Investor News Markus Georgi
25
Investor News Page 1/25 Fresenius SE & Co. KGaA, Investor Relations & Sustainability July 30, 2021 Fresenius raises Group earnings guidance after very strong Q2 • Fresenius Medical Care with expected continued COVID-19 impact; patient excess mortality rates significantly reduced • Fresenius Kabi’s strong Emerging Markets business more than offsets persistent headwinds in North America • Helios Germany with gradually increasing elective treatment volumes; Helios Spain delivers outstanding sales and earnings growth based on strong activity levels and a weak prior-year quarter • Fresenius Vamed back to growth driven by good performance in the service business; growing order book in the project business • First savings from initiatives to improve efficiency already expected in 2021 If no timeframe is specified, information refers to Q2/2021. € in millions Q2 / 2021 Growth Growth in constant currency H1 / 2021 Growth Growth in constant currency Sales 9,246 4% 8% 18,230 1% 6% EBIT 1 1,030 -8% -4% 2,039 -9% -5% Net income 1,2 474 16% 20% 910 4% 8% 1 Before special items 2 Net income attributable to shareholders of Fresenius SE & Co. KGaA For a detailed overview of special items please see the reconciliation table on page 20. Markus Georgi Senior Vice President Investor Relations & Sustainability Fresenius SE & Co. KGaA Else-Kröner-Straße 1 61352 Bad Homburg Germany T +49 6172 608-2485 F +49 6172 608-2488 [email protected] www.fresenius.com
Transcript of Investor News Markus Georgi

Investor News
Page 1/25 Fresenius SE & Co. KGaA, Investor Relations & Sustainability
July 30, 2021
Fresenius raises Group earnings guidance after very strong Q2
• Fresenius Medical Care with expected continued COVID-19 impact; patient excess mortality rates significantly reduced
• Fresenius Kabi’s strong Emerging Markets business more than offsets persistent headwinds in North America
• Helios Germany with gradually increasing elective treatment volumes; Helios Spain delivers outstanding sales and earnings growth based on strong activity levels and a weak prior-year quarter
• Fresenius Vamed back to growth driven by good performance in the service business; growing order book in the project business
• First savings from initiatives to improve efficiency already expected in 2021
If no timeframe is specified, information refers to Q2/2021.
€ in millions Q2 / 2021 Growth
Growth in constant
currency H1 / 2021 Growth
Growth in constant
currency
Sales 9,246 4% 8% 18,230 1% 6% EBIT1 1,030 -8% -4% 2,039 -9% -5% Net income1,2 474 16% 20% 910 4% 8%
1 Before special items 2 Net income attributable to shareholders of Fresenius SE & Co. KGaA For a detailed overview of special items please see the reconciliation table on page 20.
Markus Georgi Senior Vice President Investor Relations & Sustainability Fresenius SE & Co. KGaA Else-Kröner-Straße 1 61352 Bad Homburg Germany T +49 6172 608-2485 F +49 6172 608-2488 [email protected] www.fresenius.com

Page 2/25 Fresenius SE & Co. KGaA, Investor Relations & Sustainability
Stephan Sturm, CEO of Fresenius, said: “Overall, our interim result for the 2021 business
year is very strong. We have achieved very healthy sales and earnings growth, despite the
ongoing impact of the pandemic. Our businesses are developing well, and we are making
good progress on our initiatives for profitable growth and increased efficiency. The increased
vaccination rates in many of our important markets are encouraging, but of course the
pandemic is not over yet. We must remain vigilant and will continue to monitor the infection
situation very closely. Nevertheless, there are reasons for us to be optimistic: Our growth
drivers are intact, good health is and will remain of paramount importance to everyone. We
will continue the review of our structures, and to drive efficiency measures along with our
growth initiatives. The resulting benefits will allow us to sustainably develop our healthcare
group even more successfully.”
COVID-19 assumptions for guidance FY/21
Whilst the pandemic exhibited a quite differentiated regional development, negative COVID-
effects have - consistent with expectations - generally receded during Q2/21.
Fresenius had projected that the burdens and constraints caused by the pandemic will recede
in the second half of the year. Now, however, the currently rising number of COVID-19
cases, the further evolution of COVID-19 virus mutations as well as stalling vaccination
progress could all pose a threat to this assumption, and the company remains vigilant.
Whilst the risk of renewed far-reaching containment measures in one or more of Fresenius’
major markets currently appears less likely, it cannot be excluded. Any resulting significant
and direct impact on the health care sector without appropriate compensation is not reflected
in the Group’s FY/21 guidance. These assumptions are subject to considerable uncertainty.

Page 3/25 Fresenius SE & Co. KGaA, Investor Relations & Sustainability
FY/21 Group earnings guidance raised
Based on the Group’s strong Q2/21 and the progress in the program to improve Group-wide
efficiencies, where the company expects first savings already this year, Fresenius raises its
2021 earnings guidance. The Company now projects net income1,2 to grow in a low single-
digit percentage range in constant currency. Previously, Fresenius expected an at least
broadly stable net income1,2 development in constant currency. The Company continues to
project sales growth3 in a low-to-mid single-digit percentage range in constant currency.
Implicitly, net income1 for the Group excluding Fresenius Medical Care is now expected to
grow in a high single-digit percentage range in constant currency. Previously, Fresenius
expected mid-to-high single-digit percentage growth in constant currency.
The guidance implies ongoing COVID-19 related headwinds in the second half of the year. It
reflects negative pricing effects related to tender activity at Fresenius Kabi in China as well as
increasingly noticeable cost inflation effects across selected markets.
Fresenius projects net debt/EBITDA4 to be around the top-end of the self-imposed target
corridor of 3.0x to 3.5x by the end of FY/21.
Progress on efficiency measures to sustainably improve profitability
To sustainably enhance profitability and operational excellence, Fresenius has launched
group-wide efficiency initiatives. These measures are expected to gradually result in cost
savings of more than €100 million p.a. after tax and minority interest in 2023, with some
potential to increase thereafter.
While an update on the comprehensive operating model review at Fresenius Medical Care is
expected to be provided in fall 2021, the three other Fresenius business segments have
already identified and launched initiatives in defined areas.
At Fresenius Kabi, these initiatives comprise the optimization of its production network,
reduction of product portfolio complexity, centralization of worldwide purchasing and review
of organizational and cost structures.
Fresenius Helios will put a focus on its strategic review of the hospital portfolio and
ambulatory care network as well as on the reduction of G&A costs.
1 Net income attributable to shareholders of Fresenius SE & Co. KGaA 2 FY/20 base: €1,796 million, before special items; FY/21: before special items 3 FY/20 base: €36,277 million 4 At LTM average exchange rates for both net debt and EBITDA; pro forma closed acquisitions/divestitures;
excluding further potential acquisitions; before special items For a detailed overview of special items please see the reconciliation table on page 20.

Page 4/25 Fresenius SE & Co. KGaA, Investor Relations & Sustainability
Fresenius Vamed will implement some dedicated structural and organizational measures,
comprising the optimization of its global subsidiary structure, the review of its assets and
shareholdings portfolio and the optimization of procurement and G&A costs.
These activities specific to the business segments will be complemented and supported by
initiatives on the Fresenius group level, for example, the implementation of new ways of
working at the corporate headquarters as well as a group-wide review of the IT operating
model.
Achieving these sustainable efficiencies will require significant up-front expenses. For the
years 2021 to 2023, those expenses are expected to be more than €100 million p.a. after tax
and minority interest on average, with the largest portion currently expected to materialize in
2022. They will be classified as special items, consistent with previous practice.
The company expects significant contributions from all four business segments and from the
corporate center in the 2021 to 2023 period. Hence, it is expected that the savings
contributed by Fresenius Medical Care will not be overproportional.
For FY/21, initial low double-digit million € savings after tax and minority interest from the
Group’s above outlined cost and efficiency measures are expected to support the Group’s
profitability. These savings and efficiency gains derive from activities in all four business
segments.
Stephan Sturm, CEO of Fresenius, said: “We examine possible cost reductions with great
care; and we implement them in a very targeted way, with a sense of proportion. We are
saving because we have goals and want to realize them: We want to give ever more people
access to ever better medicine. We want to contribute to keeping – or making – people
healthy, to helping people enjoy their lives despite an illness. That is why we have a
responsibility to use our valuable resources carefully. We will prioritize resources where they
can have the biggest impact, remove duplication, and stop activities where results are not
satisfying. This fitness program will benefit everyone: Our patients, the healthcare system,
our employees and our shareholders.”
Page 5/25 Fresenius SE & Co. KGaA, Investor Relations & Sustainability
8% sales increase in constant currency
Group sales increased by 4% (8% in constant currency) to €9,246 million (Q2/20:
€8,920 million). Organic growth was 6%. Acquisitions/divestitures contributed net 2% to
growth. Currency translation reduced sales growth by 4%. Excluding estimated COVID-19
effects1, Group sales growth would have been 6% to 7% in constant currency. In H1/21,
Group sales increased by 1% (6% in constant currency) to €18,230 million (H1/20:
€18,055 million). Organic growth was 4%. Acquisitions/divestitures contributed net 2% to
growth. Currency translation reduced sales growth by 5%. Excluding estimated COVID-19
effects1, Group sales growth would have been 5% to 6% in constant currency.
20% net income2,3 increase in constant currency
Group EBITDA before special items decreased by 5% (0% in constant currency) to
€1,671 million (Q2/20: €1,762 million). Reported Group EBITDA was €1,662 million (Q2/20:
€1,762 million).
In H1/21, Group EBITDA before special items decreased by 6% (-1% in constant currency)
to €3,302 million (H1/20: €3,517 million). Reported Group EBITDA was €3,290 million
(H1/20: €3,517 million).
Group EBIT before special items decreased by 8% (-4% in constant currency) to €1,030
million (Q2/20: €1,123 million). The constant currency decrease is primarily due to COVID-
19 related headwinds at Fresenius Medical Care. The EBIT margin before special items was
11.1% (Q2/20: 12.6%). Reported Group EBIT was €1,021 million (Q2/20: €1,123 million).
In H1/21, Group EBIT before special items decreased by 9% (-5% in constant currency) to
€2,039 million (H1/20: €2,248 million). The constant currency decrease is primarily due to
COVID-19 related headwinds at Fresenius Medical Care. The EBIT margin before special
items was 11.2% (Q1/20: 12.5%). Reported Group EBIT was €2,027 million (H1/20:
€2,248 million).
1 For estimated COVID-19 effects please see table on page 18 2 Before special items 3 Net income attributable to shareholders of Fresenius SE & Co. KGaA For a detailed overview of special items please see the reconciliation table on page 20.
Page 6/25 Fresenius SE & Co. KGaA, Investor Relations & Sustainability
Group net interest before special items and reported net interest improved to -€121 million
(Q2/202: -€167 million) mainly due to successful refinancing activities, lower interest rates
as well as currency translation effects. In H1/21, Group net interest before special items
improved to -€258 million (H1/202: -€341 million). Reported Group net interest improved to
-€258 million (H1/20: -€349 million).
Group tax rate before special items was 21.5% (Q2/202: 23.5%) while reported Group tax
rate was 21.3% (Q2/20: 23.4%). In H1/21, Group tax rate before special items was 22.1%
(H1/202: 23.1%) while reported Group tax rate was 22.0% (H1/20: 23.0%).
Noncontrolling interests before special items were -€240 million (Q2/20: -€321 million) of
which 89% were attributable to the noncontrolling interests in Fresenius Medical Care.
Reported noncontrolling interests were -€237 million (Q2/20: -€321 million). In H1/21,
noncontrolling interests before special items were -€477 million (H1/20: -€592 million) of
which 92% were attributable to the noncontrolling interests in Fresenius Medical Care.
Reported noncontrolling interests were -€473 million (Q2/20: -€592 million).
Group net income1 before special items increased by 16% (20% in constant currency) to
€474 million (Q2/202: €410 million) driven by Helios Spain, Kabi’s Emerging Markets
business as well as the favorable net interest development. Excluding estimated COVID-19
effects3, Group net income1 before special items would have grown 10% to 14% in constant
currency. Reported Group net income1 increased to €471 million (Q2/20: €411 million).
In H1/21, Group net income1 before special items increased by 4% (8% in constant
currency) to €910 million (H1/202: €875 million). Excluding estimated COVID-19 effects3,
Group net income1 before special items would have grown 4% to 8% in constant currency.
Reported Group net income1 increased to €906 million (H1/20: €870 million).
1 Net income attributable to shareholders of Fresenius SE & Co. KGaA 2 Before special items 3 For estimated COVID-19 effects please see table on page 18. For a detailed overview of special items please see the reconciliation table on page 20.

Page 7/25 Fresenius SE & Co. KGaA, Investor Relations & Sustainability
Earnings per share1 before special items increased by 15% (19% in constant currency) to
€0.85 (Q2/202: €0.74). Reported earnings per share1 were €0.84 (Q2/20: €0.74). In H1/21,
earnings per share1 before special items increased by 4% (8% in constant currency) to
€1.63 (H1/202: €1.57). Reported earnings per share1 were €1.62 (H1/20: €1.56).
Continued investment in growth
Spending on property, plant and equipment was €509 million corresponding to 6% of
sales (Q2/20: €474 million; 5% of sales). These investments served primarily for the
modernization and expansion of dialysis clinics, production facilities as well as hospitals and
day clinics. In H1/21, spending on property, plant and equipment was €893 million
corresponding to 5% of sales (H1/20: €1,021 million; 6% of sales).
Total acquisition spending was €491 million (Q2/20: €97 million) mainly for the acquisition
of Eugin Group at Fresenius Helios which has been consolidated since April 1, 2021, and the
acquisition of dialysis clinics at Fresenius Medical Care. In H1/21, total acquisition spending
was €640 million (H1/20: €509 million).
Cash flow development
Group operating cash flow decreased to €1,451 million (Q2/20: €3,082 million) with a
margin of 15.7% (Q2/20: 34.6%). The decline was mainly due to the U.S. federal
government’s payments in Q2/20 under the CARES Act, the start of recoupment of these
advanced payments in Q2/21 as well as the timing of certain other expense payments in
2021 at Fresenius Medical Care. Free cash flow before acquisitions and dividends decreased
correspondingly to €952 million (Q2/20: €2,606 million). Free cash flow after acquisitions
and dividends decreased to -€359 million (Q2/20: €2,374 million).
In H1/21, Group operating cash flow decreased to €2,103 million (H1/20: €3,960 million)
with a margin of 11.5% (H1/20: 21.9%). Free cash flow before acquisitions and dividends
decreased to €1,193 million (H1/20: €2,911 million). Free cash flow after acquisitions
and dividends decreased to -€242 million (H1/20: €2,334 million).
1 Net income attributable to shareholders of Fresenius SE & Co. KGaA 2 Before Special items

Page 8/25 Fresenius SE & Co. KGaA, Investor Relations & Sustainability
Solid balance sheet structure
Group total assets increased by 5% (3% in constant currency) to €69,655 million
(Dec. 31, 2020: €66,646 million) given the expansion of business activities and currency
effects. Current assets increased by 7% (6% in constant currency) to €16,901 million
(Dec. 31, 2020: €15,772 million) mainly driven by the increase of trade accounts
receivables, cash and cash equivalents and inventories. Non-current assets increased by 4%
(2% in constant currency) to €52,754 million (Dec. 31, 2020: €50,874 million).
Total shareholders’ equity increased by 4% (2% in constant currency) to €27,131 million
(Dec. 31, 2020: €26,023 million). The equity ratio was 39.0% (Dec. 31, 2020: 39.0%).
Group debt increased by 5% (4% in constant currency) to €27,289 million (Dec. 31, 2020:
€ 25,913 million). Group net debt increased by 4% (3% in constant currency) to € 25,039
million (Dec. 31, 2020: € 24,076 million).
As of June 30, 2021, the net debt/EBITDA ratio increased to 3.60x1,2 (Dec. 31, 2020:
3.44x1,2) driven by COVID-19 effects weighing on EBITDA as well as increased net debt.
1 At LTM average exchange rates for both net debt and EBITDA; pro forma closed acquisitions/divestitures 2 Before special items For a detailed overview of special items please see the reconciliation table on page 20.

Page 9/25 Fresenius SE & Co. KGaA, Investor Relations & Sustainability
Business Segments
Fresenius Medical Care (Financial data according to Fresenius Medical Care press release) Fresenius Medical Care is the world's largest provider of products and services for individuals with renal diseases. As of June 30, 2021, Fresenius Medical Care was treating approximately 346,000 patients in more than 4,100 dialysis clinics. Along with its core business, the Renal Care Continuum, the company focuses on expanding in complementary areas and in the field of critical care.1 2
€ in millions Q2 / 2021 Q2 / 2020 Growth
Growth in constant
currency H1 / 2021 H1 / 2020 Growth
Growth in constant
currency
Sales 4,320 4,557 -5% 2% 8,530 9,045 -6% 2% EBITDA1 826 1,066 -23% -17% 1,691 2,022 -16% -10% EBIT1 430 656 -34% -29% 907 1,211 -25% -19% Net income1, 2 223 351 -37% -31% 474 634 -25% -20% Employees (June 30 / Dec. 31) 131,264 133,129 -1%
• As assumed, COVID-19 pandemic continued to impact organic growth in dialysis and downstream businesses; patient excess mortality rates significantly reduced
• Negative exchange rate effects continue
• Earnings development impacted by phasing and strong prior-year base, as indicated
• Financial targets for FY 2021 confirmed
Sales of Fresenius Medical Care decreased by 5% (increased by 2% in constant currency) to
€4,320 million (Q2/20: €4,557 million). Thus, currency translation had a negative effect of
7%. Organic growth was 1%. In H1/21, sales of Fresenius Medical Care decreased by 6%
(increased by 2% in constant currency) to €8,530 million (H1/20: €9,045 million). Thus,
currency translation had a negative effect of 8%. Organic growth was 1%.
EBIT decreased by 35% (-30% in constant currency) to €424 million (Q2/20: €656 million)
resulting in a margin of 9.8% (Q2/20: 14.4%). EBIT before special items declined by 34% to
€430 million (-29% in constant currency; Q2/20: €656 million), resulting in a margin of
10.0% (Q2/20: 14.4%). The decrease was mainly due to the adverse impact of the COVID-
19 pandemic, including a high prior-year base as a result of government relief funding, the
expected phasing and increase in Sales, General and Administrative expense, negative
exchange rate effects and higher direct costs. These effects were partially offset in particular
by an improved Medicare Advantage payor mix in the U.S.
1 Before special items 2 Net income attributable to shareholders of Fresenius Medical Care AG & Co. KGaA For a detailed overview of special items please see the reconciliation table on page 21.

Page 10/25 Fresenius SE & Co. KGaA, Investor Relations & Sustainability
In H1/21, EBIT decreased by 26% (-20% in constant currency) to €898 million (H1/20:
€1,211 million) resulting in a margin of 10.5% (H1/20: 13.4%). EBIT before special items
decreased by 25% (-19% in constant currency) to €907 million (Q2/20: €1,211 million)
resulting in an EBIT margin excluding special items of 10.6% (H1/20: 13.4%).
Net income1 decreased by 38% (-33% in constant currency) to €219 million (Q2/20: €351
million). Net income1 before special items decreased by 37% (-31% in constant currency) to
€223 million (Q2/20: €351 million).
In H1/21, net income1 decreased by 26% (-21% in constant currency) to €468 million
(H1/20: €634 million). Net income1 before special items decreased by 25% (-20% in
constant currency) to €474 million (H1/20: €634 million).
Operating cash flow was €921 million (Q2/20: €2,319 million) with a margin of 21.3%
(Q2/20: 50.9%). The decline was mainly due to the U.S. federal government’s payments in
Q2/20 under the CARES Act, the start of recoupment of these advanced payments in Q2/21
as well as the timing of certain other expense payments in 2021. In H1/21, operating cash
flow was €1,129 million (H1/20: €2,903 million) with a margin of 13.2% (H1/20: 32.1%).
For FY/21, Fresenius Medical Care confirms its outlook as outlined in February 2021. The
Company expects revenue2 to grow at a low-to-mid single-digit percentage range and net
income1,3 to decline at a high-teens to mid-twenties percentage range against the 2020
base4. This outlook is based on the assumption of a return to normalized mortality rates in
H2/21.
For further information, please see Fresenius Medical Care’s press release at www.freseniusmedicalcare.com.
1 Net income attributable to shareholders of Fresenius Medical Care AG & Co. KGaA 2 FY/20 base: €17,859 million 3 FY/20 base: €1,359 million, before special items; FY/21: before special items 4 These targets are based on the 2020 results excluding the impairment of goodwill and trade names in the Latin America Segment of €195 million. They are inclusive of anticipated COVID-19 effects, in constant currency and exclude special items. Special items include costs related to FME25 and other effects that are unusual in nature and have not been foreseeable or not foreseeable in size or impact at the time of giving guidance. For a detailed overview of special items please see the reconciliation table on page 23

Page 11/25 Fresenius SE & Co. KGaA, Investor Relations & Sustainability
Fresenius Kabi Fresenius Kabi offers intravenously administered generic drugs, clinical nutrition and infusion therapies for seriously and chronically ill patients in the hospital and outpatient environments. The company is also a leading supplier of medical devices and transfusion technology products. In the biosimilars business, Fresenius Kabi develops products with a focus on oncology and autoimmune diseases.12
€ in millions Q2 / 2021 Q2 / 2020 Growth
Growth in constant
currency H1 / 2021 H1 / 2020 Growth
Growth in constant
currency
Sales 1,755 1,678 5% 8% 3,516 3,467 1% 6% EBITDA1 406 390 4% 8% 780 778 0% 5% EBIT1 298 292 2% 7% 574 581 -1% 4% Net income1,2 204 196 4% 9% 394 393 0% 6% Employees (June 30 / Dec. 31) 41,145 40,519 2%
• North America performance impacted by COVID-19 and competitive pressure; effects of temporary manufacturing issues receding
• Normalizing demand in Europe driving strong growth over a COVID-impacted base
• Very strong Emerging Markets growth; China with strong performance given more normalized elective treatment activity
• Outlook improved to low single-digit constant currency EBIT percentage growth
Sales increased by 5% (8% in constant currency) to €1,755 million (Q2/20: €1,678 million).
Organic growth was 7%. In H1/21, sales increased by 1% (6% in constant currency) to
€3,516 million (H1/20: €3,467 million). Organic growth was 5%. Negative currency
translation effects of 3% in Q2 and 5% in H1 were mainly related to the weakness of the US
dollar, the Argentinian peso and the Brazilian real.
Sales in North America decreased by 13% (organic growth: -6%) to €522 million (Q2/20:
€600 million). The decrease was driven by reduced volume demand given fewer elective
treatments, consequential competitive pressure and, albeit receding, temporary
manufacturing issues. These negative effects outweighed extra demand for COVID-19 related
products. In H1/21, sales in North America decreased by 15% (organic growth: -8%) to
€1,080 million (H1/20: €1,269 million).
Sales in Europe increased by 12% (organic growth: 10%) to €634 million (Q2/20: €566
million) supported by a low prior-year basis meaningfully impacted by COVID-19. In H1/21,
sales in Europe increased by 5% (organic growth: 4%) to €1,260 million (H1/20: €1,197
million).
1 Before special items 2 Net income attributable to shareholders of Fresenius SE & Co. KGaA
Page 12/25 Fresenius SE & Co. KGaA, Investor Relations & Sustainability
Sales in Asia-Pacific increased by 17% (organic growth: 17%) to €409 million (Q2/20:
€351 million). The growth is mainly due to more normalized elective treatment activity in
China as well as a recovery in other Asian markets. In H1/21, sales in Asia-Pacific increased
by 20% (organic growth: 21%) to €801 million (H1/20: €670 million).
Sales in Latin America/Africa increased by 18% (organic growth: 24%) to €190 million
(Q2/20: €161 million) due to ongoing COVID-19 related extra demand. In H1/21, sales in
Latin America/Africa increased by 13% (organic growth: 26%) to €375 million (H1/20: €331
million).
EBIT1 increased by 2% (7% in constant currency) to €298 million (Q2/20: €292 million) with
an EBIT margin of 17.0% (Q2/20: 17.4%). The increase in constant currency was tempered
by underutilized production capacities in the US and competitive pressure coupled with
selective supply constraints due to temporary, however receding, manufacturing issues. EBIT
was supported by positive COVID-19 effects, lower corporate costs due to travel restrictions
and phasing of projects. In H1/21, EBIT1 decreased by 1% (increased by 4% in constant
currency) to €574 million (H1/20: €581 million) with an EBIT margin of 16.3% (H1/20:
16.8%).
Net income1,2 increased by 4% (9% in constant currency) to €204 million (Q2/201:
€196 million). In H1/21, net income1,2 remained stable (increased by 6% in constant
currency) at €394 million (H1/201: €393 million).
Operating cash flow decreased to €197 million (Q2/20: €437 million) with a margin of
11.2% (Q2/20: 26.0%) mainly due to the phasing of tax payments and payments for legal
proceedings. In H1/21, operating cash flow decreased to €475 million (H1/20: €611 million)
with a margin of 13.5% (H1/20: 17.6%).
For FY/21, Fresenius Kabi improves its EBIT outlook. The company now projects EBIT3 to
grow in a low single-digit percentage range in constant currency. Previously, Fresenius Kabi
expected a stable EBIT3 development up to low single-digit percentage growth. The company
continues to expect organic sales growth4 in a low-to-mid single-digit percentage range. Both
sales and EBIT outlook include expected COVID-19 effects.
1 Before special items 2 Net income attributable to shareholders of Fresenius SE & Co. KGaA 3 FY/20 base: €1,095 million, before special items; FY/21: before special items 4 FY/20 base: €6,976 million

Page 13/25 Fresenius SE & Co. KGaA, Investor Relations & Sustainability
Fresenius Helios Fresenius Helios is Europe's leading private hospital operator. The company comprises Helios Germany and Helios Spain. Helios Germany operates 89 hospitals, ~130 outpatient centers and 6 prevention centers. Helios Spain operates 47 hospitals, 74 outpatient centers and around 300 occupational risk prevention centers. In addition, the company is active in Latin America with 6 hospitals and as a provider of medical diagnostics and reproduction medicine worldwide. 1
€ in millions Q2 / 2021 Q2 / 2020 Growth
Growth in constant
currency H1 / 2021 H1 / 2020 Growth
Growth in constant
currency
Sales 2,738 2,315 18% 19% 5,387 4,781 13% 13% EBITDA 413 309 34% 34% 793 691 15% 15% EBIT 298 198 51% 51% 566 472 20% 20% Net income1 193 123 57% 59% 366 299 22% 23% Employees (June 30 / Dec. 31) 119,541 116,952 2%
• Gradually recovering elective treatments at Helios Germany
• Excellent treatment activity at Helios Spain results in outstanding organic sales and earnings growth over a weak prior year quarter
• Growth additionally fueled by contributions from acquisitions in Germany and Latin America as well as from the acquired fertility business
• Outlook improved for organic sales and constant currency EBIT growth
Sales increased by 18% (19% in constant currency) to €2,738 million (Q2/20:
€2,315 million). Organic growth was 14%. Acquisitions, including the fertility business Eugin,
(consolidated as from 1 April 2021), contributed 5% to sales growth. In H1/21, sales
increased by 13% (13% in constant currency) to €5,387 million (H1/20: €4,781 million).
Organic growth was 9%. Acquisitions contributed 4% to sales growth.
Sales of Helios Germany increased by 7% (organic growth: 3%) to €1,675 million (Q2/20:
€1,571 million) driven by a gradual recovery of elective treatments and positive case mix
effects. The hospital acquisitions from the Order of Malta contributed 4% to sales growth. In
H1/21, sales of Helios Germany increased by 5% (organic growth: 1%) to €3,348 million
(H1/20: €3,174 million). COVID-19 effects were mostly mitigated by government
compensation.
Sales of Helios Spain increased by 37% (38% in constant currency) to €1,020 million
(Q2/20: €743 million) over a weak COVID-19 impacted prior-year quarter. Organic growth of
38% was driven by a consistently high level of treatments and ongoing demand for
occupational risk prevention (ORP) services. The Latin American hospitals contributed 5% to
sales growth. In H1/21, sales of Helios Spain increased by 24% (26% in constant currency)
to €1,996 million (H1/20: €1,606 million). Organic growth was 24%.
1 Net income attributable to shareholders of Fresenius SE & Co. KGaA

Page 14/25 Fresenius SE & Co. KGaA, Investor Relations & Sustainability
EBIT of Fresenius Helios increased by 51% (51% in constant currency) to €298 million
(Q2/20: €198 million) with an EBIT margin of 10.9% (Q2/20: 8.6%). In H1/21, EBIT of
Fresenius Helios increased by 20% (20% in constant currency) to €566 million (H1/20: €472
million) with an EBIT margin of 10.5% (H1/20: 9.9%).
EBIT of Helios Germany increased by 3% to €152 million (Q2/20: €147 million) with an
EBIT margin of 9.1% (Q2/20: 9.4%). In H1/21, EBIT of Helios Germany decreased by 3% to
€302 million (H1/20: €312 million) with an EBIT margin of 9.0% (H1/20: 9.8%).
Government compensation broadly mitigated COVID-19 effects.
EBIT of Helios Spain increased by 172% (174% in constant currency) to €147 million
(Q2/20: €54 million) over a weak COVID-19 impacted prior-year quarter. EBIT margin
improved to 14.4% (Q2/20: 7.3%). Healthy organic sales growth led to an improved
coverage of the fixed cost base. The hospital acquisitions in Colombia contributed nicely. In
H1/21, EBIT of Helios Spain increased by 64% (66% in constant currency) to €273 million
(H1/20: €166 million) with an EBIT margin of 13.7% (H1/20: 10.3%).
Net income1 increased by 57% (59% in constant currency) to €193 million (Q2/20: €123
million). In H1/21, net income1 increased by 22% (23% in constant currency) to €366 million
(H1/20: €299 million).
Operating cash flow decreased to €223 million (Q2/20: €295 million) with a margin of
8.1% (Q1/20: 12.7%) resulting from the strong cash collection in Q2/20 related to
accelerated payments of treatment invoices under the German law to ease the financial
burden on hospitals. In H1/21, operating cash flow was on prior year level at €438 million
(H1/20: €440 million) with a margin of 8.1% (H1/20: 9.2%).
For FY/21, Fresenius Helios improves its outlook: The company now expects organic sales2
growth in a mid single-digit percentage range. Previously, organic sales2 were expected to
grow in a low-to-mid single-digit percentage range. Moreover, Fresenius Helios now projects
EBIT3 to grow in a high single-digit percentage range in constant currency. Previously, EBIT3
was expected to grow in a mid- to high single-digit percentage range in constant currency.
Both sales and EBIT outlook include expected COVID-19 effects.
1 Net income attributable to shareholders of Fresenius SE & Co. KGaA 2 FY/20 base: €9,818 million 3 FY/20 base: €1,025 million; FY/21 before special items

Page 15/25 Fresenius SE & Co. KGaA, Investor Relations & Sustainability
Fresenius Vamed
Fresenius Vamed manages projects and provides services for hospitals and other health care facilities worldwide and is a leading post-acute care provider in Central Europe. The portfolio ranges along the entire value chain: from project development, planning, and turnkey construction, via maintenance and technical management to total operational management.1
€ in millions Q2 / 2021 Q2 / 2020 Growth
Growth in constant
currency H1 / 2021 H1 / 2020 Growth
Growth in constant
currency
Sales 556 475 17% 17% 1,033 974 6% 6% EBITDA 38 7 -- -- 55 41 34% 34% EBIT 16 -13 -- -- 12 1 -- -- Net income1 11 -15 173% 173% 4 -8 150% 150% Employees (June 30 / Dec. 31) 19,527 19,414 1%
• Back to sales and earnings growth despite negative COVID-19 effects
• Project business still marked by COVID-19 but showing clear signs of recovery
• Good performance in the service business; rehabilitation business improving as number of elective surgeries increased
• Excellent order intake
Sales increased by 17% (17% in constant currency) to €556 million (Q2/20: €475 million).
Organic growth was 17%. In H1/21, sales increased by 6% (6% in constant currency) to
€1,033 million (H1/20: €974 million). Organic growth was 6%.
Sales in the service business improved by 19% (19% in constant currency) to €392 million
(Q2/20: €329 million), in particular driven by growing case numbers in the rehabilitation
business. Sales in the project business increased by 12% (12% in constant currency) to
€164 million (Q2/20: €146 million). In H1/21, sales in the service business increased by
10% (10% in constant currency) to €755 million (H1/20: €686 million). Sales in the project
business decreased by 3% (-3% in constant currency) to €278 million (H1/20: €288
million).
EBIT increased to €16 million (Q2/20: -€13 million) with an EBIT margin of 2.9% (Q2/20:
-2.7%). In H1/21, EBIT increased to €12 million (H1/20: €1 million) with an EBIT margin of
1.2% (H1/20: 0.1%).
Net income1increased to €11 million (Q2/20: -€15 million). In H1/21, net income1 increased
to €4 million (H1/20: -€8 million).
1 Net income attributable to shareholders of VAMED AG

Page 16/25 Fresenius SE & Co. KGaA, Investor Relations & Sustainability
Order intake was outstanding with €713 million (Q2/20: €50 million) and €851 million in
H1/21 (H1/20: €174 million), particularly driven by a turnkey project for a hospital in Wiener
Neustadt, Austria. As of June 30, 2021, order backlog was at €3,635 million
(December 31, 2020: €3,055 million).
Operating cash flow increased to €58 million (Q2/20: €28 million) with a margin of 10.4%
(Q1/20: 5.9%) mainly due to payments from the international project business. In H1/21,
operating cash flow increased to €14 million (H1/20: €8 million) with a margin of 1.4%
(H1/20: 0.8%).
For FY/21, Fresenius Vamed confirms its outlook and expects organic sales1 growth in a mid-
to-high single-digit percentage range and EBIT2 to grow to a high double-digit Euro million
amount. Both sales and EBIT outlook include expected COVID-19 effects.
1 FY/20 base: €2,068 million 2 FY/20 base: €29 million; FY/21 before special items

Page 17/25 Fresenius SE & Co. KGaA, Investor Relations & Sustainability
Conference Call
As part of the publication of the results for Q2/2021, a conference call will be held on
July 30, 2021 at 1:30 p.m. CEDT (7:30 a.m. EDT). All investors are cordially invited to follow
the conference call in a live broadcast over the Internet at www.fresenius.com/investors.
Following the call, a replay will be available on our website.
# # #
For additional information on the performance indicators used please refer to our website
https://www.fresenius.com/alternative-performance-measures.
# # #
Fresenius is a global health care group, providing products and services for dialysis, hospital and outpatient medical care. In 2020, Group sales were €36.3 billion. On June 30, 2021, the Fresenius Group had 312,734 employees worldwide. For more information visit the Company’s website at www.fresenius.com. Follow us on Twitter: www.twitter.com/fresenius_ir Follow us on LinkedIn: www.linkedin.com/company/fresenius-investor-relations This release contains forward-looking statements that are subject to various risks and uncertainties. Future results could differ materially from those described in these forward-looking statements due to certain factors, e.g. changes in business, economic and competitive conditions, regulatory reforms, results of clinical trials, foreign exchange rate fluctuations, uncertainties in litigation or investigative proceedings, and the availability of financing. Fresenius does not undertake any responsibility to update the forward-looking statements in this release. Fresenius SE & Co. KGaA Registered Office: Bad Homburg, Germany Commercial Register: Amtsgericht Bad Homburg, HRB 11852 Chairman of the Supervisory Board: Wolfgang Kirsch General Partner: Fresenius Management SE Registered Office: Bad Homburg, Germany Commercial Register: Amtsgericht Bad Homburg, HRB 11673 Management Board: Stephan Sturm (Chairman), Dr. Sebastian Biedenkopf, Dr. Francesco De Meo, Rachel Empey, Rice Powell, Michael Sen, Dr. Ernst Wastler Chairman of the Supervisory Board: Wolfgang Kirsch
Page 18/25 Fresenius SE & Co. KGaA, Investor Relations & Sustainability
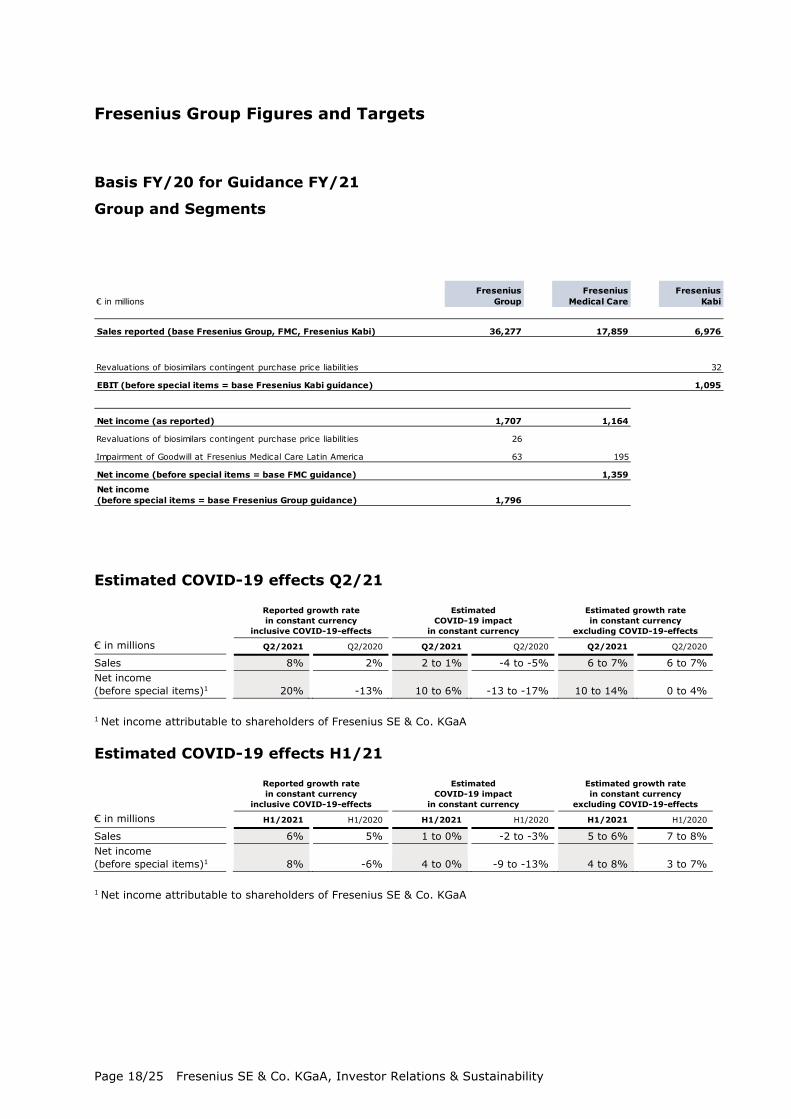
Fresenius Group Figures and Targets
Basis FY/20 for Guidance FY/21
Group and Segments
Estimated COVID-19 effects Q2/21
Reported growth rate in constant currency
inclusive COVID-19-effects
Estimated COVID-19 impact
in constant currency
Estimated growth rate in constant currency
excluding COVID-19-effects
€ in millions Q2/2021 Q2/2020 Q2/2021 Q2/2020 Q2/2021 Q2/2020
Sales 8% 2% 2 to 1% -4 to -5% 6 to 7% 6 to 7% Net income (before special items)1 20% -13% 10 to 6% -13 to -17% 10 to 14% 0 to 4%
1 Net income attributable to shareholders of Fresenius SE & Co. KGaA Estimated COVID-19 effects H1/21
Reported growth rate in constant currency
inclusive COVID-19-effects
Estimated COVID-19 impact
in constant currency
Estimated growth rate in constant currency
excluding COVID-19-effects
€ in millions H1/2021 H1/2020 H1/2021 H1/2020 H1/2021 H1/2020
Sales 6% 5% 1 to 0% -2 to -3% 5 to 6% 7 to 8% Net income (before special items)1 8% -6% 4 to 0% -9 to -13% 4 to 8% 3 to 7%
1 Net income attributable to shareholders of Fresenius SE & Co. KGaA
€ in millionsFresenius
GroupFresenius
Medical CareFresenius
Kabi
Sales reported (base Fresenius Group, FMC, Fresenius Kabi) 36,277 17,859 6,976
Revaluations of biosimilars contingent purchase price liabilities 32
EBIT (before special items = base Fresenius Kabi guidance) 1,095
Net income (as reported) 1,707 1,164
Revaluations of biosimilars contingent purchase price liabilities 26
Impairment of Goodwill at Fresenius Medical Care Latin America 63 195
Net income (before special items = base FMC guidance) 1,359
Net income (before special items = base Fresenius Group guidance) 1,796

Page 19/25 Fresenius SE & Co. KGaA, Investor Relations & Sustainability
Statement of Comprehensive Income
€ in millions Q2 / 2021 Q2 / 2020 Growth H1 / 2021 H1 / 2020 Growth
Sales 9,246 8,920 4% 18,230 18,055 1% Costs of sales -6,628 -6,391 -4% -13,154 -12,863 -2% Gross profit 2,618 2,529 4% 5,076 5,192 -2% Selling, general and administrative expenses -1,400 -1,208 -16% -2,666 -2,560 -4% Research and development expenses -197 -198 1% -383 -384 0% Operating income (EBIT) 1,021 1,123 -9% 2,027 2,248 -10% Interest result -121 -167 28% -258 -349 26% Financial result -121 -167 28% -258 -349 26% Income before income taxes 900 956 -6% 1,769 1,899 -7% Income taxes -192 -224 14% -390 -437 11% Net income 708 732 -3% 1,379 1,462 -6% Less noncontrolling interests -237 -321 26% -473 -592 20% Net income attributable to Fresenius SE & Co. KGaA1,2 474 410 16% 910 875 4% Net income attributable to Fresenius SE & Co. KGaA1 471 411 15% 906 870 4% Earnings per ordinary share (€)1,2 0.85 0.74 15% 1.63 1.57 4% Fully diluted earnings per ordinary share (€)1,2 0.85 0.74 15% 1.63 1.57 4% Earnings per ordinary share (€)1 0.84 0.74 14% 1.62 1.56 4% Fully diluted earnings per ordinary share (€)1 0.84 0.74 14% 1.62 1.56 4% Average number of shares 557,771,093 557,430,557 557,656,126 557,413,756 EBITDA2 1,671 1,762 -5% 3,302 3,517 -6% Depreciation and amortization2 -641 -639 0% -1,263 -1,269 0% EBIT2 1,030 1,123 -8% 2,039 2,248 -9% EBITDA margin2 18.1% 19.8% 18.1% 19.5% EBIT margin2 11.1% 12.6% 11.2% 12.5% 1 Net income attributable to shareholders of Fresenius SE & Co. KGaA 2 Before special items For a detailed overview of special items please see the reconciliation table on page 20.
Page 20/25 Fresenius SE & Co. KGaA, Investor Relations & Sustainability
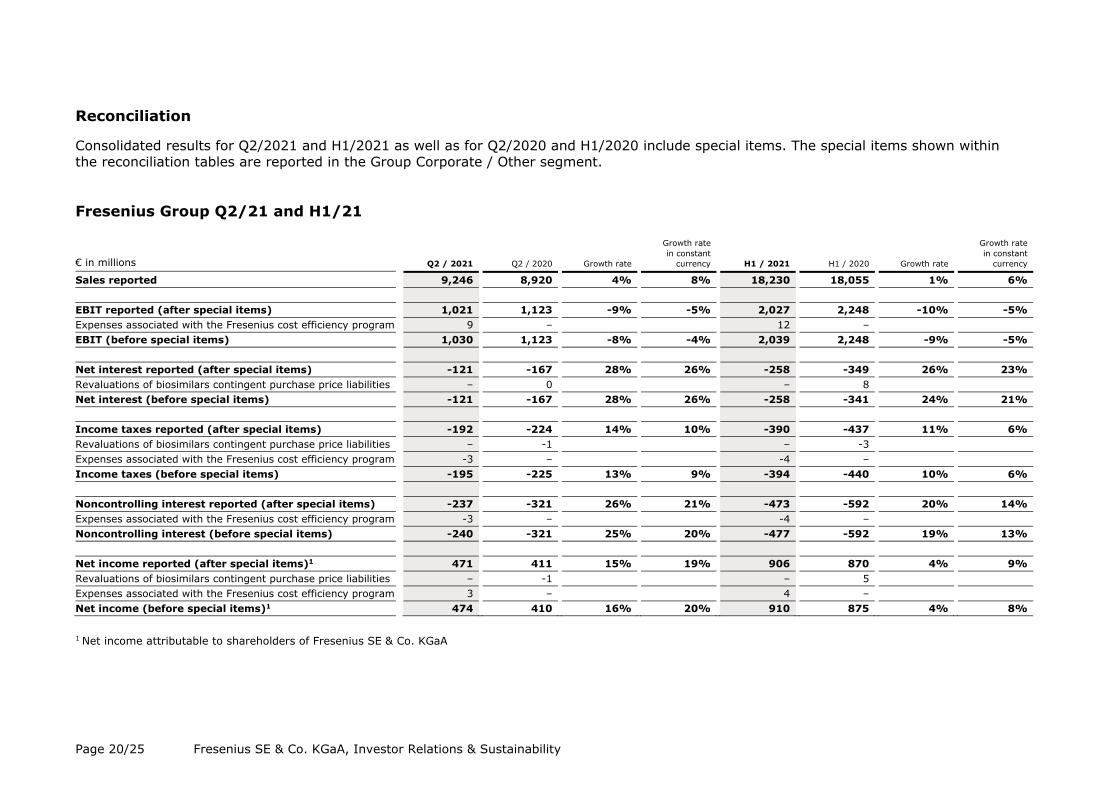
Reconciliation
Consolidated results for Q2/2021 and H1/2021 as well as for Q2/2020 and H1/2020 include special items. The special items shown within the reconciliation tables are reported in the Group Corporate / Other segment. Fresenius Group Q2/21 and H1/21
€ in millions Q2 / 2021 Q2 / 2020 Growth rate
Growth rate in constant
currency H1 / 2021 H1 / 2020 Growth rate
Growth rate in constant
currency
Sales reported 9,246 8,920 4% 8% 18,230 18,055 1% 6% EBIT reported (after special items) 1,021 1,123 -9% -5% 2,027 2,248 -10% -5% Expenses associated with the Fresenius cost efficiency program 9 – 12 – EBIT (before special items) 1,030 1,123 -8% -4% 2,039 2,248 -9% -5% Net interest reported (after special items) -121 -167 28% 26% -258 -349 26% 23% Revaluations of biosimilars contingent purchase price liabilities – 0 – 8 Net interest (before special items) -121 -167 28% 26% -258 -341 24% 21% Income taxes reported (after special items) -192 -224 14% 10% -390 -437 11% 6% Revaluations of biosimilars contingent purchase price liabilities – -1 – -3 Expenses associated with the Fresenius cost efficiency program -3 – -4 – Income taxes (before special items) -195 -225 13% 9% -394 -440 10% 6% Noncontrolling interest reported (after special items) -237 -321 26% 21% -473 -592 20% 14% Expenses associated with the Fresenius cost efficiency program -3 – -4 – Noncontrolling interest (before special items) -240 -321 25% 20% -477 -592 19% 13% Net income reported (after special items)1 471 411 15% 19% 906 870 4% 9% Revaluations of biosimilars contingent purchase price liabilities – -1 – 5 Expenses associated with the Fresenius cost efficiency program 3 – 4 – Net income (before special items)1 474 410 16% 20% 910 875 4% 8%
1 Net income attributable to shareholders of Fresenius SE & Co. KGaA

Page 21/25 Fresenius SE & Co. KGaA, Investor Relations & Sustainability
Fresenius Medical Care Q2/21 and H1/21
€ in millions Q2 / 2021 Q2 / 2020 Growth rate
Growth rate in constant
currency H1 / 2021 H1 / 2020 Growth rate
Growth rate in constant
currency
Sales reported 4,320 4,557 -5% 2% 8,530 9,045 -6% 2% EBIT reported (after special items) 424 656 -35% -30% 898 1,211 -26% -20% Costs related to FME25 program 6 – 9 – EBIT (before special items) 430 656 -34% -29% 907 1,211 -25% -19% Net income reported (after special items)1 219 351 -38% -33% 468 634 -26% -21% Costs related to FME25 program 4 – 6 – Net income (before special items)1 223 351 -37% -31% 474 634 -25% -20%
1 Net income attributable to shareholders of Fresenius Medical Care AG & Co. KGaA
Page 22/25 Fresenius SE & Co. KGaA, Investor Relations & Sustainability
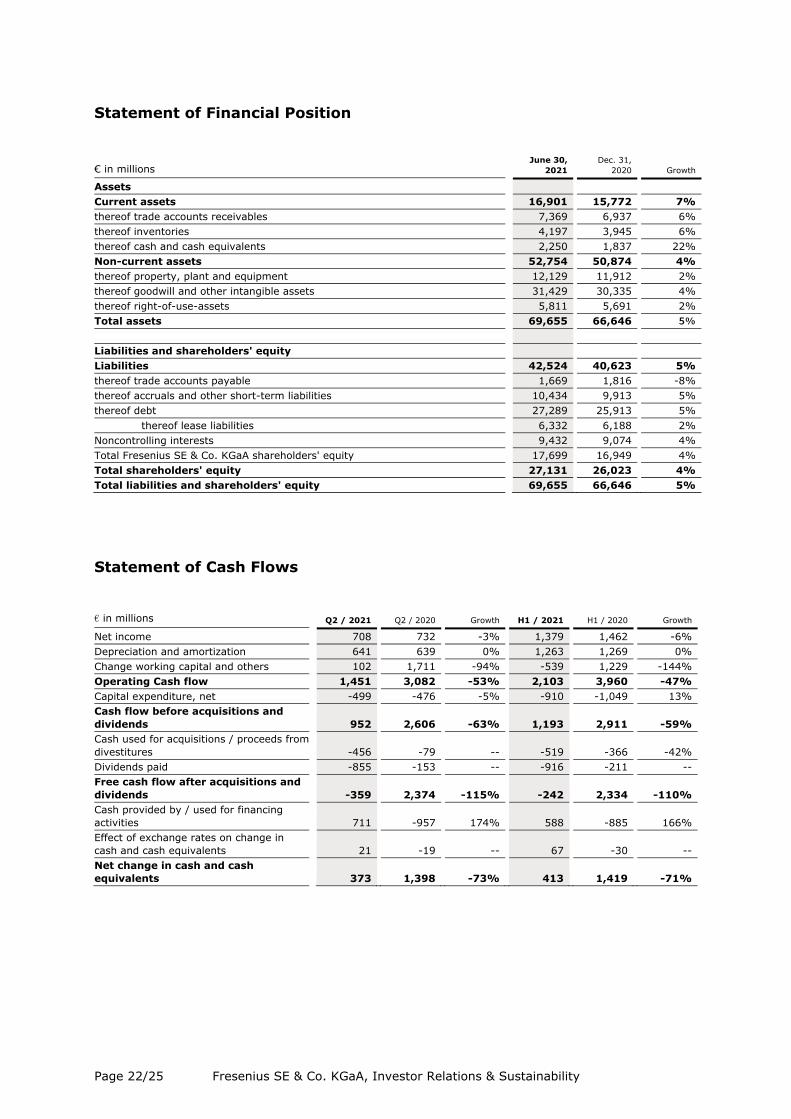
Statement of Financial Position
€ in millions June 30,
2021 Dec. 31,
2020 Growth
Assets Current assets 16,901 15,772 7% thereof trade accounts receivables 7,369 6,937 6% thereof inventories 4,197 3,945 6% thereof cash and cash equivalents 2,250 1,837 22% Non-current assets 52,754 50,874 4% thereof property, plant and equipment 12,129 11,912 2% thereof goodwill and other intangible assets 31,429 30,335 4% thereof right-of-use-assets 5,811 5,691 2% Total assets 69,655 66,646 5% Liabilities and shareholders' equity Liabilities 42,524 40,623 5% thereof trade accounts payable 1,669 1,816 -8% thereof accruals and other short-term liabilities 10,434 9,913 5% thereof debt 27,289 25,913 5% thereof lease liabilities 6,332 6,188 2% Noncontrolling interests 9,432 9,074 4% Total Fresenius SE & Co. KGaA shareholders' equity 17,699 16,949 4% Total shareholders' equity 27,131 26,023 4% Total liabilities and shareholders' equity 69,655 66,646 5%
Statement of Cash Flows
€ in millions Q2 / 2021 Q2 / 2020 Growth H1 / 2021 H1 / 2020 Growth
Net income 708 732 -3% 1,379 1,462 -6% Depreciation and amortization 641 639 0% 1,263 1,269 0% Change working capital and others 102 1,711 -94% -539 1,229 -144% Operating Cash flow 1,451 3,082 -53% 2,103 3,960 -47% Capital expenditure, net -499 -476 -5% -910 -1,049 13% Cash flow before acquisitions and dividends 952 2,606 -63% 1,193 2,911 -59% Cash used for acquisitions / proceeds from divestitures -456 -79 -- -519 -366 -42% Dividends paid -855 -153 -- -916 -211 -- Free cash flow after acquisitions and dividends -359 2,374 -115% -242 2,334 -110% Cash provided by / used for financing activities 711 -957 174% 588 -885 166% Effect of exchange rates on change in cash and cash equivalents 21 -19 -- 67 -30 -- Net change in cash and cash equivalents 373 1,398 -73% 413 1,419 -71%

Page 23/25 Fresenius SE & Co. KGaA, Investor Relations & Sustainability
Segment reporting by business segment Q2/21
Fresenius Medical Care Fresenius Kabi Fresenius Helios Fresenius Vamed Corporate / Other Fresenius Group
by business segment, € in millions Q2/2021 1 Q2/2020 Growth Q2/2021 Q2/2020 2 Growth Q2/2021 Q2/2020 Growth Q2/2021 Q2/2020 Growth Q2/2021 3 Q2/2020 4 Growth Q2/2021 Q2/2020 Growth
Sales 4,320 4,557 -5% 1,755 1,678 5% 2,738 2,315 18% 556 475 17% -123 -105 -17% 9,246 8,920 4% thereof contribution to consolidated sales 4,308 4,547 -5% 1,739 1,663 5% 2,732 2,311 18% 466 400 17% 1 -1 200% 9,246 8,920 4% thereof intercompany sales 12 10 20% 16 15 7% 6 4 50% 90 75 20% -124 -104 -19% 0 0 contribution to consolidated sales 47% 51% 19% 19% 29% 26% 5% 4% 0% 0% 100% 100%
EBITDA 826 1,066 -23% 406 390 4% 413 309 34% 38 7 -- -21 -10 -110% 1,662 1,762 -6% Depreciation and amortization 396 410 -4% 108 98 10% 115 111 4% 22 20 10% 0 0 641 639 0% EBIT 430 656 -34% 298 292 2% 298 198 51% 16 -13 -- -21 -10 -110% 1,021 1,123 -9% Net interest -69 -92 25% -16 -21 24% -45 -47 4% -1 -5 80% 10 -2 -- -121 -167 28% Income taxes -77 -137 44% -59 -64 8% -54 -28 -93% -3 3 -200% 1 2 -50% -192 -224 14% Net income attributable to shareholders of Fresenius SE & Co. KGaA 223 351 -37% 204 196 4% 193 123 57% 11 -15 173% -160 -244 34% 471 411 15% Operating cash flow 921 2,319 -60% 197 437 -55% 223 295 -24% 58 28 107% 52 3 -- 1,451 3,082 -53% Cash flow before acquisitions and dividends 720 2,103 -66% 83 276 -70% 70 226 -69% 33 5 -- 46 -4 -- 952 2,606 -63% Capital expenditure, gross 210 218 -4% 117 156 -25% 154 69 123% 25 24 4% 3 7 -57% 509 474 7% Acquisitions, gross / investments 79 83 -5% 0 0 412 13 -- 0 2 -100% 0 -1 100% 491 97 -- Research and development expenses 52 50 3% 144 147 -2% 1 1 0% 0 0 - - -- 197 198 -1% Key figures
EBITDA margin 19.1% 23.4% 23.1% 23.2% 15.1% 13.3% 6.8% 1.5% 18.1% 5 19.8% EBIT margin 10.0% 14.4% 17.0% 17.4% 10.9% 8.6% 2.9% -2.7% 11.1% 5 12.6% Depreciation and amortization in% of sales 9.2% 9.0% 6.2% 5.8% 4.2% 4.8% 4.0% 4.2% 6.9% 7.2% Operating cash flow in% of sales 21.3% 50.9% 11.2% 26.0% 8.1% 12.7% 10.4% 5.9% 15.7% 34.6%
1 Before costs related to FME25 program 2 Before revaluations of biosimilars contingent purchase price liabilities 3 After expenses associated with the Fresenius cost efficiency program 4 After revaluations of biosimilars contingent purchase price liabilities 5 Before expenses associated with the Fresenius cost efficiency program
Page 24/25 Fresenius SE & Co. KGaA, Investor Relations & Sustainability
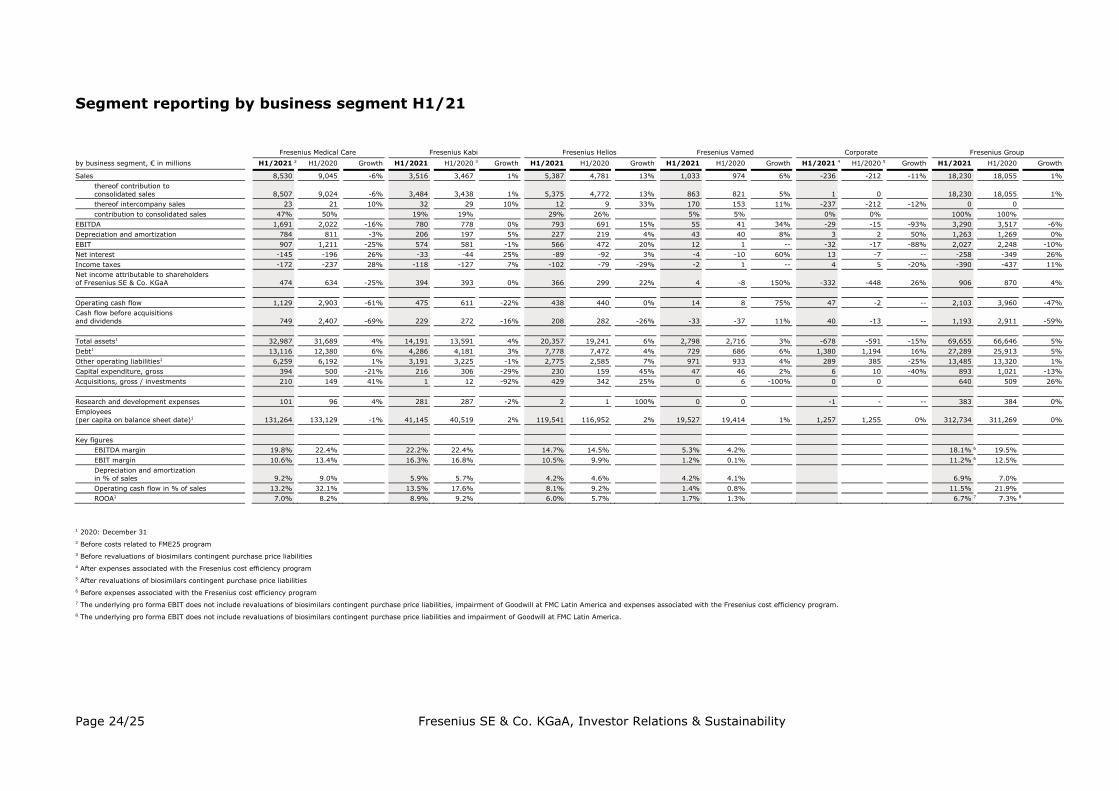
Segment reporting by business segment H1/21
Fresenius Medical Care Fresenius Kabi Fresenius Helios Fresenius Vamed Corporate Fresenius Group by business segment, € in millions H1/2021 2 H1/2020 Growth H1/2021 H1/2020 3 Growth H1/2021 H1/2020 Growth H1/2021 H1/2020 Growth H1/2021 4 H1/2020 5 Growth H1/2021 H1/2020 Growth
Sales 8,530 9,045 -6% 3,516 3,467 1% 5,387 4,781 13% 1,033 974 6% -236 -212 -11% 18,230 18,055 1% thereof contribution to consolidated sales 8,507 9,024 -6% 3,484 3,438 1% 5,375 4,772 13% 863 821 5% 1 0 18,230 18,055 1% thereof intercompany sales 23 21 10% 32 29 10% 12 9 33% 170 153 11% -237 -212 -12% 0 0 contribution to consolidated sales 47% 50% 19% 19% 29% 26% 5% 5% 0% 0% 100% 100%
EBITDA 1,691 2,022 -16% 780 778 0% 793 691 15% 55 41 34% -29 -15 -93% 3,290 3,517 -6% Depreciation and amortization 784 811 -3% 206 197 5% 227 219 4% 43 40 8% 3 2 50% 1,263 1,269 0% EBIT 907 1,211 -25% 574 581 -1% 566 472 20% 12 1 -- -32 -17 -88% 2,027 2,248 -10% Net interest -145 -196 26% -33 -44 25% -89 -92 3% -4 -10 60% 13 -7 -- -258 -349 26% Income taxes -172 -237 28% -118 -127 7% -102 -79 -29% -2 1 -- 4 5 -20% -390 -437 11% Net income attributable to shareholders of Fresenius SE & Co. KGaA 474 634 -25% 394 393 0% 366 299 22% 4 -8 150% -332 -448 26% 906 870 4% Operating cash flow 1,129 2,903 -61% 475 611 -22% 438 440 0% 14 8 75% 47 -2 -- 2,103 3,960 -47% Cash flow before acquisitions and dividends 749 2,407 -69% 229 272 -16% 208 282 -26% -33 -37 11% 40 -13 -- 1,193 2,911 -59% Total assets1 32,987 31,689 4% 14,191 13,591 4% 20,357 19,241 6% 2,798 2,716 3% -678 -591 -15% 69,655 66,646 5% Debt1 13,116 12,380 6% 4,286 4,181 3% 7,778 7,472 4% 729 686 6% 1,380 1,194 16% 27,289 25,913 5% Other operating liabilities1 6,259 6,192 1% 3,191 3,225 -1% 2,775 2,585 7% 971 933 4% 289 385 -25% 13,485 13,320 1% Capital expenditure, gross 394 500 -21% 216 306 -29% 230 159 45% 47 46 2% 6 10 -40% 893 1,021 -13% Acquisitions, gross / investments 210 149 41% 1 12 -92% 429 342 25% 0 6 -100% 0 0 640 509 26% Research and development expenses 101 96 4% 281 287 -2% 2 1 100% 0 0 -1 - -- 383 384 0% Employees (per capita on balance sheet date)1 131,264 133,129 -1% 41,145 40,519 2% 119,541 116,952 2% 19,527 19,414 1% 1,257 1,255 0% 312,734 311,269 0% Key figures
EBITDA margin 19.8% 22.4% 22.2% 22.4% 14.7% 14.5% 5.3% 4.2% 18.1% 6 19.5% EBIT margin 10.6% 13.4% 16.3% 16.8% 10.5% 9.9% 1.2% 0.1% 11.2% 6 12.5% Depreciation and amortization in % of sales 9.2% 9.0% 5.9% 5.7% 4.2% 4.6% 4.2% 4.1% 6.9% 7.0% Operating cash flow in % of sales 13.2% 32.1% 13.5% 17.6% 8.1% 9.2% 1.4% 0.8% 11.5% 21.9% ROOA1 7.0% 8.2% 8.9% 9.2% 6.0% 5.7% 1.7% 1.3% 6.7% 7 7.3% 8
1 2020: December 31 2 Before costs related to FME25 program 3 Before revaluations of biosimilars contingent purchase price liabilities 4 After expenses associated with the Fresenius cost efficiency program 5 After revaluations of biosimilars contingent purchase price liabilities 6 Before expenses associated with the Fresenius cost efficiency program 7 The underlying pro forma EBIT does not include revaluations of biosimilars contingent purchase price liabilities, impairment of Goodwill at FMC Latin America and expenses associated with the Fresenius cost efficiency program. 8 The underlying pro forma EBIT does not include revaluations of biosimilars contingent purchase price liabilities and impairment of Goodwill at FMC Latin America.

Page 25/25 Fresenius SE & Co. KGaA, Investor Relations & Sustainability
Sales by business segment
€ in millions Q2 / 2021 Q2 / 2020 Growth
Currency translation
effects
Growth at constant
rates Organic
sales growth Acquisitions /
Divestitures % of total
sales 1
Fresenius Medical Care 4,320 4,557 -5% -7% 2% 1% 1% 47% Fresenius Kabi 1,755 1,678 5% -3% 8% 7% 1% 19% Fresenius Helios 2,738 2,315 18% -1% 19% 14% 5% 29% Fresenius Vamed 556 475 17% 0% 17% 17% 0% 5% Total 9,246 8,920 4% -4% 8% 6% 2% 100%
€ in millions H1 / 2021 H1 / 2020 Growth
Currency translation
effects
Growth at constant
rates Organic
sales growth Acquisitions /
Divestitures % of total
sales 1
Fresenius Medical Care 8,530 9,045 -6% -8% 2% 1% 1% 47% Fresenius Kabi 3,516 3,467 1% -5% 6% 5% 1% 19% Fresenius Helios 5,387 4,781 13% 0% 13% 9% 4% 29% Fresenius Vamed 1,033 974 6% 0% 6% 6% 0% 5% Total 18,230 18,055 1% -5% 6% 4% 2% 100%
1 Related to the respective external sales of the business segments. Consolidation effects and corporate entities are not taken into account. Therefore, aggregation to total Group sales is not possible.
Group sales by region
€ in millions Q2 / 2021 Q2 / 2020 Growth
Currency translation
effects
Growth at constant
rates Organic
sales growth Acquisitions /
divestitures % of total
sales
North America 3,504 3,828 -8% -8% 0% -1% 1% 38% Europe 4,232 3,749 13% 0% 13% 11% 2% 46% Asia-Pacific 957 878 9% -2% 11% 11% 0% 10% Latin America 436 376 16% -13% 29% 25% 4% 5% Africa 117 89 31% 6% 25% 25% 0% 1% Total 9,246 8,920 4% -4% 8% 6% 2% 100%
€ in millions H1 / 2021 H1 / 2020 Growth
Currency translation
effects
Growth at constant
rates Organic
sales growth Acquisitions /
divestitures % of total
sales
North America 6,949 7,670 -9% -8% -1% -2% 1% 38% Europe 8,345 7,739 8% 0% 8% 6% 2% 46% Asia-Pacific 1,874 1,694 11% -2% 13% 13% 0% 10% Latin America 857 760 13% -17% 30% 24% 6% 5% Africa 205 192 7% 2% 5% 5% 0% 1% Total 18,230 18,055 1% -5% 6% 4% 2% 100%