![Investor Meet [Company Update]](https://static.fdocuments.us/doc/165x107/577c7a6b1a28abe054951eb5/investor-meet-company-update.jpg)
Investor Meet - May 2019
28
Investor Meet - May 2019 1
Transcript of Investor Meet - May 2019
Investor Meet - May 2019
1
Safe Harbor
Certain statements mentioned in this presentation concerning our future growth prospectsmay be forward-looking statements regarding our future business expectations intended toqualify for the 'safe harbor' which involve a number of risks and uncertainties that could causeactual results to differ materially from those in such forward-looking statements.
The risks and uncertainties relating to these statements include, but are not limited to, risksand uncertainties regarding fluctuations in earnings, fluctuations in foreign exchange rates, ourability to manage growth, intense competition in FMCG industry including those factors whichmay affect our costs, wage increases, our ability to attract and retain talent, our ability tomanage our international operations, withdrawal or expiration of governmental fiscalincentives, political instability and regional conflicts, legal restrictions on raising capital oracquiring companies within and India, and unauthorized use of our intellectual property andgeneral economic conditions affecting our industry.
2

3

Group Revenues*
Group EBITDA
Group Cash flows
Employees
• Rs.13,500 crores / USD 2 billion
• Rs.3,905 crores / USD 500 million
• Rs.1,400 crores / USD 200 million
• 13, 275
4*Bajaj Group is defined as Bajaj Consumer Care, Bajaj Energy and Bajaj Hindusthan Sugar Limited

v Nine decades ago, the Bajaj Group was born out of India’s struggle for freedom
v Founded by Shri Jamnalal Bajaj, freedom fighter, philanthropist and close confidante of Mahatma Gandhiji
who was adopted by Mahatma Gandhi as his 5th son.
v Today it has become a global business group with products in over 14 countries, over 13,000 employees
and Group revenue of USD 2 billion.
v Bajaj Group is amongst India’s most respected business houses enriching millions of life through their work
in important sectors of country.
Jamnalal Bajaj
(1889-1942)
KamalnayanBajaj
(1915-1972)
Shishir Bajaj
Age – 72 yrs
Kushagra Nayan Bajaj
Age – 42 yrs
Leadership over the years
5

6
• TRUSTEES FOR SOCIETY – PROGRESS BEFORE PROFITS
• Believe in delivering sustainable, inclusive growth
• Transparency in running our businesses
Bajaj Group Values

v There are 2 Trusts within Bajaj Foundation, namely:
1. Kamalnayan Jamnalal Bajaj Foundation (KJBF) in Wardha district of Maharashtra
2. Jamnalal Kaniram Bajaj Trust (JKBT) in Sikar district of Rajasthan
v Focus area – integrated water resources development & agro based livelihood.
§ 224 rivers / streams of 586 km length rejuvenated
§ 100 check dams & 3169 farm ponds constructed
§ 1512 group lift irrigation & 8000 micro irrigation systems installed
§ 880 roof rain water harvesting structures constructed
§ 3.5 lakh acres of land covered under water resource development & sustainable agriculture
§ 3932 Women Self-Help Groups formed with 50,000+ members
v Cumulative CSR Spend – Rs. 253 crores in last 10 years
v Employees strength – 210+ people
v Our Reach
§ Wardha – 820 villages covered out of 1060 villages & 5.92 lakh people benefitted out of 13.36 lakh
population.
§ Sikar – 300 villages covered out of 1167 villages & 4.22 lakh people benefitted out of 26.77 lakh
population.7
8
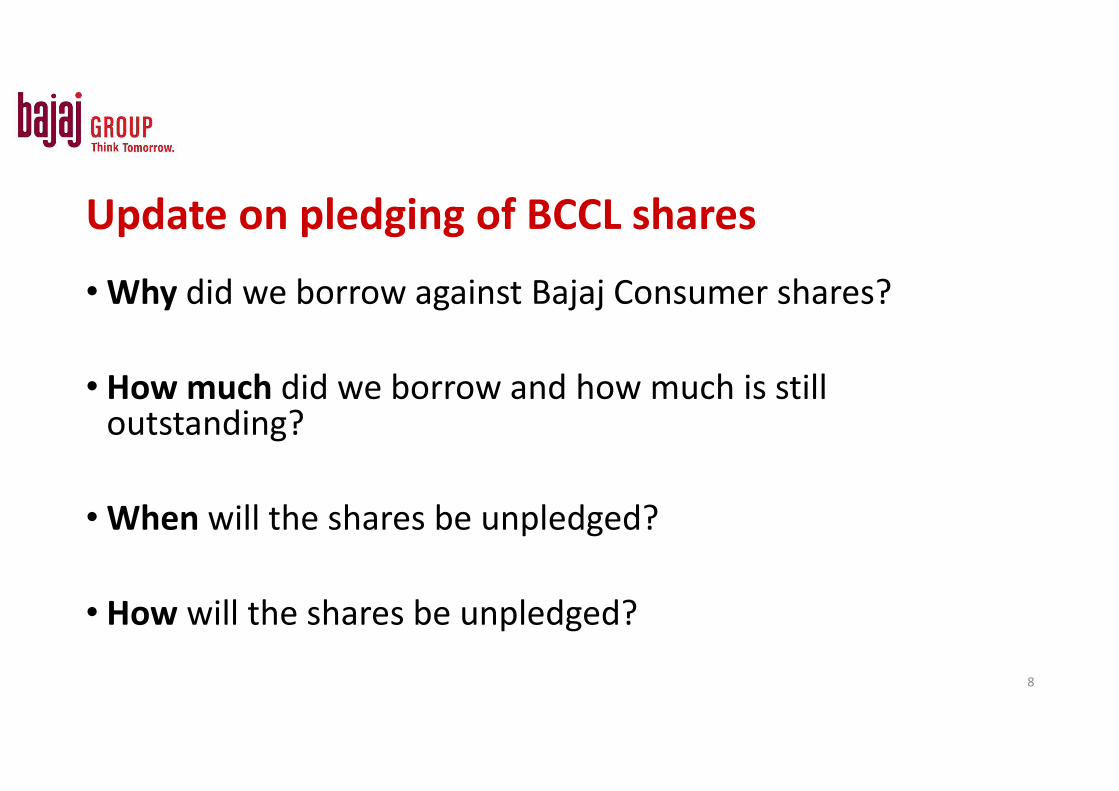
•Why did we borrow against Bajaj Consumer shares?
• How much did we borrow and how much is still outstanding?
•When will the shares be unpledged?
• How will the shares be unpledged?
Update on pledging of BCCL shares
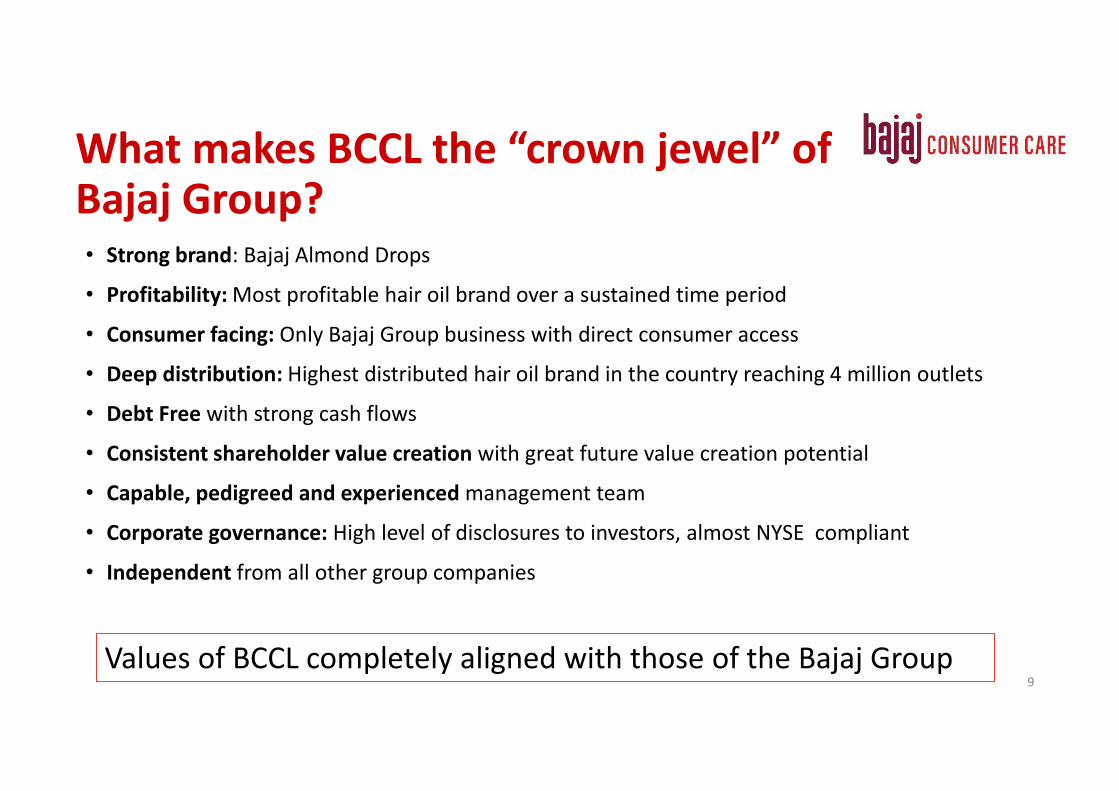
What makes BCCL the “crown jewel” of
Bajaj Group?• Strong brand: Bajaj Almond Drops
• Profitability: Most profitable hair oil brand over a sustained time period
• Consumer facing: Only Bajaj Group business with direct consumer access
• Deep distribution: Highest distributed hair oil brand in the country reaching 4 million outlets
• Debt Free with strong cash flows
• Consistent shareholder value creation with great future value creation potential
• Capable, pedigreed and experienced management team
• Corporate governance: High level of disclosures to investors, almost NYSE compliant
• Independent from all other group companies
9
Values of BCCL completely aligned with those of the Bajaj Group
The Growth story
10

Delivered consistent, profitable growth for more than a decade
95.2 92.2127.4
163.1188.2
246.2
299.7
376.5
510.7
646.8
711.8
852.6
0.98 0.21 1.37
20.228.2
46.99
83.9
84.1
120.1
167.1179
220.3
0
50
100
150
200
250
0
100
200
300
400
500
600
700
800
900
2003-04 2004-05 2005-06 2006-07 2007-08 2008-09 2009-10 2010-11 2011-12 2012-13 2013-14 2014-15
T/o PAT
Period 2003-04 to IPO
CAGR T/O- 21.7%
CAGR PAT= 88.9%
11
Consolidation
IPO – Aug 2010
IPO to 2014-15
CAGR T/O- 22.6%
CAGR PAT= 27.2%
All figures in INR Crores
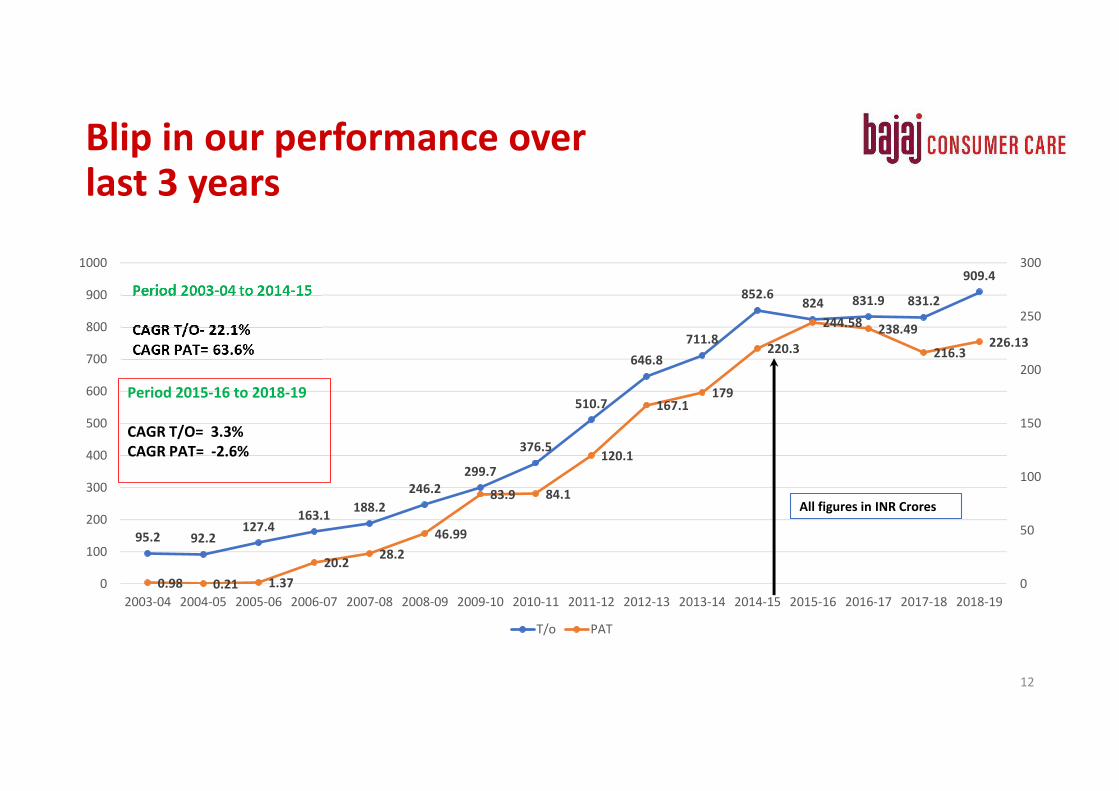
Blip in our performance over last 3 years
95.2 92.2127.4
163.1188.2
246.2
299.7
376.5
510.7
646.8
711.8
852.6824 831.9 831.2
909.4
0.98 0.21 1.37
20.228.2
46.99
83.9 84.1
120.1
167.1179
220.3
244.58238.49
216.3226.13
0
50
100
150
200
250
300
0
100
200
300
400
500
600
700
800
900
1000
2003-04 2004-05 2005-06 2006-07 2007-08 2008-09 2009-10 2010-11 2011-12 2012-13 2013-14 2014-15 2015-16 2016-17 2017-18 2018-19
T/o PAT
Period 2015-16 to 2018-19
CAGR T/O= 3.3%
CAGR PAT= -2.6%
12
All figures in INR Crores
We were investing in the future over last 3 years
• We readied ourselves for the future by getting our processes right – both customer facing and back-end
• Made significant investments in sales and supply chain automation
• Improved the consumer facing functions i.e. Marketing & R&D by bringing in top notch talent from outside and engaging world-class agencies to strengthen our equity
• Invested in getting better and smarter – capability building for our resources across functions
• Continued focus on cost excellence to sustain our profitability levels
13

Why are we bullish on the Hair Oil category?
14

Hair Oils – large, thriving and here to stay…• Indian in nature : Part of the legacy handed over from one generation to another;
• Large in size: 2nd largest personal care category in India at Rs.13,223 crores*
• Growing fast: Grew 17.1% by value and 8.7% by Volume in FY 19
• Deeply penetrated: 89% of all Indian Households(rich and poor) use Hair Oils;
• Penetration levels similar across SEC A/B/C Households and rural and urban
• Consolidated: Top 10 Brands account for 75.2% of the total branded hair oil market with only 3
Indian companies actively focused on this space
• Bajaj growing share: Market share (in THO**) has risen from 4.4% in ‘07 to 9.6% in ‘19
15* As Per Nielsen ** THO= Total Branded Hair Oil

Hair oil is one of the most deeply penetrated categories in India
16
Bajaj has grown its Household penetration from 17.4% to 20% over the last 1 year; but has significant
headroom to grow…
Source- Kantar, 2018 (U+R)
99%
89% 89%
81% 80% 79%
64%
44%
31%
0%
20%
40%
60%
80%
100%
120%
Soaps Hair Oil T Brush Shampoo Tooth Pastes Skin Creams San Nap Hair Dyes Fragrances
Household Penetration %

Hair oil category is dominated by 4 Indian players
17
Top Five companies in Hair Oils have 73% of the value share and all are Indian Promoter owned cos.
Top 10 Brands of Hair Oils have a cumulative Market Share of 75.2% of THO
Company Market Share (%)
Marico 46.2%
Bajaj 10.1%
Dabur 7.5%
Emami 6.9%
Shalimar 2.8%
Total 73.7%
Brand Company Value MS (%)
Parachute Marico 35.5%
Bajaj Almond Drops Bajaj 9.6%
Dabur Amla Dabur 7.5%
Nihar Shanti Badam Marico 5.5%
Navratna Emami 4.9%
Parachute Jasmine Marico 3.3%
Shalimar Shalimar 2.8%
Himgange GD Pharma 2.2%
Kesh King Emami 2%
Hair & Care Marico 1.9%

Is the Hair Oil category big enough to fuel our growth
ambition?
18

Market size of categories - Indian FMCG categories
19Source- Nielsen, 2017 (U+R)
15750
13000
11250
9000
6000
3750 37503000 3000
0
2000
4000
6000
8000
10000
12000
14000
16000
18000
Soaps Hair Oil Skin Creams Tooth Pastes Shampoo San Nap Hair Dyes Fragrances T Brush
Mkt Size in Rs crores
HP=89% HP=81%HP=99% HP=80%
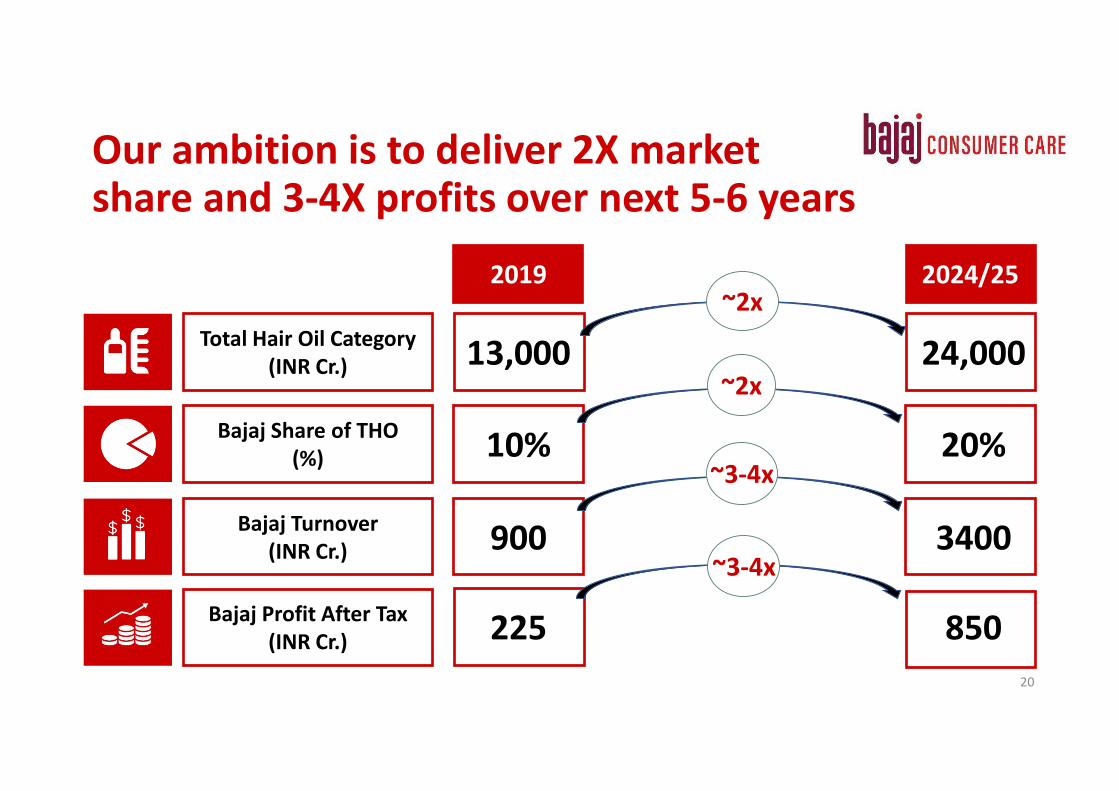
Our ambition is to deliver 2X market share and 3-4X profits over next 5-6 years
20
2024/252019
13,000 24,000Total Hair Oil Category
(INR Cr.)
10% 20%Bajaj Share of THO
(%)
900 3400Bajaj Turnover
(INR Cr.)
225 850Bajaj Profit After Tax
(INR Cr.)
~2x
~2x
~3-4x
~3-4x
We don’t believe that single category
companies are at a disadvantage
21
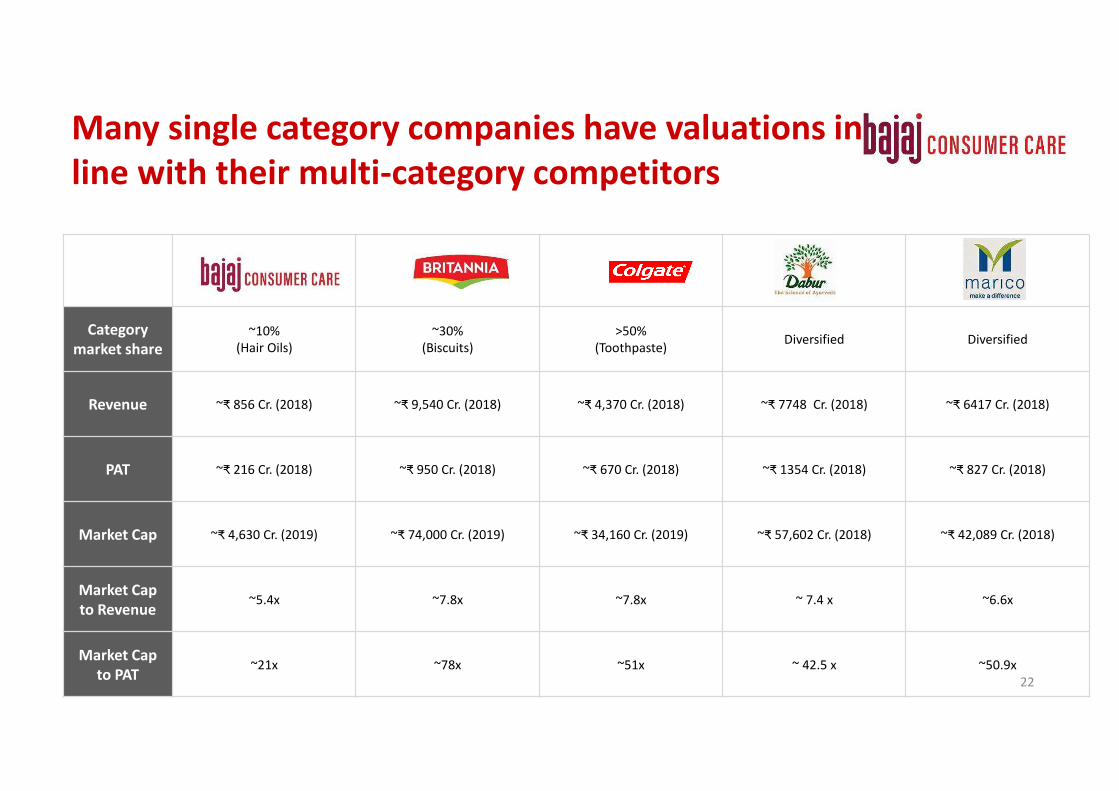
Category
market share
~10%
(Hair Oils)
~30%
(Biscuits)
>50%
(Toothpaste)Diversified Diversified
Revenue ~₹ 856 Cr. (2018) ~₹ 9,540 Cr. (2018) ~₹ 4,370 Cr. (2018) ~₹ 7748 Cr. (2018) ~₹ 6417 Cr. (2018)
PAT ~₹ 216 Cr. (2018) ~₹ 950 Cr. (2018) ~₹ 670 Cr. (2018) ~₹ 1354 Cr. (2018) ~₹ 827 Cr. (2018)
Market Cap ~₹ 4,630 Cr. (2019) ~₹ 74,000 Cr. (2019) ~₹ 34,160 Cr. (2019) ~₹ 57,602 Cr. (2018) ~₹ 42,089 Cr. (2018)
Market Cap
to Revenue~5.4x ~7.8x ~7.8x ~ 7.4 x ~6.6x
Market Cap
to PAT~21x ~78x ~51x ~ 42.5 x ~50.9x
22
Many single category companies have valuations in
line with their multi-category competitors

1
Focus category
(salience by
revenue)
Beverages
(100%)
Beverages
(46%); Snacks;
Cereal, etc.
Baiju (100%)
Whisky
(~40%); Beer
(16%)
Chocolate
(>80%)
Chocolate
(31%); Biscuits
(42%)
Apparel and
accessories (100%)
Apparel and
accessories
(~45%); Spirits &
Wines (13%)
Personal Care
(100%)
Personal care
(~30%); Fabric
and Home
care (~32%)
Revenue ~$31.9B (2018) ~$64.7B (2018)~$9.1B
(2017)
~$15.9B
(2018)~$7.8B (2018) ~$26B (2018) ~€3.20B (2018) ~€46.8B (2018) ~$30B (2018)
~$66.8B
(2018)
PAT ~$6.4B (2018) ~$12.6B (2018)~$4.3B
(2017)
~$3.9B
(2018)~$1.2B (2018) ~$3.4B (2018) ~€0.3B (2018) ~€7.0B (2018)
~$4.5B
(2018)~$9.8B (2018)
Market Cap ~$200B (2019) ~$171B (2019)~$159B
(2019)~$98B (2019)
~$23.9B
(2019)
~$71.3B
(2019)~€9.4B (2019) ~€165B (2019)
~$151B
(2019)
~$260B
(2019)
Market Cap to
Revenue~6.3x ~2.6x ~17.5x ~6.2x ~3.1x ~2.7x ~2.9x ~3.5x ~5x ~3.9x
Market Cap to
PAT~31x ~14x ~37x ~25x ~20x ~21x ~27x ~24x ~34x ~27x
23
Personal Care
(100%)
Personal care
(~30%); Fabric
and Home
care (~32%)
~$30B (2018)~$66.8B
(2018)
~$4.5B
(2018)~$9.8B (2018)
~$151B
(2019)
~$260B
(2019)
~5x ~3.9x
~34x ~27x
Many single category companies have valuations
in line with their multi-category competitors

The Way forward…
24
Our growth strategy going forward….
• Focus strongly on the Hair Oil Category – Aim to hit 20% share in 5-6 Years
• Micro Segmentation – Look at key states in great depth and design and activate the ideal assortment and marketing mix in each state/cluster
• Start small, scale fast – Start with maximizing hair oils in one state – re-apply key learnings to build a repeatable model across other states
• Continued focus on Cost excellence – deliver sustained profitability along with accelerated growth by keeping a tight leash on Employee Costs, Overheads and RM/PM
• Undertake a Multi-year Transformational Program focused on building an organization geared to succeed in the long-term
25

In summary …
• Bajaj Consumer Care is back on its growth trajectory in FY 19
• We have been investing to be future-ready in the last 3 years
• Hair oils is a large, deeply penetrated, thriving category
• Bajaj will accelerate growth by focusing its energies on hair oils - become #1 or a strong #2 across states
• Our ambition is to double our market share and quadruple our profits over the next 5-6 years
26
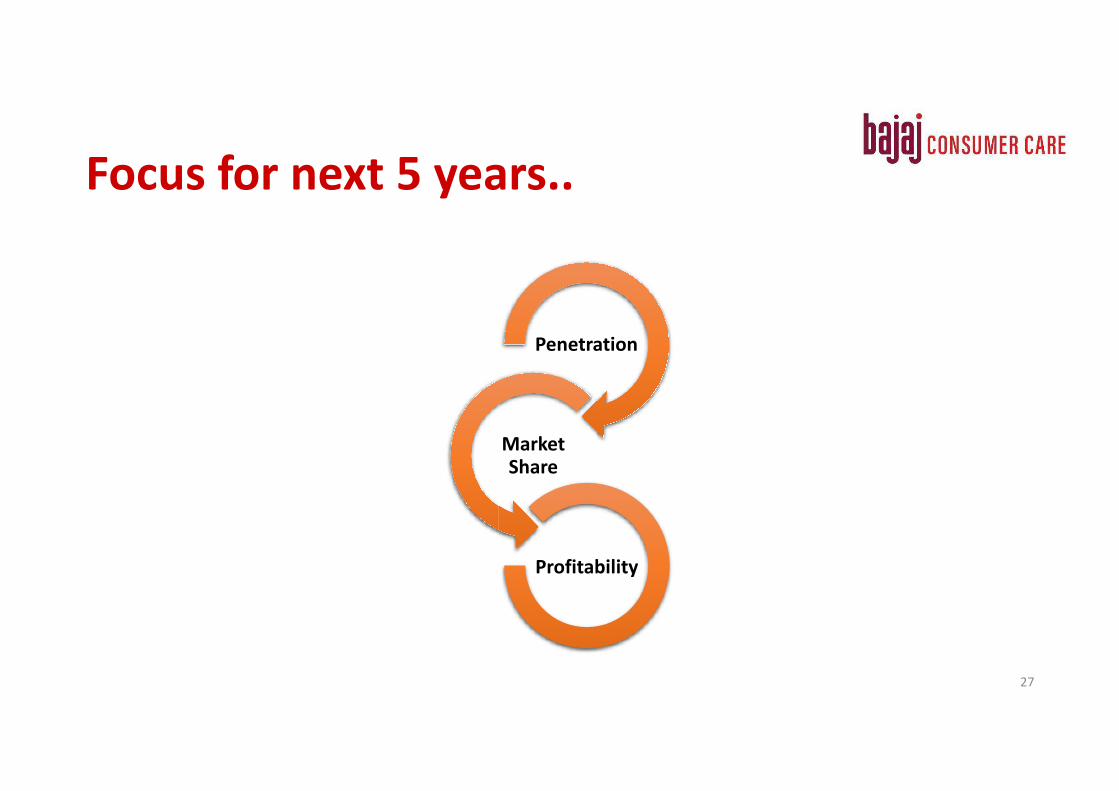
Focus for next 5 years..
Penetration
Market Share
Profitability
27
THANK YOU
28


![Investor and Analyst Meet - Presentation [Company Update]](https://static.fdocuments.us/doc/165x107/577cb4aa1a28aba7118c9a94/investor-and-analyst-meet-presentation-company-update.jpg)
![Revised Investor Meet Presentation [Company Update]](https://static.fdocuments.us/doc/165x107/577c876c1a28abe054c45af9/revised-investor-meet-presentation-company-update.jpg)


![Investor Meet Presentation [Company Update]](https://static.fdocuments.us/doc/165x107/577cb48b1a28aba7118c80c9/investor-meet-presentation-company-update.jpg)