Investor Deep Dive Investment Bank
19
9 December 2020 Deutsche Bank Investor Deep Dive Investment Bank Mark Fedorcik Ram Nayak
Transcript of Investor Deep Dive Investment Bank

9 December 2020 Deutsche Bank
Investor Deep DiveInvestment Bank
Mark FedorcikRam Nayak
Mark Fedorcik, Ram NayakInvestor Deep Dive, 9 December 2020
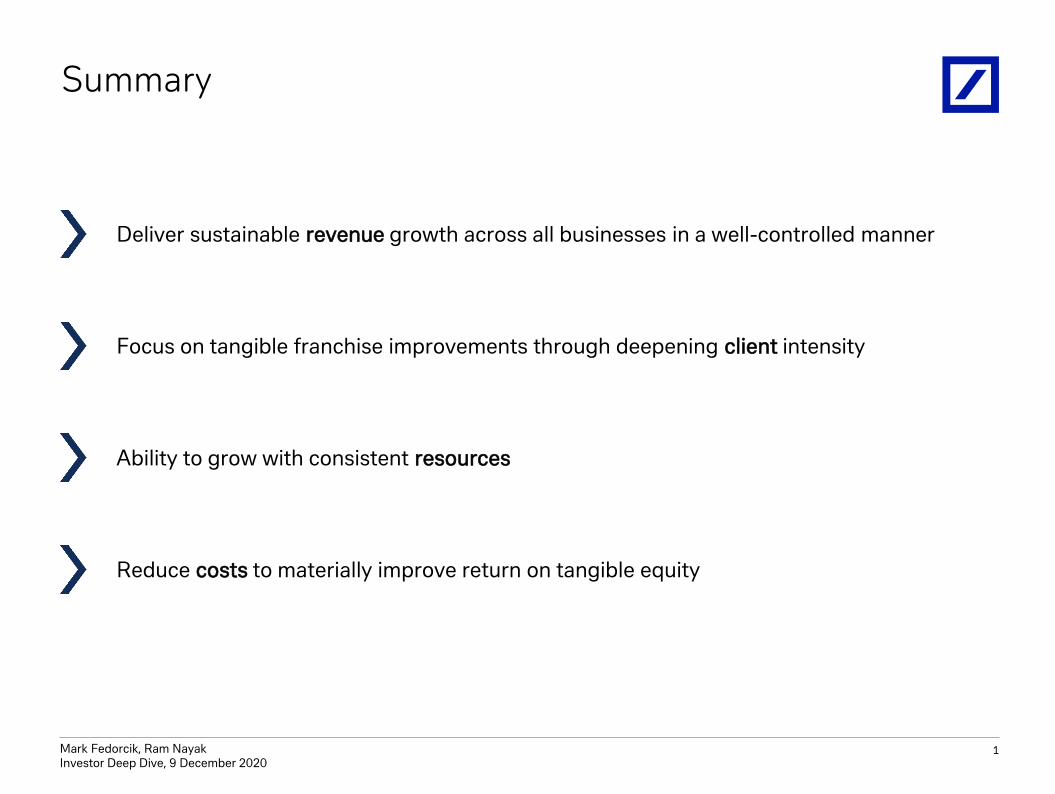
Summary
Reduce costs to materially improve return on tangible equity
Ability to grow with consistent resources
Focus on tangible franchise improvements through deepening client intensity
Deliver sustainable revenue growth across all businesses in a well-controlled manner
1
Mark Fedorcik, Ram NayakInvestor Deep Dive, 9 December 2020
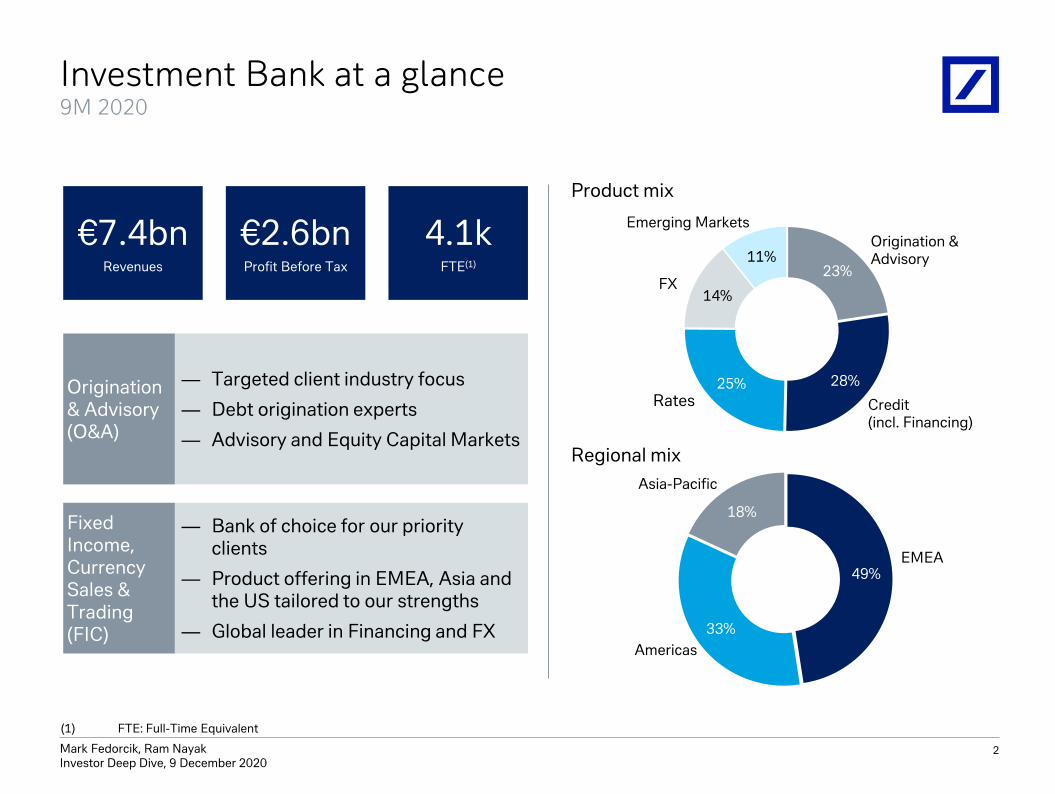
— Bank of choice for our priority clients
— Product offering in EMEA, Asia and the US tailored to our strengths
— Global leader in Financing and FX
— Targeted client industry focus
— Debt origination experts
— Advisory and Equity Capital Markets
Fixed Income, Currency Sales & Trading(FIC)
Origination & Advisory(O&A)
Investment Bank at a glance9M 2020
€7.4bnRevenues
€2.6bnProfit Before Tax
4.1kFTE(1)
Product mix
23%
28%25%
14%
11%
Rates
Origination & Advisory
Credit (incl. Financing)
FX
Emerging Markets
Regional mix
49%
33%
18%
EMEA
Americas
Asia-Pacific
(1) FTE: Full-Time Equivalent
2

Mark Fedorcik, Ram NayakInvestor Deep Dive, 9 December 2020
Material progress made
Strategic objectives Progress in 2020
4 consecutive quarters of year-on-year cost reduction since Q4 2019(1)
€ 225m reduction in funding costsReduce costs
Stabilise and grow revenues
Efficient capital usage
4 consecutive quarters of year-on-year revenue growth since Q4 2019
Sustainable revenue growth
Excluding regulatory inflation, minimal business risk weighted assets growth
Efficient capital re-allocation within the Investment Bank
Increaseclient intensity
Increased intensity across focused client set
Top 100 institutional clients +42% and platinum corporates +25%
(1) Adjusted costs ex transformation charges
3
Mark Fedorcik, Ram NayakInvestor Deep Dive, 9 December 2020
4
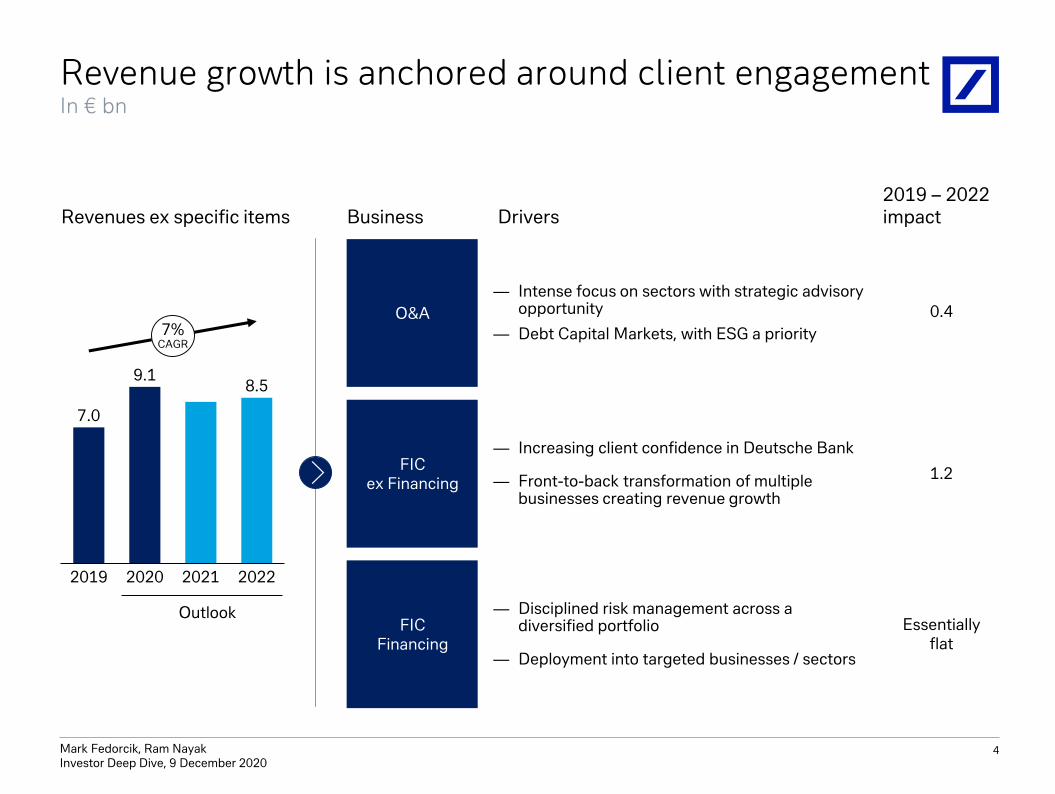
Revenue growth is anchored around client engagementIn € bn
Business DriversRevenues ex specific items2019 – 2022 impact
FIC Financing
— Disciplined risk management across a diversified portfolio
— Deployment into targeted businesses / sectors
FIC ex Financing
— Increasing client confidence in Deutsche Bank
— Front-to-back transformation of multiple businesses creating revenue growth
O&A
— Intense focus on sectors with strategic advisory opportunity
— Debt Capital Markets, with ESG a priority
0.4
1.2
Essentially flat
9.1
2019
7.0
20222020 2021
8.5
7%CAGR
Outlook
Mark Fedorcik, Ram NayakInvestor Deep Dive, 9 December 2020
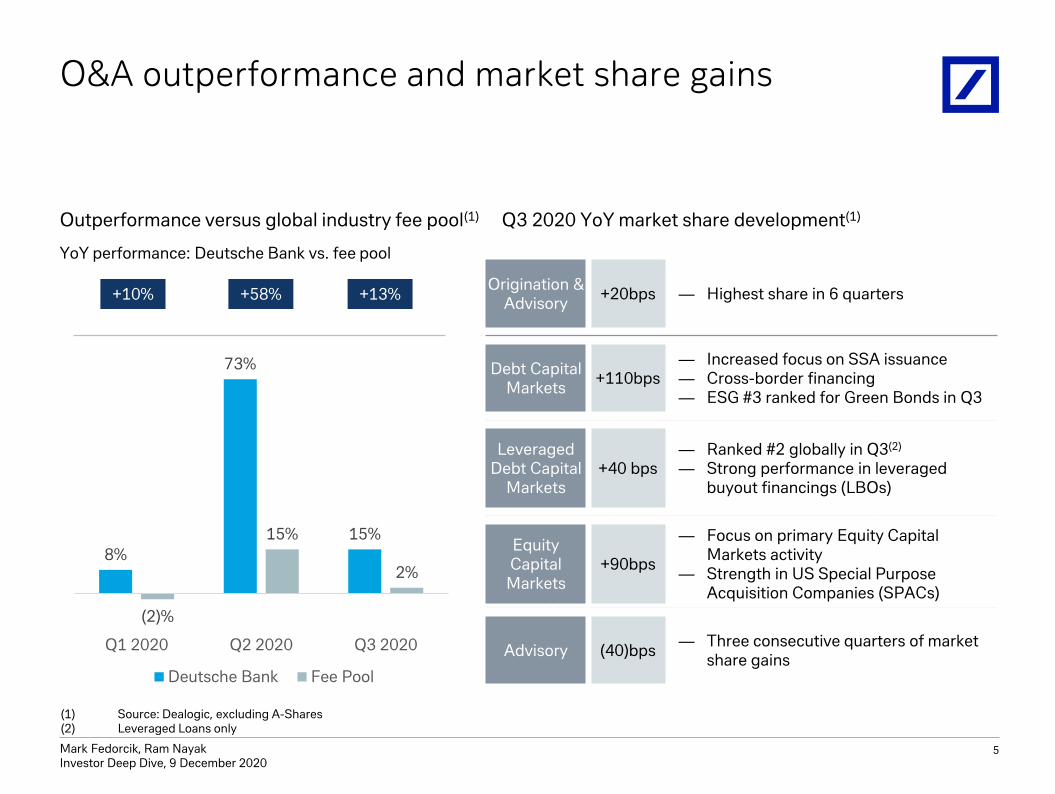
O&A outperformance and market share gains
YoY performance: Deutsche Bank vs. fee pool
Origination & Advisory
+20bps — Highest share in 6 quarters
Debt CapitalMarkets
+110bps— Increased focus on SSA issuance— Cross-border financing— ESG #3 ranked for Green Bonds in Q3
Leveraged Debt Capital
Markets+40 bps
— Ranked #2 globally in Q3(2)
— Strong performance in leveraged buyout financings (LBOs)
Equity Capital
Markets+90bps
— Focus on primary Equity Capital Markets activity
— Strength in US Special Purpose Acquisition Companies (SPACs)
Advisory (40)bps— Three consecutive quarters of market
share gains
8%
73%
15%
(2)%
15%
2%
Q1 2020 Q2 2020 Q3 2020
Deutsche Bank Fee Pool
+10% +58% +13%
(1) Source: Dealogic, excluding A-Shares(2) Leveraged Loans only
5
Outperformance versus global industry fee pool(1) Q3 2020 YoY market share development(1)
Mark Fedorcik, Ram NayakInvestor Deep Dive, 9 December 2020
6
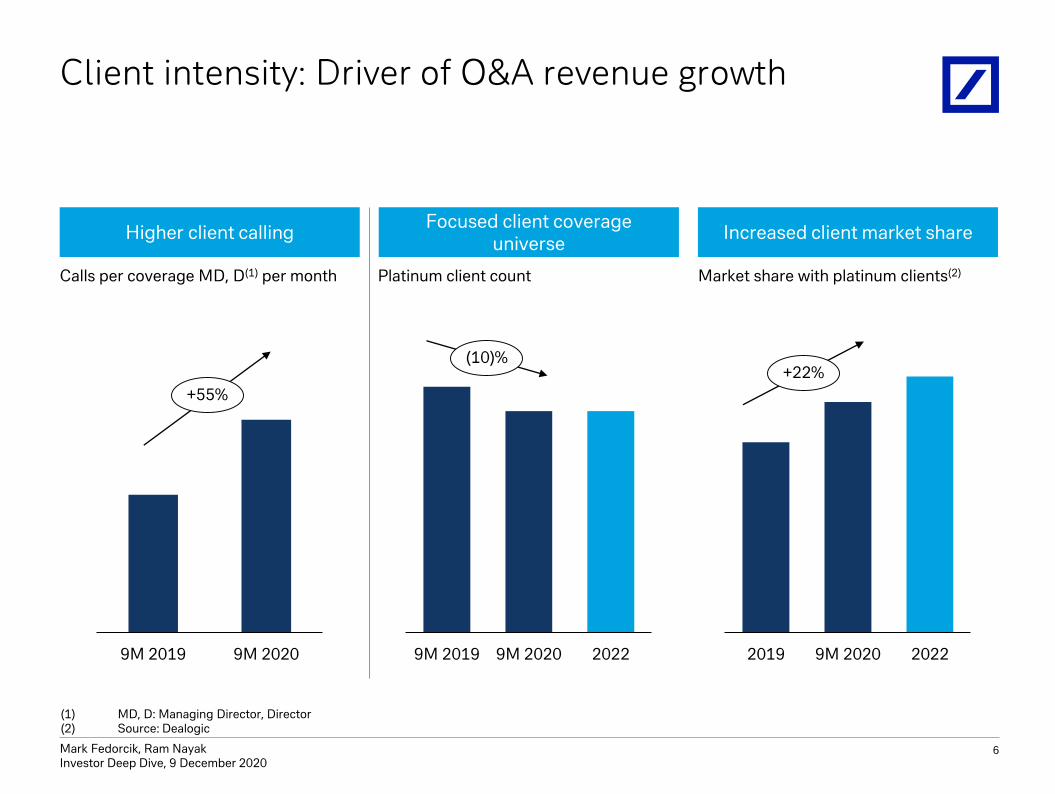
Client intensity: Driver of O&A revenue growth
9M 2019 9M 2020 2022 2019 9M 2020 2022
+22%(10)%
Focused client coverage universe
Increased client market shareHigher client calling
9M 2019 9M 2020
+55%
(1) MD, D: Managing Director, Director(2) Source: Dealogic
Calls per coverage MD, D(1) per month Platinum client count Market share with platinum clients(2)

Mark Fedorcik, Ram NayakInvestor Deep Dive, 9 December 2020
7
Transformation is the driver behind FIC revenue growth
+47% +39%(3)%
49%
19% 20%
49%
81%
(48)%
32%23%
70%
38%
119%
18%10%
23%
Oct Nov Dec Jan Feb Mar Apr May Jun Jul Aug Sep Oct Nov
Post market dislocation
Pre market dislocation
Note: 2019 and 2020 monthly figures based on August 2020 structure; 2018 monthly figures based on November 2019 structure; Nov-20 figure preliminary
FIC year-on-year monthly performance
2019 2020
Mark Fedorcik, Ram NayakInvestor Deep Dive, 9 December 2020
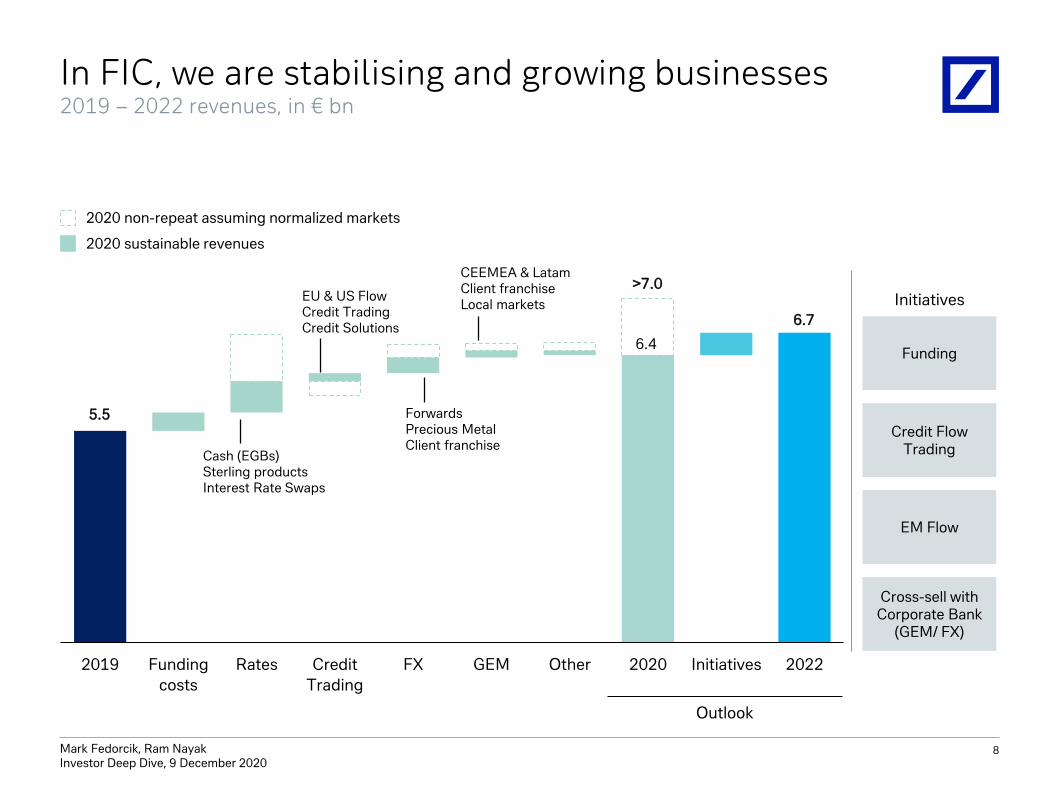
2019 Funding
costs
Rates Credit
Trading
FX GEM Other 2020 Initiatives 2022
8
In FIC, we are stabilising and growing businesses2019 – 2022 revenues, in € bn
Credit Flow Trading
EM Flow
Cross-sell with Corporate Bank
(GEM/ FX)
Funding
Initiatives
CEEMEA & LatamClient franchise Local markets
Cash (EGBs)Sterling productsInterest Rate Swaps
EU & US Flow Credit TradingCredit Solutions
Forwards Precious MetalClient franchise
5.5
>7.0
6.7
6.4
2020 non-repeat assuming normalized markets
2020 sustainable revenues
Outlook

Mark Fedorcik, Ram NayakInvestor Deep Dive, 9 December 2020
9
Client strategy is integral to FIC growth
(1) Sources: Bloomberg, TradeWeb, BondVision, DB Analysis; 9M 2020 vs. 9M 2019 unless otherwise stated(2) SSA: Sovereigns, Supranationals and Agencies; source Dealogic; 9M 2020(3) Source: McKinsey Client Wallet Analysis; 1H 2020 vs. FY 2019(4) 9M 2020 vs. 9M 2019(5) Transactions with revenues over € 250k(6) Across institutional and corporate clients
Led by technology
Northern European Pension and Insurance(3)
Market share gains in Rates
Global Asset Managers(3)
Market share gains in FX
Market leading positionin more products
Significant electronic platform market share
performance(1)
EU Govt Bonds(1)
Highest 3Q market share in last 5 years
EUR SSA issuance(2)
Highest rankin last 5 years
Global Finance(3)
1H market share gains
+121bpsG3 Bonds
+79bpsEU Credit
+159bpsG3 Swaps
+11pptsCDS
Top 5 EGBs
>7,000New
Autobahn users(6)
Targeted client focus
Focus upon depth of relationship with core institutional clients(4)
Client engagementClient relevance
Improvement in Deutsche Bank credit
outlook
Central BanksStrong re-engagement
Top 100 Global +42%
Top 50 German +45%
High valuetransactions(5) +37%
Mark Fedorcik, Ram NayakInvestor Deep Dive, 9 December 2020
10
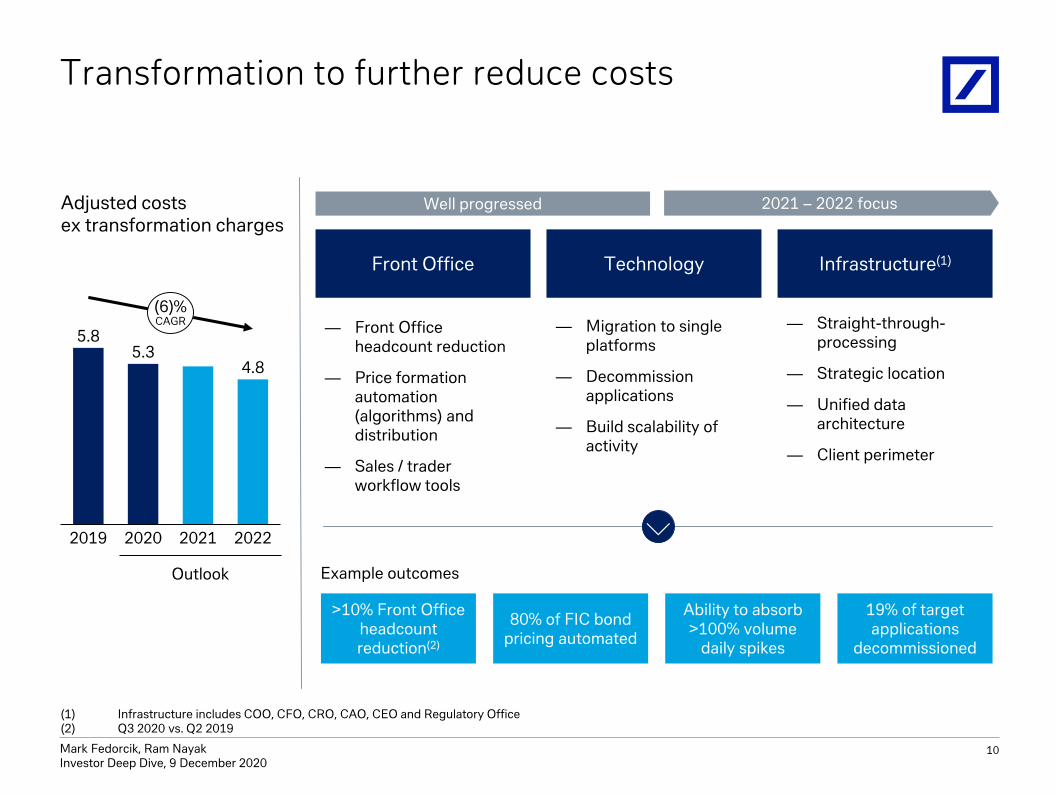
Transformation to further reduce costs
Front Office Technology Infrastructure(1)
Well progressed 2021 – 2022 focus
— Front Office headcount reduction
— Price formation automation (algorithms) and distribution
— Sales / trader workflow tools
— Migration to single platforms
— Decommission applications
— Build scalability of activity
— Straight-through-processing
— Strategic location
— Unified data architecture
— Client perimeter
Adjusted costs ex transformation charges
>10% Front Office headcount reduction(2)
80% of FIC bond pricing automated
19% of target applications
decommissioned
Ability to absorb >100% volume
daily spikes
Example outcomes
(1) Infrastructure includes COO, CFO, CRO, CAO, CEO and Regulatory Office(2) Q3 2020 vs. Q2 2019
5.3
20212019 2020 2022
5.8
4.8
(6)%CAGR
Outlook
Mark Fedorcik, Ram NayakInvestor Deep Dive, 9 December 2020
11
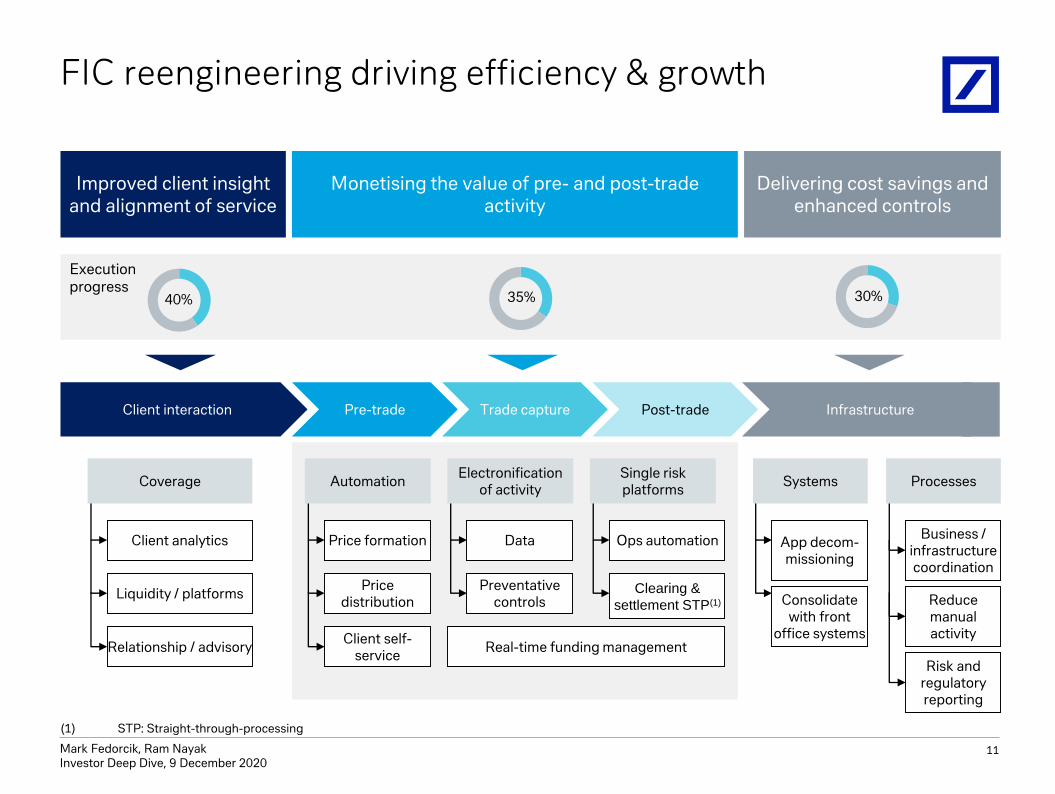
FIC reengineering driving efficiency & growth
Liquidity / platforms
Relationship / advisory
Client analytics
Infrastructure
Business / infrastructure coordination
Reduce manual activity
App decom-missioning
Consolidate with front
office systems
Pre-trade Trade capture Post-trade
Price formation
Price distribution
Client self-service
Data
Preventative controls
Ops automation
Clearing &
settlement STP(1)
Real-time funding management
Delivering cost savings and enhanced controls
Monetising the value of pre- and post-trade activity
Client interaction
Risk and regulatory reporting
35% 30%40%
Execution progress
AutomationElectronification
of activitySingle risk platforms
ProcessesSystemsCoverage
Improved client insight and alignment of service
(1) STP: Straight-through-processing

Mark Fedorcik, Ram NayakInvestor Deep Dive, 9 December 2020
12
Revenue growth without business-led RWA increaseIn € bn
2019 Actuals Business growth Regulatory
inflation
2020 Outlook Business growth Regulatory
inflation
2022 Plan
— Regulatory inflation drives majority of increase in risk weighted assets; this will continue, but at lower level than 2020
— Business growth targeted and funded by reallocation of resources within the Investment Bank
— Efficient hedging in place
117
133132
Operational risk
Market & Credit risk
Minimal risk weighted assets growth

Mark Fedorcik, Ram NayakInvestor Deep Dive, 9 December 2020
Continued disciplined approach to lendingBalance sheet profile
7%
32%
32%
29%
Commercial Real Estate(2)
Asset Backed Securities
Other(3)
Investment Bank loans:€ 73bn
Leveraged Debt Capital Markets
Risk management approach
Diversified portfolio across multiple asset
classes
Well-structured portfolio
9M 2020 loans at amortized cost(1), in € bn
Leverage Finance underwriting commitments
actively hedged
(1) Excludes off balance sheet commitments(2) Includes certain Commercial Real Estate assets which were allocated to Other at Investor Deep Dive December 2019(3) Other includes: Direct Lending, Transportation, Infrastructure and Energy, and other sectors
13
Mark Fedorcik, Ram NayakInvestor Deep Dive, 9 December 2020
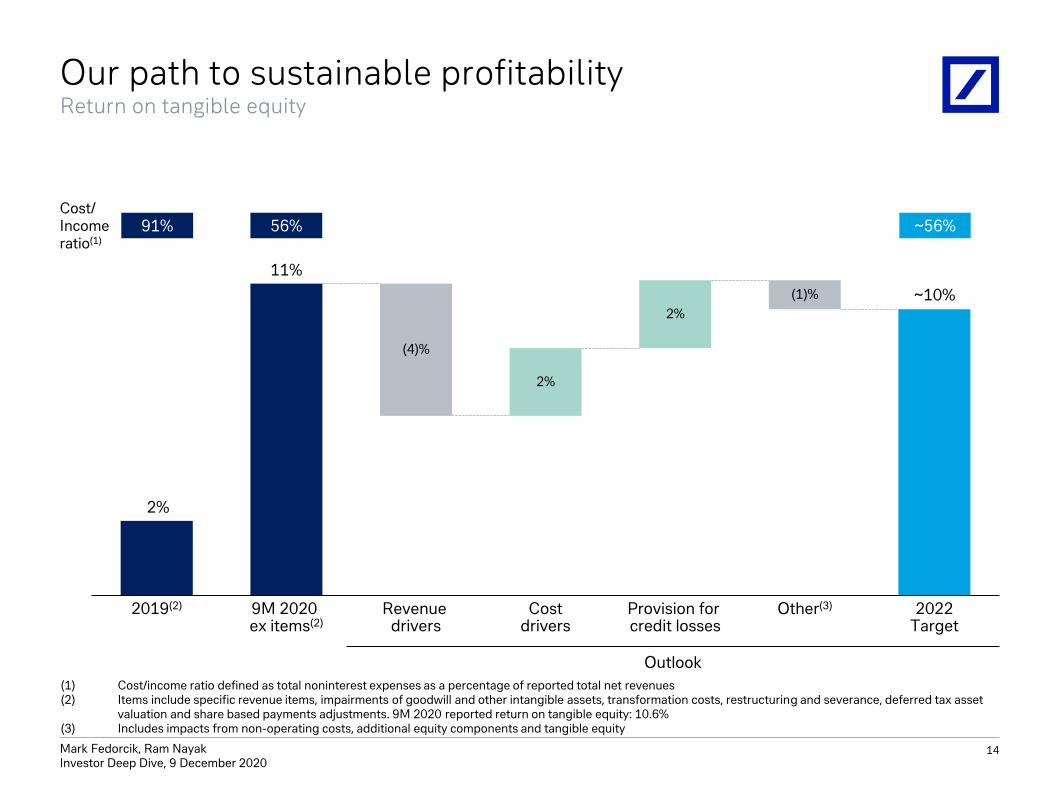
Our path to sustainable profitabilityReturn on tangible equity
2%
Provision for credit losses
2019(2)
(4)%
9M 2020 ex items(2)
Revenue drivers
Costdrivers
2%
(1)%
Other(3) 2022Target
~56%Cost/Income ratio(1)
91%
Outlook
56%
(1) Cost/income ratio defined as total noninterest expenses as a percentage of reported total net revenues(2) Items include specific revenue items, impairments of goodwill and other intangible assets, transformation costs, restructuring and severance, deferred tax asset
valuation and share based payments adjustments. 9M 2020 reported return on tangible equity: 10.6% (3) Includes impacts from non-operating costs, additional equity components and tangible equity
14
2%
11%
~10%
Mark Fedorcik, Ram NayakInvestor Deep Dive, 9 December 2020
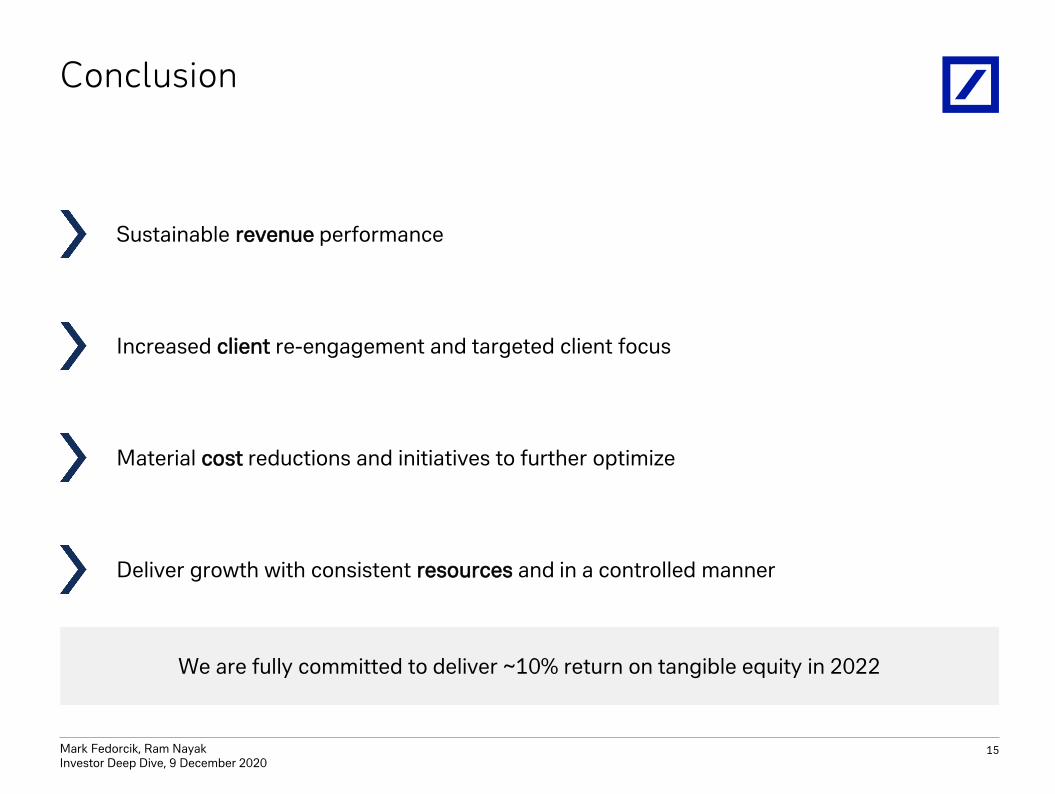
Conclusion
We are fully committed to deliver ~10% return on tangible equity in 2022
Deliver growth with consistent resources and in a controlled manner
Material cost reductions and initiatives to further optimize
Increased client re-engagement and targeted client focus
Sustainable revenue performance
15
Deutsche Bank
Appendix
Mark Fedorcik, Ram NayakInvestor Deep Dive, 9 December 2020
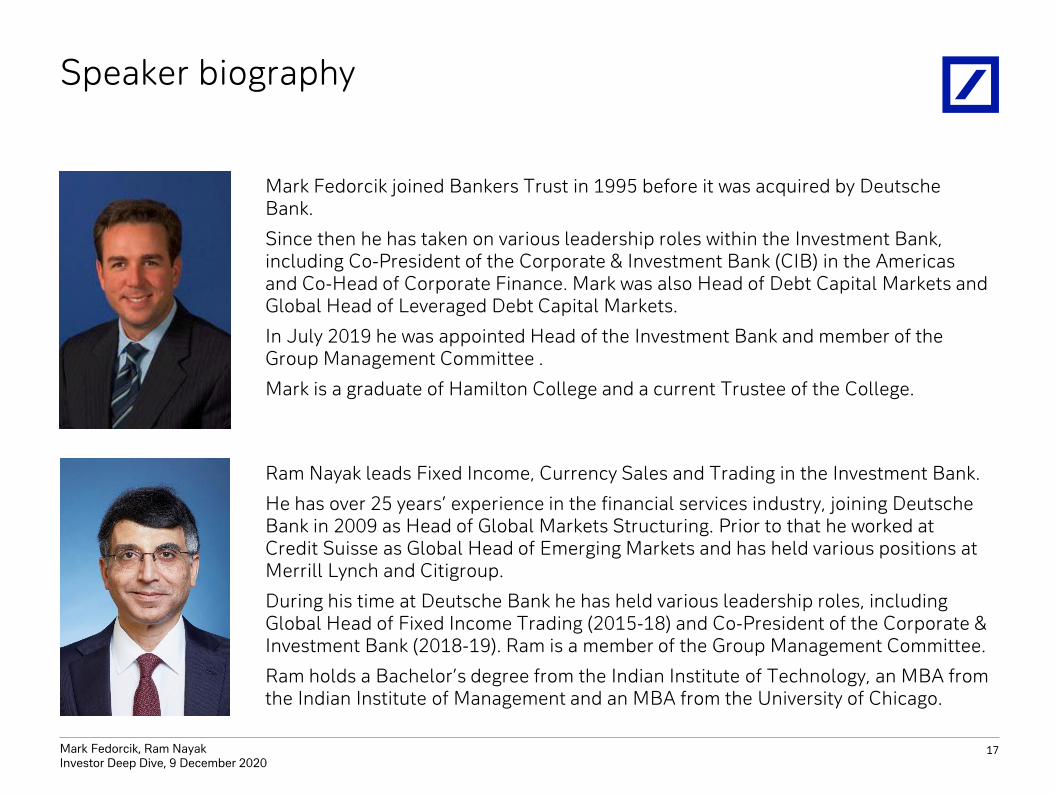
Speaker biography
Mark Fedorcik joined Bankers Trust in 1995 before it was acquired by Deutsche Bank.
Since then he has taken on various leadership roles within the Investment Bank, including Co-President of the Corporate & Investment Bank (CIB) in the Americas and Co-Head of Corporate Finance. Mark was also Head of Debt Capital Markets and Global Head of Leveraged Debt Capital Markets.
In July 2019 he was appointed Head of the Investment Bank and member of the Group Management Committee .
Mark is a graduate of Hamilton College and a current Trustee of the College.
Ram Nayak leads Fixed Income, Currency Sales and Trading in the Investment Bank.
He has over 25 years’ experience in the financial services industry, joining Deutsche Bank in 2009 as Head of Global Markets Structuring. Prior to that he worked at Credit Suisse as Global Head of Emerging Markets and has held various positions at Merrill Lynch and Citigroup.
During his time at Deutsche Bank he has held various leadership roles, including Global Head of Fixed Income Trading (2015-18) and Co-President of the Corporate & Investment Bank (2018-19). Ram is a member of the Group Management Committee.
Ram holds a Bachelor’s degree from the Indian Institute of Technology, an MBA from the Indian Institute of Management and an MBA from the University of Chicago.
17
Mark Fedorcik, Ram NayakInvestor Deep Dive, 9 December 2020
18
Cautionary statements
Non-IFRS Financial Measures
This document contains non-IFRS financial measures. For a reconciliation to directly comparable figures reported
under IFRS, to the extent such reconciliation not provided herein, please refer to the Financial Data Supplement which
can be downloaded from www.db.com/ir.
Forward-Looking Statements
This document contains forward-looking statements. Forward-looking statements are statements that are not
historical facts; they include statements about our beliefs and expectations and the assumptions underlying them.
These statements are based on plans, estimates and projections as they are currently available to the management of
Deutsche Bank. Forward-looking statements therefore speak only as of the date they are made, and we undertake no
obligation to update publicly any of them in light of new information or future events.
By their very nature, forward-looking statements involve risks and uncertainties. A number of important factors could
therefore cause actual results to differ materially from those contained in any forward-looking statement. Such factors
include the conditions in the financial markets in Germany, in Europe, in the United States and elsewhere from which
we derive a substantial portion of our revenues and in which we hold a substantial portion of our assets, the
development of asset prices and market volatility, potential defaults of borrowers or trading counterparties, the
implementation of our strategic initiatives, the reliability of our risk management policies, procedures and methods,
and other risks referenced in our filings with the U.S. Securities and Exchange Commission. Such factors are described
in detail in our SEC Form 20-F of 20 March 2020 under the heading “Risk Factors.” Copies of this document are readily
available upon request or can be downloaded from www.db.com/ir.