Investor Call Results H1 2017 - MAHLE · own assessment of the market and the market position of...
25
© MAHLE September 22nd, 2017 Michael Frick Corporate EVP and CFO Philipp Kuckuck VP Corporate Finance Investor Call Results H1 2017 1
Transcript of Investor Call Results H1 2017 - MAHLE · own assessment of the market and the market position of...

© MAHLE
September 22nd, 2017
Michael FrickCorporate EVP and CFO
Philipp Kuckuck VP Corporate Finance
Investor CallResults H1 2017
1

MAHLE GmbH
This presentation was prepared with reasonable care. However, no responsibility can be assumed for the correctness of the provided information. In addition, this
document contains summary information only and does not purport to be comprehensive and is not intended to be (and should not be construed as) the sole basis
of any analysis or other evaluation. No representation or warranty (express or implied) is made as to, and no reliance should be placed on, any information,
including projections, targets, estimates and opinions contained herein. By accepting this presentation you acknowledge that you will be solely responsible for your
own assessment of the market and the market position of the Company and that you will conduct your own analysis and be solely responsible for forming your
own view of the potential future performance of the Company’s business.
This presentation may contain forward-looking statements and information on the business development of MAHLE. These statements are based on assumptions
relating to the development of the economies of individual countries, and in particular of the automotive industry, which we have made on the basis of the
information available to us and which we consider to be realistic at the time of publication.
The estimates given involve a degree of risk, and the actual developments of e.g. sales, results and financial situation may differ from those forecasted. We do not
update forward-looking statements retrospectively. Such statements are valid on the date of publication and can be superseded.
This presentation does not constitute an offer or invitation to subscribe for, or purchase any bonds issued by MAHLE GmbH and neither this presentation nor
anything in it shall form the basis of, or be relied upon in connection with, any contract or commitment whatsoever. This presentation does not contain or constitute
an offer of, or the solicitation of an offer to buy or subscribe for, securities to any person or in any jurisdiction to whom or in which such offer or solicitation is
unlawful. The information contained in this presentation is not for publication, release or distribution in the United States, Australia, Canada or Japan and, subject
to certain exceptions, the securities referred to herein may not be offered or sold in the United States, Australia, Canada or Japan or to, or for the account or
benefit of, any national, resident or citizen of Australia, Canada or Japan.
© MAHLE
Disclaimer
2

MAHLE GmbH
MAHLE will be a driver of e-mobility, just as it already is in the conventional market today
© MAHLE
Successful development of dual strategy with focus on existing market position and future mobility trends
Highlights
3
Organic sales growth of 6% y-o-y, earnings and equity
ratio negatively impacted by one-off items and FX effects
Strengthened systems
competence with regard to e-mobility by the takeover of
electronics specialist Nagares
Presentation of MAHLE Efficient Electric Transport (MEET) – setting trends for urban
mobility
Improved financing profile due to successful
refinancing of matured
Schuldschein

MAHLE GmbH © MAHLE
Dual strategy – focus on existing market position and future mobility trends
4
Market trends and strategic positioning
HVAC: Heating, Ventilation and Air Conditioning
Strengthen ourexisting market position
Highly efficient combustion engines
Commercial Vehicles & Off-Highway
Emerging Markets
Aftermarket
New projects
Thermal management
HVAC
Shape the future in a changing mobility world
Electric auxiliaries
Electric drives & Power electronics

MAHLE GmbH
Market trends and strategic positioning
© MAHLE
Strategic evolution of business portfolio
Thermal
Acquire competence in auto-motive thermal components
MAHLE is now global no. 2 supplier for automo-tive thermal components
2013 2014 2015 2016 2017
Acquire competence in vehicle electronics
Acquire competence in thermo-electrics technology
Expansion of North American powertrain operations
Added a strong exper-tise in the mechatronics division
Advance of strategic commitment in CO2 reduction via WHR-system*
Complement mechatronics activities with e.g. electric drives
Expansion of business into test systems for automotive aftermarket
Industrial filtration
Forging activities
Turbo-charger
Business BMTSSinter
component business
Divestment
Acquisition
5
* WHR = Waste heat recovery system
Strengthening presence in workshop equipment and services
+21.1% Sales
CAGR 2013-2016

MAHLE GmbH © MAHLE
MAHLE start-up activities – fertilizing an innovation cultureMarket trends and strategic positioning
Programs to develop corporate start-ups were
initiated
The start-up market is monitored to identify potential investments
Innovative start-ups are screened to identify areas
of cooperation
Acquisition Cooperation Creation
German start-up acquired in February 2017
Thermoelectric solutions to cool & heat batteries, etc.
TinyInspektor is a German start-up with Israeli DNA
Artificial intelligence technologies to boost shop floor production
6

MAHLE GmbH
552657
753
375 3845,6% 5,7% 6,1%
6,0% 5,8%4,0%5,0%6,0%7,0%8,0%9,0%
2014 2015 2016 H1 2016 H1 2017
Current developments – addressing all crucial issues related to powertrain and air conditioning technology
7
Market trends and strategic positioning
HybridOptimization ICE Alternative drives
Compressor
Liquid management modules
Friction reduced engine components
Components for alternative fuels CNG
Heat pump
© MAHLE
48 volt drive system
Climate system for R744 refrigerant
Battery cooling Quick charge
Intake and exhaust systems for fuel cell vehicles
E-Compressor
R&D expenses (EUR mn)
Chiller
Battery(<15°C)
Chiller
LT ra
diat
or
< 40°C
Coo
ling
Air
Ca
bin
Air
iCond
Eva
po.
HV CoolantHeate r
He
ate
rC
ore
LT ra
diat
or
< 60°C
Ele
ctro
nic
s
Oil cooler
HV CoolantHeater

MAHLE GmbH
+ km
Market trends and strategic positioning
© MAHLE
MAHLE’s demonstrator vehicle –a new experience in urban mobility
+ km+ km
Efficient thermoelectric heat
pump
Innovative individual-related interior
tempering
48-volt traction drive optimized for urban
mobility
Intelligent thermal management
Climate neutral R744 air conditioning
circuit
MAHLE Efficient Electric Transport
Range + km
8

MAHLE GmbH
6,196+108 -114
+373 6,563
Financial results H1 2017
© MAHLE
All business units contributed to the strong organic sales growth of 6%
9
-1.8%
M&A
+6.0%
Organic growth
Jan – Jun 2016 Jan – Jun 2017
+1.7%
Exchange rateeffects
Sales (EUR mn)
+ 5.9%

MAHLE GmbH
Organic sales growth twice as high as market growth but earnings impacted by one-off effects
© MAHLE
Group sales grew by 5.9% as expected – organic sales growth outperformed market growth**
Earnings negatively impacted by warranty provisions
Equity ratio temporarily below target range
Still strong net debt/ EBITDA ratio
Successful increased refinancing of Schuldschein
10
Financial results H1 2017
MAHLE Group – Key financials H1 2017
Sales
€ 6,563 mn
EBITDA
€ 431 mn
Net income
€ -20 mn
Net debt/ EBITDA*
1.4x
Equity ratio
31.0%
EBITDA margin
6.6 %
**According to IHS, light vehicle production H1 2017 +2.8%* EBITDA for H1 2017 calculated on the basis of trailing 12 months EBITDA

MAHLE GmbH
By region
© MAHLE
Balanced portfolio and global footprint Financial results H1 2017
Engine Systems and Components
22.4%(+0.3pp)
Filtration and Engine
Peripherals17.4%
Thermal Management
34.7%
After-market 7.6%
(+0.2pp)
Profit Centers14.8%
(-0.5pp)
Division Mechatronics3.1%
By businessunit
Sales split H1 2017 Total: EUR 6.6 bn
Europe49.0%
(-2.5pp)
Asia/Pacific18.8%
(+1.0pp)
South America5.2%
(+1.0pp)
Africa0.4%
North America26.6%
(+0.5pp)
and (%) = Sales share H1 2017 vs. H1 2016
11

MAHLE GmbH
1.022 1.093 1.079
54343110,3% 9.5% 8.8% 8.8%6.6%
2014 2015 2016 H1 2016 H1 2017
EBITDA EBITDA margin
© MAHLE
Earnings impacted by non-recurring effects
EBITDA influenced by increased material prices and warranty provisions
Amortization of goodwill and purchase price allocation within EBIT amounting to 1.1% of group sales
Additional impacts on net income
– Lower interest income y-o-y due to positive one-off effects in H1 2016
– Increased tax rate due to higher non-deductible expenses and positive non recurring effects in H1 2016
Financial results H1 2017
12
EBIT (EUR mn)
EBITDA (EUR mn)
514 511 473
2461305.2% 4.5% 3.8% 4.0% 2.0%
2014 2015 2016 H1 2016 H1 2017
EBIT EBIT margin

MAHLE GmbH © MAHLE
Reduced equity ratio due to one-off effects
Equity ratio is below target ratio due to
– Inflated half-year balance sheet total including excess cash from recent Schuldschein
– Negative FX translation effects on equity
– Higher warranty provisions
Net debt/ EBITDA ratio still within conservative target range
Commitment to implicit investment grade rating
* Net debt = liabilities to banks + bonds – cash in hand, bank balances and checks **EBITDA for H1 2017 calculated on the basis of trailing 12 months EBITDA
Financial results H1 2017
13
Equity (EUR mn)
Net debt* (EUR mn)
2,555 2,667 2,722 2,743 2,561
37.8% 34.0% 33.9% 33.1% 31.0%
2014 2015 2016 H1 2016 H1 2017
Equity Equity ratio
33%
701
1.4071.226 1.314 1.322
0.7
1.3 1.1 1.3 1.4
2014 2015 2016 H1 2016 H1 2017
Net debt Net debt / EBITDA**
2.0

MAHLE GmbH © MAHLE
Adequate cash position after the first six months
Cash flow development H1 2017 (EUR mn)
Financial results H1 2017
Cash funds at the beginning of the
period
Incl. short term liabilities & excl. cash on banking
accounts > 3 months
Cash flow from
operating activities
Cash flow from
investing activities
Cash flow from
financing activities
161
-311
Cash funds at the end of the
period
Incl. short term liabilities & excl. cash on banking
accounts > 3 months
+244 272
+6
FX and consolidation
effects
+172
14
Reduced cash flow from operating activities due to cash out from EU antitrust fine and increased working capital
High investments in property, plant, and equipment amounting to EUR 229.4 mn
Positive cash flow from financing activities

MAHLE GmbH
99 9337 13 20
167*
629
300
500
15 124
102
125 74 10025
2017 2018 2019 2020 2021 2022 2023 2024 2025 2026 2027
Other liabilities to banks (EUR 435 mn) Bonds (EUR 829 mn) SSD (EUR 565 mn)
0
99 108137
320
769
131
2566
© MAHLE
Financial results H1 2017
MAHLE has continuously increased and diversified its investor base
Maturity of EUR 1,600 mn RCF has been extended by one year to July 2022
New EUR 250 mn Schuldschein were issued in June, maturing 2023, 2025 and 2027
Other liabilities to banks include ancillary facilities in Mexico and Turkey as well as bilateral loan agreements in Brazil, India and Japan
Total financial liabilities:EUR 1,829 mn
(incl. liabilities to banks, bonds and certain other liabilities)
RCF = Revolving Credit Facility SSD = Schuldscheindarlehen* EUR 118,5 mn of other liabilities to banks represent short-term drawdowns from RCF maturing in 2022
Well balanced maturity profile and diversified funding mix with different debt instruments
15

MAHLE GmbH
Passenger cars and light commercial vehicles Medium and heavy duty vehicles
OutlookVehicle
Markets*(Forecast
2017 vs. 2016)
OutlookMAHLE Group
9.941 11.486 12.322
2014 2015 2016 2017e(guidance)
~12,600
World market
Europe
North America
South America
Asia/Pacific
+ 4.6%
+ 3.7%
- 1.3%
+ 6.2%
+ 4.8%
Outlook
© MAHLE
Full year 2017 sales expected to reach EUR 12.6 bn
16
Group sales expected to grow by 2-3% in 2017
Strong investments in R&D focusing our dual strategy
Commitment to target equity ratio of 33% in the following years
Improve cost situation and further integrate recent acquisitions
World market
Europe
North America
South America
Asia/Pacific
+ 1.9%
+ 2.8%
+ 14.3%
- 2.2 %
+ 2.1%
Middle East/ Africa + 7.3%
*Source: Includes data provided by IHS, www.ihs.com; Copyright © [2017], LV and MHD Production August 3rd 2017 (Comparison Forecast 2017 with Actual 2016)

MAHLE GmbH © MAHLE
Investor Relations contactsIR contact
MAHLE GmbHPragstr. 26-4670376 StuttgartGermany
Investor Relations: Email: [email protected]: http://www.mahle.com
Philipp Kuckuck Vice President Corporate Finance
Verena SigelHead of Group Financing and Investor Relations
Stefanie HesseCorporate Finance and Investor Relations
17

MAHLE GmbH © MAHLE
Appendix
18

MAHLE GmbH © MAHLE
MAHLE is present in all global core marketsenhancing its well-balanced footprint
Company overview
AFRICASales: EUR 25 mn (+8.3%)
Employees: 1,044 (-0.9%)Production locations: 2Development locations: -
ASIA / PACIFICSales: EUR 1,237 mn (+12.2%)
Employees: 16,200 (+0.9%)Production locations: 54Development locations: 5
SOUTH AMERICASales: EUR 341 mn (+29.9%)
Employees: 9,024 (-3.4%)Production locations: 13Development locations: 1
EUROPESales: EUR 3,214 mn (+0.7%)
Employees: 34,766 (+0.5%)Production locations: 68 (-6)Development locations: 5
NORTH AMERICASales: EUR 1,745 mn (+8.0%)
Employees: 16,262 (+4.4%)Production locations: 29Development locations: 4
Development locations
Countries with MAHLE production locations
49.0% 26.6%
5.2%
0.4%
+0.5pp -2.5pp
+1pp
+1pp
19
18.8%
Note: Sales and Headcount figures as of June 30, 2017, Locations as of Dec 31, 2016Sales by country of origin compared to H1 2016, Employees by region compared to Dec 31, 2016 incl. development locations and sales branches
MAHLE GmbH
Company overview
© MAHLE
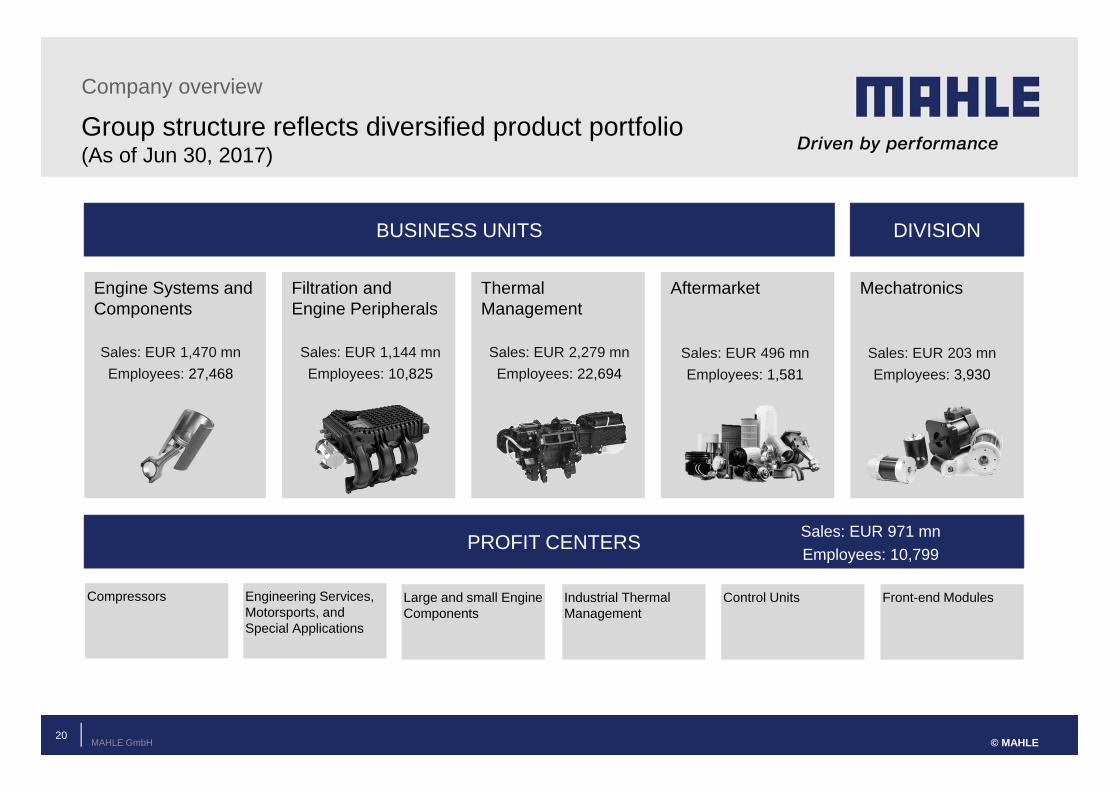
Group structure reflects diversified product portfolio(As of Jun 30, 2017)
20
BUSINESS UNITS
PROFIT CENTERS
Engine Systems andComponents
Filtration andEngine Peripherals
Thermal Management
Aftermarket
Large and small Engine Components
Industrial ThermalManagement
Control Units Front-end ModulesCompressors Engineering Services, Motorsports, and Special Applications
Sales: EUR 1,470 mnEmployees: 27,468
Sales: EUR 1,144 mnEmployees: 10,825
Sales: EUR 2,279 mnEmployees: 22,694
Sales: EUR 496 mnEmployees: 1,581
Sales: EUR 971 mnEmployees: 10,799
Mechatronics
Sales: EUR 203 mnEmployees: 3,930
DIVISION

MAHLE GmbH © MAHLE
Global vehicle production expected to grow however uncertainty remains due to political risks
Outlook
2,5
49,7
3,1
17,4
22,1
94,9
2,7
50,1
3,4
17,5
22,4
96,1
Middle East /Africa
Asia/Pacific
South America
North America
Europe
World market+1.3 %+1.9 %
Production of Passenger Cars and Light Commercial Vehicles [in million pcs.]
2.131
87
503
669
3.391
1.967
95
554
688
3.305
Asia/Pacific
South America
North America
Europe
World market(incl. MiddleEast/Africa)
-2.5 %
+4.6 %
Production of Medium and Heavy Duty Vehicles and Buses (>6t) [in thousand pcs.]
Forecast 2018
Forecast 2017
+1.2 %²+2.8 %1
+0.5 %-2.2 %
+9.3 %+14.3 %
+0.7 %+2.1 %
+10.0 %+7.3 %
+2.9 %²
+3.7 %1
+10.1 %
+6.2 %
+9.5 %
-1.3 %
-7.7 %
+4.8 %1 Comparison Forecast 2017 with Actual 2016 ² Comparison Forecast 2018 with Forecast 2017
Source: Includes data provided by IHS, www.ihs.com; Copyright © [2017], LV and MHD Production August 3rd 2017
Forecast 2018
Forecast 2017
21
MAHLE GmbH © MAHLE
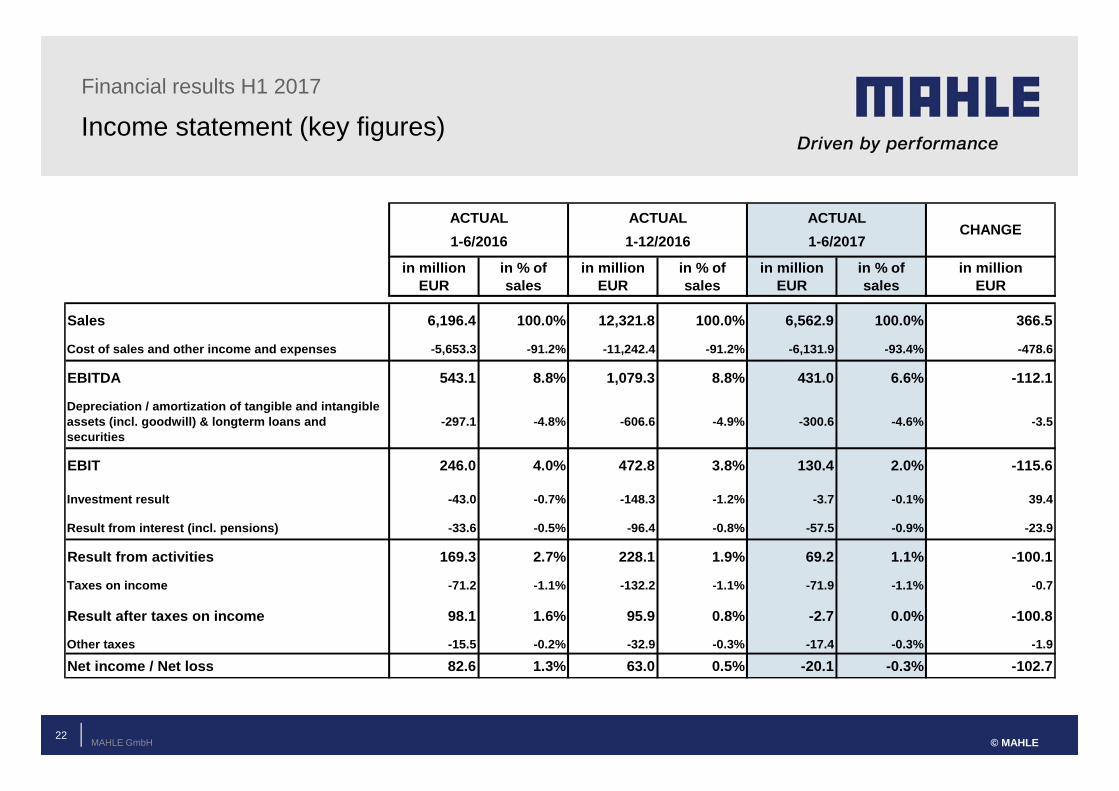
Income statement (key figures)Financial results H1 2017
ACTUAL ACTUAL ACTUAL1-6/2016 1-12/2016 1-6/2017
in million EUR
in % of sales
in million EUR
in % of sales
in million EUR
in % of sales
in million EUR
Sales 6,196.4 100.0% 12,321.8 100.0% 6,562.9 100.0% 366.5
Cost of sales and other income and expenses -5,653.3 -91.2% -11,242.4 -91.2% -6,131.9 -93.4% -478.6
EBITDA 543.1 8.8% 1,079.3 8.8% 431.0 6.6% -112.1
Depreciation / amortization of tangible and intangible assets (incl. goodwill) & longterm loans and securities
-297.1 -4.8% -606.6 -4.9% -300.6 -4.6% -3.5
EBIT 246.0 4.0% 472.8 3.8% 130.4 2.0% -115.6
Investment result -43.0 -0.7% -148.3 -1.2% -3.7 -0.1% 39.4
Result from interest (incl. pensions) -33.6 -0.5% -96.4 -0.8% -57.5 -0.9% -23.9
Result from activities 169.3 2.7% 228.1 1.9% 69.2 1.1% -100.1
Taxes on income -71.2 -1.1% -132.2 -1.1% -71.9 -1.1% -0.7
Result after taxes on income 98.1 1.6% 95.9 0.8% -2.7 0.0% -100.8
Other taxes -15.5 -0.2% -32.9 -0.3% -17.4 -0.3% -1.9
Net income / Net loss 82.6 1.3% 63.0 0.5% -20.1 -0.3% -102.7
CHANGE
22

MAHLE GmbH © MAHLE
AssetsFinancial results H1 2017
06/30/2017
in million EUR % in million
EUR % in million EUR % in million
EUR
Intangible assets 697.9 8.4% 630.7 7.9% 618.5 7.5% -12.2
Property, plant, and equipment 2,892.5 34.9% 3,029.0 37.7% 2,929.8 35.4% -99.2
Financial assets 159.4 1.9% 90.0 1.1% 115.2 1.4% 25.2
Inventories 1,270.1 15.3% 1,268.8 15.8% 1,315.8 15.9% 46.9
Receivables and other assets 2,484.6 30.0% 2,350.3 29.3% 2,488.0 30.1% 137.6
Cash and cash equivalents 488.2 5.9% 372.5 4.6% 498.4 6.0% 125.9
Prepaid expenses 33.5 0.4% 20.9 0.3% 34.9 0.4% 14.0
Deferred tax assets 197.4 2.4% 196.2 2.4% 204.7 2.5% 8.5
Plan assets 71.3 0.9% 73.6 0.9% 69.1 0.8% -4.5
Total 8,295.0 100.0% 8,032.1 100.0% 8,274.4 100.0% 242.3
ACTUAL06/30/2016
ACTUAL12/31/2016
CHANGEACTUAL
23

MAHLE GmbH © MAHLE
Equity and liabilitiesFinancial results H1 2017
06/30/2017
in million EUR % in million
EUR % in million EUR % in million
EUR
Equity 2,742.7 33.1% 2,721.9 33.9% 2,561.0 31.0% -161.0
Badwill 1.8 0.0% 1.5 0.0% 1.4 0.0% -0.1
Accruals for pensions and similar obligations 568.2 6.8% 575.3 7.2% 567.5 6.9% -7.8
Other accruals 1,530.4 18.4% 1,462.5 18.2% 1,640.6 19.8% 178.0
Bonds 829.0 10.0% 829.0 10.3% 829.0 10.0% 0.0
Liabilities to banks 973.2 11.7% 769.3 9.6% 990.8 12.0% 221.5
Trade payables 1,192.6 14.4% 1,256.8 15.6% 1,232.3 14.9% -24.5
Other liabilities 457.2 5.5% 415.6 5.2% 451.8 5.5% 36.2
Total 8,295.0 100.0% 8,032.1 100.0% 8,274.4 100.0% 242.3
ACTUALCHANGE
ACTUAL06/30/2016
ACTUAL12/31/2016
24

MAHLE GmbH © MAHLE
Abbreviated cash flow statementFinancial results H1 2017
ACTUAL ACTUAL ACTUAL
[in million EUR] 1-6/2016 1-12/2016 1-6/2017
Cash funds at beginning of period 131.3 131.3 161.2 29.9
Cash flows from operating activities 354.7 855.7 244.4 -110.3
Cash flows from investing activities -247.7 -575.2 -311.0 -63.2
Cash flows from financing activities -47.1 -266.0 171.7 218.8
Total cash flow 59.9 14.5 105.1 45.2
Change in cash funds from exchange rate movements and valuation procedures 61.5 18.9 5.6 -56.0
Change in cash funds from changes in the consolidation group -3.5 -3.5 0.0 3.5
Cash funds at end of period 249.2 161.2 271.9 22.7
CHANGE
25