Investor Briefing February 2015 NYSE:BMS - Bemis...
30
Investor Briefing February 2015 NYSE:BMS
-
Upload
duongkhuong -
Category
Documents
-
view
216 -
download
0
Transcript of Investor Briefing February 2015 NYSE:BMS - Bemis...
Investor Briefing February 2015
NYSE:BMS
2
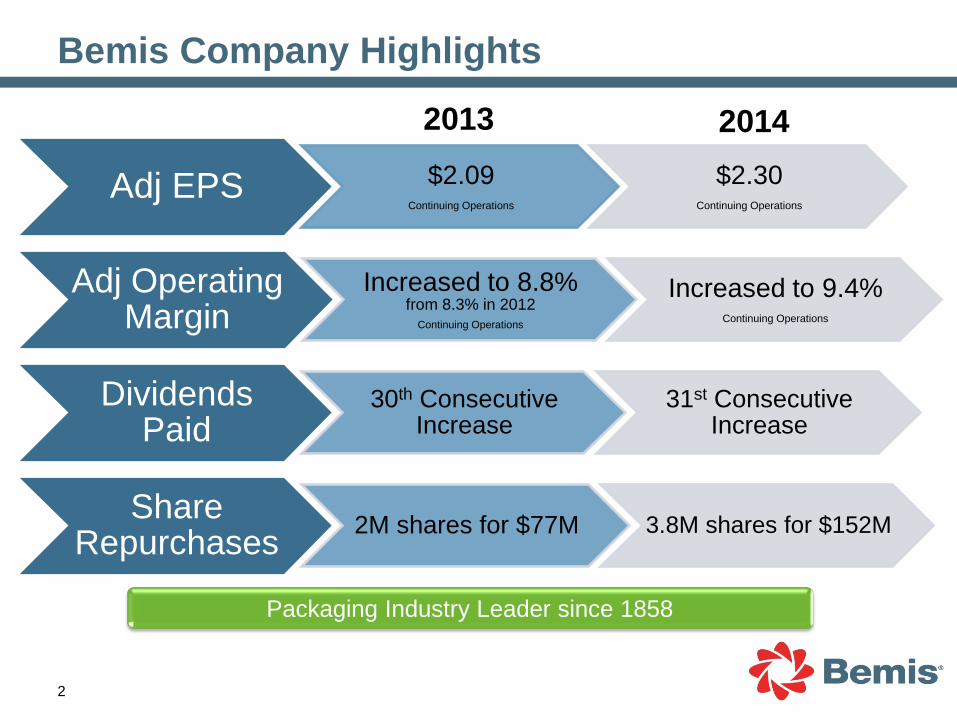
Adj EPS $2.09 Continuing Operations
$2.30 Continuing Operations
Adj Operating Margin
Increased to 8.8% from 8.3% in 2012
Continuing Operations
Increased to 9.4% Continuing Operations
Dividends Paid
30th Consecutive Increase
31st Consecutive Increase
Share Repurchases 2M shares for $77M 3.8M shares for $152M
2013 2014
Packaging Industry Leader since 1858
Bemis Company Highlights
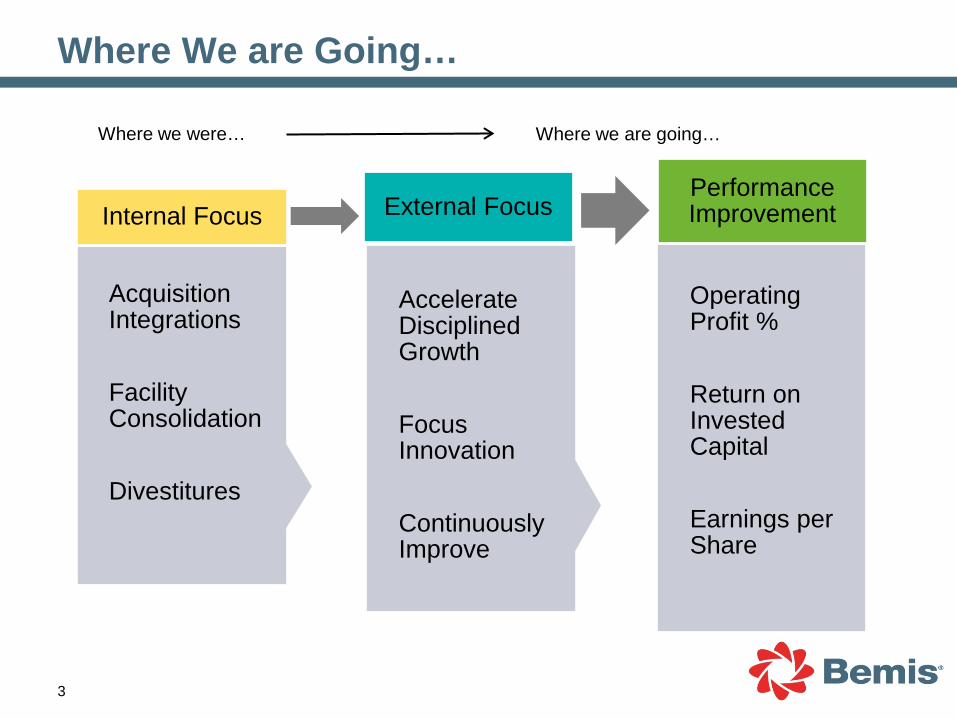
Where We are Going…
3
Operating Profit % Return on Invested Capital Earnings per Share
Performance Improvement
Accelerate Disciplined Growth Focus Innovation Continuously Improve
External Focus
Acquisition Integrations Facility Consolidation Divestitures
Internal Focus
Where we were… Where we are going…
4
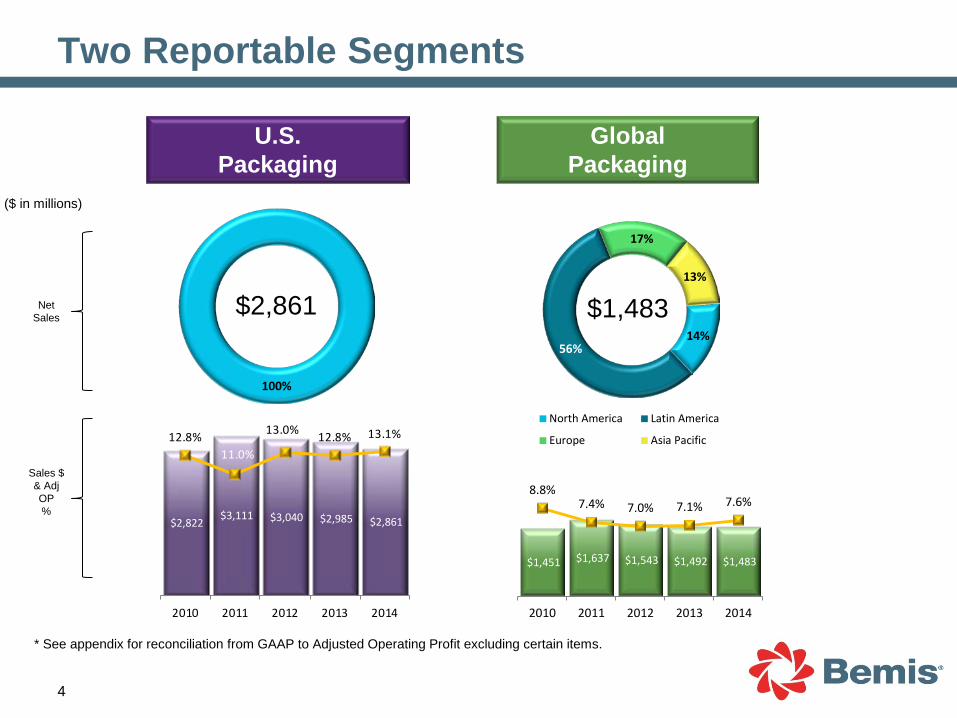
U.S. Packaging
Global Packaging
* See appendix for reconciliation from GAAP to Adjusted Operating Profit excluding certain items.
($ in millions)
$2,861 $1,483 Net Sales
Sales $ & Adj OP %
Two Reportable Segments
100%
14% 56%
17%
13%
North America Latin America
Europe Asia Pacific
$2,822 $3,111 $3,040 $2,985 $2,861
12.8%11.0%
13.0% 12.8% 13.1%
2010 2011 2012 2013 2014
$1,451 $1,637 $1,543 $1,492 $1,483
8.8% 7.4% 7.0% 7.1% 7.6%
2010 2011 2012 2013 2014
5
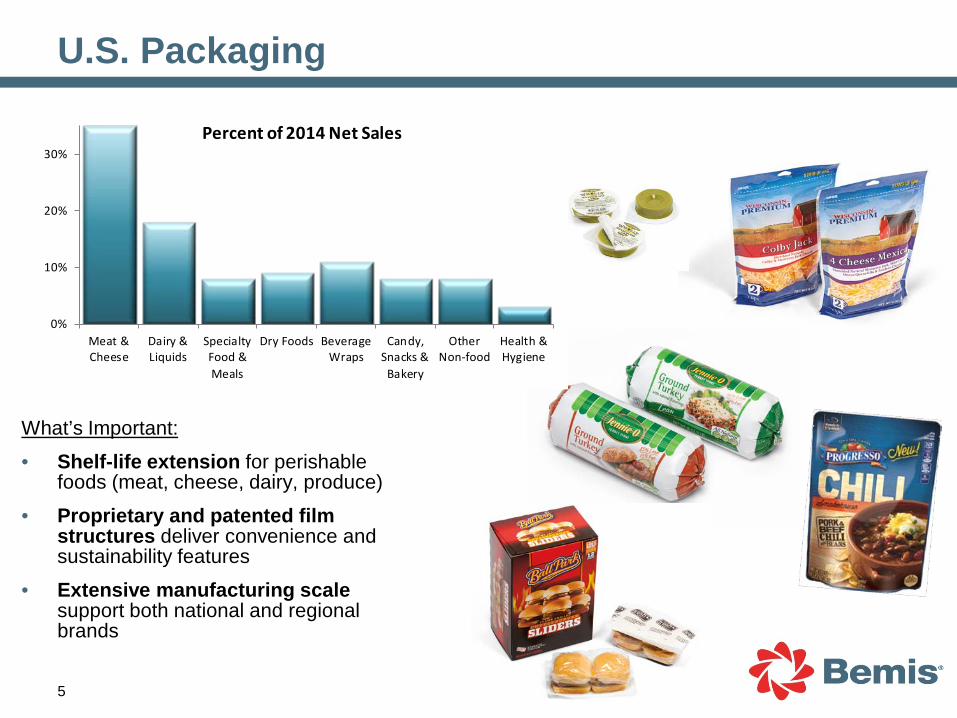
What’s Important:
• Shelf-life extension for perishable foods (meat, cheese, dairy, produce)
• Proprietary and patented film structures deliver convenience and sustainability features
• Extensive manufacturing scale support both national and regional brands
U.S. Packaging
0%
10%
20%
30%
Meat &Cheese
Dairy &Liquids
SpecialtyFood &Meals
Dry Foods BeverageWraps
Candy,Snacks &
Bakery
OtherNon-food
Health &Hygiene
Percent of 2014 Net Sales
6
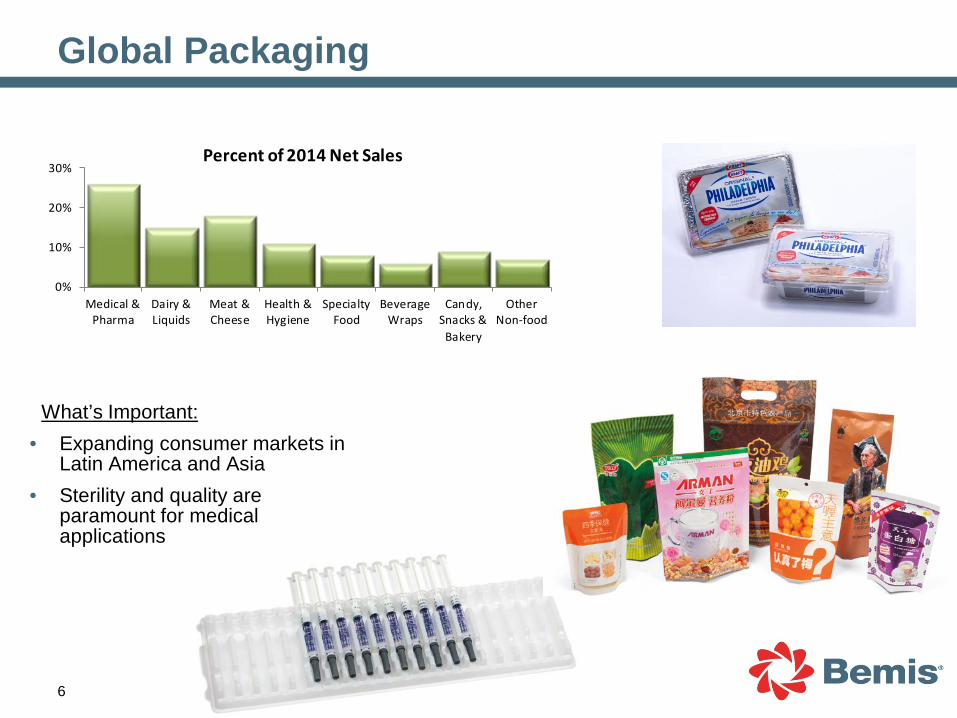
What’s Important: • Expanding consumer markets in
Latin America and Asia • Sterility and quality are
paramount for medical applications
Global Packaging
0%
10%
20%
30%
Medical &Pharma
Dairy &Liquids
Meat &Cheese
Health &Hygiene
SpecialtyFood
BeverageWraps
Candy,Snacks &
Bakery
OtherNon-food
Percent of 2014 Net Sales
7
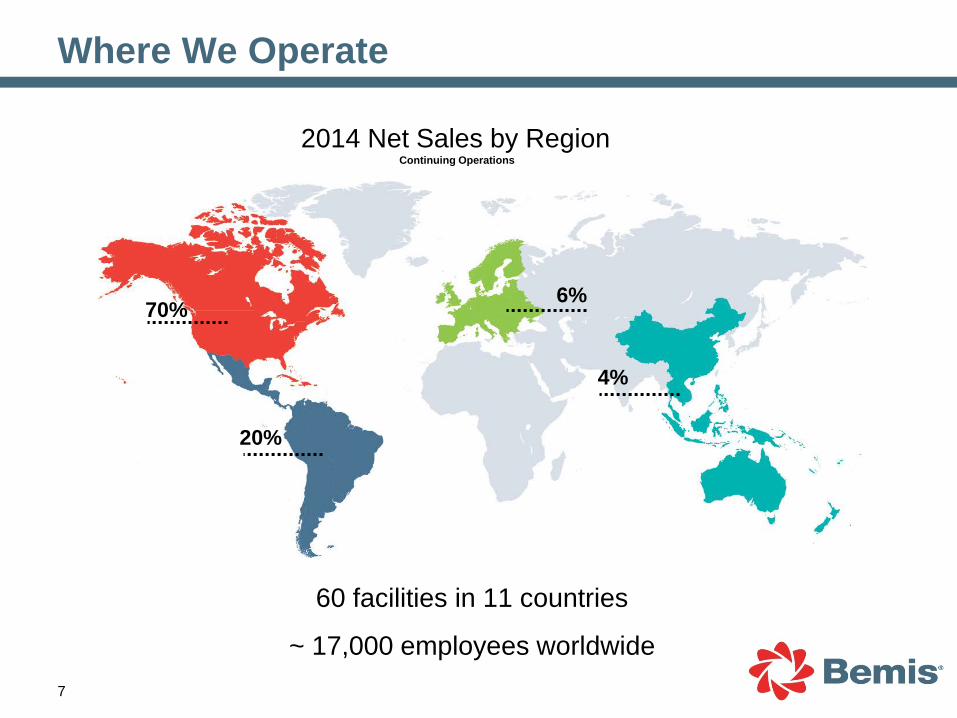
2014 Net Sales by Region Continuing Operations
Where We Operate
60 facilities in 11 countries
~ 17,000 employees worldwide
70% 6%
4%
20%
8
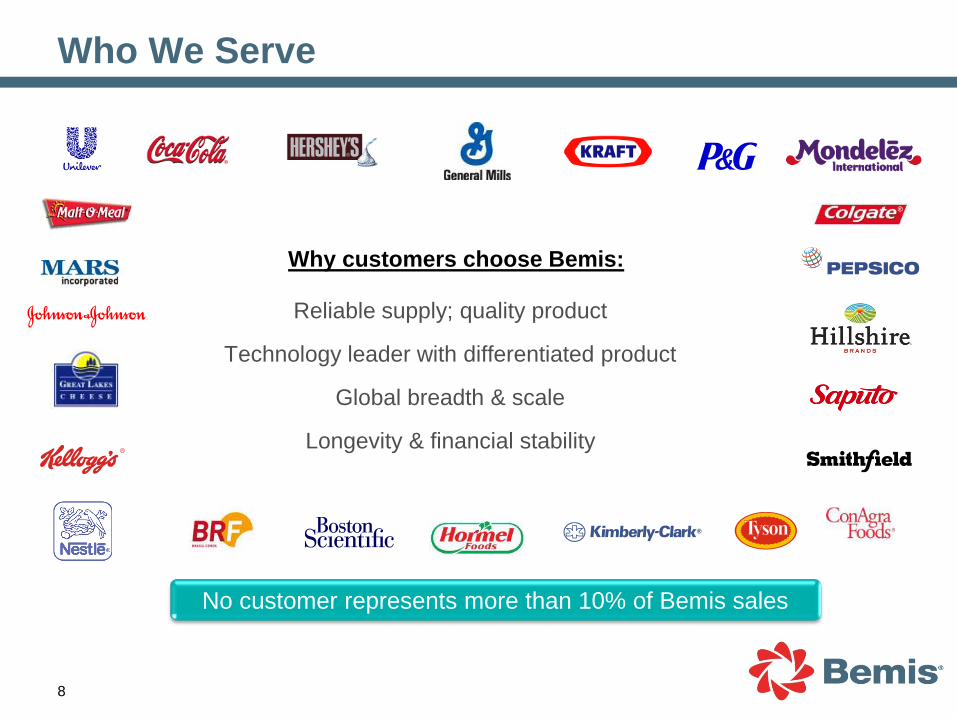
Why customers choose Bemis:
Reliable supply; quality product
Technology leader with differentiated product
Global breadth & scale
Longevity & financial stability
No customer represents more than 10% of Bemis sales
Who We Serve
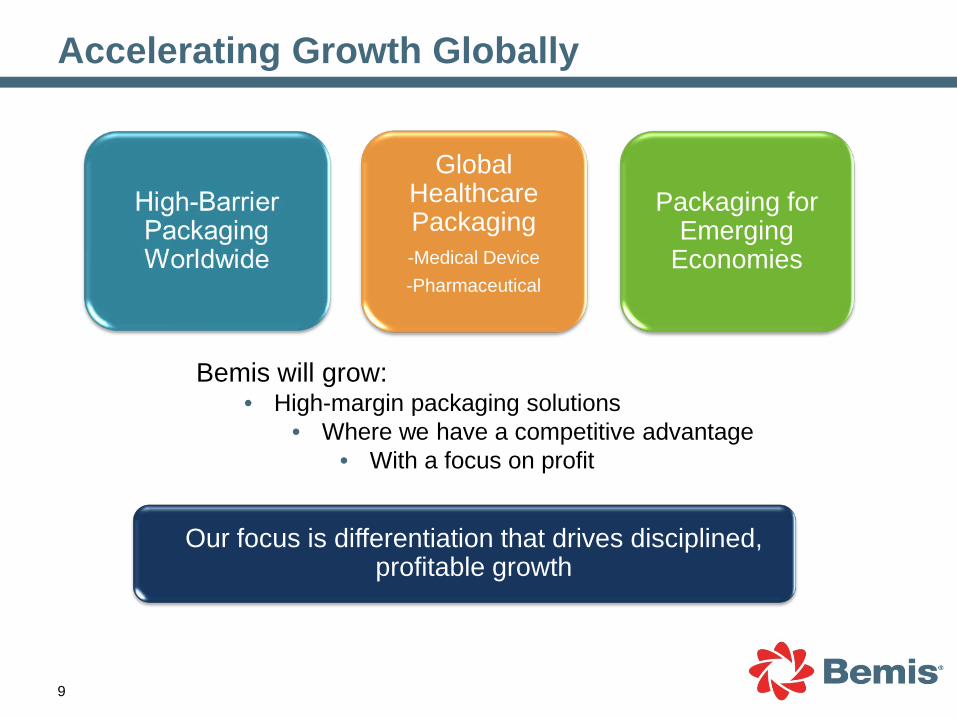
Global Healthcare Packaging -Medical Device -Pharmaceutical
Packaging for Emerging
Economies
Our focus is differentiation that drives disciplined, profitable growth
Bemis will grow: • High-margin packaging solutions
• Where we have a competitive advantage • With a focus on profit
Accelerating Growth Globally
9
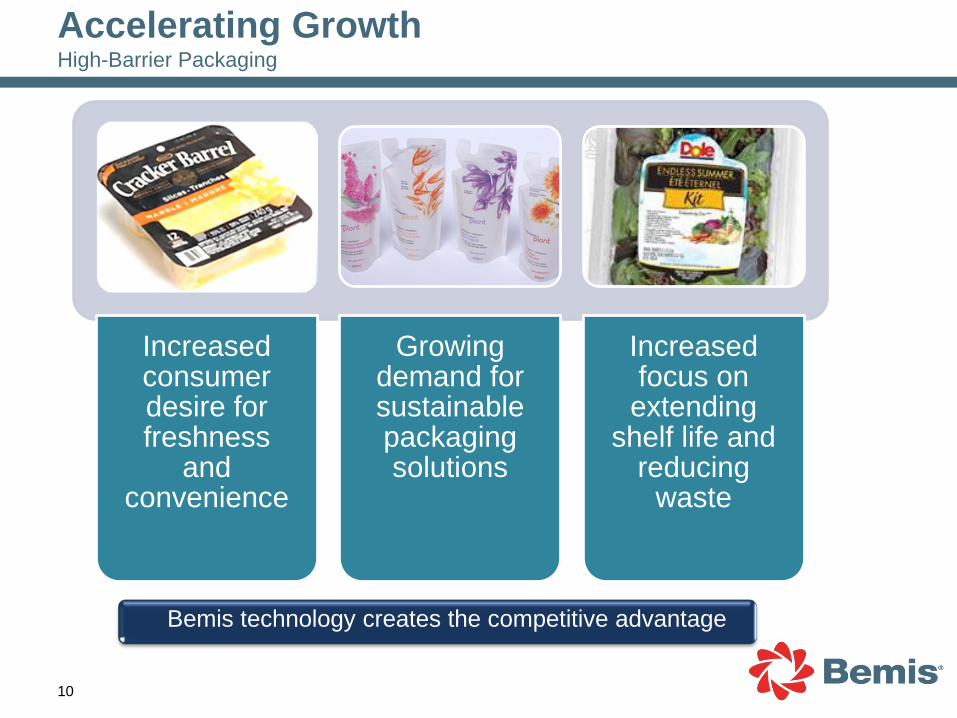
Increased consumer desire for freshness
and convenience
Growing demand for sustainable packaging solutions
Increased focus on
extending shelf life and
reducing waste
Accelerating Growth High-Barrier Packaging
10
Bemis technology creates the competitive advantage
11
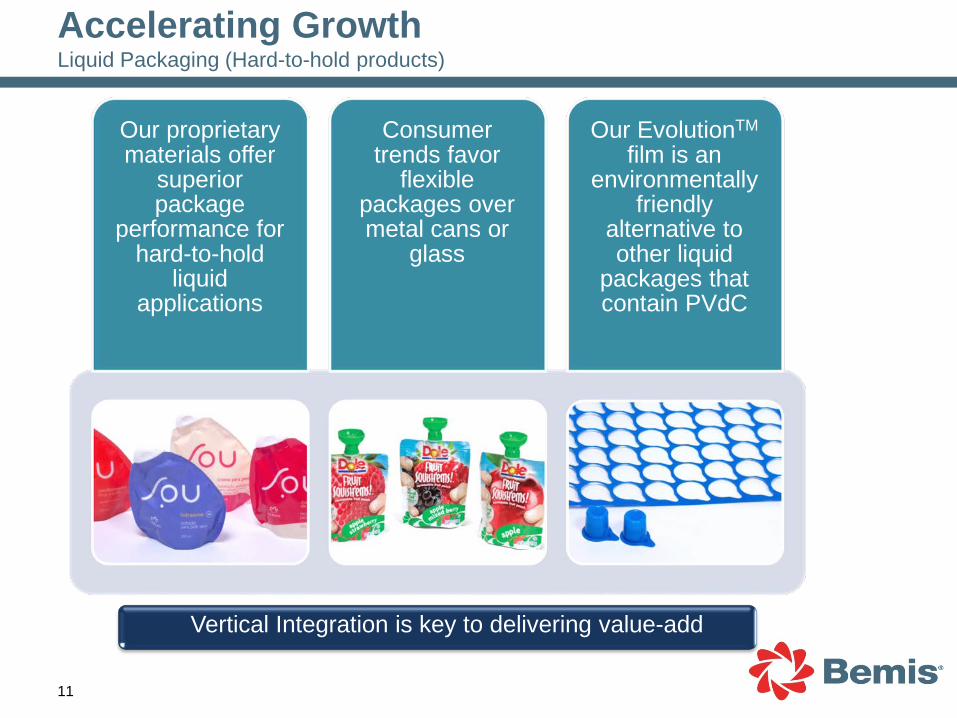
Our EvolutionTM film is an
environmentally friendly
alternative to other liquid
packages that contain PVdC
Consumer trends favor
flexible packages over metal cans or
glass
Our proprietary materials offer
superior package
performance for hard-to-hold
liquid applications
Accelerating Growth Liquid Packaging (Hard-to-hold products)
Vertical Integration is key to delivering value-add
12
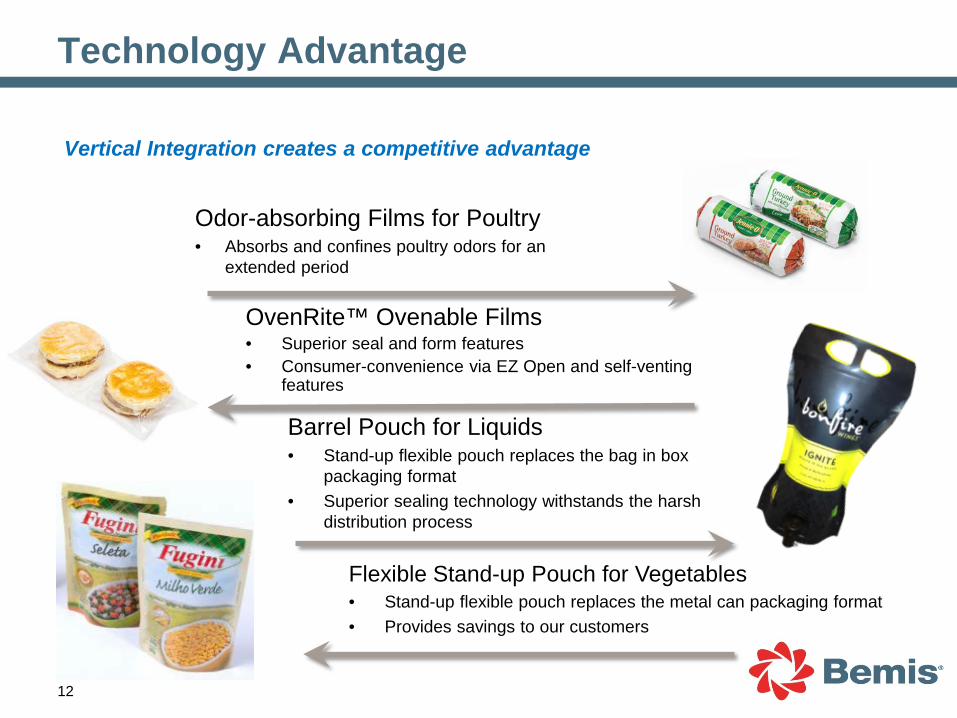
Odor-absorbing Films for Poultry • Absorbs and confines poultry odors for an
extended period OvenRite™ Ovenable Films • Superior seal and form features • Consumer-convenience via EZ Open and self-venting
features
Flexible Stand-up Pouch for Vegetables
• Stand-up flexible pouch replaces the metal can packaging format • Provides savings to our customers
Barrel Pouch for Liquids • Stand-up flexible pouch replaces the bag in box
packaging format • Superior sealing technology withstands the harsh
distribution process
Technology Advantage
Vertical Integration creates a competitive advantage
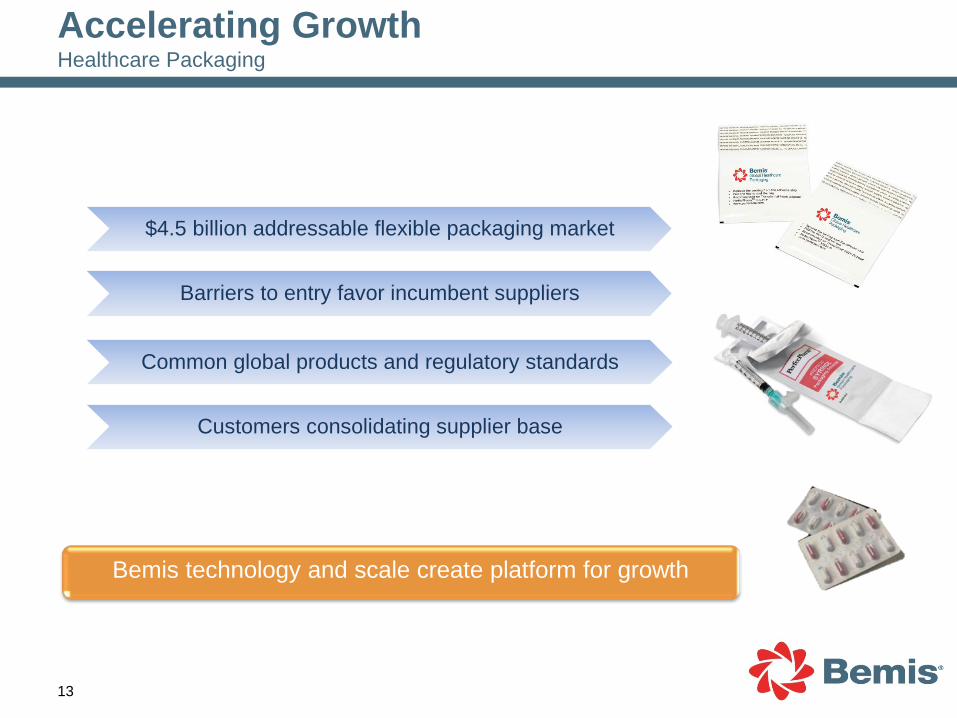
Bemis technology and scale create platform for growth
$4.5 billion addressable flexible packaging market
Barriers to entry favor incumbent suppliers
Common global products and regulatory standards
Customers consolidating supplier base
Accelerating Growth Healthcare Packaging
13
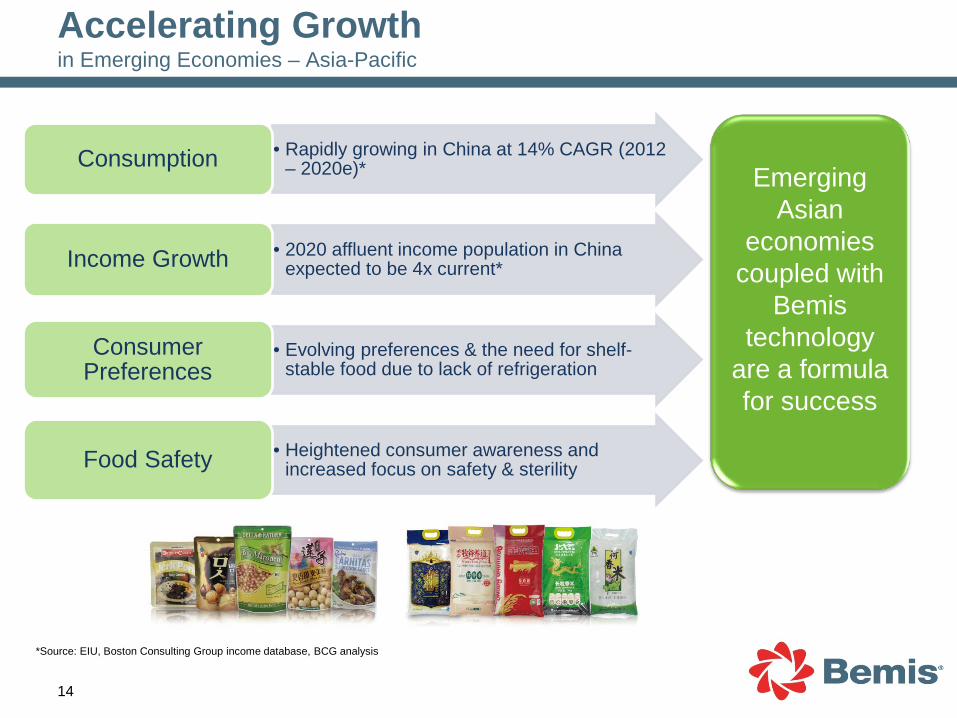
14
Emerging
Asian economies
coupled with Bemis
technology are a formula for success
*Source: EIU, Boston Consulting Group income database, BCG analysis
• Rapidly growing in China at 14% CAGR (2012 – 2020e)* Consumption
• 2020 affluent income population in China expected to be 4x current* Income Growth
• Evolving preferences & the need for shelf-stable food due to lack of refrigeration
Consumer Preferences
• Heightened consumer awareness and increased focus on safety & sterility Food Safety
Accelerating Growth in Emerging Economies – Asia-Pacific
15
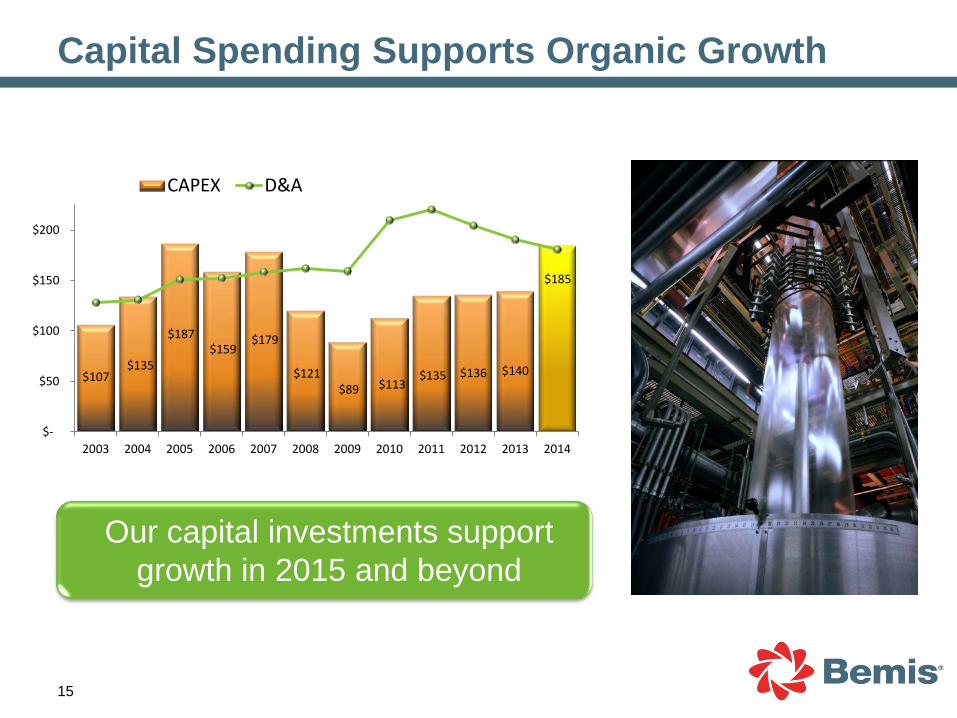
Capital investment in technologically advanced multi-layer extrusion
Our capital investments support growth in 2015 and beyond
Capital Spending Supports Organic Growth
$107 $135
$187 $159
$179
$121 $89 $113
$135 $136 $140
$-
$50
$100
$150
$200
2003 2004 2005 2006 2007 2008 2009 2010 2011 2012 2013 2014
CAPEX D&A
$185
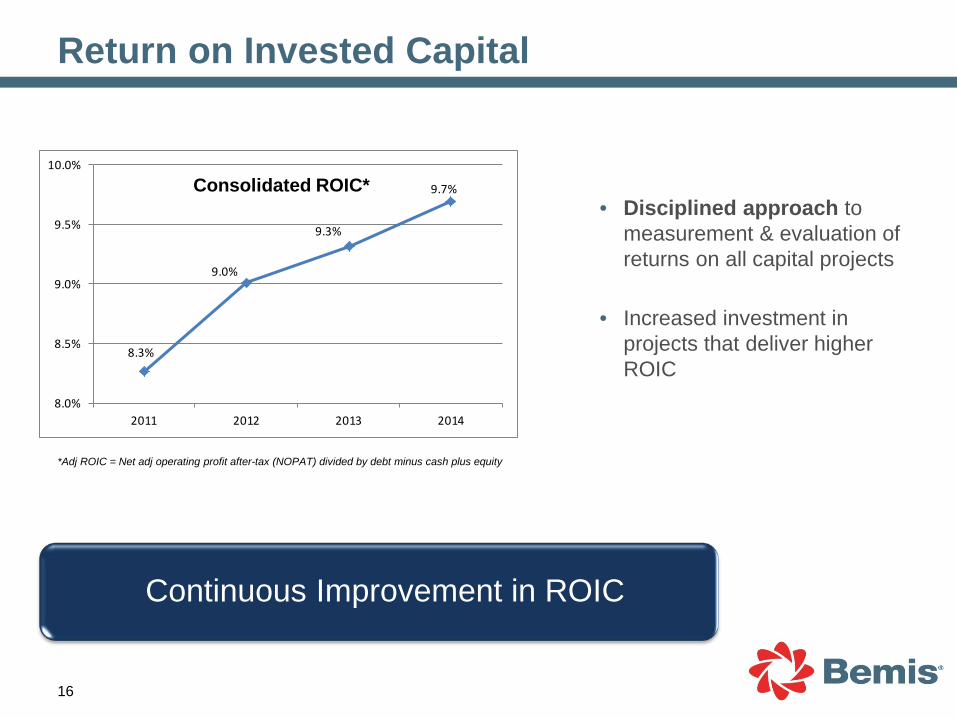
16
• Disciplined approach to measurement & evaluation of returns on all capital projects
• Increased investment in projects that deliver higher ROIC
*Adj ROIC = Net adj operating profit after-tax (NOPAT) divided by debt minus cash plus equity
Continuous Improvement in ROIC
Return on Invested Capital
8.3%
9.0%
9.3%
9.7%
8.0%
8.5%
9.0%
9.5%
10.0%
2011 2012 2013 2014
Consolidated ROIC*
17
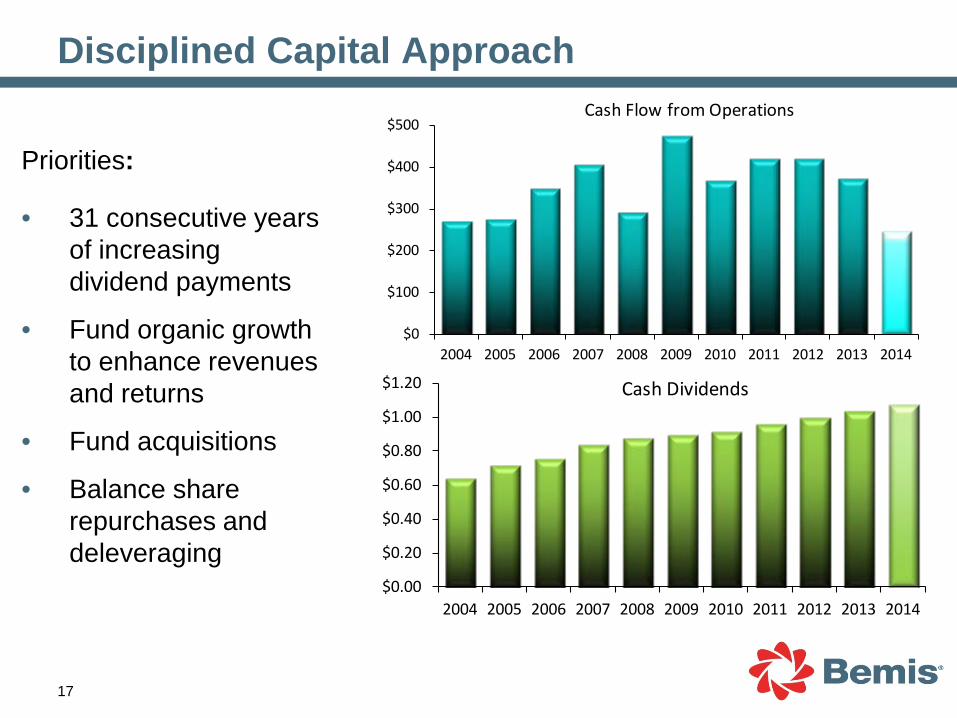
Priorities:
• 31 consecutive years of increasing dividend payments
• Fund organic growth to enhance revenues and returns
• Fund acquisitions
• Balance share repurchases and deleveraging
Disciplined Capital Approach
$0
$100
$200
$300
$400
$500
2004 2005 2006 2007 2008 2009 2010 2011 2012 2013 2014
Cash Flow from Operations
$0.00
$0.20
$0.40
$0.60
$0.80
$1.00
$1.20
2004 2005 2006 2007 2008 2009 2010 2011 2012 2013 2014
Cash Dividends

18
Adjusted EPS guidance of $2.52 to $2.67 Continuing Operations
Capital expenditures of $185 to $200 million
Note: Guidance as of January 2015
2015 Financial Guidance
19
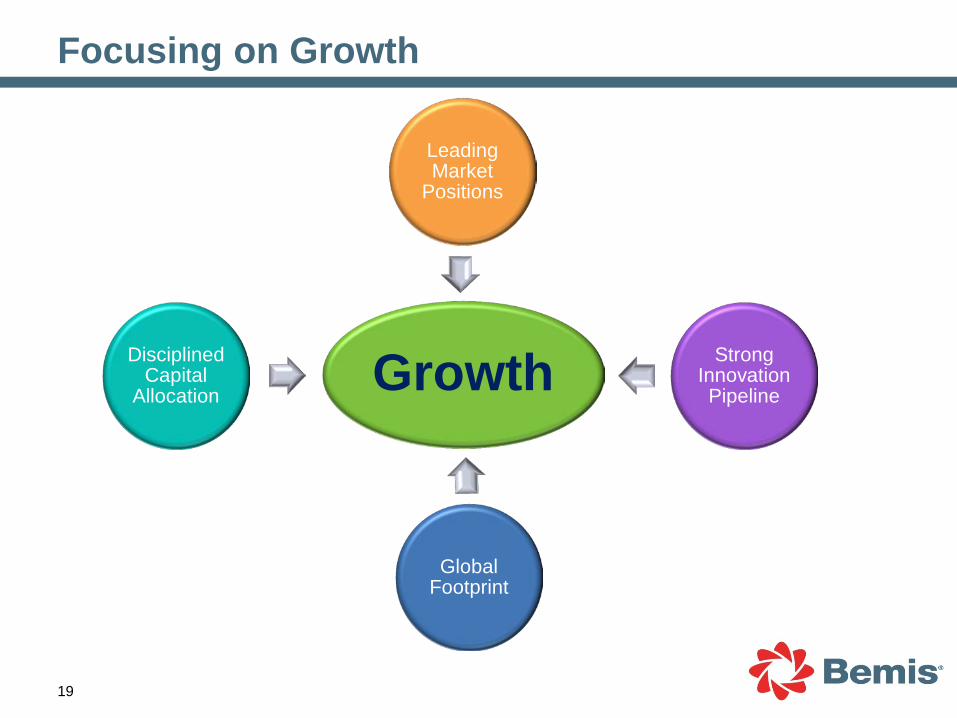
Growth
Leading Market
Positions
Strong Innovation Pipeline
Global Footprint
Disciplined Capital
Allocation
Focusing on Growth
20
This presentation includes forward-looking statements within the meaning of the Safe Harbor provisions
of the Securities Litigation Reform Act of 1995. Such statements include, but are not limited to,
statements relating to the expected future performance of the company and its objectives, expectations,
and intentions for the future. These forward-looking statements are based on the current beliefs and
expectations of Bemis Company’s management and are subject to risks and uncertainties. The forward-
looking statements speak only as of the date of this presentation, and Bemis Company does not
undertake to update such statements to reflect changes that occur after that date. There are a number of
factors that could cause actual results to differ from those set forth in the forward-looking statements.
These factors include, but are not limited to: general economic conditions, competitive conditions in our
markets, the cost and availability of raw materials, and our ability to pass these price changes on to our
customers. These and other risks, uncertainties, and assumptions are identified from time to time in our
filings with the Securities and Exchange Commission including our most recent Annual Report on form
10-K and our quarterly reports on Form 10-Q. Such reports are available on the website of the Securities
and Exchange Commission (www.sec.gov).
Safe Harbor Statement

22
Completed the largest acquisition in company history of Alcan Food Americas for $1.2B
Completed facility consolidation, optimizing our manufacturing footprint with the closure of 9 plants
Acquired a film-based aseptic and bulk packaging manufacturer
Expanded footprint in Asia-Pacific with acquisitions in China of a converting operation in Dongguan and an extrusion platform in Foshan
Divested non-core businesses including thin gauge shrink film, Paper Packaging, and Pressure Sensitive Materials
Accomplishments 2010-2014
23
M&
A Tr
ansa
ctio
n
M&
A Tr
ansa
ctio
n
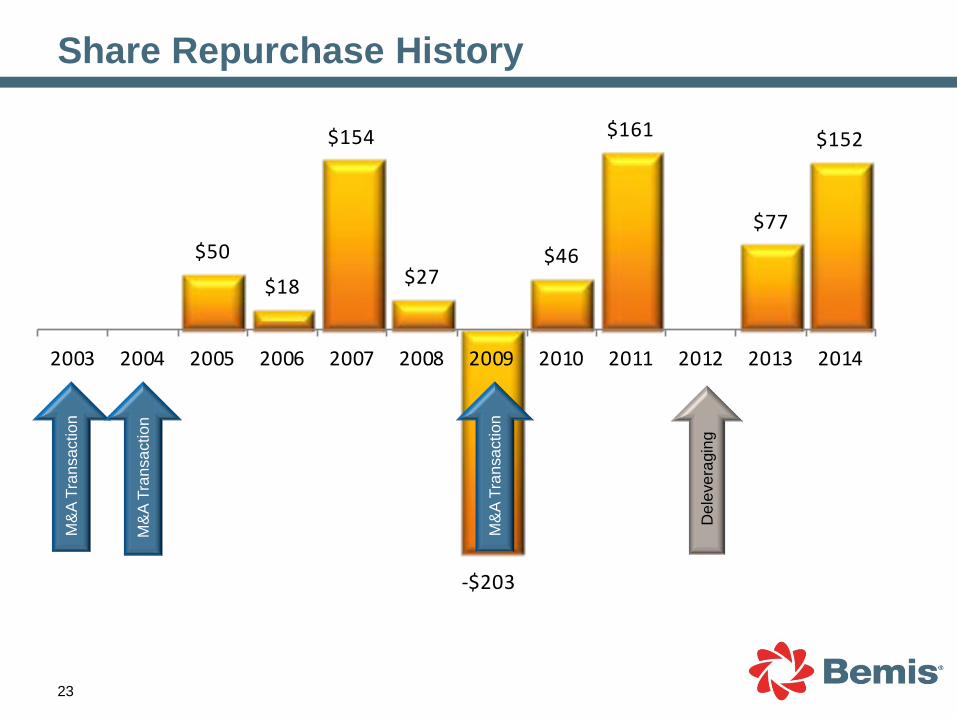
Share Repurchase History
$50
$18
$154
$27
-$203
$46
$161
$77
$152
2003 2004 2005 2006 2007 2008 2009 2010 2011 2012 2013 2014
M&
A Tr
ansa
ctio
n
Del
ever
agin
g
24
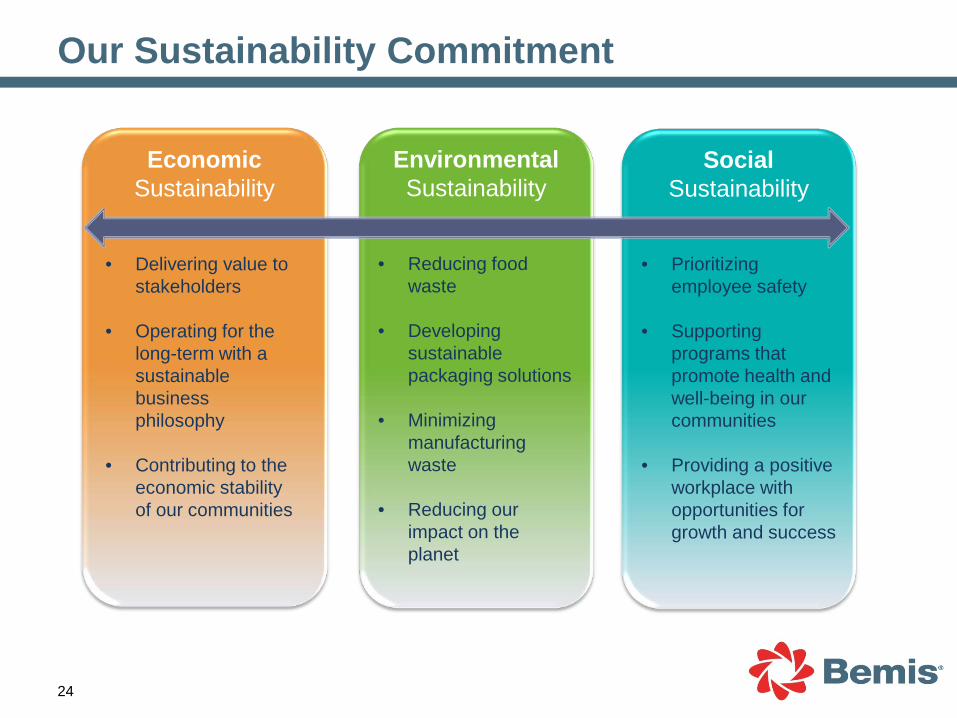
Economic Sustainability
Social Sustainability
Environmental Sustainability
• Delivering value to stakeholders
• Operating for the long-term with a sustainable business philosophy
• Contributing to the
economic stability of our communities
• Reducing food waste
• Developing
sustainable packaging solutions
• Minimizing
manufacturing waste
• Reducing our
impact on the planet
• Prioritizing employee safety
• Supporting programs that promote health and well-being in our communities
• Providing a positive workplace with opportunities for growth and success
Our Sustainability Commitment
25
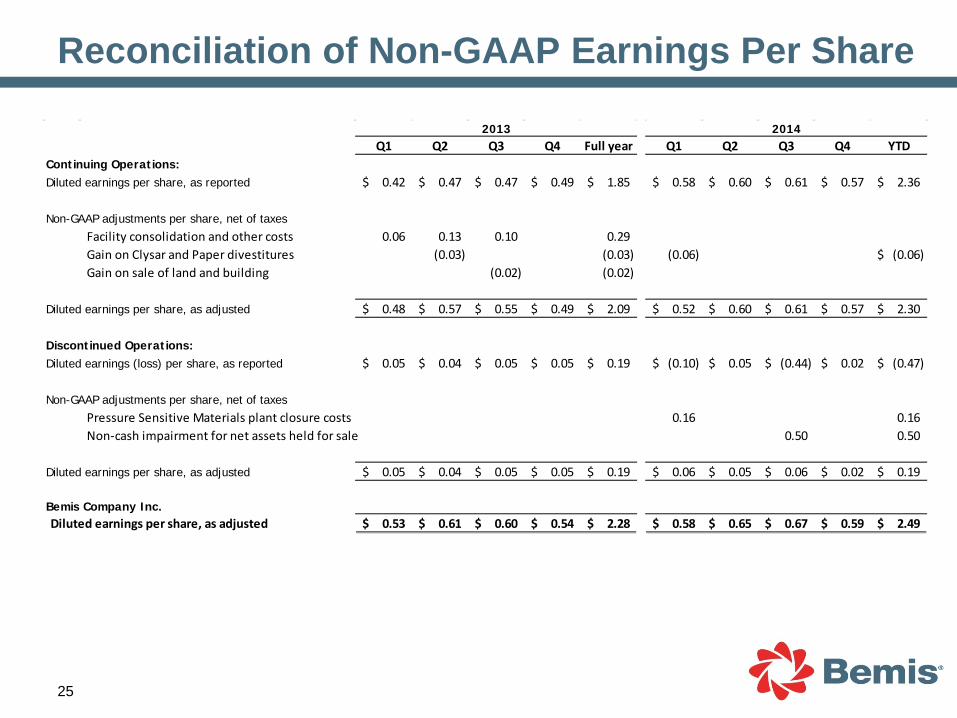
Reconciliation of Non-GAAP Earnings Per Share
Q1 Q2 Q3 Q4 Full year Q1 Q2 Q3 Q4 YTDContinuing Operations:Diluted earnings per share, as reported 0.42$ 0.47$ 0.47$ 0.49$ 1.85$ 0.58$ 0.60$ 0.61$ 0.57$ 2.36$
Non-GAAP adjustments per share, net of taxesFacility consolidation and other costs 0.06 0.13 0.10 0.29 Gain on Clysar and Paper divestitures (0.03) (0.03) (0.06) (0.06)$ Gain on sale of land and building (0.02) (0.02)
Diluted earnings per share, as adjusted 0.48$ 0.57$ 0.55$ 0.49$ 2.09$ 0.52$ 0.60$ 0.61$ 0.57$ 2.30$
Discontinued Operations:Diluted earnings (loss) per share, as reported 0.05$ 0.04$ 0.05$ 0.05$ 0.19$ (0.10)$ 0.05$ (0.44)$ 0.02$ (0.47)$
Non-GAAP adjustments per share, net of taxesPressure Sensitive Materials plant closure costs 0.16 0.16 Non-cash impairment for net assets held for sale 0.50 0.50
Diluted earnings per share, as adjusted 0.05$ 0.04$ 0.05$ 0.05$ 0.19$ 0.06$ 0.05$ 0.06$ 0.02$ 0.19$
Bemis Company Inc.Diluted earnings per share, as adjusted 0.53$ 0.61$ 0.60$ 0.54$ 2.28$ 0.58$ 0.65$ 0.67$ 0.59$ 2.49$
2013 2014
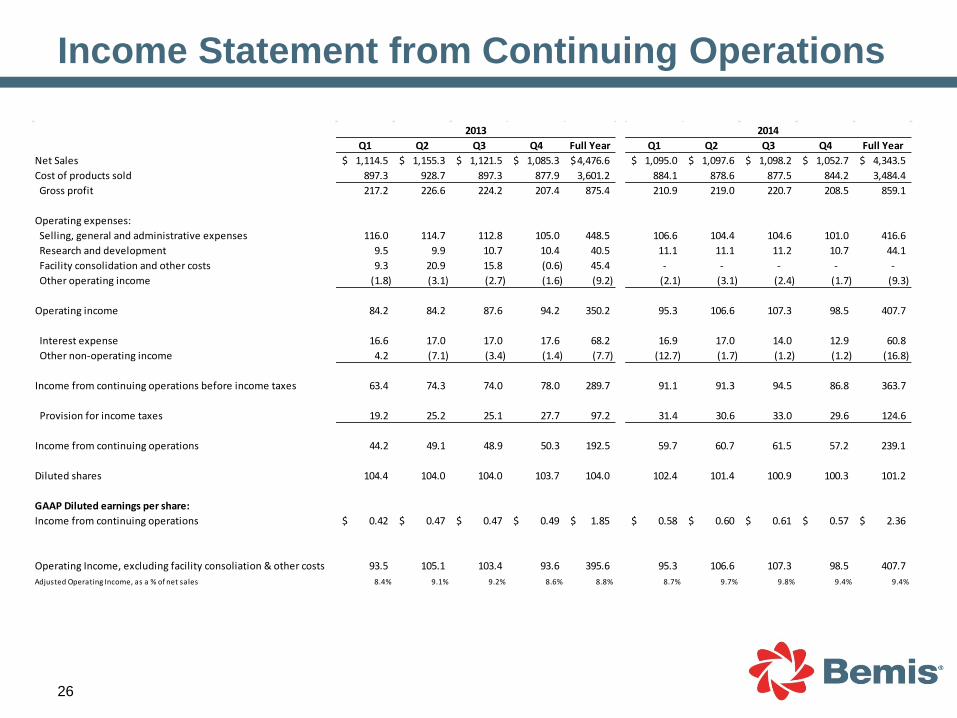
Income Statement from Continuing Operations
26
Q1 Q2 Q3 Q4 Full Year Q1 Q2 Q3 Q4 Full YearNet Sales 1,114.5$ 1,155.3$ 1,121.5$ 1,085.3$ 4,476.6$ 1,095.0$ 1,097.6$ 1,098.2$ 1,052.7$ 4,343.5$ Cost of products sold 897.3 928.7 897.3 877.9 3,601.2 884.1 878.6 877.5 844.2 3,484.4 Gross profit 217.2 226.6 224.2 207.4 875.4 210.9 219.0 220.7 208.5 859.1
Operating expenses: Selling, general and administrative expenses 116.0 114.7 112.8 105.0 448.5 106.6 104.4 104.6 101.0 416.6 Research and development 9.5 9.9 10.7 10.4 40.5 11.1 11.1 11.2 10.7 44.1 Facility consolidation and other costs 9.3 20.9 15.8 (0.6) 45.4 - - - - - Other operating income (1.8) (3.1) (2.7) (1.6) (9.2) (2.1) (3.1) (2.4) (1.7) (9.3)
Operating income 84.2 84.2 87.6 94.2 350.2 95.3 106.6 107.3 98.5 407.7
Interest expense 16.6 17.0 17.0 17.6 68.2 16.9 17.0 14.0 12.9 60.8 Other non-operating income 4.2 (7.1) (3.4) (1.4) (7.7) (12.7) (1.7) (1.2) (1.2) (16.8)
Income from continuing operations before income taxes 63.4 74.3 74.0 78.0 289.7 91.1 91.3 94.5 86.8 363.7 Provision for income taxes 19.2 25.2 25.1 27.7 97.2 31.4 30.6 33.0 29.6 124.6
Income from continuing operations 44.2 49.1 48.9 50.3 192.5 59.7 60.7 61.5 57.2 239.1
Diluted shares 104.4 104.0 104.0 103.7 104.0 102.4 101.4 100.9 100.3 101.2
GAAP Diluted earnings per share:Income from continuing operations 0.42$ 0.47$ 0.47$ 0.49$ 1.85$ 0.58$ 0.60$ 0.61$ 0.57$ 2.36$
Operating Income, excluding facility consoliation & other costs 93.5 105.1 103.4 93.6 395.6 95.3 106.6 107.3 98.5 407.7 Adjusted Operating Income, as a % of net sales 8.4% 9.1% 9.2% 8.6% 8.8% 8.7% 9.7% 9.8% 9.4% 9.4%
2013 2014

27
Adjusted Operating Profit to GAAP
Segment Operating Profit2014 2013 2012 2011
US Packaging 375.8$ 337.9$ 366.7$ 315.0$
Adjusted for:Facilities Consolidation Expense 45.0 42.1 26.3 Policy Harmonization Expense (Income) - (13.8) - Adj US Packaging OP 375.8$ 382.9$ 395.0$ 341.3$ % of Net Sales 13.1% 12.8% 13.0% 11.0%
Global Packaging 113.3$ 106.4$ 59.9$ 112.6$
Adjusted for:Facilities Consolidation Expense 0.4 26.6 8.6 Acquisition and Other Expense (Income) (0.5) 4.6 0.7 Policy Harmonization Expense (Income) 16.4 - Adj Global Packaging OP 113.3$ 106.3$ 107.5$ 121.9$ % of Net Sales 7.6% 7.1% 7.0% 7.4%
Total Year
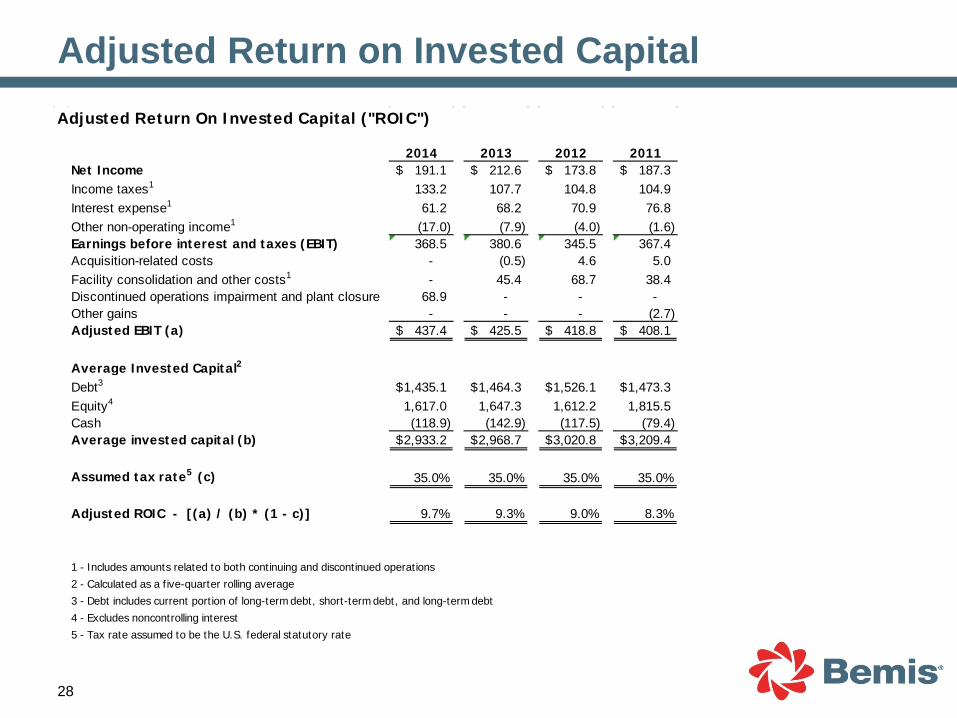
Adjusted Return on Invested Capital
28
Adjusted Return On Invested Capital ("ROIC")
2014 2013 2012 2011Net Income 191.1$ 212.6$ 173.8$ 187.3$ Income taxes1 133.2 107.7 104.8 104.9 Interest expense1 61.2 68.2 70.9 76.8 Other non-operating income1 (17.0) (7.9) (4.0) (1.6) Earnings before interest and taxes (EBIT) 368.5 380.6 345.5 367.4 Acquisition-related costs - (0.5) 4.6 5.0 Facility consolidation and other costs1 - 45.4 68.7 38.4 Discontinued operations impairment and plant closure 68.9 - - - Other gains - - - (2.7) Adjusted EBIT (a) 437.4$ 425.5$ 418.8$ 408.1$
Average Invested Capital2
Debt3 1,435.1$ 1,464.3$ 1,526.1$ 1,473.3$ Equity4 1,617.0 1,647.3 1,612.2 1,815.5 Cash (118.9) (142.9) (117.5) (79.4) Average invested capital (b) 2,933.2$ 2,968.7$ 3,020.8$ 3,209.4$
Assumed tax rate5 (c) 35.0% 35.0% 35.0% 35.0%
Adjusted ROIC - [(a) / (b) * (1 - c)] 9.7% 9.3% 9.0% 8.3%
1 - Includes amounts related to both continuing and discontinued operations2 - Calculated as a five-quarter rolling average3 - Debt includes current portion of long-term debt, short-term debt, and long-term debt4 - Excludes noncontrolling interest5 - Tax rate assumed to be the U.S. federal statutory rate
29
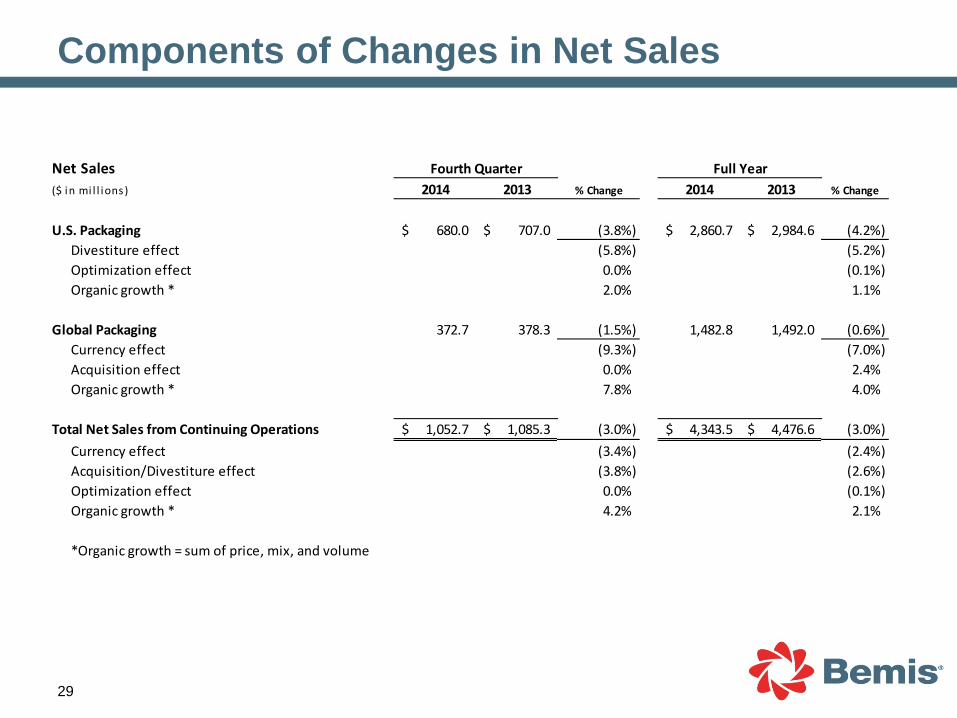
Components of Changes in Net Sales
Net Sales($ in mi l l ions) 2014 2013 % Change 2014 2013 % Change
U.S. Packaging 680.0$ 707.0$ (3.8%) 2,860.7$ 2,984.6$ (4.2%)Divestiture effect (5.8%) (5.2%)Optimization effect 0.0% (0.1%)Organic growth * 2.0% 1.1%
Global Packaging 372.7 378.3 (1.5%) 1,482.8 1,492.0 (0.6%)Currency effect (9.3%) (7.0%)Acquisition effect 0.0% 2.4%Organic growth * 7.8% 4.0%
Total Net Sales from Continuing Operations 1,052.7$ 1,085.3$ (3.0%) 4,343.5$ 4,476.6$ (3.0%)Currency effect (3.4%) (2.4%)Acquisition/Divestiture effect (3.8%) (2.6%)Optimization effect 0.0% (0.1%)Organic growth * 4.2% 2.1%
*Organic growth = sum of price, mix, and volume
Fourth Quarter Full Year
30