INVESTMENTS IN SOIL AND WATER CONSERVATION AND ...
49
INVESTMENTS IN SOIL AND WATER CONSERVATION AND PARTICIPATION IN LANDCARE BY UPLAND FARMERS IN CLAVERIA, MISAMIS ORIENTAL, PHILIPPINES MSc Thesis by Bony Pablo Dela Cruz June 2011
Transcript of INVESTMENTS IN SOIL AND WATER CONSERVATION AND ...

1
ahoo
INVESTMENTS IN SOIL AND WATER CONSERVATION AND PARTICIPATION IN LANDCARE BY UPLAND
FARMERS IN CLAVERIA, MISAMIS ORIENTAL, PHILIPPINES
MSc Thesis by Bony Pablo Dela Cruz
June 2011

2
3
INVESTMENTS IN SOIL AND WATER CONSERVATION AND PARTICIPATION IN LANDCARE BY UPLAND
FARMERS IN CLAVERIA, MISAMIS ORIENTAL, PHILIPPINES
By
Bony Pablo Dela Cruz
Master thesis Land Degradation and Development Group to be submitted in partial
fulfillment of the degree of Master of Science in International Land and Water
Management at Wageningen University, the Netherlands
Study program: MSc International Land and Water Management (MIL) Student registration number: 770406177060 Thesis Land Degradation and Development LDD 80336 Supervisors: Dr. Aad C. Kessler (Land Degradation and Development Group, Wageningen University, Netherlands) Dr. Agustin R. Mercado, Jr. (World Agroforestry Center, Claveria, Misamis Oriental Philippines) Examiner: Prof.dr.ir. Leo Stroosnijder
Date: June 2011
Wageningen University, Land Degradation and Development Group

4

5
ABSTRACT Soil erosion is a major environmental threat in the upland regions of the Philippines and has been the primary cause of declining productivity. Thus, to address the problem on soil erosion, a Landcare program was implemented in the upland areas of Mindanao that advocates the use of soil and water conservation (SWC) technologies. This study explored the level of adoption for the natural vegetative strips (NVS) technology among upland farmers in Claveria, Misamis Oriental, Philippines. It also examined the influence of farmers’ involvement in the Landcare program and the effect of household and farm characteristics on the rate of adoption. A total of 90 respondents were interviewed and 94 farms were observed during the research. The level of adoption were determined from low, moderate and high based from the percentage of the implemented NVS intensity with the intensity recommended by the World Agroforestry Centre (ICRAF). The results show that 64% of the sampled farmers were adopters of NVS technology. It appears that majority of them (56%) had low level of adoption. Only 22% of the adopters invested on the technology both at high and moderate level. The main constraints of adoption are mainly the costs, time and labour demands of SWC. The results also indicate that farmers’ involvement in Landcare is an important determinant in the adoption and intensity of SWC investments. The farmers with higher level of investments in SWC were those farmers who are actively involved in Landcare. Conversely, lower levels of investments were observed among farmers who were never involved in Landcare programs. Surprisingly, farmer’s characteristics such as age, education, farming experience, family size, ethnic group, length of residency and source of income do not significantly influence the level of adoption. On the other hand, farm characteristics such as number of parcels, farm size, slope and land ownership are found to be more important factors affecting the rate of adoption. Key words : Landcare, soil and water conservation, adoption, natural vegetative strips, Philippines

6
ACKNOWLEDGEMENTS I owe my deepest gratitude to the many people and institutions who made a significant contribution toward the completion of this thesis.
I am heartily thankful to my supervisor, Dr. Aad Kessler, for his excellent supervision throughout the course of this thesis. Without him, it would have been impossible for me to complete this thesis, and perhaps finish my master’s program.
I also express my gratitude to Dr. Mercado Agustin Jr. for granting my request to do this research in Claveria under his supervision. I am also grateful for the technical assistance and logistic support he provided during the fieldwork. I thank all ICRAF staff and friends in Claveria - Yuyen, Kuya Nanny, Don, Shongo, Ruby and Thelma, for their hospitality and kindness. Special thanks to Susan and Christy, from whom I did not only gain support and encouragement, but great camaraderie as well. I also thank all my friends for their support and encouragement, especially to Hazel for reviewing the draft. Thanks also to Leendert for his constructive comments and suggestions on how to execute this research better, and his wife Cathy for the friendship. The fieldwork would have not been successful without the help of my interpreters and enumerators. I am very grateful to my buddies, Jayson and Tophe, for their invaluable help in data collection and for patiently providing me the needed information. I am also thankful for the cooperation and hospitality of the upland farmers in Claveria. To all my respondents, thank you for sharing your time for the interviews and field visits. My deepest gratitude to my parents (Bonifacio and Crispina) as well as to my parents-in-law (Julio and Esther) for their moral support and prayers. I am most especially thankful for taking care of my family during the times I was not at home. Lastly, I am deeply indebted to my beloved wife, Maleen, for her tireless love, loyalty, support and understanding. I also would like to thank her for loving our daughters (Kristelle Coleen and Zyreel Cate) who were my inspiration in completing my degree. To those people who have assisted me one way or another whose names were not mentioned here, I feel very much indebted. Above all, I thank Jehovah God for giving me the strength, courage, wisdom and capability to make this thesis a reality. I praise you God for all of these wonderful blessings.
7
TABLE OF CONTENTS ABSTRACT .......................................................................................................................................... 5
ACKNOWLEDGEMENTS ................................................................................................................ 6
TABLE OF CONTENTS .................................................................................................................... 7
LIST OF TABLES ............................................................................................................................... 8
LIST OF FIGURES ............................................................................................................................. 8
ACRONYMS ......................................................................................................................................... 9
1. INTRODUCTION .........................................................................................................................10
2. BACKGROUND ............................................................................................................................11
2.1 Philippine general information ..........................................................................11
2.2 Development of Landcare in the Philippines ................................................11
2.3 The research area ....................................................................................................12
3. PROBLEM STATEMENT ..........................................................................................................14
4. RESEARCH OBJECTIVES AND RESEARCH QUESTIONS .............................................14
4.1 Objectives ....................................................................................................................14
4.2 Research questions .................................................................................................14
4.3 Hyphotheses .............................................................................................................15
5. CONCEPT AND THEORIES .....................................................................................................15
5.1 Concept ........................................................................................................................15
5.2 Theories .......................................................................................................................16
6. RESEARCH METHODOLOGY .................................................................................................17
6.1 Data Collection ..........................................................................................................17
6.2 Sampling strategy ....................................................................................................17
6.3 Data analysis ..............................................................................................................18
7. RESULTS AND DISCUSSION ..................................................................................................19
7.1 Farmers' investments in SWC .............................................................................19
7.2 Farmers' motives for investmenting and not investmenting in
SWC technologies..........................................................................................................22
7.3 Farmers' participation in Landcare groups and programs .....................27
7.4 Relationship of Landcare participation and level of adoption................30
7.5 Household and farm characteristics of the farmer-respondents ..........32
8. CONCLUSIONS AND RECOMMENDATIONS ....................................................................36
9. REFERENCES ..............................................................................................................................39
ANNEXES...........................................................................................................................................42
Annex A Farm household survey form ................................................................................42
Annex B Statistical results ........................................................................................................48
8
LIST OF TABLES Table 1 Frequency distrbution of farmer-respondents ................................................19
Table 2 Farmers' intensity of adoption ...............................................................................19
Table 3 Farmers' length of investments ............................................................................20
Table 4 Distribution of farmer-respondents according to the type of NVS
adoption ..........................................................................................................................21
Table 5 Farmers' length of participation in Landcare ..................................................27
Table 6 Household characteristics of the respondents by adoption
category .......................................................................................................................... 33
Table 7 Characteristics of farm operated by farmer respondents in
adoption category ...................................................................................................... 35
LIST OF FIGURES Figure 1 Location of the study site ........................................................................................13
Figure 2 A typical landscape in Claveria .............................................................................13
Figure 3 Conservation decision-process model .............................................................16
Figure 4 Adopters' year of establishment of NVS ........................................................... 20
Figure 5 Farmers' motives for establishing NVS ........................................................... 22
Figure 6 Farmers' initial expectations in establishing NVS ....................................... 23
Figure 7 Gains of NVS perceived by adopters .................................................................. 24
Figure 8 Problems of NVS perceived by adopters .......................................................... 25
Figure 9 Farmers' reasons for abolishment of NVS ....................................................... 26
Figure 10 Farmers' reasons for not establishing of NVS .............................................. 26
Figure 11 Farmers' reason for ending participation in Landcare activities ......... 28
Figure 12 Farmers' reasons for non-participation in Landcare activities ............. 28
Figure 13 Farmers' length of participation in Landcare by level of adoption ...... 30
Figure 14 Farmers' status of participation in Landcare across the level of
adoption ...................................................................................................................... 31
9
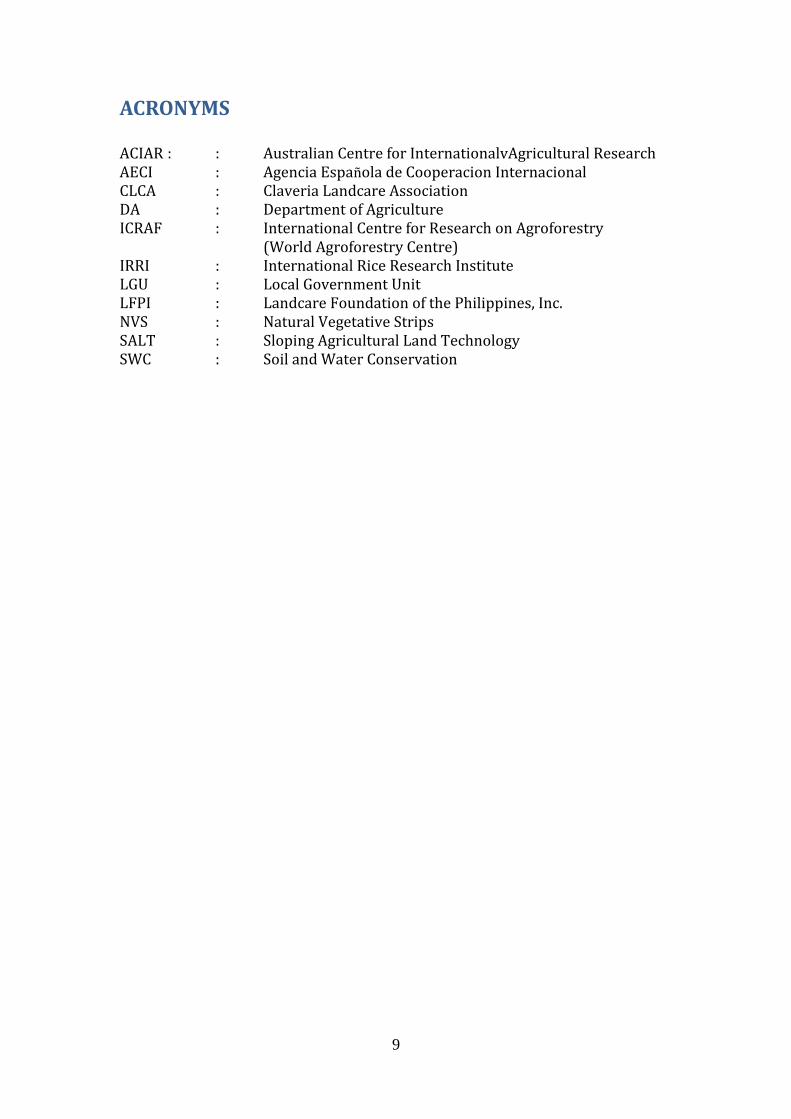
ACRONYMS ACIAR : : Australian Centre for InternationalvAgricultural Research AECI : Agencia Española de Cooperacion Internacional CLCA : Claveria Landcare Association DA : Department of Agriculture ICRAF : International Centre for Research on Agroforestry (World Agroforestry Centre) IRRI : International Rice Research Institute LGU : Local Government Unit LFPI : Landcare Foundation of the Philippines, Inc. NVS : Natural Vegetative Strips SALT : Sloping Agricultural Land Technology SWC : Soil and Water Conservation

10
1. INTRODUCTION Soil erosion is widely regarded as the most serious environmental problem and most dominant form of land degradation in the upland areas of the Philippines (Cramb et al., 1999). Human activities such as deforestation and intensive agricultural land use in the uplands have resulted in increased soil erosion (Lapar and Pandey, 1999). This erosion problem is also attributed by the country's complex topography, high rainfall intensities, and long rainfall durations (Daño et al., 1992). To prevent the worsening of the problem on erosion, several agencies geared to support soil and water conservation (SWC) program which was intended to address the environmental problems in upland areas and consequently make agricultural productivity sustainable. Several projects have been supported and implemented by government and non-government agencies in the past three decades. These projects included finding the most suitable SWC technologies among upland farmers in the many areas of the Philippines. Through this, SWC practices proven to be effective in reducing erosion rate were introduced. However, SWC practices were not widely adopted in upland areas. Thus, to enhance the development, dissemination and adoption of appropriate SWC, the Landcare approach was implemented in the uplands of Mindanao for about fifteen years ago.
The Landcare Program in the Philippines actually began in 1996 and was initiated by the World Agroforestry Centre (ICRAF) in the Northern Mindanao. It was done in partnership with the local farmer-groups and Local Government Units (LGU) that intend to encourage upland farmers to use SWC technologies for sustainable upland agriculture. The program extensively disseminated the use of different SWC technologies such as contour hedgerows, agro-forestry, mulching, trash bundling, rock walling and NVS. NVS is the most appealing soil conservation measure for farmers because it requires less labour and capital, and because of its easy establishment and maintenance. NVS is the natural growing of grasses or herbs in the contoured and unploughed strips of land about 50 cm-wide to serves as a barrier to control soil erosion. In trying to encourage farmers to invest in SWC technologies and participate in the Landcare activities, ICRAF and other affiliate institutions provided incentives in the form of human, financial and technical assistance through the Landcare program.
This research evaluated the influence of farmers’ participation in the Landcare activities and other underlying factors on the level of investment in soil and water conservation technologies among upland farmers in Claveria, Misamis Oriental in the island of Mindanao, Philippines. The outcomes of this research could help to further assess the effectiveness of the Landcare approach in terms of adoption and continued investment of SWC technologies after its fifteen years of implementation in the Philippines.
This thesis report starts with the general overview of the research as presented in the first chapter. The background information about the rise of Landcare in the Philippines and the research area are provided in Chapter 2. Then, the problem statement is described in Chapter 3. The research objectives and research questions are given in Chapter 4. Afterwards, the concepts and theories used for

11
this research are discussed in Chapter 5. The sixth chapter presents the research methodology while the empirical results of the research are presented and discussed in the Chapter 7. Chapter 8, on the other hand is devoted to the presentation of conclusions and some recommendations. Finally, this report ends with the references cited and annexes.
2. BACKGROUND 2.1 Philippine general information The Philippines is an archipelago comprising of 7,107 islands and is situated in Southeast Asia. Three main islands can be distinguished: Luzon, Visayas and Mindanao. The country has a population of about 89 million with an annual population growth rate of 2.16 % (NSO, 2007). The total land area of the country is about 30 million hectares (ha). Of this, 9 million hectares are classified as hilly land, of which 4 million hectares are currently exposed for upland agriculture (Paningbatan et al., 1995) and are often unproductive due to land degradation (Metcalfe, 2004: 10). There are various promising SWC technologies available for upland farmers, but they were not widely adopted. The problem is actually not about the shortage of technology, but rather the incompatibility of the promoted technology with the current situations of the farmers (Lapar and Pandey 1999). To increase the adoption of SWC, numerous strategies and policies have been considered by many government agencies. For instance, ICRAF was engaged in implementing the Landcare program in the uplands of Mindanao and also in Visayas. 2.2 Development of Landcare in the Philippines The Landcare approach was initially implemented in Australia in the mid-80s and was transferred to the Philippines in the mid- 1990s. The project motivates joint efforts of managing natural resources and promoting sustainable land and water management. Mercado et al. (2001) defines Landcare as "a movement of farmer-led organizations supported by the local government that share knowledge about sustainable and profitable agriculture on sloping lands while conserving natural resources”. It was first introduced in Claveria, Misamis Oriental, to promote soil conservation innovations among farmers.
A quite similar scheme already started in 1980, when the Department of Agriculture (DA) introduced a contour hedgerow which consisted of shrub legumes in the study area within the so called, Sloping Agricultural Land Technology (SALT) package. In1987, DA tied up with the International Rice Research Institute (IRRI) to enhance the adoption of hedgerow system by means of trainings. After 5 years, still only few farmers had adopted the technology. In 1993, ICRAF took over the research site to further develop the technology (Cramb and Culasero, 2004). In the year 1996, after several field trials, NVS were identified as a low cost and less labour alternative of hedgerows. Subsequently, the Landcare approach commenced to promote this technology in special partnership with farmers, local government and a technical facilitator from ICRAF. Due to the interest of many farmers, a farmer organization was formed. This is now the Claveria LandCare Association (CLCA) which aims to promote the soil conservation measures within the municipality (Cramb et al., 2007).
12
The success of Landcare in Claveria resulted in the expansion of the program to other sites of Mindanao such as in Bukidnon, South Cotabato, Agusan Del Sur and in the Visayas (Bohol). The expansion was funded and supported by the Spanish Agency for International Cooperation (AECI) from 1999 to 2002 and the Australian Centre for International Agricultural Research (ACIAR) for three phases (1999 – 2004, 2005-2007, and 2008-2009). In 2004, there were already 600 Landcare groups formed with 8000 farmer members (Metcalfe, 2004: 13). Landcare Foundation of the Philippines Incorporated (LFPI) was then created to ensure the smooth implementation and management of the Landcare activities. In 2007, LFPI was officially recognized as the lead agency for Landcare in the Philippines.
Project reports stated that the approach of the Landcare program in controlling soil erosion has increased the adoptability of SWC practices among upland farmers at different Landcare sites. For instance, by mid-2003 there were 917 adopters of NVS and tree-planting in Lantapan (Bukidnon). Seventy percent of these adopters had started the technology during the commencement of the Landcare program in 1998 (Cramb et al., 2007). In Bohol, an increased in adoption of SWC technologies was also observed especially in 2005 which resulted in a positive impact on farmer’s farm productivity and income (Newby and Cramb, 2009). 2.3 The Research Area This research was conducted in the upland municipality of Claveria in the province of Misamis Oriental which is situated in the northern part of Mindanao Island in the Philippines (Figure 1). The Landcare approach began and is well established in this site, thus, its impact is expected to be clearly identified.
Claveria is located 42 km north-east of its regional capital, Cagayan de Oro. It is connected by a paved road which gives farners good market access (Cramb et al., 2006). It has inhabitable land of 82, 500 hectares of which sixty percent is classified as steep mountains and rolling hills (Figure 2). Flat to gently sloping landscapes are comprised of only 7 percent of the municipality total land area (Catacutan and Cramb, 2004). Most of the elevation range from 600-1000 meters above sea-level (m.a.s.l.), rising up to 2,500 m.a.s.l. on Mt. Kimangkil. Soils in the area are well drained, of moderate depth, moderately acid, low in phosphorus and potassium and with low organic matter. Annual rainfall is about 2,500 mm (Metcalfe, 2004), with the heaviest rain falls in the upper Claveria. Thus, the upper Claveria is classified as continuous wet. In contrary, the lower Claveria has less rainfall. It also has distinct dry season from November to April (Cramb et. al., 2006). Because of these land characteristics, sloping fields in Claveria can lose soil up to 200 tons per hectare per year (Mercado et al., 2001).

13
Figure 1. Location of the study site (Claveria) in the southern part of the Philippines
Figure 2. A typical landscape in Claveria
Claveria is characterized by intensive, commercial and smallholder agriculture. From its 30,000 ha agricultural land, about 55 percent is under cultivation. Sixty-one percent of the land is owned by its farmers, while the rest are either tenanted or leased. The average farm size is 3 ha and the ‘major crops in the area are maize (51%), cassava (15%), tomato (10%), and rice (8%)’. Maize dominates in the upper Claveria while other vegetables dominate in the lower part (Cramb et al., 2006).
14
3. PROBLEM STATEMENT One of the major threats of sustainable farming in the upland areas of the Philippines is soil erosion. Inappropriate human activities such as deforestation and intensified cropping practices combined with increasing population growth and high rainfall intensities are extremely contribute to soil erosion. In addition, slow adoption of SWC practices is still visible in upland areas, despite of various conservation farming projects implemented in the country for decades. Most previous researches have highlighted the impact of SWC measures on the environment and on the farmers’ income (Daño et al., 1992; Garrity 2009; Newby and Cramb, 2009; Paningbatan et al., 1995; Presbitero et al., 1995). But there is still lack of knowledge on the conditions that influence sustained and intense use of SWC measures, especially in areas with long implementation of soil conservation projects such as the Landcare in Claveria, Misamis Oriental, Philippines. Understanding the conditions that could stimulate farmers the sustained use of SWC technologies is important in helping to promote more widespread adoption and success implementation of soil conservation projects in the Philippines.
4. RESEARCH OBJECTIVES AND RESEARCH QUESTIONS 4.1 Objectives The overall objective of the research is to examine the influence of farmers’ participation in the Landcare program of the Philippines on the adoption and level of investments in SWC technologies among upland farmers in Claveria, Misamis Oriental, Northern Mindanao, Philippines.
Specifically, the study designed to: 1. Determine the level of investments in SWC technologies of upland farmers
in Claveria, Misamis Oriental, Philippines; 2. Verify the correlation between the level of farmers’ participation in the
Landcare activities and the level of their investment in SWC technologies at farm-scale; and
3. Identify other underlying factors for farmers to invest in SWC technologies.
4.2 Research questions To attain the abovementioned objectives, this research focuses on two main research questions. These are as follows:
1. How was the level of investments in SWC technologies influenced by farmers’ involvement in a Landcare group and activities? o What is the farmers’ level of investment in SWC technologies? o In which Landcare SWC-related activities have upland farmers
intensively participated? o To what degree have farmers participated in SWC-related Landcare
activities?
15
2. What other factors affect farmers’ decision to continue or intensify their investments in SWC technologies? o What are the household and farm characteristics of upland farmers
who adopted and maintained NVS technique intensively? o What were their expectations when they invested in SWC
technologies? o Were their expectations met/ achieved? o What is the perception of farmers on the performance of SWC? o What makes them decide to abolish or intensify their investments in
SWC?
4.3 Hypotheses of the study 1. Upland farmers with longer involvement in Landcare programs lead to
higher investment in SWC technologies. 2. Farmer’s investments in SWC technologies particularly with the NVS
systems is influenced by the farmer’s age, level of education, source of income, land ownership, and farm’s slope and size, and attendance to Landcare activities.
5. CONCEPT AND THEORIES 5.1 Concept Adoption Adoption is a very complex term. Adoption process was defined as “a sequence of gradual stages or steps from first hearing about the new technology to the last stage of adoption” (Rogers 1995). Kessler (2006) described adoption as a decision process. He said that SWC technology is adopted only when it is implemented completely and continuously in the farmers’ field. De Graaff et al. (2008) characterized the process of adoption into three phases, namely: acceptance, actual adoption and continued used. These three phases of the framework were used in this research to understand the adoption process of SWC measures in the study area. Land degradation FAO (2010) defines land degradation as the declining quality of the lands caused by either human activity or natural processes that limits the land’s productive potential and ecological functions. Interrelated land degradation components include soil erosion, sedimentation, aridification, deforestation, nutrient mining, and others. Land degradation is recognized as one of the major environmental problems nowadays both for developed countries and developing countries like the Philippines. Soil Erosion Soil erosion is a form of land degradation and can be described as detachment, transport and deposition of soil particles due to natural conditions. Erosion can be classified into sheet, rill, gully and in-stream (Merritt et al., 2003). Rates of erosion are dependent on climate, soil type and topography. Soil erosion also
16
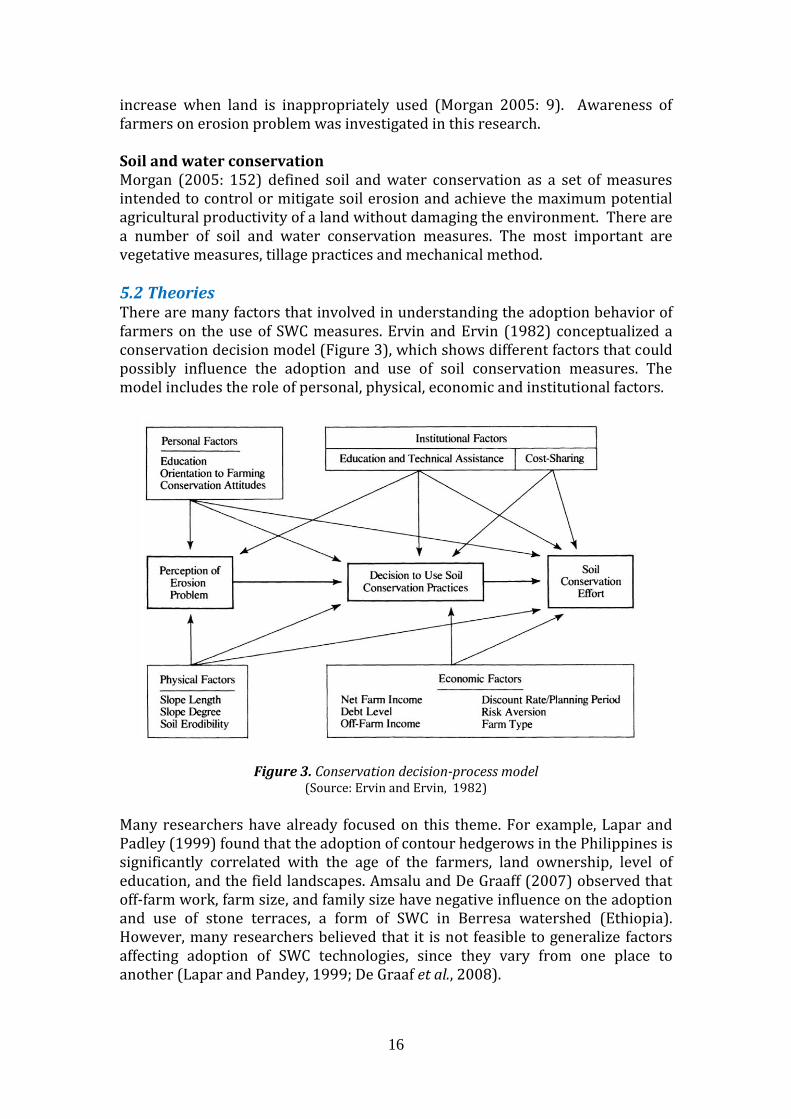
increase when land is inappropriately used (Morgan 2005: 9). Awareness of farmers on erosion problem was investigated in this research. Soil and water conservation Morgan (2005: 152) defined soil and water conservation as a set of measures intended to control or mitigate soil erosion and achieve the maximum potential agricultural productivity of a land without damaging the environment. There are a number of soil and water conservation measures. The most important are vegetative measures, tillage practices and mechanical method. 5.2 Theories There are many factors that involved in understanding the adoption behavior of farmers on the use of SWC measures. Ervin and Ervin (1982) conceptualized a conservation decision model (Figure 3), which shows different factors that could possibly influence the adoption and use of soil conservation measures. The model includes the role of personal, physical, economic and institutional factors.
Figure 3. Conservation decision-process model (Source: Ervin and Ervin, 1982)
Many researchers have already focused on this theme. For example, Lapar and Padley (1999) found that the adoption of contour hedgerows in the Philippines is significantly correlated with the age of the farmers, land ownership, level of education, and the field landscapes. Amsalu and De Graaff (2007) observed that off-farm work, farm size, and family size have negative influence on the adoption and use of stone terraces, a form of SWC in Berresa watershed (Ethiopia). However, many researchers believed that it is not feasible to generalize factors affecting adoption of SWC technologies, since they vary from one place to another (Lapar and Pandey, 1999; De Graaf et al., 2008).

17
6. RESEARCH METHODOLOLOGY 6.1 Data collection All data used for this study were obtained from document review, farm household interviews, field observations and key informant interviews. Document review: Existing documents such as project reports, articles, publications and brochures were reviewed to achieve a clearer perspective on the development of the Landcare Program in the Philippines and its current situation at the local level. Most of the literatures reviewed are available in the ICRAF library. In addition, ICRAF database and local government profiles were also used to get relevant information on technology adoption, previous status of Landcare groups and members, and biophysical characteristics of the study site. Farm household interviews: Farm household interviews were conducted using semi-structured questionnaires (see Annex A) to have both qualitative and quantitative data. The interviews mainly focused on the household characteristics, farming systems, involvement in the Landcare activities, and the level of investments in SWC technologies. A total of 90 farmer-respondents were interviewed between July and September 2010. Each interview lasted for about an hour. The questionnaires were translated in Visayan (Cebuano) – the local language in Claveria. This was done to help farmers express themselves easier during the interviews. The translation was done by two native speakers of the dialect who were recommended by ICRAF. These two also assisted in the interviews. Direct field observation: The field visits were requested to farmers in order to verify the consistency of the gathered data. Ninety four (94) parcels were visited in this research. Field observations were also done in order to see what is really happening in the field and to obtain actual information on the farmers’ field. Some of the things observed were the quality and maintenance of NVS, the coverage area and total length of NVS, and other bio-physical characteristics of the farm. Each farm was documented by photographs. Key informant interviews: Some LGU staff, and Landcare facilitators and project staff were also interviewed. This was done to gain better understanding on the roles and contribution of other stakeholders in the implementation of the Landcare programs in the site. The interview also aimed to understand the previous and current efforts made by the project partners with regards to the sustainability of technology adoption and Landcare activities. 6.2 Sampling procedure This study aims to have in-depth investigation on the farmers’ involvement in the Landcare programs and level of adoption for the NVS technology. Thus, the respondents were those who have currently and formerly participated in Landcare activities. Nevertheless, farmers who were never involved in Landcare
18
activities were also interviewed to identify their differences from those who have attended in Landcare programs with regards to their efforts and perception in investing SWC practices.
Wolfswinkel (2010) already identified the status (active and inactive) of the Landcare groups at different villages of Claveria as well as some lists of affiliated upland farmers. The list of farmers from these Landcare groups were used in this study. On the other hand, the list of non-member farmers were drawn from a list provided by the officers in barangay. Farm households residing in upper Claveria (Lanise, Madaguing, Poblacion and Panampawan) and lower Claveria (Ane-i, Hinaplanan, Patrocenio and Cabacungan) were randomly selected from the lists.
6.3 Data analysis In this study, there are two units of analysis: parcels and farmers. Parcels were analysed based on the physical characteristics of the land (i.e. slope, farm size) and NVS characteristics such as the number of contours, space and length. On the other hand, household characteristics and social aspects were studied at the farmer level.
Farmers who established NVS at their cultivated land were categorized as adopters. Their level of adoption, also referred to in this paper as rate of adoption, was determined by dividing the actual intensity of adoption by the recommended intensity of NVS. This was then multiplied to one hundred to get the percentage. The actual intensity of adoption is the measured total length of NVS implemented by the adopters per unit area (hectare). On the other hand, the recommended intensity is based on the 2-m elevation distance suggested by ICRAF (Mercado et al., 1999). This space is recommended to effectively control erosion without sacrificing so much of the crop production area.
Adopters were then classified from low, moderate and high according to the resulting level of adoption. Farmers who got a rate of more than 70% were identified as best adopters because of the high level of adoption. On the other hand, those who got less than 30% were labelled low adopters. Those in between with a rate of 30 – 70% were referred to as moderate adopters. Similarly, those who did not adopt were called non-adopters. Aside from the level of adoption, the extent (percentage of NVS covered area) and length of adoption in years were also observed on this study. In addition, other extra efforts of farmers in terms of additional money and labour investments were verified at the field.
The factors that were considered in this study in order to understand the behaviour of farmers in terms of intensifying application of SWC measures are farmers’ personal attributes, farm characteristics and involvement in Landcare activities. Differences between respondents’ characteristics based on their level of investments were tested through analysis of variance (ANOVA). Then, the mean results that are significant at a level of 0.05 were further tested with Tukey HSD. All statistical calculations were carried out using Predictive Analytics Software (PASW Statistics 18).
19
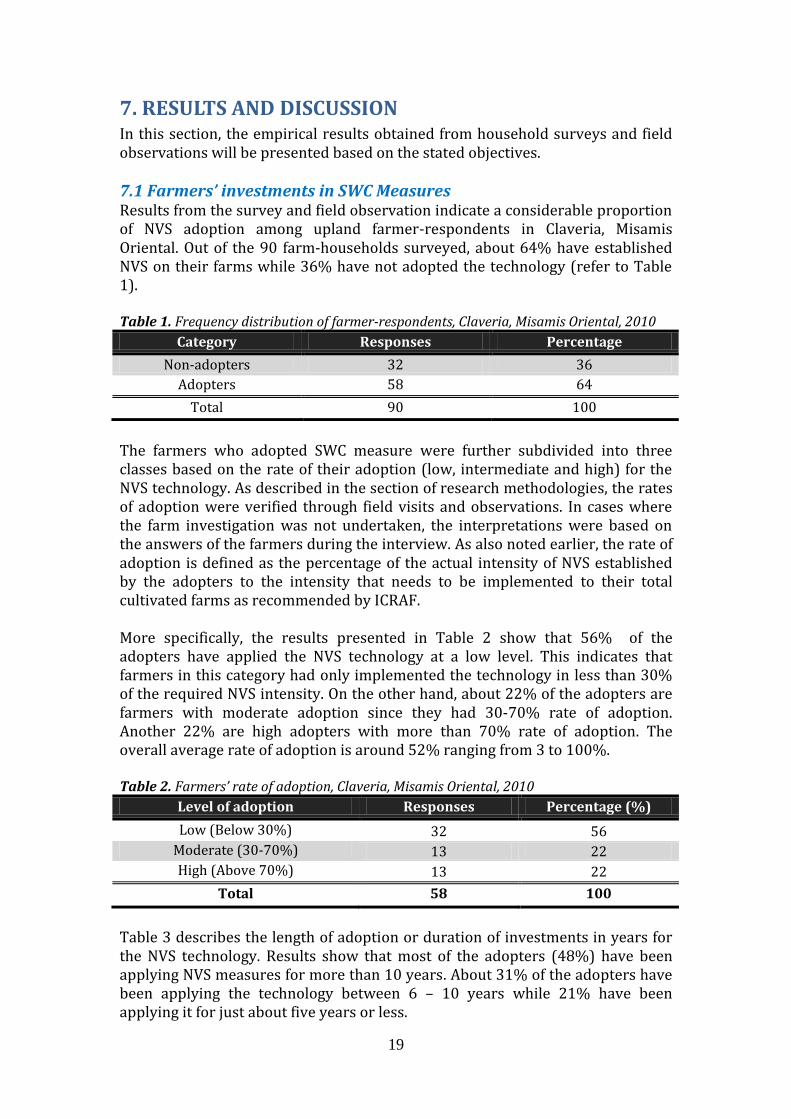
7. RESULTS AND DISCUSSION In this section, the empirical results obtained from household surveys and field observations will be presented based on the stated objectives. 7.1 Farmers’ investments in SWC Measures Results from the survey and field observation indicate a considerable proportion of NVS adoption among upland farmer-respondents in Claveria, Misamis Oriental. Out of the 90 farm-households surveyed, about 64% have established NVS on their farms while 36% have not adopted the technology (refer to Table 1).
Table 1. Frequency distribution of farmer-respondents, Claveria, Misamis Oriental, 2010
Category Responses Percentage
Non-adopters 32 36
Adopters 58 64
Total 90 100
The farmers who adopted SWC measure were further subdivided into three classes based on the rate of their adoption (low, intermediate and high) for the NVS technology. As described in the section of research methodologies, the rates of adoption were verified through field visits and observations. In cases where the farm investigation was not undertaken, the interpretations were based on the answers of the farmers during the interview. As also noted earlier, the rate of adoption is defined as the percentage of the actual intensity of NVS established by the adopters to the intensity that needs to be implemented to their total cultivated farms as recommended by ICRAF.
More specifically, the results presented in Table 2 show that 56% of the adopters have applied the NVS technology at a low level. This indicates that farmers in this category had only implemented the technology in less than 30% of the required NVS intensity. On the other hand, about 22% of the adopters are farmers with moderate adoption since they had 30-70% rate of adoption. Another 22% are high adopters with more than 70% rate of adoption. The overall average rate of adoption is around 52% ranging from 3 to 100%.
Table 2. Farmers’ rate of adoption, Claveria, Misamis Oriental, 2010
Level of adoption Responses Percentage (%)
Low (Below 30%) 32 56
Moderate (30-70%) 13 22
High (Above 70%) 13 22
Total 58 100
Table 3 describes the length of adoption or duration of investments in years for the NVS technology. Results show that most of the adopters (48%) have been applying NVS measures for more than 10 years. About 31% of the adopters have been applying the technology between 6 – 10 years while 21% have been applying it for just about five years or less.
20
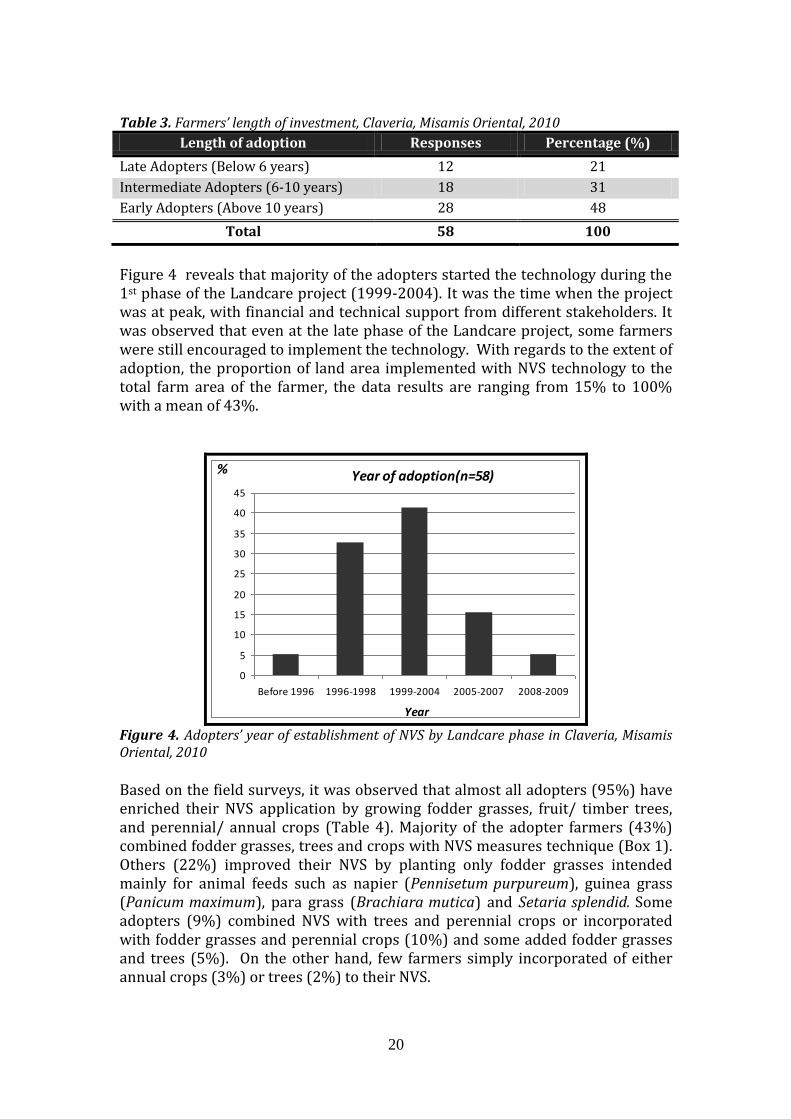
Table 3. Farmers’ length of investment, Claveria, Misamis Oriental, 2010
Length of adoption Responses Percentage (%)
Late Adopters (Below 6 years) 12 21
Intermediate Adopters (6-10 years) 18 31
Early Adopters (Above 10 years) 28 48
Total 58 100
Figure 4 reveals that majority of the adopters started the technology during the 1st phase of the Landcare project (1999-2004). It was the time when the project was at peak, with financial and technical support from different stakeholders. It was observed that even at the late phase of the Landcare project, some farmers were still encouraged to implement the technology. With regards to the extent of adoption, the proportion of land area implemented with NVS technology to the total farm area of the farmer, the data results are ranging from 15% to 100% with a mean of 43%.
Year of adoption(n=58)
0
5
10
15
20
25
30
35
40
45
Before 1996 1996-1998 1999-2004 2005-2007 2008-2009
Year
%
Figure 4. Adopters’ year of establishment of NVS by Landcare phase in Claveria, Misamis Oriental, 2010
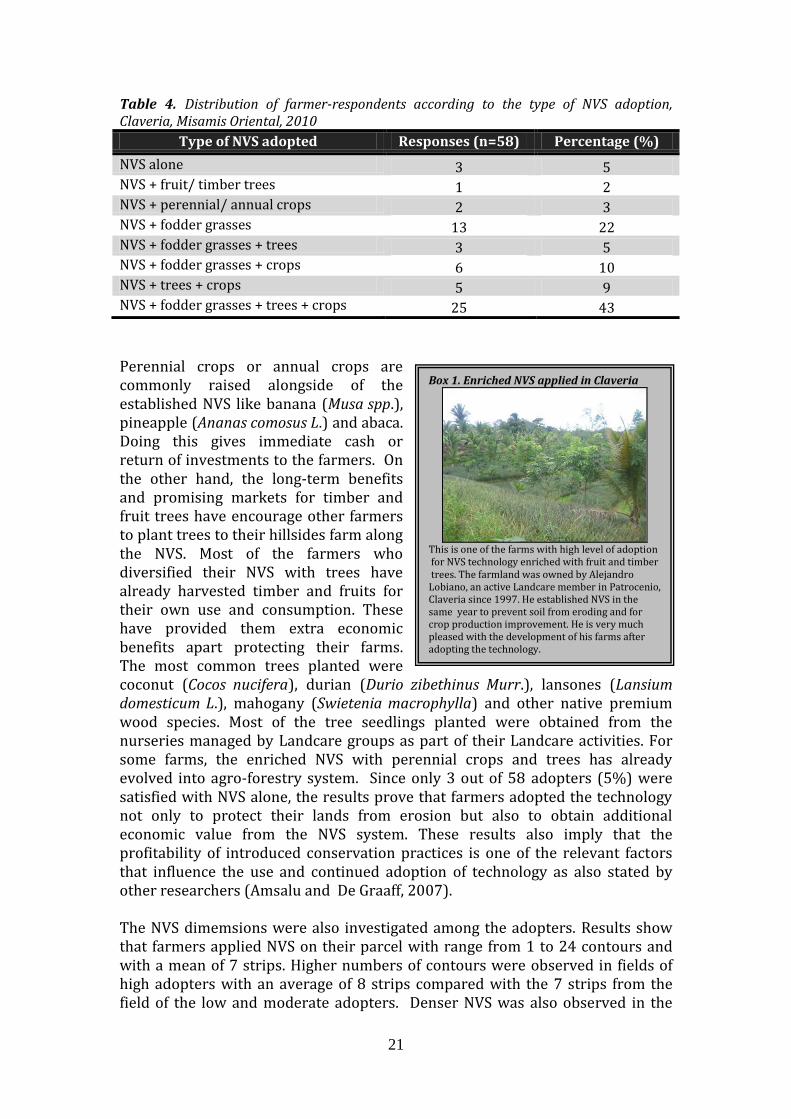
Based on the field surveys, it was observed that almost all adopters (95%) have enriched their NVS application by growing fodder grasses, fruit/ timber trees, and perennial/ annual crops (Table 4). Majority of the adopter farmers (43%) combined fodder grasses, trees and crops with NVS measures technique (Box 1). Others (22%) improved their NVS by planting only fodder grasses intended mainly for animal feeds such as napier (Pennisetum purpureum), guinea grass (Panicum maximum), para grass (Brachiara mutica) and Setaria splendid. Some adopters (9%) combined NVS with trees and perennial crops or incorporated with fodder grasses and perennial crops (10%) and some added fodder grasses and trees (5%). On the other hand, few farmers simply incorporated of either annual crops (3%) or trees (2%) to their NVS.
21
Box 1. Enriched NVS applied in Claveria
This is one of the farms with high level of adoption for NVS technology enriched with fruit and timber trees. The farmland was owned by Alejandro Lobiano, an active Landcare member in Patrocenio, Claveria since 1997. He established NVS in the same year to prevent soil from eroding and for crop production improvement. He is very much pleased with the development of his farms after adopting the technology.
Table 4. Distribution of farmer-respondents according to the type of NVS adoption, Claveria, Misamis Oriental, 2010
Type of NVS adopted Responses (n=58) Percentage (%)
NVS alone 3 5 NVS + fruit/ timber trees 1 2 NVS + perennial/ annual crops 2 3 NVS + fodder grasses 13 22 NVS + fodder grasses + trees 3 5 NVS + fodder grasses + crops 6 10 NVS + trees + crops 5 9 NVS + fodder grasses + trees + crops 25 43
Perennial crops or annual crops are commonly raised alongside of the established NVS like banana (Musa spp.), pineapple (Ananas comosus L.) and abaca. Doing this gives immediate cash or return of investments to the farmers. On the other hand, the long-term benefits and promising markets for timber and fruit trees have encourage other farmers to plant trees to their hillsides farm along the NVS. Most of the farmers who diversified their NVS with trees have already harvested timber and fruits for their own use and consumption. These have provided them extra economic benefits apart protecting their farms. The most common trees planted were coconut (Cocos nucifera), durian (Durio zibethinus Murr.), lansones (Lansium domesticum L.), mahogany (Swietenia macrophylla) and other native premium wood species. Most of the tree seedlings planted were obtained from the nurseries managed by Landcare groups as part of their Landcare activities. For some farms, the enriched NVS with perennial crops and trees has already evolved into agro-forestry system. Since only 3 out of 58 adopters (5%) were satisfied with NVS alone, the results prove that farmers adopted the technology not only to protect their lands from erosion but also to obtain additional economic value from the NVS system. These results also imply that the profitability of introduced conservation practices is one of the relevant factors that influence the use and continued adoption of technology as also stated by other researchers (Amsalu and De Graaff, 2007). The NVS dimemsions were also investigated among the adopters. Results show that farmers applied NVS on their parcel with range from 1 to 24 contours and with a mean of 7 strips. Higher numbers of contours were observed in fields of high adopters with an average of 8 strips compared with the 7 strips from the field of the low and moderate adopters. Denser NVS was also observed in the
22
plots of high adopters with an NVS mean distance of 7 m. In contrast, longer space of strips was observed from the NVS plots of low and moderate adopters with a mean distance of 10 m and 9 m, respectively. Overall, the average space between NVS is 9 m with a minimum distance of 2 m and maximum of 30 m. With regards to the total length which is calculated by multiplying the number of contours with the average length, results show that the NVS total length range from 100 m to 6000 m with a mean of 748 m. Majority of the adopters have implemented NVS at 550 m length. As expected, shorter total length of NVS was observed from the plots of low adopters with a mean of 624 m. In contrast, a mean of 1072 m and 728 m were observed from the plots of high and moderate adopters, respectively.
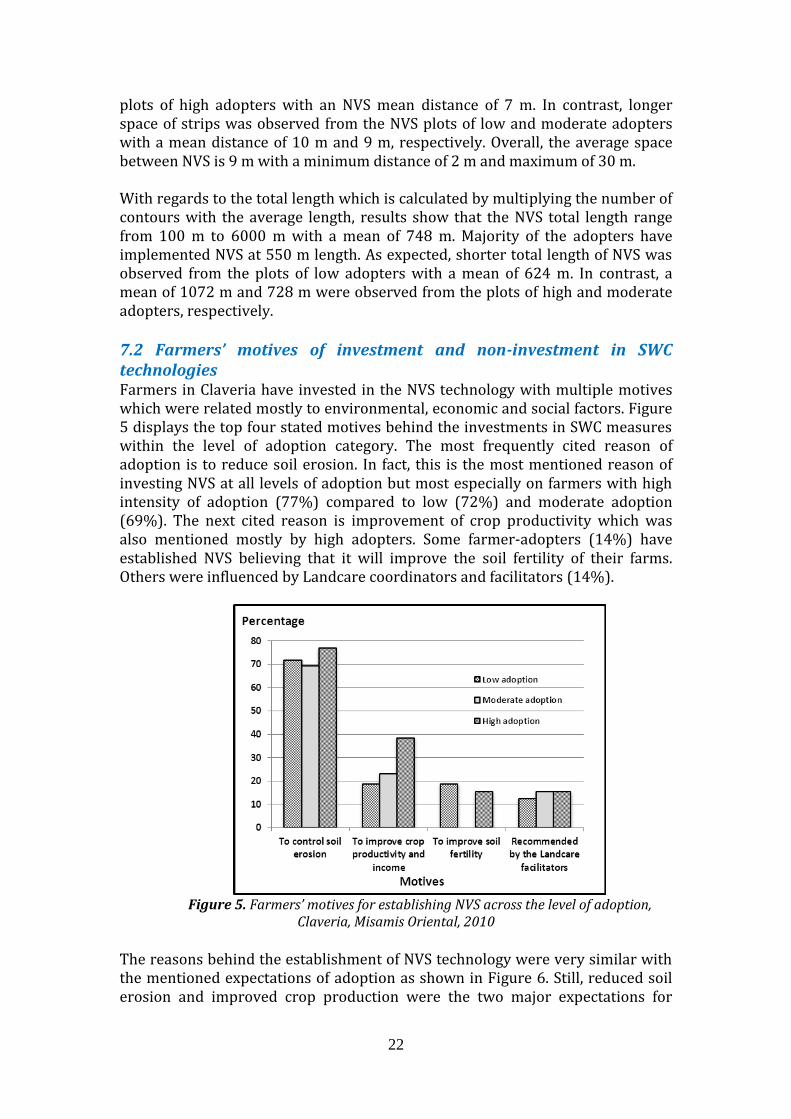
7.2 Farmers’ motives of investment and non-investment in SWC technologies Farmers in Claveria have invested in the NVS technology with multiple motives which were related mostly to environmental, economic and social factors. Figure 5 displays the top four stated motives behind the investments in SWC measures within the level of adoption category. The most frequently cited reason of adoption is to reduce soil erosion. In fact, this is the most mentioned reason of investing NVS at all levels of adoption but most especially on farmers with high intensity of adoption (77%) compared to low (72%) and moderate adoption (69%). The next cited reason is improvement of crop productivity which was also mentioned mostly by high adopters. Some farmer-adopters (14%) have established NVS believing that it will improve the soil fertility of their farms. Others were influenced by Landcare coordinators and facilitators (14%).
Figure 5. Farmers’ motives for establishing NVS across the level of adoption,
Claveria, Misamis Oriental, 2010
The reasons behind the establishment of NVS technology were very similar with the mentioned expectations of adoption as shown in Figure 6. Still, reduced soil erosion and improved crop production were the two major expectations for

23
investing in NVS. Reduced erosion is the most frequently cited expectation of high adopters (54%) and low adopters (53%). On the ther other hand, adopters with moderate adoption expected more on the improvement in crop productivity (46%) as well as those farmers with high adoption. About 24% percent of the adopters expected less application of fertilizer to their farms after applying NVS in particular with best and moderate adopters (30%). On the other hand, five adopters expected that NVS could help their farms to generate more variation or sources of livelihood. It was observed that most of the expectations mentioned can only be acquired within a long-term period of time such as prospects related to terrace formation, soil fertility improvement, soil loss reduction and increase yield. Immediate benefits were not expected that much from the technology. Farmers’ expectations of long-term benefits perhaps have motivated them to try and continuously adopt the technology. The results also indicate that high adopters have higher expectations or mentioned more expectations compared with low and moderate adopters. When farmer-adopters were asked if they achieved what they expected when they invested in NVS, almost all of them answered “yes”. In fact, only one farmer responded “no” for he thought NVS adoption would result in applying less amount of fertilizer in his farm.
Figure 6. Farmers’ initial expectations in establishing NVS by level of adoption, Claveria,
Misamis Oriental, 2010
Farmer-adopters mentioned various benefits from establishing NVS (Figure 7). The perceived benefits perhaps motivated farmers to maintain and continue adopting the technology. The primary benefit perceived by farmer-adopters was the reduced occurrence of soil erosion in their farms which was observed at all levels of adoption but especially by low adopters (69%). This confirmed the effectiveness of the vegetated grasses as barrier to control soil erosion. Fourteen farmers reported enhanced soil fertility in their cultivated lands especially in areas near the established NVS plots where the soil nutrients/ sediments accumulated. Improved crop production was observed by 12 farmer-adopters that might be attributed to the improved soil fertility and the controlled removal

24
of top soils. Yield improvement and increased soil fertility were dominantly mentioned by high adopters. Formation of terraces was also mentioned by 14% of the adopters particularly the moderate adopters. These results reflect how their expectations in adopting the technology were achieved in their actual fields.
Figure 7. Gains of NVS perceived by adopters
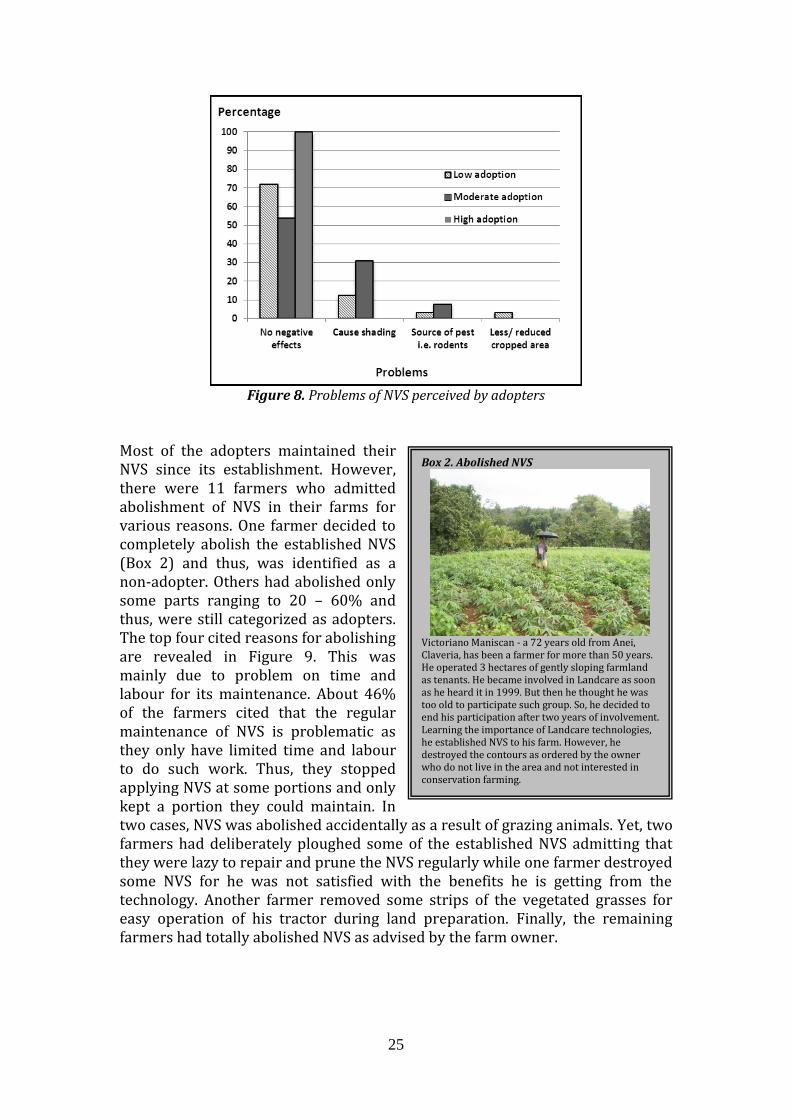
Majority of the adopters (74%) claims that the NVS has no damaging effect to their cultivated farms. All of the high adopters clearly stated this. Perhaps this served as one of their motivation to continuously adopt the technology at high intensity. Only a few farmers mentioned some negative effects of establishing NVS (Figure 8). One downside is that integrating perennial crops and trees with the NVS shaded the alley crops that eventually lowered yield as reported by 8 adopters. This indicates that farmers are really concerned with their crop production. Infestation of pests like rodents and insects was mentioned by 2 farmers as another negative effect of establishing NVS without proper and regular pruning. This problem would add additional financial and labour burdens to farmers as they need to apply pesticides and insecticides in order to have good quantity and quality of yields. Lastly, one farmer with low rate of adoption noted the disadvantage of reduced area of cultivation since some portions were occupied by strips of vegetated grasses. NVS can actually occupy 15% of crop area at 1 m vertical drop for 20% slopes of parcel (Mercado et al., 1999). The results imply that the farmers who adopted NVS more intensely perceived less negative effects to their field. Perhaps, this is one of the relevant factors that influence them to continuously use and adopt the NVS technology. Nevertheless, despite these problems observed by farmers, they were still not discouraged to apply NVS to their farms. They actually expected these problems on their farms since these were mentioned during the trainings and seminars in Landcare. Yet for them, the gains are far more worthwhile than the undesirable characteristics of the technology.
25
Box 2. Abolished NVS
Victoriano Maniscan - a 72 years old from Anei, Claveria, has been a farmer for more than 50 years. He operated 3 hectares of gently sloping farmland as tenants. He became involved in Landcare as soon as he heard it in 1999. But then he thought he was too old to participate such group. So, he decided to end his participation after two years of involvement. Learning the importance of Landcare technologies, he established NVS to his farm. However, he destroyed the contours as ordered by the owner who do not live in the area and not interested in conservation farming.
Figure 8. Problems of NVS perceived by adopters
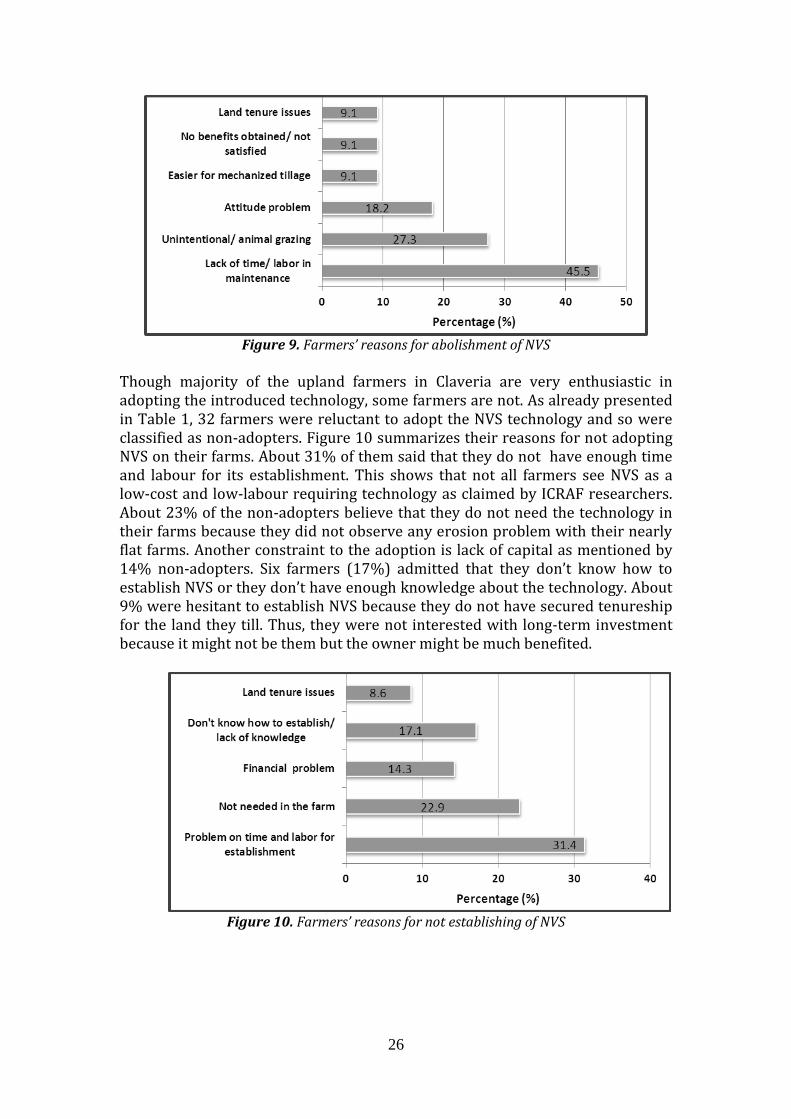
Most of the adopters maintained their NVS since its establishment. However, there were 11 farmers who admitted abolishment of NVS in their farms for various reasons. One farmer decided to completely abolish the established NVS (Box 2) and thus, was identified as a non-adopter. Others had abolished only some parts ranging to 20 – 60% and thus, were still categorized as adopters. The top four cited reasons for abolishing are revealed in Figure 9. This was mainly due to problem on time and labour for its maintenance. About 46% of the farmers cited that the regular maintenance of NVS is problematic as they only have limited time and labour to do such work. Thus, they stopped applying NVS at some portions and only kept a portion they could maintain. In two cases, NVS was abolished accidentally as a result of grazing animals. Yet, two farmers had deliberately ploughed some of the established NVS admitting that they were lazy to repair and prune the NVS regularly while one farmer destroyed some NVS for he was not satisfied with the benefits he is getting from the technology. Another farmer removed some strips of the vegetated grasses for easy operation of his tractor during land preparation. Finally, the remaining farmers had totally abolished NVS as advised by the farm owner.
26
Figure 9. Farmers’ reasons for abolishment of NVS
Though majority of the upland farmers in Claveria are very enthusiastic in adopting the introduced technology, some farmers are not. As already presented in Table 1, 32 farmers were reluctant to adopt the NVS technology and so were classified as non-adopters. Figure 10 summarizes their reasons for not adopting NVS on their farms. About 31% of them said that they do not have enough time and labour for its establishment. This shows that not all farmers see NVS as a low-cost and low-labour requiring technology as claimed by ICRAF researchers. About 23% of the non-adopters believe that they do not need the technology in their farms because they did not observe any erosion problem with their nearly flat farms. Another constraint to the adoption is lack of capital as mentioned by 14% non-adopters. Six farmers (17%) admitted that they don’t know how to establish NVS or they don’t have enough knowledge about the technology. About 9% were hesitant to establish NVS because they do not have secured tenureship for the land they till. Thus, they were not interested with long-term investment because it might not be them but the owner might be much benefited.
Figure 10. Farmers’ reasons for not establishing of NVS
27
Box 3. Formerly member in Landcare
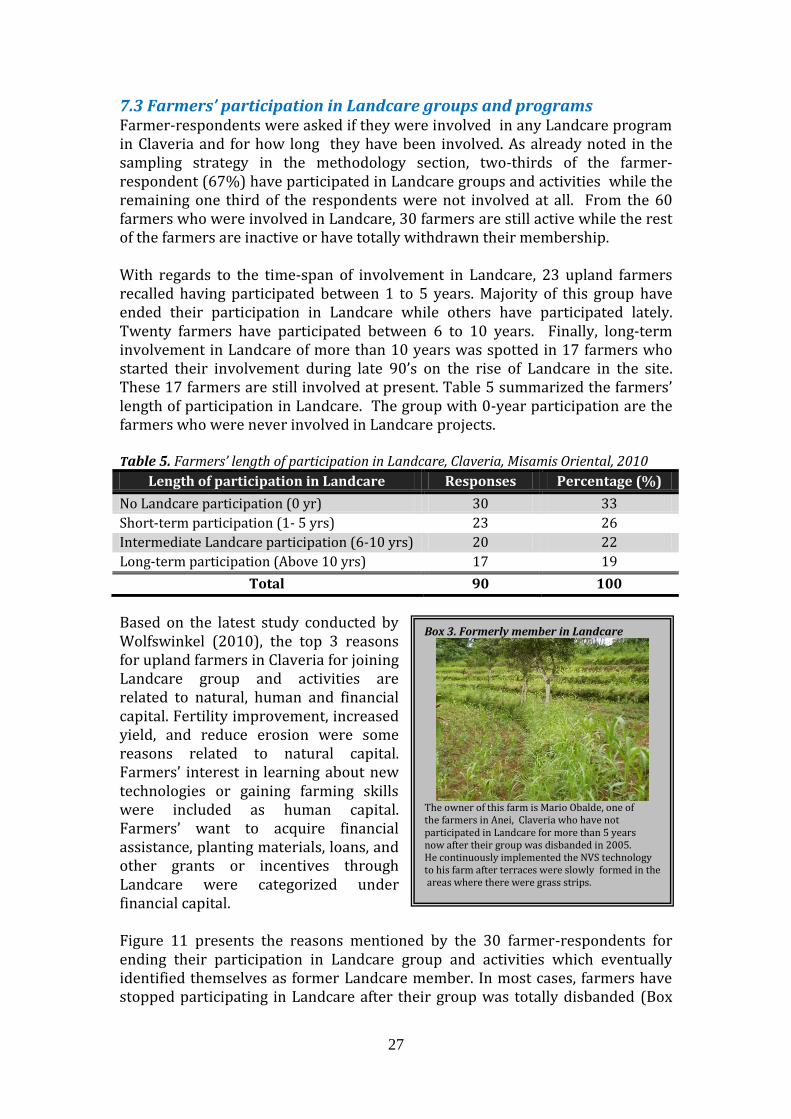
The owner of this farm is Mario Obalde, one of the farmers in Anei, Claveria who have not participated in Landcare for more than 5 years now after their group was disbanded in 2005. He continuously implemented the NVS technology to his farm after terraces were slowly formed in the areas where there were grass strips.
7.3 Farmers’ participation in Landcare groups and programs Farmer-respondents were asked if they were involved in any Landcare program in Claveria and for how long they have been involved. As already noted in the sampling strategy in the methodology section, two-thirds of the farmer-respondent (67%) have participated in Landcare groups and activities while the remaining one third of the respondents were not involved at all. From the 60 farmers who were involved in Landcare, 30 farmers are still active while the rest of the farmers are inactive or have totally withdrawn their membership.
With regards to the time-span of involvement in Landcare, 23 upland farmers recalled having participated between 1 to 5 years. Majority of this group have ended their participation in Landcare while others have participated lately. Twenty farmers have participated between 6 to 10 years. Finally, long-term involvement in Landcare of more than 10 years was spotted in 17 farmers who started their involvement during late 90’s on the rise of Landcare in the site. These 17 farmers are still involved at present. Table 5 summarized the farmers’ length of participation in Landcare. The group with 0-year participation are the farmers who were never involved in Landcare projects. Table 5. Farmers’ length of participation in Landcare, Claveria, Misamis Oriental, 2010
Length of participation in Landcare Responses Percentage (%)
No Landcare participation (0 yr) 30 33
Short-term participation (1- 5 yrs) 23 26
Intermediate Landcare participation (6-10 yrs) 20 22
Long-term participation (Above 10 yrs) 17 19
Total 90 100
Based on the latest study conducted by Wolfswinkel (2010), the top 3 reasons for upland farmers in Claveria for joining Landcare group and activities are related to natural, human and financial capital. Fertility improvement, increased yield, and reduce erosion were some reasons related to natural capital. Farmers’ interest in learning about new technologies or gaining farming skills were included as human capital. Farmers’ want to acquire financial assistance, planting materials, loans, and other grants or incentives through Landcare were categorized under financial capital. Figure 11 presents the reasons mentioned by the 30 farmer-respondents for ending their participation in Landcare group and activities which eventually identified themselves as former Landcare member. In most cases, farmers have stopped participating in Landcare after their group was totally disbanded (Box

28
3) or became inactive (46%). Some farmers have health problems or thought they were too old already to continue participating in Landcare (20%). Another 11% have changed priorities or they were mainly engaged in off-farm work. Others had specific grounds such as less time, energy and motivation.
Figure 11. Farmers’ reasons for ending participation in Landcare activities
In comparison, 30 non-Landcare member farmers were also asked what their reasons were for not joining and participating in Landcare group and activities. Their answers are summarized in Figure 12. Majority of them (40%) said that they were too busy with farm works and don’t have time to participate in Landcare. Some of them (26%) claimed that they were not informed about Landcare or had not been invited to join. Others were discouraged to join due to some problems reported on Landcare facilitation and organization (23%). Other farmers were not interested and don’t want any commitment or obligation.
Figure 12. Farmers’ reasons for non-participation in Landcare activities
Concerning the farmers’ involvement in SWC related activities of Landcare such as group meetings, trainings, pahina (traditional community work sharing group) and cross-visits, respondents were asked how many times they have attended and participated on these specific activities.
29
Majority of the Landcare members (21%) have attended trainings for more than 7 times . These trainings were mainly about contouring, NVS establishment and maintenance, organic farming, nursery management, agro-forestry, diversified farming, plant propagation and farm planning. About 34% of the respondents have not participated in training. These included all non-members of Landcare and one late member. The results likely imply that farmers who intensely adopted the NVS technology were those who attended more trainings. On the other hand, less investment in NVS technology was observed among farmers who participated in lesser trainings. Farmers said that no SWC-related training has been organized for the past two years in Claveria. This confirmed the reports of some key informants from LGU and LFPI that current Landcare activities are no longer focused on conducting trainings related to SWC but rather deal more with marketing and production of high quality crops. According to them, farmers are already knowledgeable on different SWC technologies that could help them protect their lands from erosion. Thus, farmers are more interested now on how they could be able to market their produce in a more sustainable manner. They also longing to learn new technologies that can provide them more income even through off-farm work. Because of this, only vermi-composting, also called vermin-casting, a process of organic wastes with the aid of earthworms, is the only current activity of Landcare related on SWC. Group meetings seem to be interesting to some farmers especially those who are still members of a Landcare group. Around 21% have attended meetings for more than 7 times ranging from 8 to 55 meetings. Majority of them were good adopters and have invested in SWC technologies at high and intermediate levels. On the other hand, non-adopters of NVS are those with non-attendance in landcare group meetings. Cross-visits is the least participated Landcare activity among farmers in Claveria. Nearly half (43%) of the respondents were not enthusiastic in joining cross-visits. They mentioned financial and time constraints as the top two major reasons for passively participating on such activities. Only 18% respondents have joined at least 7 cross-visits. These are those who invested in NVS at high level. Though low level of adoption is evident to farmers who rarely participated in cross-visits, high variation of participation can be observed in all other groups. Pahina is another activity in Landcare programs that has been extensively implemented in the late 90’s. Majority of the farmers who are a Landcare member (90%) had participated in pahinas. Most of them (32%) had joined more than 7 pahinas. As expected, all of the non-landcare members were uninterested with group work organized by Landcare . Farmers with high amount of participation in pahinas were also the high and moderate adopters. They were the farmers who adopted the SWC technology at high and intermediate level of adoption. In contrast, non-adopters were those who either had low or no participation in pahinas.
30
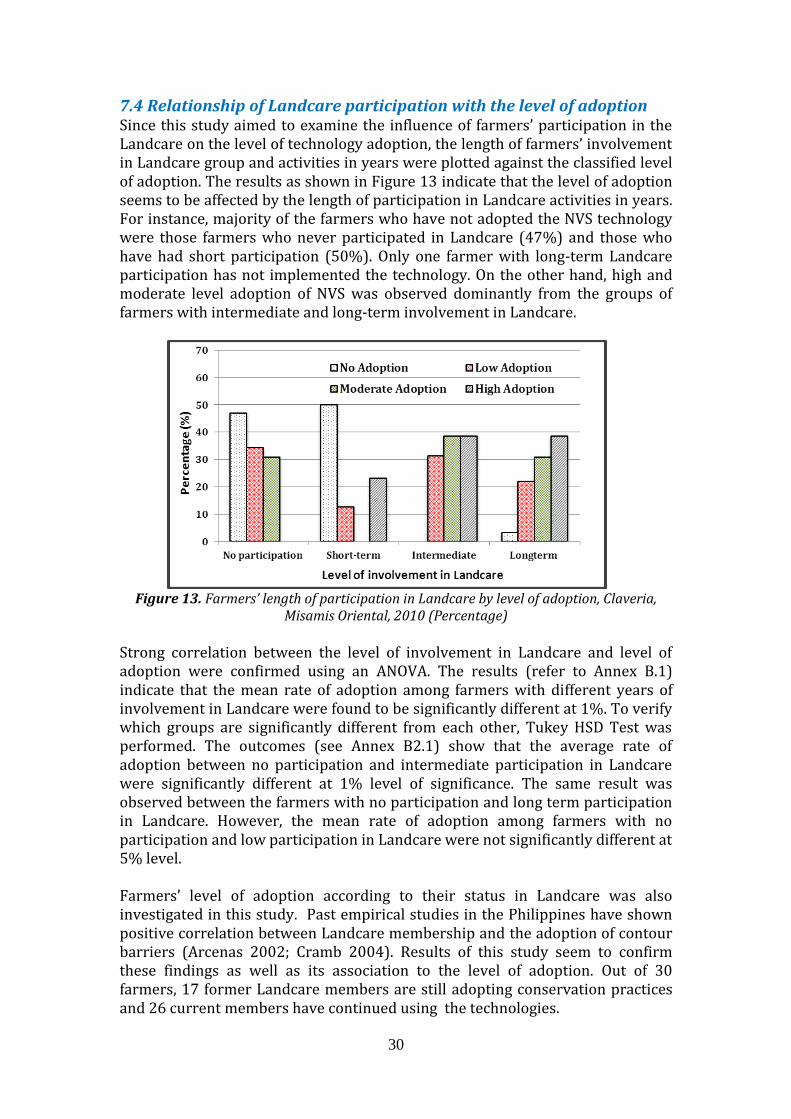
7.4 Relationship of Landcare participation with the level of adoption Since this study aimed to examine the influence of farmers’ participation in the Landcare on the level of technology adoption, the length of farmers’ involvement in Landcare group and activities in years were plotted against the classified level of adoption. The results as shown in Figure 13 indicate that the level of adoption seems to be affected by the length of participation in Landcare activities in years. For instance, majority of the farmers who have not adopted the NVS technology were those farmers who never participated in Landcare (47%) and those who have had short participation (50%). Only one farmer with long-term Landcare participation has not implemented the technology. On the other hand, high and moderate level adoption of NVS was observed dominantly from the groups of farmers with intermediate and long-term involvement in Landcare.
Figure 13. Farmers’ length of participation in Landcare by level of adoption, Claveria,
Misamis Oriental, 2010 (Percentage)
Strong correlation between the level of involvement in Landcare and level of adoption were confirmed using an ANOVA. The results (refer to Annex B.1) indicate that the mean rate of adoption among farmers with different years of involvement in Landcare were found to be significantly different at 1%. To verify which groups are significantly different from each other, Tukey HSD Test was performed. The outcomes (see Annex B2.1) show that the average rate of adoption between no participation and intermediate participation in Landcare were significantly different at 1% level of significance. The same result was observed between the farmers with no participation and long term participation in Landcare. However, the mean rate of adoption among farmers with no participation and low participation in Landcare were not significantly different at 5% level.
Farmers’ level of adoption according to their status in Landcare was also investigated in this study. Past empirical studies in the Philippines have shown positive correlation between Landcare membership and the adoption of contour barriers (Arcenas 2002; Cramb 2004). Results of this study seem to confirm these findings as well as its association to the level of adoption. Out of 30 farmers, 17 former Landcare members are still adopting conservation practices and 26 current members have continued using the technologies.

31
Box 4. Non-Landcare member adopter
Remie Labastida was discouraged to join Landcare due to some rumoured problems on the facilitation and organization of Landcare group and activities in Madaguing, Claveria. However, he learned about NVS technology from his neighbours and peer farmers. Realizing that soil erosion was occurring to his quite rolling owned farm, he then decided to implement pure NVS at intermediate intensity in 2004 and still maintained at the moment.
In Figure 14, it can be noted that half of the Landcare non-member respondents were adopters but none of them considered high adopters. Majority of the farmers who are currently involved in Landcare group and activities (77%) have established NVS on their farms at higher rates. About 38% of moderate adopters and 34% of low adopters are still participating in the Landcare. In contrary, non-adoption of technology was observed mostly among farmers who are non-members (47%) and formerly member of Landcare (41%). Only 13% of current members have not implemented the technology. It is also noteworthy to mention that majority of the farmers who abolished NVS plots were non-members (50%) and formerly members of Landcare (40%). All of these results indicate that farmers who presently participate in the Landcare programs and activities are more responsive and more willing to invest in SWC technologies compared with farmers without current involvement in Landcare.
Figure 14. Farmers’ status of participation in Landcare across the level of adoption, Claveria, Misamis Oriental, 2010 (Percentage)
The ANOVA (see Annex B.1) results proved the significant difference of the level of adoption across the farmers’ status in Landcare at 1% level. Again, Tukey HSD test was applied to determine which mean groups is regarded as significant. Results as presented in Annex B2.1 point out the significant difference between non-member and current member in Landcare at 1% level. Similar observation can be seen among farmers with former and current involvement in Landcare activities. On the other hand, the level of adoption within the group of non-
32
member and former member in Landcare were found to be not significantly different from each other at 5%. 7.5 Household and farm characteristics of the farmer-respondents The aim of this section is to highlight the characteristics of upland farmers that are significantly associated with their level of technology adoption. This part starts with the socio-demographic characteristics of the farmer-respondents as presented in Table 6. Eight traits were cross-tabulated with their level of adoption such as age, level of education, family size, ethnic group, length of residency, farmer type, years of farming experience and source of income.
The age of the sample respondents were between 24 and 78 years old. Majority of the farmers were in the 41-50 age group (36%), followed by age group of 51-60 years (23%) and then the age group of 24-40 years (21%). The mean age of the respondents was 50 years.
With regards to educational achievement, majority of the upland farmers have reached secondary level (37%), followed by elementary level (28%). There were also farmers who had spent education in tertiary level or in college (13%).The mean educational attainment of the sample respondents were 7 years in school.
The size of the family range from 2 to 9 with a mean of 5. Majority of the households have 4 to 6 family members (47%) and 1 to 3 members (41%). Only 12% had family members of 7 or more.
About 72% of respondents had migrated from outside Claveria while around 28% were born and grew up in the area. For respondents’ length of residency in the site, most of the respondents had stayed more than 30 years (42%), followed by those who had stayed between 21-30 years (30%) and 11-20 years (19%). Only 9% had residency between 1-10 years in the area. The mean years of staying the village was 30 years with range from 3 to 74 years.
Larger portion of the farmers were engaged in full-time farming (92%) than part-time farming (8%). Regarding their farming experience, majority have been farming for more than 30 years (37%). About 29% of the total respondents were involved in farm activities between 21-30 years. Only 12% and 22% farmers have started farming between 1-10 years and 11-10 years, respectively. The average years in farming of the respondents is 28 years.
Although farming is the major source of income for all of the farmer respondents, they also have other income sources which include small business operation (17%), hired laborer (10%), honorarium or incentive from LGU (5%) and raising livestock (7%). Another source of household income is the remittances of family members working outside the village either in government and private companies (2%) and pension (1%).

33
Table 6. Household characteristics of the respondents by adoption category, Claveria, Misamis Oriental, 2010
Description PERCENTAGE Sig.
No Adoption
(n=32)
Low Adoption
(n=32)
Moderate Adoption
(n=13)
High Adoption
(n=13)
All (n=90)
Age group ns 24- 40 yrs 28.1 12.5 30.8 15.4 21.1 41-50 yrs 31.3 37.5 38.5 38.5 35.6 51-60 yrs 25.0 18.8 23.1 30.8 23.3 Above 60 yrs 15.6 31.3 7.7 15.4 20.0 Total 100.0 100.0 100.0 100.0 100.0 Mean 49.0 52.8 46.6 50.2 49.6 Range 27-73 24-78 28-68 29-74 24-78
Level of education (years) ns Elementary (1-4 yrs) 37.5 25.0 23.1 15.4 27.8 Primary (5-6 yrs) 21.9 18.8 38.5 15.4 22.2 Secondary (7-10 yrs) 31.3 43.8 23.1 46.2 36.7 Tertiary (11-14 yrs) 9.4 12.5 15.4 23.1 13.3 Total 100.0 100.0 100.0 100.0 100 Mean 6.3 7.0 6.9 8.4 7.2 Range 1-14 1-12 3-12 3-12 1-14
Family size ns 1-3 37.5 50.0 38.5 30.8 41.1 4-6 50.0 37.5 46.2 61.5 46.7 7 and above 12.5 12.5 15.4 7.7 12.2 Total 100.0 100.0 100.0 100.0 100.0 Mean 4.4 4.3 4.6 4.6 4.5 Range 3-9 2-8 3-8 3-7 2-9
Ethnic group ns Native 21.9 28.1 30.8 38.5 27.8 Immigrant 78.1 71.9 69.2 61.5 72.2 Total 100.0 100.0 100.0 100.0 100.0
Length of residency 0 ns 1-10 yrs 9.4 9.4 7.7 7.7 8.9 11-20 yrs 21.9 15.6 23.1 15.4 18.9 21-30 yrs 21.9 28.1 38.5 46.2 30.0 Above 30 yrs 46.9 46.9 30.8 30.8 42.2 Total 100.0 100.0 100.0 100.0 100.0 Mean 29.7 30.2 28.1 32.3 30.1 Range 9-59 3-67 8-50 11-74 3-74 Farmer type ns Full time 87.5 90.6 100.0 100.0 92.2 Part time 12.5 9.4 0.0 0.0 7.8 Total 87.5 90.6 100.0 100.0 100.0
Length of farming experience ns 1-10 yrs 15.6 9.4 7.7 15.4 12.2 11-20 yrs 15.6 28.1 23.1 23.1 22.2 21-30 yrs 28.1 28.1 38.5 23.1 28.9 Above 30 yrs 40.6 34.4 30.8 38.5 36.7 Total 100.0 100.0 100.0 100.0 100.0 Mean 28.8 27.6 25.2 27.2 27.2 Range 2-64 6-69 8-40 10-60 2-69
Source of income ns Farming 100.0 100.0 100.0 100.0 100.0 Small business 21.9 21.9 7.7 15.4 16.7 Labor 15.6 9.4 15.4 0.0 10.1 Honorarium/ incentives 9.4 3.1 0.0 7.7 5.0 Remittances 3.1 6.3 0.0 0.0 2.3 Livestock 0.0 3.1 0.0 23.1 6.6 Pension 3.1 0.0 0.0 0.0 0.8
ns = not significant
Multiple comparisons across the level of adoption show that the mean values of all identified household characteristics of respondents were not significantly (ns) different at 5% level using a one-way ANOVA. The statistical results are accessible in Annex B-1 and also shown in Table 6. In various literatures, household attributes were identified as important factors of adoption. For

34
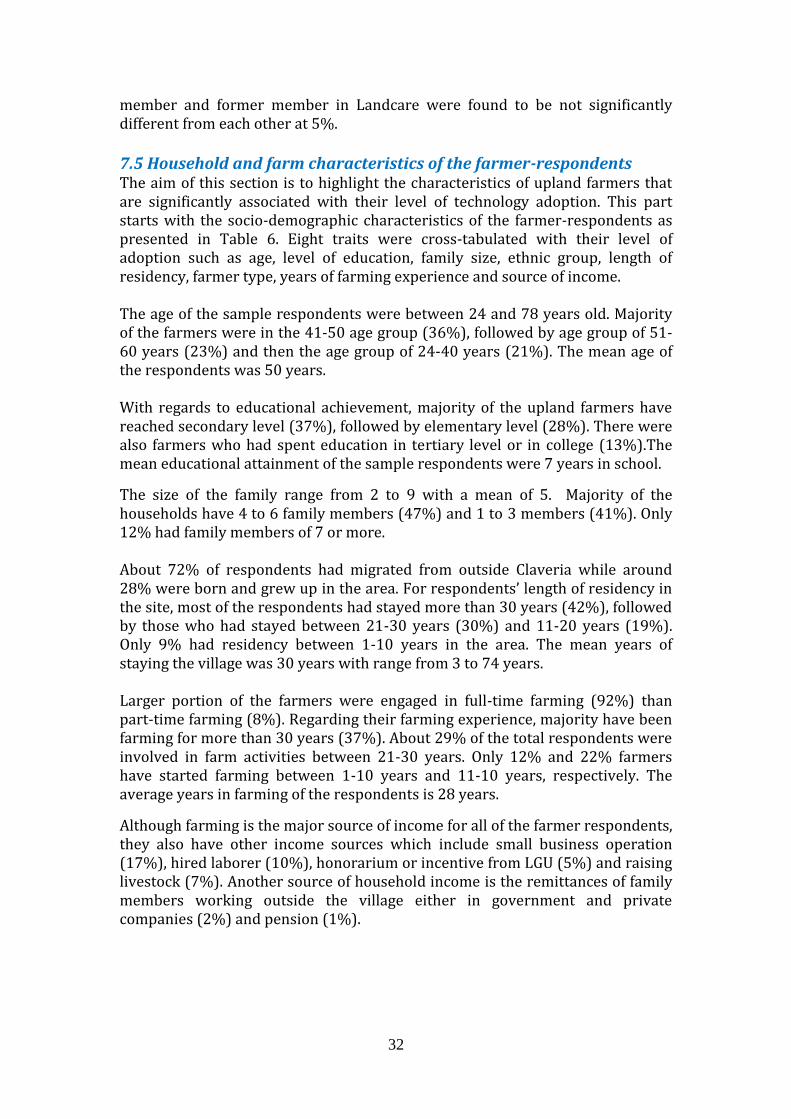
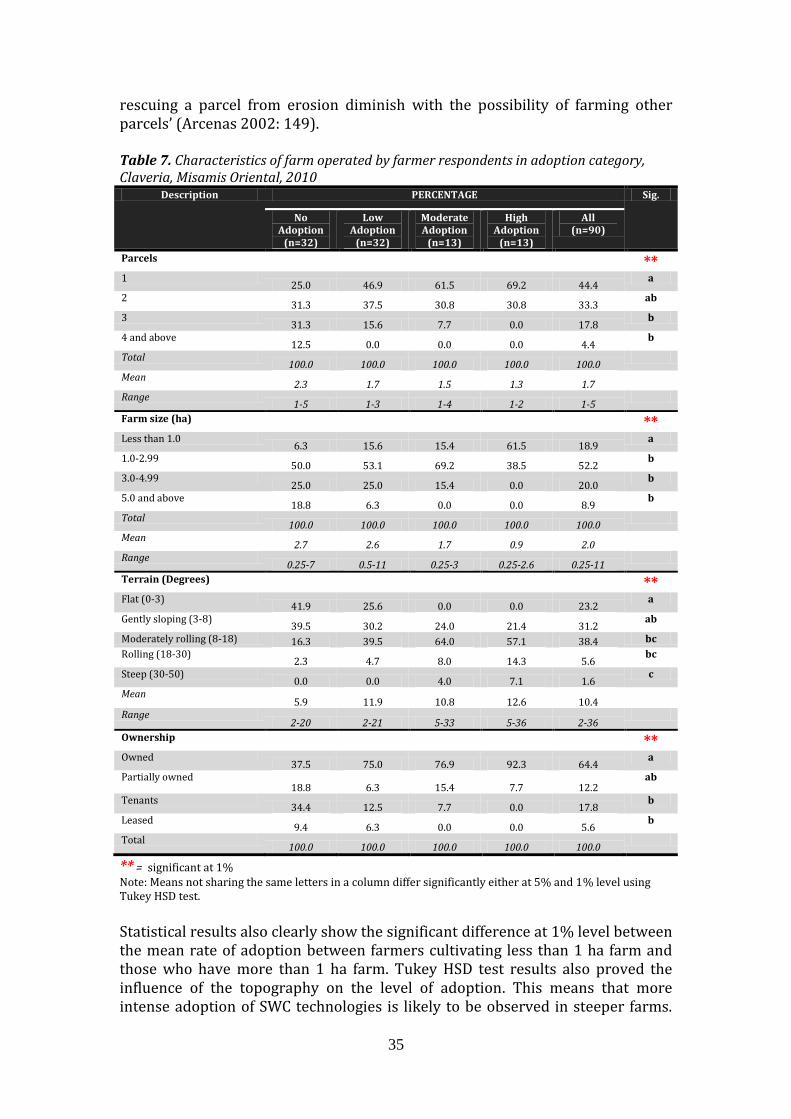
instance, continued adoption of stone terraces in Ethiopia is found to be correlated with the farmers’ age, family size and off-farm work (Amsalu and De Graaff, 2007). Adoption of contour barriers in the Philippines particularly in Ned, South Cotabato was positively associated with age, education, ethnicity, gender and farmers’ place of origin (Cramb, 2004). However, some authors argue that factors that influence farmers’ decision to adopt conservation practices may differ from those variables explaining the intensity of adoption (Gebremedhin and Swinton, 2003). This assumption affirms the results found on this study. The statistical outcomes presented here indicate that the level of investment in SWC technologies is not directly influenced by the socio-demographic characteristics such as age, level of education, family size, ethnic group, length of residency, farmer type, years of farming experience and source of income of the farmers in Claveria. Table 7 describes the characteristics of farms operated by upland farmers in Claveria. From a total of 164 parcels worked by the respondents, majority of the farmers had one (44%) and two (33%) farm parcels. Only 4% of the upland farmers had 4 parcels and more. The average number of farms operated by the farmer-respondents were 2 parcels. The respondents’ farm size is ranging from 0.25 to 11 ha. About half of the respondent had farm of 1 to 2.99 ha. Around 19% of the respondents had small area of less than 1.0 ha and 20% had a landholding of 3.0-4.99 ha. Only a few farmers (9%) had farm size of more than 5 ha. Overall, the mean farm size of the upland farmers was 2 ha. Majority of the farmers identified their farm parcels with more than one slope class, reflecting the complexity of the topography. Most of the farm parcels were characterized as moderate rolling topography (38%) and gently sloping terrain (31%). Farms with generally level or flat topography was 23%. Conversely, areas with rolling and steep land constitute only of 6% and 2% of the total farm parcels, respectively. With respect to land tenure, more than half of the farms are owned by the farmers (65%) while 12% is partially owned. The rest of the sampled farms are tenanted (18%) and leased (6%). The trend of the respondents’ farm characteristics across the level of adoption was tested using ANOVA. Results (refer Annex B1) show that the aggregate difference of the mean rate of adoption among all farm characteristics groups is significantly different from each other at 1% level of significance. For instance, the average rate of adoption between farmers with 1 parcel and those who have 3 parcels has been found to be significantly different at 1% level using Tukey HSD test as also presented in Table 7. Significant difference has been also observed between the group of farmers with 1 parcel and farmers operating with 4 parcels and more. However, the mean level of adoption between those with 1 parcel and 2 parcels were not significantly different at 5% level. The results imply that farmers with fewer parcels are more likely to adopt SWC measures at high level. These results conform the observation found by Arcenas (2002) in the same site that farmers with more parcels are less likely to adopt conservation practices particularly the contour hedgerows. This is ‘because the úrgency of
35
rescuing a parcel from erosion diminish with the possibility of farming other parcels’ (Arcenas 2002: 149). Table 7. Characteristics of farm operated by farmer respondents in adoption category, Claveria, Misamis Oriental, 2010
Description PERCENTAGE Sig.
No Adoption
(n=32)
Low Adoption
(n=32)
Moderate Adoption
(n=13)
High Adoption
(n=13)
All (n=90)
Parcels ** 1
25.0 46.9 61.5 69.2 44.4 a
2 31.3 37.5 30.8 30.8 33.3
ab
3 31.3 15.6 7.7 0.0 17.8
b
4 and above 12.5 0.0 0.0 0.0 4.4
b
Total 100.0 100.0 100.0 100.0 100.0
Mean 2.3 1.7 1.5 1.3 1.7
Range 1-5 1-3 1-4 1-2 1-5
Farm size (ha) ** Less than 1.0
6.3 15.6 15.4 61.5 18.9 a
1.0-2.99 50.0 53.1 69.2 38.5 52.2
b
3.0-4.99 25.0 25.0 15.4 0.0 20.0
b
5.0 and above 18.8 6.3 0.0 0.0 8.9
b
Total 100.0 100.0 100.0 100.0 100.0
Mean 2.7 2.6 1.7 0.9 2.0
Range 0.25-7 0.5-11 0.25-3 0.25-2.6 0.25-11
Terrain (Degrees) ** Flat (0-3)
41.9 25.6 0.0 0.0 23.2 a
Gently sloping (3-8) 39.5 30.2 24.0 21.4 31.2
ab
Moderately rolling (8-18) 16.3 39.5 64.0 57.1 38.4 bc
Rolling (18-30) 2.3 4.7 8.0 14.3 5.6
bc
Steep (30-50) 0.0 0.0 4.0 7.1 1.6
c
Mean 5.9 11.9 10.8 12.6 10.4
Range 2-20 2-21 5-33 5-36 2-36
Ownership ** Owned
37.5 75.0 76.9 92.3 64.4 a
Partially owned 18.8 6.3 15.4 7.7 12.2
ab
Tenants 34.4 12.5 7.7 0.0 17.8
b
Leased 9.4 6.3 0.0 0.0 5.6
b
Total 100.0 100.0 100.0 100.0 100.0
** = significant at 1% Note: Means not sharing the same letters in a column differ significantly either at 5% and 1% level using Tukey HSD test.
Statistical results also clearly show the significant difference at 1% level between the mean rate of adoption between farmers cultivating less than 1 ha farm and those who have more than 1 ha farm. Tukey HSD test results also proved the influence of the topography on the level of adoption. This means that more intense adoption of SWC technologies is likely to be observed in steeper farms.

36
The mean farm slope among non-adopters and adopters group were significantly different at 1% level. Nevertheless, mean rate of adoption between flat and gently sloping farms were not significantly different at 5%. The results correspond to the observed trend in El Salvador that adoption of conservation practices and structure is tended to smaller and steeper farms (Bravo-Ureta et al., 2006). As can be seen in Table 7, majority of the adopters who implemented the NVS technology owned their farms. In contrast, the group of non-adopters were composed of tenants or is renting/leasing the farm parcels they till. The level of adoption within the ownership status group (partially owned, tenants, and leased) were found to be not significantly different from each other at 5% level. Similar observation was also seen between owned and partially owned farms. However, significant difference were observed among owned farms and tenanted farms, and between owned farms and leased farms. This finding seems to harmonize with other studies, for instance, the investments of stone terraces in Ethiopia (Gebremedhin and Swinton, 2003) and contour hedgerows in the Philippines which show that investment in SWC measures are more appealing to farmer-owners than non-owners (Cramb et al., 1999; Lapar and Pandey 1999).
8. CONCLUSIONS AND RECOMMENDATIONS The first objective of this study was to determine the level of investments in SWC measures in Claveria particularly the NVS, which is the technology firmly advocated by Landcare to make farming in uplands more sustainable. Based from the survey results, majority of the upland farmers in Claveria were adopters of this technology. About 64% of the sampled farmers established NVS in 43% of their farms in average. This is in contrast with the relative low extent of adoption reported by Kiel (1999), where only 17% of the sampled farmers had implemented contoured hedgerows with mean extent of 30%. In this manner, it can be concluded that there is a considerable increase in adoption in the site that could be attributed to the intensive Landcare program of conservation in the late 90’s and early 2000s. Though the external financial support had gradually decreased in mid-2000 and the extension services in Landcare activities were reduced in the late 2000s, the adoption seems to be steadily continuing in Claveria. The database of ICRAF proves the increase of adoption in Claveria, from around 75 hectares of established contours in 1996 and 300 hectares in1999 to approximately 2153 hectares in 2006. These data also show that the adoption of new introduced SWC technology is cannot be attained instantaneously at large scale. Instead, it is a gradual process and it may take time for large scale adoption (Bodnar et al., 2006). Farmers have a generally “to see is to believe” attitude, and that the introduced new technology need to be proven feasible prior to adoption. They need to be convinced first about the reliability of favorable outcomes of the technology before they will seriously invest in SWC (Napier et al., 1991). Thus, some farmers can take up to several years before they will totally adopt the technology and incorporate in their farming systems. Long-term technology dissemination program and farm demonstrations are therefore essential to show

37
the effectiveness of the introduced technology and that the expected benefits are truly reachable. The village approach in educating farmers was found as one of the valuable strategies in Landcare that motivates farmers in investing SWC. In general, upland farmers live in remote hilly areas and do not have much resource (i.e. lack of access to transportation and communication) to participate in educational programs that are typically held in centrally located areas. Thus, the setting-up of training programs and demonstration farms near to their villages has encouraged farmers to participate and eventually learn the new introduced technologies. Landcare have also provided farmers the privilege to know both the pros and cons of the technology. As was observed in the study site, adopters are aware not only about the positive traits of the NVS technology but also on the negative characteristics. As a result, they were not much surprised and disappointed when such problems occur in their farms. The simplicity of conservation practices is truly a key starting point for farmers to invest in SWC (Cramb and Culasero 2004). In view of the fact that some farmers in Claveria have spontaneously adopted the introduced technology without proper training in Landcare, it implies that the NVS technology is indeed a simple SWC measure. These findings reconfirm a conclusion of recent research that less demanding technology is appealing to farmers (Mercado et al., 2005). It has been also noted by some researchers that SWC measures are likely to be adopted if they can generate direct income to farmers (Amsalu and De Graaf, 2007; Kessler, 2006; Napier et al. 1991). A similar conclusion can be drawn here in which the adoption of enriched NVS system is primarily driven with both short and long-term economic perspectives. The second objective of this study was to examine the influence of farmers’ participation in the Landcare on the rate of adoption. The statistical evidence presented on this paper confirms the significant relation between the farmers’ involvement in Landcare (both status and length of participation) and the level of investments in SWC measures at 1% siginificance level. Farmers who have long-term involvement in Landcare and who are still active in a Landcare groups were those who have implemented the technology at good level of adoption. On the other hand, non-adopters and low adopters are mostly those who did not or participated only for a short-term in Landcare. Although some adopters were not Landcare members and not all Landcare members were adopters, the wide spectrum of adoption among current Landcare member (87%) and their high-level of adoption (33% are high adopters) suggest that being part of Landcare groups and active participation on its programs may induce farmers to use SWC technologies continuously. The third objective of this study was to verify other underlying factors - household and farm characteristics, on the level of adoption. Based from the results, it was found out that farmers’ socio-demographic characteristics do not always largely affect the level of investments in SWC technologies. Though adopters of contour hedgerow in Claveria are more likely to be younger, well-educated and full-time farmers, these household attributes were found to be complex within the farmers’ level of investments. Similarly, based on the

38
statistical results, household characteristics such as age, education, farming experience, family size, ethnic group, length of residency and source of income do not significantly influence the level of adoption. On the other hand, the physical characteristics of farms are found to be more important factors affecting the rate of adoption. Statistical results pointed out that the level of investment in SWC technologies is significantly influenced by the number of parcels, farm size, slope and land ownership at 1% level of significance. Farmers with fewer parcels are more likely to adopt SWC measures at higher level. Non-adoption of SWC technologies is likely in locations with larger and flatter farms because of the perceived vulnerability of land parcels to erosion problems. Land tenure security is another important factor that influences farmers’ decision with respect to adopting SWC and intensifying its adoption. Farmer-owners tend to invest more in SWC technologies than non-owners. Previous researches have also highlighted these similar findings (Cramb et al., 1999; Kessler, 2006; Lapar and Pandey 1999). Moreover, results claim that land tenure security favors the high-level and long-term conservation investments of farmers.
It is hoped that the findings presented above would help in formulating appropriate policies and strategies in promoting sustainable upland development. The above information and analysis suggest the need of empowering community-based organizations and institutions such as the Landcare groups, in order to successfully promote conservation undertakings among farmers. Strong commitment of local government agencies is also vital in sustaining the soil conservation programs in the area. This includes long-term technical support and continuous extension services to facilitate SWC technology development and dissemination. The study also provided a substantial evidence that changes of farming conditions could lead to discontinuance of adoption even to farmers who had long-term adoption (Cramb et al., 2000). For instance in Claveria, change of priorities and labour availability have resulted of NVS abolishment. In addition, some farmers are totally not familiar about the technology since they are new migrants in the area. Thus, continuous extension services are needed in response to the changing environment and conditions of upland farmers. To end with, it must be emphasized that this research is based on a limited number of farmer-respondents and farm observations from eight nearest barangays or villages in Claveria. Thus, a follow-up study with larger sample size might be needed to validate the preliminary results presented here. It would be necessary to include those remote barangays that were restricted in this study, to make more reliable generalizations. The findings could also serve as the starting point for further investigation on two related areas of research: first, investigating the long-term technical impact of the NVS technology; and second, assessing the economic or monetary contributions of the enriched NVS technology on the lives of the upland farmers. Understanding of these factors would improve our insights of why upland farmers adopt the NVS technology at different levels.
39
9. REFERENCES Amsalu, A., and De Graaff, J. (2007). Determinants of adoption and continued use of stone terraces for soil and water conservation in the Ethiopian highland watershed, Ecological Economics 61, 294 –302. Arcenas, A. (2002). Farmer-led soil conservation initiative in a developing country setting – the case of the Claveria Landcare Association. Ph.D. Thesis, Michigan State University, USA. Bodnar T., Schrader T. and Van Campen W. (2006). How project approach influences adoption of SWC by farmers, examples from Southern Mali, Land Degradation and Development 17, 479-494. Bravo-Ureta B., Cocchi H. and Solis D. (2006). Adoption of soil conservation technologies in El Salvador: A cross-section and over-time analysis. Office of Evaluation and Oversight, Working Paper 8. Catacutan, D.C. and Cramb, R.A. (2004), Scaling up soil conservation programs: The case of Landcare in the Philippines. (13th International Soil Conservation Organization Conference, Brisbane, Australia). Cramb, R.A. (2004). The role of social capital in the promotion of conseration farming: The case of Landcare in the southern Philippines. (13th International Soil Conservation Organization Conference, Brisbane, Australia). Cramb, R.A., Catacutan, D. Culasero-Arellano, Z. and Mariano, K. (2007). The ‘Landcare’ approach to soil conservation in the Philippines: an assessment of farm-level impacts, Australian Journal of Experimental Agriculture 47, 721–726. Cramb, R.A., Catacutan, D., Dano, N. and Vock, N. (2006). Landcare in the Southern Philippines: Past, present and future, Philippine-Australia Landcare Project, Working Paper 8. Cramb R.A. and Culasero, Z. (2004). Landcare and livelihoods: The promotion and adoption of conservation farming systems in the Philippines, International Journal of Agricutural Sustainability. Cramb R.A., Garcia J.N.M., Gerrits R.V., and Saguiguit G.C. (1999). Smallholder adoption of soil conservation technologies: Evidence from upland projects in the Philippines. Land Degradation & Development 10, 405-423. Cramb R.A., Garcia J.N.M., Gerrits R.V., and Saguiguit G.C. (2000). Conservtion farming projects in the Philippine uplands: Rhetoric and reality. World Development Vol. 28, No. 5, 911-927. Daño A. M. and Siapno F. E. (1992). The effectiveness of soil conservation structures in steep cultivated mountain regions of the Philippines, Erosion, Debris flows and Environment in Mountain Regions (Proceedings of the Chengdu Symposium, July 1992). IAHS Publ. no. 209.

40
De Graaff, J., Amsalu, A., Bodnar, F., Kessler, A., Posthumus, H. and Tenge, A., (2008). Factors influencing adoption and continued use of long-term soil and water conservation measures in five developing countries. Applied Geography 28, 271-280. Ervin C.A. and Ervin D.E. (1982). Factors Affecting the Use of Soil Conservation Practices: Hypotheses, Evidence, and Policy Implications, Land Economics 58, No. 3, 277-292. Food and Agriculture Organization (2010), Land Degradation Assessment in Drylands, Available at: http://www.fao.org/nr/land/degradation/en/ (Accessed: 28 April 2010). Garrity, P.D. (1999) Contour farming based on natural vegetative strips: Expanding the scope for increased food crop production in sloping lands in Asia. Environment, Development and sustainability 1, 3-4. Gebremedhin, B. and Swinton S.M. (2003). Investment in soil conservation in northern Ethiopia: The role of land tenure security and public programs. Agricultural Economics 29, 69-84. Keil A. (1999). Soil degradation & conservation in the uplands of the humid tropics: A case of study of the adoption of & experiences with contour hedgerows & natural vegetative filter strips in Claveria, Philippines. MSc thesis, Gesamthochschule Universitat Kassel, Germany. Kessler, C.A. (2006). Decisive key-factors influencing farm households’ soil and water conservation investments. Applied Geography 26, 40-60. Lapar, L.A. and Pandey, S. (1999). Adoption of soil conservation: The case of the Philippine uplands. Agricultural Economics 21, 241-256. Mercado A.R., Catacutan D.C., Stark M., Laotoco M.A.C., Lasco R., and Banaticla M.R. (2005). Enhancing adoption of soil conservation practices through technical and institutional innovation: NVS and Landcare. (Symposium on Sustainable Agricultural Development of Marginal Upland Areas in the Philippines, BSWM, Quezon City, Philippines). Mercado, A.R., Garrity D.P., Sanchez N., and Laput L. (1999). Appropriate spacing of natural vegetative filter strips in upland conservation farming systems. (15th Annual Scientific Conference of the Federation of Crop Science Societies of the Philippines, General Santos City, Philippines). Mercado, A.R., Patindol, M., and Garrity, D.P. (2001). The landcare experience in the Philippines: technical and institutional innovations for conservation farming. Development in Practice 11, 495-508.
41
Merritt, W.S., Letcher, R.A. and Jakeman, A.J. (2003). A review of erosion and sediment transport model. Environmental Modelling & Software 18, 761-799 Metcalfe, J., ed. (2004). Landcare in the Philippines: Stories of people and places. ACIAR Monograph 112. Morgan, R.P.C. (2005), Soil erosion and Conservation, 3rd Edition, National Soil Resources Institute, Cranfield University Napier T.L., Napier A.S. and Tucker M.A. (1991), The social, economic and institutional factors affecting adoption of soil conservation practices: the Asian experience. Soil and Tillage Research, 20: 365-382. National Statistic Office (2007), Census of Population, Available at: http://www.census.gov.ph/data/census2007/index.html, (Accessed: 29 March 2010) Newby, J.C. and Cramb, R.A. (2009), Living on the margin: Assessing the economic impacts of Landcare in the Philippine uplands. 53rd Annual Conference, Australian Agricultural and Resource Economics Society. Paningbatan, E.P., Ciesiolka, Coughlan, K. J., and Rose, C. W. (1995). Alley cropping for managing soil erosion of hilly lands in the Philippines. Soil Technology 8, 193-204. Presbitero, A. L., Escalante,M.C., Rose, C.W. , Coughlan, K.J. and Ciesiolka, C.A. (1995). Erodibility evaluation and the effect of land management practices on soil erosion from steep slopes in Leyte, the Philippines, Soil Technology 8, 205-213. Rogers, E.M. (1995). Categorizing the adopters of agricultural practices. Rural Sociology 23, 345-354. Wolfswinkel van, L. (2010). The role of social capital in the self-sustaining ability of farmer-led-movements: The case of Landcare in Claveria, Southern Philippines. MSc thesis, Wageningen University, Wageningen, The Netherlands.
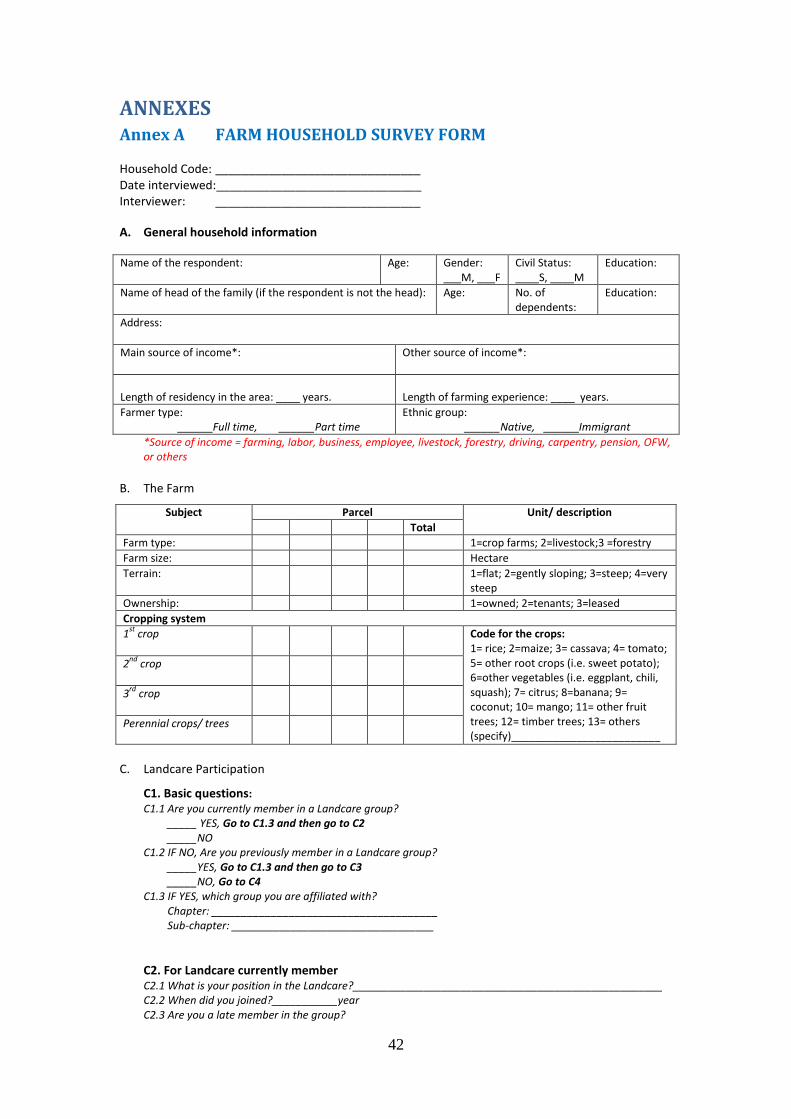
42
ANNEXES Annex A FARM HOUSEHOLD SURVEY FORM Household Code: _______________________________ Date interviewed:_______________________________ Interviewer: _______________________________
A. General household information
Name of the respondent:
Age: Gender: ___M, ___F
Civil Status: ____S, ____M
Education:
Name of head of the family (if the respondent is not the head):
Age: No. of dependents:
Education:
Address:
Main source of income*:
Other source of income*:
Length of residency in the area: ____ years.
Length of farming experience: ____ years.
Farmer type: ______Full time, ______Part time
Ethnic group: ______Native, ______Immigrant
*Source of income = farming, labor, business, employee, livestock, forestry, driving, carpentry, pension, OFW, or others
B. The Farm
Subject Parcel Unit/ description
Total
Farm type: 1=crop farms; 2=livestock;3 =forestry
Farm size: Hectare
Terrain: 1=flat; 2=gently sloping; 3=steep; 4=very steep
Ownership: 1=owned; 2=tenants; 3=leased
Cropping system
1st
crop
Code for the crops: 1= rice; 2=maize; 3= cassava; 4= tomato; 5= other root crops (i.e. sweet potato); 6=other vegetables (i.e. eggplant, chili, squash); 7= citrus; 8=banana; 9= coconut; 10= mango; 11= other fruit trees; 12= timber trees; 13= others (specify)_________________________
2nd
crop
3rd
crop
Perennial crops/ trees
C. Landcare Participation
C1. Basic questions:
C1.1 Are you currently member in a Landcare group? _____ YES, Go to C1.3 and then go to C2 _____NO
C1.2 IF NO, Are you previously member in a Landcare group? _____YES, Go to C1.3 and then go to C3 _____NO, Go to C4
C1.3 IF YES, which group you are affiliated with? Chapter: ______________________________________ Sub-chapter: __________________________________
C2. For Landcare currently member C2.1 What is your position in the Landcare?____________________________________________________ C2.2 When did you joined?___________year C2.3 Are you a late member in the group?
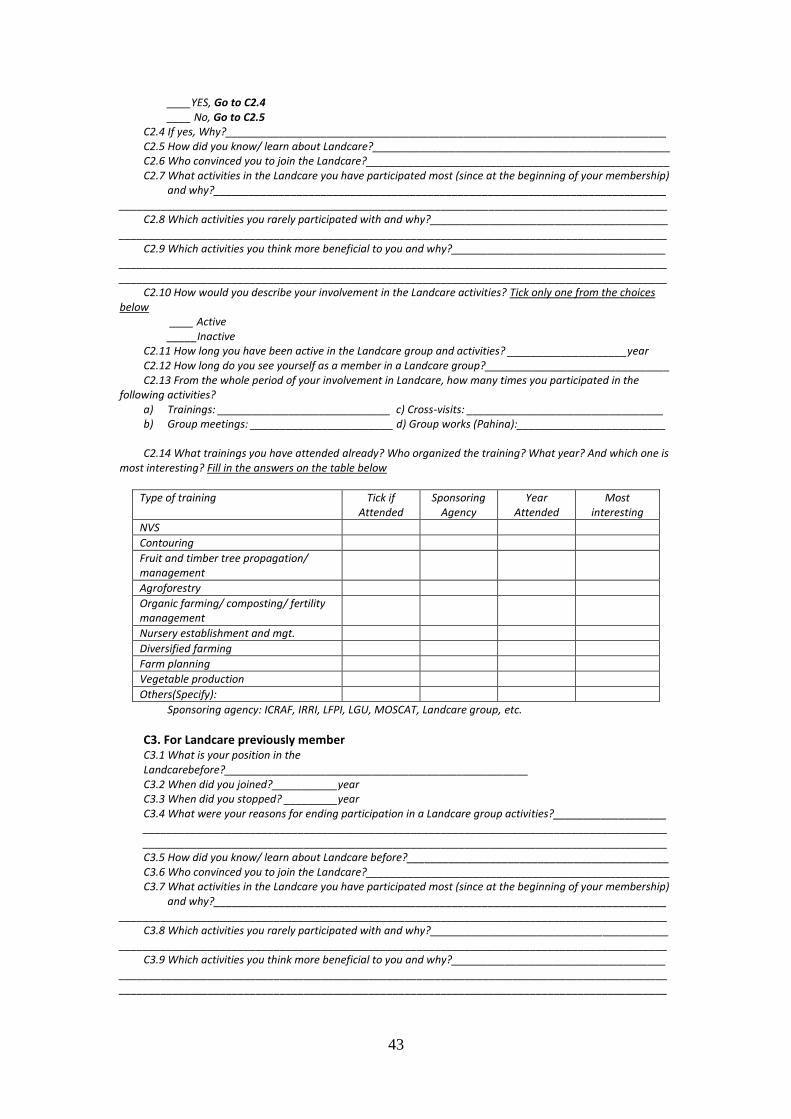
43
____YES, Go to C2.4 ____ No, Go to C2.5 C2.4 If yes, Why?__________________________________________________________________________ C2.5 How did you know/ learn about Landcare?__________________________________________________ C2.6 Who convinced you to join the Landcare?___________________________________________________ C2.7 What activities in the Landcare you have participated most (since at the beginning of your membership)
and why?____________________________________________________________________________ ____________________________________________________________________________________________
C2.8 Which activities you rarely participated with and why?________________________________________ ____________________________________________________________________________________________
C2.9 Which activities you think more beneficial to you and why?____________________________________ ________________________________________________________________________________________________________________________________________________________________________________________
C2.10 How would you describe your involvement in the Landcare activities? Tick only one from the choices below
____ Active _____Inactive
C2.11 How long you have been active in the Landcare group and activities? ____________________year C2.12 How long do you see yourself as a member in a Landcare group?_______________________________ C2.13 From the whole period of your involvement in Landcare, how many times you participated in the
following activities? a) Trainings: _____________________________ c) Cross-visits: _________________________________ b) Group meetings: ________________________ d) Group works (Pahina):_________________________
C2.14 What trainings you have attended already? Who organized the training? What year? And which one is
most interesting? Fill in the answers on the table below
Type of training Tick if Attended
Sponsoring Agency
Year Attended
Most interesting
NVS
Contouring
Fruit and timber tree propagation/ management
Agroforestry
Organic farming/ composting/ fertility management
Nursery establishment and mgt.
Diversified farming
Farm planning
Vegetable production
Others(Specify):
Sponsoring agency: ICRAF, IRRI, LFPI, LGU, MOSCAT, Landcare group, etc.
C3. For Landcare previously member C3.1 What is your position in the Landcarebefore?___________________________________________________ C3.2 When did you joined?___________year C3.3 When did you stopped? _________year C3.4 What were your reasons for ending participation in a Landcare group activities?___________________ ________________________________________________________________________________________________________________________________________________________________________________ C3.5 How did you know/ learn about Landcare before?____________________________________________ C3.6 Who convinced you to join the Landcare?___________________________________________________ C3.7 What activities in the Landcare you have participated most (since at the beginning of your membership)
and why?____________________________________________________________________________ ____________________________________________________________________________________________
C3.8 Which activities you rarely participated with and why?________________________________________ ____________________________________________________________________________________________
C3.9 Which activities you think more beneficial to you and why?____________________________________ ________________________________________________________________________________________________________________________________________________________________________________________
44
C3.10 How would you describe your involvement in the Landcare activities? Tick only one from the choices below
____ Active _____Inactive
C2.11 How long you have been active in the Landcare group and activities? ____________________year C3.12 Are you still aware with current activities of the Landcare?_____YES, ____NO C3.13 If Yes or No, why? ____________________________________________________________________ C3.14 Are you interested to join again in a Landcare group and activities in the future?_____Yes, ____No C3.15 What makes you to join again in the Landcare group and ctivities?_____________________________
____________________________________________________________________________________________ C3.16 From the whole period of your involvement in Landcare before, how many times you participated in
the following activities? a) Trainings: _____________________________ c) Cross-visits:_ _________________________________ b) Group meetings: ________________________d) Group works (Pahina):__________________________ C3.17 What trainings you have attended already? Who organized the training? What year? And which one is
most interesting? Fill in the answers on the table below
Type of training Tick if Attended
Sponsoring Agency
Year Attended
Most interesting
NVS
Contouring
Fruit and timber tree propagation/ management
Agroforestry
Organic farming/ composting/ fertility management
Nursery establishment and mgt.
Diversified farming
Farm planning
Vegetable production
Others(Specify):
Sponsoring agency: ICRAF, IRRI, LFPI, LGU, MOSCAT, Landcare group, etc.
C4. For Landcare non-member C4.1What is your perception about Landcare?___________________________________________________ ________________________________________________________________________________________ C4.2 How did you know/ learn about Landcare?__________________________________________________ C4.3 What were your reasons for not joining Landcare?___________________________________________
________________________________________________________________________________________________________________________________________________________________________________________
C4.4 Are you aware with the current activities of the Landcare?_____YES, ____NO C4.5 If Yes or No, why? _____________________________________________________________________ C4.6 Are you interested to join in a Landcare group and activities in the future?_____Yes, ____No C4.7 What makes you to join in the Landcare group and ctivities in the future?_________________________
____________________________________________________________________________________________
D. Investment in soil and water conservation technologies D1. Basic questions D1.1 Did you established NVS/ hedgerows on your farm?
_____ YES, Go to D2 _____ NO, Go to D3
D2. For NVS Adopters D2.1 When did you established your NVS/ hedgerows? _______ year D2.2 What is the percentage of your farm have you established with NVS or hedgerows, approximately?
________% or __________hectare (coverage area with NVS) D2.3 Do you maintain all your NVS/hedgerows? ____ YES, Go to D2.6 ____ NO

45
D2. 4 IF NO, What percentage of your NVS/ hedgerows do you currently maintain? ______ % (approximate) D2.5 Why some of your NVS/ hedgerows were not currently maintained?_____________________________
____________________________________________________________________________________________ D2.6 Why did you established NVS/ hedgerows? ________________________________________________
___________________________________________________________________________________________ D2.7 What were your initial expectations in establishing NVS/ hedgerows?___________________________
____________________________________________________________________________________________ D2.8 Were your expectations met/achieved? _____ YES, _____ NO D2.9 IF YES or NO, why?_____________________________________________________________________ D2.10 How did you know/ learn NVS/ hedgerows? _______________________________________________
____________________________________________________________________________________________ D2.11 Who convinced you to established NVS/ hedgerows? ________________________________________ D2.12 How did you established the NVS? _______________________________________________________
____________________________________________________________________________________________ D2.13 How do you maintain your established NVS/ hedgerows?_____________________________________
____________________________________________________________________________________________ D2.14 Have you planted forage grasses on the NVS/ hedgerows?
_____ YES _____ NO, Go to D2.17 D2.15 IF YES, What forage grasses have you planted on your NVS/ hedgerows?________________________
____________________________________________________________________________________________ D2.16 Why did you planted these forage grasses on your NVS/ hedgerows? ___________________________
____________________________________________________________________________________________ D2. 17 IF NO, Do you have plan to plant forage grasses in the future and why? ________________________
____________________________________________________________________________________________ D2.18 Have you planted perennial crops on your NVS/ hedgerows i.e. pineapple, banana, abaca? _____ YES _____ NO, Go to D2.21 D2.19 IF YES, What perennial crops have you planted on your NVS/ hedgerows?________________________
____________________________________________________________________________________________ D2.20 Why did you planted perennial crops on your NVS/ hedgerows? _______________________________
____________________________________________________________________________________________ D2.21 IF NO, Do you have plan to plant perennial crops in the future and why? ________________________
____________________________________________________________________________________________ D2.22 Have you planted fruit or timber trees on your NVS/ hedgerows i.e. lanzones, rambutan, durian, etc.? _____ YES _____ NO, Go to D2.27 D2.23 IF YES, What trees have you planted on your NVS/ hedgerows?________________________________
____________________________________________________________________________________________ D2.24 Why did you planted these trees on your NVS/ hedgerows? ___________________________________
____________________________________________________________________________________________ D2. 25 Have you already harvested some of the timber trees? _____ YES _____ NO, Go to D2.27 D2.26 IF YES, Did you replaced them?_____ YES, _____NO D2.27 IF NO, Do you have plan to plant fruit or timber trees in the future and why? _____________________
____________________________________________________________________________________________ D2.28 What negative effects of NVS/ hedgerows you observed on your farm? _________________________
____________________________________________________________________________________________ D2. 29 What positive effects of NVS/ hedgerows you observed on your farm?__________________________
____________________________________________________________________________________________ D2. 30 What crops do you grow in the alleys (between NVS)? ______________________________________
____________________________________________________________________________________________ D2.31 Do the NVS have any negative effects on your crops in the alleys?______________________________
____________________________________________________________________________________________ D2.32 What is the space distance in between your established NVS/ hedgerows? _________________ meter D2.33 How many contour lines have you established with NVS/ hedgerows? __________________________ D2.34 What is the range length of your established NVS/ hedgerows? ___________________________meter D2.35 Did you ever have NVS/ hedgerows before and abolished them? _____ YES _____ NO, Go to D2.37 D2.36 Why did you abolished some of your NVS?_________________________________________________
____________________________________________________________________________________________

46
D2. 37 How long do you intend to maintain the established NVS? ___________________________________ D2. 38 Do you have any plan to establish NVS in the rest of your plot currently untreated? ______YES ______NO D2.39 IF YES or NO, why? ___________________________________________________________________
____________________________________________________________________________________________ D2.40 What other SWC technologies you are practicing on your farm? _______________________________
____________________________________________________________________________________________ D2.41 What were your reasons of applying these technologies? ____________________________________
____________________________________________________________________________________________
D3. For NVS Non-adopters
D3. 1 What is your perception about NVS/ hedgerows? ___________________________________________ ____________________________________________________________________________________________
D3.2 How did you know/ learn NVS/ hedgerows? ________________________________________________ ____________________________________________________________________________________________
D3.3 Who convinced you to established NVS/ hedgerows? _________________________________________ D3.4What were your reasons of not establishing NVS/ hedgerows on your farm?_______________________
____________________________________________________________________________________________ D3.4 Do you have plans to establish NVS/ hedgerows on your farm?
_____YES, _____NO, Go to D3.6
D3.5 IF YES, why and within what period of time? ________________________________________________ ____________________________________________________________________________________________
D3.6 IF NO why?__________________________________________________________________________ ____________________________________________________________________________________________
D3.7 Do you practice other SWC practices excluding NVS/ hedgerows? _____ YES _____ NO, Go to D3.9 D3. 8 What SWC technologies you are practicing on your farm? ___________________________________
____________________________________________________________________________________________ D3.9 What were your reasons of applying these technologies? _____________________________________
___________________________________________________________________________________________
E. Farmers perception (Indicate whether the farmers strongly agree, agree, not sure, disagree or strongly disagree with the following statements)
Statement Strongly disagree
Disagree Not sure
Agree Strongly agree
1. Soil erosion is a problem in my farm 15 years ago.
2. Soil erosion is still a problem in my farm for the past two years.
3. I know the factors that cause soil erosion and its negative impact.
4. Soil erosion can be mitigated by investing SWC technologies.
5. NVS/ hedgerows can effectively mitigate soil erosion.
6. Occurrence of soil erosion in my farm has become rare because of the established NVS/ hedgerows.
7. Soil fertility in my farm was improved because of the established NVS/ hedgerows.
8. The crop production in my farm has improved because of the established NVS/ hedgerows.
9. I am fully satisfied with the results/ outcomes of my established NVS/ hedgerows.
10. I am already fully aware about SWC practices and so I am not interested anymore in joining any SWC related project in the future.
47
F. Field observations (to be filled up by the observer during field visits): F1. What is the actual coverage area of established NVS? ______________________hectares (approximate) F2. What percentage of the NVS currently maintained by the farmer?___________________%(approximate) F3. What is the quality of NVS? _________________%vegetation cover, _________________% collapse NVS F4. How the farmer maintained the NVS?_______________________________________________________
____________________________________________________________________________________________ F5. What perennial crops or trees planted on the NVS?____________________________________________
____________________________________________________________________________________________ F6. How the perennial crops or trees planted? __________________________________________________
____________________________________________________________________________________________ F7. How many contour lines established with NVS (count)? ________________________________________ F8. What is the range length of established NVS? _____________________________ meters (approximate) F9. What is the space of the established NVS (average)? _______________________ meters (approximate) F10. What is the vertical distance between hedgerows (average)? ________________meters (approximate) F11. What is the slope of the farm established with NVS/ hedgerows (use inclinometer)?____(% or degrees) F12. What is the elevation range of the farm (use GPS)? ____________________________________m.s.l. F13. What crops the farmer grows in the alleys? _________________________________________________ F14. What other SWC practices the farmer applied in the field? ____________________________________
____________________________________________________________________________________________ F15. Other observations: ____________________________________________________________________
____________________________________________________________________________________________________________________________________________________________________________________________________________________________________________________________________________________
G. Farm Sketch (If the farm was not documented by photographs, please sketch how the farm looks like on the next page)
H. Comments/ Remarks: ____________________________________________________________________________________________________________________________________________________________________________________________________________________________________________________________________________________
Thank you for your cooperation!!!

48
Annex B STATISTICAL RESULTS B.1 ANOVA results
Variables Sum of
Squares df Mean
Square F Sig.
Involvement in Landcare (Years)
Between Groups 29.0 3 9.7 12.3 <0.01
Within Groups 67.4 86 0.8
Total 96.5 89
Status in Landcare Between Groups 18.5 2 9.2 10.3 <0.01
Within Groups 78.0 87 0.9
Total 96.5 89
Age Between Groups 0.7 3 0.2 0.2 ns
Within Groups 95.7 86 1.1
Total 96.5 89
Years of Education Between Groups 3.5 3 1.2 1.1 ns
Within Groups 93.0 86 1.1
Total 96.5 89
Ethnic Group Between Groups 1.4 1 1.4 1.3 ns
Within Groups 95.0 88 1.1
Total 96.5 89
Family Size Between Groups 0.3 2 0.2 0.2 ns
Within Groups 96.1 87 1.1
Total 96.5 89
Length of Residency Between Groups 2.5 3 0.8 0.7 ns
Within Groups 94.0 86 1.1
Total 96.5 89
Farmer Type Between Groups 3.2 1 3.2 3.0 ns
Within Groups 93.3 88 1.1
Total 96.5 89
Yrs Farming Experience Between Groups 0.4 3 0.1 0.1 ns
Within Groups 96.0 86 1.1
Total 96.5 89
No. of Parcels Between Groups 16.8 3 5.6 6.0 <0.01
Within Groups 79.7 86 0.9
Total 96.5 89
Farm Size Between Groups 21.2 3 7.1 8.1 <0.01
Within Groups 75.2 86 0.9
Total 96.5 89
Farm Slope Between Groups 18.5 4 4.6 5.0 <0.01
Within Groups 77.9 85 0.9
Total 96.5 89
Ownership Between Groups 16.6 3 5.5 6.0 <0.01
Within Groups 79.8 86 0.9
Total 96.5 89

49
B.2. Tukey HSD test results 2.1. Multiple comparisons of the rate of adoption across the level and status of involvement in Landcare using Tukey HSD Test
Dependent Variable
Involvement in Landcare Mean
Difference Std. Error Sig.
Level of Adoption
No Participation Short 0.07 0.25 ns
No Participation Intermediate 1.12 0.26 <0.01 No Participation Long 1.13 0.27 <0.01 Short Intermediate 1.18 0.27 <0.01 Short High 1.20 0.28 <0.01 Intermediate High 0.01 0.29 ns
Level of Adoption
Non Member Former Member 0.27 0.24 ns
Non Member Current Member 1.07 0.24 <0.01 Former Member Current Member 0.80 0.24 <0.01
2.2 Multiple comparisons of the rate of adoption across farm characteristics
Farm characteristics
Variables Mean
Difference Std. Error Sig.
No. of Parcels
1 parcel 2 parcels 0.38 0.23 ns
1 parcel 3 parcels 1.01 0.28 <0.01 1 parcel 4 and above 1.45 0.50 <0.05 2 parcels 3 parcels 0.63 0.30 ns 2 parcels 4 and above 1.07 0.51 ns 3 parcels 4 and above 0.44 0.54 ns
Farm Size
> 1 ha 1 – 2.99 ha 0.88 0.26 <0.01
> 1 ha 3 – 4.99 ha 1.27 0.32 <0.01 > 1 ha 5 and above 1.69 0.40 <0.01 1 – 2.99 ha 3 – 4.99 ha 0.40 0.26 ns 1 – 2.99 ha 5 and above 0.81 0.36 ns 3 – 4.99 ha 5 and above 0.42 0.40 ns
Ownership
Owned Partially owned 0.55 0.31 ns
Owned Tenants 1.00 0.27 <0.01 Owned Leased 1.13 0.50 0.05 Partially owned Tenants 0.46 0.37 ns Partially owned Leased 0.58 0.56 ns Tenants Leased 0.13 0.54 ns
Farm Slope
Flat Gently 0.66 0.34 ns
Flat Moderate rolling 1.26 0.34 <0.01 Flat Rolling 0.97 0.49 0.05 Flat Steep 2.30 0.74 <0.01 Gently Moderate rolling 0.59 0.23 ns Gently Rolling 0.30 0.42 ns Gently Steep 1.64 0.70 0.05 Moderate rolling Rolling 0.29 0.42 ns Moderate rolling Steep 1.04 0.70 ns Rolling Steep 1.33 0.78 ns