Investment Style Risk Premiums as a Source for Excess Returns
13
Indeed, to date many of these new indices have done very well. However, it is crucial to understand what really drives the excess returns of these alternative weighting benchmarks. These indices are not driven by anything novel, but by exposures to well-known risk factors like value, momentum or low volatility. As such, these new weighting benchmarks are just an- other way of harvesting the risk premiums attached to these risk factors. Harvesting risk premium is still a rather new approach to equity investing. In asset classes like fixed income or currencies, though, it is common to think of investing in these terms. For example, fixed income investors extend the duration of portfolios to capture the term premium in fixed income, or add to corporates and high yields to earn the credit premium. Foreign ex- change (FX) investors exploit the FX carry premium by going long high-yielding currencies and shorting low- yielding currencies. In all these examples, investors take extra risk and expect to be compensated by means of additional return. The chart below shows common premiums by asset class. us.allianzgi.com Investment Style Risk Premiums as a Source for Excess Returns Smart Beta Investing and AllianzGI Best Styles Executive Summary Smart beta investing in equities is gaining traction among institutional investors. Proponents of smart beta indices, like the RAFI fundamentally-weighted indices or MSCI Minimum Volatility Indices, argue that investors can do better than traditional capitalization-weighted indices by using alternative weighting formula. March 2015 Harvesting risk premiums is a common investment strategy for many asset classes Risk Premium Strategies Equity Strategies Arbitrage Strategies Fixed Income Strategies Currency Strategies ... High Yield Premium Credit Premium Term Premium ... Momentum Strategy Value Strategy Carry Strategy ... Volatility Arbitrage Convertible Arbitrage Merger Arbitrage ... Low Volatility Strategy Momentum Strategy Value Strategy
Transcript of Investment Style Risk Premiums as a Source for Excess Returns

Indeed, to date many of these new indices have done very well. However, it is crucial to understand what really drives the excess returns of these alternative weighting benchmarks. These indices are not driven by anything novel, but by exposures to well-known risk factors like value, momentum or low volatility. As such, these new weighting benchmarks are just an-other way of harvesting the risk premiums attached to these risk factors.
Harvesting risk premium is still a rather new approach to equity investing. In asset classes like fixed income or
currencies, though, it is common to think of investing in these terms. For example, fixed income investors extend the duration of portfolios to capture the term premium in fixed income, or add to corporates and high yields to earn the credit premium. Foreign ex-change (FX) investors exploit the FX carry premium by going long high-yielding currencies and shorting low-yielding currencies. In all these examples, investors take extra risk and expect to be compensated by means of additional return. The chart below shows common premiums by asset class.
us.allianzgi.com
Investment Style Risk Premiums as a Source for Excess Returns Smart Beta Investing and AllianzGI Best Styles
Executive Summary
Smart beta investing in equities is gaining traction among institutional investors. Proponents of smart beta indices, like the RAFI fundamentally-weighted indices or MSCI Minimum Volatility Indices, argue that investors can do better than traditional capitalization-weighted indices by using alternative weighting formula.
March 2015
Harvesting risk premiums is a common investment strategy for many asset classes
Risk Premium Strategies
Equity Strategies Arbitrage StrategiesFixed Income StrategiesCurrency Strategies
...
High Yield Premium
Credit Premium
Term Premium
...
Momentum Strategy
Value Strategy
Carry Strategy
...
Volatility Arbitrage
Convertible Arbitrage
Merger Arbitrage
...
Low Volatility Strategy
Momentum Strategy
Value Strategy

Investment Style Risk Premiums as a Source for Excess Returns
2
Risk premiums within equities include the value premium, the mo-mentum premium, the small cap premium or the low-volatility premium. For example, value stocks, such as those with a low price/book-ratio, are typically less profitable, more leveraged and more cyclical than other stocks.
The existence of these premiums is well documented in academic literature. The chart above shows the development over the last thirty years of the source of returns in an equity portfolio.
In the 1980s, the days of the traditional Capital Asset Pricing Model (CAPM), the active return of a portfolio manager (i.e. the relative return of the portfolio manager versus the benchmark) was decom-posed into a market component related to the market beta of the portfolio and an alpha component attributed to the skills of the portfolio manager.
Then, in the 1990s, Eugene Fama and Kenneth French extended the CAPM and introduced two additional betas related to the value and small cap exposure of the manager. Fama received the Nobel Me-morial Prize in Economics last year for the discovery that the stock market is actually composed of several sub-segments like value stocks or small caps that can carry their own risk premiums above and beyond the premium for the stock market as a whole. This is similar in fixed income where the corporate spread represents an additional risk premium on top of the risk premium for treasuries.
Ten years later the concept of risk premiums within the equity markets was further refined and extended to other investment styles like momentum and growth.
Investment style risk premiums can drive active equity returns, and excess return opportunities have not disappeared over the course of the last thirty years. However, it has been discovered that the role of alpha may be smaller than previously thought and a larger chunk of performance may come from the tailwinds that investment styles can provide.
Equity risk premiums as the DNA of active equity portfolio returnsWe believe equity risk premiums are the DNA of active equity portfolio returns and should be at the heart of an investment process, not simply a byproduct. As proponents of this approach, we think smart beta investing is a sound, simple starting point. However, typical smart beta indices are not explicitly designed to harvest such risk premiums in the most efficient way, but we believe they are designed more for simplicity.
For example, the RAFI fundamental indices weight each stock in proportion to its fundamentals (such as earnings or book values) and not in proportion to its market capitalization, like traditional indices. As a consequence, stocks with large earnings or book values relative to market capitalisation are overweight in fundamen-tally weighted indices relative to market cap weighted indices. This may create a value bias and makes the RAFI fundamental indices essentially value indices in disguise. Another criticism of simple value strategies is that they are biased towards financially distressed companies. As many studies typically show, the value premium may be earned more efficiently by avoiding the cheap stocks of distressed companies.
Active Returns
Excess Market
Beta
AlphaAlpha
Value Beta
Small Cap Beta
Excess Market
Beta
Excess Market
Beta
Alpha
Value BetaSmall Cap Beta
Quality BetaGrowth Beta
Revisions BetaMomentum Beta
= = =
Smart Betas
1980s 1990s 2000s
Source: MSCI and Allianz Global Investors.
Investment Style Risk Premiums as a Source for Excess Returns
3
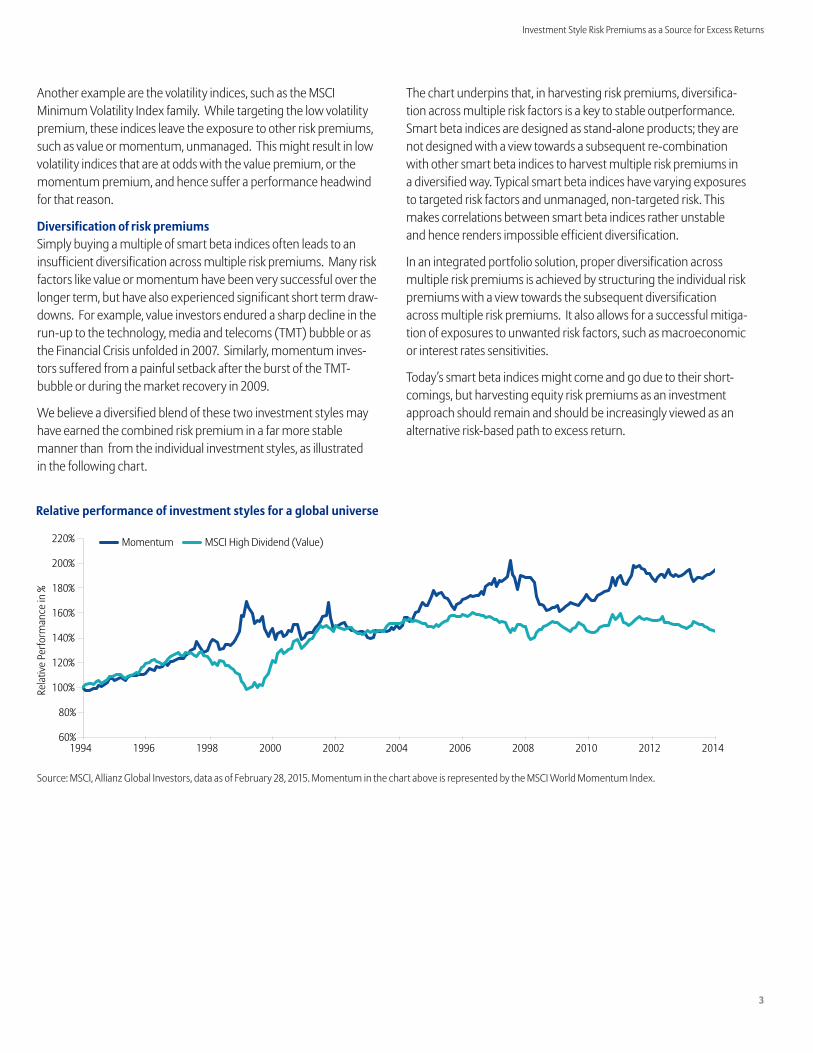
Another example are the volatility indices, such as the MSCI Minimum Volatility Index family. While targeting the low volatility premium, these indices leave the exposure to other risk premiums, such as value or momentum, unmanaged. This might result in low volatility indices that are at odds with the value premium, or the momentum premium, and hence suffer a performance headwind for that reason.
Diversification of risk premiumsSimply buying a multiple of smart beta indices often leads to an insufficient diversification across multiple risk premiums. Many risk factors like value or momentum have been very successful over the longer term, but have also experienced significant short term draw-downs. For example, value investors endured a sharp decline in the run-up to the technology, media and telecoms (TMT) bubble or as the Financial Crisis unfolded in 2007. Similarly, momentum inves-tors suffered from a painful setback after the burst of the TMT- bubble or during the market recovery in 2009.
We believe a diversified blend of these two investment styles may have earned the combined risk premium in a far more stable manner than from the individual investment styles, as illustrated in the following chart.
The chart underpins that, in harvesting risk premiums, diversifica-tion across multiple risk factors is a key to stable outperformance. Smart beta indices are designed as stand-alone products; they are not designed with a view towards a subsequent re-combination with other smart beta indices to harvest multiple risk premiums in a diversified way. Typical smart beta indices have varying exposures to targeted risk factors and unmanaged, non-targeted risk. This makes correlations between smart beta indices rather unstable and hence renders impossible efficient diversification.
In an integrated portfolio solution, proper diversification across multiple risk premiums is achieved by structuring the individual risk premiums with a view towards the subsequent diversification across multiple risk premiums. It also allows for a successful mitiga-tion of exposures to unwanted risk factors, such as macroeconomic or interest rates sensitivities.
Today’s smart beta indices might come and go due to their short-comings, but harvesting equity risk premiums as an investment approach should remain and should be increasingly viewed as an alternative risk-based path to excess return.
Source: Allianz Global Investors.
Momentum MSCI High Dividend (Value)
60%
80%
100%
120%
140%
160%
180%
200%
220%
1994 1996 1998 2000 2002 2004 2006 2008 2010 2012 2014
Rela
tive
Perfo
rman
ce in
%
Relative performance of investment styles for a global universe
Source: MSCI, Allianz Global Investors, data as of February 28, 2015. Momentum in the chart above is represented by the MSCI World Momentum Index.
Investment Style Risk Premiums as a Source for Excess Returns
4
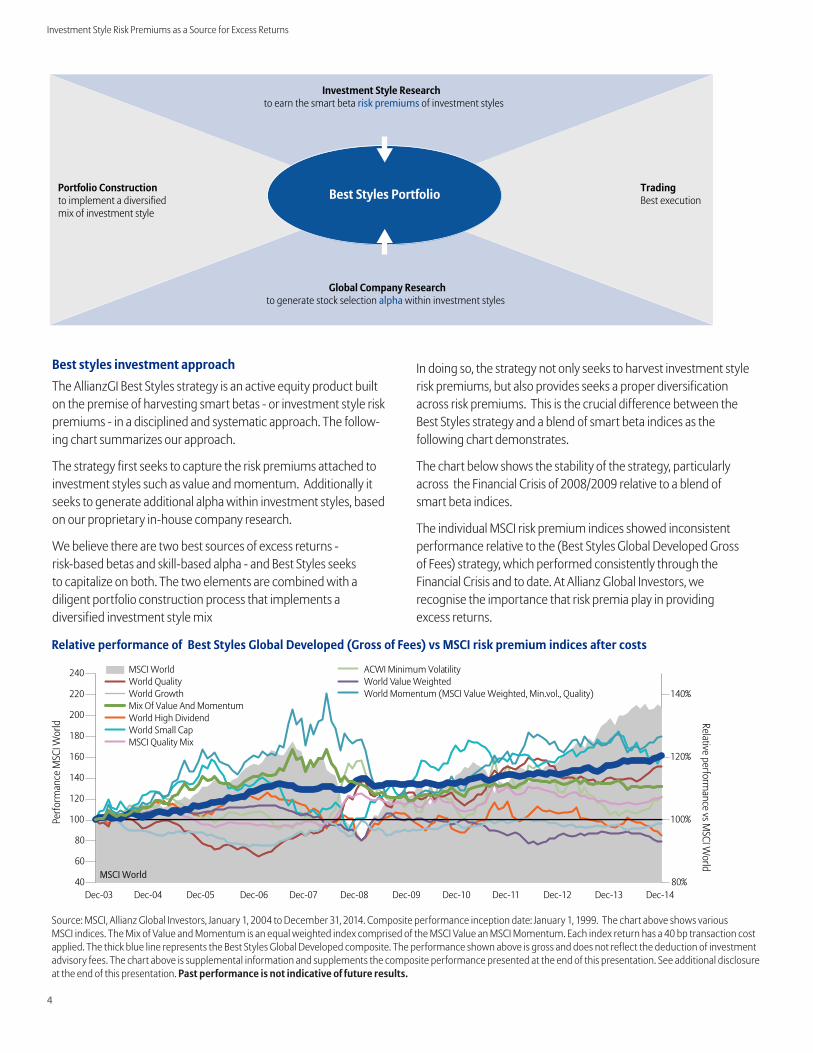
Best styles investment approachThe AllianzGI Best Styles strategy is an active equity product built on the premise of harvesting smart betas - or investment style risk premiums - in a disciplined and systematic approach. The follow-ing chart summarizes our approach.
The strategy first seeks to capture the risk premiums attached to investment styles such as value and momentum. Additionally it seeks to generate additional alpha within investment styles, based on our proprietary in-house company research.
We believe there are two best sources of excess returns - risk-based betas and skill-based alpha - and Best Styles seeks to capitalize on both. The two elements are combined with a diligent portfolio construction process that implements a diversified investment style mix
In doing so, the strategy not only seeks to harvest investment style risk premiums, but also provides seeks a proper diversification across risk premiums. This is the crucial difference between the Best Styles strategy and a blend of smart beta indices as the following chart demonstrates.
The chart below shows the stability of the strategy, particularly across the Financial Crisis of 2008/2009 relative to a blend of smart beta indices.
The individual MSCI risk premium indices showed inconsistent performance relative to the (Best Styles Global Developed Gross of Fees) strategy, which performed consistently through the Financial Crisis and to date. At Allianz Global Investors, we recognise the importance that risk premia play in providing excess returns.
Global Company Researchto generate stock selection alpha within investment styles
Investment Style Researchto earn the smart beta risk premiums of investment styles
Portfolio Constructionto implement a diversified mix of investment style
TradingBest executionBest Styles Portfolio
80%
100%
120%
140%
40
60
80
100
120
140
160
180
200
220
240
Dec-03 Dec-04 Dec-05 Dec-06 Dec-07 Dec-08 Dec-09 Dec-10 Dec-11 Dec-12 Dec-13 Dec-14
Relative performance vs M
SCI World
Perfo
rman
ce M
SCI W
orld
MSCI WorldWorld Quality World GrowthMix Of Value And MomentumWorld High DividendWorld Small CapMSCI Quality Mix
ACWI Minimum VolatilityWorld Value WeightedWorld Momentum (MSCI Value Weighted, Min.vol., Quality)
MSCI World
Source: MSCI, Allianz Global Investors, January 1, 2004 to December 31, 2014. Composite performance inception date: January 1, 1999. The chart above shows various MSCI indices. The Mix of Value and Momentum is an equal weighted index comprised of the MSCI Value an MSCI Momentum. Each index return has a 40 bp transaction cost applied. The thick blue line represents the Best Styles Global Developed composite. The performance shown above is gross and does not reflect the deduction of investment advisory fees. The chart above is supplemental information and supplements the composite performance presented at the end of this presentation. See additional disclosure at the end of this presentation. Past performance is not indicative of future results.
Relative performance of Best Styles Global Developed (Gross of Fees) vs MSCI risk premium indices after costs

Investment Style Risk Premiums as a Source for Excess Returns
With over a decade of styles research underpinning our approach, we believe superior, stable risk adjusted returns can be delivered by blending these in a risk controlled manner as evidenced by our long-term track record.
us.allianzgi.com
The material contains the current opinions of the author, which are subject to change without notice. Statements concerning financial market trends are based on current market conditions, which will fluctu-ate. Forecasts are inherently limited and should not be relied upon as an indicator of future results. Any refer-ence to a specific security, issuer or market sector is for illustrative purposes only. Nothing contained in this presentation constitutes an offer to sell, or the solicita-tion of an offer to buy or a recommendation to buy or sell any security; nor shall anything in this presentation be considered an offer or solicitation to provide servic-es in any jurisdiction in which such offer or solicitation would be unlawful.Allianz Global Investors is a global asset management business, operating under the marketing name Allianz Global Investors through affiliated entities worldwide, with approximately EUR 345 billion in assets under management an advice as of 31 December 2013. The Firm claims compliance with the Global Investment Performance Standards (GIPS®) and has prepared and presented this report in compliance with the GIPS standards. For purposes of compliance with GIPS the “Firm” is defined as Allianz Global Investors Europe GmbH, the business unit that is managed by the Global CIO, Allianz Global Investors and consists of the fund management teams in Germany that report to CIO Al-lianz Global Investors Europe GmbH and CIO Allianz Global Investors Multi Asset, the members of which participate in the Allianz Global Investors global re-search meetings and the infrastructure of Allianz Glob-al Investors globally. For periods ending before Decem-ber 31, 2011, the Firm was defined as an investment advisory organization which operated under the brand name RCM (“RCM Europe”). In 2012, through a global restructuring of the Allianz Global Investors business, the group of firms that coordinate their research, in-vestment and/or trading activities (the “Global Invest-ment Platform”) was expanded to include additional investment advisory firms. As a result the firm name (formerly RCM Europe) has been changed first to Alli-anz Global Investors Kapitalanlagegesellschaft mbH, and later to Allianz Global Investors Europe GmbH. Al-lianz Global Investors Europe presents the Best Styles Global— Developed strategy in Europe. Allianz Global Investors U.S. LLC (“AllianzGI US”) is an investment ad-visory firm registered with the U.S. Securities and Ex-change Commission and presents the Best Styles Global—Developed strategy in the United States. Reg-istration does not imply a certain level of skill or train-
ing. Certain portfolios in the composite are managed through a participating affiliate arrangement by invest-ment professionals supervised by AllianzGI US, but employed by Allianz Global Investors Europe, which is located outside of the United States and not registered with the SEC as an investment adviser. Such investment professionals are “associated per-sons” of AllianzGI US, as that term is defined in the U.S. Investment Advisers Act of 1940, as amended. For a complete list of the Firm’s composite descriptions, as well as information regarding the Firm’s policies for valuing investments, calculating performance, and preparing compliant presentations, please write to Al-lianz Global Investors U.S. LLC, 555 Mission Street, Suite 1700, San Francisco, CA 94105.Although AllianzGI US is registered with the CFTC as a commodity pool operator (“CPO”) and commodity trading adviser (“CTA”), it operates client accounts in this strategy, including funds (if any) as if it were exempt from registration as a CPO or CTA.The Systematic Equity Global Best Styles Developed composite was set up in August 2011, with an inception date of January 1999, and contains all accounts that are managed by Allianz Global Investors Europe and that invest in equities according to the Allianz Global Inves-tors Global Best Styles Developed Investment Process and where MSCI World is the appropriate benchmark. This excludes mandates that are benchmarked against customized MSCI World benchmarks e.g. MCSI World benchmarks excluding a significant percentage of MSCI World or using different weighting schemes (GDP weighted or regionally reweighted).Returns are calculated on a total return basis, including all dividends and interest, accrued income, realized and unrealized gains or losses, and are net of all broker-age commissions, execution costs and without provi-sion for federal or state income taxes. Unless otherwise noted, performance results are expressed in U.S. dol-lars. The returns in this presentation were obtained by converting the currency for the composite returns from the Euro which is the base currency of the portfo-lios in the composite, to US Dollars and therefore in-clude the effect of the currency rate of exchange.Performance results stated to be “gross” do not reflect the deduction of investment advisory fees. Gross per-formance results earned on behalf of AllianzGI US’s cli-ents will be reduced by AllianzGI US’s advisory fees. Net performance results, which reflect the deduction of actual investment advisory fees, are also displayed.
The benchmark applied to the composite is the MSCI World Total Return (Net) and is net of withholding tax-es. The MSCI World Index is a free float-adjusted mar-ket capitalization weighted index that is designed to measure the equity market performance of developed markets. The MSCI World Total Return (Net)is referred to for reference purposes only and is not intended to parallel the risk or investment style of the strategy. In-dex returns are provided to represent the investment environment existing during the time periods shown. The returns for the index do not include any trading costs, management fees, or other costs. MSCI or other index providers have not approved, reviewed or pro-duced this report, make no express or implied warran-ties or representations and are not liable whatsoever for any data in the report. You may not redistribute the MSCI or other index data or use it as a basis for other indices or investment products.References to specific securities and their characteris-tics are examples of securities held in the portfolio and are not intended to be, and should not be interpreted as an offer, solicitation or recommendation to pur-chase or sell any financial instrument, an indication that the purchase of such securities was or will be prof-itable, or representative of the composition or perfor-mance of the portfolio. “Representative Holdings” are as of the date indicated and are subject to change with-out notice. Holdings are selected based on size of positions, from a representative account. Represen-tative account characteristics and partial lists of past recommendations do not reflect Composite perfor-mance, which may be different. Additional information regarding account characteristics, and a complete list of all representative buys and sells for the last 12 months is available upon request.Portfolio characteristics and holdings when presented are supplemental information and supplement the Composite performance presented herein.
©2015 Allianz Global Investors 00330 | 14-1361
4th Quarter 1 Year 3 Year 5 Year 10 Year Since Inception0
5
15
10
20
25
2.8 2.61.0
8.0 7.34.9
17.5 16.5 15.5
12.0 10.9 10.27.9 7.0 6.0 5.9 5.3 4.4
MSCI World Index (Net)Composite, gross Composite, netComposite, gross Composite, net
Composite performance inception date is January 1, 1999. Performance of less than one year has not been annualized. Past performance is not indicative of future results.
Performance (% as of December 31, 2014)

us.allianzgi.com
FOR INSTITUTIONAL USE ONLY
Allianz Global Investors White Paper Series
A dynamic response to the limitations of diversificationTaylor Carrington, CFA, Director, Senior Relationship Manager Thomas Zimmerer, Ph.D., Director, Senior Product Specialist
Executive summaryA carefully constructed strategic asset allocation can provide a range of benefits to institutional investors, yet it is only a starting point. In this paper, we describe a dynamic asset allocation approach, centered around a plan’s strategic asset allocation, that aims to deliver superior returns over a market cycle while mitigating downside risks in times of market stress. Implementing such a dynamic approach—with its dual objective of enhanced returns and risk mitigation—aligns directly with the desired outcomes of many plan sponsors.
December 2015
Introduction Institutional investors spend a great deal of time evaluating their liability structures, return objectives and risk-tolerance levels to derive and construct strategic asset allocations that will be appropriate for their organizations. Given that asset allocation is an important driver of a portfolio’s total return, this level of time and attention is certainly warranted.
To determine these critical asset allocations, institutional investors typically use long-term asset class return expectations, plus their expected risk and correlations, to arrive at the “optimal” portfolio for a given liability and/or return objective. This method is called mean-variance optimization (MVO), and it formulates the plan’s strategic asset allocation (SAA)—a reference point that reflects overall return and risk expectations. For the purposes of this paper, the term MVO is meant as a common means of allocating institutional capital.
Once the SAA is established as a starting point, plan sponsors typically then determine acceptable asset-class deviations, defined as the tracking-error budget and the rebalancing policy. From this point forward, a plan’s investment staff and board focuses on alpha creation within each asset class, applying active strategy and security selection relative to asset-class benchmarks. Yet not only is little consideration given to identifying “alpha” from active asset-allocation decisions, but the portfolio-level tracking error budget is generally not used by active-management decisions.
Improving portfolio efficiency by diversifying capital allocations Allocating capital by means beyond MVO may complement an existing portfolio and increase risk efficiency. Just as a plan sponsor can hire different managers within a given asset class to diversify manager risk, we believe a similar diversification benefit is achieved when adding multi-asset concepts with a similar volatility as the existing SAA. In fact, a growing recognition of the potential presented by diversifying at the SAA level has recently prompted many institutions to adopt risk-parity strategies, moving away from a pure capital-oriented allocation approach toward an equal-risk allocation method.
Dynamic asset allocation (DAA) aims to provide incremental return and downside risk mitigation via active allocation around the plan’s strategic allocation. The approach allocates capital using a different underlying process than MVO, seeking to add a diversified return stream to the return of the overall plan. Furthermore, incorporating active management across asset allocation and security selection within the asset classes may enhance total portfolio performance as these return sources are typically independent; thus, overall outperfor-mance potential can be more robust in risk-adjusted terms material-izing in a higher overall information ratio. This paper examines the benefit of an alternative capital allocation process and explores how a sponsor might determine the right size and appropriate implementa-tion of such an approach.

A dynamic response to the limitations of diversification
2 | FOR INSTITUTIONAL USE ONLY
We describe an active allocation approach centered around the client’s strategic allocation that aims to deliver a superior return compared to the policy benchmark over a market cycle, while mitigating downside risks in times of market stress. Implementing the approach in a plan pursues a dual objective—enhanced returns and risk mitigation—that should result in an asymmetric return distribution similar to what is out-lined in Exhibit 1.
To deliver this return pattern, portfolio managers must have the discretion to deviate from strategic asset-class weights in both directions: de-risking in down-trending markets and up-risking when markets are positively trending.
Dynamic asset allocation introduction One drawback of a employing a strategic allocation created by mean-variance optimization that uses long-term return, risk and correlation assumptions is that it forgoes readily available information supplied by the market in the form of asset-class trends. Asset-class
cyclicality and trend behavior is well-known, observable and may be captured via a systematic portfolio-allocation process. In fact, trend behavior is utilized by many different investment strategies and thus plan sponsors might already employ this information elsewhere in the portfolio. The dynamic allocation approach helps align the portfolio with the current state of asset-class risk and drawdown potential in the market—in effect, allocating capital more efficiently to the asset classes within the strategic allocation.
To accomplish this, the dynamic allocation approach needs to capture medium-term trends across asset classes, and combine both pro-cyclical and anti-cyclical components. The use of a well-designed trend model is an intelligent way to approach active allocation. By eliminating the need to forecast future asset-class returns, it is possible to simply position portfolios in light of current market conditions.
Within each liquid asset class of the SAA, there are four observable “modes”:
◾ positive trend (normal up-mode);
◾ negative trend (normal down-mode);
◾ excessive positive trend (excessive up-mode); and
◾ excessive negative trend (excessive down-mode).
Exhibit 2 illustrates stylized trend patterns reflecting upward- and downward-trending markets, along with excessive modes that are measured in units of asset-class volatility.
With its pro-cyclical element, a dynamic asset allocation approach can take advantage of the tendency for markets to exhibit consistent trends over time. At the same time, markets occasionally overreact, leading to mean reversion. These reversals can be identified by the systematic anti-cyclical process element. A DAA approach would reduce the active weight in an asset class as the trend becomes excessively positive, while an excessive negative trend would trigger asset class re-entry to capture the mean-reversion potential.
Exhibit 2: Stylized trend patterns and their allocation response
Normal Excessive Normal Normal Excessive Normal
Time Time
TimeTime
Activ
e W
eigh
t
Activ
e W
eigh
t
Pric
e
Pric
e
Normal Excessive Normal
Time
Time
Activ
e W
eigh
t
Upward trend Downward trend
Buy into upward trend
Partial profit- taking in extreme markets
2 21
1
11
Sell into downward trend
1
1
Partial market re-entry in extreme markets
2 2
Reduce downside risk
Enhance the return
SAA DAA
Asymmetric return profile objectives
Exhibit 1: Stylized target return distributions of rolling 12-month returns for static SAA and DAA portfolios
Targeted performance pattern
Maximum
Minimum
Average0%
Source: Allianz Global Investors. The information and charts above are provided for illustrative purposes only, illustrating an example of targeted distribution, and not an accurate representation of the characteristics of an actual portfolio. The charts do not reflect actual data or show actual performance and is not indicative of future performance.
The information and charts shown are provided for illustrative purposes only, illustrating an example of targeted distribution or how the pro-cyclical and anti-cyclical process is implemented, and not an accurate representation of the characteristics of an actual portfolio. The charts do not reflect actual data or show actual performance and is not indicative of future performance.
A dynamic response to the limitations of diversification
FOR INSTITUTIONAL USE ONLY | 3
The dynamic approach employs a structure based on the plan’s strategic asset allocation in order to incorporate the unique market cycles of each sub-asset class that is designed to improve diversification and risk-mitigation potential. For example, if non-US equity is experi-encing a negative trend, a DAA approach may underweight relative to the strategic allocation.
Dynamic asset allocation simulation The dynamic approach seeks to capture the risk premia of a policy benchmark while, when markets are under stress, actively managing exposures to mitigate downside risk.
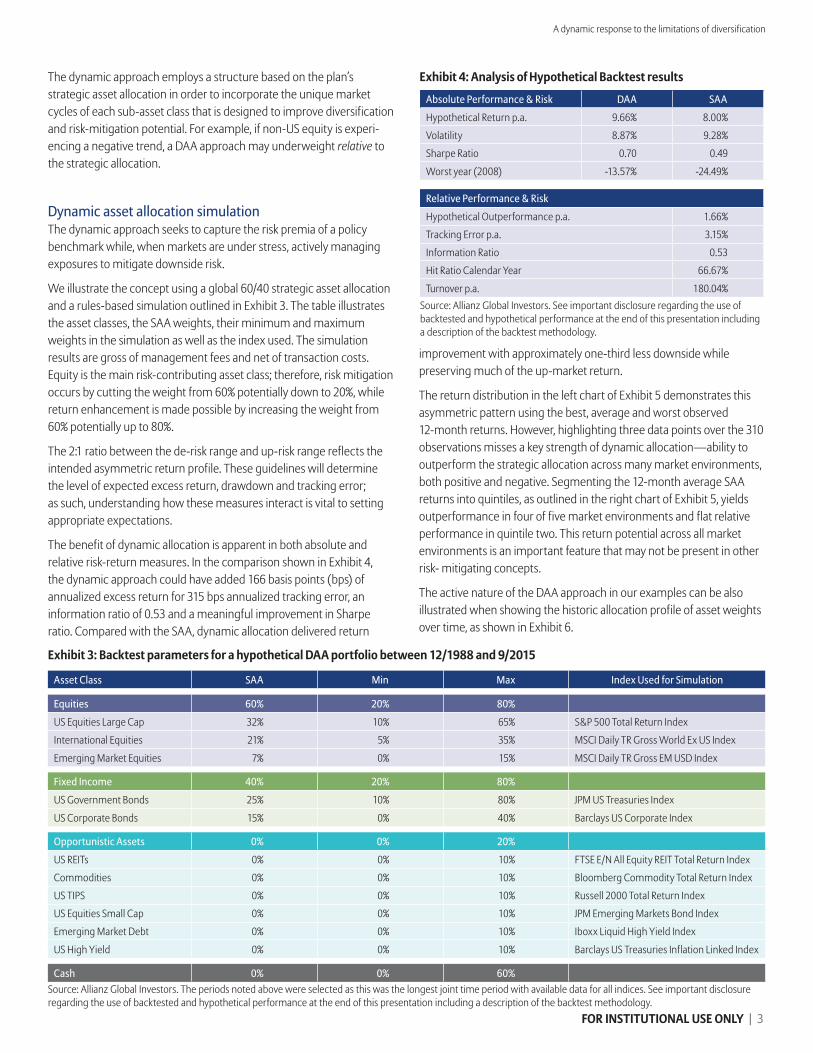
We illustrate the concept using a global 60/40 strategic asset allocation and a rules-based simulation outlined in Exhibit 3. The table illustrates the asset classes, the SAA weights, their minimum and maximum weights in the simulation as well as the index used. The simulation results are gross of management fees and net of transaction costs. Equity is the main risk-contributing asset class; therefore, risk mitigation occurs by cutting the weight from 60% potentially down to 20%, while return enhancement is made possible by increasing the weight from 60% potentially up to 80%.
The 2:1 ratio between the de-risk range and up-risk range reflects the intended asymmetric return profile. These guidelines will determine the level of expected excess return, drawdown and tracking error; as such, understanding how these measures interact is vital to setting appropriate expectations.
The benefit of dynamic allocation is apparent in both absolute and relative risk-return measures. In the comparison shown in Exhibit 4, the dynamic approach could have added 166 basis points (bps) of annualized excess return for 315 bps annualized tracking error, an information ratio of 0.53 and a meaningful improvement in Sharpe ratio. Compared with the SAA, dynamic allocation delivered return
improvement with approximately one-third less downside while preserving much of the up-market return.
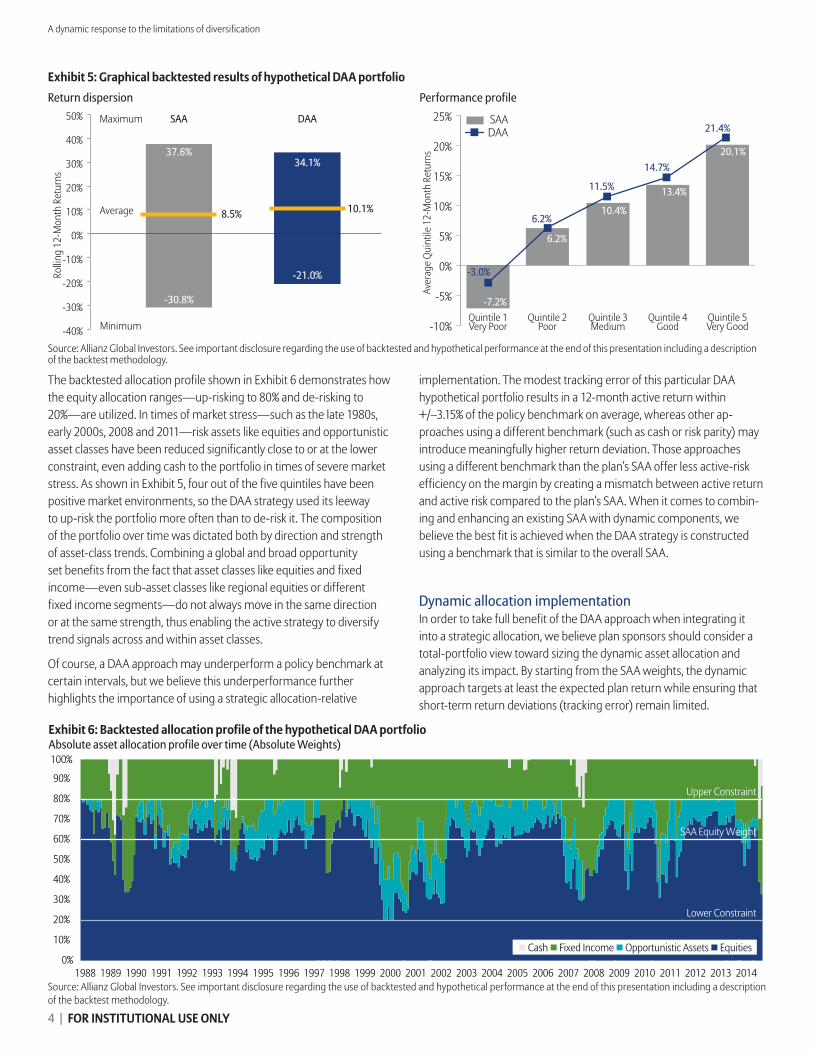
The return distribution in the left chart of Exhibit 5 demonstrates this asymmetric pattern using the best, average and worst observed 12-month returns. However, highlighting three data points over the 310 observations misses a key strength of dynamic allocation—ability to outperform the strategic allocation across many market environments, both positive and negative. Segmenting the 12-month average SAA returns into quintiles, as outlined in the right chart of Exhibit 5, yields outperformance in four of five market environments and flat relative performance in quintile two. This return potential across all market environments is an important feature that may not be present in other risk- mitigating concepts.
The active nature of the DAA approach in our examples can be also illustrated when showing the historic allocation profile of asset weights over time, as shown in Exhibit 6.
Exhibit 3: Backtest parameters for a hypothetical DAA portfolio between 12/1988 and 9/2015
Asset Class SAA Min Max Index Used for Simulation
Equities 60% 20% 80%
US Equities Large Cap 32% 10% 65% S&P 500 Total Return Index
International Equities 21% 5% 35% MSCI Daily TR Gross World Ex US Index
Emerging Market Equities 7% 0% 15% MSCI Daily TR Gross EM USD Index
Fixed Income 40% 20% 80%
US Government Bonds 25% 10% 80% JPM US Treasuries Index
US Corporate Bonds 15% 0% 40% Barclays US Corporate Index
Opportunistic Assets 0% 0% 20%
US REITs 0% 0% 10% FTSE E/N All Equity REIT Total Return Index
Commodities 0% 0% 10% Bloomberg Commodity Total Return Index
US TIPS 0% 0% 10% Russell 2000 Total Return Index
US Equities Small Cap 0% 0% 10% JPM Emerging Markets Bond Index
Emerging Market Debt 0% 0% 10% Iboxx Liquid High Yield Index
US High Yield 0% 0% 10% Barclays US Treasuries Inflation Linked Index
Cash 0% 0% 60%
Exhibit 4: Analysis of Hypothetical Backtest results
Source: Allianz Global Investors. See important disclosure regarding the use of backtested and hypothetical performance at the end of this presentation including a description of the backtest methodology.
Absolute Performance & Risk DAA SAA
Hypothetical Return p.a. 9.66% 8.00%
Volatility 8.87% 9.28%
Sharpe Ratio 0.70 0.49
Worst year (2008) -13.57% -24.49%
Relative Performance & Risk
Hypothetical Outperformance p.a. 1.66%
Tracking Error p.a. 3.15%
Information Ratio 0.53
Hit Ratio Calendar Year 66.67%
Turnover p.a. 180.04%
Sell into downward trend
Source: Allianz Global Investors. The periods noted above were selected as this was the longest joint time period with available data for all indices. See important disclosure regarding the use of backtested and hypothetical performance at the end of this presentation including a description of the backtest methodology.
A dynamic response to the limitations of diversification
4 | FOR INSTITUTIONAL USE ONLY
The backtested allocation profile shown in Exhibit 6 demonstrates how the equity allocation ranges—up-risking to 80% and de-risking to 20%—are utilized. In times of market stress—such as the late 1980s, early 2000s, 2008 and 2011—risk assets like equities and opportunistic asset classes have been reduced significantly close to or at the lower constraint, even adding cash to the portfolio in times of severe market stress. As shown in Exhibit 5, four out of the five quintiles have been positive market environments, so the DAA strategy used its leeway to up-risk the portfolio more often than to de-risk it. The composition of the portfolio over time was dictated both by direction and strength of asset-class trends. Combining a global and broad opportunity set benefits from the fact that asset classes like equities and fixed income—even sub-asset classes like regional equities or different fixed income segments—do not always move in the same direction or at the same strength, thus enabling the active strategy to diversify trend signals across and within asset classes.
Of course, a DAA approach may underperform a policy benchmark at certain intervals, but we believe this underperformance further highlights the importance of using a strategic allocation-relative
implementation. The modest tracking error of this particular DAA hypothetical portfolio results in a 12-month active return within +/–3.15% of the policy benchmark on average, whereas other ap-proaches using a different benchmark (such as cash or risk parity) may introduce meaningfully higher return deviation. Those approaches using a different benchmark than the plan’s SAA offer less active-risk efficiency on the margin by creating a mismatch between active return and active risk compared to the plan’s SAA. When it comes to combin-ing and enhancing an existing SAA with dynamic components, we believe the best fit is achieved when the DAA strategy is constructed using a benchmark that is similar to the overall SAA.
Dynamic allocation implementation In order to take full benefit of the DAA approach when integrating it into a strategic allocation, we believe plan sponsors should consider a total-portfolio view toward sizing the dynamic asset allocation and analyzing its impact. By starting from the SAA weights, the dynamic approach targets at least the expected plan return while ensuring that short-term return deviations (tracking error) remain limited.
Source: Allianz Global Investors. See important disclosure regarding the use of backtested and hypothetical performance at the end of this presentation including a description of the backtest methodology.
Aver
age
Quin
tile
12-M
onth
Ret
urns
-10%
-5%
0%
5%
10%
15%
20%
25% SAADAA
-7.2%
6.2%
6.2%
-3.0%
Quintile 1Very Poor
Quintile 2Poor
Quintile 3Medium
Quintile 4Good
Quintile 5Very Good
14.7%
21.4%
10.4%
13.4%
20.1%
11.5%
Exhibit 6: Backtested allocation profile of the hypothetical DAA portfolio Absolute asset allocation profile over time (Absolute Weights)
Return dispersion Performance profile
Exhibit 5: Graphical backtested results of hypothetical DAA portfolio
Source: Allianz Global Investors. See important disclosure regarding the use of backtested and hypothetical performance at the end of this presentation including a description of the backtest methodology.
-40%
-30%
-20%
-10%
0%
Rollin
g 12
-Mon
th R
etur
ns
10%
20%
Average
Maximum
Minimum
30%
40%
50%
37.6%
SAA DAA
34.1%
-21.0%
-30.8%
8.5% 10.1%
0%
10%
20%
30%
40%
50%
60%
70%
80%
90%
100%
1988 1989 1990 1991 1992 1993 1994 1995 1996 1997 1998 1999 2000 2001 2002 2003 2004 2005 2006 2007 2008 2009 2010 2011 2012 2013 2014
SAA Equity Weight
Upper Constraint
Lower Constraint
◽ Cash ◽ Fixed Income ◽ Opportunistic Assets ◽ Equities
A dynamic response to the limitations of diversification
FOR INSTITUTIONAL USE ONLY | 5
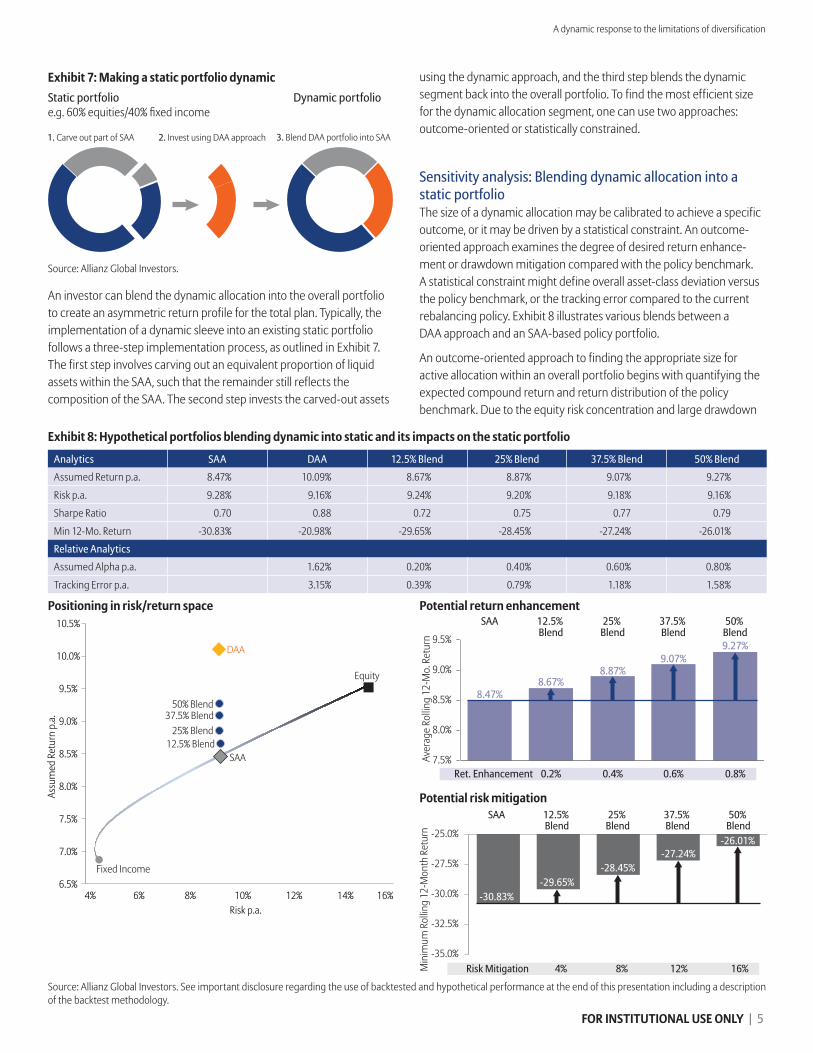
Exhibit 8: Hypothetical portfolios blending dynamic into static and its impacts on the static portfolio
Positioning in risk/return space Potential return enhancement
Potential risk mitigation
Source: Allianz Global Investors. See important disclosure regarding the use of backtested and hypothetical performance at the end of this presentation including a description of the backtest methodology.
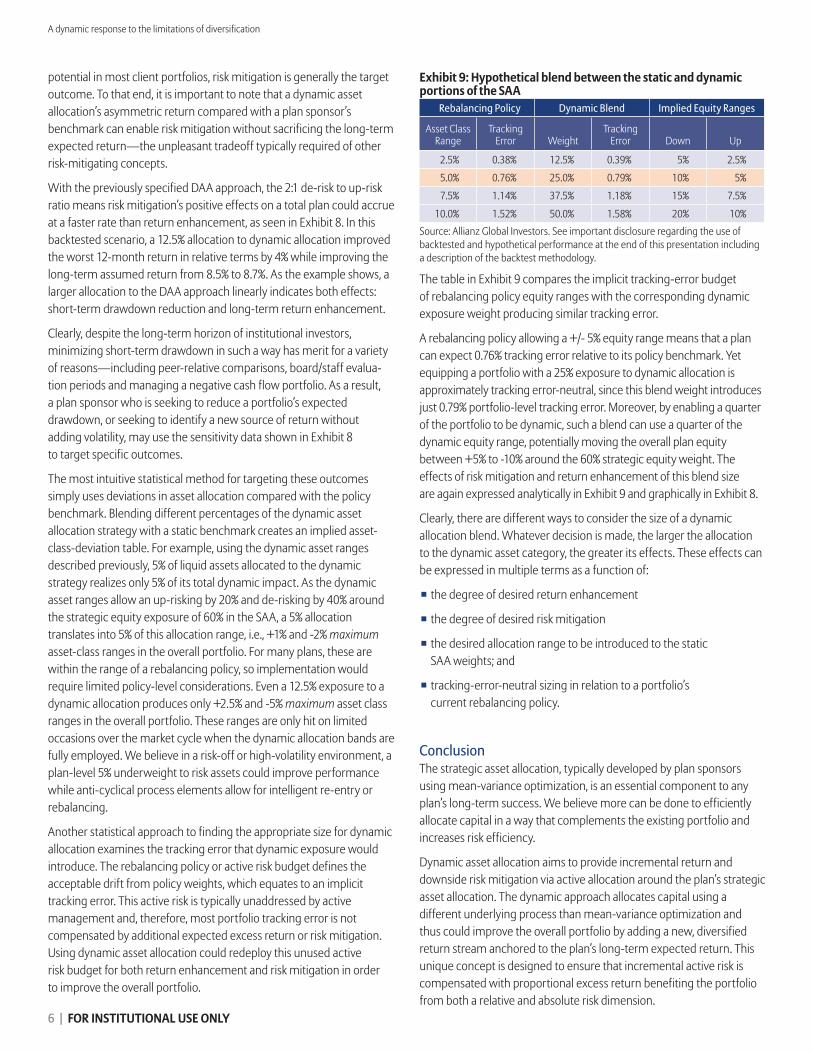
An investor can blend the dynamic allocation into the overall portfolio to create an asymmetric return profile for the total plan. Typically, the implementation of a dynamic sleeve into an existing static portfolio follows a three-step implementation process, as outlined in Exhibit 7. The first step involves carving out an equivalent proportion of liquid assets within the SAA, such that the remainder still reflects the composition of the SAA. The second step invests the carved-out assets
using the dynamic approach, and the third step blends the dynamic segment back into the overall portfolio. To find the most efficient size for the dynamic allocation segment, one can use two approaches: outcome-oriented or statistically constrained.
Sensitivity analysis: Blending dynamic allocation into a static portfolio The size of a dynamic allocation may be calibrated to achieve a specific outcome, or it may be driven by a statistical constraint. An outcome-oriented approach examines the degree of desired return enhance-ment or drawdown mitigation compared with the policy benchmark. A statistical constraint might define overall asset-class deviation versus the policy benchmark, or the tracking error compared to the current rebalancing policy. Exhibit 8 illustrates various blends between a DAA approach and an SAA-based policy portfolio.
An outcome-oriented approach to finding the appropriate size for active allocation within an overall portfolio begins with quantifying the expected compound return and return distribution of the policy benchmark. Due to the equity risk concentration and large drawdown
Analytics SAA DAA 12.5% Blend 25% Blend 37.5% Blend 50% Blend
Assumed Return p.a. 8.47% 10.09% 8.67% 8.87% 9.07% 9.27%
Risk p.a. 9.28% 9.16% 9.24% 9.20% 9.18% 9.16%
Sharpe Ratio 0.70 0.88 0.72 0.75 0.77 0.79
Min 12-Mo. Return -30.83% -20.98% -29.65% -28.45% -27.24% -26.01%
Relative Analytics
Assumed Alpha p.a. 1.62% 0.20% 0.40% 0.60% 0.80%
Tracking Error p.a. 3.15% 0.39% 0.79% 1.18% 1.58%
Aver
age
Rollin
g 12
-Mo.
Ret
urn
8.67%8.47%
SAA 12.5% Blend
25% Blend
37.5% Blend
50% Blend
8.87%9.07%
9.27%
7.5%
8.0%
8.5%
9.0%
9.5%
0.2%Ret. Enhancement 0.4% 0.6% 0.8%
Min
imum
Rol
ling
12-M
onth
Ret
urn
SAA 12.5% Blend
25% Blend
37.5% Blend
50% Blend
4%Risk Mitigation 8% 12% 16%-35.0%
-32.5%
-30.0%
-27.5%
-25.0%
-30.83%-29.65%
-28.45%-27.24%
-26.01%
Fixed Income
Equity
SAA
DAA
12.5% Blend 25% Blend
37.5% Blend 50% Blend
6.5%
7.0%
7.5%
8.0%
8.5%
9.0%
9.5%
10.0%
10.5%
4% 6% 8% 10% 12% 14% 16%
Assu
med
Ret
urn
p.a.
Risk p.a.
Exhibit 7: Making a static portfolio dynamic
1. Carve out part of SAA 2. Invest using DAA approach 3. Blend DAA portfolio into SAA
Source: Allianz Global Investors.
Static portfolioe.g. 60% equities/40% fixed income
Dynamic portfolio
A dynamic response to the limitations of diversification
6 | FOR INSTITUTIONAL USE ONLY
potential in most client portfolios, risk mitigation is generally the target outcome. To that end, it is important to note that a dynamic asset allocation’s asymmetric return compared with a plan sponsor’s benchmark can enable risk mitigation without sacrificing the long-term expected return—the unpleasant tradeoff typically required of other risk-mitigating concepts.
With the previously specified DAA approach, the 2:1 de-risk to up-risk ratio means risk mitigation’s positive effects on a total plan could accrue at a faster rate than return enhancement, as seen in Exhibit 8. In this backtested scenario, a 12.5% allocation to dynamic allocation improved the worst 12-month return in relative terms by 4% while improving the long-term assumed return from 8.5% to 8.7%. As the example shows, a larger allocation to the DAA approach linearly indicates both effects: short-term drawdown reduction and long-term return enhancement.
Clearly, despite the long-term horizon of institutional investors, minimizing short-term drawdown in such a way has merit for a variety of reasons—including peer-relative comparisons, board/staff evalua-tion periods and managing a negative cash flow portfolio. As a result, a plan sponsor who is seeking to reduce a portfolio’s expected drawdown, or seeking to identify a new source of return without adding volatility, may use the sensitivity data shown in Exhibit 8 to target specific outcomes.
The most intuitive statistical method for targeting these outcomes simply uses deviations in asset allocation compared with the policy benchmark. Blending different percentages of the dynamic asset allocation strategy with a static benchmark creates an implied asset-class-deviation table. For example, using the dynamic asset ranges described previously, 5% of liquid assets allocated to the dynamic strategy realizes only 5% of its total dynamic impact. As the dynamic asset ranges allow an up-risking by 20% and de-risking by 40% around the strategic equity exposure of 60% in the SAA, a 5% allocation translates into 5% of this allocation range, i.e., +1% and -2% maximum asset-class ranges in the overall portfolio. For many plans, these are within the range of a rebalancing policy, so implementation would require limited policy-level considerations. Even a 12.5% exposure to a dynamic allocation produces only +2.5% and -5% maximum asset class ranges in the overall portfolio. These ranges are only hit on limited occasions over the market cycle when the dynamic allocation bands are fully employed. We believe in a risk-off or high-volatility environment, a plan-level 5% underweight to risk assets could improve performance while anti-cyclical process elements allow for intelligent re-entry or rebalancing.
Another statistical approach to finding the appropriate size for dynamic allocation examines the tracking error that dynamic exposure would introduce. The rebalancing policy or active risk budget defines the acceptable drift from policy weights, which equates to an implicit tracking error. This active risk is typically unaddressed by active management and, therefore, most portfolio tracking error is not compensated by additional expected excess return or risk mitigation. Using dynamic asset allocation could redeploy this unused active risk budget for both return enhancement and risk mitigation in order to improve the overall portfolio.
The table in Exhibit 9 compares the implicit tracking-error budget of rebalancing policy equity ranges with the corresponding dynamic exposure weight producing similar tracking error.
A rebalancing policy allowing a +/- 5% equity range means that a plan can expect 0.76% tracking error relative to its policy benchmark. Yet equipping a portfolio with a 25% exposure to dynamic allocation is approximately tracking error-neutral, since this blend weight introduces just 0.79% portfolio-level tracking error. Moreover, by enabling a quarter of the portfolio to be dynamic, such a blend can use a quarter of the dynamic equity range, potentially moving the overall plan equity between +5% to -10% around the 60% strategic equity weight. The effects of risk mitigation and return enhancement of this blend size are again expressed analytically in Exhibit 9 and graphically in Exhibit 8.
Clearly, there are different ways to consider the size of a dynamic allocation blend. Whatever decision is made, the larger the allocation to the dynamic asset category, the greater its effects. These effects can be expressed in multiple terms as a function of:
◾ the degree of desired return enhancement
◾ the degree of desired risk mitigation
◾ the desired allocation range to be introduced to the static SAA weights; and
◾ tracking-error-neutral sizing in relation to a portfolio’s current rebalancing policy.
ConclusionThe strategic asset allocation, typically developed by plan sponsors using mean-variance optimization, is an essential component to any plan’s long-term success. We believe more can be done to efficiently allocate capital in a way that complements the existing portfolio and increases risk efficiency.
Dynamic asset allocation aims to provide incremental return and downside risk mitigation via active allocation around the plan’s strategic asset allocation. The dynamic approach allocates capital using a different underlying process than mean-variance optimization and thus could improve the overall portfolio by adding a new, diversified return stream anchored to the plan’s long-term expected return. This unique concept is designed to ensure that incremental active risk is compensated with proportional excess return benefiting the portfolio from both a relative and absolute risk dimension.
Exhibit 9: Hypothetical blend between the static and dynamic portions of the SAA
Source: Allianz Global Investors. See important disclosure regarding the use of backtested and hypothetical performance at the end of this presentation including a description of the backtest methodology.
Rebalancing Policy Dynamic Blend Implied Equity Ranges
Asset Class Range
Tracking Error Weight
Tracking Error Down Up
2.5% 0.38% 12.5% 0.39% 5% 2.5%
5.0% 0.76% 25.0% 0.79% 10% 5%
7.5% 1.14% 37.5% 1.18% 15% 7.5%
10.0% 1.52% 50.0% 1.58% 20% 10%

A dynamic response to the limitations of diversification
FOR INSTITUTIONAL USE ONLY | 7
About the authors
Taylor Carrington, CFA, Director, Senior Relationship Manager
Mr. Carrington is a director and a senior relationship manager with Allianz Global Investors, which he joined in 2014. He is responsible for new business development in the central region of the United States. Mr. Carrington has 15 years of investment industry experience. Before joining the firm, he worked at Janus Capital Group in institutional business development across corporate, endowment/ foundation, public and insurance plans. Mr. Carrington also worked in equity research sales with Cowen and Company, where he placed initial and secondary offerings in equity and convertibles and was responsible for traditional equity research sales to asset managers in the technology, health care, defense/aerospace and media sectors. Before that, he worked at Stifel Nicolaus in equity research sales. Mr. Carrington has a B.A. in economics from Wake Forest University. He is a CFA charterholder.
Thomas Zimmerer, Ph.D., Director, Senior Product Specialist
Mr. Zimmerer is a director and Head of Product Specialists Multi Asset US with Allianz Global Investors, which he joined in 2014. As a member of the Multi Asset US portfolio management team, he focuses on the firm’s dynamic multi-asset strategies. Mr. Zimmerer has 18 years of investment-industry experience. Before joining Allianz Global Investors, he was a professor of finance and investments at the University of Applied Science in Ansbach, Germany, and served as senior consultant for alpha portfolio advisors, a German-based consulting firm, advising institutional investors. Prior, Mr. Zimmerer was a portfolio manager with Allianz Asset Management on active bond strategies and active protection strategies. He has an M.B.A. in economics and finance and a Ph.D. in econometrics from the University of Regensburg, Germany.
FOR INSTITUTIONAL USE ONLY
Investing involves risk. The value of an investment and the income from it may fall as well as rise, and in-vestors may not get back the full amount invested. Past performance is not indicative of future results. This document is being provided for informational purposes only and should not be considered invest-ment advice or recommendations of any particular security, strategy or investment product. Statements concerning financial market trends are based on cur-rent market conditions, which will fluctuate. If pre-sented, references to specific securities and issuers are for illustrative purposes only and are not intended to be, and should not be interpreted as, recommen-dations to purchase or sell such securities. Forecasts and estimates have certain inherent limitations, and are not intended to be relied upon as advice or inter-preted as a recommendation. The opinions expressed herein represent the current, good faith views of the author(s) at the time of publi-cation and are provided for limited purposes, are not definitive investment advice, and should not be relied on as such. The information presented in this article has been developed internally and/or obtained from sources believed to be reliable; however, Allianz Glob-al Investors does not guarantee the accuracy, adequa-cy or completeness of such information. Predictions, opinions, and other information contained in this ar-ticle are subject to change continually and without notice of any kind and may no longer be true after the date indicated. Any forward-looking statements speak only as of the date they are made, and Allianz Global Investors assumes no duty to and does not un-dertake to update forward-looking statements. For-ward-looking statements are subject to numerous as-sumptions, risks and uncertainties, which change over time.Rebalancing Policy represents acceptable asset class deviations. Based on our proprietary model, the poli-cy range translates into a suggested dynamic alloca-tion blend into the static asset allocation. The tracking error shown is based on the hypothetical returns of the SAA and the DAA.The back-tested performance information contained in this presentation is being provided for institutional
use only and cannot be shared, reproduced or distrib-uted to third parties or the public without the express written consent of AllianzGI US. Back-tested perfor-mance reflects hypothetical performance an investor would have obtained had it invested in the manner shown and does not represents returns that any in-vestor actually attained.The SAA is based on a hypothetical blend of the index-es using the allocations shown in Exhibit 3. The back-tested performance presented represents a historical simulation for the periods shown based on historical index data and gross of investment management fees. Unless otherwise noted, all figures are in USD, net of expected transaction costs of 10 bps and do not reflect the cost of custody or other fees that a client would have paid. The indexes used and the parame-ters for the backtest are shown in Exhibit 3. Realloca-tions are executed monthly with asset class weight-ings determined by proprietary market cycle indicators. Fundamental economic cycle analysis is not considered. Additional backtests show a blend of the DAA backtest into the SAA to proportionally re-place segments of the original Equities and Fixed In-come allocations. Assumed return (or alpha) is used to illustrate the calculation of various risk metrics, and actual returns may be higher or lower. Charts that show quintiles are determined based on the rolling 12 month returns of the SAA. Quintile 1 re-flects the worst 12 month rolling SAA returns and the other four quintiles reflect each 20% portion of the better performing 12 month rolling SAA returns. The numbers in the chart are the arithmetic average re-turns of the SAA and the correspondent arithmetic average returns in the relevant quintiles.Where gross returns are indicated, the returns do not give effect to investment advisory fees, the cost of custody or other fees that a client would have paid. Fees may vary depending on, among other things, the applicable fee schedule and portfolio size. Please see the AllianzGI US ADV Part 2A Brochure for all stan-dard applicable fee schedules.Investors should not assume they will have invest-ment results that are similar to the back-tested per-formance shown. There are frequently material dif-
ferences between back-tested performance results and actual results subsequently achieved by a partic-ular investment strategy. Additional information regarding policies for calculat-ing and reporting returns is available upon request. Backtested returns have many inherent limitations, only some of which are described here. The returns were developed with the benefit of hindsight and do not reflect the impact that material economic and market factors might have had on investment deci-sions if client funds were actually managed in the manner shown. Furthermore, back-tested returns do not represent actual trading. The back-tested returns have been generated based on certain assumptions that may not be reasonable or applicable for particu-lar clients. Changes in the assumptions may have a material impact on the hypothetical and back-tested returns presented. Performance is shown for a limit-ed period of time. Performance over a different mar-ket cycle may not be as favorable as the performance shown and may result in losses. There can be no assur-ance that any client account will achieve profits similar to those shown or avoid incurring substantial losses. Allianz Global Investors is a global asset management business that operates under the marketing name Al-lianz Global Investors through affiliated entities world¬wide, including Allianz Global Investors U.S. LLC (AllianzGI US) and its subsidiary NFJ Investment Group LLC, each an SEC registered investment adviser. No part of this material may be reproduced in any form, or referred to in any other publication, without express written permission. us.allianzgi.com© 2016 Allianz Global Investors U.S. LLCAGI-2016-02-25-14619 | 01299