Investment Policy Statement Prepared for Tom & Tess - PlanPlus
25
Date Printed: 3/9/11 Page 1 Default Planner Investment Policy Statement Prepared for Tom & Tess London Prepared: February 3, 2011 Prepared by: Jane Barclay CFP
Transcript of Investment Policy Statement Prepared for Tom & Tess - PlanPlus

Date Printed: 3/9/11 Page 1 Default Planner
Investment Policy Statement
Prepared for
Tom & Tess London
Prepared: February 3, 2011Prepared by: Jane Barclay CFP

Date Printed: 3/9/11 Page 2 Default Planner
Index
Page
Purpose for an Investment Policy Statement 3
Risk Tolerance 4
Portfolio Objectives 8
Current Holdings 9
Current Financial Situation 10
Asset Allocation 12
Portfolio Risk vs. Return 16
Efficient Frontier 17
Historical Annual Returns 18
Portfolio Risk vs. Time 19
Assumptions 20
Portfolio Repositioning Recommendations 21
Tactical Implementation Strategy 22
Investment Policy Statement Agreement 23
Action Plan Checklist 24

Date Printed: 3/9/11 Page 3 Default Planner
Purpose for an Investment Policy Statement An Investment Policy Statement (IPS) provides the framework for your investment decisions. The IPS ensures that the decision-making process with respect to the management of your money will be consistent, even when unexpected market fluctuations tempt to distract you from your long-term strategy. Investment recommendations will always be made based on the guidelines that we agree upon and outline in this document. I view the development of an IPS as imperative ⎯ the essential foundation upon which our work together will be based.
This report has been prepared to assist in the analysis of your current financial position and to help you identify steps that you can take to assist you in achieving your personal financial goals and objectives. Although great care has been taken to ensure the accuracy of this report, it should be kept in mind that projections, by their very nature, are based on a variety of assumptions and as such it is likely that the actual results achieved will be somewhat different than illustrated. For this reason it is very important that you review your strategy on a regular basis to ensure its timeliness and relevance to your changing financial position.

Date Printed: 3/9/11 Page 4 Default Planner
Risk Tolerance
Tom
Your Risk Tolerance Score Your Risk Tolerance Score enables you to compare yourself to a representative sample of the adult population. Your score is 53. This is a slightly-higher-than-average score, higher than 60% of all scores.
When scores are graphed they form a bell-curve as shown below. To make the scores more meaningful, the 0to100 scale has been divided into seven Risk Groups. Your score places you in Risk Group 4.
In answer to the last question, you estimated your score would be 55. Congratulations! You were close. Most people under-estimate their score by a few points.
Your Risk Group The description of Risk Group 4 which follows provides a summary of the typical attitudes, values, preferences and experiences of those in your group. Six of your answers differed from this description. They are shown in italics below the relevant section. These differences fine-tune the description to you personally.
Making Financial Decisions They usually think of "risk" as "uncertainty". They have a reasonable amount of confidence in their ability to make good financial decisions and usually feel at least somewhat optimistic about their major financial decisions after they make them.

Date Printed: 3/9/11 Page 5 Default Planner
They are prepared to take a medium degree of risk with their financial decisions and are usually, if not always, more concerned about the possible gains than the possible losses.
You usually feel somewhat pessimistic about your major financial decisions after you make them.
When faced with a major financial decision you are usually, but not always, more concerned about the possible losses.
Financial Disappointments
Typically, when things go wrong financially they adapt at least somewhat easily.
When things go wrong financially you usually adapt somewhat uneasily.
Financial Past
They have taken a small to medium degree of risk with their past financial decisions. Most have never borrowed money to make an investment. The great majority have never invested a large sum in a risky investment mainly for the "thrill" of seeing whether it went up or down in value.
You have borrowed money to make an investment.
Investment
Most commonly they feel it is somewhat more important that the value of their investments retains its purchasing power than that it does not fall. Over ten years, most expect an investment portfolio to earn, on average, from one and a half to twice the rate from bank deposits. Typically, they would begin to feel uncomfortable if the total value of their investments went down by 20%.
Given these portfolio choices,
Expected Return and Risk
High Medium Low
Portfolio 1 0 % 0 % 100 % Portfolio 2 0 % 30 % 70 % Portfolio 3 10 % 40 % 50 % Portfolio 4 30 % 40 % 30 % Portfolio 5 50 % 40 % 10 %

Date Printed: 3/9/11 Page 6 Default Planner
Portfolio 6 70 % 30 % 0 % Portfolio 7 100 % 0 % 0 %
where shares and property are high return/high risk and cash and bank deposits are low return/low risk, their most common choice is Portfolio 4.
Over ten years you would expect average earnings of about two and a half times the rate from bank deposits.
Borrowing
If they were borrowing a large sum of money at a time when it was not clear which way interest rates were going to move and when the fixed interest rate was 1% more than the then variable rate, they would choose to have 50% to 75% of the loan at variable interest.
You would choose to have only 25% at variable interest.
Government Benefits and Tax Advantages
So long as there was only a small chance they could finish up worse off than if they'd done nothing, they would take a risk in arranging their affairs to qualify for a government benefit or obtain a tax advantage.
How to Use This Report
Your Personal Financial Risk Profile has been prepared from information provided by you and is, of course, only relevant to you.
If, for example, you are one of a couple who make joint decisions, your partner should also do a risk tolerance assessment. Both Risk Profiles then need to be considered when joint decisions are being made. Similarly, where you are acting on behalf of someone else, e.g. under a power of attorney or as trustee, your own Risk Profile remains relevant but must be considered in the context of your responsibilities.
The factors, other than personality, which influence risk tolerance include financial know how and experience, as well as personal, family and work situations and aspirations. If there is a significant change in any of these, risk tolerance should be re-tested. This re-testing is not only for your subsequent decision-making but also for review of decisions made before the change.
People starting to actively manage their finances and/or investments for the first time can find that the new knowledge and experience lead to an increased risk tolerance. In such circumstances, risk tolerance should be re-tested within 6 to 12 months.

Date Printed: 3/9/11 Page 7 Default Planner
In any event, your risk tolerance should be re-tested every two or three years as it usually does change (slowly) with age.
You should discuss your Risk Profile with your financial adviser. Notes of this discussion should be made. These notes may include modifications of, or expansions on, particular aspects of your Risk Profile. Because it is critical that you and your adviser have the same understanding of your risk tolerance, you both should sign-off on your Risk Profile, including any changes made as a result of discussion.
It is important to have confidence in any person with whom you discuss your Risk Profile. They must have the experience, skill and capacity to incorporate it into a decision making process with you.
You can rely on your Risk Profile to assist you in your financial decision making. However, we cannot endorse or support any specific decision you may make because, while we fully support the Risk Profile itself, we are not privy to all the other information that effective financial decision making requires.
Our Risk Profiling system is the financial services equivalent of the first blood pressure machine. While an accurate blood pressure reading does not, by itself, determine a diagnosis or treatment, it does provide critically important information. As the use of scientific Risk Profilers becomes widespread, better 'diagnoses' will be made, more appropriate 'treatments' will be prescribed, the incidence of unpleasant 'side-effects' will be reduced and 'health' outcomes will improve.
FinaMetrica Pty Ltd 1998-2011 U.S. Patent No.6859788
Date Printed: 3/9/11 Page 8 Default Planner
Portfolio Objectives
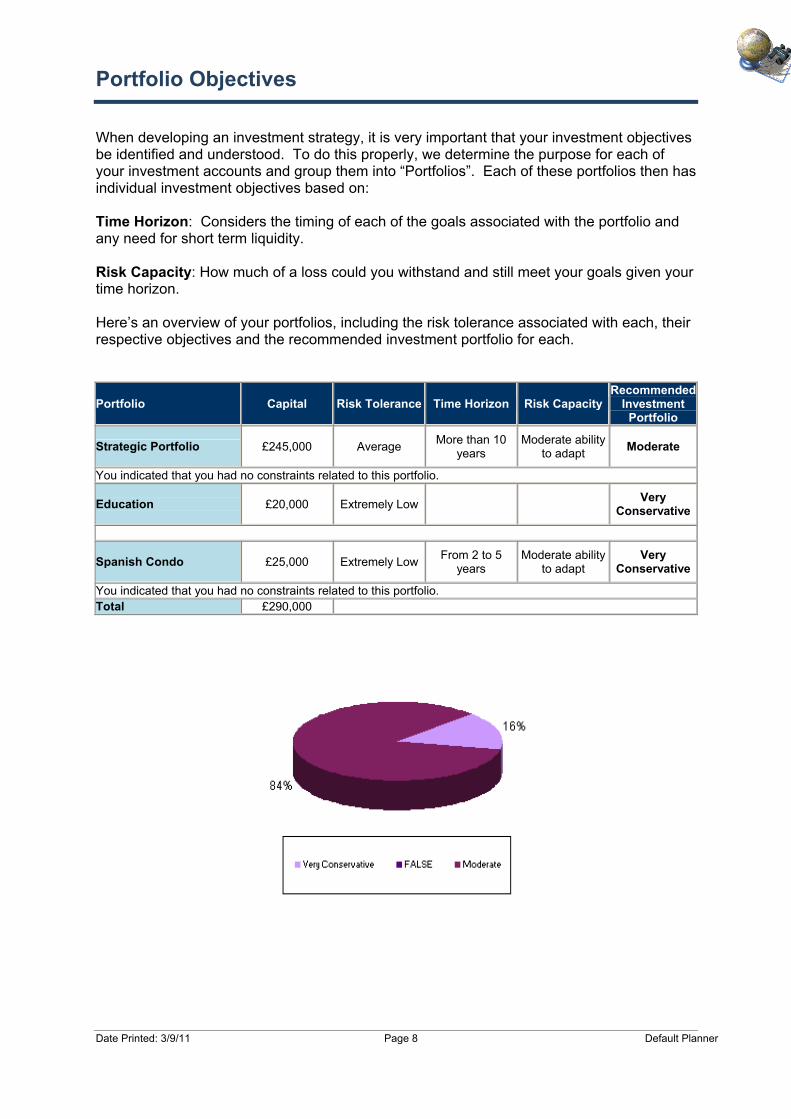
When developing an investment strategy, it is very important that your investment objectives be identified and understood. To do this properly, we determine the purpose for each of your investment accounts and group them into “Portfolios”. Each of these portfolios then has individual investment objectives based on: Time Horizon: Considers the timing of each of the goals associated with the portfolio and any need for short term liquidity. Risk Capacity: How much of a loss could you withstand and still meet your goals given your time horizon. Here’s an overview of your portfolios, including the risk tolerance associated with each, their respective objectives and the recommended investment portfolio for each.
Portfolio Capital Risk Tolerance Time Horizon Risk Capacity Recommended
Investment Portfolio
Strategic Portfolio £245,000 Average More than 10 years
Moderate ability to adapt Moderate
You indicated that you had no constraints related to this portfolio.
Education £20,000 Extremely Low Very Conservative
Spanish Condo £25,000 Extremely Low From 2 to 5 years
Moderate ability to adapt
Very Conservative
You indicated that you had no constraints related to this portfolio. Total £290,000

Date Printed: 3/9/11 Page 9 Default Planner
Current Holdings
This Investment Policy Statement has been prepared with regards to the following investments:
Portfolio Description: Strategic Portfolio
Account Description Holdings Account Types Owner Amount
Tom Individual Savings Plan Cash (C£) PEP/ISA/TESSA Tom £ 100,000 Tess's Individual Savings Account Individual Savings Account PEP/ISA/TESSA Tess £ 100,000
Tom's General Investment Account General Investment Accounts Open Tom £ 35,000
Tess's Investment Account General Investment Accounts Open Tess £ 10,000 Portfolio Total £245,000
Portfolio Description: Spanish Condo
Account Description Holdings Account Types Owner Amount
Joint Investment Account General Investment Accounts Open Joint £ 25,000 Portfolio Total £25,000
Portfolio Description: Education
Account Description Holdings Account Types Owner Amount
Robert's Education Account General Investment Accounts Open Other £ 20,000
Portfolio Total £20,000
Grand Total £290,000

Date Printed: 3/9/11 Page 10 Default Planner
Current Financial Situation
Your net worth statement measures your financial position at a specific point in time. It also provides a benchmark against you can measure your progress. Net Worth is the difference between your total assets of £590,000 and your total liabilities of £150,000. Currently, your net worth is £440,000. Assets Tom Tess Other Total
Personal Assets
Personal Use 150,000 150,000 0 300,000
Total Personal Assets 150,000 150,000 0 300,000
Tax Efficient Investments
Cash (C£) 100,000 0 0 100,000
Individual Savings Account 0 100,000 0 100,000
Total Tax Efficient Investments 100,000 100,000 0 200,000
General Investment Accounts
General Investment Accounts 0 10,000 0 10,000
General Investment Accounts 35,000 0 0 35,000
General Investment Accounts 12,500 12,500 0 25,000
General Investment Accounts 0 0 20,000 20,000
Total General Investments 47,500 22,500 20,000 90,000
Total Assets 297,500 272,500 20,000 590,000
Liabilities Tom Tess Other Total
Personal Liabilities
Personal Use 75,000 75,000 0 150,000
Total Personal Liabilities 75,000 75,000 0 150,000
Total Liabilities 75,000 75,000 0 150,000
Net Worth 222,500 197,500 20,000 440,000

Date Printed: 3/9/11 Page 11 Default Planner
Net Investment Assets Although your net worth measures your overall financial position, it is your net investment assets that will fund your financial goals. Your net investment assets of £290,000 are comprised of your total investment assets minus your investment liabilities.

Date Printed: 3/9/11 Page 12 Default Planner
Asset Allocation
Asset allocation is the cornerstone of good investing. Each investment included in your portfolio should be part of an overall investment strategy. In order to identify an appropriate asset allocation we take into consideration your risk tolerance and your investment objectives, translating these constraints into a proposed asset allocation recommendation.
Strategic Portfolio
Current Asset Allocation
Based on the information that you have provided, the current asset allocation for this portfolio is:
Cash 50%Fixed Income 25%UK Equity 25%Total 100%
Long-Term Historical Return: 5.40% Long-Term Historical Risk: 7.89%
Proposed Asset Allocation - Moderate
We propose the following asset allocation for this portfolio:
Long-Term Historical Return: 7.91% Long-Term Historical Risk: 13.18%
Cash 10%Fixed Income 30%Global Fixed Income 5%UK Equity 13%UK Small Cap Equity 15%Global Equity 5%Emerging Markets 12%Alternatives 10%Total 100%
Date Printed: 3/9/11 Page 13 Default Planner
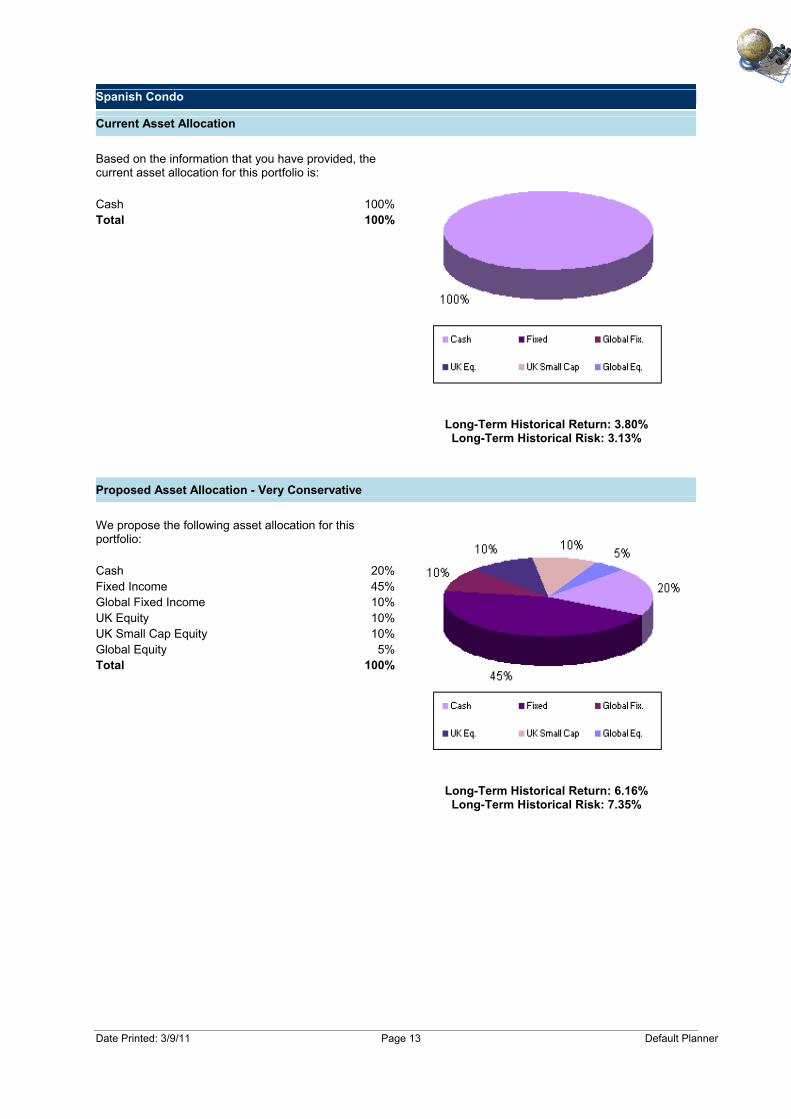
Spanish Condo
Current Asset Allocation
Based on the information that you have provided, the current asset allocation for this portfolio is:
Long-Term Historical Return: 3.80% Long-Term Historical Risk: 3.13%
Cash 100%Total 100%
Proposed Asset Allocation - Very Conservative
We propose the following asset allocation for this portfolio:
Long-Term Historical Return: 6.16% Long-Term Historical Risk: 7.35%
Cash 20%Fixed Income 45%Global Fixed Income 10%UK Equity 10%UK Small Cap Equity 10%Global Equity 5%Total 100%

Date Printed: 3/9/11 Page 14 Default Planner
Education
Current Asset Allocation
Based on the information that you have provided, the current asset allocation for this portfolio is:
Long-Term Historical Return: 3.80% Long-Term Historical Risk: 3.13%
Cash 100%Total 100%
Proposed Asset Allocation - Very Conservative
We propose the following asset allocation for this portfolio:
Cash 20%Fixed Income 45%Global Fixed Income 10%UK Equity 10%UK Small Cap Equity 10%Global Equity 5%
Long-Term Historical Return: 6.16% Long-Term Historical Risk: 7.35%
Total 100%

Date Printed: 3/9/11 Page 15 Default Planner
Above we have identified the proposed asset allocation for each of your portfolios. Below we have illustrated the combined asset allocation for all of your portfolios based on these recommendations.
All Portfolios
Current Asset Allocation
Based on the information that you have provided, the current asset allocation for this portfolio is:
Cash 57.76%Fixed Income 21.12%UK Equity 21.12%
Long-Term Historical Return: 5.15% Long-Term Historical Risk: 6.87%
Total 100.00%
Proposed Asset Allocation - Custom
This illustrates the combined asset allocation for all of your portfolios combined.
Long-Term Historical Return: 7.64% Long-Term Historical Risk: 12.21%
Cash 11.55%Fixed Income 32.33%Global Fixed Income 5.78%UK Equity 12.53%UK Small Cap Equity 14.22%Global Equity 5.00%Emerging Markets 10.14%Alternatives 8.45%Total 100.00%

Date Printed: 3/9/11 Page 16 Default Planner
Portfolio Risk vs. Return
Today it’s widely recognized that there is a trade-off between risk and reward when investing. Higher reward can only be achieved by taking on some risk. However, in designing an investment portfolio, the objective should always be to achieve the highest expected return with the least amount of risk. Measuring reward is straightforward. It is the combined expected return of the individual assets. Whilst risk can be measured in many ways, the most frequently used method is a statistical measurement of volatility called “Standard Deviation”. This is a technical way to measure the range of return fluctuation expected for a given portfolio mix among the major asset classes. In calculating overall portfolio volatility there is another dimension that must be considered, that being the degree to which returns for each asset class move up and down, compared to each other. In technical terms, this is called “correlation of returns” and it supplies the real power behind asset allocation to reduce risk. This is accomplished by combining assets in the portfolio with varying patterns of return so that, as some are falling in value, others are offsetting that decline with positive returns. Our objective in developing an asset allocation strategy is to identify the portfolio that most efficiently matches the risk and reward for you that has the highest probability of meeting your objectives. The Risk vs. Return graph below illustrates how the proposed change in your portfolio may impact your projected long-term return and the degree of risk or volatility within your portfolio. A portfolio that falls on the far left side of the graph, consisting almost entirely of short-term cash type investments, represents the least risky portfolio (one that is expected to fluctuate the least in the short-term) and has the lowest expected returns. A portfolio on the far right side of the graph, which would consist of mostly equity investments, represents a portfolio with the highest short-term volatility with the highest expected returns. Portfolios between these two extremes represent portfolios of gradually increasing returns and correspondingly increasing risk.

Date Printed: 3/9/11 Page 17 Default Planner
Efficient Frontier
In his Nobel Prize winning work, Harry Markowitz employed advanced mathematics to solve the puzzle of how to achieve maximum return with the least amount of risk. He was able to calculate “mathematically correct” portfolios that were most effective in balancing the trade-off between the risk and reward of various asset classes. He called those portfolios “efficient” and was able to plot them graphically to illustrate the range of possibilities for each level of risk or expected reward. The graph below shows the “efficient frontier” for your portfolio from an overall strategic perspective.
Whilst it’s considered ideal for your proposed portfolio to be positioned directly on the efficient frontier, it’s also a reality that there are constraints that can limit your ability to achieve this ideal. These constraints might be a lack of liquidity in your current portfolio, tax ramifications of rebalancing or other limiting factors. In such cases you may not be able to achieve the ideal today, but over the long term we’ll work with you towards this goal as the impact of such constraints are minimised.

Date Printed: 3/9/11 Page 18 Default Planner
Historical Annual Returns
When we identified the long-term projected return of 5.15% for your current portfolio and 7.64% for your proposed portfolio, this creates an expectation for the future. However, it’s also helpful to see how both the current and the proposed portfolio have performed historically based on the benchmarks used for each asset class. The following graph illustrates the actual annual returns achieved by each portfolio in the past. It highlights the fact that whilst we expect a certain return over the long term, actual returns from year to year will fluctuate.
Annual Returns –25 Years of History
Recognising the variable nature of historical returns can help us to understand how future returns will impact your investments going forward. With this understanding comes the ability to maintain a strategic approach to investment management and not be tempted to over react to short term fluctuations in the marketplace.

Date Printed: 3/9/11 Page 19 Default Planner
Portfolio Risk vs. Time
The long-term projected returns for your current and proposed portfolio are based on historical rates of return for each asset class using data going back as far as 1950, where the actual rate of inflation is replaced with an estimated rate of inflation of 3.0%. Whilst we know that history does not repeat itself exactly, the rates of return for the various asset classes and their associated “risk” are influenced by economic cycles that do have a reasonably consistent long-term pattern. Consider the following “Portfolio Risk vs. Time” graph, which provides a good picture of the highest, lowest and average historical returns over both short-term and long-term time horizons for your current and proposed portfolio.
1Year
2Years
3Years
5Years
10 Years
20 Years
30Years
Current Portfolio Actual Historical Highest (%) 38.10 21.51 19.23 15.91 15.54 13.17 10.84Actual Historical Average (%) 8.31 8.41 8.57 8.80 9.29 10.04 10.04Expected Return (%) 5.15 5.15 5.15 5.15 5.15 5.15 5.15Actual Historical Lowest (%) -4.06 -2.35 0.53 3.17 4.00 5.06 8.44 Proposed Portfolio Actual Historical Highest (%) 40.03 21.53 21.32 17.00 16.21 13.83 11.60Actual Historical Average (%) 8.75 8.65 8.81 9.03 9.38 10.08 10.07Expected Return (%) 7.64 7.64 7.64 7.64 7.64 7.64 7.64Actual Historical Lowest (%) -12.59 -9.64 -3.72 1.07 2.87 3.71 7.72
This clearly illustrates that shorter time horizons demonstrate high historical volatility of returns whereas volatility over longer time horizons is reduced. This risk/reward profile is a key component to your personal Investment Policy Statement as it relates directly to your personal tolerance for risk. Portfolios with an emphasis on aggressive long-term growth will tend to experience a higher degree of volatility in the short-term than portfolios with a moderate or conservative emphasis on growth. This is the trade-off that must be accepted in order to achieve higher rates of return.

Date Printed: 3/9/11 Page 20 Default Planner
Assumptions
An Investment Policy Statement is a long-term planning document. Consequently, it’s necessary to make a number of assumptions about the future so that we can identify the long-term impact your investment decisions will have on your portfolio. The following are some of the key assumptions that we have made in doing our calculations.
Inflation The performance of most investments is significantly influenced by a number of economic factors, one very significant one being inflation. Your goals and objectives also will be impacted by future inflation rates. For this reason, it’s necessary to identify an expected inflation factor. In your case we have used an assumed inflation rate of 3.0% throughout this report unless otherwise identified.
Portfolio Returns The long-term average returns used for projecting portfolio performance are based on historical real rates of return for each asset class. When we say “real” rates of return, this means that we take the historical return for each asset class and subtract the historical inflation for the same time period. We then take your inflation assumption of 3.0% as identified above and add this to the real rates of return to get a forward looking projected return. These long-term average returns are based on appropriate benchmarks for each asset class using 59 years of history where data is available.
Asset Class Benchmark Cash UK 91 Day T-Bills Fixed Income UK 5 Year Bonds Global Fixed Income JP Morgan Global Gov't Bond Global Property Citi Global Property (1) UK Equity MSCI UK UK Small Cap Equity MSCI UK Small Cap (2) Global Equity MSCI Emerging Emerging Markets MSCI World Alternatives C.S. Tremont Hedge Fund Index (3) 1) Data from 1990 2) Data from 1993 3) Data from 1994 3) Data from 1994 3) Data from 1994 3) Data from 1994 3) Data from 1994 3) Data from 1994 3) Data from 1994
Whilst past investment performance is no guarantee of future performance, history does give us insight into how asset classes behave over long periods of time. That’s why we use these benchmarks as the basis for projecting future investment performance. Note also that in your case we have reduced the projected returns by 1.0% in order to be more conservative in any projections done.

Date Printed: 3/9/11 Page 21 Default Planner
Portfolio Repositioning Recommendations
The following illustrates the overall changes that need to be made in your current portfolio in order to achieve the proposed asset allocation that we have identified. As we move towards this ideal, we will need to take into consideration several issues. For example we will need to recognize the regulatory nature of your accounts, any tax consequences associated with the disposition of any existing holdings as well as the objective to minimize any fees and charges that may be related to repositioning. Asset Category Current
% Current
Value (£) Target
% Target
Value (£) Reposition
% Reposition Value (£)
Cash 57.76 167,500 11.55 33,500 -46.21 -134,000Fixed Income 21.12 61,250 32.33 93,750 11.21 32,500Global Fixed Income 0.00 0 5.78 16,750 5.78 16,750UK Equity 21.12 61,250 12.53 36,350 -8.59 -24,900UK Small Cap Equity 0.00 0 14.22 41,250 14.22 41,250Global Equity 0.00 0 5.00 14,500 5.00 14,500Emerging Markets 0.00 0 10.14 29,400 10.14 29,400Alternatives 0.00 0 8.45 24,500 8.45 24,500Totals 100% 290,000 100% 290,000 N/A N/A

Date Printed: 3/9/11 Page 22 Default Planner
Tactical Implementation Strategy
The following illustrates the tactical changes we recommend be made to move you towards the proposed asset allocation that we have recommended.
Strategic Portfolio Tom Individual Savings Plan Current Target Change Cash (C£) £100,000 £0 £100,000Subtotal £100,000 £0
Tess's Investment Account Current Target Change General Investment Accounts £10,000 £0 £10,000Subtotal £10,000 £0
Tess's Individual Savings Account Current Target Change AXA Rosenberg European R £0 £10,000 £10,000Baillie Gifford Index Linked C Gross £0 £10,000 £10,000Barclays International Sterling Reserve £0 £10,000 £10,000CLI Fidelity Managed International £0 £20,000 £20,000FPIL Investec Cautious Mngd £0 £10,000 £10,000FPIL JPMorgan Emerging Markets Small Cap £0 £10,000 £10,000HSBC Open Global Property Retail Inc £0 £10,000 £10,000Individual Savings Account £100,000 £0 £-100,000Melchior North American Opps C GBP £0 £10,000 £10,000T. Rowe Price Emerging Markets Bond Comp £0 £10,000 £10,000Subtotal £100,000 £100,000
Tom's General Investment Account Current Target Change General Investment Accounts £35,000 £0 £35,000Subtotal £35,000 £0 Portfolio Total £245,000 £100,000
Spanish Condo Joint Investment Account Current Target Change General Investment Accounts £25,000 £0 £25,000Subtotal £25,000 £0
Portfolio Total £25,000 £0
Grand Total £270,000 £100,000
Date Printed: 3/9/11 Page 23 Default Planner
Investment Policy Statement Agreement
As a result of your input and our discussions, we have jointly developed this Investment Policy Statement (IPS). Its purpose is to guide us in effectively implementing and supervising a strategy for managing your investment assets. To accomplish this, we have:
Ascertained your attitudes, expectations and objectives.
Outlined the various asset classes and allocations to be used in the implementation of your IPS.
Illustrated the target rate of return and associated risk associated with your proposed portfolio.
This IPS also creates an effective channel of communication between us so that important issues and concerns for either party can be clarified. By committing our agreed upon thoughts to a written document, the potential for conflict and general misunderstandings is greatly minimised. For this reason, we ask you to sign this Agreement ⎯ to confirm that you concur with its contents. This Investment Policy Statement (IPS) is not a contract of any kind. It is only meant to be a summary of our agreed upon investment strategy for your portfolio. I agree with the Investment Policy Statement as outlined in this document. I further agree that this document shall provide the guidelines under which my investment portfolio will be managed. Signed this ____ __________day of ___________________________________ 2011. __________________________________ ____________________________________ Tom London Tess London __________________________________ Jane Barclay, CFP

Date Printed: 3/9/11 Page 24 Default Planner
Action Plan Checklist
When
Who
What
Date Complete
Now Jane Tom Tess
Investment Policy Statement Agreement - Review this Investment Policy Statement and answer any questions or concerns you might have. Once you are satisfied that the proposed strategy is appropriate for you, sign the Agreement.
Now Jane Tom Tess
Implementation of your Proposed Asset Allocation – We will work with you to implement your proposed asset allocation using various investment alternatives.
Regularly Jane Tom Tess
Investment Reporting – Based on your recommended implementation option, you will receive investment reporting on a regular basis. This reporting will identify all transactions during the reporting period.
Annually Jane Tom Tess
Portfolio Reviews – Together we will conduct annual meetings to review your portfolio results. If at any time you experience a change in your financial circumstances or life goals, we should discuss the implications that these changes may have on your investment portfolio.
Future Planning Action Steps
When
Who
What Date
Complete [Note1]Jun
e/ 2011 Jane Tom Tess
Life Goals Analysis [Note2]– From our review of your investments, it is apparent that you would gain significant benefit by having us complete a Life Goals Analysis to extend this Investment Policy Statement into an overall Personal Financial Strategy that goes beyond how to manage your portfolio. This Life Goals Analysis is a more comprehensive review of your personal financial goals and objectives and it offers broader recommendations of the action steps that need to be taken to achieve those goals and objectives. The depth of review has many benefits, the primary one being that you’ll have a roadmap to guide you in all of your financial decisions, not just those related to investments. For us to complete this work[Note3], we will need to collect some further information. This would include a discussion about your life goals, information about your personal cash flow and a review of your tax situation.
Apr./ 2011 Jane Tom Tess
Life Goals Analysis in the event of Death or Disability [Note4]– From our review of your investments, it is apparent that you would gain significant benefit by having us complete a Life Goals Analysis in the Event of Death or Disability to extend this Investment Policy Statement into an overall Personal Financial Strategy. For us to complete this work[Note5], we will need to discuss your goals and objectives in the event of pre-mature death or disability. This would include the lifestyle you desire for your family, any bequests you wish to make, as well as other estate planning concerns you might have. We would also review your existing life and disability insurance cover, employee group benefits, creditor insurance and so on.
Dec/2011 Jane Estate Planning Review [Note6]– From our review of your

Date Printed: 3/9/11 Page 25 Default Planner
When
Who
What
Date Complete
Tom Tess
investments, it is apparent that you would gain significant benefit by having us complete an Estate Planning Review for you. This would include a survey of your wills and powers of attorney (for personal property and personal care). Our report would identify any estate liabilities that would arise on your death or that of your spouse. For us to complete this review, we would need to spend time identifying what you would like to happen with your estate in the event of your death. As part of this review, we would examine your wills and powers of attorney.
Apr/2011 Jane Tom Tess
Critical Illness Review [Note7]– Given today’s health care environment, critical illness insurance can protect you against potential exposure to significant medical expenses in the event of a serious or prolonged illness. It will also enable you to obtain time sensitive medical treatment when you need it, rather than being added to a list and waiting until that treatment is available. We feel that it would be beneficial for you to engage us to research the options available to you.
Apr/2011 Jane Tom Tess
Long Term Care Review [Note8]– A review of your options in the event that you require long term care in the future would be very worthwhile. The risk in not doing so is the impact on your lifestyle and the capital erosion to your estate that could occur should you be unable to care for yourself due to a prolonged physical illness, disability or cognitive disorder. We feel that it would be beneficial for you to engage us to research the options available to you.