Investment Performance - Small Cap Growth
377
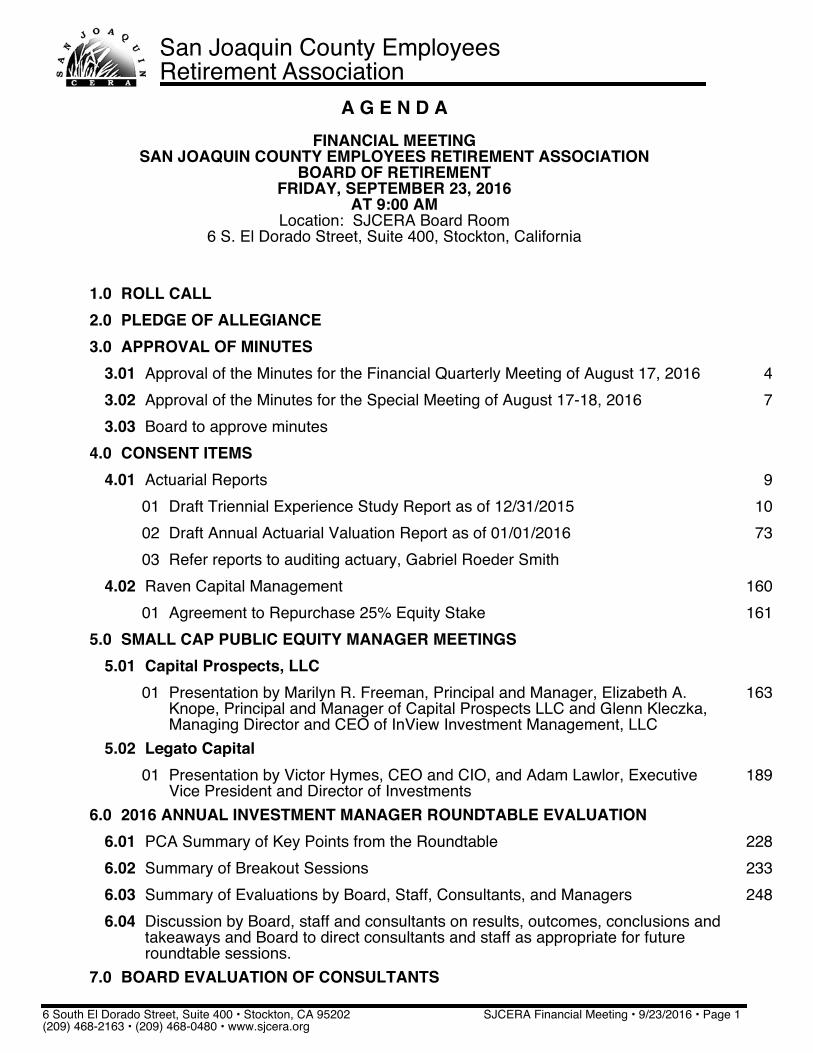
San Joaquin County Employees Retirement Association A G E N D A FINANCIAL MEETING SAN JOAQUIN COUNTY EMPLOYEES RETIREMENT ASSOCIATION BOARD OF RETIREMENT FRIDAY, SEPTEMBER 23, 2016 AT 9:00 AM Location: SJCERA Board Room 6 S. El Dorado Street, Suite 400, Stockton, California 1.0 ROLL CALL 2.0 PLEDGE OF ALLEGIANCE 3.0 APPROVAL OF MINUTES 3.01 Approval of the Minutes for the Financial Quarterly Meeting of August 17, 2016 4 3.02 Approval of the Minutes for the Special Meeting of August 17-18, 2016 7 3.03 Board to approve minutes 4.0 CONSENT ITEMS 4.01 Actuarial Reports 9 01 Draft Triennial Experience Study Report as of 12/31/2015 10 02 Draft Annual Actuarial Valuation Report as of 01/01/2016 73 03 Refer reports to auditing actuary, Gabriel Roeder Smith 4.02 Raven Capital Management 160 01 Agreement to Repurchase 25% Equity Stake 161 5.0 SMALL CAP PUBLIC EQUITY MANAGER MEETINGS 5.01 Capital Prospects, LLC 01 Presentation by Marilyn R. Freeman, Principal and Manager, Elizabeth A. Knope, Principal and Manager of Capital Prospects LLC and Glenn Kleczka, Managing Director and CEO of InView Investment Management, LLC 163 5.02 Legato Capital 01 Presentation by Victor Hymes, CEO and CIO, and Adam Lawlor, Executive Vice President and Director of Investments 189 6.0 2016 ANNUAL INVESTMENT MANAGER ROUNDTABLE EVALUATION 6.01 PCA Summary of Key Points from the Roundtable 228 6.02 Summary of Breakout Sessions 233 6.03 Summary of Evaluations by Board, Staff, Consultants, and Managers 248 6.04 Discussion by Board, staff and consultants on results, outcomes, conclusions and takeaways and Board to direct consultants and staff as appropriate for future roundtable sessions. 7.0 BOARD EVALUATION OF CONSULTANTS 6 South El Dorado Street, Suite 400 • Stockton, CA 95202 (209) 468-2163 • (209) 468-0480 • www.sjcera.org SJCERA Financial Meeting • 9/23/2016 • Page 1
Transcript of Investment Performance - Small Cap Growth
San Joaquin County EmployeesRetirement Association
A G E N D AFINANCIAL MEETING
SAN JOAQUIN COUNTY EMPLOYEES RETIREMENT ASSOCIATIONBOARD OF RETIREMENT
FRIDAY, SEPTEMBER 23, 2016AT 9:00 AM
Location: SJCERA Board Room6 S. El Dorado Street, Suite 400, Stockton, California
1.0 ROLL CALL2.0 PLEDGE OF ALLEGIANCE3.0 APPROVAL OF MINUTES
3.01 Approval of the Minutes for the Financial Quarterly Meeting of August 17, 2016 43.02 Approval of the Minutes for the Special Meeting of August 17-18, 2016 73.03 Board to approve minutes
4.0 CONSENT ITEMS4.01 Actuarial Reports 9
01 Draft Triennial Experience Study Report as of 12/31/2015 1002 Draft Annual Actuarial Valuation Report as of 01/01/2016 7303 Refer reports to auditing actuary, Gabriel Roeder Smith
4.02 Raven Capital Management 16001 Agreement to Repurchase 25% Equity Stake 161
5.0 SMALL CAP PUBLIC EQUITY MANAGER MEETINGS5.01 Capital Prospects, LLC
01 Presentation by Marilyn R. Freeman, Principal and Manager, Elizabeth A.Knope, Principal and Manager of Capital Prospects LLC and Glenn Kleczka,Managing Director and CEO of InView Investment Management, LLC
163
5.02 Legato Capital01 Presentation by Victor Hymes, CEO and CIO, and Adam Lawlor, Executive
Vice President and Director of Investments189
6.0 2016 ANNUAL INVESTMENT MANAGER ROUNDTABLE EVALUATION6.01 PCA Summary of Key Points from the Roundtable 2286.02 Summary of Breakout Sessions 2336.03 Summary of Evaluations by Board, Staff, Consultants, and Managers 2486.04 Discussion by Board, staff and consultants on results, outcomes, conclusions and
takeaways and Board to direct consultants and staff as appropriate for futureroundtable sessions.
7.0 BOARD EVALUATION OF CONSULTANTS
6 South El Dorado Street, Suite 400 • Stockton, CA 95202(209) 468-2163 • (209) 468-0480 • www.sjcera.org
SJCERA Financial Meeting • 9/23/2016 • Page 1

7.01 Consulting Actuary - Board Evaluation Summary 2557.02 General Investment Consultant - Board Evaluation Summary 2577.03 Real Estate Investment Consultant - Board Evaluation Summary 2607.04 Board to discuss and give direction to staff and consultants as appropriate
8.0 REPORTS8.01 Monthly Investment Performance Updates
01 Manager Performance Flash Report - August 2016 (to be provided at themeeting)
02 PCA Investment Market Risk Metrics - September 2016 2628.02 CIO Report 2808.03 Trustee and Executive Staff Travel
01 Conferences and Events Summary for 2016 288a Morgan Creek Capital Management Napa Investment Retreat 289
02 Summary of Pending Trustee and Executive Staff Travel 29203 Summary of Completed Trustee and Executive Staff Travel and Travel Reports
(2)293
a FileMaker Developer Conference 294b IREI Editorial Advisory Board Meeting 297
8.04 Board to accept and file reports and approve (1) pending travel request.9.0 CORRESPONDENCE
9.01 Letters Received01 September 6, 2016 DoubleLine Press Release 29802 September 15, 2016 Bridgewater Associates Press Release 299
9.02 Letters Sent9.03 Market Commentary/Newsletters
01 Research Affiliates Fundamentals August 2016 30102 Morgan Creek Market Review & Outlook Q2 2016 30903 Pension & Investments Online Article August 22, 2016 375
10.0 COMMENTS10.01 Comments from the Board of Retirement10.02 Comments from the Chief Executive Officer10.03 Comments from the Public
11.0 CLOSED SESSION
CONSIDERATION OF INVESTMENT TRANSACTIONS, PURCHASES, SALES;GOVERNMENT CODE SECTION 54956.8 (1)
12.0 CALENDAR
SJCERA Financial Meeting • 9/23/2016 • Page 2

12.01 Regular Meeting, October 14, 2016 at 9:00 AM12.02 Financial Meeting, October 28, 2016 at 9:00 AM
13.0 ADJOURNMENT
SJCERA Financial Meeting • 9/23/2016 • Page 3

M I N U T E SFINANCIAL QUARTERLY MEETING
SAN JOAQUIN COUNTY EMPLOYEES RETIREMENT ASSOCIATIONBOARD OF RETIREMENT
WEDNESDAY, AUGUST 17, 2016AT 9:00 AM
Location: SJCERA Board Room6 S. El Dorado Street, Suite 400, Stockton, California
San Joaquin County EmployeesRetirement Association
1.0 ROLL CALL1.01 MEMBERS PRESENT: Shabbir Khan, J.C. Weydert, Cindy Garman, Michael Duffy,
Katherine Miller, Chanda Bassett, Adrian Van Houten (arrived at 9:40 a.m.), MargoPraus, Raymond McCray and Michael Restuccia presidingMEMBERS ABSENT: NoneSTAFF PRESENT: Chief Executive Officer Annette St. Urbain, Chief InvestmentOfficer Nancy Calkins, Financial Officer Lily Cherng, Information Systems ManagerTallie Claypool, Retirement Investment Accountant Fe Maliwat, Management AnalystIII Greg Frank, Department Information Systems Specialist II Jordan Regevig, andOffice Secretary Andrea IrelandOTHERS PRESENT: Deputy County Counsel Andrew Eshoo, SJCERA ConsultantRobert Palmer, David Sancewich of PCA, Graham Schmidt and Timothy Doyle ofCheiron, Michael Humphrey and Thomas Hester of Courtland Partners, CountyAdministrator Monica Nino, Assistant County Administrator Deborah West, SeniorDeputy County Administrator Chris Rose, and San Joaquin County HumanResources Director Ted Cwiek.
2.0 PLEDGE OF ALLEGIANCE2.01 Led by J.C. Weydert.
3.0 APPROVAL OF MINUTES3.01 Approval of the Minutes for the Financial Meeting of July 22, 20163.02 Board unanimously approved the minutes of the Financial Meeting of July 22,
20164.0 CONSENT ITEMS - NONE5.0 DEMOGRAPHIC AND ECONOMIC ACTUARIAL ASSUMPTIONS
5.01 Presentation by Consulting Actuary Graham Schmidt and Project Manager TimothyDoyle of Cheiron on demographic and economic assumptions for SJCERA
5.02 The Board discussed and directed the Consulting Actuary to use the followingeconomic assumptions (presented as Option 1) for the plan: InvestmentReturn: 7.40%, Wage Inflation: 3.15%, CPI: 2.90%, COLA: 2.60%, andincorporate the demographic assumptions as presented by Cheiron for thefinal annual actuarial valuation report as of January 1, 2016.
6.0 QUARTERLY REPORTS FROM INVESTMENT CONSULTANT FOR PERIOD ENDINGJUNE 30, 2016
6.01 PCA Quarterly Investment Performance Analysis6.02 PCA Manager Compliance Report
6 South El Dorado Street, Suite 400 • Stockton, CA 95202(209) 468-2163 • (209) 468-0480 • www.sjcera.org
SJCERA Financial Quarterly Meeting • 8/17/2016 • Page 1

6.03 David Sancewich reviewed and discussed the reports in relation to the Board’sinvestment policies. The Total Portfolio return was 2.2% for the quarter and 0.8% forthe year ending 6/30/16, outperforming the policy benchmark by 0.6% and 0.7%respectfully, net of fees. The total portfolio outperformed the median public fund overthe most recent quarter and 1-year periods. Since inception results were in line withboth measures. Over the three, five, and ten-year periods, the total portfoliounderperformed the policy benchmark by -0.5%, -0.2%, and -0.1% per annum net offees, respectively.
6.04 Board accepted and filed the reports.7.0 SMALL CAP EQUITY REVIEW EDUCATIONAL SESSION
7.01 Presentation by PCA on Small Cap Equity Review7.02 David Sancewish reviewed information on the small cap equity asset class, it’s role in
a diversified portfolio, and SJCERA’s small cap equity allocation. This was aninformational item in preparation for a review of SJCERA’s Global Equity asset classand manager structure later this year.
8.0 REPORTS8.01 Monthly Investment Performance Updates
01 Manager Performance Summary Report - July 2016 (provided at the meeting)02 PCA Investment Market Risk Metrics - August 2016
8.02 CIO Report
CIO Calkins noted that on August 11, 2016 the U.S. stock markets had a recordtrifecta. For the first time in nearly 17 years (since the dot-com boom), all three majorU.S. stock indexes reach new records on the same day. With new record highs, themarket can also be positioned to fall. With SJCERA’s recent transition toward thenew asset allocation targets, we are structured to weather a decline.
8.03 Report from Real Estate Committee01 CIO Calkins provided a brief summary of the outcome of the Real Estate
Committee meeting and investments.8.04 Board accepted and filed reports
9.0 CORRESPONDENCE9.01 Letters Received
01 Stone Harbor CIO Letter02 Marinus Capital Advisors Mid-Year Investor Letter July 201603 PIMCO Announcement July 20, 2016
9.02 Letters Sent9.03 Market Commentary/Newsletters/Articles
01 Dodge & Cox Fixed Income Investment Commentary - Second Quarter 2016
02 Research Affiliates Fundamentals July 201603 FundFire Bridgewater Associates July 18, 201604 Pension & Investments Bridgewater Associates August 3, 201605 FundFire Bridgewater Associates August 4, 2016
SJCERA Financial Quarterly Meeting • 8/17/2016 • Page 2

10.0 COMMENTS10.01 Comments from the Board of Retirement
01 Trustee Miller appreciated the CALAPRS trustee education program she attendedat Pepperdine University. She found it very valuable and suggested that trusteesattend. She also thanked CEO St. Urbain for her participation in the educationalsessions. CEO St. Urbain noted that Ms. Miller was the only attendee who is acounty supervisor appointed to the retirement board which, along with herexperience as a council person during the City of Stockton bankruptcy, provided avaluable and unique perspective to the class discussions.
10.02 Comments from the Chief Executive Officer01 Alliance Resource Consulting LLC - CEO St. Urbain stated she would add an
agenda item to an upcoming Board Meeting to get further clarification from theBoard regarding the respective roles, relationships, and Board’s expectations ofAlliance Resource Consulting, consultant Robert Palmer, and the CEO.
02 11th Annual Investment Manager Roundtable - CEO St. Urbain reviewed theschedule for the next two days regarding registration, meals, and seatingarrangements at the event.
10.03 Comments from the Public - None11.0 CALENDAR
11.01 Regular Meeting, September 9, 2016 at 9:00 AM11.02 Financial Meeting, September 23, 2016 at 9:00 AM
12.0 ADJOURNMENT12.01 There being no further business the meeting was adjourned at 11:24 a.m.
Respectfully Submitted:
________________________Michael Restuccia, Chair
Attest:
________________________Raymond McCray, Secretary
SJCERA Financial Quarterly Meeting • 8/17/2016 • Page 3

M I N U T E SSPECIAL MEETING
SAN JOAQUIN COUNTY EMPLOYEES RETIREMENT ASSOCIATIONBOARD OF RETIREMENT
WEDNESDAY, AUGUST 17, 2016AT 1:42 PM AND CONTINUING
THURSDAY, AUGUST 18, 2016 AT 8:00 AMLocation: 2505 West Turner Road, Lodi, CA 95242
San Joaquin County EmployeesRetirement Association
1.0 ROLL CALL1.01 MEMBERS PRESENT: Shabbir Khan (absent August 18th), J.C. Weydert, Cindy
Garman, Michael Duffy, Katherine Miller, Chanda Bassett, Adrian Van Houten, MargoPraus, Raymond McCray and Michael Restuccia presidingMEMBERS ABSENT: None August 17th, Shabbir Khan August 18thSTAFF PRESENT: Chief Executive Officer Annette St. Urbain, Chief InvestmentOfficer Nancy Calkins, Financial Officer Lily Cherng, Information Systems ManagerTallie Claypool, Retirement Investment Accountant Fe Maliwat, Management AnalystIII Greg Frank, and Office Secretary Andrea IrelandOTHERS PRESENT: Deputy County Counsel Andrew Eshoo, SJCERA ConsultantRobert Palmer, David Sancewich of PCA, Graham Schmidt of Cheiron, and MichaelHumphrey and Thomas Hester of Courtland Partners.
2.0 INTRODUCTIONS AND OPENING REMARKS2.01 Roundtable Agenda with Time Schedule2.02 The Chair welcomed guests attending the roundtable: Assistant County
Administrator Deborah West, Senior Deputy County Administrator Chris Rose,General Manager Edwin Pattison and Administrative Services Director SarahRagsdale of Mountain House Community Services District, and Chief ExecutiveOfficer Donna DeMartino of San Joaquin Regional Transit District.
Board members, staff, consultants, and manager representatives introducedthemselves and the strategies they manage for SJCERA. David Sancewich ofPension Consulting Alliance moderated the discussion.
3.0 PENSION CHALLENGES AND SJCERA OVERVIEW3.01 David Sancewich summarized SJCERA’s portfolio and plan characteristics and
outlined the challenges (funding and investments) facing SJCERA.4.0 GLOBAL MACRO REVIEW AND OUTLOOK
4.01 Presentation by David Lafferty, Chief Market Strategist, of Natixis Global AssetManagement on the state of the global economy, implications for porftolioconstruction, and asset class outlook.
5.0 CAPITAL MARKETS REVIEW AND OUTLOOK5.01 David Sancewich moderated discussion of the current environment, outlook, and
concerns about U.S. and international capital markets6.0 BREAKOUT SESSION I - RISK AND CHANGE
6 South El Dorado Street, Suite 400 • Stockton, CA 95202(209) 468-2163 • (209) 468-0480 • www.sjcera.org
SJCERA Special Meeting • 8/17/2016 • Page 1

6.01 Board members and investment manager representatives formed smaller groups todiscuss what risks SJCERA’s investment managers are concerned about with regardto SJCERA’s assets and the changes they would make to the SJCERA investmentportfolio.
7.0 BREAKOUT SESSION SUMMARY AND DISCUSSION7.01 The group reassembled in a general session and a representative from each table
reviewed the key points and take-aways of that table’s discussion.8.0 RECESSED UNTIL THURSDAY, AUGUST 18, 2016 AT 8:00 AM
8.01 The Special Meeting recessed at 5:35 p.m., on Wednesday, August 17, 2016, andreconvened at 8:00 a.m. on Thursday, August 18, 2016, with all Board Membersexcept Shabbir Khan present.
9.0 GLOBAL GROWTH AND INTEREST RATES9.01 David Sancewich asked the group to comment on whether the federal reserve board
has lost control of its ability to control inflation and whether the current and expectedinterest rate policy make sense in today’s market.
10.0 BREAKOUT SESSION II - INVESTMENT OPPORTUNITIES FOR SJCERA10.01 Board members and investment manager representatives formed smaller discussion
groups to address investment opportunities for SJCERA.11.0 BREAKOUT SESSION SUMMARY AND DISCUSSION
11.01 The group reassembled in a general session and a representative from each tablereported their group’s suggestions about investment opportunities for SJCERA.
12.0 SUMMARY AND WRAP-UP12.01 David Sancewich reviewed the one-year market return predictions from the group last
year, and repeated the process for the current year. He also reviewed some of thekey discussion points of the roundtable. He also thanked the Board members,investment managers, and SJCERA staff for their attendance and participation in theroundtable.
13.0 COMMENTS13.01 Chair Restuccia expressed his appreciation to all involved on behalf of the Board.13.02 CEO St. Urbain thanked all involved and reminded attendees to complete their
evaluations of the roundtable.14.0 ADJOURNMENT
14.01 There being no further business the meeting was adjourned at 11:30 a.m.
Respectfully Submitted:
_______________________Michael Restuccia, Chair
Attest:
_______________________Raymond McCray, Secretary
SJCERA Special Meeting • 8/17/2016 • Page 2

Board of Retirement Financial Meeting San Joaquin County Employees’ Retirement Association
Agenda Item 4.01 September 23, 2016 SUBJECT: Refer Actuarial Reports to Auditing Actuary SUBMITTED FOR: _X__ CONSENT l__l ACTION ___ INFORMATION RECOMMENDATION Staff recommends the Board accept the draft triennial experience study report as of 12/31/2015 and the draft annual actuarial valuation report as of 01/01/2016 from the plan actuary Cheiron, and refer to the auditing actuary Gabriel Roeder Smith (GRS).
PURPOSE To ensure timely completion of the parallel studies GRS was engaged to conduct and receive findings and recommendations from GRS at the Financial Meeting of October 28, 2016. DISCUSSION At the February 12, 2016 Regular meeting, the Board authorized the release of the Request for Proposal (RFP) 2016-01 for Actuarial Audit Services for the Triennial Experience Study and Annual Actuarial Valuation for the periods ending December 31, 2015 and later hired GRS to be the auditing actuary. Upon receiving these draft actuarial reports from Cheiron, GRS will be able to conclude its work and present its findings and recommendations to the Board at the Financial Meeting of October 28, 2016. While Cheiron’s work in recommending and incorporating the Board’s changes to actuarial assumptions and these reports are final, providing them in draft form gives the Board an opportunity to direct Cheiron to incorporate changes or adjustments based on the findings and recommendations provided by GRS. Graham Schmidt of Cheiron will have an opportunity to review GRS’ report to the Board prior to, and will attend, the October Financial Meeting. Final reports from Cheiron, including the recommended member and employer contribution rates for 2017, will be submitted to the Board for formal action in November. The contribution rates will then be submitted to the Board of Supervisors for adoption prior to December 31, 2016. ATTACHMENT Draft Triennial Experience Study Report as of 12/31/2015 Draft Annual Actuarial Valuation Report as of 01/01/2016
__________________________ ANNETTE ST. URBAIN Chief Executive Officer

San Joaquin County Employees’ Retirement Association
Actuarial Experience Study for January 1, 2013 through December 31, 2015
Produced by Cheiron
September 2016
DRAFT

TABLE OF CONTENTS
Section Page
Transmittal Letter i
Section I Executive Summary ..............................................................................................1
Section II Economic Assumptions ........................................................................................3
A. Price Inflation........................................................................................................3 B. Wage Inflation ......................................................................................................6 C. COLA Inflation .....................................................................................................7 D. Discount Rate ........................................................................................................8
Section III Demographic Assumptions .................................................................................13
A. Merit Salary Increases.........................................................................................13 B. Retirement Rates .................................................................................................17 C. Termination Rates ...............................................................................................30 D. Disability Rates ...................................................................................................36 E. Mortality Rates....................................................................................................39 F. Other Demographic Assumptions .......................................................................44
Appendices
Appendix A Summary of Proposed Assumptions ...................................................................47
Appendix B Summary of Prior Assumptions ..........................................................................53

September 15, 2016
Board of Retirement San Joaquin County Employees’ Retirement Association 6 South El Dorado St, Suite 400 Stockton, CA 95202
Dear Members of the Board:
The purpose of this report is to present an Actuarial Experience Study of the San Joaquin County Employees’ Retirement Association (SJCERA, the Fund, the Plan) covering actuarial experience from January 1, 2013 through December 31, 2015. The report includes analyses and recommendations of economic and demographic assumptions to be used beginning with the January 1, 2016 actuarial valuation.
The purpose of this report is to provide the results of an Actuarial Experience Study of the San Joaquin County Employees’ Retirement Association (SJCERA) covering actuarial experience from January 1, 2013 through December 31, 2015. This report is for the use of the SJCERA Retirement Board in selecting assumptions to be used in actuarial valuations beginning January 1, 2016.
In preparing our report, we relied on information (some oral and some written) supplied by SJCERA. This information includes, but is not limited to, the plan provisions, employee data, and financial information. We performed an informal examination of the obvious characteristics of the data for reasonableness and consistency in accordance with Actuarial Standard of Practice No. 23.
To the best of our knowledge, this report and its contents have been prepared in accordance with generally recognized and accepted actuarial principles and practices that are consistent with the Code of Professional Conduct and applicable Actuarial Standards of Practice set out by the Actuarial Standards Board. Furthermore, as credentialed actuaries, we meet the Qualification Standards of the American Academy of Actuaries to render the opinion contained in this report. This report does not address any contractual or legal issues. We are not attorneys and our firm does not provide any legal services or advice.
This report was prepared for the SJCERA Retirement Board for the purposes described herein. This report is not intended to benefit any other party, and Cheiron assumes no duty or liability to any such party.
If you have any questions about the report or would like additional information, please let us know.

Board of Retirement September 15, 2016 Page ii
Sincerely, Cheiron
Graham A. Schmidt, ASA, FCA, EA, MAAA Timothy S. Doyle, ASA, MAAA Consulting Actuary Associate Actuary
Anne Harper, FSA, FCA, EA, MAAA Consulting Actuary
SAN JOAQUIN COUNTY EMPLOYEES’ RETIREMENT ASSOCIATION EXPERIENCE STUDY AS OF DECEMBER 31, 2015
SECTION I – EXECUTIVE SUMMARY
1
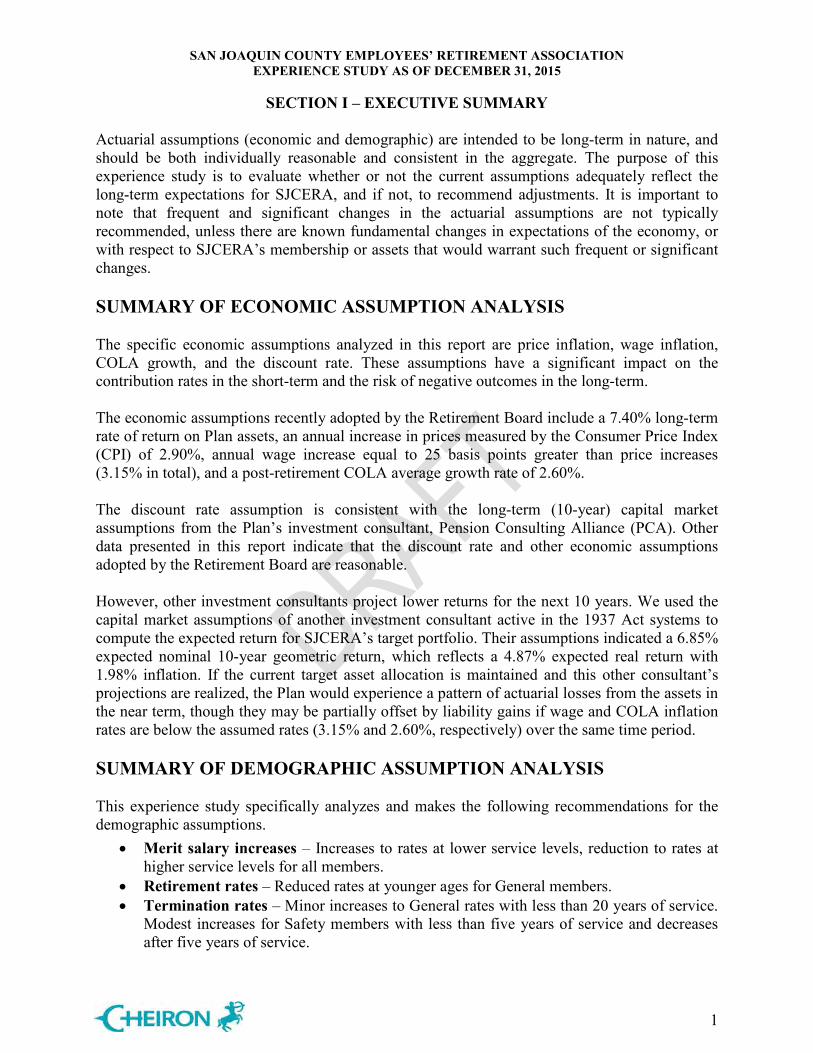
Actuarial assumptions (economic and demographic) are intended to be long-term in nature, and should be both individually reasonable and consistent in the aggregate. The purpose of this experience study is to evaluate whether or not the current assumptions adequately reflect the long-term expectations for SJCERA, and if not, to recommend adjustments. It is important to note that frequent and significant changes in the actuarial assumptions are not typically recommended, unless there are known fundamental changes in expectations of the economy, or with respect to SJCERA’s membership or assets that would warrant such frequent or significant changes.
SUMMARY OF ECONOMIC ASSUMPTION ANALYSIS
The specific economic assumptions analyzed in this report are price inflation, wage inflation, COLA growth, and the discount rate. These assumptions have a significant impact on the contribution rates in the short-term and the risk of negative outcomes in the long-term.
The economic assumptions recently adopted by the Retirement Board include a 7.40% long-term rate of return on Plan assets, an annual increase in prices measured by the Consumer Price Index (CPI) of 2.90%, annual wage increase equal to 25 basis points greater than price increases (3.15% in total), and a post-retirement COLA average growth rate of 2.60%.
The discount rate assumption is consistent with the long-term (10-year) capital market assumptions from the Plan’s investment consultant, Pension Consulting Alliance (PCA). Other data presented in this report indicate that the discount rate and other economic assumptions adopted by the Retirement Board are reasonable.
However, other investment consultants project lower returns for the next 10 years. We used the capital market assumptions of another investment consultant active in the 1937 Act systems to compute the expected return for SJCERA’s target portfolio. Their assumptions indicated a 6.85% expected nominal 10-year geometric return, which reflects a 4.87% expected real return with 1.98% inflation. If the current target asset allocation is maintained and this other consultant’s projections are realized, the Plan would experience a pattern of actuarial losses from the assets in the near term, though they may be partially offset by liability gains if wage and COLA inflation rates are below the assumed rates (3.15% and 2.60%, respectively) over the same time period.
SUMMARY OF DEMOGRAPHIC ASSUMPTION ANALYSIS
This experience study specifically analyzes and makes the following recommendations for the demographic assumptions.
• Merit salary increases – Increases to rates at lower service levels, reduction to rates athigher service levels for all members.
• Retirement rates – Reduced rates at younger ages for General members.• Termination rates – Minor increases to General rates with less than 20 years of service.
Modest increases for Safety members with less than five years of service and decreasesafter five years of service.

SAN JOAQUIN COUNTY EMPLOYEES’ RETIREMENT ASSOCIATION EXPERIENCE STUDY AS OF DECEMBER 31, 2015
SECTION I – EXECUTIVE SUMMARY
2
• Disability rates – Decrease in Safety rates for members over age 50. Add assumption for members over age 60.
• Mortality rates – Adjusted CalPERS base tables, with generational improvement for all members.
• Other assumptions – Minor changes to other assumptions, including Safety deferral age, marital assumptions, and COLA timing.
The body of this report provides additional detail and support for our conclusions and recommendations. COST OF ECONOMIC AND DEMOGRAPHIC ASSUMPTION CHANGES Among the demographic assumptions, the recommended changes to mortality and merit salary increase assumptions have the largest impact on contribution rates. This table summarizes the estimated cost impact – for the General, Safety, and combined membership - of the recommended changes to economic and demographic assumptions contained in this report.
General Contribution
Rate
Safety Contribution
Rate
Total Contribution
RateTotal Employer
CostJanuary 1, 2016 before Assumption Changes $ 35.68% 72.42% 41.71% 167,539,980 Assumption Change:
Mortality Rates 1.19% ( 0.09%) 0.99% 4,088,197 Retirement Rates ( 0.21%) 0.00% ( 0.18%) (596,851)Termination Rates ( 0.32%) 0.15% ( 0.24%) (1,049,760)Disability Rates 0.00% ( 0.21%) ( 0.03%) (134,489)Merit Salary Increases ( 1.42%) ( 4.56%) ( 1.95%) (7,737,960)Deferral Age 0.00% 0.67% 0.11% 443,925 Marital % and Age Difference 0.35% 0.60% 0.40% 1,569,385 COLA Timing 0.61% 1.03% 0.66% 2,708,086 Withdrawal and Transfer Assumptions 0.26% 0.56% 0.31% 1,283,257 Economic Assumptions 0.94% 1.99% 1.12% 4,472,499 Employee Contribution Rates 0.07% 0.18% 0.09% 358,466
January 1, 2016 after Assumption Changes $ 37.15% 72.74% 42.99% 172,944,736
TABLE I-1Summary of Changes in Employer Plan Cost from Experience Study Changes

SAN JOAQUIN COUNTY EMPLOYEES’ RETIREMENT ASSOCIATION EXPERIENCE STUDY AS OF DECEMBER 31, 2015
SECTION II – ECONOMIC ASSUMPTIONS
PRICE INFLATION
3
The economic assumptions used in actuarial valuations are intended to be long-term in nature, and should be both individually reasonable and consistent with each other. The specific assumptions analyzed in this report are:
• Price inflation – used indirectly as an underlying component of other economic assumptions.
• Wage inflation – across the board wage growth used to project benefits and to amortize the unfunded liability as a level percentage of expected payroll.
• COLA growth – rate at which inflation-linked post-retirement COLAs are expected to change.
• Discount rate – used both to project long-term asset growth and to discount future cash flows in calculating the liabilities and costs of the Plan.
In order to develop recommendations for each of these assumptions, we considered historical data, both nationally and for the Plan, and expectations for the future, as expressed by the Plan’s and other external investment consultants and the Board. PRICE INFLATION Long-term price inflation rates are the foundation of other economic assumptions. In a growing economy, wages and investments are expected to grow at the underlying inflation rate plus some additional real growth rate, whether it reflects productivity in terms of wages or risk premiums in terms of investments. Historical Data Chart II-1 below shows inflation for the U.S. by individual year since 1950.
Chart II-1
Over the 50 years ending December 2015, the geometric average inflation rate for the U.S. has been about 4.1%, but this average is heavily influenced by the high inflation rates in the 1970s

SAN JOAQUIN COUNTY EMPLOYEES’ RETIREMENT ASSOCIATION EXPERIENCE STUDY AS OF DECEMBER 31, 2015
SECTION II – ECONOMIC ASSUMPTIONS
PRICE INFLATION
4
and early 1980s. Over the last 30 years, the geometric average inflation rate has been 2.6%, and only about 1.9% over the past 10 years. Future Expectations A measure of the market consensus of expected future inflation rates is the difference in yields between conventional treasury bonds and Treasury Inflation-Protected Securities (TIPS) at the same maturity. Table II-1 shows the yields on both types of bonds and the break-even inflation rate as of December 2015. Break-even inflation is the level of inflation needed for an investment in TIPS to “break even” with an investment in conventional treasury bonds of the same maturity.
Table II-1
Data Source Federal Reserve, Constant Maturity Yields, Monthly Series
The Federal Reserve Bank of Cleveland publishes a forecast of inflation based primarily on this same data, as well as additional information such as inflation swaps and surveys of professional forecasters. Chart II-2 shows a summary of their published expectations as of the last three valuation dates.
Chart II-2
Time to Maturity
Conventional Yield
TIPS Yield
Break Even Inflation
5 Years 1.70% 0.46% 1.24%10 Years 2.24% 0.73% 1.51%20 Years 2.61% 1.06% 1.55%
Break-Even Inflation Based on Treasury Bond Yields

SAN JOAQUIN COUNTY EMPLOYEES’ RETIREMENT ASSOCIATION EXPERIENCE STUDY AS OF DECEMBER 31, 2015
SECTION II – ECONOMIC ASSUMPTIONS
PRICE INFLATION
5
The Federal Reserve Bank of Philadelphia publishes a quarterly survey of professional economic forecasters. Chart III-3 shows the distribution of the professionals forecasts for average inflation over the next 10 years compared to assumptions used by California public pension plans.
Chart II-3
Finally, PCA, the Board’s investment consultant, uses an inflation assumption of 2.25%, similar to that of many other investment consultants. Based on all of these considerations, we believe a reasonable range for long-term price inflation for use in the Plan’s actuarial valuations is between 2.0% and 3.25%. Therefore, we agree with the Board’s recent action to reduce the assumption from 3.00% to 2.90%. If, at the time of the next review of economic assumptions, the markets and forecasters continue to indicate lower expectations of future inflation, further reductions in the assumption could be considered.
Minimum 1.59% 2.50%25th Percentile 2.00% 3.00%50th Percentile 2.12% 3.00%75th Percentile 2.40% 3.25%Maximum 3.10% 3.30%
0.0%
0.5%
1.0%
1.5%
2.0%
2.5%
3.0%
3.5%
EconomicForecasters
CaliforniaPlans
Survey of CPI Assumptions
Min to 25th 25th to 50th50th to 75th 75th to Max
SAN JOAQUIN COUNTY EMPLOYEES’ RETIREMENT ASSOCIATION EXPERIENCE STUDY AS OF DECEMBER 31, 2015
SECTION II – ECONOMIC ASSUMPTIONS
WAGE INFLATION AND COLA GROWTH
6
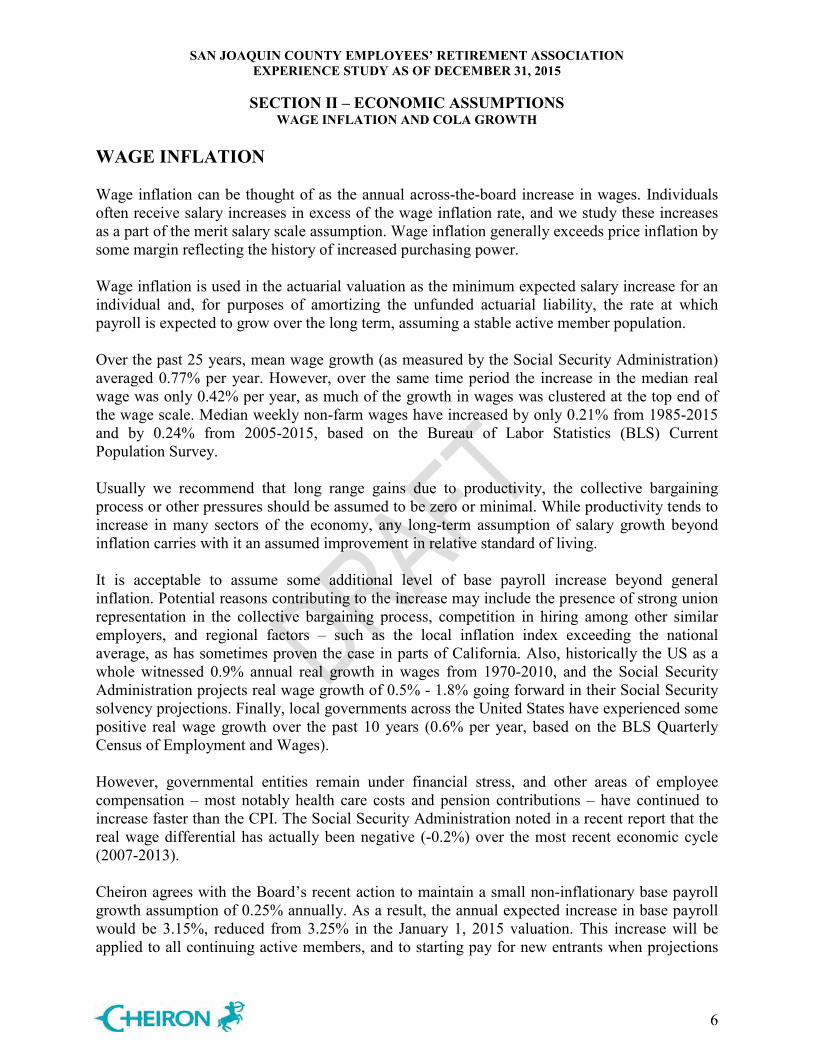
WAGE INFLATION Wage inflation can be thought of as the annual across-the-board increase in wages. Individuals often receive salary increases in excess of the wage inflation rate, and we study these increases as a part of the merit salary scale assumption. Wage inflation generally exceeds price inflation by some margin reflecting the history of increased purchasing power. Wage inflation is used in the actuarial valuation as the minimum expected salary increase for an individual and, for purposes of amortizing the unfunded actuarial liability, the rate at which payroll is expected to grow over the long term, assuming a stable active member population. Over the past 25 years, mean wage growth (as measured by the Social Security Administration) averaged 0.77% per year. However, over the same time period the increase in the median real wage was only 0.42% per year, as much of the growth in wages was clustered at the top end of the wage scale. Median weekly non-farm wages have increased by only 0.21% from 1985-2015 and by 0.24% from 2005-2015, based on the Bureau of Labor Statistics (BLS) Current Population Survey.
Usually we recommend that long range gains due to productivity, the collective bargaining process or other pressures should be assumed to be zero or minimal. While productivity tends to increase in many sectors of the economy, any long-term assumption of salary growth beyond inflation carries with it an assumed improvement in relative standard of living. It is acceptable to assume some additional level of base payroll increase beyond general inflation. Potential reasons contributing to the increase may include the presence of strong union representation in the collective bargaining process, competition in hiring among other similar employers, and regional factors – such as the local inflation index exceeding the national average, as has sometimes proven the case in parts of California. Also, historically the US as a whole witnessed 0.9% annual real growth in wages from 1970-2010, and the Social Security Administration projects real wage growth of 0.5% - 1.8% going forward in their Social Security solvency projections. Finally, local governments across the United States have experienced some positive real wage growth over the past 10 years (0.6% per year, based on the BLS Quarterly Census of Employment and Wages). However, governmental entities remain under financial stress, and other areas of employee compensation – most notably health care costs and pension contributions – have continued to increase faster than the CPI. The Social Security Administration noted in a recent report that the real wage differential has actually been negative (-0.2%) over the most recent economic cycle (2007-2013). Cheiron agrees with the Board’s recent action to maintain a small non-inflationary base payroll growth assumption of 0.25% annually. As a result, the annual expected increase in base payroll would be 3.15%, reduced from 3.25% in the January 1, 2015 valuation. This increase will be applied to all continuing active members, and to starting pay for new entrants when projections
SAN JOAQUIN COUNTY EMPLOYEES’ RETIREMENT ASSOCIATION EXPERIENCE STUDY AS OF DECEMBER 31, 2015
SECTION II – ECONOMIC ASSUMPTIONS
WAGE INFLATION AND COLA GROWTH
7
of future populations are required. This increase will also be used in the calculation of the unfunded liability amortization payment as a level percentage of payroll. COLA GROWTH Members of SJCERA are eligible to receive automatic Cost of Living Adjustments (COLAs), based on the growth in the Bay Area Consumer Price Index (CPI-U) and a 3% cap on the annual COLA increase. Any increase in the CPI above the maximum increase can be banked for future years in which the change in the CPI is below the maximum increase. It is necessary to determine an assumed rate of COLA growth, reflecting both inflation (i.e. the growth in the CPI), and the interaction of the CPI with the COLA cap and banking mechanism. Simulations of inflation show us that the average growth in the COLA is expected to be below the cap, even if the expected increase in the CPI is equal to or higher than the cap itself. This is because if there is not a significant bank already in existence (such as in the early years of retirement) and there are years in which inflation is below the cap, this shortfall will not be made up in future years. We have produced statistical simulations of inflation and then modeled how the COLA maximum and the banking process interact with the changes in CPI. For a given long-term estimate of inflation, we used two sets of inputs and then blended the results: a 50% autocorrelation factor with 1.5% annual inflation volatility, and a 25% autocorrelation factor with 1.0% annual inflation volatility. A starting inflation level of 2.25% was used in all simulations, to reflect the low level of current inflation. Based on a blending of the results under the two sets of inputs, and using the 2.9% inflation assumption adopted by the Board and found to be reasonable by Cheiron, we recommend maintaining the 2.6% COLA growth assumption used in the prior actuarial valuation. Finally, we note that the actuarial valuation software (ProVal) used by Cheiron has been updated to allow for the specification of an exact date on which COLA increases will be applied, which in SJCERA's case will be April 1 of each year. In prior valuations, a load was applied to the Plan’s liabilities to account for the April 1 timing of the COLA; in future valuations, the date of COLA will be reflected directly in the valuation coding.

SAN JOAQUIN COUNTY EMPLOYEES’ RETIREMENT ASSOCIATION EXPERIENCE STUDY AS OF DECEMBER 31, 2015
SECTION II – ECONOMIC ASSUMPTIONS
DISCOUNT RATE
8
DISCOUNT RATE The discount rate assumption is generally the most significant of all the assumptions employed in actuarial valuations. The discount rate is based on the long-term expected return on plan investments. In the short-term, a higher discount rate results in lower expected contributions. However, over the long term, actual contributions will depend on actual investment returns and not the discount rate (or expected investment returns). If actual investment returns are lower than expected, contribution rates will increase in the future. It is important to set a realistic discount rate so that projections of future contributions for budgeting purposes will not be biased, particularly to be too low. Other Large Public Retirement Plans Based on the Public Fund Survey, developed by the National Association of State Retirement Administrators (NASRA) covering most of the largest public retirement systems in the country, there has been a general movement over at least the last decade to reduce the discount rate used in actuarial valuations. Chart II-4 below shows the change in the distribution of assumptions since 2001. The median assumption is now 7.75% and the number of plans using a discount rate of 7.5% or lower has increased significantly.
Chart II-4
SAN JOAQUIN COUNTY EMPLOYEES’ RETIREMENT ASSOCIATION EXPERIENCE STUDY AS OF DECEMBER 31, 2015
SECTION II – ECONOMIC ASSUMPTIONS
DISCOUNT RATE
9
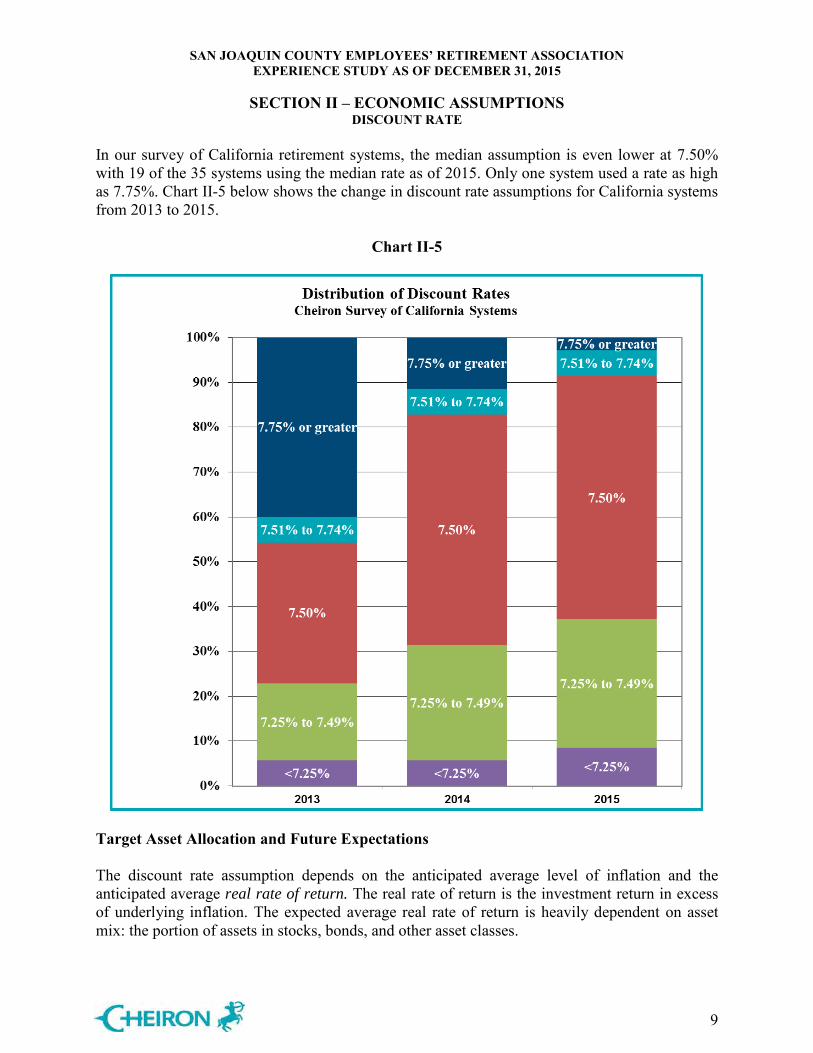
In our survey of California retirement systems, the median assumption is even lower at 7.50% with 19 of the 35 systems using the median rate as of 2015. Only one system used a rate as high as 7.75%. Chart II-5 below shows the change in discount rate assumptions for California systems from 2013 to 2015.
Chart II-5
Target Asset Allocation and Future Expectations The discount rate assumption depends on the anticipated average level of inflation and the anticipated average real rate of return. The real rate of return is the investment return in excess of underlying inflation. The expected average real rate of return is heavily dependent on asset mix: the portion of assets in stocks, bonds, and other asset classes.

SAN JOAQUIN COUNTY EMPLOYEES’ RETIREMENT ASSOCIATION EXPERIENCE STUDY AS OF DECEMBER 31, 2015
SECTION II – ECONOMIC ASSUMPTIONS
DISCOUNT RATE
10
Tables II-2 and II-3 on the next page show the target allocation based on the Board’s current policy along with the capital market assumptions provided by the Plan’s investment consultant (PCA), and those from another investment consultant active in the 1937 Act systems (Verus). We elected to use Verus’ assumptions to illustrate an alternative outlook, because they had similar benchmarks for most asset classes to those used by PCA. The PCA and Verus assumptions are both intended to project returns over a 10-year period. Based on these assumptions, we calculated an expected geometric return of 7.50% under the PCA assumptions, but only a 6.85% return under the Verus assumptions.
Table II-2
.
Table II-3
* The Verus assumptions did not include Credit, Private Appreciation or Crisis Risk Offset classes, therefore we used a blending of Verus asset classes with similar benchmarks for these classes.
PCA (10-year) Assumptions
Target Arithmetic Geometric StandardAsset Category Allocation Return Return Deviation
Global Equity 30.0% 9.1% 7.5% 19.0%Stable Fixed 10.0% 3.0% 2.9% 4.0%Credit 14.0% 8.0% 7.5% 10.0%Risk Parity 14.0% 6.0% 5.0% 14.4%Private Appreciation 12.0% 12.1% 9.2% 26.0%Crisis Risk Offset 20.0% 7.8% 7.1% 11.9%
Total 100.0% 7.99% 7.50% 10.32%Real Return 5.74% 5.25%
Verus (10-year) Assumptions*
Target Arithmetic Geometric StandardAsset Category Allocation Return Return Deviation
Global Equity 30.0% 9.1% 7.8% 16.9%Stable Fixed 10.0% 3.3% 3.3% 3.2%Credit (HY) 7.0% 7.6% 7.1% 10.6%Credit (Lev Loan)) 7.0% 4.5% 4.2% 8.1%Risk Parity 14.0% 7.5% 7.0% 10.0%Private Equity 12.0% 11.0% 8.6% 23.7%Crisis Risk Offset (Treas) 6.7% 2.5% 2.3% 6.5%Crisis Risk Offset (HF) 13.3% 6.40% 6.02% 9.00%
Total 100.0% 7.30% 6.85% 9.83%Real Return 5.32% 4.87%

SAN JOAQUIN COUNTY EMPLOYEES’ RETIREMENT ASSOCIATION EXPERIENCE STUDY AS OF DECEMBER 31, 2015
SECTION II – ECONOMIC ASSUMPTIONS
DISCOUNT RATE
11
Based on these capital market assumptions, we also calculated the potential distribution of returns over 10-year periods as shown in Table II-4. The 50th percentile return under the PCA survey assumptions was 7.50%, which is slightly higher than the 7.40% nominal return recently adopted by the Board. Using PCA’s average inflation assumption (2.25%), this results in a 5.25% real return assumption.
Table II-4
As stated earlier in this report, the Verus geometric assumption for the current target portfolio is considerably lower over the next 10 years (6.85%). However, the median real return under the Verus assumptions (4.87%) is still higher than that recently adopted by the Board: 4.50%, based on a 7.40% nominal return and 2.90% price inflation.
As of the 2013 valuation, the expected rate of return is expressed net of investment, but not administrative expenses. The returns above were modeled based on the expected returns of the portfolio benchmark indices, which are expected to have minimal expenses. The actuarial standards on selecting a return assumption (ASOP 27) state that in general superior or inferior returns (net of fees) should not be assumed for active versus passive management, therefore we do not recommend a significant adjustment to the modeled returns for the fees of the asset managers. However, a slight margin is appropriate to reflect the investment-related expenses other than those of the investment managers, which would include the investment advisor and custodian.
The recently adopted discount rate of 7.40% is consistent with the PCA long-term capital market assumptions, including a small adjustment for investment-related expenses as described above. We therefore find the current discount rate to be a reasonable assumption. However, there are a number of factors that suggest that the near-term expected rate of return should be discussed.
• Many investment consultants expect poor rates of return in the immediate and near-term future. They reason that there is little in the way of yields on fixed income, and that the equity markets are fully valued.

SAN JOAQUIN COUNTY EMPLOYEES’ RETIREMENT ASSOCIATION EXPERIENCE STUDY AS OF DECEMBER 31, 2015
SECTION II – ECONOMIC ASSUMPTIONS
DISCOUNT RATE
12
• If Verus and much of the investment community are correct in their projections, we can expect returns below the 7.40% assumed rate for a number of years. This will result in actuarial losses and increases in employer contribution rates. However, these losses may be partially offset by gains on the liabilities from price and wage inflation below the assumed level (2.90% and 3.15%, respectively)
• We believe that near- and mid-term return projections should be considered along with long-term projections. Fund performance is usually measured over five to ten years; longer measurement periods are often considered less relevant because of the potential for changes in the economy and in the investment markets.
We recommend that the Board and staff continue to conduct at least a brief discussion of this assumption annually, in consultation with the Plan’s actuary and investment consultant, to determine if further changes are appropriate.
SAN JOAQUIN COUNTY EMPLOYEES’ RETIREMENT ASSOCIATION EXPERIENCE STUDY AS OF DECEMBER 31, 2015
SECTION III – DEMOGRAPHIC ASSUMPTIONS
MERIT SALARY INCREASES
13
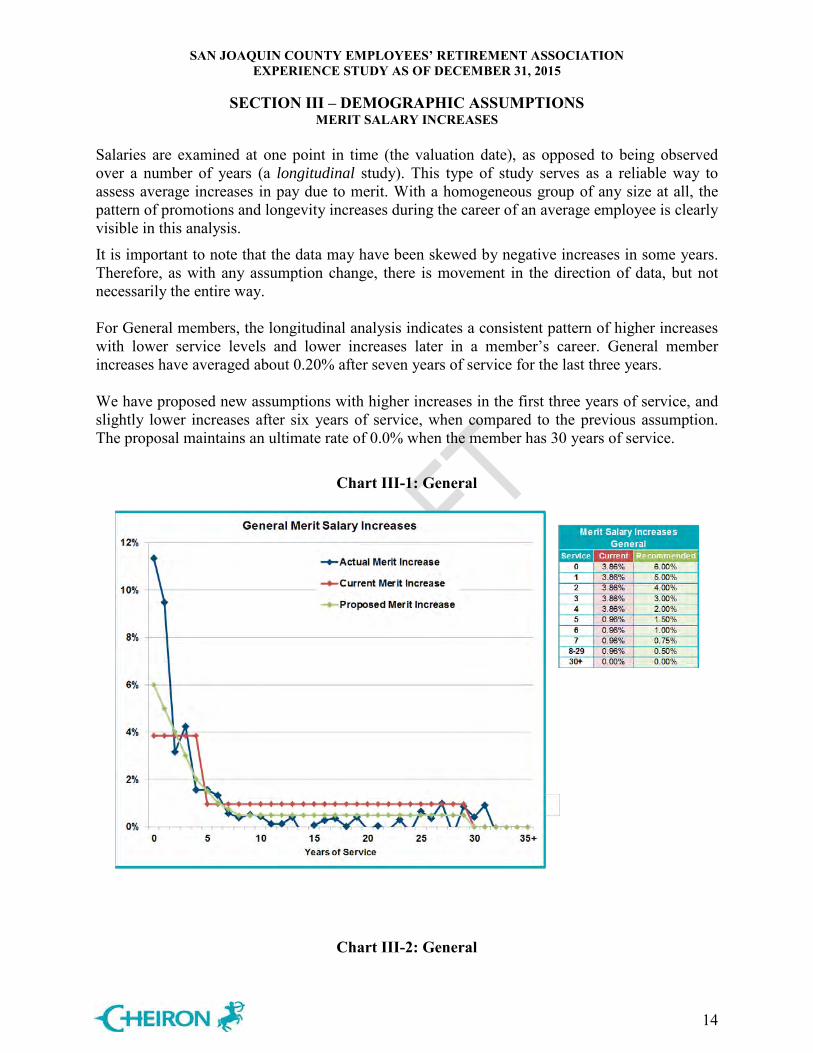
Demographic assumptions are used to predict membership behavior, including rates of retirement, termination, disability, and mortality. These assumptions are based primarily on the historical experience of SJCERA, with some adjustments where future experience is expected to differ from historical experience and with deference to standard tables where SJCERA experience is not fully credible and a standard table is available. For purposes of this study, merit salary increases are also considered a demographic assumption because the assumption is based primarily on SJCERA’s historical experience. MERIT SALARY INCREASES Salary increases consist of three components: Increases due to cost of living maintenance (inflation), increases related to non-inflationary pressures on base pay (such as productivity increases), and increases in individual pay due to merit, promotion, and longevity. Increases due to cost of living and non-inflationary base pay factors were addressed in an earlier section of this report. The merit salary increase assumption is analyzed by employee group and by service. Generally, newer employees are more likely to earn a longevity increase or receive a promotion, so their salary increases tend to be greater than those for longer service employees. Two different approaches were used to analyze the merit increases: a longitudinal study and a transverse study. A longitudinal study reviews the average increase in pay for each level of service. To analyze the merit component, we subtracted the Plan’s real wage growth - as measured by the base wage increases reflected in the most recent collective bargaining agreements covering most employees - from the total pay increases experienced by each member during the experience study period. Longitudinal studies, which use changes in pay collected over several years need to consider the effects of inflation, collective bargaining, and management decisions during the term of the study in order to be reliable. Charts III-1 and III-3 on the following pages analyze the pay patterns for General and Safety members, respectively. The charts show the current assumption (red line) compared to the actual experience (blue line) and the proposed assumption (green line). Charts III-2 and III-4 illustrate the results of the transverse study. It compares the current pay patterns for each group with current pay data. Only increases due to merit (longevity and promotion) are considered here. In the graphs, the average pay of the active General and Safety members of December 31, 2015 is plotted against service. A curve is then fitted to the average pay data, and this curve is used to determine a pay increase due to merit.
In each chart, the current assumed pay increases due to merit are shown by the teal line and the proposed pay increases due to merit are shown by the purple line. The blue diamonds represent the average pay at each year of service. The charts show proposed modifications to the merit salary increases for both General and Safety members.
SAN JOAQUIN COUNTY EMPLOYEES’ RETIREMENT ASSOCIATION EXPERIENCE STUDY AS OF DECEMBER 31, 2015
SECTION III – DEMOGRAPHIC ASSUMPTIONS
MERIT SALARY INCREASES
14
Salaries are examined at one point in time (the valuation date), as opposed to being observed over a number of years (a longitudinal study). This type of study serves as a reliable way to assess average increases in pay due to merit. With a homogeneous group of any size at all, the pattern of promotions and longevity increases during the career of an average employee is clearly visible in this analysis.
It is important to note that the data may have been skewed by negative increases in some years. Therefore, as with any assumption change, there is movement in the direction of data, but not necessarily the entire way. For General members, the longitudinal analysis indicates a consistent pattern of higher increases with lower service levels and lower increases later in a member’s career. General member increases have averaged about 0.20% after seven years of service for the last three years. We have proposed new assumptions with higher increases in the first three years of service, and slightly lower increases after six years of service, when compared to the previous assumption. The proposal maintains an ultimate rate of 0.0% when the member has 30 years of service.
Chart III-1: General
Chart III-2: General
SAN JOAQUIN COUNTY EMPLOYEES’ RETIREMENT ASSOCIATION EXPERIENCE STUDY AS OF DECEMBER 31, 2015
SECTION III – DEMOGRAPHIC ASSUMPTIONS
MERIT SALARY INCREASES
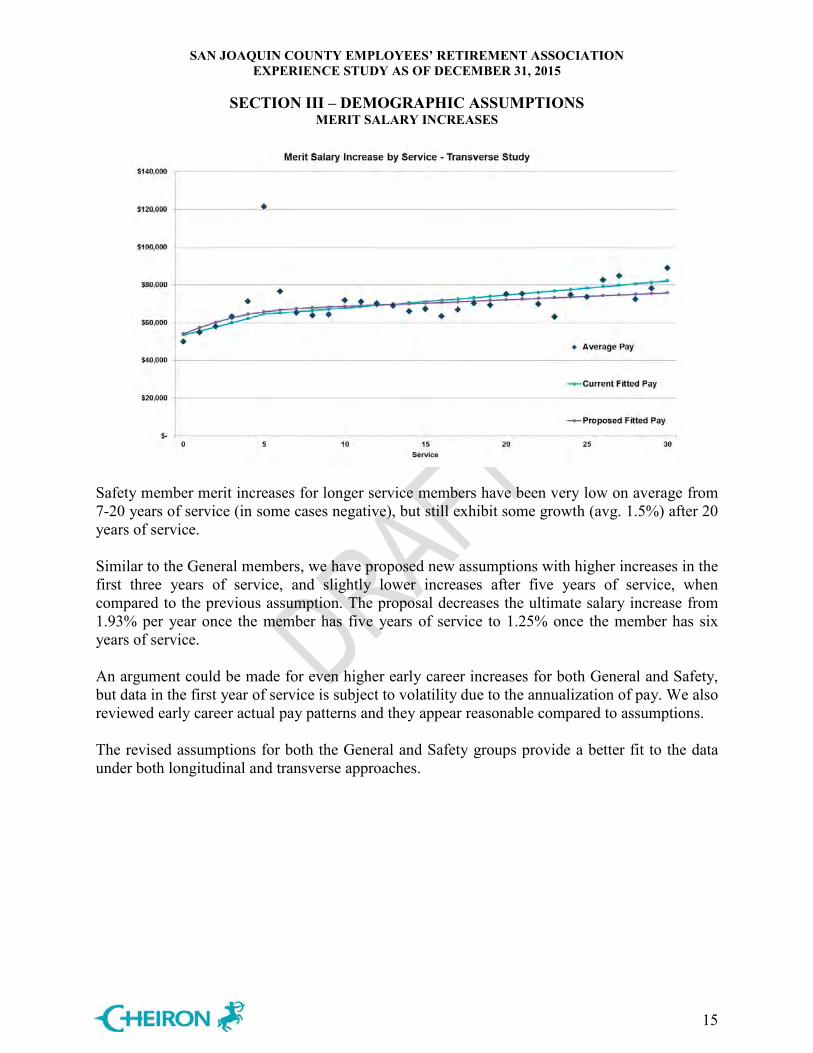
15
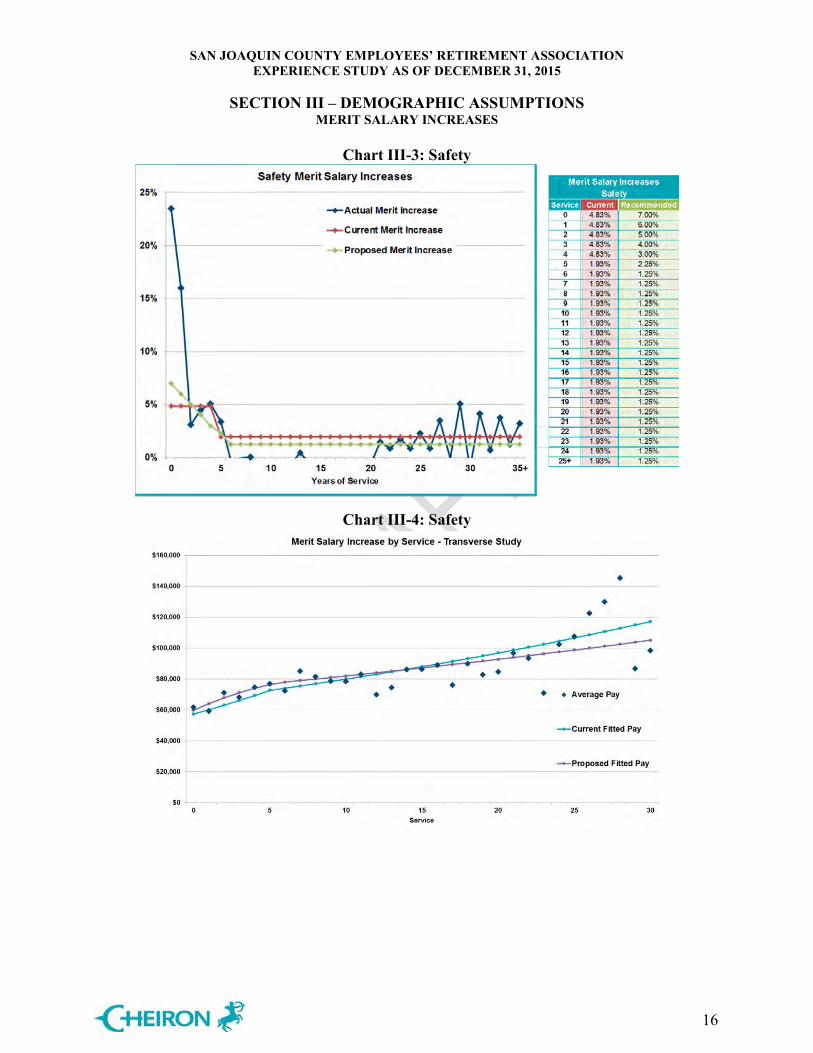
Safety member merit increases for longer service members have been very low on average from 7-20 years of service (in some cases negative), but still exhibit some growth (avg. 1.5%) after 20 years of service. Similar to the General members, we have proposed new assumptions with higher increases in the first three years of service, and slightly lower increases after five years of service, when compared to the previous assumption. The proposal decreases the ultimate salary increase from 1.93% per year once the member has five years of service to 1.25% once the member has six years of service. An argument could be made for even higher early career increases for both General and Safety, but data in the first year of service is subject to volatility due to the annualization of pay. We also reviewed early career actual pay patterns and they appear reasonable compared to assumptions. The revised assumptions for both the General and Safety groups provide a better fit to the data under both longitudinal and transverse approaches.
SAN JOAQUIN COUNTY EMPLOYEES’ RETIREMENT ASSOCIATION EXPERIENCE STUDY AS OF DECEMBER 31, 2015
SECTION III – DEMOGRAPHIC ASSUMPTIONS
MERIT SALARY INCREASES
16
Chart III-3: Safety
Chart III-4: Safety

SAN JOAQUIN COUNTY EMPLOYEES’ RETIREMENT ASSOCIATION EXPERIENCE STUDY AS OF DECEMBER 31, 2015
SECTION III – DEMOGRAPHIC ASSUMPTIONS
RETIREMENT RATES
17
ANALYSIS OF OTHER DEMOGRAPHIC ASSUMPTIONS For all of the remaining demographic assumptions, we determined the ratio of the actual number of decrements for each membership group compared to the expected number of decrements (A/E ratio or actual-to-expected ratio). If the assumption is perfect, this ratio will be 100%. Otherwise, any recommended assumption change should move from the current A/E ratio towards 100% unless future experience is expected to be different than the experience during the period of study. We also calculate an r-squared statistic for each assumption. R-squared measures how well the assumption fits the actual data and can be thought of as the percentage of the variation in actual data explained by the assumption. Ideally, r-squared would equal 1.00 although this is never the case. Any recommended assumption change should increase the r-squared compared to the current assumption making it closer to 1.00 unless the pattern of future decrements is expected to be different from the pattern experienced during the period of study. In addition, we calculated the 90% confidence interval, which represents the range within which the true decrement rate during the experience study period fell with 90% confidence. (If there is insufficient data to calculate a confidence interval, the confidence interval is shown as the entire range of the graph.) We generally propose assumption changes when the current assumption is outside the 90% confidence interval of the observed experience. However, adjustments are made to account for differences between future expectations and historical experience, to account for the past experience represented by the current assumption, and to maintain a neutral to slight conservative bias in the selection of the assumption. For mortality rates, we compare SJCERA’s experience to that of a standard table and adjust the tables to bring the proposed assumption closer to an A/E ratio of 100%. RETIREMENT RATES The current retirement rates vary by age and service and are applied to all members who are eligible to retire. Generally, at any given age, members with more service are generally more likely to retire than members with fewer years of service. SJCERA is not large enough to justify assumptions for each age and service combination. We continue to recommend separate assumptions by age and gender for each of the following three service groups for General members:
• Members with 5-9 years of service, • Member with 10-29 years of service, • Members with 30 or more years of service.
We recommend separate assumptions by age for each of the following two service groups for Safety members:
• Members with less than 20 years of service, • Members with 20 or more years of service.

SAN JOAQUIN COUNTY EMPLOYEES’ RETIREMENT ASSOCIATION EXPERIENCE STUDY AS OF DECEMBER 31, 2015
SECTION III – DEMOGRAPHIC ASSUMPTIONS
RETIREMENT RATES
18
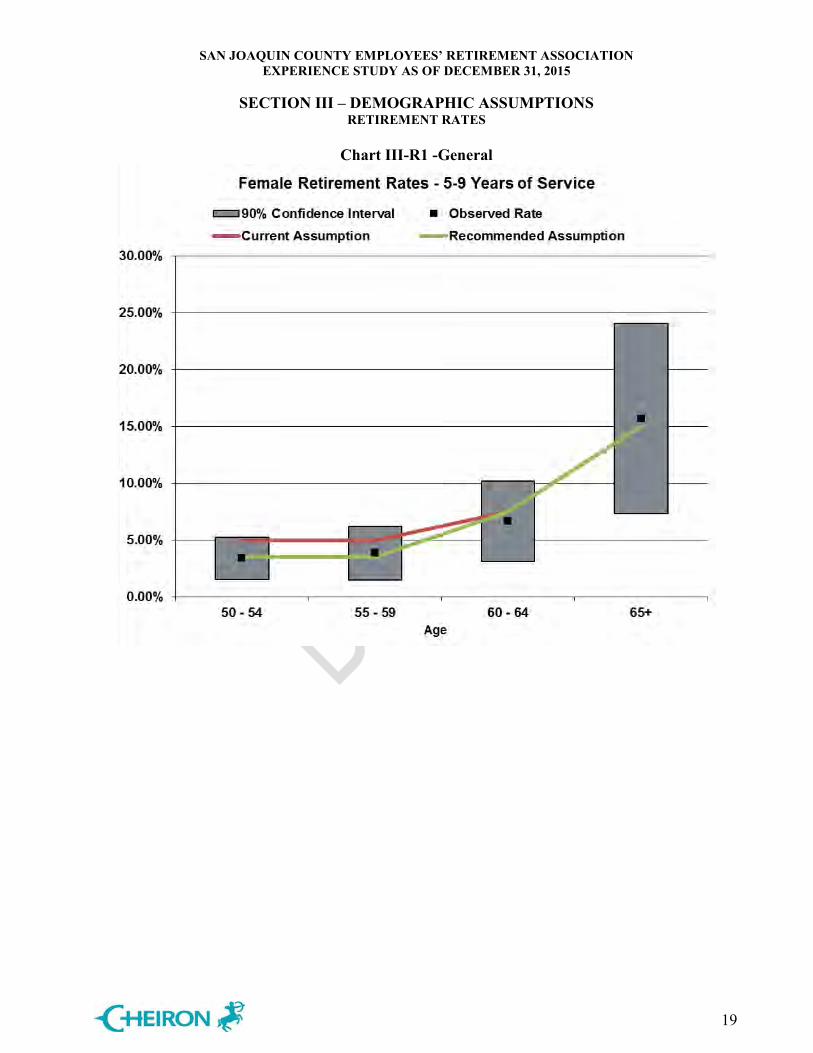
We continue to recommend using the same assumptions for Tier I and II members, with the exception that the rates will only be applied once the member is eligible for retirement. For example, the retirement rates for the Tier II General members will not be applied until the member has reached age 52. Although some have speculated that the reduced multipliers reflected in the Tier II benefits may result in members working longer than they would have under the Tier I benefit formulas, we do not yet have any plan experience to support a different set of assumptions. In addition, our initial modeling of the Tier II benefits revealed that the actuarially determined contribution rates required to fund these benefits are relatively insensitive to the actual retirement rates, as a result of the early retirement reductions reflected in the benefit formulas. Table III-R1 shows the calculation of actual-to-expected ratios and the r-squared statistic for General female members with between 5-9 years of service. Charts III-R1 shows the information graphically along with the 90% confidence interval. The data shows lower actual retirement rates than expected under the current assumption. The proposed assumption decreases the aggregate assumed rate of retirement and increases the aggregate A/E ratio from 83% to 99%. The r-squared also increases from 0.12 to 0.18. See Appendices A and B for a full listing of the proposed and prior rates. The ultimate retirement age remains at 70.
Table III-R1 – General
Female Retirement Rates - 5-9 Years of ServiceRetirements Actual to Expected Ratios
Age Exposures Actual Current Recommended Current Recommended50 - 54 263 9 13 9 68% 98%55 - 59 181 7 9 6 77% 110%60 - 64 135 9 10 10 89% 89%
65+ 51 8 8 8 105% 105%
Total 630 33 40 33 83% 99%R-squared 0.1228 0.1779
SAN JOAQUIN COUNTY EMPLOYEES’ RETIREMENT ASSOCIATION EXPERIENCE STUDY AS OF DECEMBER 31, 2015
SECTION III – DEMOGRAPHIC ASSUMPTIONS
RETIREMENT RATES
19
Chart III-R1 -General

SAN JOAQUIN COUNTY EMPLOYEES’ RETIREMENT ASSOCIATION EXPERIENCE STUDY AS OF DECEMBER 31, 2015
SECTION III – DEMOGRAPHIC ASSUMPTIONS
RETIREMENT RATES
20
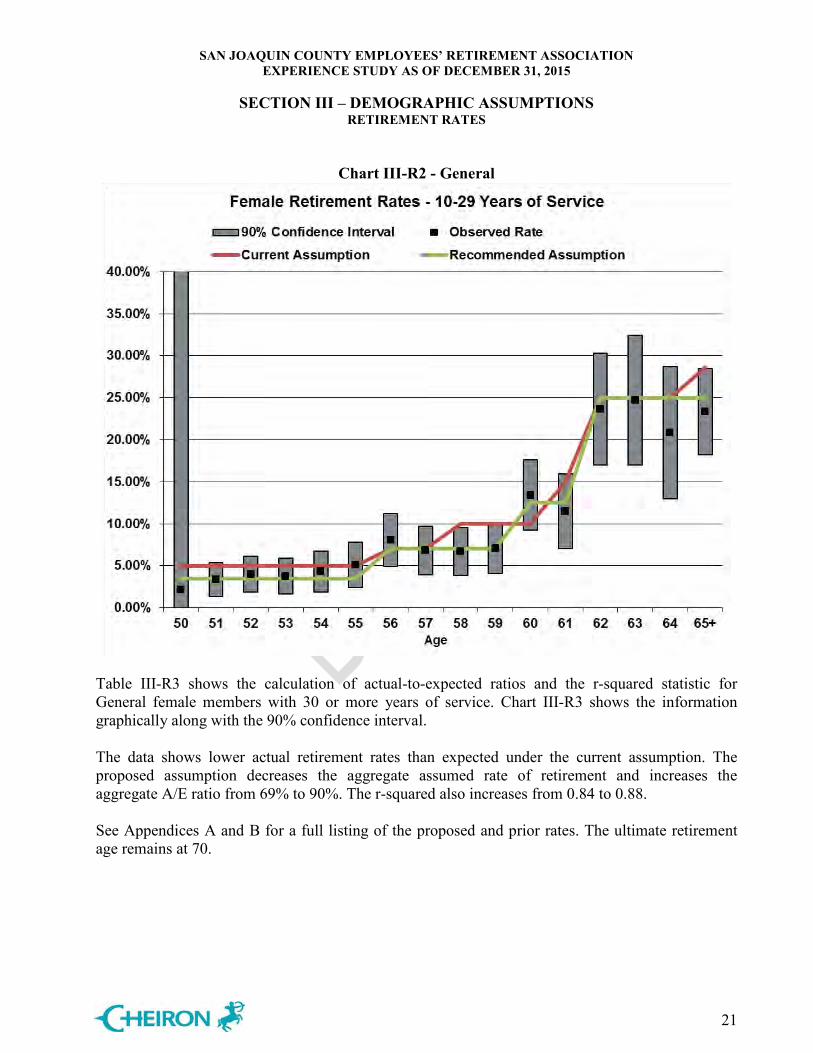
Table III-R2 shows the calculation of actual-to-expected ratios and the r-squared statistic for General female members with service between 10 and 29 years, and Chart III-R2 shows the information graphically along with the 90% confidence interval. The data shows lower actual retirement rates than expected under the current assumption. The proposed assumption decreases the overall assumed rate of retirement and increases the aggregate A/E ratio from 86% to 99%. The r-squared also increases from 0.79 to 0.94. See Appendices A and B for a full listing of the proposed and prior rates. The ultimate retirement age remains at 70.
Table III-R2 – General
Female Retirement Rates - 10-29 Years of ServiceRetirements Actual to Expected Ratios
Age Exposures Actual Current Recommended Current Recommended50 187 4 9 7 43% 61%51 209 7 10 7 67% 96%52 226 9 11 8 80% 114%53 214 8 11 7 75% 107%54 186 8 9 7 86% 123%55 177 9 9 6 102% 145%56 199 16 14 14 115% 115%57 205 14 14 14 98% 98%58 209 14 21 15 67% 96%59 197 14 20 14 71% 102%60 179 24 18 22 134% 107%61 139 16 21 17 77% 92%62 110 26 28 28 95% 95%63 85 21 21 21 99% 99%64 72 15 18 18 83% 83%
65+ 184 43 53 46 82% 93%
Total 2,778 248 287 251 86% 99%R-squared 0.7917 0.9447
SAN JOAQUIN COUNTY EMPLOYEES’ RETIREMENT ASSOCIATION EXPERIENCE STUDY AS OF DECEMBER 31, 2015
SECTION III – DEMOGRAPHIC ASSUMPTIONS
RETIREMENT RATES
21
Chart III-R2 - General
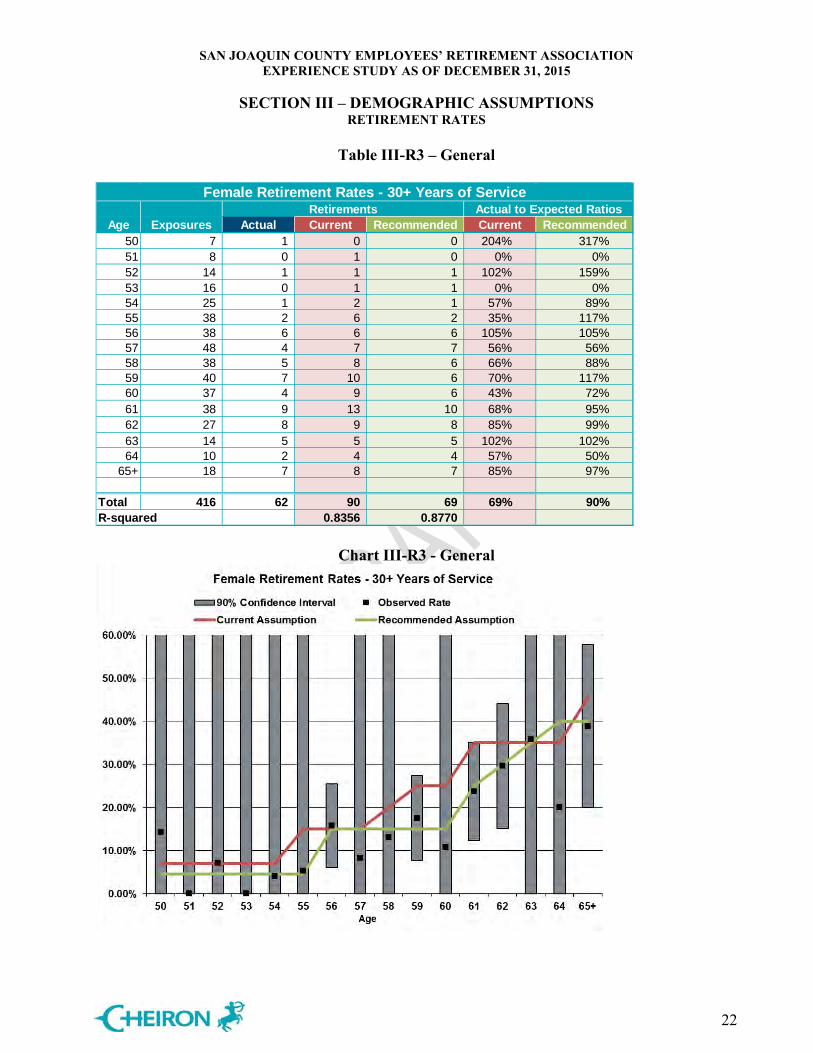
Table III-R3 shows the calculation of actual-to-expected ratios and the r-squared statistic for General female members with 30 or more years of service. Chart III-R3 shows the information graphically along with the 90% confidence interval. The data shows lower actual retirement rates than expected under the current assumption. The proposed assumption decreases the aggregate assumed rate of retirement and increases the aggregate A/E ratio from 69% to 90%. The r-squared also increases from 0.84 to 0.88. See Appendices A and B for a full listing of the proposed and prior rates. The ultimate retirement age remains at 70.
SAN JOAQUIN COUNTY EMPLOYEES’ RETIREMENT ASSOCIATION EXPERIENCE STUDY AS OF DECEMBER 31, 2015
SECTION III – DEMOGRAPHIC ASSUMPTIONS
RETIREMENT RATES
22
Table III-R3 – General
Chart III-R3 - General
Female Retirement Rates - 30+ Years of ServiceRetirements Actual to Expected Ratios
Age Exposures Actual Current Recommended Current Recommended50 7 1 0 0 204% 317%51 8 0 1 0 0% 0%52 14 1 1 1 102% 159%53 16 0 1 1 0% 0%54 25 1 2 1 57% 89%55 38 2 6 2 35% 117%56 38 6 6 6 105% 105%57 48 4 7 7 56% 56%58 38 5 8 6 66% 88%59 40 7 10 6 70% 117%60 37 4 9 6 43% 72%61 38 9 13 10 68% 95%62 27 8 9 8 85% 99%63 14 5 5 5 102% 102%64 10 2 4 4 57% 50%
65+ 18 7 8 7 85% 97%
Total 416 62 90 69 69% 90%R-squared 0.8356 0.8770

SAN JOAQUIN COUNTY EMPLOYEES’ RETIREMENT ASSOCIATION EXPERIENCE STUDY AS OF DECEMBER 31, 2015
SECTION III – DEMOGRAPHIC ASSUMPTIONS
RETIREMENT RATES
23
Table III-R4 shows the calculation of actual-to-expected ratios and the r-squared statistic for General male members with between 5-9 years of service. Charts III-R4 shows the information graphically along with the 90% confidence interval. The data shows lower actual retirement rates than expected under the current assumption. The proposed assumption decreases the aggregate assumed rate of retirement and increases the aggregate A/E ratio from 93% to 111%. The r-squared also increases from 0.03 to 0.17. See Appendices A and B for a full listing of the proposed and prior rates. The ultimate retirement age remains at 70.
Table III-R4 – General
Male Retirement Rates - 5-9 Years of ServiceRetirements Actual to Expected Ratios
Age Exposures Actual Current Recommended Current Recommended50 - 54 126 4 6 4 63% 98%55 - 59 123 5 6 5 81% 102%60 - 64 88 6 7 6 91% 102%
65+ 45 9 7 7 133% 133%
Total 382 24 26 22 93% 111%R-squared 0.0297 0.1734

SAN JOAQUIN COUNTY EMPLOYEES’ RETIREMENT ASSOCIATION EXPERIENCE STUDY AS OF DECEMBER 31, 2015
SECTION III – DEMOGRAPHIC ASSUMPTIONS
RETIREMENT RATES
24
Chart III-R4 - General

SAN JOAQUIN COUNTY EMPLOYEES’ RETIREMENT ASSOCIATION EXPERIENCE STUDY AS OF DECEMBER 31, 2015
SECTION III – DEMOGRAPHIC ASSUMPTIONS
RETIREMENT RATES
25
Table III-R5 shows the calculation of actual-to-expected ratios and the r-squared statistic for General male members with service between 10 and 29 years, and Chart III-R5 shows the information graphically along with the 90% confidence interval. The data shows slightly lower actual retirement rates than expected under the current assumption. The proposed assumptions have minimal impact on the overall assumed rate of retirement and the aggregate A/E ratio stays at 92%. The r-squared increases from 0.59 to 0.80. See Appendices A and B for a full listing of the proposed and prior rates. The ultimate retirement age remains at 70.
Table III-R5 – General
Male Retirement Rates - 10-29 Years of ServiceRetirements Actual to Expected Ratios
Age Exposures Actual Current Recommended Current Recommended50 - 52 267 11 13 11 82% 103%53 - 55 265 13 13 14 98% 91%56 - 58 251 9 15 10 62% 90%59 - 61 222 28 31 35 91% 80%62 - 64 126 33 32 34 105% 97%
65+ 116 33 35 35 95% 95%
Total 1,247 127 138 139 92% 92%R-squared 0.5949 0.8046

SAN JOAQUIN COUNTY EMPLOYEES’ RETIREMENT ASSOCIATION EXPERIENCE STUDY AS OF DECEMBER 31, 2015
SECTION III – DEMOGRAPHIC ASSUMPTIONS
RETIREMENT RATES
26
Chart III-R5 - General
Table III-R6 shows the calculation of actual-to-expected ratios and the r-squared statistic for General male members with 30 or more years of service. Chart III-R6 shows the information graphically along with the 90% confidence interval. The data shows actual retirement rates are as expected under the current assumption. We recommend no changes to the assumption since the aggregate A/E ratio is 100%. The r-squared is 0.74. See Appendices A and B for a full listing of the proposed and prior rates. The ultimate retirement age remains at 70.

SAN JOAQUIN COUNTY EMPLOYEES’ RETIREMENT ASSOCIATION EXPERIENCE STUDY AS OF DECEMBER 31, 2015
SECTION III – DEMOGRAPHIC ASSUMPTIONS
RETIREMENT RATES
27
Table III-R6 - General
Chart III-R6 - General
Male Retirement Rates - 30+ Years of ServiceRetirements Actual to Expected Ratios
Age Exposures Actual Current Recommended Current Recommended50 - 52 3 0 0 0 0% 0%53 - 55 22 2 2 2 95% 95%56 - 58 46 7 8 8 89% 89%59 - 61 71 16 20 20 78% 78%62 - 64 31 19 12 12 162% 162%
65+ 11 3 5 5 61% 61%
Total 184 47 47 47 100% 100%R-squared 0.7353 0.7353

SAN JOAQUIN COUNTY EMPLOYEES’ RETIREMENT ASSOCIATION EXPERIENCE STUDY AS OF DECEMBER 31, 2015
SECTION III – DEMOGRAPHIC ASSUMPTIONS
RETIREMENT RATES
28
Retirement data for Safety members between January 1, 2013 and December 2015 was somewhat limited, with less than 65 retirements and about 500 exposures. We have added data from the prior study to add more credibility to these calculations. Table III-R7 shows the calculation of actual-to-expected ratios and the r-squared statistic for all Safety members, and Chart III-R7 shows the information graphically along with the 90% confidence interval. The data shows actual retirement rates are as expected under the current assumption. We recommend no change to the Safety members retirement rates at his time. The aggregate A/E ratio is 100% and the r-squared is 0.90. See Appendices A and B for a full listing of the proposed and prior rates. The ultimate retirement age remains at 65.
Table III-R7 - Safety
Retirement Rates - All Years of ServiceRetirements Actual to Expected Ratios
Age Exposures Actual Current Recommended Current Recommended50 134 12 16 16 75% 75%51 129 14 10 10 141% 141%52 119 11 9 9 118% 118%53 114 16 17 17 94% 94%54 98 16 15 15 110% 110%55 82 18 18 18 98% 98%56 61 13 9 9 144% 144%57 45 8 6 6 131% 131%58 43 6 6 6 98% 98%59 37 3 5 5 61% 61%60 34 5 4 4 127% 127%61 33 5 7 7 77% 77%62 28 5 7 7 74% 74%63 22 5 6 6 83% 83%64 13 1 3 3 31% 31%
Total 992 138 138 138 100% 100%R-squared 0.9030 0.9030

SAN JOAQUIN COUNTY EMPLOYEES’ RETIREMENT ASSOCIATION EXPERIENCE STUDY AS OF DECEMBER 31, 2015
SECTION III – DEMOGRAPHIC ASSUMPTIONS
RETIREMENT RATES
29
Chart III-R7 - Safety

SAN JOAQUIN COUNTY EMPLOYEES’ RETIREMENT ASSOCIATION EXPERIENCE STUDY AS OF DECEMBER 31, 2015
SECTION III — DEMOGRAPHIC ASSUMPTIONS
TERMINATION RATES
30
Termination rates reflect the frequency at which active members leave employment for reasons other than retirement, death, or disability. Currently, the termination rates are based on service for both Safety and General members. We have found that the rate of termination is more related to years of service rather than age. This methodology also avoids under-weighting the liabilities that can occur is using age-based rates only. The termination rates do not apply once members are eligible for a service retirement benefit. Table III-T1 shows the calculation of actual-to-expected ratios and the r-squared statistic for General members, and Chart III-T1 shows the information graphically along with the 90% confidence interval. The data shows slightly higher actual termination rates than expected under the current assumption. We are recommending modest increases in the General termination rates for those members with less than 20 years of service. The proposed assumption increases the assumed rates of termination and decreases the aggregate A/E ratio from 120% to 99%. The r-squared also increases from 0.96 to 0.99. See Appendices A and B for a full listing of the proposed and prior rates.
Table III-T1
Termination Rates - General: All Years of ServiceRetirements Actual to Expected Ratios
Service Exposures Actual Current Recommended Current Recommended0 898 168 114.5 157.2 147% 107%1 1,106 118 110.6 121.7 107% 97%2 602 58 60.2 60.2 96% 96%3 314 22 24.3 24.3 90% 90%4 320 19 15.2 21.6 125% 88%5 421 34 18.9 26.3 179% 129%6 552 32 24.8 33.1 129% 97%7 581 22 26.1 26.1 84% 84%8 450 25 16.9 20.3 148% 123%9 345 11 10.4 12.9 106% 85%10 314 11 6.3 11.8 175% 93%11 392 9 7.8 10.8 115% 83%12 406 10 8.1 11.2 123% 90%13 377 9 7.5 9.4 119% 95%14 279 6 5.6 7.0 108% 86%
15 - 19 680 13 13.6 17.0 96% 76%20 - 24 278 3 2.8 2.8 108% 108%25 - 29 84 0 0.8 0.8 0% 0%
Total 8,399 570 474.6 574.5 120% 99%R-squared 0.9584 0.9941

SAN JOAQUIN COUNTY EMPLOYEES’ RETIREMENT ASSOCIATION EXPERIENCE STUDY AS OF DECEMBER 31, 2015
SECTION III — DEMOGRAPHIC ASSUMPTIONS
TERMINATION RATES
31
Chart III-T1
Table III-T2 shows the calculation of actual-to-expected ratios and the r-squared statistic for Safety members, and Chart III-T2 shows the information graphically along with the 90% confidence interval. The data shows that actual termination rates are slightly higher when a member has only five years of service or less, but lower after they reach five years of service. In aggregate, the proposed assumptions decrease the assumed rates of termination. The proposal increases the aggregate A/E ratio from 93% to 98%. The r-squared increases from 0.71 to 0.82. See Appendices A and B for a full listing of the proposed and prior rates.

SAN JOAQUIN COUNTY EMPLOYEES’ RETIREMENT ASSOCIATION EXPERIENCE STUDY AS OF DECEMBER 31, 2015
SECTION III — DEMOGRAPHIC ASSUMPTIONS
TERMINATION RATES
32
Table III-T2
Termination Rates - Safety: All Years of ServiceRetirements Actual to Expected Ratios
Service Exposures Actual Current Recommended Current Recommended0 44 5 3.9 4.4 130% 114%1 96 6 7.4 7.4 81% 81%2 41 2 2.4 2.4 85% 85%3 27 2 0.7 1.4 269% 148%4 69 4 1.9 3.1 211% 129%5 138 3 2.8 2.8 109% 109%6 166 4 3.3 2.9 120% 138%7 149 0 3.0 2.2 0% 0%8 103 2 2.1 1.5 97% 129%9 95 0 1.9 1.4 0% 0%
10 107 1 1.1 0.8 93% 125%11 116 1 1.2 0.9 86% 115%14 96 0 1.0 0.7 0% 0%15 93 1 0.9 0.7 108% 143%16 70 0 0.7 0.5 0% 0%17 55 0 0.6 0.4 0% 0%18 43 1 0.4 0.3 233% 310%19 0 0 0 0 0% 0%
Total 1,508 32 35.1 33.9 91% 94%R-squared 0.7113 0.8242

SAN JOAQUIN COUNTY EMPLOYEES’ RETIREMENT ASSOCIATION EXPERIENCE STUDY AS OF DECEMBER 31, 2015
SECTION III — DEMOGRAPHIC ASSUMPTIONS
TERMINATION RATES
33
Chart III-T2
0%
5%
10%
15%
20%
25%
30%
0 1 2 3 4 5 6 7 8 9 10 11 14 15 16 17 18 19Service
Termination Rates - Safety: All Years of Service
90% Confidence Interval Observed Rate Current Assumption Recommended Assumption
SAN JOAQUIN COUNTY EMPLOYEES’ RETIREMENT ASSOCIATION EXPERIENCE STUDY AS OF DECEMBER 31, 2015
SECTION III — DEMOGRAPHIC ASSUMPTIONS
TERMINATION RATES
34
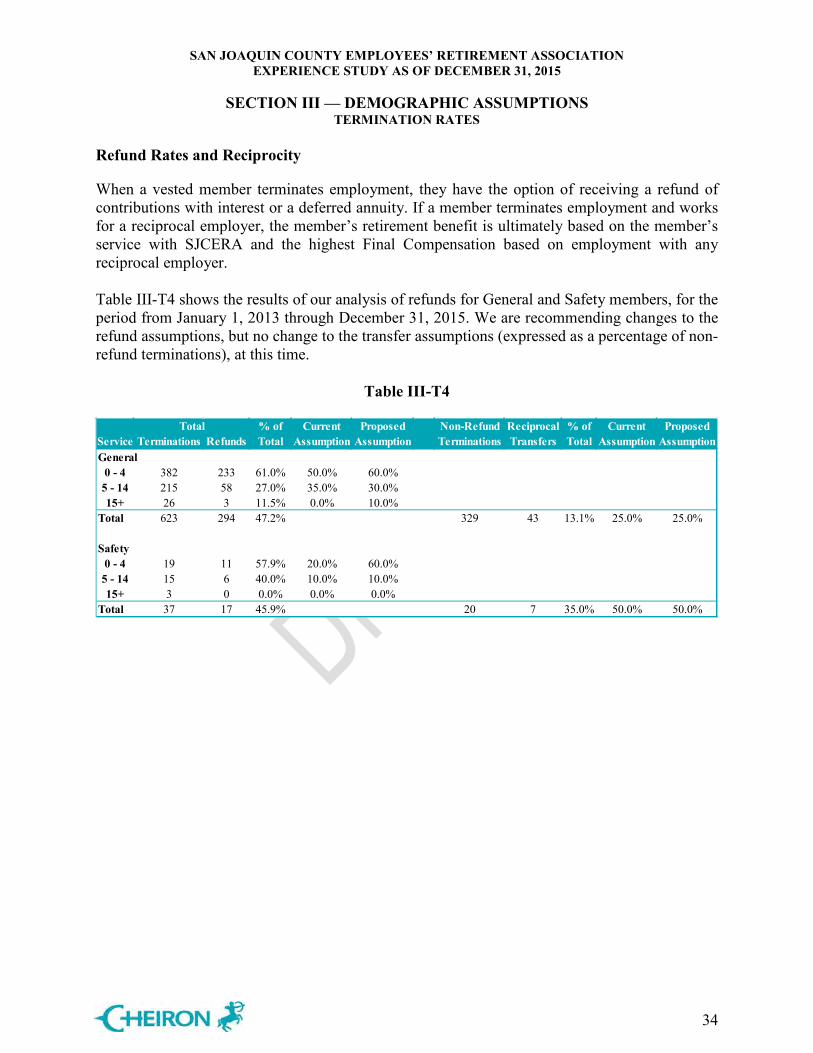
Refund Rates and Reciprocity
When a vested member terminates employment, they have the option of receiving a refund of contributions with interest or a deferred annuity. If a member terminates employment and works for a reciprocal employer, the member’s retirement benefit is ultimately based on the member’s service with SJCERA and the highest Final Compensation based on employment with any reciprocal employer. Table III-T4 shows the results of our analysis of refunds for General and Safety members, for the period from January 1, 2013 through December 31, 2015. We are recommending changes to the refund assumptions, but no change to the transfer assumptions (expressed as a percentage of non-refund terminations), at this time.
Table III-T4
Total % of Current Proposed Non-Refund Reciprocal % of Current ProposedService Terminations Refunds Total Assumption Assumption Terminations Transfers Total Assumption AssumptionGeneral
0 - 4 382 233 61.0% 50.0% 60.0%5 - 14 215 58 27.0% 35.0% 30.0%15+ 26 3 11.5% 0.0% 10.0%
Total 623 294 47.2% 329 43 13.1% 25.0% 25.0%
Safety0 - 4 19 11 57.9% 20.0% 60.0%
5 - 14 15 6 40.0% 10.0% 10.0%15+ 3 0 0.0% 0.0% 0.0%
Total 37 17 45.9% 20 7 35.0% 50.0% 50.0%

SAN JOAQUIN COUNTY EMPLOYEES’ RETIREMENT ASSOCIATION EXPERIENCE STUDY AS OF DECEMBER 31, 2015
SECTION III — DEMOGRAPHIC ASSUMPTIONS
TERMINATION RATES
35
Table III-T5 shows the results of our analysis of the age at which vested terminated and transferred members decide to retire. The current assumptions are that vested terminated General members will commence payment at age 58, and that vested terminated Safety members will commence payment at age 53. We are not recommending any changes to the General assumptions, but are recommending a change to the Safety assumptions from a commencement age of 53 to 50.
Table III-T5
As stated on the previous page, if a member terminates employment and works for a reciprocal employer, the member’s retirement benefit is ultimately computed using the highest Final Compensation based on employment any reciprocal employer. We recommend that the assumption used to project pay during employment with the reciprocal employer be based on the wage growth assumption, compounded by the ultimate merit pay increase assumption described earlier in this report. Therefore, the recommended total pay growth assumptions for members in reciprocal status are 3.67% for General members and 4.44% for Safety members. Also, reciprocal pay increases in the prior study were applied from the valuation date to the assumed retirement ages. Upon further review of the data, we recommend a change to projecting salary increases from the year of the members’ most recent reported salary to their assumed retirement age.
Average Retirement Age for Retirees from Vested Status
Calendar Year
# of New Retirees
Retirement Age
# of New Retirees
Retirement Age
2013 27 56.11 2 50.002014 20 61.37 0 0.002015 25 57.38 2 50.00Total 72 58.01 4 50.00
General Safety

SAN JOAQUIN COUNTY EMPLOYEES’ RETIREMENT ASSOCIATION EXPERIENCE STUDY AS OF DECEMBER 31, 2015
SECTION III – DEMOGRAPHIC ASSUMPTIONS
DISABILITY RATES
36
This section analyzes the incidence of disability by the age of the employee. There are separate sets of assumptions for nonservice-connected disabilities and service-connected disabilities. Service-connected disability rates for Safety members are unisex, while all General rates and Safety nonservice-connected disability rates vary by gender. The disability decrement is only applied after members are eligible for disability benefits. The amount of disability experience is fairly limited; only twenty disabilities have occurred during the last three years for Safety and General members combined. To improve the credibility of the data, we have aggregated the experience of the past three years with that of the prior experience study (2010-2012). Table III-D1 shows the calculation of actual-to-expected ratios and the r-squared statistic for all disabilities for General members, and Chart III-D1 shows the information graphically. The 90% confidence interval is not shown because of a lack of credible data. The data shows disability rates that are close to the current assumption. The current assumption has an A/E ratio of 77%. The r-squared is 0.40. The current assumption is somewhat conservative, but disability rates do not have significant impact on General cost. We are not proposing any change to the disability assumption for General members, including the incidence of duty-related vs. non-duty related disability, but if disability incidence remains low at the next experience study, reductions in disability rates may be considered. See Appendix A or B for a full listing of the rates.
Table III-D1

SAN JOAQUIN COUNTY EMPLOYEES’ RETIREMENT ASSOCIATION EXPERIENCE STUDY AS OF DECEMBER 31, 2015
SECTION III – DEMOGRAPHIC ASSUMPTIONS
DISABILITY RATES
37
Chart III-D1
Table III-D2 on the next page shows the calculation of actual-to-expected ratios and the r-squared statistic for Safety members, and Chart III-D2 shows the information graphically. The 90% confidence interval is not shown because of a lack of credible data. The data shows that the number of disabilities are close to the number expected under the current assumption. However, the current rates do not assume any disabilities past age 59, and several have occurred in the last three years. We recommend setting a rate of 1.5% for Safety disabilities from age 50 onward. We are not proposing any other changes to the total disability assumption for Safety members. Since Safety disability rates were combined during this review and given a flat rate of 1.5% from age 50 onward, it’s necessary to define what percent of disabilities are nonservice-connected and service-connected. As of January 1, 2016, there are 210 disabled Safety retirees. 93.3% (196 out of 210) of disabled Safety retirees are retired due to service-connected disabilities. We are recommending that 95% of Safety disabilities are assumed to be service-connected, and to assume a refund of contributions for nonservice-connected disabilities before a member reaches five years of service. See Appendix A or B for a full listing of the rates.
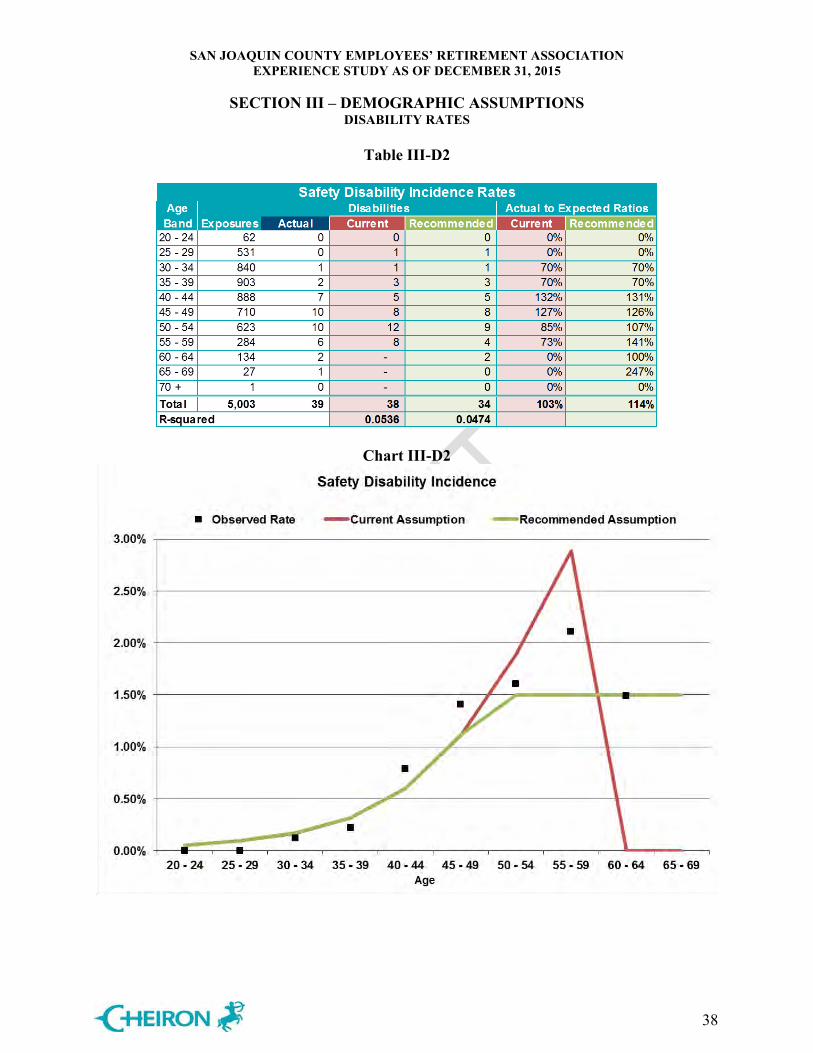
SAN JOAQUIN COUNTY EMPLOYEES’ RETIREMENT ASSOCIATION EXPERIENCE STUDY AS OF DECEMBER 31, 2015
SECTION III – DEMOGRAPHIC ASSUMPTIONS
DISABILITY RATES
38
Table III-D2
Chart III-D2
SAN JOAQUIN COUNTY EMPLOYEES’ RETIREMENT ASSOCIATION EXPERIENCE STUDY AS OF DECEMBER 31, 2015
SECTION III – DEMOGRAPHIC ASSUMPTIONS
MORTALITY RATES
39
Post-retirement mortality assumptions are typically developed separately by gender for both healthy annuitants and disabled annuitants. Pre-retirement mortality assumptions are developed separately for males and females. Unlike most of the other demographic assumptions that rely exclusively on the experience of the plan, for mortality, standard mortality tables and projection scales serve as the primary basis for the assumption. The Society of Actuaries recently completed an extensive mortality study and updated their mortality tables and mortality improvement projection scale, the most recent of which is named the MP-2015 scale. CalPERS also recently released a set of mortality tables based on California public plan experience. We used these tables as the basis for our analysis. The steps in our analysis are as follows:
1. Select a standard mortality table that is, based on experience, most closely matching the anticipated experience of SJCERA.
2. Compare actual SJCERA experience to what would have been predicted by the selected standard table for the period of the experience study.
3. Adjust the standard table either fully or partially depending on the level of credibility for SJCERA experience. This adjusted table is called the base table.
4. Select an appropriate standard mortality improvement projection scale and apply it to the base table.
As we have done in prior experience studies, we have combined the experience of the past three years with that of the prior three-year period in order to have a more robust dataset to review. Historically we have proposed assumption changes when the Actual-to-Expected (A/E) ratio for the current assumption is less than 100%. However, beginning with the 2010-2013 Experience Study, we recommended a change in this approach going forward, where the proposed assumptions are intended to track closely to actual experience (i.e. an A/E ratio close to 100%, but with a ratio slightly less than 100% still being reasonable). However, as described below, this approach also includes an expectation that the assumed mortality rates will automatically become more conservative each year, since the actual mortality rates are also expected to decrease over time. We also historically recommended the same or a related table for active employees and healthy annuitants, which has been the current practice for SJCERA. However, recent mortality studies by the Society of Actuaries and others have shown significantly lower rates of mortality for active employees versus those of the same age who are no longer working, therefore this year we have suggested using separate tables for active versus retired members.

SAN JOAQUIN COUNTY EMPLOYEES’ RETIREMENT ASSOCIATION EXPERIENCE STUDY AS OF DECEMBER 31, 2015
SECTION III – DEMOGRAPHIC ASSUMPTIONS
MORTALITY RATES
40
In the prior study, SJCERA elected to use the following assumptions: Healthy active members, retirees, and beneficiaries
• The Combined Healthy Retired Pensioners (RP) 2000 tables published by the Society of Actuaries, with generational projection using Projection Scale BB.
Disabled members
• The Combined Healthy Retired Pensioners (RP) 2000 tables published by the Society of Actuaries, with generational projection using Projection Scale BB, set-forward eight years for males and females.
Since the prior study, the Society of Actuaries' Retirement Plans Experience Committee (RPEC) has released a new mortality improvement scale, Scale MP-2015, which reflects more up-to-date data than was used in the development of Scale BB. MP-2015 represents the Society of Actuaries’ most advanced actuarial methodology in incorporating mortality improvement trends with actual recent mortality rates, by using rates that vary not only by age but also by calendar year – known as a two-dimensional approach to projecting mortality improvements. Scale MP-2015 was designed with the intent of being applied to mortality on a generational basis. The effect of this is to build in an automatic expectation of future improvements in mortality. This is a different approach from building in a margin for conservatism in the current rates to account for the expectation that the same rates will be applied in future years, when mortality experience has improved. Recent reports issued by RPEC suggest that using generational mortality is a preferable approach, as it allows for an explicit declaration of the amount of future mortality improvement included in the assumptions. RPEC has also recently released a new set of base mortality rate tables – the RP-2014 tables, which are intended to replace the RP-2000 tables and are based on a recent study of US defined benefit plan mortality experience. However, RPEC excluded all public pension plan data in the construction of these tables - including a large amount of California public sector data - because there were significant differences between the private and public sector retirement experience, and the new tables are expected to be used by private sector plans to meet accounting and federal funding requirements specific to private plans. Fortunately, there are alternative sets of assumptions that have been developed that may serve as a logical basis for developing mortality assumptions for SJCERA. As part of an Experience Study completed in 2014, CalPERS adopted a new set of mortality tables for active, retired, and disabled members. SJCERA’s experience over the past six years matches well with the new CalPERS rates, after removing the improvement projections included by CalPERS and replacing them with the new MP-2015 mortality improvement projections through the mid-point of the six-year period (2010-2016).

SAN JOAQUIN COUNTY EMPLOYEES’ RETIREMENT ASSOCIATION EXPERIENCE STUDY AS OF DECEMBER 31, 2015
SECTION III – DEMOGRAPHIC ASSUMPTIONS
MORTALITY RATES
41
Even with the use of six years of data, the SJCERA experience is only partially credible, based on standard statistical theory. We therefore recommend partially adjusting the CalPERS base tables to fit SJCERA’s experience to develop a new base table. The rates for each age in the standard table are adjusted by a factor, where the factor is determined by multiplying the actual-to-expected ratio for the group (such as male retirees) by a credibility factor which will bring the A/E results closer – but not all the way – to 100%. Based on these adjustments, we are recommending the following base mortality table assumptions: Active members
• CalPERS Preretirement Non-Industrial Mortality, with no adjustment (General and Safety).
• CalPERS Preretirement Industrial Mortality, with no adjustment (Safety only). Healthy retirees and beneficiaries
• CalPERS Healthy Annuitant Mortality, adjusted 110% by for Safety and no adjustment for General.
Disabled members
• CalPERS Industrially Disabled Annuitant Mortality, with no adjustment (Safety only) • CalPERS Non-Industrially Disabled Annuitant Mortality, adjusted by 105% (General
only). We also recommend projecting these base tables generationally using the MP-2015 mortality improvement scale described above for all types of mortality. As shown in Table III-M1 on the following page, our proposed mortality rates for healthy annuitants are close to recent experience, in particular for the General members. As described above, we applied a partial adjustment to the Safety healthy retiree mortality rates and the General disabled mortality rates to bring the A/E rates closer to 100%. However, these rates still reflect a margin for conservatism, because the SJCERA data cannot be considered fully credible, particularly for the disability mortality experience. To perform our comparisons, the CalPERS base rates (without projection) were projected from their base year (2009) to the midpoint of the combined six-year study period (2013).

SAN JOAQUIN COUNTY EMPLOYEES’ RETIREMENT ASSOCIATION EXPERIENCE STUDY AS OF DECEMBER 31, 2015
SECTION III – DEMOGRAPHIC ASSUMPTIONS
MORTALITY RATES
42
Table III-M1
SAN JOAQUIN COUNTY EMPLOYEES’ RETIREMENT ASSOCIATION EXPERIENCE STUDY AS OF DECEMBER 31, 2015
SECTION III – DEMOGRAPHIC ASSUMPTIONS
MORTALITY RATES
43
Rather than weighting the experience based on the number of members living and dying, we have weighted the experience based on benefit size (salary for current active members). This approach has been recommended by RPEC, since members with larger benefits are expected to live longer, and a benefit-weighted approach helps avoid underestimating the liabilities. The match between the actual and expected experience across all statuses (active, retired, and disabled) is close under the proposed assumptions: 104%. We are comfortable that the ratio of actual to expected deaths is less than 100% within some subgroups, since as described above, the use of generational mortality assumptions will automatically result in assumed mortality rates that decrease over time. Mortality Assumptions for Employee Contribution Rates For purposes of determining employee contribution rates, the use of generational mortality improvements is impractical from an administrative perspective. Therefore, we recommend using the base mortality tables described above (various CalPERS tables with SJCERA-specific adjustments) projected using Scale MP-2015 from 2009 to 2038 for General Members and to 2040 for Safety Members. These static projections are intended to approximate generational mortality improvements. The projection periods are based upon the duration of active liabilities for the respective impacted groups, and the period during which the associated employee contribution rates will be in use. The employee contribution rates are also blended using a male/female weighting of 29%/71% for General Members and 75% /25% for Safety members. We anticipate that these mortality assumptions will be used to determine the employee contribution rates in effect for the period of January 1, 2017 through December 31, 2019. We also anticipate that the mortality assumptions for this purpose will be updated again after the next experience study covering the period from January 1, 2016 through December 31, 2018.

SAN JOAQUIN COUNTY EMPLOYEES’ RETIREMENT ASSOCIATION EXPERIENCE STUDY AS OF DECEMBER 31, 2015
SECTION III – DEMOGRAPHIC ASSUMPTIONS
OTHER DEMOGRAPHIC ASSUMPTIONS
44
TERMINAL PAY The prior experience study demonstrated that Sick Leave Bank service is unlikely to have a significant impact on benefits. We have updated our analysis for the current study period, and confirmed that this conclusion is still valid.
Table III-O1
We also performed a comparison of the actual versus expected final average pay used in the service retirement benefit calculations to confirm any other substantial/recurring terminal pay increases. For all service retirements which occurred over the past three years, we compared the actual final average pay used in the member's benefit calculation to the expected final average pay for that member reflected in the prior actuarial valuation (as an active member) and found no significant difference. Therefore, we do not recommend the application of any additional terminal pay increase.
Table III-O2

SAN JOAQUIN COUNTY EMPLOYEES’ RETIREMENT ASSOCIATION EXPERIENCE STUDY AS OF DECEMBER 31, 2015
SECTION III – DEMOGRAPHIC ASSUMPTIONS
OTHER DEMOGRAPHIC ASSUMPTIONS
45
FAMILY COMPOSITION The current assumption is that 70% of active male and 50% of active female SJCERA participants will have beneficiaries eligible for an unreduced (i.e. subsidized) 60% Joint and Survivor allowance (100% for Duty Disability). Table III-O3 shows the results of the analysis during the experience study period for the number members who retired or became disabled and who had such eligible beneficiaries.
Table III-O3
We recommend increasing the assumed percentage of active members who are married or have a domestic partner at retirement or when they become disabled by 5% for males and females to 75% and 55%, respectively. This assumption will also be applied to determine the number of active members eligible for a pre-retirement surviving spouse death benefit. The current assumption is that male spouses are three years older than their wives. Table III-O4 compiles the average age difference for retired or disabled members between spouses and domestic partners. This information is used to predict spouse information for future retirees. We recommend changing the assumption so that the spouse of a male member is expected to be four years younger while the spouse of a female member is expected to be two years older.
Table III-O4
Age Difference Between Retired or Disabled Membersand Their Spouses or Domestic Partners
Females MalesCalendar
YearEligible Spouses
Member Age
Spouse Age Difference
Eligible Spouses
Member Age
Spouse Age Difference
2013 67 59.10 59.40 (0.30) 66 58.97 56.00 2.97 2014 85 60.20 62.83 (2.63) 73 53.52 50.08 3.44 2015 87 59.28 61.47 (2.19) 99 68.76 64.29 4.47 Total 239 59.56 61.37 (1.81) 238 61.37 57.63 3.74
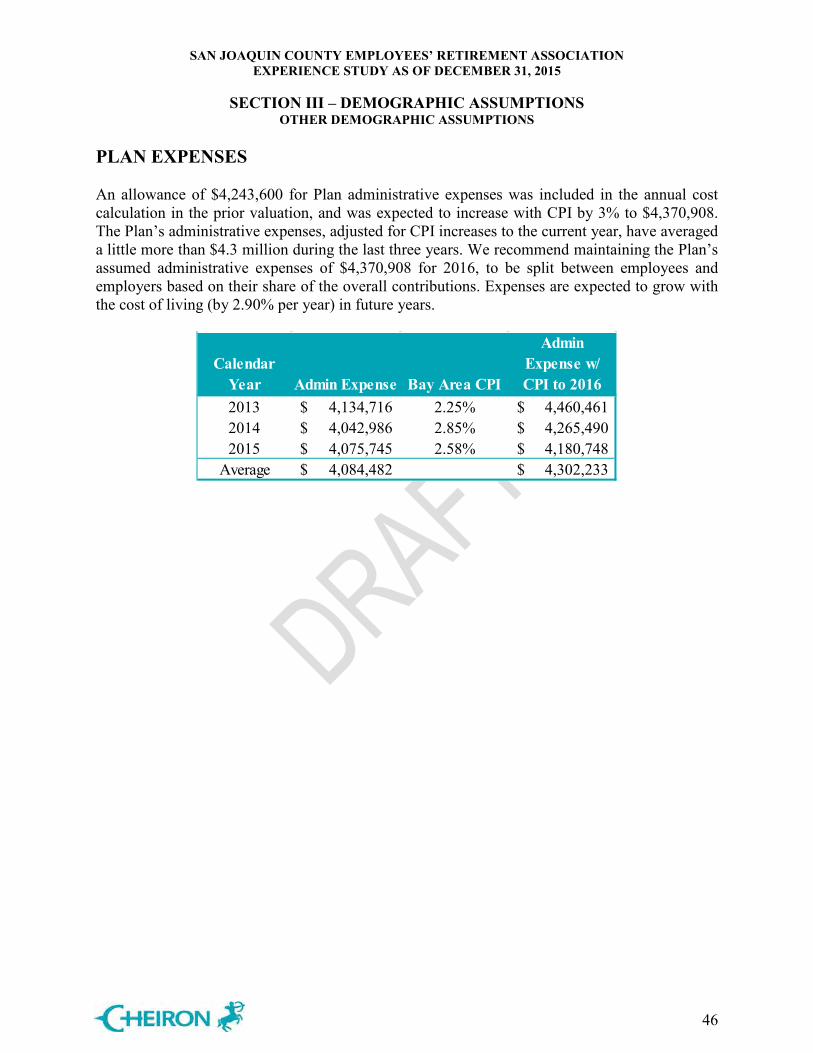
SAN JOAQUIN COUNTY EMPLOYEES’ RETIREMENT ASSOCIATION EXPERIENCE STUDY AS OF DECEMBER 31, 2015
SECTION III – DEMOGRAPHIC ASSUMPTIONS
OTHER DEMOGRAPHIC ASSUMPTIONS
46
PLAN EXPENSES An allowance of $4,243,600 for Plan administrative expenses was included in the annual cost calculation in the prior valuation, and was expected to increase with CPI by 3% to $4,370,908. The Plan’s administrative expenses, adjusted for CPI increases to the current year, have averaged a little more than $4.3 million during the last three years. We recommend maintaining the Plan’s assumed administrative expenses of $4,370,908 for 2016, to be split between employees and employers based on their share of the overall contributions. Expenses are expected to grow with the cost of living (by 2.90% per year) in future years.
Calendar Year Admin Expense Bay Area CPI
Admin Expense w/ CPI to 2016
2013 4,134,716$ 2.25% 4,460,461$ 2014 4,042,986$ 2.85% 4,265,490$ 2015 4,075,745$ 2.58% 4,180,748$
Average 4,084,482$ 4,302,233$
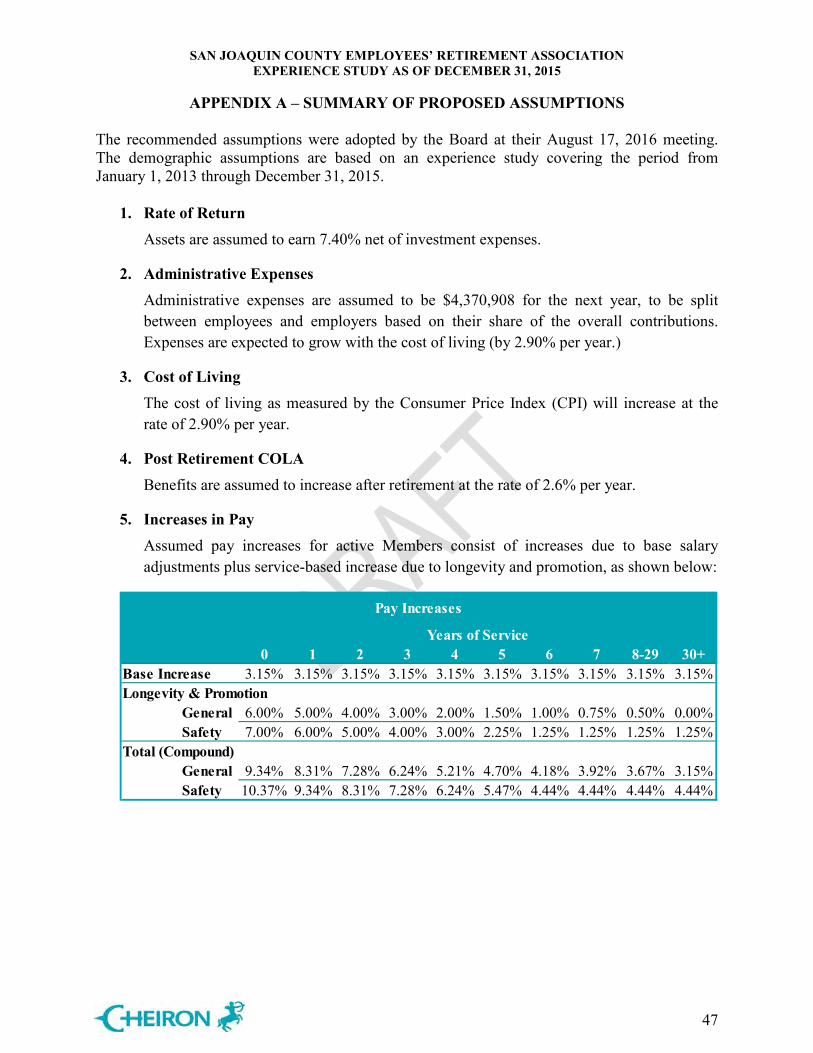
SAN JOAQUIN COUNTY EMPLOYEES’ RETIREMENT ASSOCIATION EXPERIENCE STUDY AS OF DECEMBER 31, 2015
APPENDIX A – SUMMARY OF PROPOSED ASSUMPTIONS
47
The recommended assumptions were adopted by the Board at their August 17, 2016 meeting. The demographic assumptions are based on an experience study covering the period from January 1, 2013 through December 31, 2015.
1. Rate of Return Assets are assumed to earn 7.40% net of investment expenses.
2. Administrative Expenses Administrative expenses are assumed to be $4,370,908 for the next year, to be split between employees and employers based on their share of the overall contributions. Expenses are expected to grow with the cost of living (by 2.90% per year.)
3. Cost of Living The cost of living as measured by the Consumer Price Index (CPI) will increase at the rate of 2.90% per year.
4. Post Retirement COLA Benefits are assumed to increase after retirement at the rate of 2.6% per year.
5. Increases in Pay Assumed pay increases for active Members consist of increases due to base salary adjustments plus service-based increase due to longevity and promotion, as shown below:
Years of Service0 1 2 3 4 5 6 7 8-29 30+
Base Increase 3.15% 3.15% 3.15% 3.15% 3.15% 3.15% 3.15% 3.15% 3.15% 3.15%Longevity & Promotion
General 6.00% 5.00% 4.00% 3.00% 2.00% 1.50% 1.00% 0.75% 0.50% 0.00%Safety 7.00% 6.00% 5.00% 4.00% 3.00% 2.25% 1.25% 1.25% 1.25% 1.25%
Total (Compound)General 9.34% 8.31% 7.28% 6.24% 5.21% 4.70% 4.18% 3.92% 3.67% 3.15%Safety 10.37% 9.34% 8.31% 7.28% 6.24% 5.47% 4.44% 4.44% 4.44% 4.44%
Pay Increases
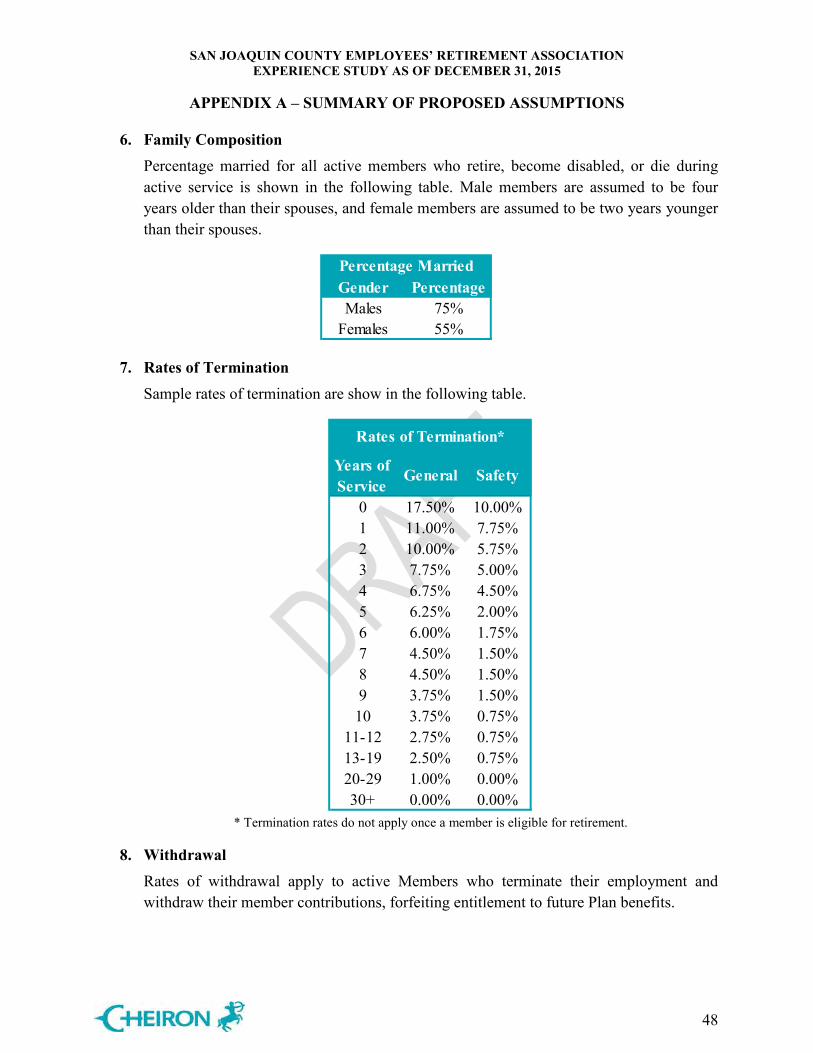
SAN JOAQUIN COUNTY EMPLOYEES’ RETIREMENT ASSOCIATION EXPERIENCE STUDY AS OF DECEMBER 31, 2015
APPENDIX A – SUMMARY OF PROPOSED ASSUMPTIONS
48
6. Family Composition Percentage married for all active members who retire, become disabled, or die during active service is shown in the following table. Male members are assumed to be four years older than their spouses, and female members are assumed to be two years younger than their spouses.
7. Rates of Termination Sample rates of termination are show in the following table.
* Termination rates do not apply once a member is eligible for retirement.
8. Withdrawal Rates of withdrawal apply to active Members who terminate their employment and withdraw their member contributions, forfeiting entitlement to future Plan benefits.
Gender PercentageMales 75%
Females 55%
Percentage Married
Years of Service
General Safety
0 17.50% 10.00%1 11.00% 7.75%2 10.00% 5.75%3 7.75% 5.00%4 6.75% 4.50%5 6.25% 2.00%6 6.00% 1.75%7 4.50% 1.50%8 4.50% 1.50%9 3.75% 1.50%
10 3.75% 0.75%11-12 2.75% 0.75%13-19 2.50% 0.75%20-29 1.00% 0.00%30+ 0.00% 0.00%
Rates of Termination*

SAN JOAQUIN COUNTY EMPLOYEES’ RETIREMENT ASSOCIATION EXPERIENCE STUDY AS OF DECEMBER 31, 2015
APPENDIX A – SUMMARY OF PROPOSED ASSUMPTIONS
49
60% of all General Member terminations with less than five years of service, 30% of those with five to 14 years of service, and 10% of those with more than 15 years of service, are assumed to take a refund of contributions.
60% of all Safety Member terminations with less than five years of service, 10% of those with five to 14 years of service, and none of those with more than 15 years of service, are assumed to take a refund of contributions.
9. Vested Termination and Reciprocal Transfers Rates of vested termination apply to active Members who terminate their employment and leave their member contributions on deposit with the Plan.
40% of all General Member terminations with less than five years of service, 70% of those with five to 14 years of service, and 90% of those with more than 15 years of service, are assumed to leave their contributions on deposit.
40% of all Safety Member terminations with less than five years of service, 90% of those with five to 14 years of service, and 100% of those with more than 15 years of service, are assumed to leave their contributions on deposit.
Vested terminated General Members are assumed to begin receiving benefits at age 58; vested terminated Safety Members are assumed to begin receiving benefits at age 50.
25% of vested terminated General Members and 50% of vested terminated Safety Members are assumed to be reciprocal.
Final average pay for General Members who terminate with reciprocity is assumed to increase by 3.67% per year until their assumed retirement date. Final average pay for Safety Members who terminate with reciprocity is assumed to increase by 4.44% per year until their assumed retirement date.

SAN JOAQUIN COUNTY EMPLOYEES’ RETIREMENT ASSOCIATION EXPERIENCE STUDY AS OF DECEMBER 31, 2015
APPENDIX A – SUMMARY OF PROPOSED ASSUMPTIONS
50
10. Rates of Service-Connected Disability Sample service-connected disability rates of active participants are provided in the table below.
11. Rates of Nonservice-Connected Disability
Sample nonservice-connected disability rates of active participants are provided in the table below.
12. Rates of Mortality for Healthy Lives Mortality rates for active members are based on the sex distinct CALPERS Preretirement Non-Industrial Mortality Table, with generational mortality improvements projected from 2009 using Projection Scale MP-2015, published by the Society of Actuaries.
General General Safety SafetyAge Male Female Male Female22 0.066% 0.022% 0.048% 0.048%27 0.066% 0.030% 0.086% 0.089%32 0.066% 0.051% 0.161% 0.166%37 0.066% 0.073% 0.296% 0.305%42 0.380% 0.094% 0.565% 0.592%47 0.380% 0.123% 1.023% 1.101%52 0.226% 0.159% 1.425% 1.425%57 0.226% 0.204% 1.425% 1.425%62 0.226% 0.249% 1.425% 1.425%
Rates of Svc Disability
General General Safety SafetyAge Male Female Male Female22 0.051% 0.053% 0.003% 0.003%27 0.068% 0.067% 0.005% 0.005%32 0.086% 0.081% 0.008% 0.009%37 0.108% 0.102% 0.016% 0.016%42 0.138% 0.138% 0.030% 0.031%47 0.178% 0.197% 0.054% 0.058%52 0.225% 0.267% 0.075% 0.075%57 0.286% 0.337% 0.075% 0.075%62 0.362% 0.408% 0.075% 0.075%
Rates of Non-Svc Disability

SAN JOAQUIN COUNTY EMPLOYEES’ RETIREMENT ASSOCIATION EXPERIENCE STUDY AS OF DECEMBER 31, 2015
APPENDIX A – SUMMARY OF PROPOSED ASSUMPTIONS
51
Mortality rates for healthy annuitants are based on the sex distinct CALPERS Healthy Annuitant Mortality Table, with no adjustment for General members and a partial credibility adjustment of 1.10 for Safety members, with generational mortality improvements projected from 2009 using Projection Scale MP-2015, published by the Society of Actuaries.
Mortality rates for active members who die in the line-of-duty are based on the sex distinct CALPERS Preretirement Industrial Mortality Table, with generational mortality improvements projected from 2009 using Projection Scale MP-2015, published by the Society of Actuaries.
13. Rates of Mortality for Disabled Retirees Mortality rates for Safety disabled annuitants are based on the sex distinct CALPERS Industrially Disabled Annuitant Mortality Table, with no adjustment, with generational mortality improvements projected from 2009 using Projection Scale MP-2015, published by the Society of Actuaries.
Mortality rates for General disabled annuitants are based on the sex distinct CALPERS Non-Industrially Disabled Annuitant Mortality Table, with a partial credibility adjustment of 1.05, with generational mortality improvements projected from 2009 using Projection Scale MP-2015, published by the Society of Actuaries.

SAN JOAQUIN COUNTY EMPLOYEES’ RETIREMENT ASSOCIATION EXPERIENCE STUDY AS OF DECEMBER 31, 2015
APPENDIX A – SUMMARY OF PROPOSED ASSUMPTIONS
52
14. Rates of Retirement Rates of retirement are based on age according to the following table.
Age 5-9 10-29 30+ 5-9 10-29 30+ 10-19 20+45 0.00% 0.00% 0.00% 0.00% 0.00% 0.00% 0.00% 5.00%46 0.00% 0.00% 0.00% 0.00% 0.00% 0.00% 0.00% 5.00%47 0.00% 0.00% 0.00% 0.00% 0.00% 0.00% 0.00% 5.00%48 0.00% 0.00% 0.00% 0.00% 0.00% 0.00% 0.00% 5.00%49 0.00% 0.00% 0.00% 0.00% 0.00% 0.00% 0.00% 5.00%50 3.25% 4.00% 5.00% 3.50% 3.50% 4.50% 10.00% 15.00%51 3.25% 4.00% 5.00% 3.50% 3.50% 4.50% 5.00% 10.00%52 3.25% 4.00% 5.00% 3.50% 3.50% 4.50% 5.00% 10.00%53 3.25% 4.00% 5.00% 3.50% 3.50% 4.50% 5.00% 20.00%54 3.25% 4.00% 5.00% 3.50% 3.50% 4.50% 5.00% 20.00%55 4.00% 8.50% 15.00% 3.50% 3.50% 4.50% 5.00% 30.00%56 4.00% 4.00% 15.00% 3.50% 7.00% 15.00% 5.00% 20.00%57 4.00% 4.00% 15.00% 3.50% 7.00% 15.00% 5.00% 20.00%58 4.00% 4.00% 20.00% 3.50% 7.00% 15.00% 5.00% 20.00%59 4.00% 15.00% 25.00% 3.50% 7.00% 15.00% 5.00% 20.00%60 4.00% 15.00% 25.00% 7.50% 12.50% 15.00% 5.00% 20.00%61 7.50% 17.50% 35.00% 7.50% 12.50% 25.00% 25.00% 25.00%62 7.50% 30.00% 40.00% 7.50% 25.00% 30.00% 25.00% 50.00%63 7.50% 25.00% 35.00% 7.50% 25.00% 35.00% 25.00% 50.00%64 7.50% 25.00% 35.00% 7.50% 25.00% 40.00% 25.00% 50.00%65 15.00% 25.00% 50.00% 15.00% 25.00% 40.00% 100.00% 100.00%66 15.00% 35.00% 50.00% 15.00% 25.00% 40.00% 100.00% 100.00%67 15.00% 30.00% 40.00% 15.00% 25.00% 40.00% 100.00% 100.00%68 15.00% 30.00% 30.00% 15.00% 25.00% 40.00% 100.00% 100.00%69 15.00% 30.00% 30.00% 15.00% 25.00% 40.00% 100.00% 100.00%70 100.00% 100.00% 100.00% 100.00% 100.00% 100.00% 100.00% 100.00%
Rates of Retirement
General MaleYears of Service
General FemaleYears of Service Years of Service
Safety
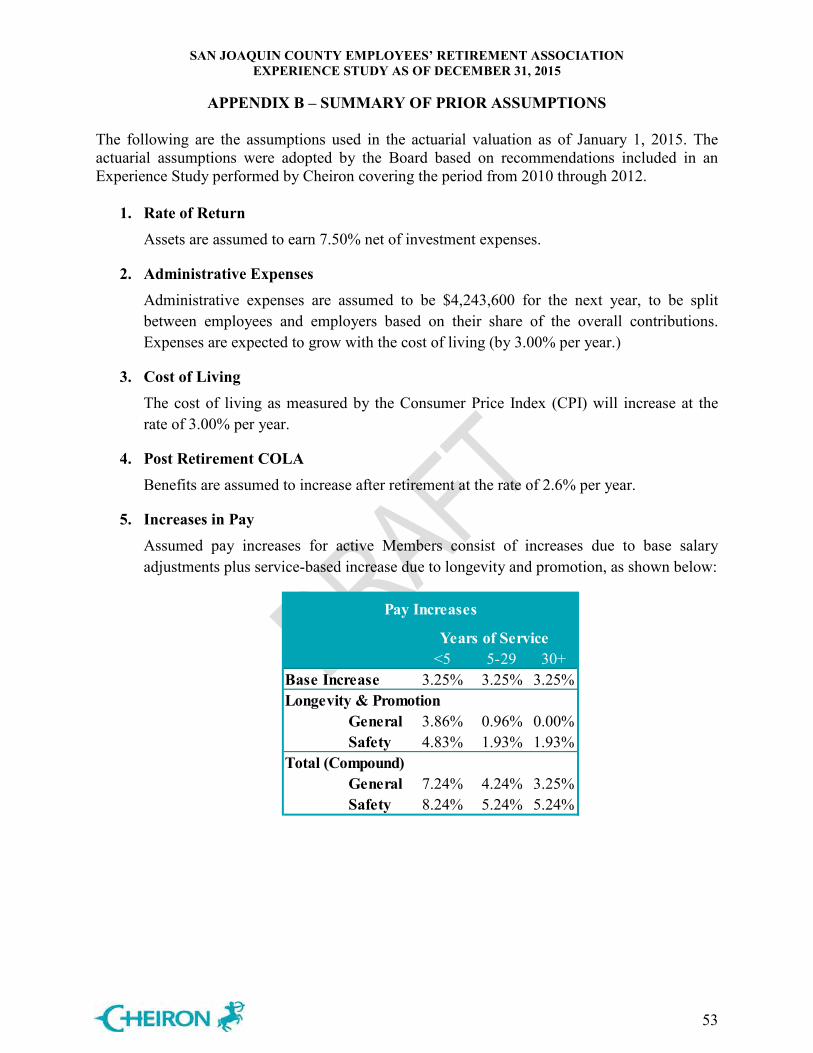
SAN JOAQUIN COUNTY EMPLOYEES’ RETIREMENT ASSOCIATION EXPERIENCE STUDY AS OF DECEMBER 31, 2015
APPENDIX B – SUMMARY OF PRIOR ASSUMPTIONS
53
The following are the assumptions used in the actuarial valuation as of January 1, 2015. The actuarial assumptions were adopted by the Board based on recommendations included in an Experience Study performed by Cheiron covering the period from 2010 through 2012.
1. Rate of Return Assets are assumed to earn 7.50% net of investment expenses.
2. Administrative Expenses Administrative expenses are assumed to be $4,243,600 for the next year, to be split between employees and employers based on their share of the overall contributions. Expenses are expected to grow with the cost of living (by 3.00% per year.)
3. Cost of Living The cost of living as measured by the Consumer Price Index (CPI) will increase at the rate of 3.00% per year.
4. Post Retirement COLA Benefits are assumed to increase after retirement at the rate of 2.6% per year.
5. Increases in Pay Assumed pay increases for active Members consist of increases due to base salary adjustments plus service-based increase due to longevity and promotion, as shown below:
Years of Service<5 5-29 30+
Base Increase 3.25% 3.25% 3.25%Longevity & Promotion
General 3.86% 0.96% 0.00%Safety 4.83% 1.93% 1.93%
Total (Compound)General 7.24% 4.24% 3.25%Safety 8.24% 5.24% 5.24%
Pay Increases

SAN JOAQUIN COUNTY EMPLOYEES’ RETIREMENT ASSOCIATION EXPERIENCE STUDY AS OF DECEMBER 31, 2015
APPENDIX B – SUMMARY OF PRIOR ASSUMPTIONS
54
6. Family Composition Percentage married for all active members who retire, become disabled, or die during active service is shown in the following table. Female members are assumed to be three years younger than male members.
7. Rates of Termination Sample rates of termination are show in the following table.
* Termination rates do not apply once a member is eligible for retirement.
8. Withdrawal Rates of withdrawal apply to active Members who terminate their employment and withdraw their member contributions, forfeiting entitlement to future Plan benefits.
50% of all General Member terminations with less than five years of service are assumed to take a refund of contributions, as well as 35% of those with five to 14 years of service.
Gender PercentageMales 70%
Females 50%
Percentage Married
Years of Service
General Safety
0 12.75% 8.75%1 10.00% 7.75%2 10.00% 5.75%3 7.75% 2.75%4 4.75% 2.75%5 4.50% 2.00%6 4.50% 2.00%7 4.50% 2.00%8 3.75% 2.00%9 3.00% 2.00%
10-19 2.00% 1.00%20-29 1.00% 0.00%30+ 0.00% 0.00%
Rates of Termination*

SAN JOAQUIN COUNTY EMPLOYEES’ RETIREMENT ASSOCIATION EXPERIENCE STUDY AS OF DECEMBER 31, 2015
APPENDIX B – SUMMARY OF PRIOR ASSUMPTIONS
55
20% of all Safety Member terminations with less than five years of service are assumed to take a refund of contributions and 10% of those between five and 14 years are assumed to take a refund.
9. Vested Termination and Reciprocal Transfers Rates of vested termination apply to active Members who terminate their employment and leave their member contributions on deposit with the Plan.
50% of all General Member terminations with less than five years of service are assumed to leave their contributions on deposit, as well as 65% of those with five to 14 years of service, and 100% of those with 15 or more years of service.
80% of all Safety Member terminations with less than five years of service are assumed to leave their contributions on deposit, as well as 90% of those between five and 14 years of service and 100% of those with 15 or more years of service.
Vested terminated General Members are assumed to begin receiving benefits at age 58; terminated Safety Members are assumed to begin receiving benefits at age 53.
25% of vested terminated General Members and 50% of vested terminated Safety Members are assumed to be reciprocal.
Final average pay for General Members who terminate with reciprocity is assumed to increase by 4.25% per year until their assumed retirement date. Final average pay for Safety Members who terminate with reciprocity is assumed to increase by 5.25% per year until their assumed retirement date.

SAN JOAQUIN COUNTY EMPLOYEES’ RETIREMENT ASSOCIATION EXPERIENCE STUDY AS OF DECEMBER 31, 2015
APPENDIX B – SUMMARY OF PRIOR ASSUMPTIONS
56
10. Rates of Service-Connected Disability Sample service-connected disability rates of active participants are provided in the table below.
11. Rates of Nonservice-Connected Disability Sample nonservice-connected disability rates of active participants are provided in the table below.
General GeneralAge Male Female Safety22 0.066% 0.022% 0.050%27 0.066% 0.030% 0.088%32 0.066% 0.051% 0.165%37 0.066% 0.073% 0.302%42 0.380% 0.094% 0.566%47 0.380% 0.123% 0.995%52 0.226% 0.159% 1.713%57 0.226% 0.204% 2.633%62 0.226% 0.249% 0.000%
Rates of Svc Disability
General General Safety SafetyAge Male Female Male Female22 0.051% 0.053% 0.000% 0.000%27 0.068% 0.067% 0.003% 0.006%32 0.086% 0.081% 0.005% 0.010%37 0.108% 0.102% 0.009% 0.019%42 0.138% 0.138% 0.028% 0.057%47 0.178% 0.197% 0.082% 0.164%52 0.225% 0.267% 0.167% 0.334%57 0.286% 0.337% 0.265% 0.529%62 0.362% 0.408% 0.000% 0.000%
Rates of Non-Svc Disability

SAN JOAQUIN COUNTY EMPLOYEES’ RETIREMENT ASSOCIATION EXPERIENCE STUDY AS OF DECEMBER 31, 2015
APPENDIX B – SUMMARY OF PRIOR ASSUMPTIONS
57
12. Rates of Mortality for Healthy Lives Mortality rates for active members, retirees, beneficiaries, terminated vested, and reciprocal members are based on the sex distinct Retired Pensioner (RP) 2000 Combined Healthy Tables, published by the Society of Actuaries, with Generational Projection using Projection Scale BB.
13. Rates of Mortality for Disabled Retirees Mortality rates for active members, retirees, beneficiaries, terminated vested, and reciprocal members are based on the sex distinct Retired Pensioner (RP) 2000 Combined Healthy Tables, published by the Society of Actuaries, with Generational Projection using Projection Scale BB, set-forward eight years for males and females.
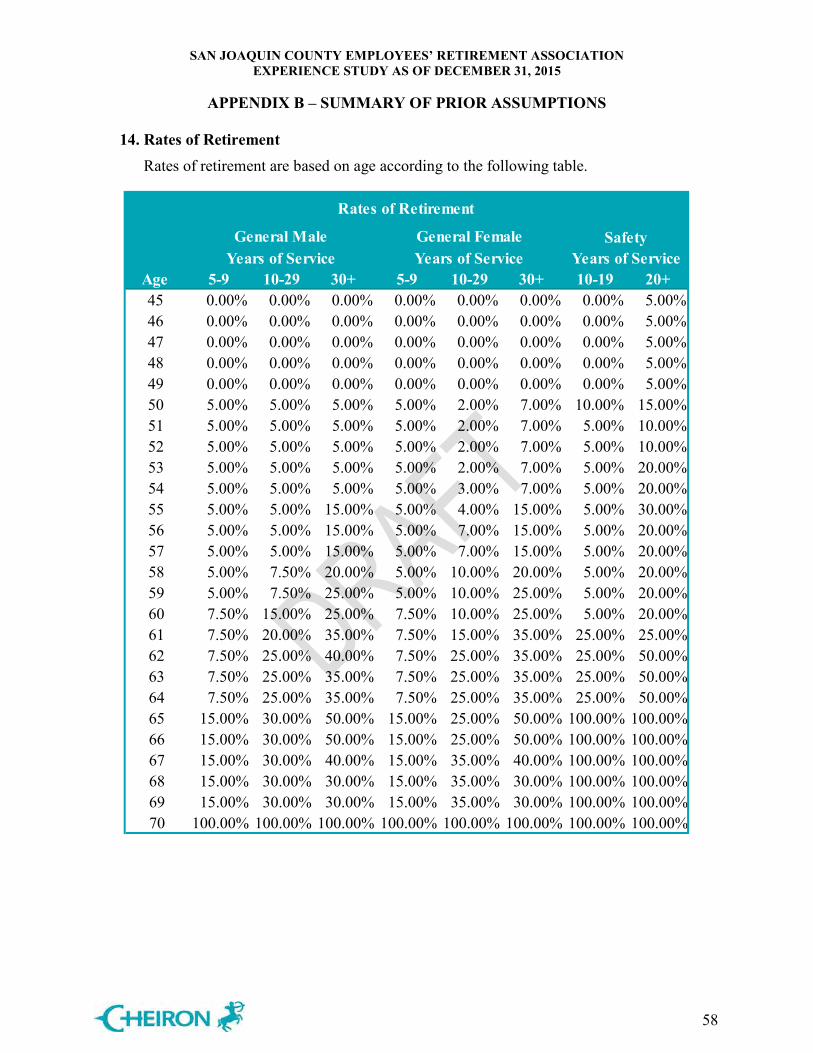
SAN JOAQUIN COUNTY EMPLOYEES’ RETIREMENT ASSOCIATION EXPERIENCE STUDY AS OF DECEMBER 31, 2015
APPENDIX B – SUMMARY OF PRIOR ASSUMPTIONS
58
14. Rates of Retirement Rates of retirement are based on age according to the following table.
Age 5-9 10-29 30+ 5-9 10-29 30+ 10-19 20+45 0.00% 0.00% 0.00% 0.00% 0.00% 0.00% 0.00% 5.00%46 0.00% 0.00% 0.00% 0.00% 0.00% 0.00% 0.00% 5.00%47 0.00% 0.00% 0.00% 0.00% 0.00% 0.00% 0.00% 5.00%48 0.00% 0.00% 0.00% 0.00% 0.00% 0.00% 0.00% 5.00%49 0.00% 0.00% 0.00% 0.00% 0.00% 0.00% 0.00% 5.00%50 5.00% 5.00% 5.00% 5.00% 2.00% 7.00% 10.00% 15.00%51 5.00% 5.00% 5.00% 5.00% 2.00% 7.00% 5.00% 10.00%52 5.00% 5.00% 5.00% 5.00% 2.00% 7.00% 5.00% 10.00%53 5.00% 5.00% 5.00% 5.00% 2.00% 7.00% 5.00% 20.00%54 5.00% 5.00% 5.00% 5.00% 3.00% 7.00% 5.00% 20.00%55 5.00% 5.00% 15.00% 5.00% 4.00% 15.00% 5.00% 30.00%56 5.00% 5.00% 15.00% 5.00% 7.00% 15.00% 5.00% 20.00%57 5.00% 5.00% 15.00% 5.00% 7.00% 15.00% 5.00% 20.00%58 5.00% 7.50% 20.00% 5.00% 10.00% 20.00% 5.00% 20.00%59 5.00% 7.50% 25.00% 5.00% 10.00% 25.00% 5.00% 20.00%60 7.50% 15.00% 25.00% 7.50% 10.00% 25.00% 5.00% 20.00%61 7.50% 20.00% 35.00% 7.50% 15.00% 35.00% 25.00% 25.00%62 7.50% 25.00% 40.00% 7.50% 25.00% 35.00% 25.00% 50.00%63 7.50% 25.00% 35.00% 7.50% 25.00% 35.00% 25.00% 50.00%64 7.50% 25.00% 35.00% 7.50% 25.00% 35.00% 25.00% 50.00%65 15.00% 30.00% 50.00% 15.00% 25.00% 50.00% 100.00% 100.00%66 15.00% 30.00% 50.00% 15.00% 25.00% 50.00% 100.00% 100.00%67 15.00% 30.00% 40.00% 15.00% 35.00% 40.00% 100.00% 100.00%68 15.00% 30.00% 30.00% 15.00% 35.00% 30.00% 100.00% 100.00%69 15.00% 30.00% 30.00% 15.00% 35.00% 30.00% 100.00% 100.00%70 100.00% 100.00% 100.00% 100.00% 100.00% 100.00% 100.00% 100.00%
Rates of Retirement
General MaleYears of Service
General FemaleYears of Service Years of Service
Safety


San Joaquin County Employees’ Retirement Association
Actuarial Valuation as of January 1, 2016
Produced by Cheiron
September 2016

TABLE OF CONTENTS Section Letter of Transmittal ........................................................................................................................ i Foreword ......................................................................................................................................... ii Section I Executive Summary .................................................................................................1 Section II Assets .....................................................................................................................13 Section III Liabilities ...............................................................................................................21 Section IV Contributions..........................................................................................................24 Section V Additional CAFR Schedules ..................................................................................28 Appendices Appendix A Membership Information .......................................................................................29 Appendix B Statement of Current Actuarial Assumptions and Methods ..................................51 Appendix C Summary of Plan Provisions ..................................................................................58 Appendix D 401(h) Repayment Schedule ..................................................................................71
Appendix E Glossary .................................................................................................................72 Appendix F General and Safety Employer Contribution Rates .................................................74 Appendix G Member Contribution Rates ...................................................................................79

September 16, 2016 Retirement Board of San Joaquin County Employees’ Retirement Association 6 South El Dorado Street, Suite 400 Stockton, CA 95202 Dear Members of the Board: At your request, we have conducted an actuarial valuation of the San Joaquin County Employees’ Retirement Association (SJCERA, the System, the Fund, the Plan) as of January 1, 2016. This report contains information on the System’s assets and liabilities and discloses employer and employee contribution levels. It also contains schedules for inclusion in the Actuarial Section of the Comprehensive Annual Financial Report (CAFR). Your attention is called to the Foreword in which we refer to the general approach employed in the preparation of this report. The purpose of this report is to present the results of the annual actuarial valuation of SJCERA. This report is for the use of the Retirement Board of SJCERA and its auditors in preparing financial reports in accordance with applicable law and accounting requirements. Cheiron’s report was prepared solely for the Retirement Board of SJCERA for the purposes described herein, except that the plan auditor may rely on this report solely for the purpose of completing an audit related to the matters herein. Other users of this report are not intended users as defined in the Actuarial Standards of Practice, and Cheiron assumes no duty or liability to any other user.
To the best of our knowledge, this report and its contents have been prepared in accordance with generally recognized and accepted actuarial principles and practices which are consistent with the Code of Professional Conduct and applicable Actuarial Standards of Practice set out by the Actuarial Standards Board. Furthermore, as credentialed actuaries, we meet the Qualification Standards of the American Academy of Actuaries to render the opinion contained in this report. This report does not address any contractual or legal issues. We are not attorneys and our firm does not provide any legal services or advice.
Sincerely, Cheiron Graham Schmidt, ASA, FCA, MAAA, EA Anne Harper, FSA, MAAA, EA Consulting Actuary Consulting Actuary
SAN JOAQUIN COUNTY EMPLOYEES’ RETIREMENT ASSOCIATION ACTUARIAL VALUATION REPORT AS OF JANUARY 1, 2016
FOREWORD
ii
Cheiron has performed the actuarial valuation of the San Joaquin County Employees’ Retirement Association as of January 1, 2016. The valuation is organized as follows:
• In Section I, the Executive Summary, we describe the purpose of an actuarial valuation,
summarize the key results found in this valuation and disclose important trends;
• The Main Body of the report presents details on the System’s
o Section II - Assets o Section III - Liabilities o Section IV- Contributions o Section V- Additional CAFR Schedules
• In the Appendices we conclude our report with detailed information describing plan
membership (Appendix A), actuarial assumptions and methods employed in the valuation (Appendix B), a summary of pertinent plan provisions (Appendix C), a 401(h) repayment schedule (Appendix D), a glossary of key actuarial terms (Appendix E), a summary of General and Safety Employer contribution rates (Appendix F), and tables containing member contribution rates (Appendix G).
The results of this report rely on future plan experience conforming to the actuarial assumptions. To the extent that actual plan experience deviates from these assumptions, the results would vary accordingly. In preparing our report, we relied on information (some oral and some written) supplied by the SJCERA staff. This information includes, but is not limited to, plan provisions, employee data, and financial information. We performed an informal examination of the obvious characteristics of the data for reasonableness and consistency in accordance with Actuarial Standard of Practice No. 23.

SAN JOAQUIN COUNTY EMPLOYEES’ RETIREMENT ASSOCIATION ACTUARIAL VALUATION REPORT AS OF JANUARY 1, 2016
SECTION I – EXECUTIVE SUMMARY
1
The primary purpose of the actuarial valuation and this report is to measure, describe, and identify the following as of the valuation date:
• The financial condition of the System, • Past and expected trends in the financial progress of the System, and • Employer and employee contribution rates for Plan Year 2017.
In previous years, the valuation report included information required by the Government Accounting Standards Board (GASB). The information required under the new GASB standards (Nos. 67 and 68) is now included in a separate report, with the report for the Plan’s Fiscal Year Ending December 31, 2015 provided to SJCERA in May 2016. In the balance of this Executive Summary, we present (A) the basis upon which this year’s valuation was completed, (B) the key findings of this valuation including a summary of all key financial results, (C) an examination of the historical trends, and (D) the projected financial outlook for the System. A. Valuation Basis
This valuation determines the employer contributions for the plan year. The System’s funding policy is to contribute an amount equal to the sum of:
• The normal cost under the Entry Age Normal Cost Method, • Amortization of the unfunded actuarial liability (UAL), and • A portion of the Fund’s expected administrative expenses.
At the July 24, 2015 board meeting, the SJCERA Board of Retirement made a change to the funding policy, choosing to amortize any new unexpected changes in the UAL over a period of 15 years as a level percent of pay, with new amortization layers each year. The single equivalent amortization period for these streams of payments is 19 years. The amortization period for each layer of the remaining UAL will decrease each year. Prior to this change, all UAL, other than the extraordinary loss from 2008, was being amortized over a closed period of 19 years as a level percentage of member payroll. This valuation was prepared based on the plan provisions shown in Appendix C. There have been no changes in plan provisions since the prior valuation. An Actuarial Experience Study was performed since the last valuation, covering experience from January 1, 2013 through December 31, 2015, leading to changes in demographic and economic assumptions. A summary of the assumptions and methods used in the current valuation is shown in Appendix B.

SAN JOAQUIN COUNTY EMPLOYEES’ RETIREMENT ASSOCIATION ACTUARIAL VALUATION REPORT AS OF JANUARY 1, 2016
SECTION I – EXECUTIVE SUMMARY
2
B. Key Findings of this Valuation
The key results of the January 1, 2016 actuarial valuation are as follows: • The actuarially determined employer contribution rate increased from 41.35% of payroll
last year to 41.71% of payroll for 2016 before assumption changes. Assumption changes further increased the employer contribution rate from 41.71% to 42.99%.
• The System’s funded ratio, the ratio of assets over actuarial liability, decreased from 66.2% last year to 65.0% as of January 1, 2016 on an Actuarial Value of Assets (AVA) basis, and from 65.6% to 60.1% on a Market Value of Assets (MVA) basis.
• The unfunded actuarial liability (UAL) is the excess of the System’s actuarial liability over the Actuarial Value of Assets. The System experienced an increase in the UAL from $1,260,343,325 to $1,401,917,266 as of January 1, 2016.
• During the year ending December 31, 2015, the return on Plan assets was -1.92% on a market value basis, as compared to the 7.50% assumption. This resulted in a market value loss on investments of $232,118,073. The Actuarial Value of Assets recognizes 20% of the difference between the expected actuarial value of assets and the Market Value of Assets. This method of smoothing the asset gains and losses returned 5.63% on the smoothed value of assets, an actuarial asset loss of $46,199,967 for the year.
• The Actuarial Value of Assets is currently 108% of market value. Since actuarial assets are above market assets, there are unrecognized investment losses (approximately $195 million) that will be reflected in the smoothed value in future years.
• The System experienced a loss on the actuarial liability of $3,690,955. Combining the liability and asset losses, the System experienced a total loss of $49,890,922.
• Changes in assumptions following an Actuarial Experience Study increased the Plan’s liabilities by $91,855,247.
On the following page, we present Table I-1, which summarizes all the key results of the valuation with respect to membership, assets and liabilities, and contributions. The results are presented and compared for both the current and prior plan year.

SAN JOAQUIN COUNTY EMPLOYEES’ RETIREMENT ASSOCIATION ACTUARIAL VALUATION REPORT AS OF JANUARY 1, 2016
SECTION I – EXECUTIVE SUMMARY
3
January 1, 2015 January 1, 2016 % ChangeParticipant CountsActive Participants 5,706 5,924 3.82%Participants Receiving a Benefit 5,249 5,435 3.54%Terminated Vested Participants 899 899 0.00%Terminated Non-Vested Participants 536 557 3.92%Total 12,390 12,815 3.43%
Annual Pay of Active Members $ 382,525,098 $ 391,328,162 2.30%Calendar Year Projected Pay $ 397,636,401 $ 413,551,615 4.00%
Assets and LiabilitiesActuarial Liability (AL) $ 3,731,634,372 $ 4,006,390,050 7.36%Actuarial Value of Assets (AVA) 2,471,291,047 2,604,472,784 5.39%Unfunded Actuarial Liability (UAL) $ 1,260,343,325 $ 1,401,917,266 11.23%Funded Ratio (AVA) 66.2% 65.0% -1.84%Funded Ratio (MVA) 65.6% 60.1% -8.26%Inactive Funded Ratio 59.4% 61.7% 3.87%
Contributions as a Percentage of PayrollNormal Cost Rate 16.86% 15.52% -1.34%Unfunded Actuarial Liability Rate 23.58% 26.56% 2.98%Administrative Expense 0.91% 0.91% 0.00%Total Contribution Rate 41.35% 42.99% 1.64%
TABLE I-1Summary of Principal Plan Results

SAN JOAQUIN COUNTY EMPLOYEES’ RETIREMENT ASSOCIATION ACTUARIAL VALUATION REPORT AS OF JANUARY 1, 2016
SECTION I – EXECUTIVE SUMMARY
4
Changes in Cost Table I-2 below summarizes the impact of actuarial experience and changes in assumptions on Plan cost, for the Plan as a whole and for the General and Safety classes.
An analysis of the cost changes from the prior valuation reveals the following:
• Demographic experience was somewhat unfavorable. The demographic experience of the Plan – rates of retirement, death, disability, and termination – was slightly worse overall than predicted by the actuarial assumptions in aggregate, causing a 0.52% increase in employer cost. Most of this increase was due to COLA increases for retirees and other members in pay status of 3.00%, higher than the expectation of 2.60%, and some new retirees having higher benefits than expected. Safety members also had more retirements than expected, while there were more pre-retirement General terminations than expected, both of which contributed to a relatively larger demographic loss for Safety versus General.
• Pay increases for returning members were below expectations.
Increases in pay among active General and Safety members during 2015 were below those anticipated by the actuarial assumptions. As a result, actuarial liabilities increased less than expected, resulting in an actuarial gain, decreasing the overall employer contribution rate by 0.59% of payroll.
• The unfunded liability is being amortized over a larger-than-expected payroll base for the General members, but over a smaller-than-expected base for Safety members.
The payroll used to amortize the unfunded liability for General members was higher than expected due to an expansion in the General member workforce, which decreased the General employer contribution rate by an additional 0.45% of pay. However, the Safety
General Employer
Cost
General Employer
Contribution Rate (% Payroll)
Safety Employer
Cost
Safety Employer Contribution
Rate (% Payroll)
Total Employer
Cost
Employer Contribution
Rate (% Payroll)January 1, 2015 $ 113,421,902 35.66% $ 46,080,014 68.06% $ 159,501,916 41.35% Change in Cost Due to:
Demographic Experience 1,380,451 0.32% 1,220,437 1.30% 2,600,888 0.52% Salary Experience (2,171,455) ( 0.51%) (910,520) ( 0.97%) (3,081,975) ( 0.59%)Payroll Amortization 0 ( 0.45%) 0 2.51% 0 ( 0.18%)New Entrants to the Plan 4,125,637 ( 0.21%) 247,455 ( 0.16%) 4,373,092 ( 0.39%)Asset Experience 3,056,970 0.87% 1,089,089 1.68% 4,146,059 1.00% Assumption Changes 5,156,191 1.47% 248,565 0.32% 5,404,756 1.28%
Total Cost as of January 1, 2016 $ 124,969,696 37.15% $ 47,975,040 72.74% $ 172,944,736 42.99%
TABLE I-2Summary of Changes in Plan Cost from Prior Review
SAN JOAQUIN COUNTY EMPLOYEES’ RETIREMENT ASSOCIATION ACTUARIAL VALUATION REPORT AS OF JANUARY 1, 2016
SECTION I – EXECUTIVE SUMMARY
5
workforce actually shrank – dropping from 827 to 793 active members – which reduced overall Safety projected payroll, resulting in an increase in the contribution rate by over 2.5% of pay. The aggregate impact from the change in total projected payroll was a reduction in the contribution rate of 0.18% of pay. Note that the change in the payroll base used to amortize the unfunded liability does not change the dollar amount of the contribution – only the contribution rate calculated as a percentage of pay.
• New members entered the Plan.
During 2015, there were 763 newly hired or rehired members entering the Plan to replace departing members. New Tier 2 hires have a smaller Plan normal cost as a percentage of payroll when compared to the legacy (Tier 1) members, but they also increase the payroll on which normal cost contributions are based. Due to the shift in both populations towards more Tier 2 members, the employer contribution rate decreased by 0.22% of payroll for General members and by 0.16% of pay for Safety members. The overall contribution rate dropped by a larger amount (0.39% of pay), because there were significantly more General new hires than Safety new hires, and the new General members have a lower expected cost. The new members do earn additional benefits and therefore add to the normal cost of the Plan. The new members increased member payroll by $38 million, and increased the Plan cost by about $4.4 million.
Overall, the combined demographic and salary experience resulted in gains, for a net decrease in cost of about 0.64% of pay.
• Asset experience produced an investment loss on a market basis. The assets of the Plan returned -1.92% on a market basis, lower than the assumed rate of 7.50%, resulting in a loss of approximately $232 million for 2015. Under the actuarial asset smoothing policy, 20% of this loss is recognized in the current year, in addition to 20% of the gains and losses from each of the prior three years. The overall return on the smoothed assets was 5.63%, increasing the overall contribution rate by 1.00% of pay. The contribution rate increased more for Safety members (by 1.68% of pay) than for General members (0.87% of pay) as a result of the asset loss; this is due to the fact that the Safety members have a higher ratio of assets to payroll than the General members, and is discussed further in the section on cost sensitivity below.
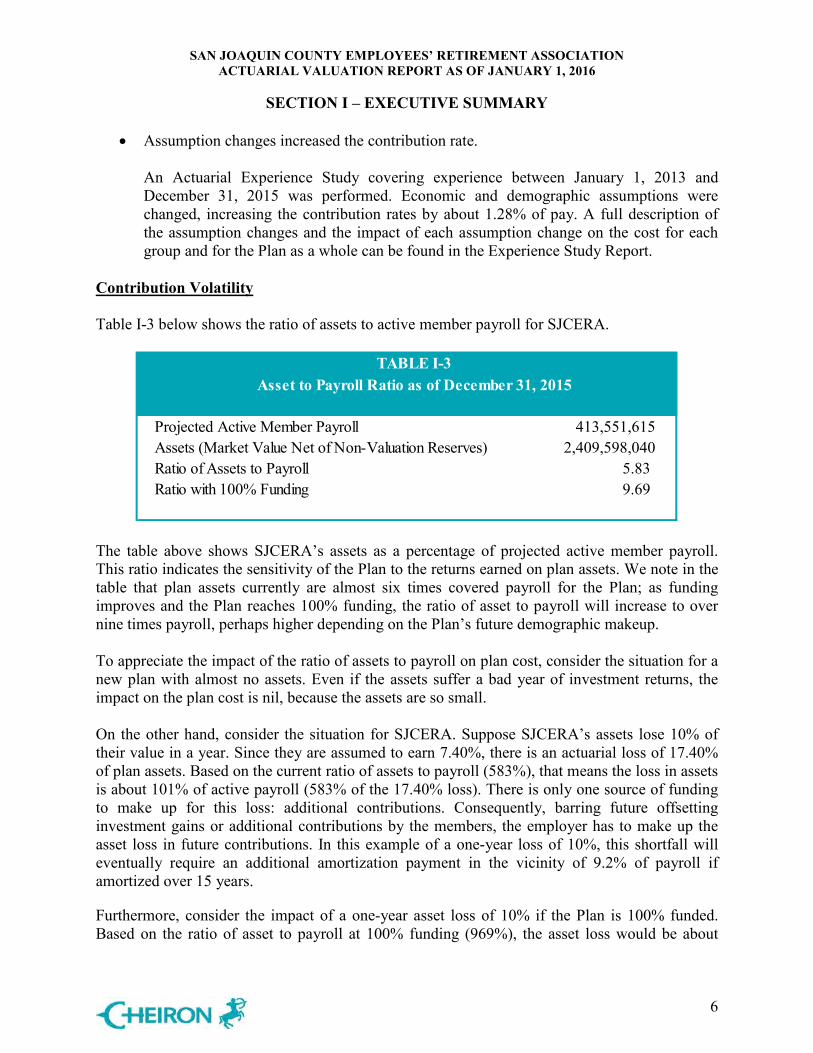
SAN JOAQUIN COUNTY EMPLOYEES’ RETIREMENT ASSOCIATION ACTUARIAL VALUATION REPORT AS OF JANUARY 1, 2016
SECTION I – EXECUTIVE SUMMARY
6
• Assumption changes increased the contribution rate. An Actuarial Experience Study covering experience between January 1, 2013 and December 31, 2015 was performed. Economic and demographic assumptions were changed, increasing the contribution rates by about 1.28% of pay. A full description of the assumption changes and the impact of each assumption change on the cost for each group and for the Plan as a whole can be found in the Experience Study Report.
Contribution Volatility Table I-3 below shows the ratio of assets to active member payroll for SJCERA.
The table above shows SJCERA’s assets as a percentage of projected active member payroll. This ratio indicates the sensitivity of the Plan to the returns earned on plan assets. We note in the table that plan assets currently are almost six times covered payroll for the Plan; as funding improves and the Plan reaches 100% funding, the ratio of asset to payroll will increase to over nine times payroll, perhaps higher depending on the Plan’s future demographic makeup. To appreciate the impact of the ratio of assets to payroll on plan cost, consider the situation for a new plan with almost no assets. Even if the assets suffer a bad year of investment returns, the impact on the plan cost is nil, because the assets are so small. On the other hand, consider the situation for SJCERA. Suppose SJCERA’s assets lose 10% of their value in a year. Since they are assumed to earn 7.40%, there is an actuarial loss of 17.40% of plan assets. Based on the current ratio of assets to payroll (583%), that means the loss in assets is about 101% of active payroll (583% of the 17.40% loss). There is only one source of funding to make up for this loss: additional contributions. Consequently, barring future offsetting investment gains or additional contributions by the members, the employer has to make up the asset loss in future contributions. In this example of a one-year loss of 10%, this shortfall will eventually require an additional amortization payment in the vicinity of 9.2% of payroll if amortized over 15 years.
Furthermore, consider the impact of a one-year asset loss of 10% if the Plan is 100% funded. Based on the ratio of asset to payroll at 100% funding (969%), the asset loss would be about
Projected Active Member Payroll 413,551,615 Assets (Market Value Net of Non-Valuation Reserves) 2,409,598,040 Ratio of Assets to Payroll 5.83 Ratio with 100% Funding 9.69
TABLE I-3Asset to Payroll Ratio as of December 31, 2015
SAN JOAQUIN COUNTY EMPLOYEES’ RETIREMENT ASSOCIATION ACTUARIAL VALUATION REPORT AS OF JANUARY 1, 2016
SECTION I – EXECUTIVE SUMMARY
7
169% of active payroll (969% of the 17.40% loss). Again, there is only one source of funding to make up for this loss: the employers. In this example, the shortfall could require an additional amortization payment of approximately 15.2% of payroll, amortized over 15 years.
Finally, we note that the ratio of both assets and liabilities to payroll, and therefore the sensitivity to investment returns, is higher for the Safety membership compared to the General members, because of the higher benefit amounts and the earlier average retirement ages for Safety. The current ratio of assets to payroll is 506% for the General members and 977% for Safety members. The 10% loss described above would translate to a loss of 88% of General pay and 170% of Safety pay, which would require amortization payment increases of 7.9% and 15.3% of General and Safety pay, respectively. Therefore the contribution rates (expressed as a percentage of payroll) for the Safety members will generally be about twice as volatile as those of the General members.
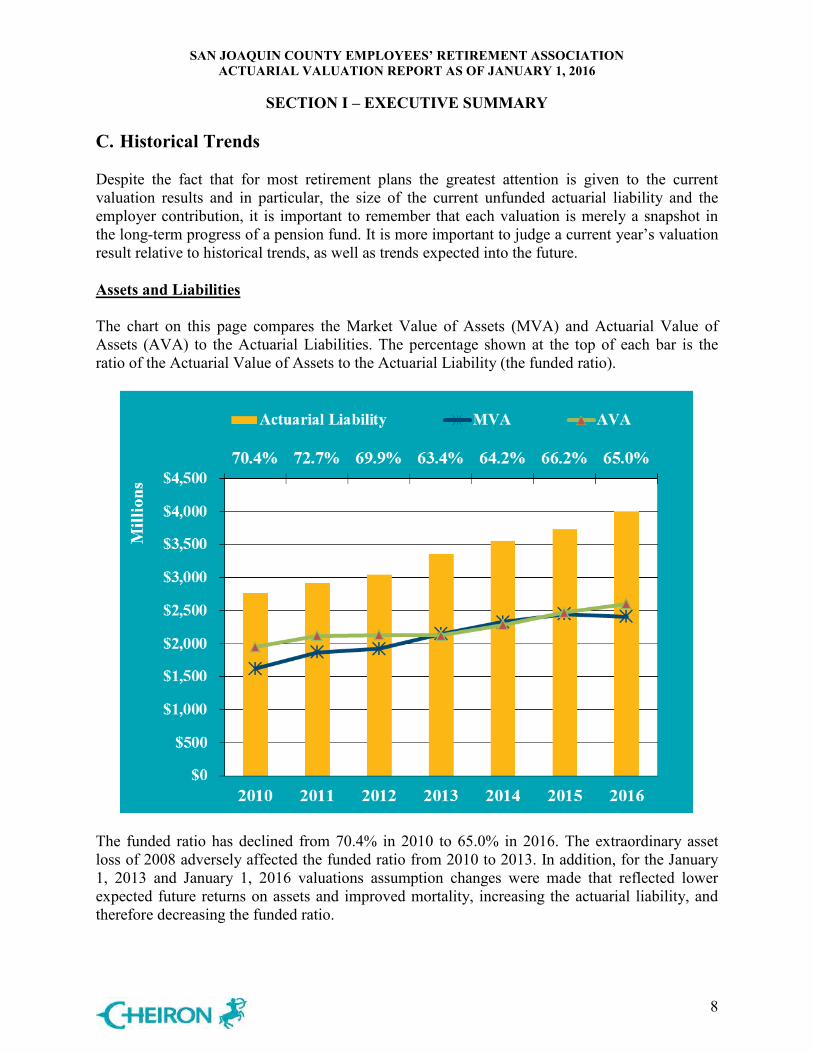
SAN JOAQUIN COUNTY EMPLOYEES’ RETIREMENT ASSOCIATION ACTUARIAL VALUATION REPORT AS OF JANUARY 1, 2016
SECTION I – EXECUTIVE SUMMARY
8
C. Historical Trends
Despite the fact that for most retirement plans the greatest attention is given to the current valuation results and in particular, the size of the current unfunded actuarial liability and the employer contribution, it is important to remember that each valuation is merely a snapshot in the long-term progress of a pension fund. It is more important to judge a current year’s valuation result relative to historical trends, as well as trends expected into the future. Assets and Liabilities The chart on this page compares the Market Value of Assets (MVA) and Actuarial Value of Assets (AVA) to the Actuarial Liabilities. The percentage shown at the top of each bar is the ratio of the Actuarial Value of Assets to the Actuarial Liability (the funded ratio).
The funded ratio has declined from 70.4% in 2010 to 65.0% in 2016. The extraordinary asset loss of 2008 adversely affected the funded ratio from 2010 to 2013. In addition, for the January 1, 2013 and January 1, 2016 valuations assumption changes were made that reflected lower expected future returns on assets and improved mortality, increasing the actuarial liability, and therefore decreasing the funded ratio.

SAN JOAQUIN COUNTY EMPLOYEES’ RETIREMENT ASSOCIATION ACTUARIAL VALUATION REPORT AS OF JANUARY 1, 2016
SECTION I – EXECUTIVE SUMMARY
9
Participant Trends
The chart above provides a measure for the maturity in the Plan by comparing the ratio of active members to inactive members (retirees and deferred vested participants). These ratios are given at the top of each bar. As the Plan matures, this ratio is expected to decrease as more employees leave the active workforce and receive benefits. The increase in inactive liabilities relative to active liabilities may result in a larger burden on the employers should assets perform poorly. The active-to-inactive ratio has decreased significantly from 2008 to 2013, but increased slightly in 2014, indicating an influx of new members to the Plan. Cash Flows The chart on the next page shows the Plan’s cash flow (contributions less benefit payments and administrative expenses). This is a critical measure, as it reflects the ability to have funds available to meet benefit payments without having to make difficult investment decisions, especially during volatile markets.
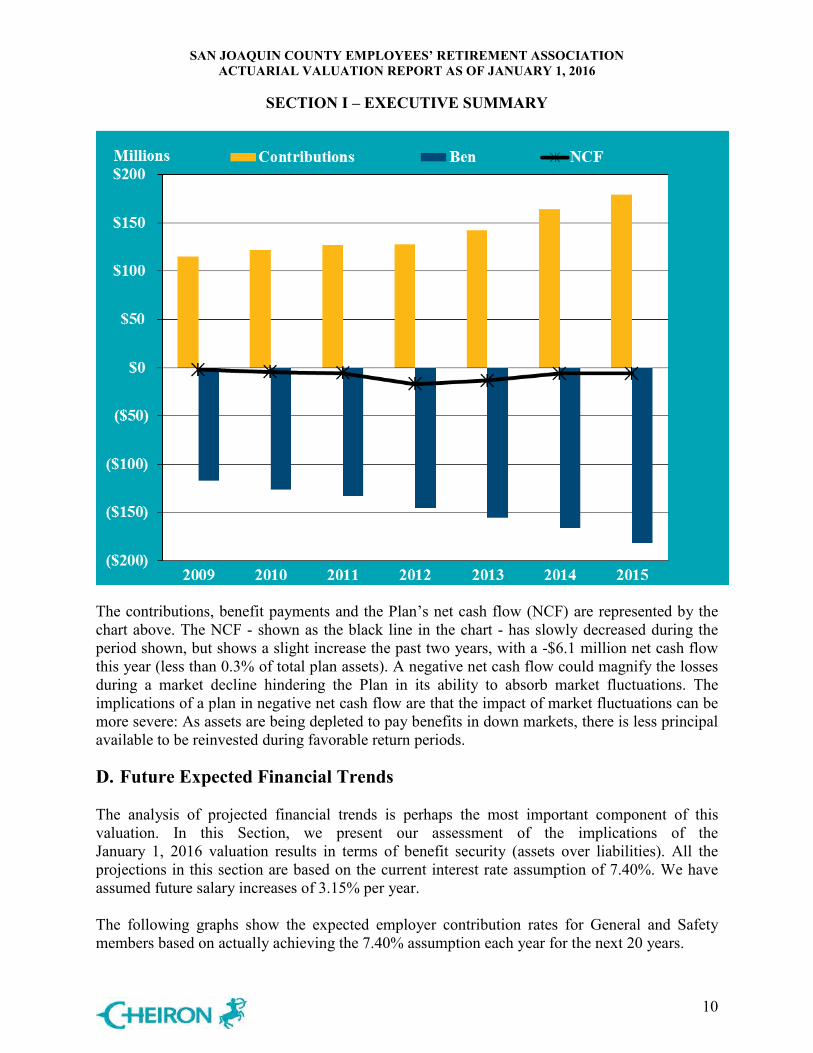
SAN JOAQUIN COUNTY EMPLOYEES’ RETIREMENT ASSOCIATION ACTUARIAL VALUATION REPORT AS OF JANUARY 1, 2016
SECTION I – EXECUTIVE SUMMARY
10
The contributions, benefit payments and the Plan’s net cash flow (NCF) are represented by the chart above. The NCF - shown as the black line in the chart - has slowly decreased during the period shown, but shows a slight increase the past two years, with a -$6.1 million net cash flow this year (less than 0.3% of total plan assets). A negative net cash flow could magnify the losses during a market decline hindering the Plan in its ability to absorb market fluctuations. The implications of a plan in negative net cash flow are that the impact of market fluctuations can be more severe: As assets are being depleted to pay benefits in down markets, there is less principal available to be reinvested during favorable return periods. D. Future Expected Financial Trends The analysis of projected financial trends is perhaps the most important component of this valuation. In this Section, we present our assessment of the implications of the January 1, 2016 valuation results in terms of benefit security (assets over liabilities). All the projections in this section are based on the current interest rate assumption of 7.40%. We have assumed future salary increases of 3.15% per year. The following graphs show the expected employer contribution rates for General and Safety members based on actually achieving the 7.40% assumption each year for the next 20 years.
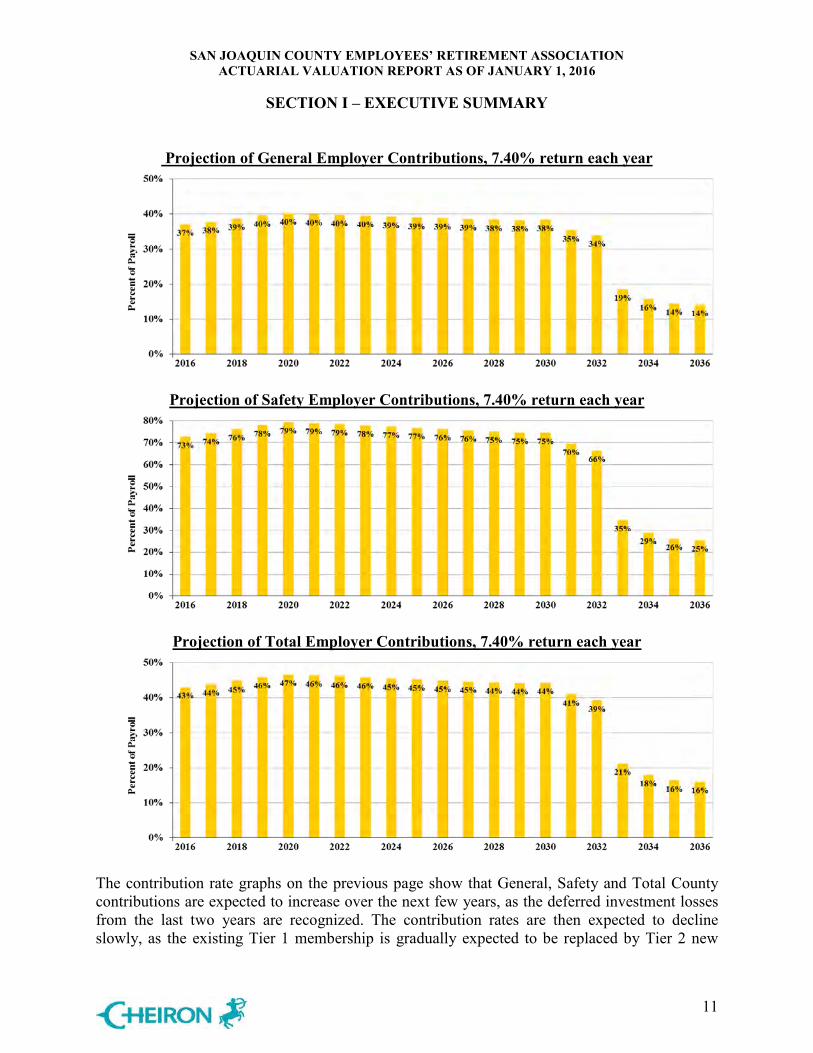
SAN JOAQUIN COUNTY EMPLOYEES’ RETIREMENT ASSOCIATION ACTUARIAL VALUATION REPORT AS OF JANUARY 1, 2016
SECTION I – EXECUTIVE SUMMARY
11
Projection of General Employer Contributions, 7.40% return each year
Projection of Safety Employer Contributions, 7.40% return each year
Projection of Total Employer Contributions, 7.40% return each year
The contribution rate graphs on the previous page show that General, Safety and Total County contributions are expected to increase over the next few years, as the deferred investment losses from the last two years are recognized. The contribution rates are then expected to decline slowly, as the existing Tier 1 membership is gradually expected to be replaced by Tier 2 new

SAN JOAQUIN COUNTY EMPLOYEES’ RETIREMENT ASSOCIATION ACTUARIAL VALUATION REPORT AS OF JANUARY 1, 2016
SECTION I – EXECUTIVE SUMMARY
12
hires. The dollar contribution will be approximately $123 million for General and $46 million for Safety in 2016, growing to around $163 million for General and $63 million for Safety in five years. Note that the graphs above do not forecast any actuarial gains or losses. Even relatively modest losses relative to the 7.4% assumed return could push the employer contribution rates even higher in the next few years. Asset and Liability Projections: The graph below shows the projection of SJCERA’s assets and liabilities assuming that assets will earn the 7.40% assumption each year during the projection period.
Projection of Assets and Liabilities, 7.40% return each year
The graph shows that the projected funded status increases over the next 19 years to 100%, assuming the actuarial assumption is achieved. However, as above, it is the actual return on System assets that will determine the future funding status and contribution rate to the Fund.

SAN JOAQUIN COUNTY EMPLOYEES’ RETIREMENT ASSOCIATION ACTUARIAL VALUATION REPORT AS OF JANUARY 1, 2016
SECTION II – ASSETS
13
Pension Plan assets play a key role in the financial operation of the System and in the decisions the Board may make with respect to future deployment of those assets. The level of assets, the allocation of assets among asset classes, and the methodology used to measure assets will likely impact benefit levels, employer contributions, and the ultimate security of participants’ benefits. In this section, we present detailed information on System assets including:
• Disclosure of System assets as of December 31, 2014 and December 31, 2015, • Statement of the changes in market values during the year, • Development of the Actuarial Value of Assets, • An assessment of investment performance, and • Determination of reserve balances as of January 1, 2016.
Disclosure
There are two types of asset values disclosed in the valuation, the market value of assets and the actuarial value of assets. The market value represents the fair value of assets that provide the principal basis for measuring financial performance from one year to the next. Market values, however, can fluctuate widely with corresponding swings in the marketplace. As a result, market values are usually not as suitable for long-range planning as are the actuarial value of assets, which reflect smoothing of annual investment returns. Table II-1 on the next page discloses and compares the market values as of December 31, 2014 and December 31, 2015.

SAN JOAQUIN COUNTY EMPLOYEES’ RETIREMENT ASSOCIATION ACTUARIAL VALUATION REPORT AS OF JANUARY 1, 2016
SECTION II – ASSETS
14
2014 2015Cash and Cash Equivalents $ 86,304,586 $ 79,806,039 Cash Collateral-Securities Lending 164,195,271 147,105,961 Total Cash and Cash Equivalents 250,499,857 226,912,000
Receivables:Investment Income Receivables 2,664,983 3,103,370 Contributions Receivable 8,960,303 3,041,118 Securities Sold, Not Received - Domestic 420,303 2,720,987 Other Investment Income Receivable 637 1,142 Miscellaneous Receivables 34,606 63,074 Total Receivables 12,080,832 8,929,691
Investments, at Market Value:Fixed Income 527,386,250 534,574,588 U.S. and Non U.S. Equities 891,844,719 825,704,397 Global Equity 57,668,488 0 Real Estate 253,709,478 265,514,852 Real Asset 108,824,107 702,471,159 Global Opportunistic Strategy 278,197,288 0 Risk Parity 253,749,953 0 Total Investments 2,371,380,283 2,328,264,996
Other Assets:Prepaid Expenses 86,318 112,136 Equipment and Fixtures, Net 314,644 192,519
Total Assets 2,634,361,934 2,564,411,342 Liabilities:
Securities Lending-Cash Collateral 164,195,271 147,105,961 Securities Purchased, Not Paid 1,671,227 2,739,348 Accrued Expenses and Other Payables 2,137,604 1,306,553 Security Lending Interest and Other Expense 8,303 16,933
Total Liabilities 168,012,405 151,168,795 $ 2,466,349,529 $ 2,413,242,547
TABLE II-1Statement of Assets at Market Value
December 31,
Market Value of Assets
Assets
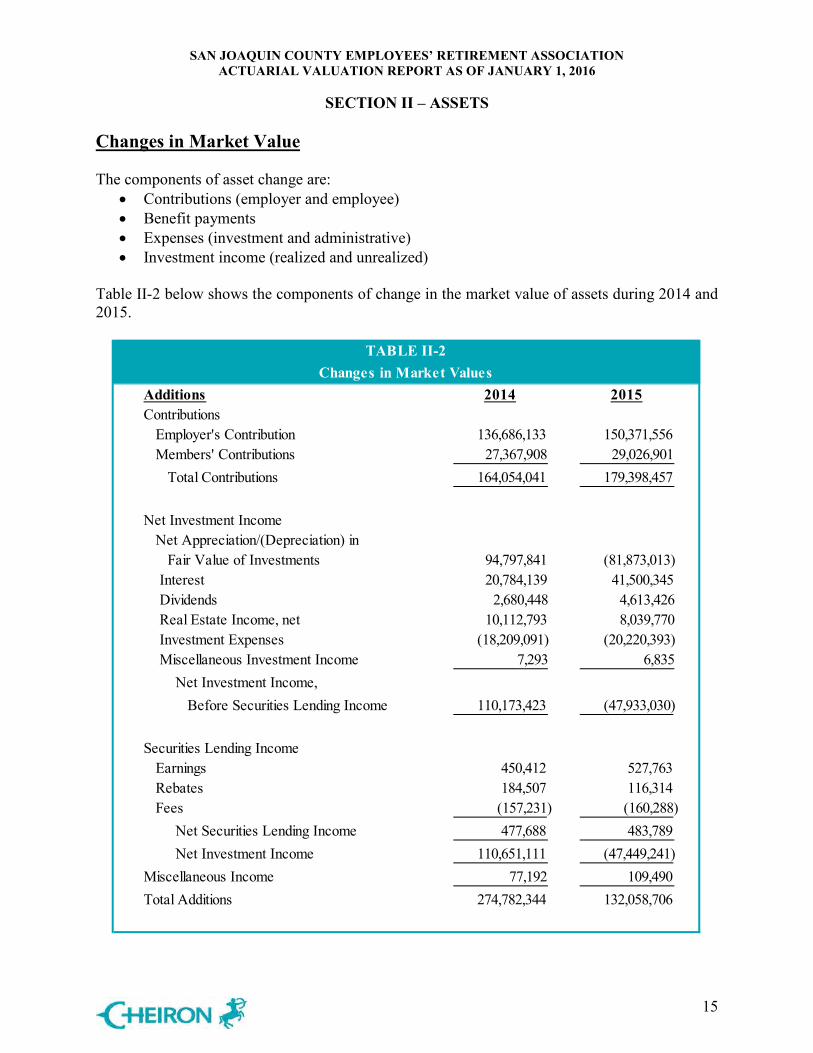
SAN JOAQUIN COUNTY EMPLOYEES’ RETIREMENT ASSOCIATION ACTUARIAL VALUATION REPORT AS OF JANUARY 1, 2016
SECTION II – ASSETS
15
Changes in Market Value The components of asset change are:
• Contributions (employer and employee) • Benefit payments • Expenses (investment and administrative) • Investment income (realized and unrealized)
Table II-2 below shows the components of change in the market value of assets during 2014 and 2015.
Additions 2014 2015Contributions Employer's Contribution 136,686,133 150,371,556 Members' Contributions 27,367,908 29,026,901 Total Contributions 164,054,041 179,398,457
Net Investment Income Net Appreciation/(Depreciation) in Fair Value of Investments 94,797,841 (81,873,013) Interest 20,784,139 41,500,345 Dividends 2,680,448 4,613,426 Real Estate Income, net 10,112,793 8,039,770 Investment Expenses (18,209,091) (20,220,393) Miscellaneous Investment Income 7,293 6,835 Net Investment Income, Before Securities Lending Income 110,173,423 (47,933,030) Securities Lending Income Earnings 450,412 527,763 Rebates 184,507 116,314 Fees (157,231) (160,288) Net Securities Lending Income 477,688 483,789 Net Investment Income 110,651,111 (47,449,241)Miscellaneous Income 77,192 109,490 Total Additions 274,782,344 132,058,706
TABLE II-2Changes in Market Values
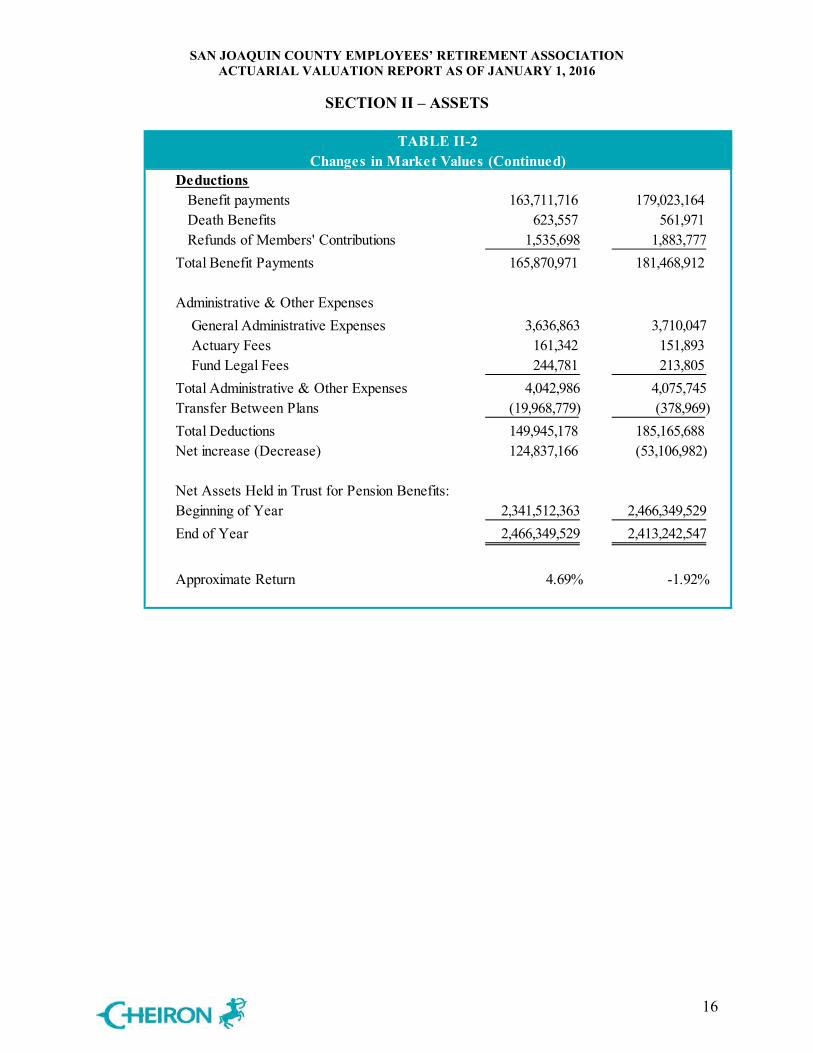
SAN JOAQUIN COUNTY EMPLOYEES’ RETIREMENT ASSOCIATION ACTUARIAL VALUATION REPORT AS OF JANUARY 1, 2016
SECTION II – ASSETS
16
Deductions Benefit payments 163,711,716 179,023,164 Death Benefits 623,557 561,971 Refunds of Members' Contributions 1,535,698 1,883,777 Total Benefit Payments 165,870,971 181,468,912
Administrative & Other Expenses General Administrative Expenses 3,636,863 3,710,047 Actuary Fees 161,342 151,893 Fund Legal Fees 244,781 213,805 Total Administrative & Other Expenses 4,042,986 4,075,745 Transfer Between Plans (19,968,779) (378,969)Total Deductions 149,945,178 185,165,688 Net increase (Decrease) 124,837,166 (53,106,982)
Net Assets Held in Trust for Pension Benefits:Beginning of Year 2,341,512,363 2,466,349,529 End of Year 2,466,349,529 2,413,242,547
Approximate Return 4.69% -1.92%
TABLE II-2Changes in Market Values (Continued)

SAN JOAQUIN COUNTY EMPLOYEES’ RETIREMENT ASSOCIATION ACTUARIAL VALUATION REPORT AS OF JANUARY 1, 2016
SECTION II – ASSETS
17
Actuarial Value of Assets (AVA) The actuarial value of assets represents a “smoothed” value developed by the actuary to reduce the volatile results, which could develop due to short-term fluctuations in the market value of assets. For this System, the actuarial value of assets is calculated by recognizing the deviation of actual investment returns compared to the expected return over a five-year period. The dollar amount of the expected return on the market value of assets is determined using the actual contributions, administrative expense (beginning in 2013), and benefit payments during the year. Any difference between this amount and the actual investment earnings is considered a gain or loss. However, in no event will the actuarial value of assets be less than 80% or more than 120% of market value on the valuation date. The following table shows the development of the actuarial asset value.
TABLE II-3 Development of Actuarial Value of Assets
as of January 1, 2016(a) (b) (c) (d) (e) (f) (g) = (f) – (e) (h) (i) = (g) x (h)
Administrative Healthcare Expected Actual Additional Not UnrecognizedYear Contributions Benefits Expense Fund Transfer Return Return Earnings Recognized Earnings2012 127,962,598 144,978,040 0 0 150,473,721 227,485,527 77,011,806 20% 15,402,361 2013 142,184,201 155,401,819 4,134,716 0 161,392,211 198,449,237 37,057,026 40% 14,822,811 2014 164,054,041 165,870,971 4,042,986 19,968,779 176,895,311 110,728,303 (66,167,008) 60% (39,700,205) 2015 179,398,457 181,468,912 4,075,745 378,969 184,778,322 (47,339,751) (232,118,073) 80% (185,694,458)
1. Total Unrecognized Dollars (195,169,491) 2. Market Value of Assets as of December 31, 2015 2,413,242,547 3. Preliminary Actuarial Value of Assets as of December 31, 2015: [(2) - (1)] 2,608,412,038 4. Corridor Limits
a. 80% of Net Market Value 1,930,594,038 b. 120% of Net Market Value 2,895,891,056
5. Actuarial Value of Assets after Corridor 2,608,412,038 6. Ratio of Actuarial Value to Market Value 108.09%
[(5) ÷ (2)]7. Market Stabilization Designation (195,169,491)
[(2) – (5)]8. Special (Non Valuation) Reserves:
Class Action Settlement – Post 4/1/1982 3,644,507Contingency 0Undistributed Earnings Reserve 0Total Special Reserves 3,644,507
9. Pension Reserves at Actuarial Value (Valuation Assets): [(5) - (8)*(6)] $2,604,472,784

SAN JOAQUIN COUNTY EMPLOYEES’ RETIREMENT ASSOCIATION ACTUARIAL VALUATION REPORT AS OF JANUARY 1, 2016
SECTION II – ASSETS
18
Investment Performance The following table calculates the investment related gain/loss for the plan year on both a Market Value and an Actuarial Value basis. The Market Value gain/loss is a useful measure for comparing the actual asset performance to the previous valuations.
Note that the return on market value shown above is not the dollar-weighted return on assets required for purposes of GASB Statements 67 and 68.
Asset Gain/(Loss)
Market Value Actuarial ValueJanuary 1, 2015 value $ 2,466,349,529 $ 2,471,291,047 County Contributions 150,371,556 150,371,556 Employee Contributions 29,026,901 29,026,901 Healthcare Transfer 378,969 378,969 Benefit Payments (181,468,912) (181,468,912)Administrative Expenses (4,075,745) (4,075,745)Expected Investment Earnings (7.50%) 184,778,322 185,148,935 Expected Value December 31, 2015 $ 2,645,360,620 $ 2,650,672,751 Investment Gain / (Loss) (232,118,073) (46,199,967) January 1, 2016 value 2,413,242,547 $ 2,604,472,784
Return -1.92% 5.63%
TABLE II-4

SAN JOAQUIN COUNTY EMPLOYEES’ RETIREMENT ASSOCIATION ACTUARIAL VALUATION REPORT AS OF JANUARY 1, 2016
SECTION II – ASSETS
19
The following table shows the historical annual asset returns on a market value and actuarial value basis, as well in the increase in the Consumer Price Index (CPI) since 1997.
TABLE II-5Historical Asset Returns
Year Ended Return on Return onDecember 31 Market Value Actuarial Value Increase in CPI1
1997 17.3% 13.9% 1.7% 1998 9.9% 13.3% 1.6% 1999 13.7% 15.1% 2.7% 2000 3.2% 11.5% 3.4% 2001 ( 0.1%) 8.8% 1.6% 2002 ( 5.5%) 4.7% 2.4% 2003 25.5% 6.8% 1.9% 2004 11.8% 6.6% 3.3% 2005 6.9% 7.2% 3.4% 2006 12.7% 9.6% 2.5% 2007 6.9% 11.2% 4.1% 2008 ( 30.1%) ( 14.3%) ( 0.5%)2009 11.4% 11.6% 2.5% 2010 12.4% 6.4% 1.5% 2011 1.3% ( 1.8%) 3.0% 2012 11.7% ( 0.2%) 1.7% 2013 9.2% 8.5% 1.5% 2014 4.7% 7.5% 0.8% 2015 ( 1.9%) 5.6% 0.7%
Compounded 15 Year Average
4.4% 5.0% 2.0%
Compounded 10 Year Average
3.0% 4.1% 1.8%
Compounded 5 Year Average
4.9% 3.8% 1.5%
1 Based on All Urban Consumers - U.S. City Average, December Indices.
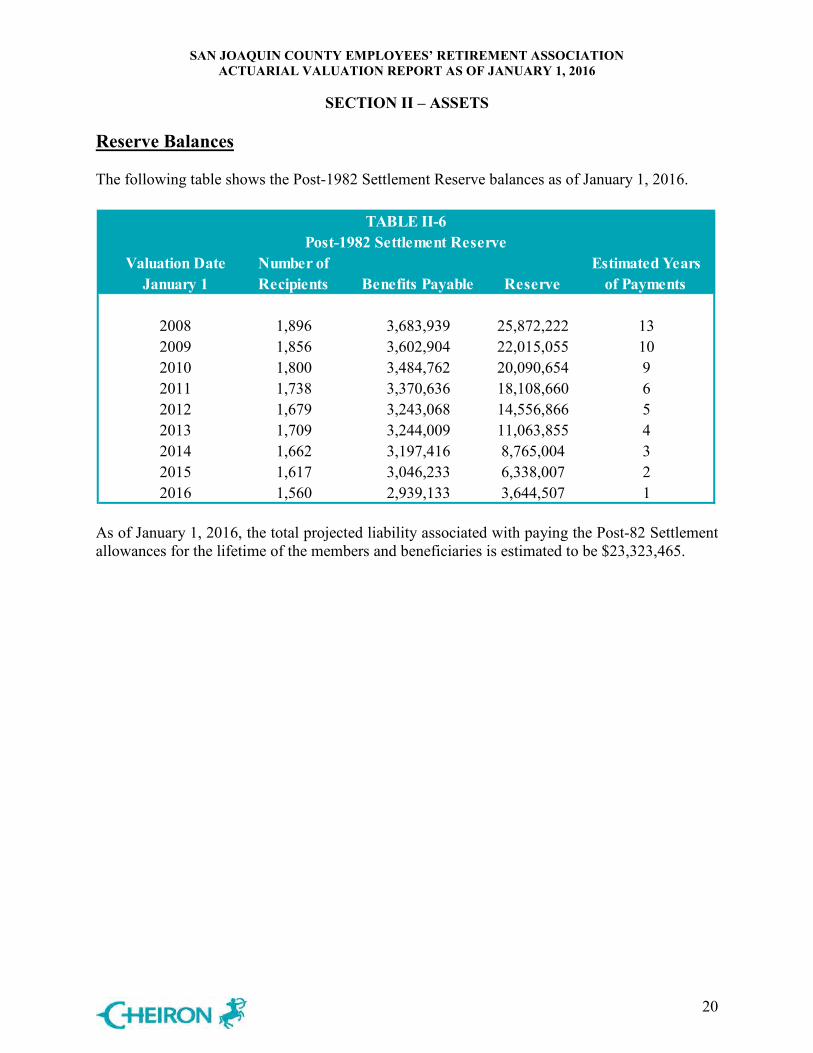
SAN JOAQUIN COUNTY EMPLOYEES’ RETIREMENT ASSOCIATION ACTUARIAL VALUATION REPORT AS OF JANUARY 1, 2016
SECTION II – ASSETS
20
Reserve Balances The following table shows the Post-1982 Settlement Reserve balances as of January 1, 2016.
As of January 1, 2016, the total projected liability associated with paying the Post-82 Settlement allowances for the lifetime of the members and beneficiaries is estimated to be $23,323,465.
Valuation Date Number of Estimated YearsJanuary 1 Recipients Benefits Payable Reserve of Payments
2008 1,896 3,683,939 25,872,222 132009 1,856 3,602,904 22,015,055 102010 1,800 3,484,762 20,090,654 92011 1,738 3,370,636 18,108,660 62012 1,679 3,243,068 14,556,866 52013 1,709 3,244,009 11,063,855 42014 1,662 3,197,416 8,765,004 32015 1,617 3,046,233 6,338,007 22016 1,560 2,939,133 3,644,507 1
TABLE II-6Post-1982 Settlement Reserve

SAN JOAQUIN COUNTY EMPLOYEES’ RETIREMENT ASSOCIATION ACTUARIAL VALUATION REPORT AS OF JANUARY 1, 2016
SECTION III – LIABILITIES
21
In this section, we present detailed information on System liabilities including:
• Disclosure of System liabilities at January 1, 2015 and January 1, 2016; • Statement of changes in these liabilities during the year.
Disclosure Several types of liabilities are calculated and presented in this report. We note that the liabilities described below are not appropriate for assessing the sufficiency of plan assets to cover the estimated cost of settling the plan’s benefit obligations, in the case of a plan termination or other similar action.
• Present Value of Future Benefits: Used for measuring all future System obligations, represents the amount of money needed today to fully fund all benefits of the System both earned as of the valuation date and those to be earned in the future by current plan participants, under the current System provisions.
• Actuarial Liability: Used for funding calculations, this liability is calculated taking the Present Value of Future Benefits and subtracting the present value of future Member Contributions and future Employer Normal Costs under an acceptable actuarial funding method. The method used for this System is called the Entry Age Normal (EAN) funding method.
• Unfunded Actuarial Liability: The excess of the Actuarial Liability over the Actuarial Value of Assets.
• Table III-1 on the following page discloses each of these liabilities for the current and prior valuations. With respect to each disclosure, a subtraction of the appropriate value of Plan assets yields, for each respective type, a net surplus, or an unfunded actuarial liability.
January 1, 2015 January 1, 2016Present Value of Future BenefitsActive Participant Benefits $ 2,269,045,331 $ 2,251,826,857 Retiree and Inactive Benefits 2,215,349,763 2,470,481,038 Present Value of Future Benefits (PVB) $ 4,484,395,094 $ 4,722,307,895
Actuarial LiabilityPresent Value of Future Benefits (PVB) $ 4,484,395,094 $ 4,722,307,895 Present Value of Future Normal Costs (PVFNC) 752,760,722 715,917,845 Actuarial Liability (AL = PVB – PVFNC) $ 3,731,634,372 $ 4,006,390,050 Actuarial Value of Assets (AVA) 2,471,291,047 2,604,472,784 Net (Surplus)/Unfunded (AL – AVA) $ 1,260,343,325 $ 1,401,917,266
TABLE III-1Liabilities/Net (Surplus)/Unfunded

SAN JOAQUIN COUNTY EMPLOYEES’ RETIREMENT ASSOCIATION ACTUARIAL VALUATION REPORT AS OF JANUARY 1, 2016
SECTION III – LIABILITIES
22
Changes in Liabilities Each of the Liabilities disclosed in the prior table are expected to change at each valuation. The components of that change, depending upon which liability is analyzed, can include:
• New hires since the last valuation • Benefits accrued since the last valuation • Plan amendments • Passage of time which adds interest to the prior liability • Benefits paid to retirees since the last valuation • Participants retiring, terminating, or dying at rates different than expected • A change in actuarial or investment assumptions • A change in the actuarial funding method
Unfunded liabilities will change because of all of the above, and due to changes in System assets resulting from:
• Employer contributions different than expected • Investment earnings different than expected • A change in the method used to measure plan assets
Actuarial Liability at January 1, 2015 $ 3,731,634,372 Actuarial Liability at January 1, 2016 $ 4,006,390,050 Liability Increase (Decrease) 274,755,678
Change due to: Accrual of Benefits $ 84,380,795 Actual Benefit Payments (181,468,912) Interest 276,297,593 Assumption Changes 91,855,247 Actuarial Liability (Gain)/Loss 3,690,955
TABLE III-2Changes in Actuarial Liability

SAN JOAQUIN COUNTY EMPLOYEES’ RETIREMENT ASSOCIATION ACTUARIAL VALUATION REPORT AS OF JANUARY 1, 2016
SECTION III – LIABILITIES
23
1. Unfunded Actuarial Liability at Start of Year (not less than zero) $ 1,260,343,325
2. Employer Normal Cost at Middle of Year 84,380,795
3. Administrative Expense 4,075,745
4. Interest on 1. 2. and 3. to End of Year 97,782,903
5. Contributions for Prior Year 179,398,457
6. Healthcare Fund Transfer 378,969
7. Interest on 5. and 6. to End of Year 6,634,245
8. Assumption Changes 91,855,247
9. Expected Unfunded Actuarial Liability at End of Year[1. + 2. + 3. + 4. – 5. – 6. + 7. + 8.] $ 1,352,026,344
10. Actual Unfunded Actuarial Liability at End of Year (not less than zero) 1,401,917,266
11. Unfunded Actuarial Liability Gain / (Loss) [9. – 10.] $ (49,890,922)
12. Actuarial Liability Gain / (Loss) $ (3,690,955)
13. Actuarial Asset Gain / (Loss) [11. – 12.] $ (46,199,967)
TABLE III-3Development of Actuarial Gain / (Loss)
SAN JOAQUIN COUNTY EMPLOYEES’ RETIREMENT ASSOCIATION ACTUARIAL VALUATION REPORT AS OF JANUARY 1, 2016
SECTION IV – CONTRIBUTIONS
24
In the process of evaluating the financial condition of any pension plan, the actuary analyzes the assets and liabilities to determine what level (if any) of contributions is needed to properly maintain the funding status of the System. Typically, the actuarial process will use a funding technique that will result in a pattern of contributions that are both stable and predictable. For this System, the actuarial funding method used to determine the normal cost and the unfunded actuarial liability is the Entry Age Normal (EAN) cost method. There are three primary components to the total contribution: the normal cost rate (employee and employer), the unfunded actuarial liability rate (UAL rate), and the administrative expense contribution. The normal cost rate is determined in the following steps. First, an individual normal cost rate is determined by taking the value, as of entry age into the System, of each member’s projected future benefits. This value is then divided by the value, also at entry age, of the member’s expected future salary producing a normal cost rate that should remain relatively constant over a member’s career. The total normal cost is adjusted with interest to the middle of the year, to reflect the fact that the normal cost contributions are paid throughout the year as member payroll payments are made. Finally, the total normal cost rate is reduced by the member contribution rate to produce the employer normal cost rate. The unfunded actuarial liability is the difference between the EAN actuarial liability and the actuarial value of assets. At the July 24, 2015 board meeting, the SJCERA Board of Retirement chose to make a change to their funding policy, opting to amortize any unexpected changes in the UAL over a period of 15 years as a level percent of pay, with new amortization layers each year. The result was a set of three amortization bases as of January 1, 2015: The 2008 loss being amortized over 24 years, the remaining UAL as of December 31, 2014 being amortized over 18 years, and new additions to the UAL on and after January 1, 2015 amortized over 15 years. The single equivalent amortization period for these streams of payments is 19 years as of January 1, 2016. The amortization period for each unfunded actuarial liability layer will decrease each year. The administrative expenses are assumed to be $4,370,908 per year, increasing with the CPI assumption each valuation. The tables on the following pages present the employer contributions for the System for this valuation.

SAN JOAQUIN COUNTY EMPLOYEES’ RETIREMENT ASSOCIATION ACTUARIAL VALUATION REPORT AS OF JANUARY 1, 2016
SECTION IV – CONTRIBUTIONS
25
% of pay % of pay1. Normal Cost at Middle of Year $ $62,252,888 16.26% $ 59,355,786 15.52%
2. Amortization of Unfunded Liability a. Actuarial Liability $ 3,914,534,803 $ 4,006,390,050 b. Actuarial Value of Assets $ 2,604,472,784 $ 2,604,472,784 c. Unfunded Liability (a) – (b) $ 1,310,062,019 $ 1,401,917,266 d. Amortization of Unfunded Liability $ 101,561,381 24.55% $ 109,836,358 26.56%
3. Administrative Expense $ 3,725,711 0.90% $ 3,752,592 0.91%
4. Annual Required Contribution $ 167,539,980 41.71% $ 172,944,736 42.99%(1c) + (2d) + (3)
TABLE IV-1Development of Employer Contribution Amount
January 1, 2016Old Assumptions New Assumptions
January 1, 2016
Old Assumptions New AssumptionsJanuary 1, 2015 January 1, 2016 January 1, 2016
Contributions as a Percentage of PayrollGross Entry Age Normal Cost Rate 23.76% 23.32% 22.45%Employee Contribution Rate 6.90% 7.06% 6.93%Employer Entry Age Normal Cost Rate 16.86% 16.26% 15.52%
Employer Normal Cost Rate 16.86% 16.26% 15.52%Administrative Expense 0.91% 0.90% 0.91%Amortization Payment 23.58% 24.55% 26.56%Employer Contribution Rate 41.35% 41.71% 42.99%
Annual Required Contribution (Employer) $ 159,501,915 $ 167,539,980 $ 172,944,736
TABLE IV-2Employer Contribution Rate

SAN JOAQUIN COUNTY EMPLOYEES’ RETIREMENT ASSOCIATION ACTUARIAL VALUATION REPORT AS OF JANUARY 1, 2016
SECTION IV – CONTRIBUTIONS
26
General Tier I General Tier II Safety Tier I Safety Tier IIJanuary 1, 2016 January 1, 2016 January 1, 2016 January 1, 2016
Contributions as a Percentage of Payroll before Assumption ChangesGross Entry Age Normal Cost Rate 21.72% 17.68% 36.67% 29.25%Employee Contribution Rate 6.32% 8.84% 7.30% 14.62%Employer Entry Age Normal Cost Rate 15.40% 8.84% 29.37% 14.63%
Employer Normal Cost Rate 15.40% 8.84% 29.37% 14.63%Administrative Expense 0.90% 0.90% 0.90% 0.90%Amortization Payment 20.84% 20.84% 43.54% 43.54%Employer Contribution Rate 37.14% 30.58% 73.81% 59.07%
Annual Required Contribution (Employer) $ 96,753,034 $ 23,060,471 $ 44,077,851 $ 3,648,624
Contributions as a Percentage of Payroll after Assumption ChangesGross Entry Age Normal Cost Rate 20.94% 17.55% 34.46% 28.43%Employee Contribution Rate 6.19% 8.77% 7.08% 14.22%Employer Entry Age Normal Cost Rate 14.75% 8.78% 27.38% 14.21%
Employer Normal Cost Rate 14.75% 8.78% 27.38% 14.21%Administrative Expense 0.91% 0.91% 0.91% 0.91%Amortization Payment 22.83% 22.83% 45.69% 45.69%Employer Contribution Rate 38.49% 32.52% 73.98% 60.81%
Annual Required Contribution (Employer) $ 100,448,688 $ 24,521,008 $ 44,216,125 $ 3,758,915
TABLE IV-3Employer Contribution Rate

SAN JOAQUIN COUNTY EMPLOYEES’ RETIREMENT ASSOCIATION ACTUARIAL VALUATION REPORT AS OF JANUARY 1, 2016
SECTION IV – CONTRIBUTIONS
27
Initial 1/1/2016 RemainingDate Initial Amortization Outstanding Amortization Amortization
Type of Base Established Amount Years Balance Years Amount
Charges/(Credits)1. 2008 Extraordinary Actuarial Loss 1/1/2009 $ 424,264,899 30 $ 462,862,439 23 $ 31,379,538 2. Remaining 1/1/2014 UAL 1/1/2014 820,499,756 19 810,906,535 17 66,964,049 3. 1/1/2015 Gain 1/1/2015 (16,438,883) 15 (16,132,782) 14 (1,532,231) 4. 1/1/2016 Loss1 1/1/2016 52,425,827 15 52,425,827 15 4,732,751 5. 1/1/2016 Assumption Changes 1/1/2016 91,855,247 15 91,855,247 15 8,292,251
$ 1,401,917,266 $ 109,836,358
1 The January 1, 2016 loss shown in Table IV-4 does not match the UAL loss shown in table III-3, as the loss in Table IV-4 includes the impact of contributions being less than expected during 2015.
TABLE IV-4
For Fiscal Year 2016Development of Amortization Payment
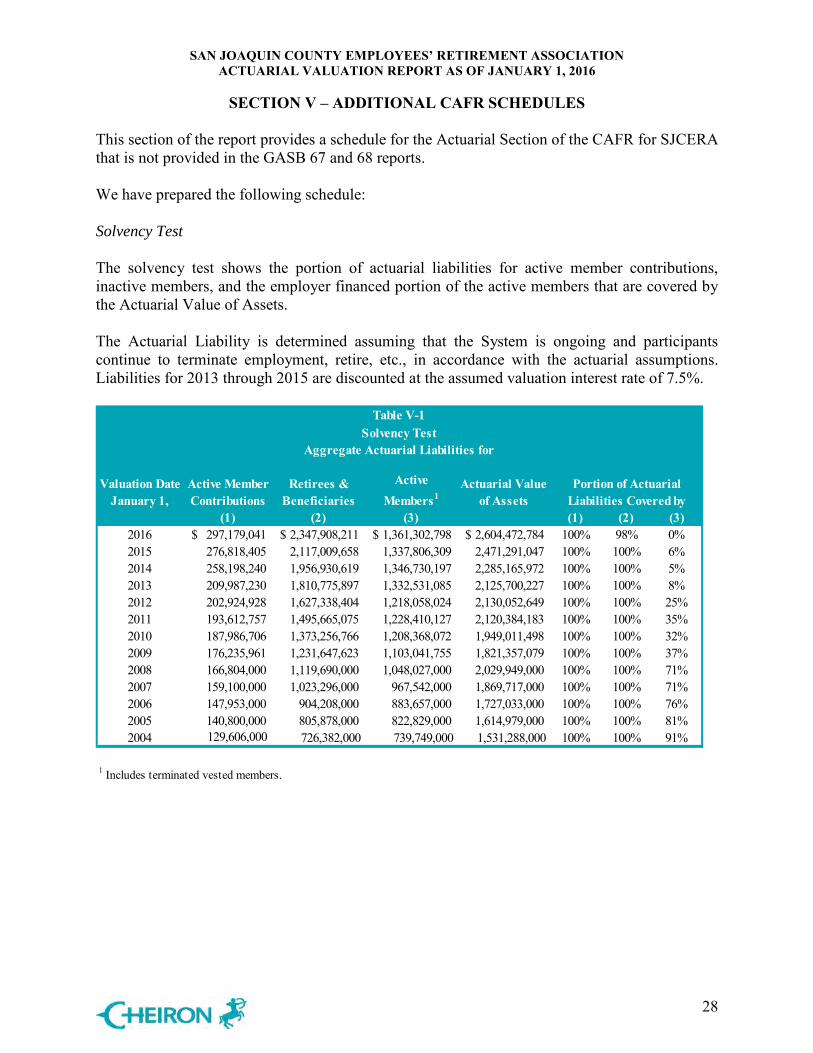
SAN JOAQUIN COUNTY EMPLOYEES’ RETIREMENT ASSOCIATION ACTUARIAL VALUATION REPORT AS OF JANUARY 1, 2016
SECTION V – ADDITIONAL CAFR SCHEDULES
28
This section of the report provides a schedule for the Actuarial Section of the CAFR for SJCERA that is not provided in the GASB 67 and 68 reports. We have prepared the following schedule: Solvency Test The solvency test shows the portion of actuarial liabilities for active member contributions, inactive members, and the employer financed portion of the active members that are covered by the Actuarial Value of Assets.
The Actuarial Liability is determined assuming that the System is ongoing and participants continue to terminate employment, retire, etc., in accordance with the actuarial assumptions. Liabilities for 2013 through 2015 are discounted at the assumed valuation interest rate of 7.5%.
Valuation DateJanuary 1,
(1) (2) (3) (1) (2) (3)2016 297,179,041$ 2,347,908,211$ 1,361,302,798$ 2,604,472,784$ 100% 98% 0%2015 276,818,405 2,117,009,658 1,337,806,309 2,471,291,047 100% 100% 6%2014 258,198,240 1,956,930,619 1,346,730,197 2,285,165,972 100% 100% 5%2013 209,987,230 1,810,775,897 1,332,531,085 2,125,700,227 100% 100% 8%2012 202,924,928 1,627,338,404 1,218,058,024 2,130,052,649 100% 100% 25%2011 193,612,757 1,495,665,075 1,228,410,127 2,120,384,183 100% 100% 35%2010 187,986,706 1,373,256,766 1,208,368,072 1,949,011,498 100% 100% 32%2009 176,235,961 1,231,647,623 1,103,041,755 1,821,357,079 100% 100% 37%2008 166,804,000 1,119,690,000 1,048,027,000 2,029,949,000 100% 100% 71%2007 159,100,000 1,023,296,000 967,542,000 1,869,717,000 100% 100% 71%2006 147,953,000 904,208,000 883,657,000 1,727,033,000 100% 100% 76%2005 140,800,000 805,878,000 822,829,000 1,614,979,000 100% 100% 81%2004 129,606,000 726,382,000 739,749,000 1,531,288,000 100% 100% 91%
1 Includes terminated vested members.
Table V-1Solvency Test
Active Member Contributions
Retirees & Beneficiaries
Active Members1
Actuarial Value of Assets
Aggregate Actuarial Liabilities for
Portion of Actuarial Liabilities Covered by

SAN JOAQUIN COUNTY EMPLOYEES’ RETIREMENT ASSOCIATION ACTUARIAL VALUATION REPORT AS OF JANUARY 1, 2016
APPENDIX A – MEMBERSHIP INFORMATION
29
The data for this valuation was provided by the San Joaquin County staff as of January 1, 2016.

SAN JOAQUIN COUNTY EMPLOYEES’ RETIREMENT ASSOCIATION ACTUARIAL VALUATION REPORT AS OF JANUARY 1, 2016
APPENDIX A – MEMBERSHIP INFORMATION
30
Summary of Participant Data as of January 1, 2016General Safety Total
Tier I Active ParticipantsNumber 3,710 699 4,409Average Age 49.39 42.75 48.34Average Benefit Service 14.04 13.74 13.99Average Vesting Service 14.31 14.20 14.30Average Pay $71,407 $86,275 $73,764
Tier II Active ParticipantsNumber 1,421 94 1,515Average Age 39.04 32.29 38.62Average Benefit Service 1.31 1.63 1.33Average Vesting Service 1.34 1.63 1.36Average Pay $53,350 $65,426 $54,100
All Active ParticipantsNumber 5,131 793 5,924Average Age 46.53 41.51 45.85Average Benefit Service 10.51 12.31 10.75Average Vesting Service 10.72 12.71 10.99Average Pay $66,407 $83,804 $68,735

SAN JOAQUIN COUNTY EMPLOYEES’ RETIREMENT ASSOCIATION ACTUARIAL VALUATION REPORT AS OF JANUARY 1, 2016
APPENDIX A – MEMBERSHIP INFORMATION
31
Summary of Participant Data as of January 1, 2016General Safety Total
Service RetiredNumber 3,506 554 4,060Average Age 70.30 65.40 69.63Average Annual Base Benefit $18,692 $39,560 $21,539Average Annual Total Benefit $31,655 $63,054 $35,940
BeneficiariesNumber 598 177 775Average Age 72.78 67.84 71.65Average Annual Base Benefit $8,038 $14,380 $9,486Average Annual Total Benefit $18,190 $32,720 $21,508
Duty DisabledNumber 234 196 430Average Age 63.52 60.41 62.10Average Annual Base Benefit $15,177 $32,553 $23,097Average Annual Total Benefit $23,854 $49,674 $35,623
Non-Duty DisabledNumber 156 14 170Average Age 63.47 66.07 63.69Average Annual Base Benefit $10,084 $13,992 $10,406Average Annual Total Benefit $15,941 $25,306 $16,712
Total Receiving BenefitsNumber 4,494 941 5,435Average Age 70.04 64.83 69.14Average Annual Base Benefit $16,792 $32,984 $19,596Average Annual Total Benefit $28,912 $54,000 $33,255
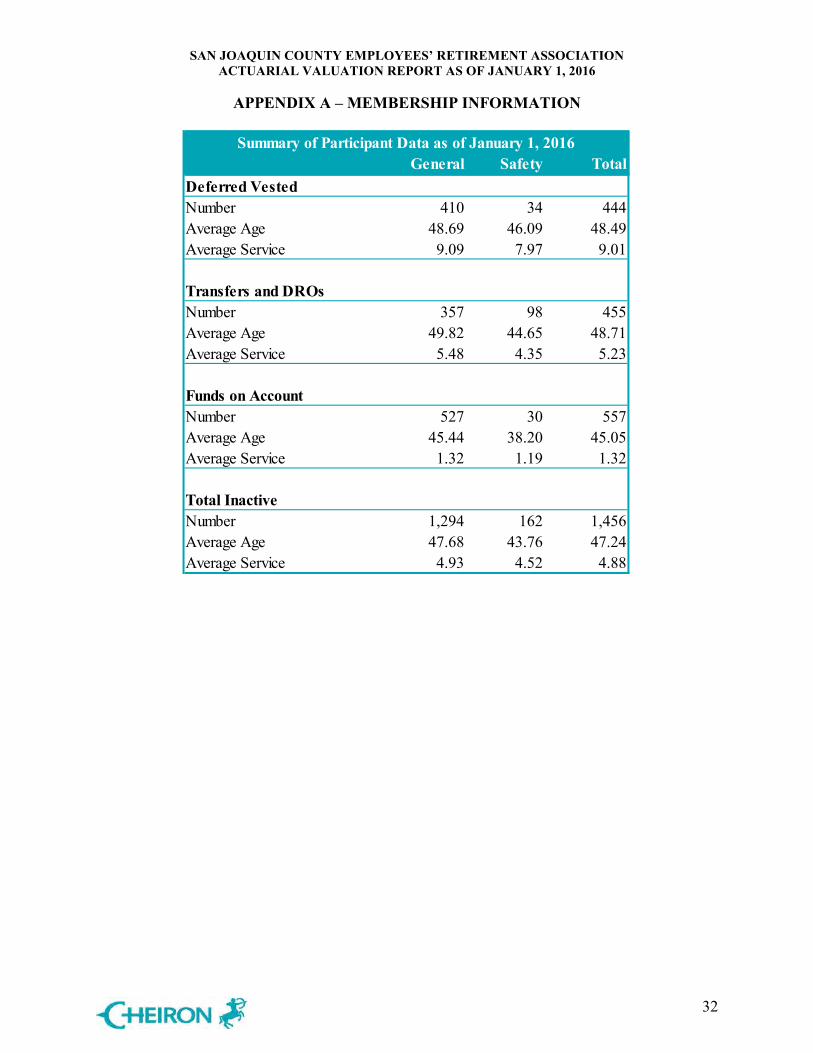
SAN JOAQUIN COUNTY EMPLOYEES’ RETIREMENT ASSOCIATION ACTUARIAL VALUATION REPORT AS OF JANUARY 1, 2016
APPENDIX A – MEMBERSHIP INFORMATION
32
Summary of Participant Data as of January 1, 2016General Safety Total
Deferred VestedNumber 410 34 444Average Age 48.69 46.09 48.49Average Service 9.09 7.97 9.01
Transfers and DROsNumber 357 98 455Average Age 49.82 44.65 48.71Average Service 5.48 4.35 5.23
Funds on AccountNumber 527 30 557Average Age 45.44 38.20 45.05Average Service 1.32 1.19 1.32
Total InactiveNumber 1,294 162 1,456Average Age 47.68 43.76 47.24Average Service 4.93 4.52 4.88

SAN JOAQUIN COUNTY EMPLOYEES’ RETIREMENT ASSOCIATION ACTUARIAL VALUATION REPORT AS OF JANUARY 1, 2016
APPENDIX A – MEMBERSHIP INFORMATION
33
Changes in Plan Membership: General
Actives Transfers/ DROS
Non-Vested Terminations
Vested Terminations
Non-Duty Disabled
Duty Disabled
Retired Beneficiaries Total
January 1, 2015 4,879 387 507 381 161 232 3,385 580 10,512New Entrants 692 0 0 0 0 0 0 0 692Rehires 46 (4) (6) (9) 0 0 (5) 0 22Duty Disabilities (3) 0 0 0 0 3 0 0 0Non-Duty Disabilities (3) 0 0 (1) 4 0 0 0 0Retirements (171) (20) 0 (26) 0 0 214 3 0Vested Terminations (73) 0 0 73 0 0 0 0 0Retirements from Safety with General Service
0 0 0 1 1 1 5 0 8
Died, With Beneficiaries' Benefit Payable (4) 0 0 0 (5) (2) (26) 37 0
Died, Without Beneficiary, and Other Terminations (53) 0 52 (1) (7) (3) (60) (1) (73)
Transfers (9) 1 0 0 0 0 0 0 (8)Redeposits – AB 2766 0 0 0 0 0 0 0 0 0Withdrawals Paid (170) (12) (26) (8) 0 0 0 0 (216)Beneficiary Deaths 0 0 0 0 0 0 0 (26) (26)Domestic Relations Orders 0 5 0 0 0 0 0 3 8Data Corrections 0 0 0 0 2 3 (7) 2 0January 1, 2016 5,131 357 527 410 156 234 3,506 598 10,919

SAN JOAQUIN COUNTY EMPLOYEES’ RETIREMENT ASSOCIATION ACTUARIAL VALUATION REPORT AS OF JANUARY 1, 2016
APPENDIX A – MEMBERSHIP INFORMATION
34
Changes in Plan Membership: Safety
Actives Transfers/ DROS
Non-Vested Terminations
Vested Terminations
Non-Duty Disabled
Duty Disabled
Retired Beneficiaries Total
January 1, 2015 827 103 29 28 13 192 524 162 1,878New Entrants 24 0 0 0 0 0 0 0 24Rehires 0 0 0 0 0 0 0 0 0Duty Disabilities (3) 0 0 0 0 3 0 0 0Non-Duty Disabilities (1) 0 0 0 1 0 0 0 0Retirements (45) (4) 0 (2) 0 0 50 1 0Vested Terminations (8) 0 0 8 0 0 0 0 0Retirements from Safety with General Service
0 0 0 0 0 0 0 0 0
Died, With Beneficiaries' Benefit Payable 0 0 0 0 0 0 (12) 12 0
Died, Without Beneficiary, and Other Terminations (4) 0 2 0 0 (1) (3) 0 (6)
Transfers 8 0 0 0 0 0 0 0 8Redeposits – AB 2766 0 0 0 0 0 0 0 0 0Withdrawals Paid (5) (2) 0 (1) 0 0 0 0 (8)Beneficiary Deaths 0 0 0 0 0 0 0 (3) (3)Domestic Relations Orders 0 2 0 0 0 0 0 2 4Data Corrections 0 (1) (1) 1 0 2 (5) 3 (1)January 1, 2016 793 98 30 34 14 196 554 177 1,896
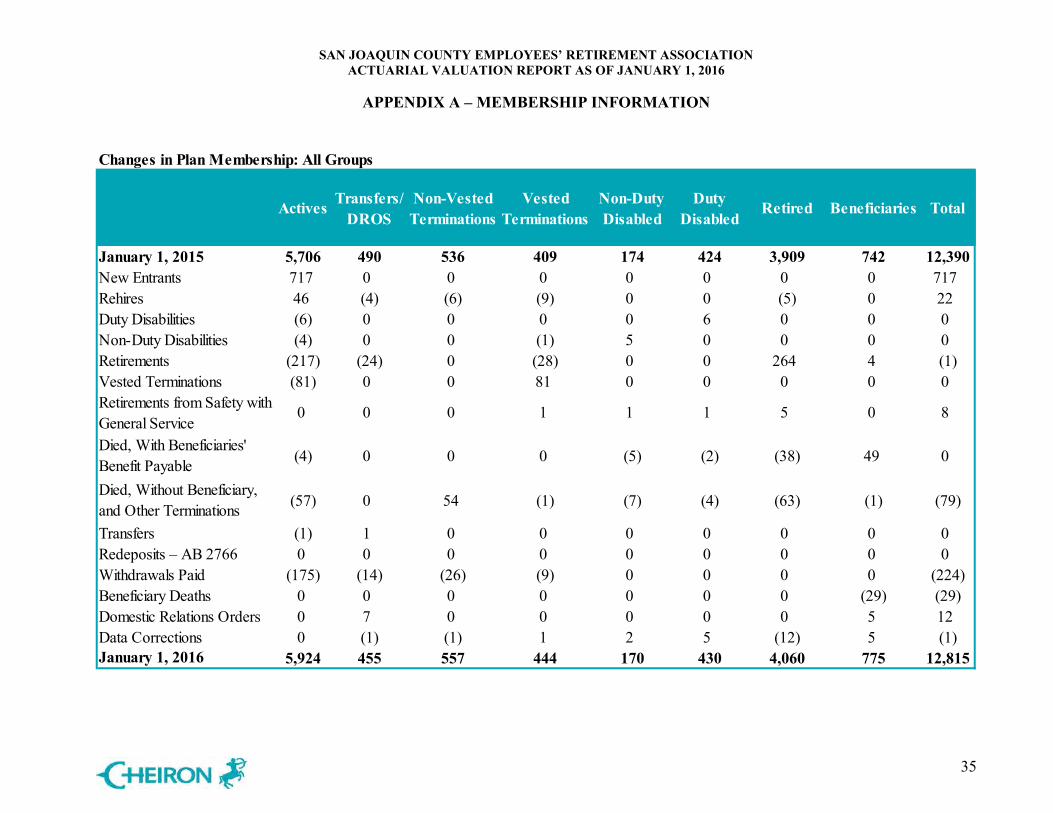
SAN JOAQUIN COUNTY EMPLOYEES’ RETIREMENT ASSOCIATION ACTUARIAL VALUATION REPORT AS OF JANUARY 1, 2016
APPENDIX A – MEMBERSHIP INFORMATION
35
Changes in Plan Membership: All Groups
Actives Transfers/ DROS
Non-Vested Terminations
Vested Terminations
Non-Duty Disabled
Duty Disabled
Retired Beneficiaries Total
January 1, 2015 5,706 490 536 409 174 424 3,909 742 12,390New Entrants 717 0 0 0 0 0 0 0 717Rehires 46 (4) (6) (9) 0 0 (5) 0 22Duty Disabilities (6) 0 0 0 0 6 0 0 0Non-Duty Disabilities (4) 0 0 (1) 5 0 0 0 0Retirements (217) (24) 0 (28) 0 0 264 4 (1)Vested Terminations (81) 0 0 81 0 0 0 0 0Retirements from Safety with General Service
0 0 0 1 1 1 5 0 8
Died, With Beneficiaries' Benefit Payable (4) 0 0 0 (5) (2) (38) 49 0
Died, Without Beneficiary, and Other Terminations (57) 0 54 (1) (7) (4) (63) (1) (79)
Transfers (1) 1 0 0 0 0 0 0 0Redeposits – AB 2766 0 0 0 0 0 0 0 0 0Withdrawals Paid (175) (14) (26) (9) 0 0 0 0 (224)Beneficiary Deaths 0 0 0 0 0 0 0 (29) (29)Domestic Relations Orders 0 7 0 0 0 0 0 5 12Data Corrections 0 (1) (1) 1 2 5 (12) 5 (1)January 1, 2016 5,924 455 557 444 170 430 4,060 775 12,815
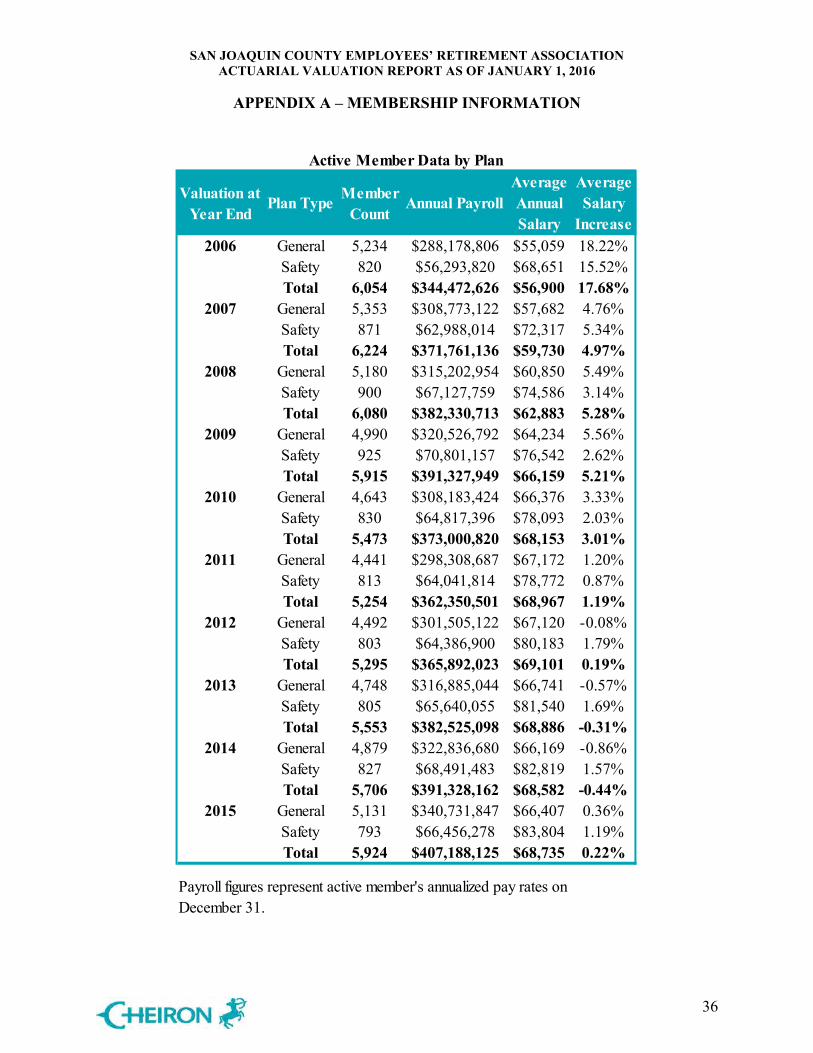
SAN JOAQUIN COUNTY EMPLOYEES’ RETIREMENT ASSOCIATION ACTUARIAL VALUATION REPORT AS OF JANUARY 1, 2016
APPENDIX A – MEMBERSHIP INFORMATION
36
Valuation at Year End
Plan Type Member Count
Annual PayrollAverage Annual Salary
Average Salary
Increase2006 General 5,234 $288,178,806 $55,059 18.22%
Safety 820 $56,293,820 $68,651 15.52%Total 6,054 $344,472,626 $56,900 17.68%
2007 General 5,353 $308,773,122 $57,682 4.76%Safety 871 $62,988,014 $72,317 5.34%Total 6,224 $371,761,136 $59,730 4.97%
2008 General 5,180 $315,202,954 $60,850 5.49%Safety 900 $67,127,759 $74,586 3.14%Total 6,080 $382,330,713 $62,883 5.28%
2009 General 4,990 $320,526,792 $64,234 5.56%Safety 925 $70,801,157 $76,542 2.62%Total 5,915 $391,327,949 $66,159 5.21%
2010 General 4,643 $308,183,424 $66,376 3.33%Safety 830 $64,817,396 $78,093 2.03%Total 5,473 $373,000,820 $68,153 3.01%
2011 General 4,441 $298,308,687 $67,172 1.20%Safety 813 $64,041,814 $78,772 0.87%Total 5,254 $362,350,501 $68,967 1.19%
2012 General 4,492 $301,505,122 $67,120 -0.08%Safety 803 $64,386,900 $80,183 1.79%Total 5,295 $365,892,023 $69,101 0.19%
2013 General 4,748 $316,885,044 $66,741 -0.57%Safety 805 $65,640,055 $81,540 1.69%Total 5,553 $382,525,098 $68,886 -0.31%
2014 General 4,879 $322,836,680 $66,169 -0.86%Safety 827 $68,491,483 $82,819 1.57%Total 5,706 $391,328,162 $68,582 -0.44%
2015 General 5,131 $340,731,847 $66,407 0.36%Safety 793 $66,456,278 $83,804 1.19%Total 5,924 $407,188,125 $68,735 0.22%
Active Member Data by Plan
Payroll figures represent active member's annualized pay rates on December 31.

SAN JOAQUIN COUNTY EMPLOYEES’ RETIREMENT ASSOCIATION ACTUARIAL VALUATION REPORT AS OF JANUARY 1, 2016
APPENDIX A – MEMBERSHIP INFORMATION
37
Schedule of Retirees and Beneficiaries Valuation Data
Valuation at Year End
Plan Type Member Retirements
Beneficiary Continuance
Members and Beneficiaries
Removed
Total Retirees on Payroll
Annual Retirement
Payroll
Average Annual
Allowance
Average Allowance Increase
2006 General 190 41 102 3,107 $58,634,478 $18,872 3.96%Safety 31 8 11 632 $25,003,422 $39,562 2.14%Total 221 49 113 3,739 $83,637,900 $22,369 3.45%
2007 General 199 31 99 3,238 $65,213,731 $20,140 6.72%Safety 38 6 8 668 $27,396,329 $41,012 3.67%Total 237 37 107 3,906 $92,610,060 $23,710 5.99%
2008 General 203 30 83 3,388 $71,488,335 $21,100 4.77%Safety 50 10 18 710 $30,575,540 $43,064 5.00%Total 253 40 101 4,098 $102,063,875 $24,906 5.04%
2009 General 207 31 104 3,522 $78,988,070 $22,427 6.29%Safety 24 7 11 730 $32,575,964 $44,625 3.62%Total 231 38 115 4,252 $111,564,034 $26,238 5.35%
2010 General 242 35 102 3,697 $85,931,078 $23,243 3.64%Safety 65 5 8 792 $36,354,738 $45,902 2.86%Total 307 40 110 4,489 $122,285,816 $27,241 3.82%
2011 General 240 42 108 3,871 $92,938,361 $24,009 3.30%Safety 32 4 14 814 $38,098,866 $46,805 1.97%Total 272 46 122 4,685 $131,037,227 $27,970 2.68%
2012 General 278 27 135 4,041 $102,025,575 $25,248 5.16%Safety 52 12 20 856 $42,008,598 $49,075 4.85%Total 330 39 155 4,897 $144,034,172 $29,413 5.16%
2013 General 213 52 134 4,172 $109,869,721 $26,335 4.31%Safety 22 11 20 869 $43,548,028 $50,113 2.11%Total 235 63 154 5,041 $153,411,632 $30,433 3.47%
2014 General 247 51 112 4,358 $120,722,240 $27,701 5.19%Safety 29 14 21 891 $45,889,472 $51,503 2.77%Total 276 65 133 5,249 $166,611,711 $31,742 4.30%
2015 General 228 45 136 4,494 $129,928,957 $28,912 4.37%Safety 54 15 19 941 $50,813,875 $54,000 4.85%Total 282 60 155 5,435 $180,742,832 $33,255 4.77%
Payroll figures represent year end monthly retirement benefits annualized and exclude Post-Employment Healthcare benefit and benefits under the Class Action Settlement.

SAN JOAQUIN COUNTY EMPLOYEES’ RETIREMENT ASSOCIATION ACTUARIAL VALUATION REPORT AS OF JANUARY 1, 2016
APPENDIX A – MEMBERSHIP INFORMATION
38
Retirees and Beneficiaries Added to and Removed from Retiree Payroll
Fiscal Year
Beginning of Year
Added During Year
Allowances Added
(in 000s)1
Removed During Year
Allowances Removed
End of Year
Annual Retirement
Payroll (in 000s)
Average Allowance
Percentage Increase
Average Annual
Allowance
2010 4,252 353 $12,918 116 $2,196 4,489 $122,286 3.82% $27,2412011 4,489 318 $11,544 122 $2,793 4,685 $131,037 2.67% $27,9692012 4,685 361 $16,400 149 $3,403 4,897 $144,034 5.16% $29,4132013 4,897 297 $12,908 153 $3,530 5,041 $153,412 3.47% $30,4332014 5,041 340 $12,522 132 $3,030 5,249 $166,612 4.30% $31,7422015 5,249 341 $13,207 155 $3,651 5,435 $180,737 4.77% $33,255
1 Includes COLA amounts not included in previous year’s Annual Allowance totals.

SAN JOAQUIN COUNTY EMPLOYEES’ RETIREMENT ASSOCIATION ACTUARIAL VALUATION REPORT AS OF JANUARY 1, 2016
APPENDIX A – MEMBERSHIP INFORMATION
39
Schedule of Average Monthly Benefit PaymentsNumber of Years of Service Credit
Retirement Effective Date 0-4 5-9 10-14 15-19 20-24 25-29 30 & Over1/2/11 to 1/1/12RetireesGeneral MembersAverage Benefits $470 $1,205 $1,464 $2,615 $3,302 $3,968 $4,670 Average Final Compensation $5,518 $5,903 $4,928 $6,463 $6,110 $5,541 $5,570 Count 12 26 56 27 41 16 39Safety MembersAverage Benefits $922 $1,112 $2,551 $3,970 $7,499 $7,790 $10,586 Average Final Compensation $9,746 $4,483 $5,290 $7,767 $10,430 $9,162 $10,797 Count 2 6 3 3 4 5 3Survivors/QDROsGeneral MembersAverage Benefits $622 $890 $773 $1,367 $1,838 $2,039 $3,281 Average Final Compensation $9,807 $4,816 $3,578 $4,371 $4,108 $3,364 $5,366 Count 5 9 11 10 5 5 5Safety MembersAverage Benefits $825 $859 $1,591 $3,334 $0 $0 $3,829 Average Final Compensation $9,779 $4,960 $2,795 $9,010 $0 $0 $5,257 Count 1 1 2 1 0 0 11/2/12 to 1/1/13RetireesGeneral MembersAverage Benefits $517 $1,077 $1,481 $2,129 $2,729 $4,198 $6,317 Average Final Compensation $7,532 $5,925 $5,233 $4,900 $5,338 $6,449 $7,295 Count 19 31 56 36 42 30 44Safety MembersAverage Benefits $429 $2,194 $3,026 $4,186 $5,302 $9,183 $13,206 Average Final Compensation $6,793 $5,812 $6,636 $8,124 $7,306 $13,360 $13,606 Count 4 5 7 3 14 11 5Survivors/QDROsGeneral MembersAverage Benefits $331 $1,189 $1,017 $1,525 $1,274 $3,105 $2,783 Average Final Compensation $4,482 $3,558 $2,664 $2,604 $3,639 $4,794 $3,940 Count 4 4 8 3 1 2 4Safety MembersAverage Benefits $0 $1,039 $2,423 $3,450 $3,573 $3,206 $4,887 Average Final Compensation $0 $6,972 $7,561 $1,358 $1,776 $3,836 $6,169 Count 0 2 2 2 1 3 2

SAN JOAQUIN COUNTY EMPLOYEES’ RETIREMENT ASSOCIATION ACTUARIAL VALUATION REPORT AS OF JANUARY 1, 2016
APPENDIX A – MEMBERSHIP INFORMATION
40
Schedule of Average Monthly Benefit PaymentsNumber of Years of Service Credit
Retirement Effective Date 0-4 5-9 10-14 15-19 20-24 25-29 30 & Over1/2/13 to 1/1/14RetireesGeneral MembersAverage Benefits $433 $1,410 $1,589 $2,556 $3,149 $4,241 $5,837 Average Final Compensation $7,695 $7,279 $5,787 $6,125 $6,132 $6,467 $6,718 Count 10 25 40 35 35 26 29Safety MembersAverage Benefits $1,165 $1,435 $2,621 $3,501 $4,260 $11,134 $9,279 Average Final Compensation $9,478 $7,434 $6,316 $7,044 $5,599 $13,945 $9,670 Count 3 2 7 4 1 2 2Survivors/QDROsGeneral MembersAverage Benefits $687 $1,000 $883 $1,182 $2,063 $1,572 $2,985 Average Final Compensation $3,804 $4,531 $3,953 $3,163 $3,722 $1,821 $3,681 Count 6 9 15 7 5 2 5Safety MembersAverage Benefits $650 $3,101 $1,385 $2,012 $1,918 $3,745 $4,936 Average Final Compensation $4,955 $10,868 $2,506 $3,966 $2,525 $6,184 $5,381 Count 3 1 2 1 2 1 11/2/14 to 1/1/15RetireesGeneral MembersAverage Benefits $618 $1,120 $1,601 $2,635 $4,409 $4,672 $6,283 Average Final Compensation $9,300 $6,612 $5,529 $6,454 $8,122 $6,944 $7,635 Count 9 25 49 46 23 45 41Safety MembersAverage Benefits $380 $1,190 $3,433 $4,546 $3,993 $7,412 $11,302 Average Final Compensation $8,910 $6,591 $7,642 $8,863 $6,031 $9,013 $11,761 Count 1 1 3 5 4 6 1Survivors/QDROsGeneral MembersAverage Benefits $475 $654 $1,087 $814 $2,160 $1,680 $2,941 Average Final Compensation $5,928 $4,152 $2,879 $2,457 $4,998 $3,887 $8,068 Count 11 6 11 6 5 3 5Safety MembersAverage Benefits $2,030 $2,464 $2,890 $3,326 $2,002 $3,569 $3,499 Average Final Compensation $9,251 $8,581 $5,515 $4,817 $4,850 $5,955 $2,018 Count 2 3 4 1 1 1 2

SAN JOAQUIN COUNTY EMPLOYEES’ RETIREMENT ASSOCIATION ACTUARIAL VALUATION REPORT AS OF JANUARY 1, 2016
APPENDIX A – MEMBERSHIP INFORMATION
41
Schedule of Average Monthly Benefit PaymentsNumber of Years of Service Credit
Retirement Effective Date 0-4 5-9 10-14 15-19 20-24 25-29 30 & Over1/2/15 to 1/1/16RetireesGeneral MembersAverage Benefits $330 $988 $1,661 $2,449 $3,277 $4,342 $5,770 Average Final Compensation $5,778 $5,953 $5,826 $5,723 $5,918 $6,501 $6,781 Count 12 27 36 43 26 29 37Safety MembersAverage Benefits $585 $1,352 $2,452 $3,959 $5,597 $8,061 $10,770 Average Final Compensation $7,403 $5,334 $6,269 $6,943 $8,120 $9,621 $11,481 Count 2 2 4 3 10 21 6Survivors/QDROsGeneral MembersAverage Benefits $376 $987 $999 $1,612 $3,184 $2,709 $5,276 Average Final Compensation $3,328 $5,939 $3,359 $4,532 $8,017 $5,312 $5,850 Count 4 10 9 4 4 3 5Safety MembersAverage Benefits $530 $2,019 $2,184 $1,970 $2,902 $4,784 $5,026 Average Final Compensation $6,052 $11,395 $9,909 $3,887 $4,783 $6,788 $5,405 Count 2 1 2 1 2 4 3
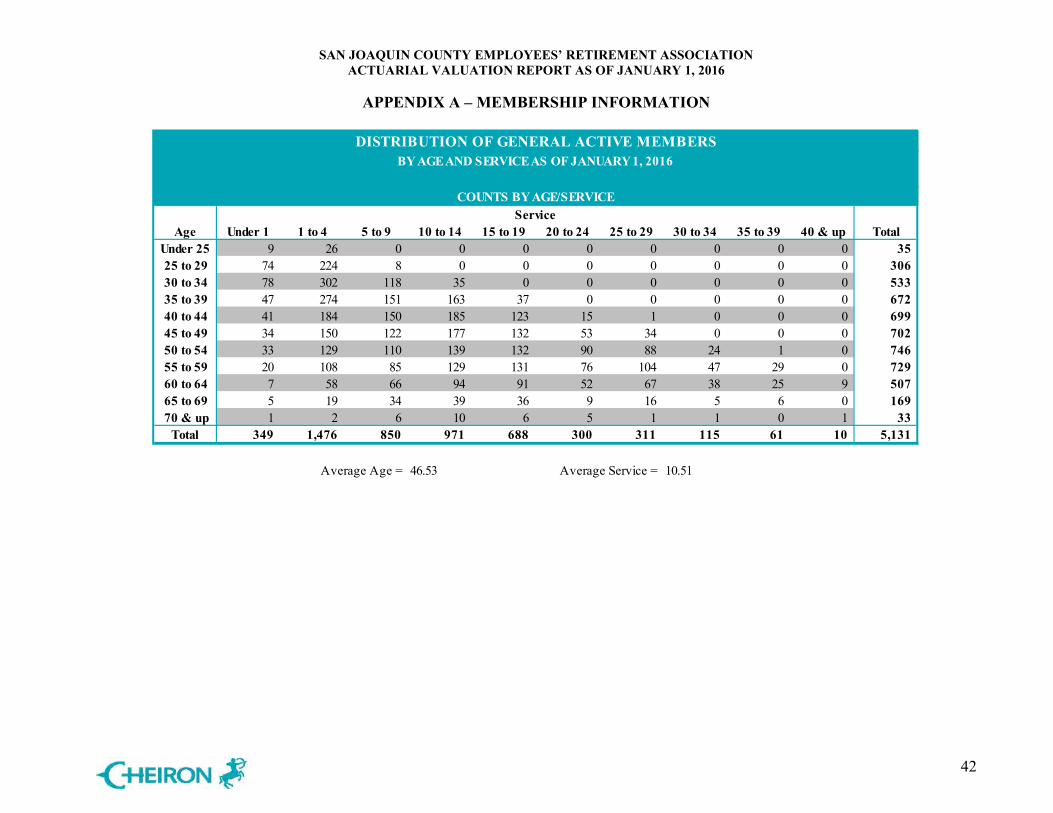
SAN JOAQUIN COUNTY EMPLOYEES’ RETIREMENT ASSOCIATION ACTUARIAL VALUATION REPORT AS OF JANUARY 1, 2016
APPENDIX A – MEMBERSHIP INFORMATION
42
DISTRIBUTION OF GENERAL ACTIVE MEMBERS BY AGE AND SERVICE AS OF JANUARY 1, 2016
COUNTS BY AGE/SERVICE Service
Age Under 1 1 to 4 5 to 9 10 to 14 15 to 19 20 to 24 25 to 29 30 to 34 35 to 39 40 & up TotalUnder 25 9 26 0 0 0 0 0 0 0 0 35 25 to 29 74 224 8 0 0 0 0 0 0 0 306 30 to 34 78 302 118 35 0 0 0 0 0 0 533 35 to 39 47 274 151 163 37 0 0 0 0 0 672 40 to 44 41 184 150 185 123 15 1 0 0 0 699 45 to 49 34 150 122 177 132 53 34 0 0 0 702 50 to 54 33 129 110 139 132 90 88 24 1 0 746 55 to 59 20 108 85 129 131 76 104 47 29 0 729 60 to 64 7 58 66 94 91 52 67 38 25 9 507 65 to 69 5 19 34 39 36 9 16 5 6 0 169 70 & up 1 2 6 10 6 5 1 1 0 1 33
Total 349 1,476 850 971 688 300 311 115 61 10 5,131
Average Age = 46.53 Average Service = 10.51

SAN JOAQUIN COUNTY EMPLOYEES’ RETIREMENT ASSOCIATION ACTUARIAL VALUATION REPORT AS OF JANUARY 1, 2016
APPENDIX A – MEMBERSHIP INFORMATION
43
DISTRIBUTION OF SAFETY ACTIVE MEMBERS BY AGE AND SERVICE AS OF JANUARY 1, 2016
COUNTS BY AGE/SERVICE Service
Age Under 1 1 to 4 5 to 9 10 to 14 15 to 19 20 to 24 25 to 29 30 to 34 35 to 39 40 & up TotalUnder 25 0 11 1 0 0 0 0 0 0 0 12 25 to 29 4 45 9 0 0 0 0 0 0 0 58 30 to 34 4 25 85 27 1 0 0 0 0 0 142 35 to 39 0 16 38 59 18 0 0 0 0 0 131 40 to 44 0 9 29 54 62 6 0 0 0 0 160 45 to 49 0 2 13 31 46 21 16 1 0 0 130 50 to 54 3 5 10 8 18 11 23 8 0 0 86 55 to 59 0 3 2 7 10 3 15 2 0 0 42 60 to 64 0 1 2 3 3 5 6 2 1 0 23 65 to 69 0 0 1 3 3 1 1 0 0 0 9 70 & up 0 0 0 0 0 0 0 0 0 0 0
Total 11 117 190 192 161 47 61 13 1 0 793
Average Age = 41.51 Average Service = 12.31

SAN JOAQUIN COUNTY EMPLOYEES’ RETIREMENT ASSOCIATION ACTUARIAL VALUATION REPORT AS OF JANUARY 1, 2016
APPENDIX A – MEMBERSHIP INFORMATION
44
PAYROLL DISTRIBUTION OF GENERAL ACTIVE PARTICIPANTS BY AGE AND SERVICE AS OF JANUARY 1, 2016
AVERAGE SALARY BY AGE/SERVICE Service
Age Under 1 1 to 4 5 to 9 10 to 14 15 to 19 20 to 24 25 to 29 30 to 34 35 to 39 40 & up TotalUnder 25 $41,352 $48,721 $0 $0 $0 $0 $0 $0 $0 $0 $46,826 25 to 29 $49,677 $57,960 $56,365 $0 $0 $0 $0 $0 $0 $0 $55,915 30 to 34 $48,800 $56,784 $59,837 $60,155 $0 $0 $0 $0 $0 $0 $56,513 35 to 39 $48,156 $58,174 $62,829 $68,158 $62,488 $0 $0 $0 $0 $0 $61,178 40 to 44 $49,226 $58,524 $78,372 $71,177 $64,727 $79,755 $66,811 $0 $0 $0 $67,146 45 to 49 $50,347 $54,697 $74,048 $73,955 $71,453 $68,432 $72,259 $0 $0 $0 $67,743 50 to 54 $58,027 $64,482 $72,679 $64,769 $71,241 $73,959 $79,276 $83,510 $104,059 $0 $70,208 55 to 59 $47,526 $63,898 $71,544 $69,065 $65,861 $70,752 $85,095 $82,678 $77,989 $0 $71,117 60 to 64 $55,017 $68,297 $81,389 $69,511 $65,075 $71,263 $74,806 $85,195 $85,377 $75,293 $72,862 65 to 69 $55,910 $99,362 $72,835 $72,396 $64,364 $65,046 $70,876 $86,253 $117,297 $0 $74,786 70 & up $55,120 $68,392 $136,137 $60,420 $56,428 $74,513 $40,925 $40,352 $0 $54,138 $74,530
Total $49,952 $59,293 $71,211 $69,358 $67,317 $71,734 $78,896 $83,471 $85,311 $73,178 $66,407
Average Salary = $66,407

SAN JOAQUIN COUNTY EMPLOYEES’ RETIREMENT ASSOCIATION ACTUARIAL VALUATION REPORT AS OF JANUARY 1, 2016
APPENDIX A – MEMBERSHIP INFORMATION
45
PAYROLL DISTRIBUTION OF SAFETY ACTIVE PARTICIPANTSBY AGE AND SERVICE AS OF JANUARY 1, 2016
AVERAGE SALARY BY AGE/SERVICEService
Age Under 1 1 to 4 5 to 9 10 to 14 15 to 19 20 to 24 25 to 29 30 to 34 35 to 39 40 & up TotalUnder 25 $0 $65,932 $88,002 $0 $0 $0 $0 $0 $0 $0 $67,771 25 to 29 $58,054 $65,408 $93,457 $0 $0 $0 $0 $0 $0 $0 $69,253 30 to 34 $53,050 $64,706 $81,433 $80,748 $69,760 $0 $0 $0 $0 $0 $77,476 35 to 39 $0 $65,498 $81,987 $77,434 $94,093 $0 $0 $0 $0 $0 $79,586 40 to 44 $0 $66,445 $78,879 $83,711 $83,808 $97,309 $0 $0 $0 $0 $82,412 45 to 49 $0 $55,849 $73,063 $78,847 $84,257 $92,326 $124,972 $173,685 $0 $0 $88,413 50 to 54 $78,062 $92,373 $76,785 $69,710 $85,205 $96,947 $119,862 $131,614 $0 $0 $98,040 55 to 59 $0 $98,672 $68,723 $75,393 $76,234 $69,951 $130,001 $97,417 $0 $0 $97,101 60 to 64 $0 $93,882 $107,379 $67,215 $94,268 $85,185 $103,473 $94,029 $296,024 $0 $101,041 65 to 69 $0 $0 $107,371 $65,043 $80,157 $70,347 $72,460 $0 $0 $0 $76,197 70 & up $0 $0 $0 $0 $0 $0 $0 $0 $0 $0 $0
Total $61,691 $67,484 $81,217 $79,144 $84,812 $91,388 $121,306 $123,807 $296,024 $0 $83,804
Average Salary = $83,804
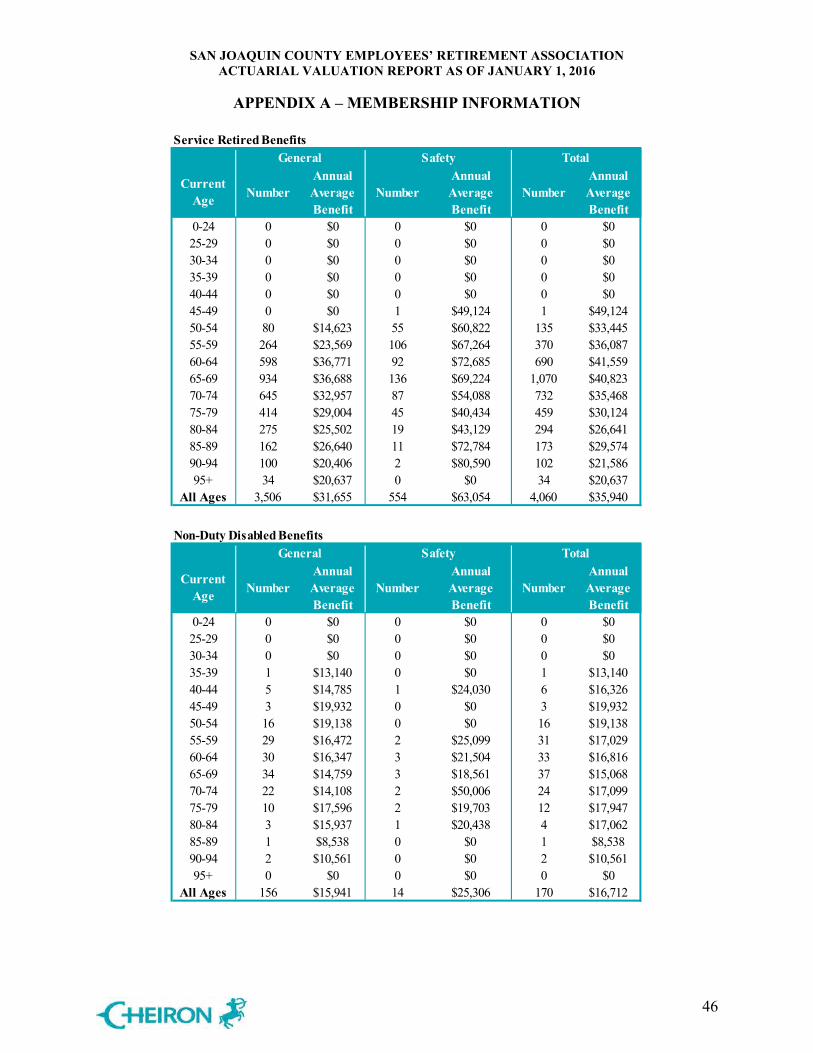
SAN JOAQUIN COUNTY EMPLOYEES’ RETIREMENT ASSOCIATION ACTUARIAL VALUATION REPORT AS OF JANUARY 1, 2016
APPENDIX A – MEMBERSHIP INFORMATION
46
Service Retired Benefits
Current Age Number
Annual Average Benefit
NumberAnnual Average Benefit
NumberAnnual Average Benefit
0-24 0 $0 0 $0 0 $0 25-29 0 $0 0 $0 0 $0 30-34 0 $0 0 $0 0 $0 35-39 0 $0 0 $0 0 $0 40-44 0 $0 0 $0 0 $0 45-49 0 $0 1 $49,124 1 $49,124 50-54 80 $14,623 55 $60,822 135 $33,445 55-59 264 $23,569 106 $67,264 370 $36,087 60-64 598 $36,771 92 $72,685 690 $41,559 65-69 934 $36,688 136 $69,224 1,070 $40,823 70-74 645 $32,957 87 $54,088 732 $35,468 75-79 414 $29,004 45 $40,434 459 $30,124 80-84 275 $25,502 19 $43,129 294 $26,641 85-89 162 $26,640 11 $72,784 173 $29,574 90-94 100 $20,406 2 $80,590 102 $21,586 95+ 34 $20,637 0 $0 34 $20,637
All Ages 3,506 $31,655 554 $63,054 4,060 $35,940
General Safety Total
Non-Duty Disabled Benefits
Current Age Number
Annual Average Benefit
NumberAnnual Average Benefit
NumberAnnual Average Benefit
0-24 0 $0 0 $0 0 $0 25-29 0 $0 0 $0 0 $0 30-34 0 $0 0 $0 0 $0 35-39 1 $13,140 0 $0 1 $13,140 40-44 5 $14,785 1 $24,030 6 $16,326 45-49 3 $19,932 0 $0 3 $19,932 50-54 16 $19,138 0 $0 16 $19,138 55-59 29 $16,472 2 $25,099 31 $17,029 60-64 30 $16,347 3 $21,504 33 $16,816 65-69 34 $14,759 3 $18,561 37 $15,068 70-74 22 $14,108 2 $50,006 24 $17,099 75-79 10 $17,596 2 $19,703 12 $17,947 80-84 3 $15,937 1 $20,438 4 $17,062 85-89 1 $8,538 0 $0 1 $8,538 90-94 2 $10,561 0 $0 2 $10,561 95+ 0 $0 0 $0 0 $0
All Ages 156 $15,941 14 $25,306 170 $16,712
General Safety Total

SAN JOAQUIN COUNTY EMPLOYEES’ RETIREMENT ASSOCIATION ACTUARIAL VALUATION REPORT AS OF JANUARY 1, 2016
APPENDIX A – MEMBERSHIP INFORMATION
47
Duty Disabled Benefits
Current Age Number
Annual Average Benefit
NumberAnnual Average Benefit
NumberAnnual Average Benefit
0-24 0 $0 0 $0 0 $0 25-29 0 $0 0 $0 0 $0 30-34 0 $0 2 $37,875 2 $37,875 35-39 0 $0 3 $32,894 3 $32,894 40-44 7 $11,450 10 $35,083 17 $25,352 45-49 11 $9,831 13 $39,739 24 $26,031 50-54 13 $19,231 33 $44,684 46 $37,491 55-59 41 $21,547 33 $51,228 74 $34,783 60-64 50 $23,833 32 $51,618 82 $34,676 65-69 61 $28,477 35 $57,044 96 $38,892 70-74 30 $24,362 18 $50,960 48 $34,336 75-79 9 $30,323 9 $53,090 18 $41,707 80-84 8 $27,289 2 $52,055 10 $32,242 85-89 2 $22,294 6 $63,596 8 $53,271 90-94 2 $32,394 0 $0 2 $32,394 95+ 0 $0 0 $0 0 $0
All Ages 234 $23,854 196 $49,674 430 $35,623
General Safety Total
Surviving Beneficiary Benefits (all benefit types)
Current Age Number
Annual Average Benefit
NumberAnnual Average Benefit
NumberAnnual Average Benefit
0-24 9 $13,477 0 $0 9 $13,477 25-29 2 $18,767 0 $0 2 $18,767 30-34 1 $8,910 0 $0 1 $8,910 35-39 1 $11,482 0 $0 1 $11,482 40-44 4 $11,442 2 $60,793 6 $27,892 45-49 8 $14,428 5 $26,265 13 $18,981 50-54 20 $10,203 18 $16,584 38 $13,226 55-59 37 $16,097 23 $24,643 60 $19,373 60-64 64 $14,236 24 $36,387 88 $20,277 65-69 100 $21,709 27 $36,373 127 $24,827 70-74 82 $19,783 27 $30,971 109 $22,554 75-79 69 $17,324 18 $43,436 87 $22,726 80-84 67 $18,043 17 $35,520 84 $21,580 85-89 62 $17,954 11 $38,893 73 $21,109 90-94 44 $21,396 5 $33,612 49 $22,642 95+ 28 $20,513 0 $0 28 $20,513
All Ages 598 $18,190 177 $32,720 775 $21,508
General Safety Total

SAN JOAQUIN COUNTY EMPLOYEES’ RETIREMENT ASSOCIATION ACTUARIAL VALUATION REPORT AS OF JANUARY 1, 2016
APPENDIX A – MEMBERSHIP INFORMATION
48
Assumed Probabilities of Separation from Active Membership
AgeNon-Duty
DeathOrdinary Disability
Service Retirement1 Duty Death
Duty Disability
20 0.0002 0.000 0.000 0.000 0.00125 0.0003 0.001 0.000 0.000 0.00130 0.0005 0.001 0.000 0.000 0.00135 0.0005 0.001 0.000 0.000 0.00140 0.0007 0.001 0.000 0.000 0.00445 0.0009 0.002 0.000 0.000 0.00450 0.0014 0.002 0.040 0.000 0.00255 0.0022 0.003 0.085 0.000 0.00260 0.0034 0.003 0.150 0.000 0.00265 0.0046 0.004 0.250 0.000 0.002
20 0.0002 0.000 0.000 0.000 0.00025 0.0002 0.001 0.000 0.000 0.00030 0.0003 0.001 0.000 0.000 0.00035 0.0004 0.001 0.000 0.000 0.00140 0.0005 0.001 0.000 0.000 0.00145 0.0006 0.002 0.000 0.000 0.00150 0.0010 0.002 0.035 0.000 0.00155 0.0015 0.003 0.035 0.000 0.00260 0.0021 0.004 0.125 0.000 0.00265 0.0029 0.005 0.250 0.000 0.003
General Members – Male
General Members – Female
1 Lower rates assumed for members with less than 10 years of service, and higher rates assumed for members with at least 30 years of service.
The probabilities for each cause of separation represent the likelihood that a given member will separate at a particular age for the indicated reason. As an example, if the probability of separation of a male general member at age 20 is 0.036, that indicates that 3.6% of active general members are expected to separate from service during the year. Rates of Duty and Non-Duty Death are for active members who reach the given age during 2016.
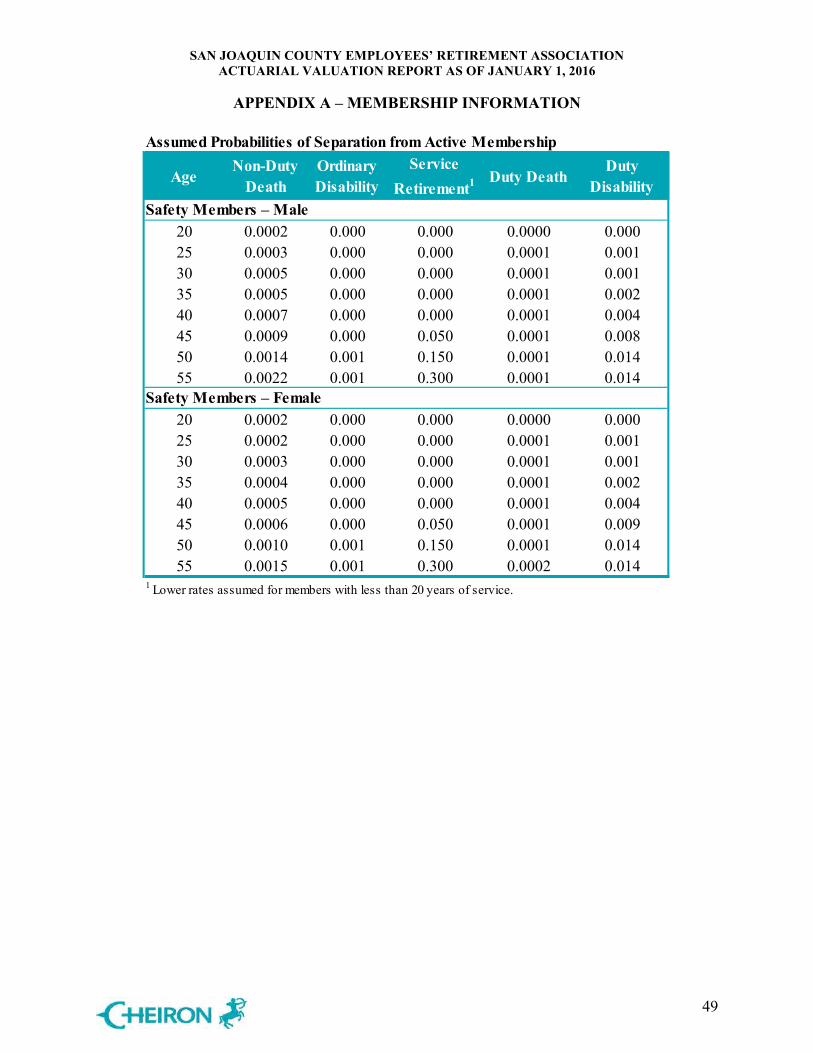
SAN JOAQUIN COUNTY EMPLOYEES’ RETIREMENT ASSOCIATION ACTUARIAL VALUATION REPORT AS OF JANUARY 1, 2016
APPENDIX A – MEMBERSHIP INFORMATION
49
Assumed Probabilities of Separation from Active Membership
AgeNon-Duty
DeathOrdinary Disability
Service Retirement1 Duty Death
Duty Disability
20 0.0002 0.000 0.000 0.0000 0.00025 0.0003 0.000 0.000 0.0001 0.00130 0.0005 0.000 0.000 0.0001 0.00135 0.0005 0.000 0.000 0.0001 0.00240 0.0007 0.000 0.000 0.0001 0.00445 0.0009 0.000 0.050 0.0001 0.00850 0.0014 0.001 0.150 0.0001 0.01455 0.0022 0.001 0.300 0.0001 0.014
20 0.0002 0.000 0.000 0.0000 0.00025 0.0002 0.000 0.000 0.0001 0.00130 0.0003 0.000 0.000 0.0001 0.00135 0.0004 0.000 0.000 0.0001 0.00240 0.0005 0.000 0.000 0.0001 0.00445 0.0006 0.000 0.050 0.0001 0.00950 0.0010 0.001 0.150 0.0001 0.01455 0.0015 0.001 0.300 0.0002 0.014
1 Lower rates assumed for members with less than 20 years of service.
Safety Members – Male
Safety Members – Female
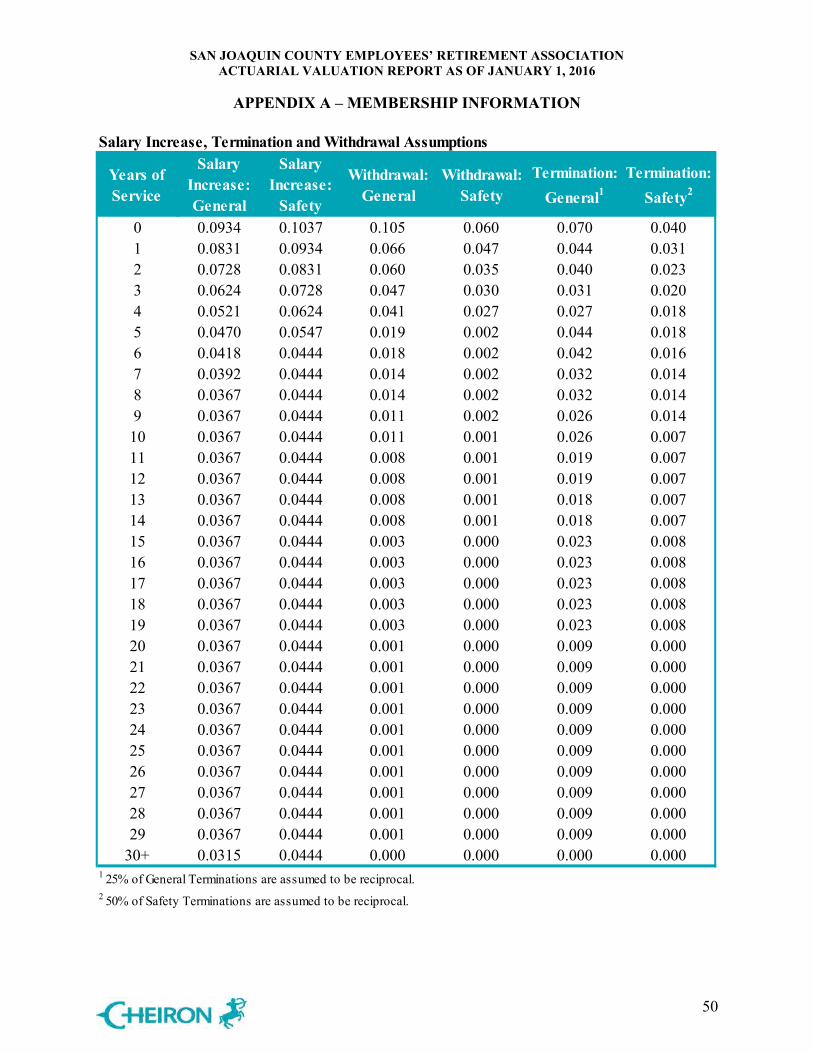
SAN JOAQUIN COUNTY EMPLOYEES’ RETIREMENT ASSOCIATION ACTUARIAL VALUATION REPORT AS OF JANUARY 1, 2016
APPENDIX A – MEMBERSHIP INFORMATION
50
Salary Increase, Termination and Withdrawal Assumptions
Years of Service
Salary Increase: General
Salary Increase:
Safety
Withdrawal: General
Withdrawal: Safety
Termination: General1
Termination: Safety2
0 0.0934 0.1037 0.105 0.060 0.070 0.0401 0.0831 0.0934 0.066 0.047 0.044 0.0312 0.0728 0.0831 0.060 0.035 0.040 0.0233 0.0624 0.0728 0.047 0.030 0.031 0.0204 0.0521 0.0624 0.041 0.027 0.027 0.0185 0.0470 0.0547 0.019 0.002 0.044 0.0186 0.0418 0.0444 0.018 0.002 0.042 0.0167 0.0392 0.0444 0.014 0.002 0.032 0.0148 0.0367 0.0444 0.014 0.002 0.032 0.0149 0.0367 0.0444 0.011 0.002 0.026 0.014
10 0.0367 0.0444 0.011 0.001 0.026 0.00711 0.0367 0.0444 0.008 0.001 0.019 0.00712 0.0367 0.0444 0.008 0.001 0.019 0.00713 0.0367 0.0444 0.008 0.001 0.018 0.00714 0.0367 0.0444 0.008 0.001 0.018 0.00715 0.0367 0.0444 0.003 0.000 0.023 0.00816 0.0367 0.0444 0.003 0.000 0.023 0.00817 0.0367 0.0444 0.003 0.000 0.023 0.00818 0.0367 0.0444 0.003 0.000 0.023 0.00819 0.0367 0.0444 0.003 0.000 0.023 0.00820 0.0367 0.0444 0.001 0.000 0.009 0.00021 0.0367 0.0444 0.001 0.000 0.009 0.00022 0.0367 0.0444 0.001 0.000 0.009 0.00023 0.0367 0.0444 0.001 0.000 0.009 0.00024 0.0367 0.0444 0.001 0.000 0.009 0.00025 0.0367 0.0444 0.001 0.000 0.009 0.00026 0.0367 0.0444 0.001 0.000 0.009 0.00027 0.0367 0.0444 0.001 0.000 0.009 0.00028 0.0367 0.0444 0.001 0.000 0.009 0.00029 0.0367 0.0444 0.001 0.000 0.009 0.000
30+ 0.0315 0.0444 0.000 0.000 0.000 0.0001 25% of General Terminations are assumed to be reciprocal.2 50% of Safety Terminations are assumed to be reciprocal.
SAN JOAQUIN COUNTY EMPLOYEES’ RETIREMENT ASSOCIATION ACTUARIAL VALUATION REPORT AS OF JANUARY 1, 2016
APPENDIX B – STATEMENT OF CURRENT ACTUARIAL
ASSUMPTIONS AND METHODS
51
The assumptions and methods used in the actuarial valuation as of January 1, 2016 are: Actuarial Methods
1. Actuarial Cost Method The actuarial valuation is prepared using the entry age actuarial cost method (CERL 31453.5). Under the principles of this method, the actuarial present value of the projected benefits of each individual included in the valuation is allocated as a level percentage of the individual's projected compensation between entry age and assumed exit (until maximum retirement age). For members who transferred from outside of SJCERA, entry age (for the Actuarial Cost calculation only) is based on entry into the system. The normal cost for the Plan is based on the sum of the individual normal costs for each member (Individual Entry Age Method). The UAL (or Surplus Funding) is amortized as a percentage of the projected salaries of present and future members of SJCERA. Effective with the January 1, 2015 valuation, the UAL as of January 1, 2014 is amortized over a closed 19-year period (17 years remaining as of January 1, 2016), except for the additional UAL attributable to the extraordinary loss from 2008, which is being amortized over a separate closed period (23 years as of January 1, 2016). Any subsequent unexpected change in the unfunded actuarial liability after January 1, 2014 is amortized over 15 years.
2. Valuation of Assets
The assets are valued using a five-year smoothed method based on the difference between the expected market value and the actual market value of the assets as of the valuation date. The expected market value is the prior year’s market value increased with the net increase in the cash flow of funds, all increased with interest during the past fiscal year at the expected investment return rate assumption. An asset corridor limit is applied such that the smoothed market value of assets stays within 20% of the market value of assets.

SAN JOAQUIN COUNTY EMPLOYEES’ RETIREMENT ASSOCIATION ACTUARIAL VALUATION REPORT AS OF JANUARY 1, 2016
APPENDIX B – STATEMENT OF CURRENT ACTUARIAL
ASSUMPTIONS AND METHODS
52
Actuarial Assumptions The actuarial assumptions have been adopted by the Board for this valuation based on recommendations included in an Experience Study performed by Cheiron, which analyzed the Plan’s experience from 2013-2016 (and in some cases from 2010-2016). Many of the assumptions changed as a result of the Experience Study; the Experience Study report contains a full description of the old and new assumptions, as well as the basis for our recommendations. These assumptions will be used for the 2016 through 2018 actuarial valuations, unless modified by the Board.
3. Rate of Return Assets are assumed to earn 7.40% net of investment expenses.
4. Administrative Expenses Administrative expenses are assumed to be $4,370,908 for the next year, to be split between employees and employers based on their share of the overall contributions. Expenses are expected to grow with the cost of living (by 2.90% per year.)
5. Cost of Living
The cost of living as measured by the Consumer Price Index (CPI) will increase at the rate of 2.90% per year.
6. Post Retirement COLA
Benefits are assumed to increase after retirement at the rate of 2.6% per year.
7. Increases in Pay Assumed pay increases for active Members consist of increases due to base salary adjustments plus service-based increase due to longevity and promotion, as shown below:
Years of Service0 1 2 3 4 5 6 7 8-29 30+
Base Increase 3.15% 3.15% 3.15% 3.15% 3.15% 3.15% 3.15% 3.15% 3.15% 3.15%Longevity & Promotion
General 6.00% 5.00% 4.00% 3.00% 2.00% 1.50% 1.00% 0.75% 0.50% 0.00%Safety 7.00% 6.00% 5.00% 4.00% 3.00% 2.25% 1.25% 1.25% 1.25% 1.25%
Total (Compound)General 9.34% 8.31% 7.28% 6.24% 5.21% 4.70% 4.18% 3.92% 3.67% 3.15%Safety 10.37% 9.34% 8.31% 7.28% 6.24% 5.47% 4.44% 4.44% 4.44% 4.44%
Pay Increases

SAN JOAQUIN COUNTY EMPLOYEES’ RETIREMENT ASSOCIATION ACTUARIAL VALUATION REPORT AS OF JANUARY 1, 2016
APPENDIX B – STATEMENT OF CURRENT ACTUARIAL
ASSUMPTIONS AND METHODS
53
8. Family Composition Percentage married for all active members who retire, become disabled, or die during active service is shown in the following table. Male members are assumed to be four years older than their spouses, and female members are assumed to be two years younger than their spouses.
9. Rates of Termination
Sample rates of termination are show in the following table.
* Termination rates do not apply once a member is eligible for retirement.
10. Withdrawal
Rates of withdrawal apply to active Members who terminate their employment and withdraw their member contributions, forfeiting entitlement to future Plan benefits.
Gender PercentageMales 75%
Females 55%
Percentage Married
Years of Service
General Safety
0 17.50% 10.00%1 11.00% 7.75%2 10.00% 5.75%3 7.75% 5.00%4 6.75% 4.50%5 6.25% 2.00%6 6.00% 1.75%7 4.50% 1.50%8 4.50% 1.50%9 3.75% 1.50%
10 3.75% 0.75%11-12 2.75% 0.75%13-19 2.50% 0.75%20-29 1.00% 0.00%30+ 0.00% 0.00%
Rates of Termination*
SAN JOAQUIN COUNTY EMPLOYEES’ RETIREMENT ASSOCIATION ACTUARIAL VALUATION REPORT AS OF JANUARY 1, 2016
APPENDIX B – STATEMENT OF CURRENT ACTUARIAL
ASSUMPTIONS AND METHODS
54
60% of all General Member terminations with less than five years of service, 30% of those with five to fourteen years of service, and 10% of those with more than fifteen years of service, are assumed to take a refund of contributions. 60% of all Safety Member terminations with less than five years of service, 10% of those with five to fourteen years of service, and none of those with more than fifteen years of service, are assumed to take a refund of contributions.
11. Vested Termination and Reciprocal Transfers Rates of vested termination apply to active Members who terminate their employment and leave their member contributions on deposit with the Plan.
40% of all General Member terminations with less than five years of service, 70% of those with five to fourteen years of service, and 90% of those with more than fifteen years of service, are assumed to leave their contributions on deposit. 40% of all Safety Member terminations with less than five years of service, 90% of those with five to fourteen years of service, and 100% of those with more than fifteen years of service, are assumed to leave their contributions on deposit. Vested terminated General Members are assumed to begin receiving benefits at age 58; vested terminated Safety Members are assumed to begin receiving benefits at age 50. 25% of vested terminated General Members and 50% of vested terminated Safety Members are assumed to be reciprocal. Final average pay for General Members who terminate with reciprocity is assumed to increase by 3.67% per year until their assumed retirement date. Final average pay for Safety Members who terminate with reciprocity is assumed to increase by 4.44% per year until their assumed retirement date.
12. Rates of Service-Connected Disability Sample service-connected disability rates of active participants are provided in the table below.

SAN JOAQUIN COUNTY EMPLOYEES’ RETIREMENT ASSOCIATION ACTUARIAL VALUATION REPORT AS OF JANUARY 1, 2016
APPENDIX B – STATEMENT OF CURRENT ACTUARIAL
ASSUMPTIONS AND METHODS
55
13. Rates of Nonservice-Connected Disability Sample nonservice-connected disability rates of active participants are provided in the table below.
14. Rates of Mortality for Healthy Lives
Mortality rates for active members are based on the sex distinct CALPERS Preretirement Non-Industrial Mortality Table, with generational mortality improvements projected from 2009 using Projection Scale MP-2015, published by the Society of Actuaries. Mortality rates for healthy annuitants are based on the sex distinct CALPERS Healthy Annuitant Mortality Table, with a partial credibility adjustment of 1.10 for Safety
General General Safety SafetyAge Male Female Male Female22 0.066% 0.022% 0.048% 0.048%27 0.066% 0.030% 0.086% 0.089%32 0.066% 0.051% 0.161% 0.166%37 0.066% 0.073% 0.296% 0.305%42 0.380% 0.094% 0.565% 0.592%47 0.380% 0.123% 1.023% 1.101%52 0.226% 0.159% 1.425% 1.425%57 0.226% 0.204% 1.425% 1.425%62 0.226% 0.249% 1.425% 1.425%
Rates of Svc Disability
General General Safety SafetyAge Male Female Male Female22 0.051% 0.053% 0.003% 0.003%27 0.068% 0.067% 0.005% 0.005%32 0.086% 0.081% 0.008% 0.009%37 0.108% 0.102% 0.016% 0.016%42 0.138% 0.138% 0.030% 0.031%47 0.178% 0.197% 0.054% 0.058%52 0.225% 0.267% 0.075% 0.075%57 0.286% 0.337% 0.075% 0.075%62 0.362% 0.408% 0.075% 0.075%
Rates of Non-Svc Disability

SAN JOAQUIN COUNTY EMPLOYEES’ RETIREMENT ASSOCIATION ACTUARIAL VALUATION REPORT AS OF JANUARY 1, 2016
APPENDIX B – STATEMENT OF CURRENT ACTUARIAL
ASSUMPTIONS AND METHODS
56
members, with generational mortality improvements projected from 2009 using Projection Scale MP-2015, published by the Society of Actuaries. Mortality rates for active members who die in the line-of-duty are based on the sex distinct CALPERS Preretirement Industrial Mortality Table, with generational mortality improvements projected from 2009 using Projection Scale MP-2015, published by the Society of Actuaries.
15. Rates of Mortality for Disabled Retirees
Mortality rates for Safety disabled annuitants are based on the sex distinct CALPERS Industrially Disabled Annuitant Mortality Table, with generational mortality improvements projected from 2009 using Projection Scale MP-2015, published by the Society of Actuaries. Mortality rates for General disabled annuitants are based on the sex distinct CALPERS Non-Industrially Disabled Annuitant Mortality Table, with a partial credibility adjustment of 1.05, with generational mortality improvements projected from 2009 using Projection Scale MP-2015, published by the Society of Actuaries.
16. Mortality Improvement
As mentioned above, the mortality assumptions employ a fully generational mortality improvement projection from the base year of the CalPERS mortality tables (2009) using Scale MP-2015.
17. Adjustment for Service Purchases
SJCERA provides Cheiron with the amount of service that active employees are eligible to purchase. We include this service when calculating the employees’ benefit eligibility. Half of eligible service purchases which have not been purchased by the members are included in the employees’ Credited Service, as employees will pay approximately half of the normal cost for these benefits when purchasing this service.

SAN JOAQUIN COUNTY EMPLOYEES’ RETIREMENT ASSOCIATION ACTUARIAL VALUATION REPORT AS OF JANUARY 1, 2016
APPENDIX B – STATEMENT OF CURRENT ACTUARIAL
ASSUMPTIONS AND METHODS
57
18. Rates of Retirement Rates of retirement are based on age according to the following table.
19. Changes in Assumptions Details of all assumption changes can be found in the Actuarial Experience Study Report for the period covering January 1, 2013 to December 31, 2015.
Age 5-9 10-29 30+ 5-9 10-29 30+ 10-19 20+45 0.00% 0.00% 0.00% 0.00% 0.00% 0.00% 0.00% 5.00%46 0.00% 0.00% 0.00% 0.00% 0.00% 0.00% 0.00% 5.00%47 0.00% 0.00% 0.00% 0.00% 0.00% 0.00% 0.00% 5.00%48 0.00% 0.00% 0.00% 0.00% 0.00% 0.00% 0.00% 5.00%49 0.00% 0.00% 0.00% 0.00% 0.00% 0.00% 0.00% 5.00%50 3.25% 4.00% 5.00% 3.50% 3.50% 4.50% 10.00% 15.00%51 3.25% 4.00% 5.00% 3.50% 3.50% 4.50% 5.00% 10.00%52 3.25% 4.00% 5.00% 3.50% 3.50% 4.50% 5.00% 10.00%53 3.25% 4.00% 5.00% 3.50% 3.50% 4.50% 5.00% 20.00%54 3.25% 4.00% 5.00% 3.50% 3.50% 4.50% 5.00% 20.00%55 4.00% 8.50% 15.00% 3.50% 3.50% 4.50% 5.00% 30.00%56 4.00% 4.00% 15.00% 3.50% 7.00% 15.00% 5.00% 20.00%57 4.00% 4.00% 15.00% 3.50% 7.00% 15.00% 5.00% 20.00%58 4.00% 4.00% 20.00% 3.50% 7.00% 15.00% 5.00% 20.00%59 4.00% 15.00% 25.00% 3.50% 7.00% 15.00% 5.00% 20.00%60 4.00% 15.00% 25.00% 7.50% 12.50% 15.00% 5.00% 20.00%61 7.50% 17.50% 35.00% 7.50% 12.50% 25.00% 25.00% 25.00%62 7.50% 30.00% 40.00% 7.50% 25.00% 30.00% 25.00% 50.00%63 7.50% 25.00% 35.00% 7.50% 25.00% 35.00% 25.00% 50.00%64 7.50% 25.00% 35.00% 7.50% 25.00% 40.00% 25.00% 50.00%65 15.00% 25.00% 50.00% 15.00% 25.00% 40.00% 100.00% 100.00%66 15.00% 35.00% 50.00% 15.00% 25.00% 40.00% 100.00% 100.00%67 15.00% 30.00% 40.00% 15.00% 25.00% 40.00% 100.00% 100.00%68 15.00% 30.00% 30.00% 15.00% 25.00% 40.00% 100.00% 100.00%69 15.00% 30.00% 30.00% 15.00% 25.00% 40.00% 100.00% 100.00%70 100.00% 100.00% 100.00% 100.00% 100.00% 100.00% 100.00% 100.00%
General MaleYears of Service
General FemaleYears of Service Years of Service
Safety
Rates of Retirement
SAN JOAQUIN COUNTY EMPLOYEES’ RETIREMENT ASSOCIATION ACTUARIAL VALUATION REPORT AS OF JANUARY 1, 2016
APPENDIX C – SUMMARY OF PLAN PROVISIONS
58
A. Definitions
Compensation: Compensation means the cash remuneration for services paid by the employer. It includes base pay and certain differential, incentive, and special pay allowances defined by the Board of Retirement. Overtime is excluded, with the exception of overtime paid under the Fair Labor Standards Act that is regular and recurring.
For members joining the Plan on and after January 1, 2013 (Tier II Members), only pensionable compensation up to the Social Security Taxable Wage Base ($117,020 for 2016) will count for computing Plan benefits and employee contributions and employer contributions for those participating in Social Security. For those not participating in Social Security, the compensation cap is 120% of the Taxable Wage Base ($140,424 for 2016.) In addition, it is possible that some sources of compensation, such as any payments deemed to be terminal or special pays, may be excluded from benefit and contribution computations for Tier II Members.
Credited Service: In general, Credited Service is earned for the period during which Member
Contributions are paid. Temporary service for which the Member was not credited, or service for
which the Member withdrew his or her Member Contributions, may be purchased by paying or repaying the Member Contributions with interest. Credit for up to 12 months of a medical leave of absence and all military leaves of absence may also be purchased.
Public Service (see below) is part of Credited Service for the computation
of benefits only, not for eligibility for benefits or for vesting. Final Compensation: For Tier I Members, Final Compensation means the highest average
Compensation earned during any 12 consecutive months of the Member’s employment.
For Tier II Members, highest average Compensation will be based on the
highest 36 consecutive months, rather than 12 months. General Member: Any Member who is not a Safety Member is a General Member. Public Service: The Member may elect to purchase Public Service for time spent while
employed in another recognized public agency. The public agency must have a reciprocal agreement with the Plan or be one of several specified municipalities, counties, special districts, or State or Federal agencies.

SAN JOAQUIN COUNTY EMPLOYEES’ RETIREMENT ASSOCIATION ACTUARIAL VALUATION REPORT AS OF JANUARY 1, 2016
APPENDIX C – SUMMARY OF PLAN PROVISIONS
59
Public Service cannot be purchased if it is used for eligibility for another
pension. The cost to purchase Public Service is twice the Member Contributions
and interest applicable for the period of time purchased. Public Service is used to compute benefits, but does not count toward eligibility for benefits or vesting.
Safety Member: Any sworn Member engaged in law enforcement, probation, or fire
suppression is a Safety Member. B. Membership
Eligibility: All full-time, permanent employees of San Joaquin County and other
participating special districts become Members on their date of appointment. Membership is mandatory; only elected officials and members who are age 60 or older at the time of employment in a position requiring membership in SJCERA may choose not to participate.
A Tier II Member is any Member joining the Plan for the first time on or
after January 1, 2013. Employees who transfer from and are eligible for reciprocity with another public employer will not be Tier II Members if their service in the reciprocal system was under a previous tier. Employees who were Members of SJCERA prior to January 1, 2013 and experienced a break in service of more than six months and then were reemployed by a different SJCERA-participating employer on or after January 1, 2013 will be considered Tier II Members for all subsequent service.
Member Contributions: Each Member contributes a percentage of Compensation to the Plan
through payroll deduction. For Tier I members, the percentage contributed depends on the Member’s age upon joining the Plan. Representative rates are shown in Table 1 on the next page.
Tier I members covered by Social Security have their contributions
reduced by one-third on the first $161.54 of biweekly Compensation. General Members who joined the Plan prior to March 7, 1973 and who have earned 30 years of Credited Service do not contribute; Safety Members do not contribute after earning 30 years of Credited Service.

SAN JOAQUIN COUNTY EMPLOYEES’ RETIREMENT ASSOCIATION ACTUARIAL VALUATION REPORT AS OF JANUARY 1, 2016
APPENDIX C – SUMMARY OF PLAN PROVISIONS
60
Some Tier I members also contribute half of the normal cost associated with the post-retirement COLA benefits, also based on entry age. Many bargaining groups have also agreed to have their Tier I members pay additional basic rate contributions (14% of the current basic rates for General members, 33% for Safety). Complete rate tables for all groups are in the Appendix.
Tier II Members contribute half of the normal cost of the Plan.
Contributions for these Members are based on the Normal Cost associated with their benefits; General and Safety members pay different rates.
Tier II Members pay a single contribution rate, not a rate based on entry
age. All Tier II Members continue contributing after earning 30 years of service.
Interest is credited semiannually to each Member’s accumulated contributions. The crediting rate is set by the Board; the semi-annual rate for 2015 was 3.68%, for an effective annual rate of 7.50%.
C. Service Retirement: Eligibility: Tier I General Members are eligible to retire at age 50 if they have earned
five years of Credited Service and have passed the tenth anniversary of their membership in the Plan. Alternatively, General Members are eligible to retire at any age after having earned 30 years of Credited Service, or upon reaching age 70 with no service requirement.
Table 1: Tier I Member Contribution Rates (Basic Rates)General Member Rate Safety Member Rate
Entry Age Over $350 1st $350/month Over $35020 2.57% 2.68% 4.02%25 2.91% 2.91% 4.36%30 3.24% 3.15% 4.73%35 3.59% 3.43% 5.14%40 3.99% 3.75% 5.62%45 4.46% 4.11% 6.16%50 4.96% 4.04% 6.06%
2.97%3.31%
1st $350/month1.71%1.94%2.16%2.39%2.66%
Table 2: Tier II Member Contribution Rates
8.97% 14.53%
Safety Member RateGeneral Member Rate
SAN JOAQUIN COUNTY EMPLOYEES’ RETIREMENT ASSOCIATION ACTUARIAL VALUATION REPORT AS OF JANUARY 1, 2016
APPENDIX C – SUMMARY OF PLAN PROVISIONS
61
Tier I Safety Members are eligible to retire at age 50 if they have earned
five years of Credited Service and have passed the tenth anniversary of their membership in the Plan. Alternatively, Safety Members are eligible to retire at any age after having earned 20 years of Credited Service.
Tier II General Members are eligible to retire upon attaining age 52 and
completing five or more years of service. Tier II Safety Members are eligible to retire upon attaining age 50 and completing five or more years of service. Tier II Members are eligible to retire, regardless of service, after attaining age 70.
Benefit Amount: The Service Retirement Benefit payable to Tier I General Members is
equal to the percentage in Table 3 on the next page multiplied by the Member’s Final Compensation. The Service Retirement Benefit payable to Tier I Safety Members is equal to the percentage in Table 4 on page 63 multiplied by the Member’s Final Compensation. The percentage of Final Compensation may not exceed 100%.

SAN JOAQUIN COUNTY EMPLOYEES’ RETIREMENT ASSOCIATION ACTUARIAL VALUATION REPORT AS OF JANUARY 1, 2016
APPENDIX C – SUMMARY OF PLAN PROVISIONS
62
Table 3: Tier I General Members (CERL Section 31676.14)
Service 46 47 48 49 50 51 52 53 54 55 56 57 58 59 60 61 62 63 64 6510 14.75 15.67 16.67 17.41 18.41 19.48 20.61 21.82 22.68 23.54 24.40 25.26 26.11 26.11 26.11 26.1111 16.23 17.23 18.33 19.15 20.25 21.42 22.67 24.00 24.95 25.89 26.84 27.78 28.72 28.72 28.72 28.7212 17.70 18.80 20.00 20.89 22.10 23.37 24.73 26.19 27.22 28.25 29.28 30.31 31.34 31.34 31.34 31.3413 19.18 20.36 21.67 22.64 23.94 25.32 26.79 28.37 29.48 30.60 31.72 32.83 33.95 33.95 33.95 33.9514 20.65 21.93 23.33 24.38 25.78 27.27 28.85 30.55 31.75 32.95 34.16 35.36 36.56 36.56 36.56 36.5615 22.13 23.50 25.00 26.12 27.62 29.22 30.91 32.73 34.02 35.31 36.60 37.88 39.17 39.17 39.17 39.1716 23.60 25.06 26.67 27.86 29.46 31.16 32.97 34.92 36.29 37.66 39.04 40.41 41.78 41.78 41.78 41.7817 25.08 26.63 28.33 29.60 31.30 33.11 35.03 37.10 38.56 40.01 41.47 42.93 44.39 44.39 44.39 44.3918 26.55 28.20 30.00 31.34 33.14 35.06 37.09 39.28 40.82 42.37 43.91 45.46 47.00 47.00 47.00 47.0019 28.03 29.76 31.67 33.08 34.98 37.01 39.16 41.46 43.09 44.72 46.35 47.98 49.61 49.61 49.61 49.6120 29.50 31.33 33.33 34.82 36.83 38.95 41.22 43.64 45.36 47.08 48.79 50.51 52.23 52.23 52.23 52.2321 30.98 32.90 35.00 36.57 38.67 40.90 43.28 45.83 47.63 49.43 51.23 53.04 54.84 54.84 54.84 54.8422 32.45 34.46 36.67 38.31 40.51 42.85 45.34 48.01 49.90 51.78 53.67 55.56 57.45 57.45 57.45 57.4523 33.93 36.03 38.33 40.05 42.35 44.80 47.40 50.19 52.16 54.14 56.11 58.09 60.06 60.06 60.06 60.0624 35.40 37.60 40.00 41.79 44.19 46.74 49.46 52.37 54.43 56.49 58.55 60.61 62.67 62.67 62.67 62.6725 36.88 39.16 41.67 43.53 46.03 48.69 51.52 54.56 56.70 58.85 60.99 63.14 65.28 65.28 65.28 65.2826 38.35 40.73 43.33 45.27 47.87 50.64 53.58 56.74 58.97 61.20 63.43 65.66 67.89 67.89 67.89 67.8927 39.83 42.30 45.00 47.01 49.72 52.59 55.64 58.92 61.24 63.55 65.87 68.19 70.51 70.51 70.51 70.5128 41.30 43.86 46.67 48.75 51.56 54.54 57.70 61.10 63.50 65.91 68.31 70.71 73.12 73.12 73.12 73.1229 42.78 45.43 48.33 50.49 53.40 56.48 59.76 63.28 65.77 68.26 70.75 73.24 75.73 75.73 75.73 75.7330 35.28 37.27 39.41 41.73 44.25 47.00 50.00 52.24 55.24 58.43 61.82 65.47 68.04 70.61 73.19 75.77 78.34 78.34 78.34 78.3431 38.51 40.72 43.12 45.73 48.56 51.67 53.98 57.08 60.38 63.88 67.65 70.31 72.97 75.63 78.29 80.95 80.95 80.95 80.9532 42.04 44.51 47.20 50.13 53.33 55.72 58.92 62.33 65.95 69.83 72.58 75.32 78.07 80.82 83.56 83.56 83.56 83.5633 45.90 48.68 51.69 55.00 57.46 60.76 64.27 68.01 72.01 74.84 77.68 80.51 83.34 86.17 86.17 86.17 86.1734 50.15 53.26 56.67 59.20 62.60 66.22 70.07 74.19 77.11 80.03 82.95 85.87 88.78 88.78 88.78 88.7835 54.83 58.33 60.94 64.45 68.17 72.13 76.38 79.38 82.38 85.39 88.39 91.40 91.40 91.40 91.4036 60.00 62.68 66.29 70.12 74.19 78.56 81.65 84.74 87.83 90.92 94.01 94.01 94.01 94.0137 64.42 68.13 72.06 76.25 80.74 83.92 87.09 90.27 93.44 96.62 96.62 96.62 96.6238 69.97 74.01 78.31 82.92 86.18 89.44 92.71 95.97 99.23 99.23 99.23 99.2339 75.96 80.37 85.11 88.45 91.80 95.15 98.49 100 100 100 10040 82.43 87.29 90.72 94.15 97.59 10041 89.47 92.99 96.51 10042 95.26 98.8643 100

SAN JOAQUIN COUNTY EMPLOYEES’ RETIREMENT ASSOCIATION ACTUARIAL VALUATION REPORT AS OF JANUARY 1, 2016
APPENDIX C – SUMMARY OF PLAN PROVISIONS
63
Table 4: Tier I Safety Members (CERL Section 31664.1)
Service 41 42 43 44 45 46 47 48 49 50 51 52 53 54 5510 30.00 30.00 30.00 30.00 30.00 30.0011 33.00 33.00 33.00 33.00 33.00 33.0012 36.00 36.00 36.00 36.00 36.00 36.0013 39.00 39.00 39.00 39.00 39.00 39.0014 42.00 42.00 42.00 42.00 42.00 42.0015 45.00 45.00 45.00 45.00 45.00 45.0016 48.00 48.00 48.00 48.00 48.00 48.0017 51.00 51.00 51.00 51.00 51.00 51.0018 54.00 54.00 54.00 54.00 54.00 54.0019 57.00 57.00 57.00 57.00 57.00 57.0020 37.55 39.75 42.02 44.38 46.83 49.36 52.07 54.51 57.13 60.00 60.00 60.00 60.00 60.00 60.0021 41.74 44.13 46.6 49.17 51.82 54.67 57.24 59.99 63.00 63.00 63.00 63.00 63.00 63.0022 46.23 48.82 51.51 54.29 57.27 59.96 62.85 66.00 66.00 66.00 66.00 66.00 66.0023 51.04 53.85 56.76 59.88 62.69 65.7 69.00 69.00 69.00 69.00 69.00 69.0024 56.2 59.23 62.48 65.41 68.56 72.00 72.00 72.00 72.00 72.00 72.0025 61.7 65.09 68.14 71.42 75.00 75.00 75.00 75.00 75.00 75.0026 67.69 70.86 74.27 78.00 78.00 78.00 78.00 78.00 78.0027 73.59 77.13 81.00 81.00 81.00 81.00 81.00 81.0028 79.98 84.00 84.00 84.00 84.00 84.00 84.0029 87.00 87.00 87.00 87.00 87.00 87.0030 90.00 90.00 90.00 90.00 90.00 90.0031 93.00 93.00 93.00 93.00 93.00 93.0032 96.00 96.00 96.00 96.00 96.00 96.0033 99.00 99.00 99.00 99.00 99.00 99.0034 100.00 100.00 100.00 100.00 100.00 100.0035 100.00 100.00 100.00 100.00 100.0036 100.00 100.00 100.00 100.0037 100.00 100.00 100.0038 100.00 100.0039 100.00

SAN JOAQUIN COUNTY EMPLOYEES’ RETIREMENT ASSOCIATION ACTUARIAL VALUATION REPORT AS OF JANUARY 1, 2016
APPENDIX C – SUMMARY OF PLAN PROVISIONS
64
Table 5: Tier I Social Security Adjustment
Age at Retirement
General Member
Reduction
Safety Member Reduction
46 $1.372 $2.879 47 $1.449 $3.037 48 $1.533 $3.180 49 $1.623 $3.333 50 $1.721 $3.500 51 $1.828 $3.500 52 $1.944 $3.500 53 $2.031 $3.500 54 $2.148 $3.500 55 $2.272 $3.500 56 $2.404 $3.500 57 $2.546 $3.500 58 $2.646 $3.500 59 $2.746 $3.500 60 $2.846 $3.500 61 $2.946 $3.500 62 $3.046 $3.500 63 $3.046 $3.500 64 $3.046 $3.500 65 $3.046 $3.500
For Tier II General Members, the benefit multiplier is 1% at age 52, increasing by 0.1% for each year of age to 2.5% at 67. For Tier II Safety Members, the benefit multiplier is 2% at age 50, increasing by 0.1% for each year of age to 2.7% at age 57. In between exact ages, the multiplier increases by 0.025% for each quarter year increase in age.
Form of Benefit: The Service Retirement Benefit will be paid monthly beginning at
retirement and for the life of the Member. If the member selects the unmodified benefit form, in the event of the Member’s death, 60% of the benefit will continue for the life of the Member’s spouse, or to the age of majority of dependent minor children if there is no spouse. In the event there is no surviving spouse or minor children, any unpaid remainder of the Member’s accumulated contributions will be paid to the Member’s designated beneficiary.
Actuarially equivalent optional benefit forms are also available.

SAN JOAQUIN COUNTY EMPLOYEES’ RETIREMENT ASSOCIATION ACTUARIAL VALUATION REPORT AS OF JANUARY 1, 2016
APPENDIX C – SUMMARY OF PLAN PROVISIONS
65
Annually on April 1, benefits are adjusted to reflect changes in the CPI for the San Francisco Bay Area. Annual adjustments may not exceed 3%, but changes in CPI in excess of 3% are “banked” and used for future adjustments when changes in CPI are less than 3%.
In addition, ad hoc cost of living adjustments have been granted in the past
and may be granted in the future. A lump sum benefit of $5,000 will be payable upon the death of a retired
member. D. Service-Connected Disability Eligibility: Members are eligible for Service-Connected Disability Retirement
benefits at any age if they are permanently disabled as a result of injuries or illness sustained in the line of duty.
Benefit Amount: The Service-Connected Disability Retirement Benefit payable to Members
is equal to the greater of 50% of their Final Compensation or – if the Member is eligible at disability for a Service Retirement Benefit – the Service Retirement Benefit accrued on the date of disability.
Members who return to work at a different position with lower pay may
receive a Supplemental Disability Allowance that, when added to their new pay, may bring the Member’s total income up to the current pay for his or her position at the time of disability. The Supplemental Disability Allowance may not exceed the Service-Connected Disability Retirement benefit.
Form of Benefit: The Service-Connected Disability Retirement Benefit will be paid
monthly beginning at the effective date of disability retirement and for the life of the Member; in the event of the Member’s death, 100% of the benefit will continue for the life of the Member’s spouse, or to the age of majority of dependent minor children if there is no spouse. In the event there is no surviving spouse or minor children, any unpaid remainder of the Member’s accumulated contributions will be paid to the Member’s designated beneficiary.
Actuarially equivalent optional benefit forms are also available. Annually on April 1, benefits are adjusted to reflect changes in the CPI for
the San Francisco Bay Area. Annual adjustments may not exceed 3%, but changes in CPI in excess of 3% are “banked” and used for future adjustments when changes in CPI are less than 3%.

SAN JOAQUIN COUNTY EMPLOYEES’ RETIREMENT ASSOCIATION ACTUARIAL VALUATION REPORT AS OF JANUARY 1, 2016
APPENDIX C – SUMMARY OF PLAN PROVISIONS
66
In addition, ad hoc cost of living adjustments have been granted in the past and may be granted in the future.
A lump sum benefit of $5,000 will be payable upon the death of a retired
member. E. Nonservice-Connected Disability
Eligibility: Members are eligible for Nonservice-Connected Disability Retirement
benefits if they are permanently disabled at any age after earning five years of Credited Service or after becoming eligible for a deferred vested benefit.
Benefit Amount: The Nonservice-Connected Disability Retirement Benefit payable to
General Members is equal to the greatest of:
• 1.5% of Final Compensation at disability multiplied by years of Credited Service at disability; • 1.5% of Final Compensation at disability multiplied by years of
Credited Service projected to age 65, but not to exceed one-third of Final Compensation; or
• If the Member is eligible at disability for a Service Retirement Benefit, the Service Retirement Benefit accrued on the date of disability.
The Nonservice-Connected Disability Retirement Benefit payable to Safety Members is equal to the greatest of: • 1.8% of Final Compensation at disability multiplied by years of • Credited Service at disability;
1.8% of Final Compensation at disability multiplied by years of Credited Service projected to age 55, but not to exceed one-third of Final Compensation; or
• If the Member is eligible at disability for a Service Retirement Benefit, the Service Retirement Benefit accrued on the date of disability.
Members who return to work at a different position with lower pay may receive a Supplemental Disability Allowance that, when added to their new pay, may bring the Member’s total income up to the current pay for his or her position at the time of disability. The Supplemental Disability Allowance may not exceed the Nonservice-Connected Disability Retirement benefit.

SAN JOAQUIN COUNTY EMPLOYEES’ RETIREMENT ASSOCIATION ACTUARIAL VALUATION REPORT AS OF JANUARY 1, 2016
APPENDIX C – SUMMARY OF PLAN PROVISIONS
67
Form of Benefit: The Nonservice-Connected Disability Retirement Benefit will be paid monthly beginning at the effective date of disability retirement, and for the life of the Member; in the event of the Member’s death, 60% of the benefit will continue for the life of the Member’s spouse or to the age of majority of dependent minor children if there is no spouse. In the event there is no surviving spouse or minor children, any unpaid remainder of the Member’s accumulated contributions will be paid to the Member’s designated beneficiary.
Actuarially equivalent optional benefit forms are also available. Annually on April 1, benefits are adjusted to reflect changes in the CPI for
the San Francisco Bay Area. Annual adjustments may not exceed 3%, but changes in CPI in excess of 3% are “banked” and used for future adjustments when changes in CPI are less than 3%.
In addition, ad hoc cost of living adjustments have been granted in the past
and may be granted in the future. A lump sum benefit of $5,000 will be payable upon the death of a retired
member.
F. Service-Connected Death Eligibility: A Member’s survivors are eligible to receive Service-Connected Death
benefits if the Member’s death resulted from injury or illness sustained in connection with the Member’s duties.
Benefit Amount: The Service-Connected Death benefit payable to a surviving spouse or
minor children will be 50% of the Member’s Final Compensation. In the event the Member’s death was caused by external violence or
physical force, an additional benefit of 25% of the above basic benefit will be paid for the first minor child, 15% for the second, and 10% for the third.
Furthermore, for Safety Members only, there will be an additional lump
sum benefit of 12 months of pay at the time of death. Form of Benefit: The Service-Connected Death Benefit will be paid monthly beginning at
the Member’s death and for the life of the surviving spouse or to the age of majority of dependent minor children if there is no spouse.
Annually on April 1, benefits are adjusted to reflect changes in the CPI for
the San Francisco Bay Area. Annual adjustments may not exceed 3%, but

SAN JOAQUIN COUNTY EMPLOYEES’ RETIREMENT ASSOCIATION ACTUARIAL VALUATION REPORT AS OF JANUARY 1, 2016
APPENDIX C – SUMMARY OF PLAN PROVISIONS
68
changes in CPI in excess of 3% are “banked” and used for future adjustments when changes in CPI are less than 3%.
In addition, ad hoc cost of living adjustments have been granted in the past
and may be granted in the future. G. Nonservice-Connected Death
Eligibility: A Member’s survivors are eligible to receive Nonservice-Connected Death
benefits if the Member’s death arose from causes unrelated to the Member’s duties.
Benefit Amount: In the event the Member had earned fewer than five years of Credited
Service and has no or insufficient reciprocity service from another system, the Nonservice-Connected Death benefit will be a refund of the Member’s accumulated contributions with interest plus a payment of one month of Final Compensation for each year of Credited Service, not to exceed six months.
In the event the Member had earned five or more years of Credited
Service, the Nonservice-Connected Death benefit payable to a surviving spouse or minor children will be 60% of the amount the Member would have received as a Nonservice-Connected Disability Retirement Benefit on the date of death.
Form of Benefit: For Members who had earned fewer than five years of Credited Service at
death, the benefit will be paid as a lump sum. For Members with five or more years of Credited Service, the Nonservice-
Connected Death Benefit will be paid monthly beginning at the Member’s death and for the life of the surviving spouse or to the age of majority of dependent minor children if there is no spouse.
Annually on April 1, benefits are adjusted to reflect changes in the CPI for
the San Francisco Bay Area. Annual adjustments may not exceed 3%, but changes in CPI in excess of 3% are “banked” and used for future adjustments when changes in CPI are less than 3%.
In addition, ad hoc cost of living adjustments have been granted in the past
and may be granted in the future.

SAN JOAQUIN COUNTY EMPLOYEES’ RETIREMENT ASSOCIATION ACTUARIAL VALUATION REPORT AS OF JANUARY 1, 2016
APPENDIX C – SUMMARY OF PLAN PROVISIONS
69
H. Withdrawal Benefit: Eligibility: A Member is eligible for a Withdrawal Benefit upon termination of
employment. Benefit Amount: The Withdrawal Benefit is a refund of the Member’s accumulated
contributions with interest. Upon receipt of the Withdrawal Benefit, the Member forfeits all Credited Service.
Form of Benefit: The Withdrawal Benefit is paid in a lump sum upon election by the
Member.
I. Deferred Vested Benefit: Eligibility: A Member is eligible for a Deferred Vested Benefit upon termination of
employment after earning five years of Credited Service, including reciprocity service from another system. The Member must leave his or her Member Contributions with interest on deposit with the Plan.
Benefit Amount: The Deferred Vested Benefit is computed in the same manner as the
Service Retirement Benefit, but it is based on Credited Service and Final Compensation on the date of termination.
For Tier I Members, Tables 2 and 3 are extended for service under ten
years using benefit multipliers of one-sixtieth per year of Credited Service at age 52 (General) or 3% per year of Credited Service at age 50 (Safety), with adjustments for earlier or later retirement under Sections 31676.14 and 31664.1, respectively, of the County Employees Retirement Law of 1937.
Form of Benefit: The Deferred Vested Benefit will be paid monthly beginning at retirement
and for the life of the Member; in the event of the Member’s death, 60% of the benefit will continue for the life of the Member’s spouse or to the age of majority of dependent minor children if there is no spouse. In the event there is no surviving spouse or minor children, any unpaid remainder of the Member’s accumulated contributions will be paid to the Member’s designated beneficiary.
Actuarially equivalent optional benefit forms are also available. Annually on April 1, benefits are adjusted to reflect changes in the CPI for the San Francisco Bay Area. Annual adjustments may not exceed 3%, but changes in CPI in excess of 3% are “banked” and used for future adjustments when changes in CPI are less than 3%.

SAN JOAQUIN COUNTY EMPLOYEES’ RETIREMENT ASSOCIATION ACTUARIAL VALUATION REPORT AS OF JANUARY 1, 2016
APPENDIX C – SUMMARY OF PLAN PROVISIONS
70
In addition, ad hoc cost of living adjustments have been granted in the past and may be granted in the future. A lump sum benefit of $5,000 will be payable upon the death of a retired member.
J. Reciprocal Benefit:
Eligibility: A Member is eligible for a Reciprocal Benefit upon termination of employment and entry, within a specified period of time, into another retirement system recognized as a reciprocal system by the Plan. In addition, the Member must leave his or her Member Contributions with interest on deposit with the Plan.
Benefit Amount: The Reciprocal Benefit is computed in the same manner as the Service
Retirement Benefit, but it is based on Credited Service on the date of termination and Final Compensation on the date of retirement; Final Compensation is based on the highest of the Compensation earned under this Plan or the reciprocal plan.
Form of Benefit: The Reciprocal Benefit will be paid monthly beginning at retirement and
for the life of the Member; in the event of the Member’s death, 60% of the benefit will continue for the life of the Member’s spouse or to the age of majority of dependent minor children if there is no spouse. In the event there is no surviving spouse or minor children, any unpaid remainder of the Member’s accumulated contributions will be paid to the Member’s designated beneficiary.
Actuarially equivalent optional benefit forms are also available. Annually on April 1, benefits are adjusted to reflect changes in the CPI for
the San Francisco Bay Area. Annual adjustments may not exceed 3%, but changes in CPI in excess of 3% are “banked” and used for future adjustments when changes in CPI are less than 3%.
In addition, ad hoc cost of living adjustments have been granted in the past
and may be granted in the future. A lump sum benefit may be payable upon the death of a retired Member
by the last system under which the Member’s service was covered.

SAN JOAQUIN COUNTY EMPLOYEES’ RETIREMENT ASSOCIATION ACTUARIAL VALUATION REPORT AS OF JANUARY 1, 2016
APPENDIX D – 401(H) REPAYMENT SCHEDULE
71
As of January 1, 2014, a separate amortization layer was established for the repayment of funds originally transferred to a retiree health reserve. This schedule was prepared in compliance with an approved Voluntary Correction Program that SJCERA submitted to the IRS. The original balance of the amortization layer ($48.0 million) is being amortized using the same methodology and assumptions as the UAL - as a level percentage of payroll over a 19-year period - after an initial payment of $19.8 million.
Date Outstanding Balance
Years Remaining
End of Year
Payment1/1/2015 $28,076,169 18 $2,311,593 1/1/2016 $27,870,288 17 $2,385,143 1/1/2017 $27,547,546 16 $2,460,275 1/1/2018 $27,125,789 15 $2,537,774 1/1/2019 $26,595,323 14 $2,617,714 1/1/2020 $25,945,663 13 $2,700,172 1/1/2021 $25,165,470 12 $2,785,227 1/1/2022 $24,242,487 11 $2,872,962 1/1/2023 $23,163,469 10 $2,963,460 1/1/2024 $21,914,105 9 $3,056,809 1/1/2025 $20,478,940 8 $3,153,099 1/1/2026 $18,841,282 7 $3,252,421 1/1/2027 $16,983,116 6 $3,354,873 1/1/2028 $14,884,994 5 $3,460,551 1/1/2029 $12,525,932 4 $3,569,559 1/1/2030 $9,883,292 3 $3,682,000 1/1/2031 $6,932,656 2 $3,797,983 1/1/2032 $3,647,690 1 $3,917,619 1/1/2033 $0 0 $4,041,024

SAN JOAQUIN COUNTY EMPLOYEES’ RETIREMENT ASSOCIATION ACTUARIAL VALUATION REPORT AS OF JANUARY 1, 2016
APPENDIX E – GLOSSARY
72
1. Actuarial Assumptions Assumptions as to the occurrence of future events affecting pension costs such as mortality,
withdrawal, disability, retirement, changes in compensation, and rates of investment return. 2. Actuarial Cost Method A procedure for determining the Actuarial Present Value of pension plan benefits and
expenses and for developing an allocation of such value to each year of service, usually in the form of a Normal Cost and an Actuarial Liability.
3. Actuarial Gain (Loss) The difference between actual experience and that expected based upon a set of Actuarial
Assumptions during the period between two Actuarial Valuation dates, as determined in accordance with a particular Actuarial Cost Method.
4. Actuarial Liability The portion of the Actuarial Present Value of Projected Benefits that will not be paid by
future Normal Costs. It represents the value of the past Normal Costs with interest to the valuation date.
5. Actuarial Present Value (Present Value) The value as of a given date of a future amount or series of payments. The Actuarial Present
Value discounts the payments to the given date at the assumed investment return and includes the probability of the payment being made.
6. Actuarial Valuation The determination, as of a specified date, of the Normal Cost, Actuarial Liability, Actuarial
Value of Assets, and related Actuarial Present Values for a pension plan. 7. Actuarial Value of Assets The value of cash, investments, and other property belonging to a pension plan as used by the
actuary for the purpose of an Actuarial Valuation. The purpose of an Actuarial Value of Assets is to smooth out fluctuations in market values.
8. Actuarially Equivalent Of equal Actuarial Present Value, determined as of a given date, with each value based on
the same set of actuarial assumptions.

SAN JOAQUIN COUNTY EMPLOYEES’ RETIREMENT ASSOCIATION ACTUARIAL VALUATION REPORT AS OF JANUARY 1, 2016
APPENDIX E – GLOSSARY
73
9. Amortization Payment The portion of the pension plan contribution that is designed to pay interest and principal on
the Unfunded Actuarial Liability in order to pay for that liability in a given number of years. 10. Entry Age Normal Actuarial Cost Method A method under which the Actuarial Present Value of the Projected Benefits of each
individual included in an Actuarial Valuation is allocated on a level basis over the earnings of the individual between entry age and assumed exit ages.
11. Funded Ratio The ratio of the Actuarial Value of Assets to the Actuarial Liabilities. The Funded Ratio
shown in this report is not appropriate for assessing the sufficiency of plan assets to cover the estimated cost of settling the plan’s benefit obligations, in the case of a plan termination or other similar action. However, it is an appropriate measure for assessing the need for or the amount of future contributions.
12. Inactive Funded Ratio The ratio of the Inactive Actuarial Liabilities to the total Actuarial Liabilities. The Inactive
Funded Ratio is a measure that shows the minimum funded status needed to pay benefits for all inactive members.
13. Normal Cost That portion of the Actuarial Present Value of pension plan benefits and expenses, which is
allocated to a valuation year by the Actuarial Cost Method. 14. Projected Benefits Those pension plan benefit amounts which are expected to be paid in the future under a
particular set of Actuarial Assumptions, taking into account such items as increases in future compensation and service credits.
15. Unfunded Actuarial Liability The excess of the Actuarial Liability over the Actuarial Value of Assets.
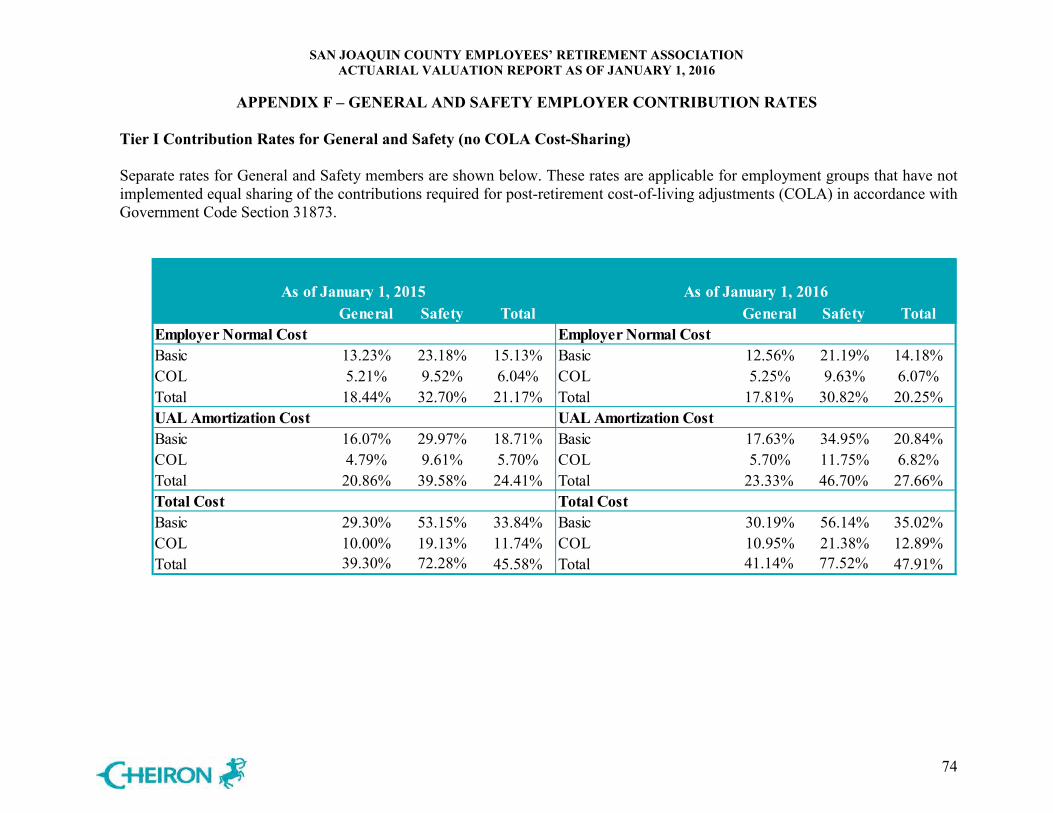
SAN JOAQUIN COUNTY EMPLOYEES’ RETIREMENT ASSOCIATION ACTUARIAL VALUATION REPORT AS OF JANUARY 1, 2016
APPENDIX F – GENERAL AND SAFETY EMPLOYER CONTRIBUTION RATES
74
Tier I Contribution Rates for General and Safety (no COLA Cost-Sharing) Separate rates for General and Safety members are shown below. These rates are applicable for employment groups that have not implemented equal sharing of the contributions required for post-retirement cost-of-living adjustments (COLA) in accordance with Government Code Section 31873.
General Safety Total General Safety TotalEmployer Normal Cost Employer Normal CostBasic 13.23% 23.18% 15.13% Basic 12.56% 21.19% 14.18%COL 5.21% 9.52% 6.04% COL 5.25% 9.63% 6.07%Total 18.44% 32.70% 21.17% Total 17.81% 30.82% 20.25%UAL Amortization Cost UAL Amortization CostBasic 16.07% 29.97% 18.71% Basic 17.63% 34.95% 20.84%COL 4.79% 9.61% 5.70% COL 5.70% 11.75% 6.82%Total 20.86% 39.58% 24.41% Total 23.33% 46.70% 27.66%Total Cost Total CostBasic 29.30% 53.15% 33.84% Basic 30.19% 56.14% 35.02%COL 10.00% 19.13% 11.74% COL 10.95% 21.38% 12.89%Total 39.30% 72.28% 45.58% Total 41.14% 77.52% 47.91%
As of January 1, 2015 As of January 1, 2016

SAN JOAQUIN COUNTY EMPLOYEES’ RETIREMENT ASSOCIATION ACTUARIAL VALUATION REPORT AS OF JANUARY 1, 2016
APPENDIX F – GENERAL AND SAFETY EMPLOYER CONTRIBUTION RATES
75
Tier I Contribution Rates for General and Safety (Employer Cost with additional 14% / 33% Normal Rates by members without COLA Cost-sharing) Separate rates for General and Safety members contributing an additional 14% / 33% of Normal Rates are shown below.
General Safety Total General Safety TotalEmployer Normal Cost Employer Normal CostBasic 12.71% 21.61% 14.41% Basic 12.06% 19.74% 13.50%COL 5.21% 9.52% 6.04% COL 5.25% 9.63% 6.07%Total 17.92% 31.13% 20.45% Total 17.31% 29.37% 19.57%UAL Amortization Cost UAL Amortization CostBasic 16.07% 29.97% 18.71% Basic 17.63% 34.95% 20.84%COL 4.79% 9.61% 5.70% COL 5.70% 11.75% 6.82%Total 20.86% 39.58% 24.41% Total 23.33% 46.70% 27.66%Total Cost Total CostBasic 28.78% 51.58% 33.12% Basic 29.69% 54.69% 34.34%COL 10.00% 19.13% 11.74% COL 10.95% 21.38% 12.89%Total 38.78% 70.71% 44.86% Total 40.64% 76.07% 47.23%
As of January 1, 2015 As of January 1, 2016

SAN JOAQUIN COUNTY EMPLOYEES’ RETIREMENT ASSOCIATION ACTUARIAL VALUATION REPORT AS OF JANUARY 1, 2016
APPENDIX F – GENERAL AND SAFETY EMPLOYER CONTRIBUTION RATES
76
Tier I Contribution Rates for General and Safety (with COLA Cost-sharing) Separate rates for General and Safety members contributing Normal Rates plus COLA Cost-sharing are shown below.
General Safety Total General Safety TotalEmployer Normal Cost Employer Normal CostBasic 13.23% 23.18% 15.13% Basic 12.56% 21.19% 14.18%COL 2.80% 5.06% 3.24% COL 2.72% 5.04% 3.15%Total 16.03% 28.24% 18.37% Total 15.28% 26.23% 17.33%UAL Amortization Cost UAL Amortization CostBasic 16.07% 29.97% 18.71% Basic 17.63% 34.95% 20.84%COL 4.79% 9.61% 5.70% COL 5.70% 11.75% 6.82%Total 20.86% 39.58% 24.41% Total 23.33% 46.70% 27.66%Total Cost Total CostBasic 29.30% 53.15% 33.84% Basic 30.19% 56.14% 35.02%COL 7.59% 14.67% 8.94% COL 8.42% 16.79% 9.97%Total 36.89% 67.82% 42.78% Total 38.61% 72.93% 44.99%
As of January 1, 2015 As of January 1, 2016

SAN JOAQUIN COUNTY EMPLOYEES’ RETIREMENT ASSOCIATION ACTUARIAL VALUATION REPORT AS OF JANUARY 1, 2016
APPENDIX F – GENERAL AND SAFETY EMPLOYER CONTRIBUTION RATES
77
Tier I Contribution Rates for General and Safety (Employer Cost with additional 14% / 33% Normal Rates by members and COLA Cost-sharing) Separate rates for General and Safety members contributing an additional 14% / 33% of Normal Rates and COLA Cost-sharing are shown below.
General Safety Total General Safety TotalEmployer Normal Cost Employer Normal CostBasic 12.71% 21.61% 14.41% Basic 12.06% 19.74% 13.50%COL 2.80% 5.06% 3.24% COL 2.72% 5.04% 3.15%Total 15.51% 26.67% 17.65% Total 14.78% 24.78% 16.65%UAL Amortization Cost UAL Amortization CostBasic 16.07% 29.97% 18.71% Basic 17.63% 34.95% 20.84%COL 4.79% 9.61% 5.70% COL 5.70% 11.75% 6.82%Total 20.86% 39.58% 24.41% Total 23.33% 46.70% 27.66%Total Cost Total CostBasic 28.78% 51.58% 33.12% Basic 29.69% 54.69% 34.34%COL 7.59% 14.67% 8.94% COL 8.42% 16.79% 9.97%Total 36.37% 66.25% 42.06% Total 38.11% 71.48% 44.31%
As of January 1, 2015 As of January 1, 2016
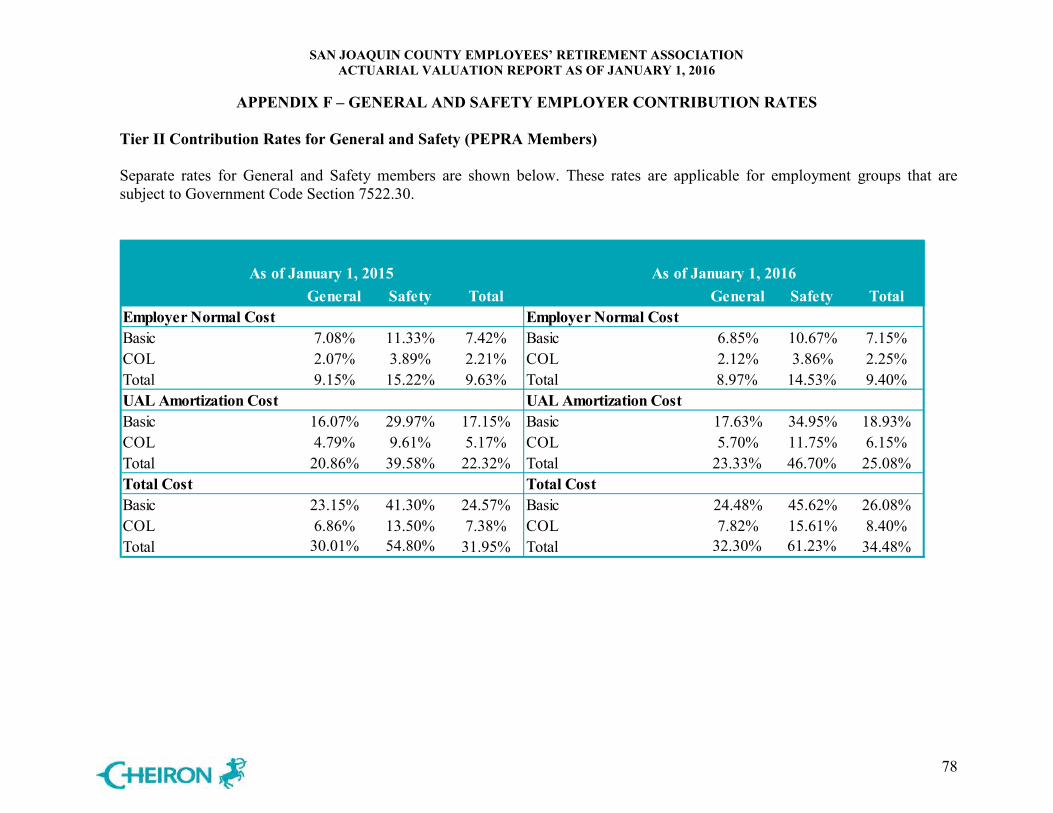
SAN JOAQUIN COUNTY EMPLOYEES’ RETIREMENT ASSOCIATION ACTUARIAL VALUATION REPORT AS OF JANUARY 1, 2016
APPENDIX F – GENERAL AND SAFETY EMPLOYER CONTRIBUTION RATES
78
Tier II Contribution Rates for General and Safety (PEPRA Members) Separate rates for General and Safety members are shown below. These rates are applicable for employment groups that are subject to Government Code Section 7522.30.
General Safety Total General Safety TotalEmployer Normal Cost Employer Normal CostBasic 7.08% 11.33% 7.42% Basic 6.85% 10.67% 7.15%COL 2.07% 3.89% 2.21% COL 2.12% 3.86% 2.25%Total 9.15% 15.22% 9.63% Total 8.97% 14.53% 9.40%UAL Amortization Cost UAL Amortization CostBasic 16.07% 29.97% 17.15% Basic 17.63% 34.95% 18.93%COL 4.79% 9.61% 5.17% COL 5.70% 11.75% 6.15%Total 20.86% 39.58% 22.32% Total 23.33% 46.70% 25.08%Total Cost Total CostBasic 23.15% 41.30% 24.57% Basic 24.48% 45.62% 26.08%COL 6.86% 13.50% 7.38% COL 7.82% 15.61% 8.40%Total 30.01% 54.80% 31.95% Total 32.30% 61.23% 34.48%
As of January 1, 2015 As of January 1, 2016

SAN JOAQUIN COUNTY EMPLOYEES’ RETIREMENT ASSOCIATION ACTUARIAL VALUATION REPORT AS OF JANUARY 1, 2016
APPENDIX G – MEMBER CONTRIBUTION RATES
79
Entry Age 1st $350/month Over $350 1st $350/month Over $350
16 1.71% 2.57% 1.10% 1.65%17 1.71% 2.57% 1.10% 1.65%18 1.71% 2.57% 1.10% 1.65%19 1.71% 2.57% 1.10% 1.65%20 1.71% 2.57% 1.10% 1.65%21 1.75% 2.63% 1.14% 1.71%22 1.80% 2.70% 1.18% 1.77%23 1.85% 2.78% 1.21% 1.82%24 1.90% 2.85% 1.26% 1.89%25 1.94% 2.91% 1.30% 1.95%26 1.98% 2.97% 1.33% 2.00%27 2.03% 3.04% 1.37% 2.06%28 2.07% 3.10% 1.41% 2.11%29 2.11% 3.17% 1.43% 2.15%30 2.16% 3.24% 1.47% 2.20%31 2.20% 3.30% 1.51% 2.27%32 2.25% 3.37% 1.55% 2.32%33 2.30% 3.45% 1.59% 2.38%34 2.35% 3.52% 1.63% 2.44%35 2.39% 3.59% 1.67% 2.50%36 2.45% 3.67% 1.71% 2.57%37 2.50% 3.75% 1.76% 2.64%38 2.55% 3.83% 1.82% 2.73%39 2.61% 3.91% 1.87% 2.81%40 2.66% 3.99% 1.94% 2.91%41 2.72% 4.08% 1.99% 2.99%42 2.78% 4.17% 2.05% 3.08%43 2.84% 4.26% 2.11% 3.16%44 2.91% 4.36% 2.17% 3.26%45 2.97% 4.46% 2.23% 3.35%46 3.05% 4.57% 2.31% 3.46%47 3.12% 4.68% 2.33% 3.50%48 3.19% 4.78% 2.36% 3.54%49 3.25% 4.87% 2.38% 3.57%50 3.31% 4.96% 2.39% 3.58%51 3.34% 5.01% 2.40% 3.60%52 3.35% 5.02% 2.41% 3.61%53 3.34% 5.01% 2.36% 3.54%
54+ 3.31% 4.97% 2.33% 3.50%
Basic Rate COLA Cost-Sharing Rate1
1 Some members and employers share equally the contributions required for post-retirement cost-of-living adjustments (COLA) in accordance with Government Code Section 31873. For other members, the employers pay all of the contributions required for post-retirement COLA.
General Member Contribution RatesBasic Half Rate (Government Code Section 31621.3)

SAN JOAQUIN COUNTY EMPLOYEES’ RETIREMENT ASSOCIATION ACTUARIAL VALUATION REPORT AS OF JANUARY 1, 2016
APPENDIX G – MEMBER CONTRIBUTION RATES
80
Entry Age 1st $350/month Over $350 1st $350/month Over $350
16 1.95% 2.93% 1.10% 1.65%17 1.95% 2.93% 1.10% 1.65%18 1.95% 2.93% 1.10% 1.65%19 1.95% 2.93% 1.10% 1.65%20 1.95% 2.93% 1.10% 1.65%21 2.00% 3.00% 1.14% 1.71%22 2.05% 3.08% 1.18% 1.77%23 2.11% 3.17% 1.21% 1.82%24 2.17% 3.25% 1.26% 1.89%25 2.21% 3.32% 1.30% 1.95%26 2.26% 3.39% 1.34% 2.01%27 2.31% 3.47% 1.37% 2.06%28 2.35% 3.53% 1.41% 2.11%29 2.41% 3.61% 1.44% 2.16%30 2.46% 3.69% 1.47% 2.20%31 2.51% 3.76% 1.51% 2.27%32 2.56% 3.84% 1.55% 2.32%33 2.62% 3.93% 1.59% 2.38%34 2.67% 4.01% 1.63% 2.45%35 2.73% 4.09% 1.67% 2.50%36 2.79% 4.18% 1.71% 2.57%37 2.85% 4.28% 1.76% 2.64%38 2.91% 4.37% 1.82% 2.73%39 2.97% 4.46% 1.87% 2.81%40 3.03% 4.55% 1.94% 2.91%41 3.10% 4.65% 1.99% 2.99%42 3.17% 4.75% 2.05% 3.08%43 3.24% 4.86% 2.11% 3.17%44 3.31% 4.97% 2.17% 3.26%45 3.39% 5.08% 2.24% 3.36%46 3.47% 5.21% 2.31% 3.46%47 3.56% 5.34% 2.33% 3.50%48 3.63% 5.45% 2.36% 3.54%49 3.70% 5.55% 2.38% 3.57%50 3.77% 5.65% 2.39% 3.58%51 3.81% 5.71% 2.40% 3.60%52 3.81% 5.72% 2.41% 3.61%53 3.81% 5.71% 2.37% 3.55%
54+ 3.78% 5.67% 2.33% 3.50%
Basic Rate COLA Cost-Sharing Rate1
1 Some members and employers share equally the contributions required for post-retirement cost-of-living adjustments (COLA) in accordance with Government Code Section 31873. For other members, the employers pay all of the contributions required for post-retirement COLA.
Basic Half Rate (Government Code Section 31621.3) + 14% , not greater than 1/2 Normal Cost
General Member Contribution Rates
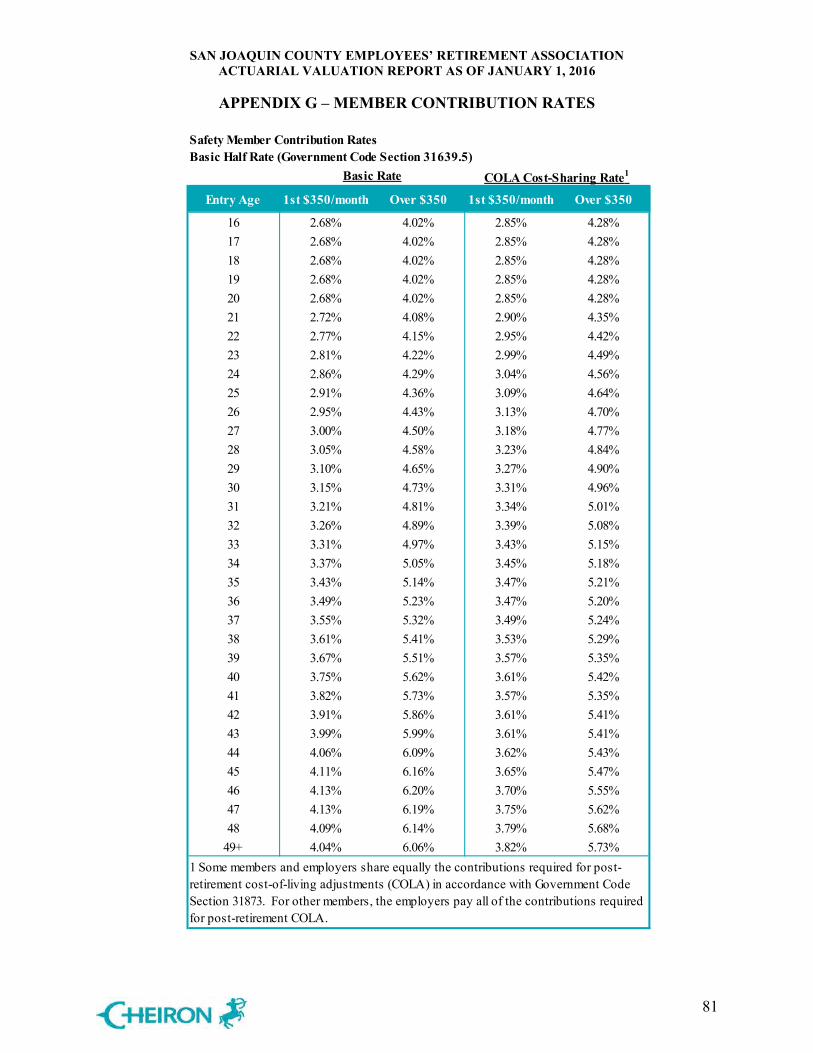
SAN JOAQUIN COUNTY EMPLOYEES’ RETIREMENT ASSOCIATION ACTUARIAL VALUATION REPORT AS OF JANUARY 1, 2016
APPENDIX G – MEMBER CONTRIBUTION RATES
81
Entry Age 1st $350/month Over $350 1st $350/month Over $350
16 2.68% 4.02% 2.85% 4.28%17 2.68% 4.02% 2.85% 4.28%18 2.68% 4.02% 2.85% 4.28%19 2.68% 4.02% 2.85% 4.28%20 2.68% 4.02% 2.85% 4.28%21 2.72% 4.08% 2.90% 4.35%22 2.77% 4.15% 2.95% 4.42%23 2.81% 4.22% 2.99% 4.49%24 2.86% 4.29% 3.04% 4.56%25 2.91% 4.36% 3.09% 4.64%26 2.95% 4.43% 3.13% 4.70%27 3.00% 4.50% 3.18% 4.77%28 3.05% 4.58% 3.23% 4.84%29 3.10% 4.65% 3.27% 4.90%30 3.15% 4.73% 3.31% 4.96%31 3.21% 4.81% 3.34% 5.01%32 3.26% 4.89% 3.39% 5.08%33 3.31% 4.97% 3.43% 5.15%34 3.37% 5.05% 3.45% 5.18%35 3.43% 5.14% 3.47% 5.21%36 3.49% 5.23% 3.47% 5.20%37 3.55% 5.32% 3.49% 5.24%38 3.61% 5.41% 3.53% 5.29%39 3.67% 5.51% 3.57% 5.35%40 3.75% 5.62% 3.61% 5.42%41 3.82% 5.73% 3.57% 5.35%42 3.91% 5.86% 3.61% 5.41%43 3.99% 5.99% 3.61% 5.41%44 4.06% 6.09% 3.62% 5.43%45 4.11% 6.16% 3.65% 5.47%46 4.13% 6.20% 3.70% 5.55%47 4.13% 6.19% 3.75% 5.62%48 4.09% 6.14% 3.79% 5.68%
49+ 4.04% 6.06% 3.82% 5.73%
Safety Member Contribution RatesBasic Half Rate (Government Code Section 31639.5)
Basic Rate COLA Cost-Sharing Rate1
1 Some members and employers share equally the contributions required for post-retirement cost-of-living adjustments (COLA) in accordance with Government Code Section 31873. For other members, the employers pay all of the contributions required for post-retirement COLA.
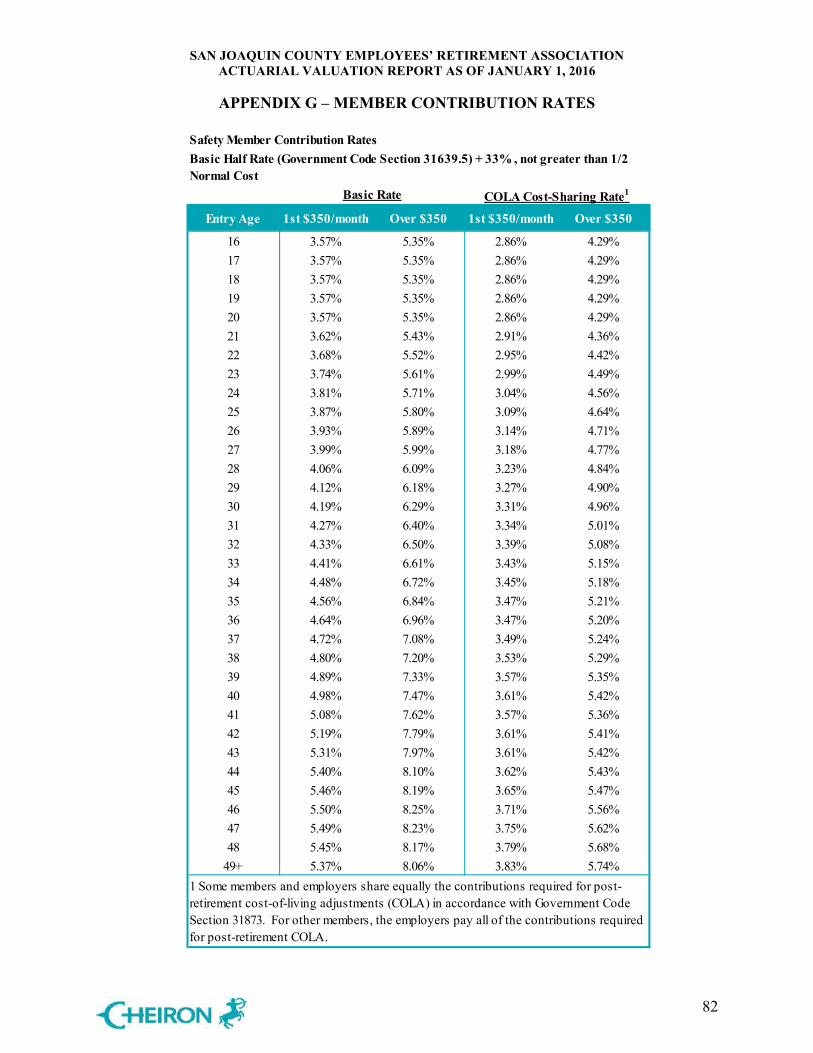
SAN JOAQUIN COUNTY EMPLOYEES’ RETIREMENT ASSOCIATION ACTUARIAL VALUATION REPORT AS OF JANUARY 1, 2016
APPENDIX G – MEMBER CONTRIBUTION RATES
82
Entry Age 1st $350/month Over $350 1st $350/month Over $350
16 3.57% 5.35% 2.86% 4.29%17 3.57% 5.35% 2.86% 4.29%18 3.57% 5.35% 2.86% 4.29%19 3.57% 5.35% 2.86% 4.29%20 3.57% 5.35% 2.86% 4.29%21 3.62% 5.43% 2.91% 4.36%22 3.68% 5.52% 2.95% 4.42%23 3.74% 5.61% 2.99% 4.49%24 3.81% 5.71% 3.04% 4.56%25 3.87% 5.80% 3.09% 4.64%26 3.93% 5.89% 3.14% 4.71%27 3.99% 5.99% 3.18% 4.77%28 4.06% 6.09% 3.23% 4.84%29 4.12% 6.18% 3.27% 4.90%30 4.19% 6.29% 3.31% 4.96%31 4.27% 6.40% 3.34% 5.01%32 4.33% 6.50% 3.39% 5.08%33 4.41% 6.61% 3.43% 5.15%34 4.48% 6.72% 3.45% 5.18%35 4.56% 6.84% 3.47% 5.21%36 4.64% 6.96% 3.47% 5.20%37 4.72% 7.08% 3.49% 5.24%38 4.80% 7.20% 3.53% 5.29%39 4.89% 7.33% 3.57% 5.35%40 4.98% 7.47% 3.61% 5.42%41 5.08% 7.62% 3.57% 5.36%42 5.19% 7.79% 3.61% 5.41%43 5.31% 7.97% 3.61% 5.42%44 5.40% 8.10% 3.62% 5.43%45 5.46% 8.19% 3.65% 5.47%46 5.50% 8.25% 3.71% 5.56%47 5.49% 8.23% 3.75% 5.62%48 5.45% 8.17% 3.79% 5.68%
49+ 5.37% 8.06% 3.83% 5.74%1 Some members and employers share equally the contributions required for post-retirement cost-of-living adjustments (COLA) in accordance with Government Code Section 31873. For other members, the employers pay all of the contributions required for post-retirement COLA.
Safety Member Contribution RatesBasic Half Rate (Government Code Section 31639.5) + 33% , not greater than 1/2 Normal Cost
Basic Rate COLA Cost-Sharing Rate1


Board of Retirement Financial Meeting San Joaquin County Employees’ Retirement Association
Agenda Item 4.02 September 23, 2016 SUBJECT: Raven Capital Management Agreement to Repurchase 25% Equity
Stake SUBMITTED FOR: _X_ CONSENT l___l ACTION ___ INFORMATION RECOMMENDATION Staff recommends the Board approve Raven Capital Management LLC’s agreement to repurchase the 25% equity stake of its minority owner, Northern Lights. PURPOSE To provide SJCERA’s consent to the repurchase agreement as a limited partner in two funds sponsored by Raven. DISCUSSION Northern Lights is currently presumed to have a controlling interest in Raven Capital Management due to its 25.0% ownership in the firm. This transaction would result in a “Change of Control” under the U.S. Investment Advisors Act of 1940 and will constitute an assignment under the Advisors Act. An assignment requires the consent of 75.0% of the limited partners in each of Raven Asset-Base Opportunity Funds I, II, and III. SJCERA is a limited partner in Funds II and III. In 2009, Northern Lights acquired its minority stake in Raven Capital Management LLC and provided operating capital to facilitate operations while Raven was fund raising. Upon completion of the assignment, Raven Capital Management LLC will be wholly owned by its principals and employees. ATTACHMENTS Raven Capital Management letter to limited partners dated September 15, 2016
__________________________ __________________________ NANCY CALKINS ANNETTE ST. URBAIN Chief Investment Officer Chief Executive Officer
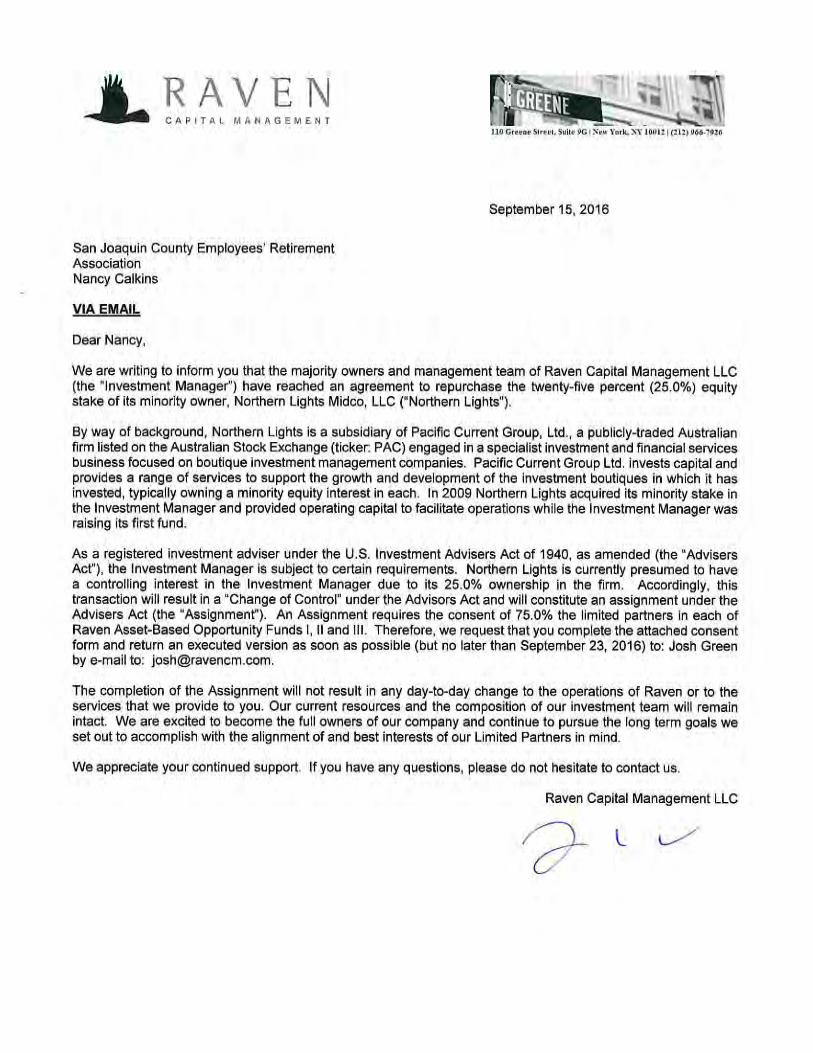

X
Michael Restuccia, Chair Board of Retirement
September 23, 2016

Marilyn R. Freeman
Elizabeth A. Knope
Glenn A. Kleczka – InView
Capital Prospects LLC
San Joaquin County Employees’ Retirement Association
Small Cap Value Emerging Manager
Program Review
September 23, 2016

1
Capital Prospects LLC
Ø Formed October, 2002
Ø SEC Registered Investment Adviser
Ø 100% women-owned and controlled; Principals each own 50%
Ø Focus on emerging manager-of-managers investment programs
• Area of specialty for both partners since 1992 • Built emerging business to approximately $2.0 billion and 8 key clients at previous employer
Ø CP specializes in domestic emerging managers and minority/woman-owned managers
Ø AUM as of July 31, 2016: $1,177 million; 6 client relationships
– Russell 3000 $366 million, 2 accounts – Russell 2500 $ 41 million, 1 account – Russell 2000 Value $166 million, 2 accounts – Russell 2000 $140 million, 3 accounts – Russell 3000/Barclays Intermediate Aggregate $464 million, 1 account

Bernzott $9,927 12.6 %Channing 18,570 23.6InView 18,127 23.1Keeley 9,760 12.4Pacific Ridge 11,950 15.2
Walthausen 10,265 13.1Total Fund $78,600 100.0 %
Total Portfolio ($000)
% of Assets
2
San Joaquin County Employees’ Retirement Association Small Cap Value Emerging Manager Program
Ø Funding date 7/3/06: $45 million
Ø Cash withdrawal 3/1/11: $5 million
Ø Cash withdrawal 12/21/15: $5 million
Ø Cash withdrawal 3/30/16: $4 million
Ø Current value 7/31/16: $79 million
Ø Manager changes/rebalancing
• March, 2008 – replaced Denali (terminated) with Ten
• October, 2010 – added Walthausen, funded as part of a rebalancing
• June, 2013 – transitioned Ten to Haber Trilix, retaining same portfolio manager
• November, 2013 – replaced Haber Trilix (firm closed) with Pacific Ridge

% Total
# Holdings
Wtd. Avg. Mkt. Cap ($B)
Forecast P/E
Price/Book
Forecast Growth (%)
Yield (%)
Bernzott 13.0 % 29 $ 2.3 16.1 x 2.8 x 11.9 % 1.6 % Channing 23.6 39 2.6 16.4 2.2 10.4 1.9 InView 22.9 53 2.5 12.4 1.8 8.3 3.0 Keeley 12.5 60 2.5 17.5 2.0 11.3 2.0 Walthausen 13.0 81 1.0 15.2 1.8 13.3 1.7 Pacific Ridge 15.0 72 0.2 15.4 1.5 12.8 1.2 Total Portfolio 100.0 % 307 $ 2.0 15.1 x 2.0 x 10.8 % 2.0 % Russell 2000 Value 1,361 $ 1.6 15.0 x 1.5 x 9.7 % 2.3 %
3
San Joaquin County Employees’ Retirement Association Equity Investment Characteristics – 6/30/16
• All managers employ varying degrees of quantitative, fundamental and technical analysis: objective is to achieve a balanced mix
• “Core” position (60%) combines Channing’s and InView’s intrinsic value focus on currently undervalued, high quality
companies with improving outlooks with a dedicated micro cap allocation to Pacific Ridge • Remaining 40% more “eclectic”
– Bernzott: Long term support from dividend/earnings growth plus critical assessment of management – Keeley: Restructuring-driven change (ownership; operating; balance sheet; marketplace) – Walthausen: Cash flow generation; value creation strategies
• Resulting portfolio: – Well-diversified – Historically tilted toward higher quality – PEG ratio (on forecast growth and p/e) at a 10% discount to the benchmark – Moderate risk level (forecast tracking error of 2.63)
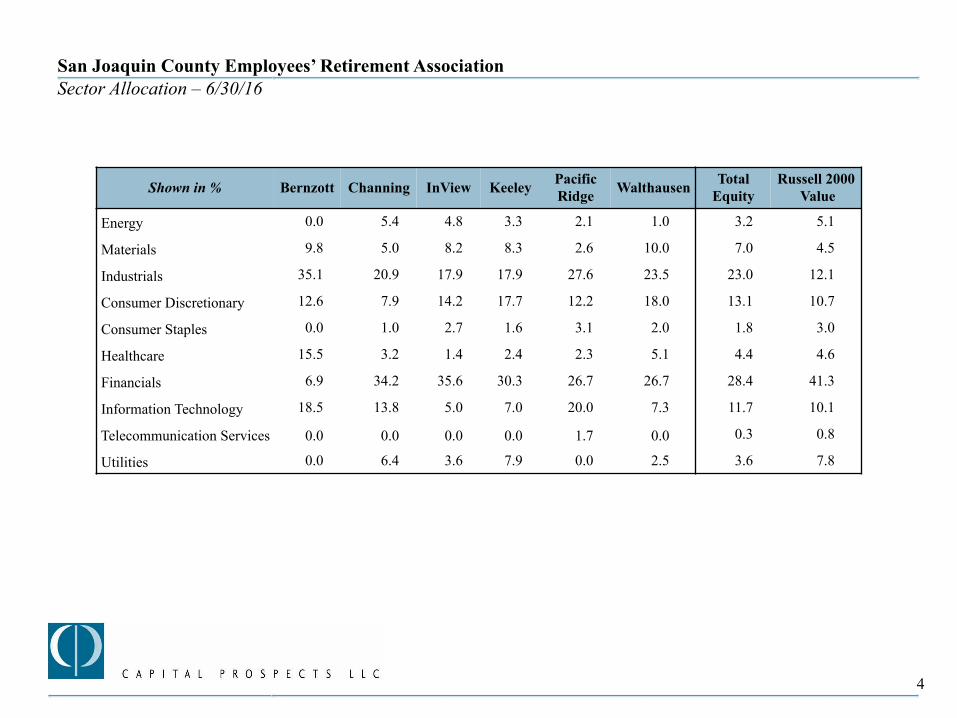
4
San Joaquin County Employees’ Retirement Association Sector Allocation – 6/30/16
Shown in % Bernzott Channing InView Keeley Pacific Ridge Walthausen Total
Equity Russell 2000
Value
Energy 0.0 5.4 4.8 3.3 2.1 1.0 3.2 5.1
Materials 9.8 5.0 8.2 8.3 2.6 10.0 7.0 4.5
Industrials 35.1 20.9 17.9 17.9 27.6 23.5 23.0 12.1
Consumer Discretionary 12.6 7.9 14.2 17.7 12.2 18.0 13.1 10.7
Consumer Staples 0.0 1.0 2.7 1.6 3.1 2.0 1.8 3.0
Healthcare 15.5 3.2 1.4 2.4 2.3 5.1 4.4 4.6
Financials 6.9 34.2 35.6 30.3 26.7 26.7 28.4 41.3
Information Technology 18.5 13.8 5.0 7.0 20.0 7.3 11.7 10.1
Telecommunication Services 0.0 0.0 0.0 0.0 1.7 0.0 0.3 0.8
Utilities 0.0 6.4 3.6 7.9 0.0 2.5 3.6 7.8
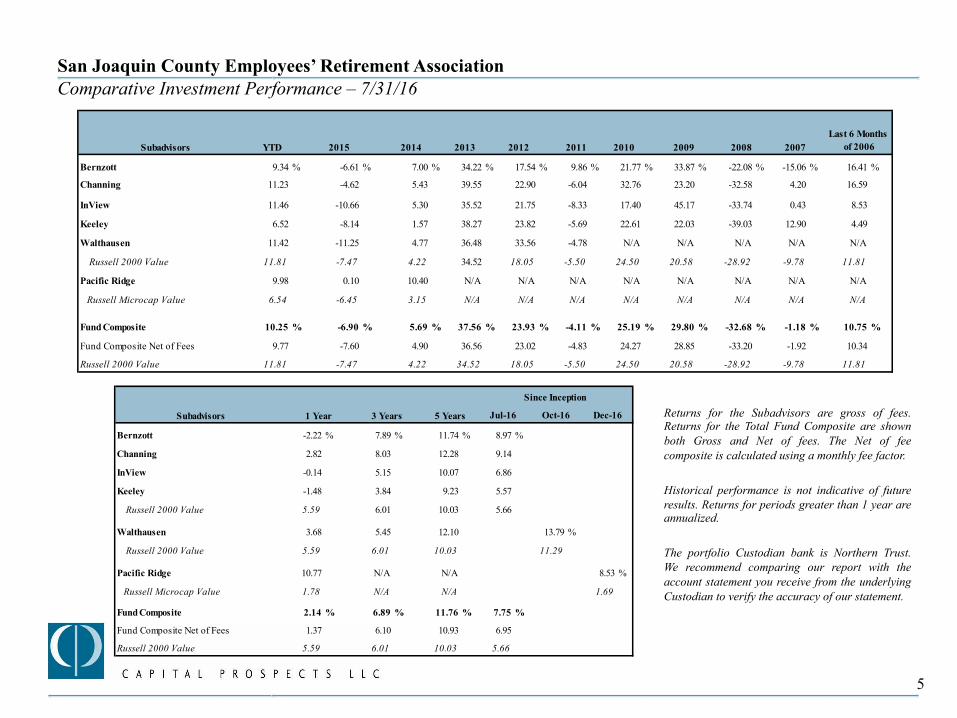
Returns for the Subadvisors are gross of fees. Returns for the Total Fund Composite are shown both Gross and Net of fees. The Net of fee composite is calculated using a monthly fee factor. Historical performance is not indicative of future results. Returns for periods greater than 1 year are annualized. The portfolio Custodian bank is Northern Trust. We recommend comparing our report with the account statement you receive from the underlying Custodian to verify the accuracy of our statement.
5
San Joaquin County Employees’ Retirement Association Comparative Investment Performance – 7/31/16
Subadvisors YTD 2015 2014 2013 2012 2011 2010 2009 2008 2007
Bernzott 9.34 % -6.61 % 7.00 % 34.22 % 17.54 % 9.86 % 21.77 % 33.87 % -22.08 % -15.06 % 16.41 %
Channing 11.23 -4.62 5.43 39.55 22.90 -6.04 32.76 23.20 -32.58 4.20 16.59
InView 11.46 -10.66 5.30 35.52 21.75 -8.33 17.40 45.17 -33.74 0.43 8.53
Keeley 6.52 -8.14 1.57 38.27 23.82 -5.69 22.61 22.03 -39.03 12.90 4.49
Walthausen 11.42 -11.25 4.77 36.48 33.56 -4.78 N/A N/A N/A N/A N/A
Russell 2000 Value 11.81 -7.47 4.22 34.52 18.05 -5.50 24.50 20.58 -28.92 -9.78 11.81
Pacific Ridge 9.98 0.10 10.40 N/A N/A N/A N/A N/A N/A N/A N/A
Russell Microcap Value 6.54 -6.45 3.15 N/A N/A N/A N/A N/A N/A N/A N/A
Fund Composite 10.25 % -6.90 % 5.69 % 37.56 % 23.93 % -4.11 % 25.19 % 29.80 % -32.68 % -1.18 % 10.75 %
Fund Composite Net of Fees 9.77 -7.60 4.90 36.56 23.02 -4.83 24.27 28.85 -33.20 -1.92 10.34
Russell 2000 Value 11.81 -7.47 4.22 34.52 18.05 -5.50 24.50 20.58 -28.92 -9.78 11.81
Last 6 Months of 2006
Bernzott -2.22 % 7.89 % 11.74 % 8.97 %
Channing 2.82 8.03 12.28 9.14
InView -0.14 5.15 10.07 6.86
Keeley -1.48 3.84 9.23 5.57
Russell 2000 Value 5.59 6.01 10.03 5.66
Walthausen 3.68 5.45 12.10 13.79 %
Russell 2000 Value 5.59 6.01 10.03 11.29
Pacific Ridge 10.77 N/A N/A 8.53 %
Russell Microcap Value 1.78 N/A N/A 1.69
Fund Composite 2.14 % 6.89 % 11.76 % 7.75 %
Fund Composite Net of Fees 1.37 6.10 10.93 6.95
Russell 2000 Value 5.59 6.01 10.03 5.66
Subadvisors 1 Year 3 Years 5 Years
Since Inception
Oct-16 Dec-16Jul-16

6
San Joaquin County Employees’ Retirement Association Comparative Investment Performance – Overall Comments
• The investment program began (mid-year 2006) during a time of uncertainty over the direction of the economy and increased volatility preceding the severe contraction covering late 2007 through early 2009 that accompanied the financial crisis and economic recession. The market turned sharply upward starting in March 2009 but was dominated for the next year by lower price, lower quality stocks at the expense of more fundamentally strong companies. From early 2010 until towards the end of 2012, the market – while positive on balance – see-sawed between optimism and pessimism driven by views on the sustainability of the U.S. economic recovery, slowing growth in emerging markets, financial crises in European economies and challenging fiscal issues globally, with investors exhibiting a commensurately variable appetite for risk taking (“risk-on/risk-off”) as opinions shifted. Building confidence in the sustainability of the economic recovery and less attention on macro factors supported a strong market in 2013, and one that was more amenable to rewarding stock selection, but that “normalization” was not sustained. Since the start of 2014, the markets have again shifted between optimism and pessimism, seen spikes in volatility, favored defensiveness but at other time momentum and growth, experienced significant downturns/corrections (Aug/Sept 2015; Dec 2015/Jan 2016 for the Russell 2000 Value) and produced a very challenging environment for active managers.
• Over the 10 years 1 month since inception (through July 2016), the Fund outperformed the benchmark by 210 basis points
annualized. Stock selection accounted for essentially all the value added and was favorable across all the sectors. Sector positioning was neutral on balance. Stock selection and underweighting financials were key positives, followed by stock selection in industrials, technology and energy. From a risk model perspective, factor positioning has been relatively neutral more recently with positives from favoring higher price/book, lower relative strength and higher beta positioning largely offset by tilts toward lower p/e and dividend yield and higher earnings growth, debt/equity and price volatility. Over time, tilts toward higher market capitalization (relative to the benchmark) and lower dividend yield have been detractors of note.
• Since inception, the managers currently in the program have performed well with all but Keeley (who is in line) well ahead of
their benchmarks. We are pleased with this performance and expect value added from each of the managers over the longer term, but we anticipate there will be some periods of weak relative performance for individual managers as well as for the composite. We continue to have confidence in each of the managers in the investment program.

InView Investments 230 East Ohio Street, Suite 104, Chicago, Illinois 60611 Copyright © 2006 - 2016 InView Investments
SJCERA September 23, 2016
Presented by Glenn A. Kleczka, CFA
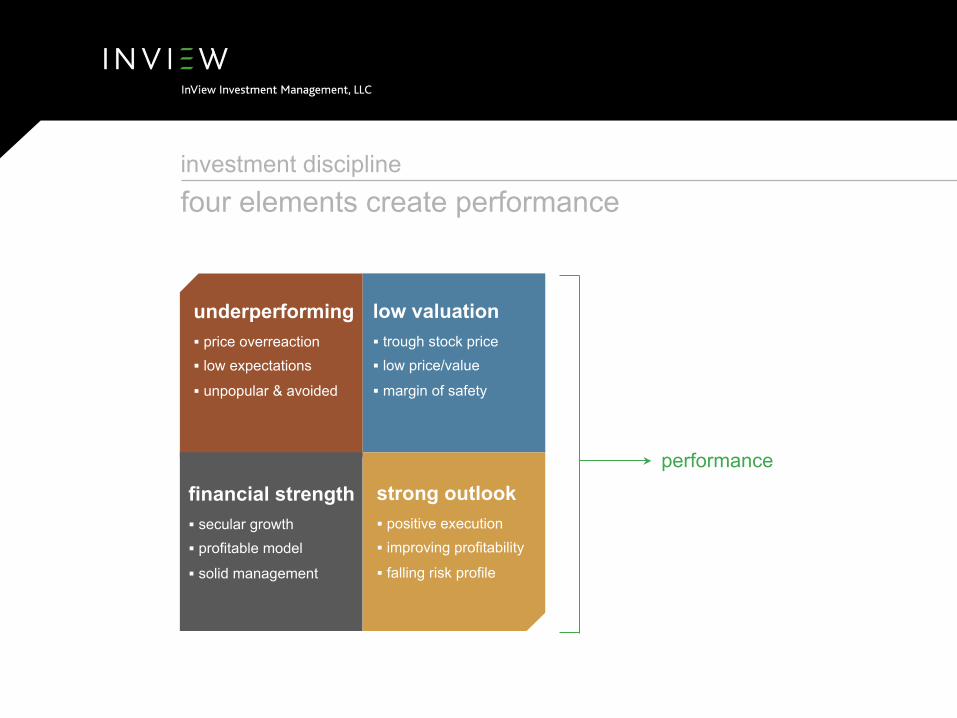
performance
investment discipline four elements create performance
underperforming § price overreaction § low expectations
§ unpopular & avoided
low valuation § trough stock price § low price/value
§ margin of safety
strong outlook § positive execution § improving profitability
§ falling risk profile
financial strength § secular growth § profitable model
§ solid management

sjcera small value portfolio (inception to 09.06.16) returns
7.7%
-6.8%
15.8%
7.2%5.7%
-0.3%
15.4%
5.9%
-10%
-5%
0%
5%
10%
15%
20%
inception to 07.31.15 08.01.15 - 11.30.15 ytd to 09.06.16 inception to 09.06.16
sjcera (gross)
russell 2000® value
Value Add is the respective period gross less the period Russell 2000 Value return expressed in basis points. One basis point is equal to 1/100th of 1%. Periods greater than 1-year are annualized returns. All dividends and earnings were reinvested. Actual results may be better or worse than portrayed. Material market or economic conditions may affect results. All investments carry some level of risk. Financial markets are unpredictable and future performance cannot be guaranteed. Past performance is no guarantee of future results. Request Disclosures for further important information regarding InView’s investment performance.
Value Add
Gross 200 bpts (645) bpts 46 bpts 125 bpts

biography
Glenn A. Kleczka, CFA Managing Director Glenn founded InView in 2003. He is Portfolio Manager for the firm’s domestic and global portfolios. Previously, he built highly successful Value practices and billion-dollar funds at two Chicago-based asset management firms. He was a Founding Partner in 1989 in Brinson Partners, Inc. (now UBS Global Asset Management, Americas Inc.) where he worked in the Private Markets (Venture Capital) and U.S. Equities Groups. He was co-manager of the Post-Venture Portfolio through 1996, an institutional Small Value portfolio that invested in public small cap equity of which a portion were venture-backed ("Post-Venture stocks"). He was a manager on the Venture Capital and the Multi-Asset Portfolio (MAP) investment committees which managed all venture capital investments and the MAP institutional portfolios. From 1997 through 2002 Glenn founded and led the Value practice in the Investment Management Services group of William Blair & Company, LLC. He was Lead Manager of the Small Value portfolios and Value Discovery mutual fund. The mutual fund was a 5-Star Morningstar-rated fund and won Mutual Funds Best in Class Award for 2001. He was named a finalist for Morningstar Manager of the Year in 2002. Education B.S. Finance and Marketing, Marquette University M.S. Finance, Investment sand Banking, and Center for Applied Security Analysis Program, University of Wisconsin Member CFA Institute, Investment Analysts Society of Chicago

Appendix

12
Client
Total Plan (12/15)
(billions)
CP Allocation (6/16)
(millions)
Benchmark
Funding Date
1 $ 155.1 $ 210.4 Russell 3000 & Russell 2000
12/2007 (small cap 6/2012)
2 43.7 446.1 Blended Broad Equity & Barclays Intermediate 12/2008
3 28.1 275.0 Russell 3000 9/2005
4 2.4 74.6 Russell 2000 Value 7/2006
5 1.8 (9/14) 83.1 Russell 2000 Value 1/2009
6 2.2 39.2 Russell 2500 1/2016
Capital Prospects LLC – Client Profile

Capital Prospects LLC - Organizational Chart
Marilyn R. Freeman Principal & Manager
Elizabeth A. Knope Principal & Manager, EEO Officer
Compliance Accounting FINRA Administration Lead Business Development/Client Service Support Investment Manager Research/Program Management
Manager Database Administrator Lead Investment Manager Research/Program Management Support Business Development Human Resources
Claudia L. Lupinacci Sr. Client Service/Operations Associate
Joan R. Cueni Sr. Research/Operations Associate
Operations/Client Contact Support Business Development Support Investment Manager Research/Program Management
Operations/Client Contact Support Investment Manager Research/Program Management Support Business Development
Market/Program Analysis Support Investment Manager Research/Program Management Support Business Development
External Resources: Network Support Co. – IT Consultant Finn Dixon & Herling – Counsel R.L. DePanfilis & Co. – Accountant U.S.I. – Insurance First County – Bank
Karen Mair Sr. Research Associate
Name Title/Role Yr Joined # Yr Exp. Education/Certifications Marilyn R. Freeman Principal & Manager, CCO 2001 35+ BA, MBA Elizabeth A. Knope Principal & Manager, EEO 2002 40+ BA, MBA, CFA Karen A. Mair Sr. Research Associate 2012 18 BA, MBA Joan R. Cueni Sr. Research/Operations Associate 2004 17 BS Claudia L. Lupinacci Sr. Client Service/Operations Associate 2006 17 BA
13

14
Marilyn R. Freeman 35+ years investment experience * Principal and Manager, Capital Prospects LLC B.A. State University of NY at Stony Brook * EVP & Director of Client Service, Northern Trust Global Advisors, Inc. M.B.A. University of Connecticut
and predecessor firm RCB International, Inc. * Partner and Managing Director, Rogers, Casey & Barksdale, Inc. * Member of The Greenwich Roundtable Elizabeth A. Knope, CFA 40+ years investment experience * Principal and Manager, Capital Prospects LLC B.A. Skidmore College * EVP & Director of U.S. Investment Research, Northern Trust Global Advisors, Inc. M.B.A. Boston University
and predecessor firm RCB International, Inc. * Partner and Managing Director, Rogers, Casey & Barksdale, Inc. * Manager, Pension Fund Planning & Analysis, AT&T and New England Telephone * Investment Analyst, The Boston Company, Inc. Karen A. Mair 18+ years investment experience * Sr. Research Associate, Capital Prospects LLC B.A. Trinity College * Director, Private Banking & Investments Group, Merrill Lynch & Co. M.A. Harvard University * Senior Risk Manager, Engelhard Corporation * Senior Financial Analyst, Federal Reserve Bank of NY Joan R. Cueni 17+ years investment experience * Sr. Research/Operations Associate, Capital Prospects LLC B.S. Iona College * Research Assistant, HEI Hospitality * Jr. Analyst, Northern Trust Global Advisors, Inc. Claudia L. Lupinacci 17+ years investment experience * Sr. Client Service/Operations Associate, Capital Prospects LLC B.A. Pace University * Sr. Analyst, Client Services Team Leader, Northern Trust Global Advisors, Inc. * Staff Accountant, J.S. Karlton Company, Inc.
Capital Prospects LLC

Research Universe
Ø Specialized focus on domestic emerging managers – over 30 years experience evaluating/funding emerging firms
Ø “Emerging” is a client-defined term – the resulting candidate universe is dynamic. We extend coverage to:
§ More recently established investment firms § Established firms newly entering the institutional arena § Emerging talent/products within larger organizations on an opportunistic basis
Ø We monitor established as well as emerging minority- and woman-owned investment firms
Ø “Focus List” of generally 170-180 firms includes those subject to more extensive research/monitoring and those currently funded; secondary list of firms (currently numbers 140) are either very early on in the research process or those still monitored but of less interest
15

Investment Strategy and Objectives
Ø Primary investment program goal is to add value over the chosen benchmark within acceptable risk parameters
§ Benchmark, risk tolerances and return expectations determined in conjunction with client
Ø Manager research focuses on identifying investment managers able to develop unique insights/strategies, who have solid implementation processes that prospectively give them a performance advantage
Ø Investment program construction keys off the profile and dynamics of the benchmark. We engineer the manager mix so that the overall program will be:
§ Tailored to risk specifications § Well-diversified § Benchmark “style” neutral
Ø At every step, judgments are developed based upon an assessment of both qualitative and quantitative factors
Ø Value added results in part from our construction decisions but is primarily expected to come from the active decisions of the individual managers in terms of:
§ Security selection § Sector/industry bets § Investment/economic themes § Risk factor exposures
16

Investment Process
Identify Manager Candidates
Identification
Due Diligence
Ongoing Monitoring
Test Manager Combinations
Develop Client Program Parameters
Manager Changes/Rebalancing
Focus
List
Manager Research Effort Decision Making Process
Select Manager Mix
Investment Program Management
17

Ongoing Manager Research and Evaluation
• Identify managers of interest
- Managers contacting us - Our networking - Conferences - Trade press articles - Database analysis
• Review background material
- Firm profile/history - People - Investment philosophy and process - Performance
• Interviews with key professionals
- Including on-site meetings
• Quantitative assessment
- Portfolio characteristics - Performance history
• Reference checks
Investment Process
Research Focus List
18

Manager Evaluation
Qualitative Factors
Ø Organization
§ History/development of firm, business profile, financial resources, growth plans § Investment professionals’ backgrounds/experience, commitment § Strength of support structure and operational/administrative controls § Any regulatory issues
Ø Investment philosophy and process
§ Thoroughness and depth § Caliber of research effort and adequacy of resources § Flexibility of thought process § Effectiveness of implementation – buy and sell disciplines, trading § Consistency of characteristics with style § Potential to add value / “uniqueness” versus peers
Quantitative Factors
Ø Portfolio characteristics and risk factor exposures § Consistency over time and with style
Ø Risk profile § Diversification characteristics, volatility measures, tracking error
Ø Historical performance comparisons § Versus benchmark, peers, style and in different market environments
Ø Value added expectations
19
Investment Program Management
Investment Program Management
Ø Define parameters of client program
§ Investment objectives § Manager qualifications § Benchmark § Risk and return expectations
Ø Develop manager candidate list (from Research Focus List)
Ø Program construction
§ Test manager combinations for optimal mix versus benchmark
• Diversification • Risk profile • Value added potential
Ø Ongoing monitoring
§ Results versus selection criteria § Performance analysis and attribution
Ø Program rebalancing; manager changes/graduation
§ Rebalance to original style, capitalization and specific manager allocations periodically § Terminations typically result from adverse firm developments, inconsistent strategy, excessive asset growth, undesirable
volatility or persistent underperformance § Graduation policy set in conjunction with the client - in our view, these may be case-by-case decisions driven by
expected value-added potential
20

Analytic Systems Process
Ø Investment Metrics & Northfield U.S. Fundamental Equity Risk Model
• Individual manager portfolio holdings from custodian (live accounts) or portfolio files from managers
• Portfolios scaled to initial target weights (subjective)
• Composite portfolio created; output analyzed relative to goals
• Judgment as to changes to test to move composite to goal
• Rescale portfolios and repeat process
• Individual manager return streams calculated in PARIS
• Composite returns created
• Risk analytics run; assessment of results
• If necessary re-weight composite and repeat process
21

Resource Commitment
Ø Continued due diligence on vendors of analytical systems to support our manager research, investment program management and client service requirements
Ø Currently have agreements in place with:
• eVestment Manager database: Manager profiles, performance, returns-based analytics, peer group comparisons
• Investment Metrics
- PARIS Returns-based analytics: Performance and risk analytics
• Northfield Fundamental analytics: Risk model, portfolio analytics, holdings- based performance attribution
• FTSE Russell Index Data: Russell Index constituent data and analytics
Ø We are committed to acquiring additional tools, as we identify them, that we believe will enhance our ability to deliver a consistently superior investment product
22

San Joaquin County Employees’ Retirement Association Sub-Manager Firm Descriptions
23
Bernzott Capital Advisors Camarillo, CA Kevin Bernzott Majority-Owned Style: Small Cap Value 6/30/16 AUM:$564MM Benchmark: Russell 2000 Value
Bernzott focuses on identifying stable, sustainable long term returns through extensive evaluation of value metrics and company management. Initially, screens are applied targeting companies with consecutive ten year periods of accelerating earnings and/or dividend growth. Additional ratios are applied to develop a select list of companies with attractive value characteristics. Key to the process is extensive discussion with top management, which enables Bernzott to determine their opinion as to the true worth of the underlying business. Buy prices are carefully determined to minimize downside risk.
Channing Capital Management
Chicago, IL
Eric T. McKissack, Wendell E. Mackey African-American Style: Small Cap Value 6/30/16 AUM:$2,427MM Benchmark: Russell 2000 Value
Channing utilizes a fundamental, bottom up value approach that focuses on undervalued and neglected stocks (i.e., companies trading at a 40% or greater discount to their intrinsic value) that have improving returns and attractive growth opportunities. Screening disciplines focus on numerous variables, including cash flow multiples, earnings multiples, return on equity, return on capital and earnings growth rates. Companies of interest are high quality with strong management teams and have leading market positions or competitive advantages that will drive future earnings and cash flow growth but which are currently misunderstood and underfollowed by Wall Street. Extensive fundamental research conducted in-house is a hallmark of Channing’s approach. Valuation disciplines focus on p/e and cash flow ratios and are examined relative to history, peers, growth rate, overall market and in light of the current stage in the business cycle.

San Joaquin County Employees’ Retirement Association Sub-Manager Firm Descriptions
24
InView Investment Management Chicago, IL Glen Kleczka Majority-Owned Style: Small Cap Value 6/30/16 AUM:$69MM Benchmark: Russell 2000 Value
InView’s investment process starts with the premise that equity prices systematically overreact to transitory psychology or events without regard to long term outlook or intrinsic value but do trend toward intrinsic value over time. Through quantitative screens they identify such companies displaying price/value disparities that are also good businesses with solid managements, favorable outlooks and improving financials. Fundamental research delves further into management’s strength. Models are produced to develop InView’s opinion as to intrinsic value and normalized earnings power, revealing the most attractive opportunities relative to current price.
Keeley Asset Management Chicago, IL Kevin Chin Majority-Owned Style: Small Cap Value 6/30/16 AUM:$2,596MM Benchmark: Russell 2000 Value
The investment strategy focuses on restructuring-driven change and seeks to identify underfollowed/misunderstood companies that are undervalued but have catalysts that as they are realized can drive long term appreciation. Restructuring opportunities include companies undergoing ownership changes (spif-offs, divestitures, de-mutualizations), operating changes (new management, cost reduction, mergers & acquisitions), capital restructuring (refinancings, capital reallocations, emergence from bankruptcy), and marketplace shifts (regulatory changes, industry consolidations). Stocks of companies in those categories traditionally trade early on at discounts to inherent market value, and opportunities exist for a move to premium valuations as successful management of these typically focused businesses becomes evident in the marketplace. This is a heavily (and proprietary) research-driven process, focusing on company-by-company analysis.

San Joaquin County Employees’ Retirement Association Sub-Manager Firm Descriptions
25
Pacific Ridge Capital Partners, LLC Lake Oswego, OR Dominic Marshall, Mark Cooper Majority-owned Style: Micro Cap Value 6/30/16 AUM:$224MM Benchmark: Russell Microcap Value
Pacific Ridge’s micro cap value strategy is focused on the smallest and most inefficient segment of the U.S. equity market, consisting of a universe of 2,500 stocks in the $25 to $350 million market cap range. Ongoing quantitative screening includes common valuation metrics (with a focus on free cash flow and asset value), earnings estimate and revision data, profit margin trends, price/volume data, and others that attempt to quantify attractive attributes (such as low institutional ownership, low broker research coverage, high insider ownership, and insider buying activity). Non-quantitative means include management meetings at investor conferences and the firm's offices, broker research and contact with industry analysts. The process is a team process, whereby information and analysis on stocks is shared continually via initial formal analytical write-ups, ongoing maintenance updates, and a free-flow of information between the investment team members.
Walthausen & Co. LLC Clifton Park, NY John B. Walthausen Majority-Owned Style: Small Cap Value 6/30/16 AUM:$1,165MM Benchmark: Russell 2000 Value
Walthausen’s investment approach emphasizes neglected stocks and value on an individual basis relative to the full universe of small cap stocks. The process begins with a scoring process using 12 specific criteria grouped into value, insider sentiment, street enthusiasm, financial strength and relative momentum categories. Top scoring stocks are subject to proprietary fundamental research that looks carefully at management’s historical success in creating value for shareholders, in their ability to generate cash flow going forward and at their opportunities and strategies to enhance future value. Portfolio construction focuses on each holding’s contribution to the overall risk profile.

Le‐ga‐to(adj. & adv.) smooth, connected; without breaks
DEDICATED TO DISCOVERING THE FINEST ENTREPRENEURIAL INVESTMENT MANAGER TALENT
SAN JOAQUIN COUNTY EMPLOYEES'RETIREMENT ASSOCIATION
Board of Retirement Presentation
September 23, 2016
Legato Capital Management, LLC General Office: (415) 821‐8585
111 Pine Street Investment Office: (415) 821‐8586
Suite #1700 Fax: (877) 838‐8304
San Francisco, CA 94111 [email protected]

SJCERA2nd Quarter 2016
Biographical Information
Victor L. [email protected] line: (415) 821-8560Mr. Hymes is the Chief Executive Officer and Chief Investment Officer at Legato Capital Management, LLC, and brings more than30 years of investment experience to these roles. Prior to founding Legato in 2004, he held the positions of Chief Investment Officerand Chief Operating Officer at Cazenave Partners, LLC. Before joining Cazenave Partners, Mr. Hymes spent ten years managinginvestment portfolios for public and corporate pension funds, Taft-Hartley and eleemosynary clients at Scudder, Stevens & Clark,Inc. Early in 2000, following Scudder’s reorganization as Zurich Scudder Investments, Inc., he headed Zurich’s $80 billion NorthAmerican institutional business. Mr. Hymes’ professional career began with nearly a decade of work at Goldman, Sachs & Companyand Kidder, Peabody & Company. He received his undergraduate degree from Oberlin College and holds an MBA from the StanfordUniversity Graduate School of Business. He is a member of the Strategic Advisory Board of the CFA Society of San Francisco and amember of the Board of Trustees of NRDC and the Brookings Institution.
Adam S. Lawlor, [email protected] line: (415) 821-8561Mr. Lawlor is Executive Vice President, Director of Investments and a member of the investment committee at Legato CapitalManagement, LLC. Prior to Legato’s founding in 2004, he held the position of Director of Manager Research at Cazenave Partners,LLC. From 2000 to 2002, Mr. Lawlor directed the Investment Consulting Group at Robertson Stephens. From 1995 to 2000, he wasa member of the Global Manager Research Group at Callan Associates. Mr. Lawlor has 24 years of investment experience. Hereceived his undergraduate degree from the University of Connecticut, Storrs, where he studied business administration. He is amember of both the CFA Institute and the CFA Society of San Francisco.
1

SJCERA2nd Quarter 2016
Firm OverviewAs of June 30, 2016
• Founded in 2004• More than $1.4 billion in AUM• Minority owned firm• 10 employees• More than 80 years of cumulative investment experience*• 100% employee ownership
*Includes members of the investment committee
AUM by Client TypeCLIENT TYPE PRODUCT ASSETS % OF AUM
Public All Cap Core $969 million 67%
Global Opportunities
Small Cap Growth
Foundations & Small Cap Core $285 million 20%Endowments Small Cap Value
Corporate Micro Cap Core $46 million 3%
Insurance Large Cap High Quality Core $125 million 9%
Large Cap High Quality Value
Commingled Fund International Equity $21 million 1%
TOTAL AUM $1,446 million 100%
Legato Team
Investment Research Compliance SupportCommittee Analysts and Legal Associates
3 3 1 3
2

Firm Overview
Legato Management Committee
Danielle R. FreitasExecutive Assistant to the
CEO/CIO
Victor L. HymesCEO & Chief Investment Officer
Investment Management, Research & Operations Administration
Manager Operational, Product DevelopmentProcess and Strategy Implementation
Victor L. Hymes Adam S. Lawlor, CFACo‐Team Leader Co‐Team Leader
Timothy M. ByrdVice President
Diana D. TamhankarVice President
Evan L. WalkerVice President
Compliance OperationsCordium Empaxis
Focus 1 Associates EasyAUM
The names in bold indicate a team member’s area of greatest concentration.
and Compliance Due Diligence
Eric C. Pollack, CPASVP‐Team Leader
Timothy M. ByrdVice President
Evan L. WalkerVice President
Tiffani M. D’AngelicoAssociate
Tax/AuditDeloitte & Touche
Ashland Partners
& Company
Finance, Compliance and Administration
Eric C. Pollack, CPASVP‐Chief Financial Officer &Chief Compliance Officer
Dennis LiAssistant Vice President
Aaron F. PauleAssistant Vice President
Tiffani M. D’AngelicoAssociate
Legal Human ResourcesPillsbury Winthrop Shaw Melita Group
Pittman LLP
Information TechnologyFarella Braun + Martel LLP TekLeap
3
2nd Quarter 2016SJCERA
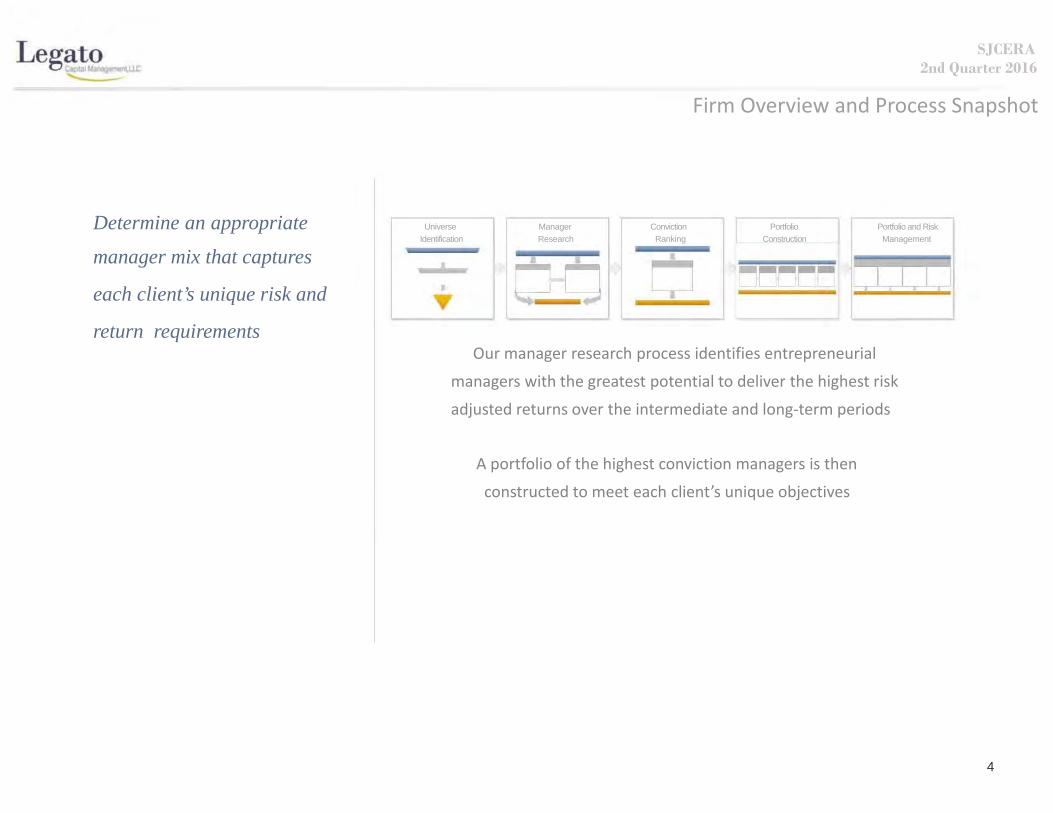
Firm Overview and Process Snapshot
Determine an appropriate
manager mix that captures
each client’s unique risk and
return requirements
Universe Manager Conviction Portfolio Portfolio and RiskIdentification Research Ranking Construction Management
Our manager research process identifies entrepreneurial
managers with the greatest potential to deliver the highest risk
adjusted returns over the intermediate and long‐term periods
A portfolio of the highest conviction managers is then
constructed to meet each client’s unique objectives
4
2nd Quarter 2016SJCERA

Firm Overview and Process SnapshotConviction Ranking
We assign each manager a
Conviction Ranking. Our
conclusions are not the result of
a simple averaging scheme, but
are based on our overall
assessment of an organization’s
most powerful drivers.
Focus List
Conviction Ranking Criteria
TeamProcess
OrganizationPerformance
Structure
Overall Conviction Ranking
1 2 3 4 5
Low Medium High
5
2nd Quarter 2016SJCERA

SJCERA2nd Quarter 2016
Investment Objective ‐ Small Cap Growth
A small cap growth manager‐of‐managers (MOM) portfolio that seeks to consistently produce alpha by utilizing entrepreneurial managers withcomplementary styles. The Portfolio is benchmarked against the Russell 2000® Growth Index.
Total Assets
SJCERA ‐ Small Cap Growth Portfolio
There can be no guarantee that the Portfolio will achieve its investment objective.
Market Value
Equities $70,690,256.98
Cash & Equivalents $1,137,021.42
Total Portfolio $71,827,278.40
Market Value ‐ 03/31/2016
Net Additions and Withdrawals
Interest and Dividends
Net Gains and Losses
Market Value ‐ 06/30/2016
Allocation
98.42%
1.58%
100.00%
$69,865,546.52
‐
$74,449.02
$1,887,282.86
$71,827,278.40
6

SJCERA2nd Quarter 2016
Manager Allocations ‐ Small Cap GrowthAs of June 30, 2016
Manager
AMI Asset ManagementInception Date: October 3, 2014
Rice Hall James & AssociatesInception Date: October 3, 2014
LMCG InvestmentsInception Date: March 2, 2010
CastleArk ManagementInception Date: March 2, 2010
EAM Investors*Inception Date: March 29, 2011
Market Cap Style Sub‐Style
Small Cap Growth Conservative
Small Cap Growth Conservative
Small Cap Growth Pure
Small Cap Growth Aggressive
Small/Micro Cap Growth Aggressive
Target CurrentWeight Weight
22.00% 22.15%
24.00% 24.30%
21.00% 20.57%
18.00% 17.86%
15.00% 15.12%
Difference
0.15%
0.30%
‐0.43%
‐0.14%
0.12%
Style and sub‐style characterizations are based on Legato Capital Management’s classifications. For more detail on the Managers, please refer to Appendix E.*EAM Investors was terminated on August 30, 2016.
7

SJCERA2nd Quarter 2016
Investment Performance ‐ Small Cap GrowthFor the second quarter, the Portfolio (net‐of‐fees) underperformed its benchmark by 0.62%. Since inception, the Portfolio (net‐of‐fees) hasunderperformed its benchmark by 0.47% on an annualized basis.
SJCERA ‐ Small Cap Growth As of June 30, 2016
18%
13%
8%
3%
‐2%
‐7%
‐12%
‐17%1‐Month QTD YTD 1‐Year 3‐Year 5‐Year 7‐Year Since Inception*
SJCERA ‐ Gross ‐0.39% 2.81% ‐4.87% ‐13.22% 5.94% 8.45% 14.13% 7.98%
SJCERA ‐ Net ‐0.58% 2.62% ‐5.22% ‐13.89% 5.15% 7.64% 13.28% 7.18%
Russell 2000® Growth Index ‐0.46% 3.24% ‐1.59% ‐10.75% 7.74% 8.51% 14.29% 7.65%
Returns for periods greater than 1 year are annualized.*Portfolio inception date: June 16, 2008.Past performance is no guarantee of future results. Gross‐of‐fees returns are presented gross of advisory and custodial fees, but net of trading expenses and non‐reclaimablewithholding taxes. Net‐of‐fees returns are calculated by deducting actual advisory fees incurred by the Portfolio from the gross‐of‐fees returns. Performance results reflect thereinvestment of dividends and other earnings.
8

SJCERA2nd Quarter 2016
Investment Performance ‐ Small Cap Growth
SJCERA ‐ Small Cap Growth
Calendar Years
56%
47%
38%
29%
20%
11%
2%
‐7%
‐16%
‐25%
‐34%
‐43%
2016* 2015 2014 2013 2012 2011 2010 20092008 PartialYear**
SJCERA ‐ Gross ‐4.87% ‐0.81% 2.74% 47.22% 18.17% ‐2.41% 26.90% 37.86% ‐35.62%
SJCERA ‐ Net ‐5.22% ‐1.56% 1.98% 46.16% 17.31% ‐3.16% 25.97% 36.88% ‐35.89%
Russell 2000® Growth Index ‐1.59% ‐1.38% 5.60% 43.30% 14.59% ‐2.91% 29.09% 34.47% ‐36.22%
*As of June 30, 2016. **Portfolio inception date: June 16, 2008.Past performance is no guarantee of future results. Gross‐of‐fees returns are presented gross of advisory and custodial fees, but net of trading expenses and non‐reclaimablewithholding taxes. Net‐of‐fees returns are calculated by deducting actual advisory fees incurred by the Portfolio from the gross‐of‐fees returns.Performance results reflect the reinvestment of dividends and other earnings. 9

10
1‐Month QTD YTD 1‐Year 3‐Year 5‐Year 7‐YearSince
Inception*
SJCERA ‐ Gross 0.71% 6.52% 1.35% ‐0.58% 6.19% 12.69% 13.94% 8.64%
Russell 2000® Growth Index 1.06% 7.67% 5.95% 3.54% 8.49% 13.02% 14.11% 8.45%
‐10%
‐5%
0%
5%
10%
15%
20%
25%
Returns
SJCERA ‐ Small Cap Growth As of August 31, 2016 (Estimated)
Investment Performance‐Small Cap Growth
Returns for periods greater than 1 year are annualized.*Portfolio inception date: June 16, 2008. Past performance is no guarantee of future results. Gross‐of‐fees returns are presented gross of advisory and custodial fees, but net of trading expenses and non‐reclaimable withholding taxes. Net‐of‐fees returns are calculated by deducting actual advisory fees incurred by the Portfolio from the gross‐of‐fees returns. Performance results reflect the reinvestment of dividends and other earnings.
August 31, 2016SJCERA
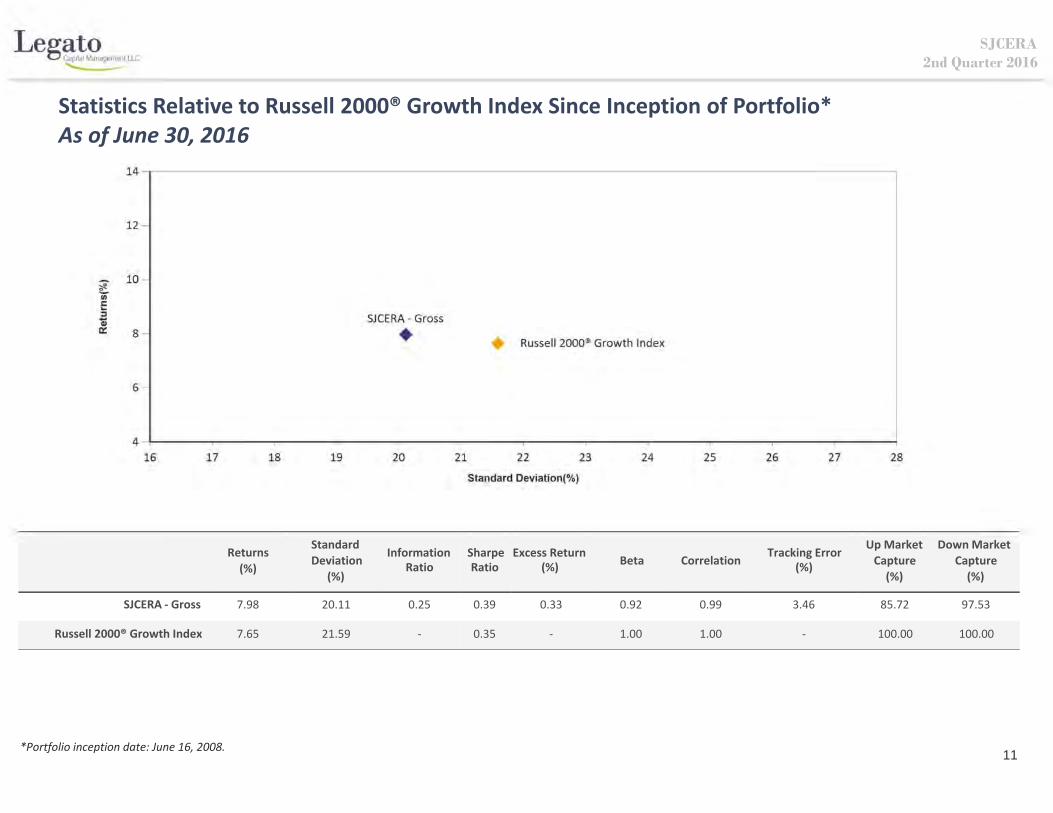
SJCERA2nd Quarter 2016
Statistics Relative to Russell 2000® Growth Index Since Inception of Portfolio*As of June 30, 2016
Returns(%)
StandardDeviation
(%)
Information Sharpe Excess ReturnRatio Ratio (%)
Beta CorrelationTracking Error
(%)
Up Market Down MarketCapture Capture(%) (%)
SJCERA ‐ Gross 7.98 20.11 0.25 0.39 0.33 0.92 0.99 3.46 85.72 97.53
Russell 2000® Growth Index 7.65 21.59 ‐ 0.35 ‐ 1.00 1.00 ‐ 100.00 100.00
*Portfolio inception date: June 16, 2008. 11

SJCERA2nd Quarter 2016
Top Ten Holdings & Sector Allocation ‐ Small Cap Growth
• The top ten holdings had an overall positiveeffect on relative performance.
• The portfolio is overweight in consumerdiscretionary, consumer staples, energy,
health care, producer durables, technology,and underweight in financial services,
materials & processing, utilities.
24
21
18
15
12
9
6
3
0
Security Sector
Ligand Pharmaceuticals Incorporated Health Care
LifeLock, Inc. Consumer Discretionary
Synchronoss Technologies, Inc. Technology
Echo Global Logistics, Inc Producer Durables
Fleetmatics Group PLC Technology
iShares Russell 2000 Growth ETF Unassigned
Criteo SA Sponsored ADR Technology
AmSurg Corp. Health Care
Pool Corporation Consumer Discretionary
BroadSoft, Inc. Technology
Total:
Weight in Weight inPortfolio (%) Index (%)
2.19 0.28
2.05 0.16
1.78 0.16
1.69 0.07
1.48 0.21
1.40 0.00
1.37 0.00
1.24 0.00
1.11 0.00
1.08 0.15
15.40 1.02
Contribution toRelative
Performance (%)
0.20
0.40
‐0.06
‐0.40
0.09
0.00
0.10
‐0.01
0.04
‐0.02
0.33
Consumer ConsumerDiscretionary Staples
EnergyFinancialServices
Health CareMaterials & ProducerProcessing Durables
Technology UtilitiesCash &
Equivalents Unassigned*
SJCERA 17.81 4.78 1.93 6.95 23.18 4.94 15.31 20.30 1.83 1.58 1.40
Russell 2000®Growth Index
17.66 3.35 0.88 11.78 22.34 8.92 13.81 18.80 2.46 0.00 0.00
* Unassigned sector is made up of ETF holdings.Source: FactSet. Analysis includes cash & equivalents. Sector characterizations based on Russell classifications. Numbers may not add up due to rounding. 12
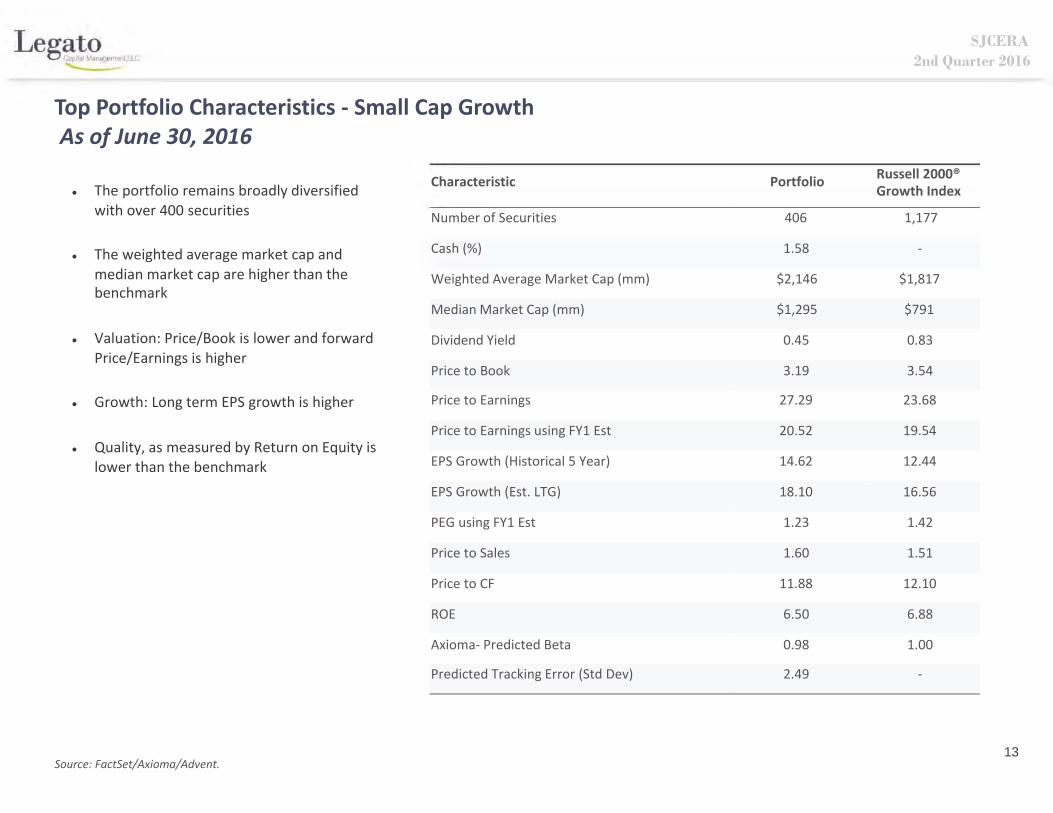
SJCERA2nd Quarter 2016
Top Portfolio Characteristics ‐ Small Cap GrowthAs of June 30, 2016
• The portfolio remains broadly diversifiedwith over 400 securities
• The weighted average market cap andmedian market cap are higher than thebenchmark
• Valuation: Price/Book is lower and forwardPrice/Earnings is higher
• Growth: Long term EPS growth is higher
• Quality, as measured by Return on Equity islower than the benchmark
Source: FactSet/Axioma/Advent.
Characteristic Portfolio
Number of Securities 406
Cash (%) 1.58
Weighted Average Market Cap (mm) $2,146
Median Market Cap (mm) $1,295
Dividend Yield 0.45
Price to Book 3.19
Price to Earnings 27.29
Price to Earnings using FY1 Est 20.52
EPS Growth (Historical 5 Year) 14.62
EPS Growth (Est. LTG) 18.10
PEG using FY1 Est 1.23
Price to Sales 1.60
Price to CF 11.88
ROE 6.50
Axioma‐ Predicted Beta 0.98
Predicted Tracking Error (Std Dev) 2.49
Russell 2000®Growth Index
1,177
‐
$1,817
$791
0.83
3.54
23.68
19.54
12.44
16.56
1.42
1.51
12.10
6.88
1.00
‐
13
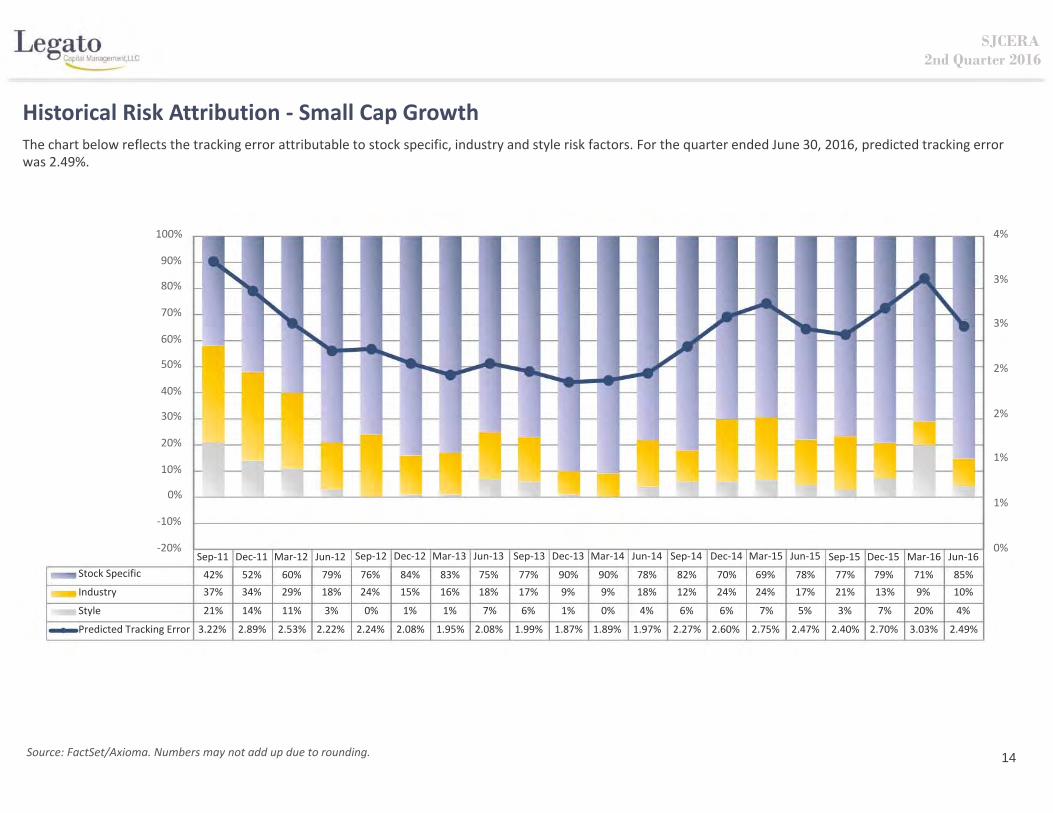
SJCERA2nd Quarter 2016
Historical Risk Attribution ‐ Small Cap GrowthThe chart below reflects the tracking error attributable to stock specific, industry and style risk factors. For the quarter ended June 30, 2016, predicted tracking errorwas 2.49%.
100%
90%
80%
70%
60%
50%
40%
30%
20%
10%
0%
‐10%
‐20%Sep‐11 Dec‐11 Mar‐12 Jun‐12 Sep‐12 Dec‐12 Mar‐13 Jun‐13 Sep‐13 Dec‐13 Mar‐14 Jun‐14 Sep‐14 Dec‐14 Mar‐15 Jun‐15
4%
3%
3%
2%
2%
1%
1%
0%Sep‐15 Dec‐15 Mar‐16 Jun‐16
Stock Specific 42% 52% 60% 79% 76% 84% 83% 75% 77% 90% 90% 78% 82% 70% 69% 78% 77% 79% 71% 85%
Industry 37% 34% 29% 18% 24% 15% 16% 18% 17% 9% 9% 18% 12% 24% 24% 17% 21% 13% 9% 10%
Style 21% 14% 11% 3% 0% 1% 1% 7% 6% 1% 0% 4% 6% 6% 7% 5% 3% 7% 20% 4%
Predicted Tracking Error 3.22% 2.89% 2.53% 2.22% 2.24% 2.08% 1.95% 2.08% 1.99% 1.87% 1.89% 1.97% 2.27% 2.60% 2.75% 2.47% 2.40% 2.70% 3.03% 2.49%
Source: FactSet/Axioma. Numbers may not add up due to rounding. 14

SJCERA2nd Quarter 2016
Small Cap Growth Portfolio
15
Appendix A.

SJCERA2nd Quarter 2016
Total Portfolio & Manager Investment Performance ‐ Small Cap GrowthAs of June 30, 2016
Market Value 1‐Month QTD YTD 1‐Year 3‐Year 5‐Year 7‐Year
Portfolio: Small Cap Growth ‐ Gross $71,827,278.40 ‐0.39% 2.81% ‐4.87% ‐13.22% 5.94% 8.45% 14.13%
Small Cap Growth ‐ Net ‐0.58% 2.62% ‐5.22% ‐13.89% 5.15% 7.64% 13.28%
Benchmark: Russell 2000® Growth Index ‐0.46% 3.24% ‐1.59% ‐10.75% 7.74% 8.51% 14.29%
Excess Return ‐ Net: ‐0.12% ‐0.62% ‐3.63% ‐3.14% ‐2.59% ‐0.87% ‐1.01%
Managers ‐ Gross: AMI Asset Management † $15,906,432.75 0.73% 3.51% ‐0.86% ‐2.34% ‐‐ ‐‐ ‐‐
Rice Hall James & Associates † $17,453,787.79 ‐0.81% 2.81% ‐0.84% ‐8.49% ‐‐ ‐‐ ‐‐
LMCG Investments † $14,775,139.83 ‐3.42% 1.31% ‐12.42% ‐23.10% 4.16% 6.96% ‐‐
CastleArk Management † $12,830,748.69 0.99% 1.85% ‐4.12% ‐15.06% 7.23% 8.94% ‐‐
EAM Investors † $10,861,169.33 1.35% 5.03% ‐7.51% ‐19.15% 5.01% 7.66% ‐‐
Benchmark: Russell 2000® Growth Index ‐0.46% 3.24% ‐1.59% ‐10.75% 7.74% 8.51% 14.29%
Returns for periods greater then 1 year have been annualized.*Portfolio inception date: June 16, 2008.†CastleArk Management and LMCG Investments were funded on March 2, 2010, EAM Investors was funded on March 29, 2011, AMI Asset Management and Rice Hall James & Associates were funded onOctober 3, 2014.
SinceInception*
7.98%
7.18%
7.65%
‐0.47%
‐‐
‐‐
‐‐
‐‐
‐‐
7.65%
16

SJCERA2nd Quarter 2016
Quarterly Attribution Analysis ‐ Small Cap GrowthAs of June 30, 2016
Top Contributors/Detractors to Performance:
Sector Allocation
Positive Negative
Financial Services Materials & Processing
Consumer Staples Cash
PORTFOLIO
Average
Stock Selection
Positive Negative
Health Care Technology
Consumer Discretionary Financial Services
RUSSELL 2000® GROWTH INDEX ATTRIBUTION EFFECT
Average Sector StockSector
Total Portfolio
Consumer Discretionary
Consumer Staples
Energy
Financial Services
Health Care
Materials & Processing
Producer Durables
Technology
Utilities
Cash
Unassigned*
Weight
100.00
18.34
4.08
1.77
6.45
23.27
4.58
14.97
21.30
1.79
1.72
1.73
Return Contribution
2.81 2.81
1.65 0.22
10.63 0.43
12.32 0.12
‐1.00 ‐0.04
7.50 1.76
10.79 0.45
1.02 0.10
‐2.51 ‐0.55
15.23 0.25
0.06 0.00
3.45 0.08
Weight
100.00
18.67
3.49
0.93
10.26
24.41
8.14
12.86
19.65
1.59
0.00
0.00
Return Contribution
3.24 3.24
‐0.92 ‐0.24
9.89 0.31
0.30 0.00
1.98 0.26
4.73 1.18
7.43 0.59
1.56 0.21
3.98 0.72
10.97 0.19
0.00 0.00
0.00 0.00
Allocation Selection
‐0.28 ‐0.15
0.00 0.46
0.03 0.06
‐0.07 0.17
0.04 ‐0.18
0.00 0.58
‐0.16 0.16
‐0.04 ‐0.08
‐0.01 ‐1.38
0.01 0.06
‐0.08 0.00
0.00 0.00
Total
‐0.43
0.46
0.09
0.10
‐0.15
0.58
‐0.01
‐0.13
‐1.38
0.07
‐0.08
0.00
* Unassigned sector is made up of ETF holdings.Source: FactSet. FactSet analysis includes cash & equivalents. FactSet returns may differ due to various factors, such as the way FactSet treats large portfolio flows andcorporate actions. Numbers may not add up due to rounding. 17

SJCERA2nd Quarter 2016
Risk Factor Analysis ‐ Small Cap GrowthAs of June 30, 2016
Summary
Style
Volatility
Market Sensitivity
Exchange Rate Sensitivity
Medium‐Term Momentum
Short‐Term Momentum
Liquidity
Growth
Leverage
Value
Size
Industry
Stock Specific
TOTAL
Portfolio BenchmarkExposure Exposure
‐0.17 ‐0.78
0.41 0.40
0.26 0.24
0.18 0.09
0.18 0.05
0.04 ‐0.03
0.00 ‐0.08
‐0.01 ‐0.11
‐0.26 ‐0.28
‐0.31 ‐0.36
‐0.67 ‐0.70
0.98 1.00
Active Factor Contribution toExposure Total Active Risk (%)
0.61 4.22
0.01 ‐0.39
0.02 ‐0.27
0.08 0.28
0.13 3.47
0.07 0.62
0.09 0.04
0.10 0.52
0.02 ‐0.10
0.05 ‐0.07
0.03 0.14
‐0.02 10.50
85.28
100.00
Source: FactSet/Axioma. Numbers may not add up due to rounding. 18

SJCERA2nd Quarter 2016
Manager Overview
19
Appendix B.

SJCERA2nd Quarter 2016
Manager Overview ‐ Small Cap GrowthAs of June 30, 2016
Manager
AMI Asset Management
Rice Hall James & Associates
LMCG Investments
CastleArk Management
EAM Investors
*Source: FactSet/Advent.**Source: Manager.
Manager Assets Total Managerin Strategy Assets(millions)** (millions)**
$361 $1,785
$823 $2,257
$675 $6,932
$734 $3,565
$1,018 $1,491
SJCERA Assets Number of Holdings(millions)* in Portfolio*
$15.9 33
$17.5 67
$14.8 70
$12.8 102
$10.9 233
20

SJCERA2nd Quarter 2016
AMI Asset Management ‐ Small Cap Growth
Year Founded
EmployeeOwnership
Total Firm Assets
Total Strategy Assets
Total FirmEmployees
Investment TeamMembers
1998
100%
$1.8 bil.
$361.0 mil.
12
5
Investment ProcessChange*
Investment PersonnelChange*
Business Changes*
Compliance Violations*
Operations Violations*
AMI Asset
No
Yes
No
No
No
Product
Role inPortfolio**
Benchmark
Small Cap Growth
Growth ‐ Conservative
Russell 2000® Growth Index
Conservative
Overall Market Conditions***
Actual Performance Results***
Result Versus Legato'sExpectations***
Small Cap Growth Style
Pure
Favorable
Outperformed
Outside
Aggressive
Characteris c† Management
Number of Securities 33
Weighted Average Market Cap (mm) $1,728
Median Market Cap (mm) $1,500
Dividend Yield 0.23
Price to Book 2.98
Price to Earnings 28.18
Price to Earnings using FY1 Est 19.55
EPS Growth (Historical 5 Year) 19.60
EPS Growth (Est. LTG) 19.34
PEG using FY1 Est 1.03
Price to Sales 1.41
Price to CF 9.40
ROE 8.95
Axioma‐ Predicted Beta 0.95
Predicted Tracking Error (Std Dev) 6.19
*Significant changes or violations based on Legato’s evaluation ofinformation provided by the manager.Equity Analyst, Zach Robinow, departed the firm in 2Q 2016͘
Russell 2000® Growth Index
1,177
$1,817
$791
0.83
3.54
23.68
19.54
12.44
16.56
1.42
1.51
12.10
6.88
1.00
‐
**Based on Legato Style Classifications, refer to Appendix E.***Based on Legato’s due diligence and evaluation over the prior 12 months.†Source: FactSet/Axioma/Advent. 21
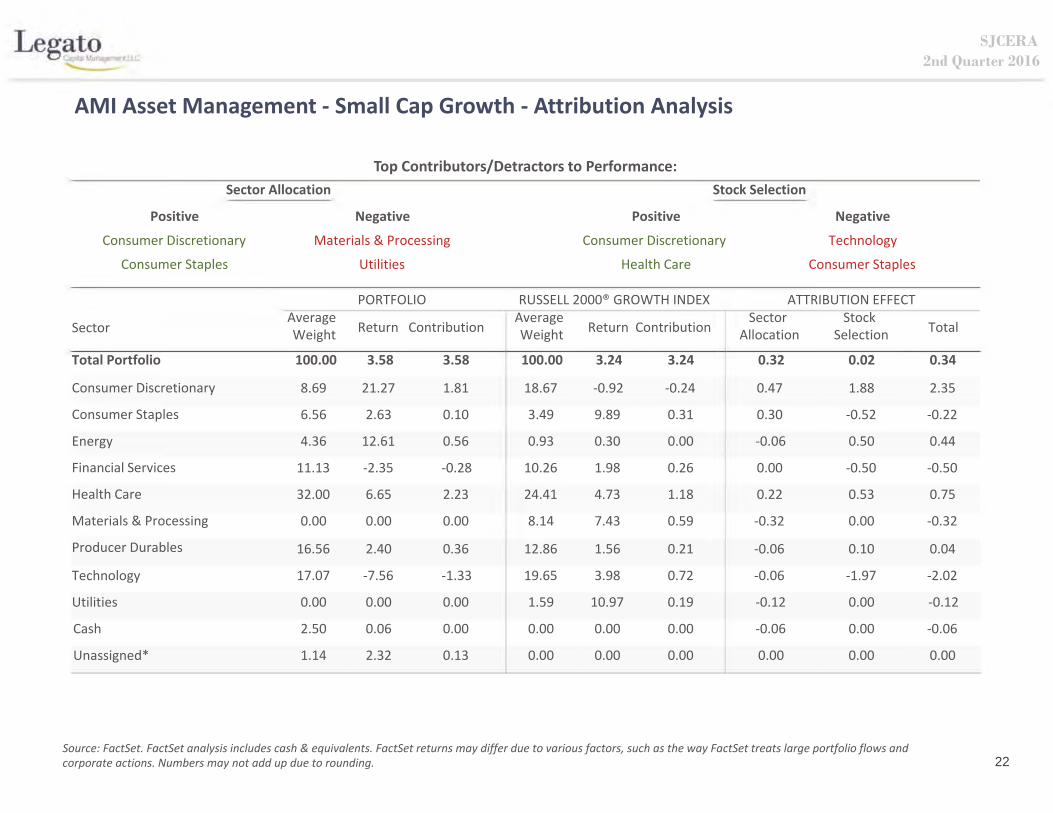
SJCERA2nd Quarter 2016
AMI Asset Management ‐ Small Cap Growth ‐ Attribution Analysis
Top Contributors/Detractors to Performance:
Sector Allocation
Positive Negative
Consumer Discretionary Materials & Processing
Consumer Staples Utilities
PORTFOLIOAverage
Stock Selection
Positive Negative
Consumer Discretionary Technology
Health Care Consumer Staples
RUSSELL 2000® GROWTH INDEX ATTRIBUTION EFFECTAverage Sector Stock
Sector
Total Portfolio
Consumer Discretionary
Consumer Staples
Energy
Financial Services
Health Care
Materials & Processing
Producer Durables
Technology
Utilities
Cash
Unassigned*
Weight
100.00
8.69
6.56
4.36
11.13
32.00
0.00
16.56
17.07
0.00
2.50
1.14
Return Contribution
3.58 3.58
21.27 1.81
2.63 0.10
12.61 0.56
‐2.35 ‐0.28
6.65 2.23
0.00 0.00
2.40 0.36
‐7.56 ‐1.33
0.00 0.00
0.06 0.00
2.32 0.13
Weight
100.00
18.67
3.49
0.93
10.26
24.41
8.14
12.86
19.65
1.59
0.00
0.00
Return Contribution
3.24 3.24
‐0.92 ‐0.24
9.89 0.31
0.30 0.00
1.98 0.26
4.73 1.18
7.43 0.59
1.56 0.21
3.98 0.72
10.97 0.19
0.00 0.00
0.00 0.00
Allocation Selection
0.32 0.02
0.47 1.88
0.30 ‐0.52
‐0.06 0.50
0.00 ‐0.50
0.22 0.53
‐0.32 0.00
‐0.06 0.10
‐0.06 ‐1.97
‐0.12 0.00
‐0.06 0.00
0.00 0.00
Total
0.34
2.35
‐0.22
0.44
‐0.50
0.75
‐0.32
0.04
‐2.02
‐0.12
‐0.06
0.00
Source: FactSet. FactSet analysis includes cash & equivalents. FactSet returns may differ due to various factors, such as the way FactSet treats large portfolio flows andcorporate actions. Numbers may not add up due to rounding. 22

SJCERA2nd Quarter 2016
Rice Hall James & Associates ‐ Small Cap Growth
Year Founded
EmployeeOwnership
Total Firm Assets
Total Strategy Assets
Total FirmEmployees
Investment TeamMembers
1974
100%
$2.3 bil.
$823.0 mil.
26
5
Investment ProcessChange*
Investment PersonnelChange*
Business Changes*
Compliance Violations*
Operations Violations*
Rice Hall James &
No
No
No
No
No
Product
Role inPortfolio**
Benchmark
Small Cap Growth
Growth ‐ Conservative
Russell 2000® Growth Index
Conservative
Overall Market Conditions***
Actual Performance Results***
Result Versus Legato'sExpectations***
Small Cap Growth Style
Pure
Favorable
Outperformed
Within
Aggressive
Characteris c†Associates Russell 2000® Growth Index
Number of Securities 67 1,177
Weighted Average Market Cap (mm) $2,158 $1,817
Median Market Cap (mm) $1,265 $791
Dividend Yield 0.50 0.83
Price to Book 3.49 3.54
Price to Earnings 25.94 23.68
Price to Earnings using FY1 Est 20.17 19.54
EPS Growth (Historical 5 Year) 12.71 12.44
EPS Growth (Est. LTG) 19.30 16.56
PEG using FY1 Est 1.16 1.42
Price to Sales 2.01 1.51
Price to CF 13.48 12.10
ROE 10.35 6.88
Axioma‐ Predicted Beta 0.98 1.00
Predicted Tracking Error (Std Dev) 4.86 ‐
*Significant changes or violations based on Legato’s evaluation of informationprovided by the manager.
**Based on Legato Style Classifications, refer to Appendix E.***Based on Legato’s due diligence and evaluation over the prior 12 months.†Source: FactSet/Axioma/Advent. 23

SJCERA2nd Quarter 2016
Rice Hall James & Associates ‐ Small Cap Growth ‐ Attribution Analysis
Top Contributors/Detractors to Performance:
Sector Allocation
Positive Negative
Financial Services Consumer Discretionary
Utilities Materials & Processing
PORTFOLIOAverage
Stock Selection
Positive Negative
Consumer Discretionary Producer Durables
Health Care Financial Services
RUSSELL 2000® GROWTH INDEX ATTRIBUTION EFFECTAverage Sector Stock
Sector
Total Portfolio
Consumer Discretionary
Consumer Staples
Energy
Financial Services
Health Care
Materials & Processing
Producer Durables
Technology
Utilities
Cash
Unassigned*
Weight
100.00
32.60
2.71
0.00
2.05
18.74
0.61
17.19
19.22
2.30
1.52
3.06
Return Contribution
2.83 2.83
2.03 0.57
10.66 0.28
0.00 0.00
‐13.39 ‐0.30
6.92 1.31
13.25 0.06
‐1.67 ‐0.37
4.85 1.02
7.48 0.16
0.06 0.00
3.45 0.09
Weight
100.00
18.67
3.49
0.93
10.26
24.41
8.14
12.86
19.65
1.59
0.00
0.00
Return Contribution
3.24 3.24
‐0.92 ‐0.24
9.89 0.31
0.30 0.00
1.98 0.26
4.73 1.18
7.43 0.59
1.56 0.21
3.98 0.72
10.97 0.19
0.00 0.00
0.00 0.00
Allocation Selection
‐1.12 0.71
‐0.62 0.96
‐0.16 0.12
0.03 0.00
0.10 ‐0.34
‐0.13 0.41
‐0.30 0.01
‐0.09 ‐0.58
0.04 0.21
0.05 ‐0.09
‐0.03 0.00
0.01 0.00
Total
‐0.41
0.34
‐0.04
0.03
‐0.24
0.28
‐0.29
‐0.66
0.25
‐0.04
‐0.03
0.01
Source: FactSet. FactSet analysis includes cash & equivalents. FactSet returns may differ due to various factors, such as the way FactSet treats large portfolio flows andcorporate actions. Numbers may not add up due to rounding. 24
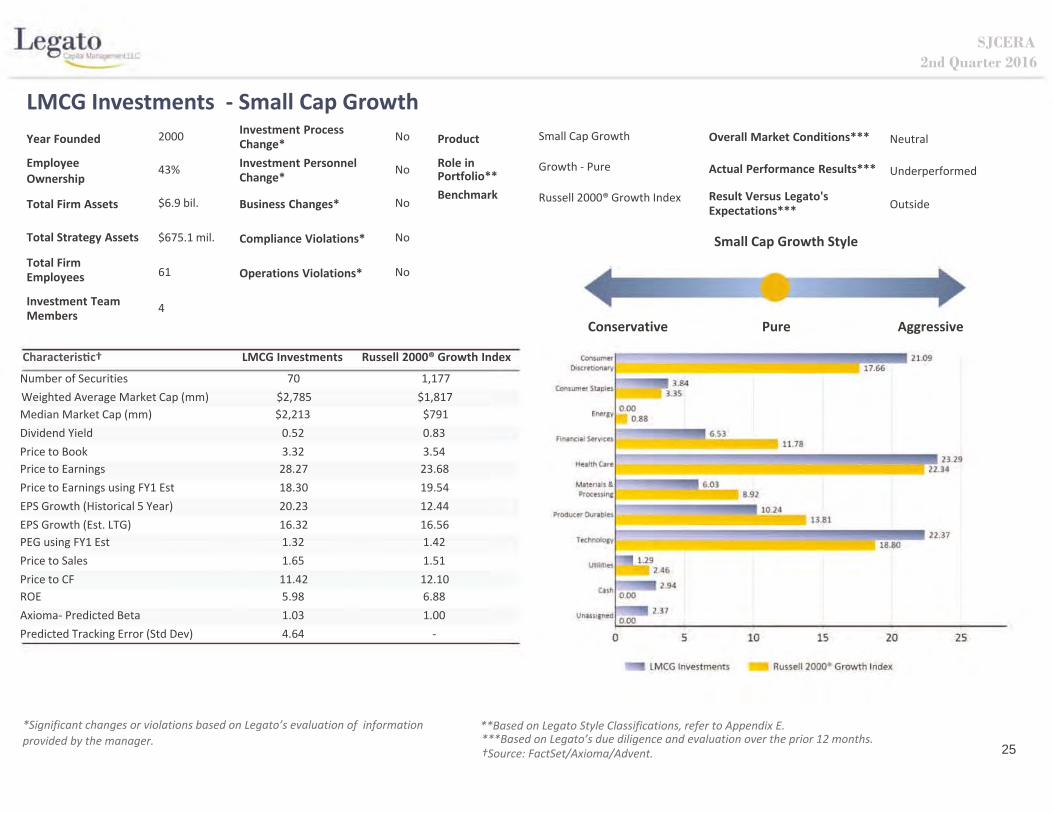
SJCERA2nd Quarter 2016
LMCG Investments ‐ Small Cap Growth
Year Founded
EmployeeOwnership
Total Firm Assets
Total Strategy Assets
Total FirmEmployees
Investment TeamMembers
2000
43%
$6.9 bil.
$675.1 mil.
61
4
Investment ProcessChange*
Investment PersonnelChange*
Business Changes*
Compliance Violations*
Operations Violations*
No
No
No
No
No
Product
Role inPortfolio**
Benchmark
Small Cap Growth
Growth ‐ Pure
Russell 2000® Growth Index
Conservative
Overall Market Conditions***
Actual Performance Results***
Result Versus Legato'sExpectations***
Small Cap Growth Style
Pure
Neutral
Underperformed
Outside
Aggressive
Characteris c† LMCG Investments Russell 2000® Growth Index
Number of Securities 70 1,177
Weighted Average Market Cap (mm) $2,785 $1,817
Median Market Cap (mm) $2,213 $791
Dividend Yield 0.52 0.83
Price to Book 3.32 3.54
Price to Earnings 28.27 23.68
Price to Earnings using FY1 Est 18.30 19.54
EPS Growth (Historical 5 Year) 20.23 12.44
EPS Growth (Est. LTG) 16.32 16.56
PEG using FY1 Est 1.32 1.42
Price to Sales 1.65 1.51
Price to CF 11.42 12.10
ROE 5.98 6.88
Axioma‐ Predicted Beta 1.03 1.00
Predicted Tracking Error (Std Dev) 4.64 ‐
*Significant changes or violations based on Legato’s evaluation of informationprovided by the manager.
**Based on Legato Style Classifications, refer to Appendix E.***Based on Legato’s due diligence and evaluation over the prior 12 months.†Source: FactSet/Axioma/Advent. 25

SJCERA2nd Quarter 2016
LMCG Investments ‐ Small Cap Growth ‐ Attribution Analysis
Top Contributors/Detractors to Performance:
Sector Allocation
Positive Negative
Consumer Discretionary Cash
Health Care Materials & Processing
PORTFOLIOAverage
Stock Selection
Positive Negative
Health Care Technology
Consumer Discretionary Financial Services
RUSSELL 2000® GROWTH INDEX ATTRIBUTION EFFECTAverage Sector Stock
Sector
Total Portfolio
Consumer Discretionary
Consumer Staples
Energy
Financial Services
Health Care
Materials & Processing
Producer Durables
Technology
Utilities
Cash
Unassigned*
Weight
100.00
18.15
3.83
0.00
4.75
26.07
5.57
10.35
24.96
1.03
2.26
3.03
Return Contribution
1.23 1.23
3.87 0.45
17.34 0.59
0.00 0.00
‐5.93 ‐0.27
8.41 2.09
8.25 0.45
1.26 ‐0.02
‐9.36 ‐2.31
13.08 0.13
0.06 0.00
3.45 0.11
Weight
100.00
18.67
3.49
0.93
10.26
24.41
8.14
12.86
19.65
1.59
0.00
0.00
Return Contribution
3.24 3.24
‐0.92 ‐0.24
9.89 0.31
0.30 0.00
1.98 0.26
4.73 1.18
7.43 0.59
1.56 0.21
3.98 0.72
10.97 0.19
0.00 0.00
0.00 0.00
Allocation Selection
‐0.10 ‐1.91
0.12 0.57
‐0.07 0.27
0.02 ‐0.01
0.03 ‐0.41
0.07 0.94
‐0.12 0.09
0.02 ‐0.05
0.04 ‐3.32
‐0.04 0.00
‐0.17 0.00
0.00 0.00
Total
‐2.01
0.68
0.20
0.01
‐0.37
1.01
‐0.03
‐0.03
‐3.28
‐0.04
‐0.17
0.00
Source: FactSet. FactSet analysis includes cash & equivalents. FactSet returns may differ due to various factors, such as the way FactSet treats large portfolio flows andcorporate actions. Numbers may not add up due to rounding. 26

SJCERA2nd Quarter 2016
CastleArk Management ‐ Small Cap Growth
Year Founded
EmployeeOwnership
Total Firm Assets
Total Strategy Assets
Total FirmEmployees
Investment TeamMembers
1999
100%
$3.6 bil.
$734.4 mil.
30
6
Investment ProcessChange*
Investment PersonnelChange*
Business Changes*
Compliance Violations*
Operations Violations*
CastleArk
No
No
No
No
No
Product
Role inPortfolio**
Benchmark
Small Cap Growth
Growth ‐ Aggressive
Russell 2000® Growth Index
Conservative
Overall Market Conditions***
Actual Performance Results***
Result Versus Legato'sExpectations***
Small Cap Growth Style
Pure
Favorable
Underperformed
Within
Aggressive
Characteris c†Management Russell 2000® Growth Index
Number of Securities 102 1,177
Weighted Average Market Cap (mm) $2,674 $1,817
Median Market Cap (mm) $2,238 $791
Dividend Yield 0.49 0.83
Price to Book 3.35 3.54
Price to Earnings 29.06 23.68
Price to Earnings using FY1 Est 23.51 19.54
EPS Growth (Historical 5 Year) 10.24 12.44
EPS Growth (Est. LTG) 17.16 16.56
PEG using FY1 Est 1.51 1.42
Price to Sales 1.48 1.51
Price to CF 15.55 12.10
ROE 5.56 6.88
Axioma‐ Predicted Beta 0.96 1.00
Predicted Tracking Error (Std Dev) 3.86 ‐
*Significant changes or violations based on Legato’s evaluation of informationprovided by the manager.
**Based on Legato Style Classifications, refer to Appendix E.***Based on Legato’s due diligence and evaluation over the prior 12 months.†Source: FactSet/Axioma/Advent. 27
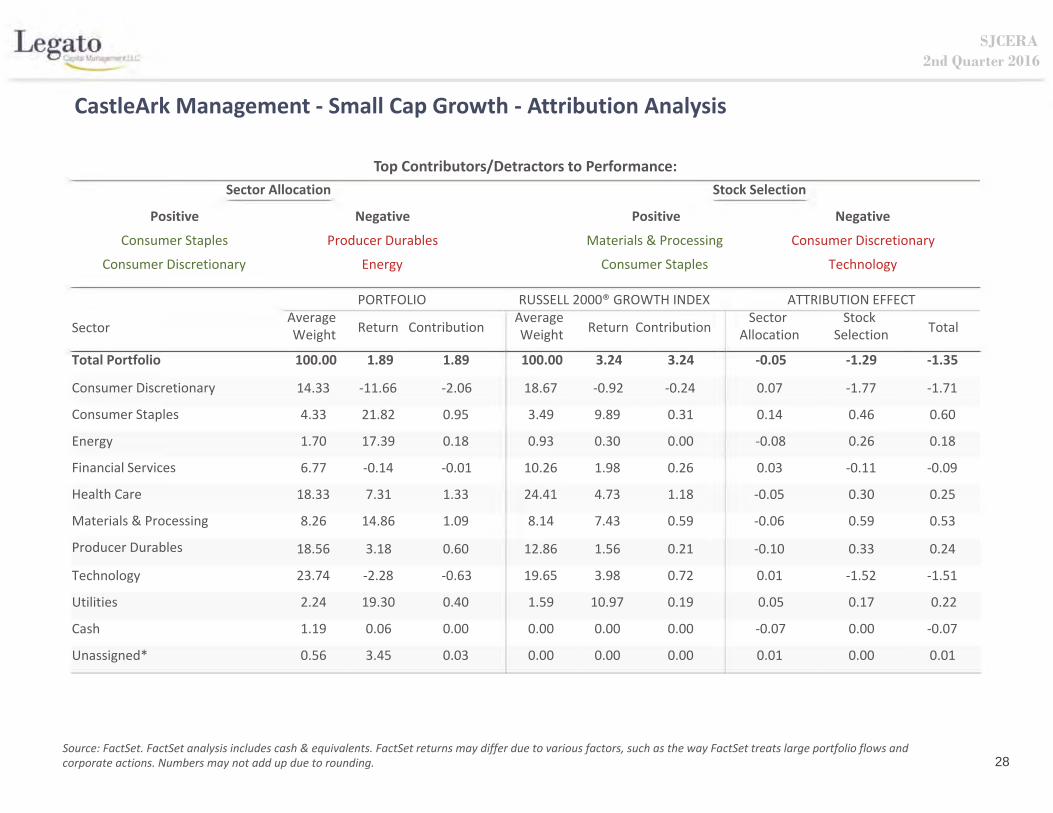
SJCERA2nd Quarter 2016
CastleArk Management ‐ Small Cap Growth ‐ Attribution Analysis
Top Contributors/Detractors to Performance:
Sector Allocation
Positive Negative
Consumer Staples Producer Durables
Consumer Discretionary Energy
PORTFOLIOAverage
Stock Selection
Positive Negative
Materials & Processing Consumer Discretionary
Consumer Staples Technology
RUSSELL 2000® GROWTH INDEX ATTRIBUTION EFFECTAverage Sector Stock
Sector
Total Portfolio
Consumer Discretionary
Consumer Staples
Energy
Financial Services
Health Care
Materials & Processing
Producer Durables
Technology
Utilities
Cash
Unassigned*
Weight
100.00
14.33
4.33
1.70
6.77
18.33
8.26
18.56
23.74
2.24
1.19
0.56
Return Contribution
1.89 1.89
‐11.66 ‐2.06
21.82 0.95
17.39 0.18
‐0.14 ‐0.01
7.31 1.33
14.86 1.09
3.18 0.60
‐2.28 ‐0.63
19.30 0.40
0.06 0.00
3.45 0.03
Weight
100.00
18.67
3.49
0.93
10.26
24.41
8.14
12.86
19.65
1.59
0.00
0.00
Return Contribution
3.24 3.24
‐0.92 ‐0.24
9.89 0.31
0.30 0.00
1.98 0.26
4.73 1.18
7.43 0.59
1.56 0.21
3.98 0.72
10.97 0.19
0.00 0.00
0.00 0.00
Allocation Selection
‐0.05 ‐1.29
0.07 ‐1.77
0.14 0.46
‐0.08 0.26
0.03 ‐0.11
‐0.05 0.30
‐0.06 0.59
‐0.10 0.33
0.01 ‐1.52
0.05 0.17
‐0.07 0.00
0.01 0.00
Total
‐1.35
‐1.71
0.60
0.18
‐0.09
0.25
0.53
0.24
‐1.51
0.22
‐0.07
0.01
Source: FactSet. FactSet analysis includes cash & equivalents. FactSet returns may differ due to various factors, such as the way FactSet treats large portfolio flows andcorporate actions. Numbers may not add up due to rounding. 28

SJCERA2nd Quarter 2016
EAM Investors ‐ Small/Micro Cap Growth
Year Founded
Employee
Ownership
Total Firm Assets
Total Strategy Assets
Total FirmEmployees
Investment TeamMembers
2007
56%
$1.5 bil.
$1.02 bil.
15
10
Investment ProcessChange*
Investment PersonnelChange*
Business Changes*
Compliance Violations*
Operations Violations*
No
No
No
No
No
Product
Role inPortfolio**
Benchmark
Small/Micro Cap Growth
Growth ‐ Aggressive
Russell 2000® Growth Index
Conservative
Overall Market Conditions***
Actual Performance Results***
Result Versus Legato'sExpectations***
Small/Micro Cap Growth Style
Pure
Unfavorable
Underperformed
Outside
Aggressive
Characteris c† EAM Investors Russell 2000® Growth Index
Number of Securities 233 1,177
Weighted Average Market Cap (mm) $1,249 $1,817
Median Market Cap (mm) $1,089 $791
Dividend Yield 0.52 0.83
Price to Book 2.81 3.54
Price to Earnings 25.02 23.68
Price to Earnings using FY1 Est 23.48 19.54
EPS Growth (Historical 5 Year) 8.14 12.44
EPS Growth (Est. LTG) 17.84 16.56
PEG using FY1 Est 1.44 1.42
Price to Sales 1.50 1.51
Price to CF 11.76 12.10
ROE ‐1.14 6.88
Axioma‐ Predicted Beta 1.01 1.00
Predicted Tracking Error (Std Dev) 3.82 ‐
*Significant changes or violations based on Legato’s evaluation of informationprovided by the manager.
**Based on Legato Style Classifications, refer to Appendix E.***Based on Legato’s due diligence and evaluation over the prior 12 months.†Source: FactSet/Axioma/Advent. 29
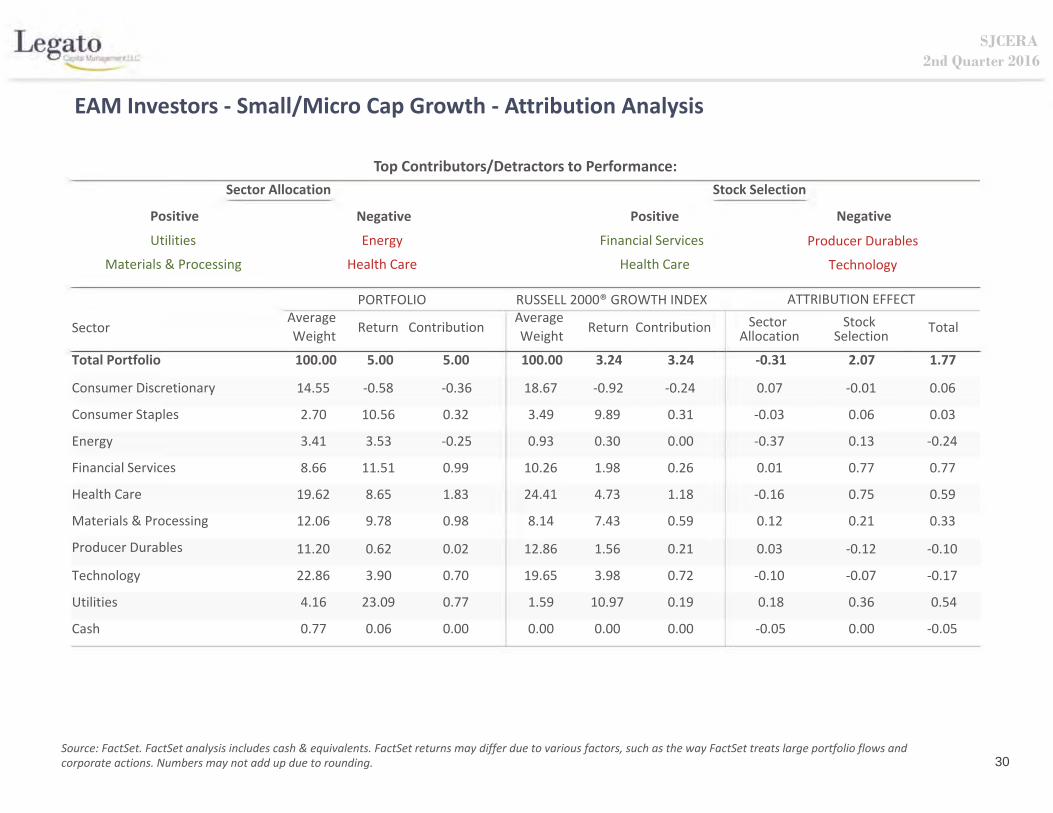
SJCERA2nd Quarter 2016
EAM Investors ‐ Small/Micro Cap Growth ‐ Attribution Analysis
Top Contributors/Detractors to Performance:
Sector Allocation
Positive
Utilities
Materials & Processing
Average
Negative Positive
Energy Financial Services
Health Care Health Care
PORTFOLIO RUSSELL 2000® GROWTH INDEXAverage
Stock Selection
Negative
Producer Durables
Technology
ATTRIBUTION EFFECT
Sector StockSector
Total Portfolio
Consumer Discretionary
Consumer Staples
Energy
Financial Services
Health Care
Materials & Processing
Producer Durables
Technology
Utilities
Cash
Weight
100.00
14.55
2.70
3.41
8.66
19.62
12.06
11.20
22.86
4.16
0.77
Return Contribution
5.00 5.00
‐0.58 ‐0.36
10.56 0.32
3.53 ‐0.25
11.51 0.99
8.65 1.83
9.78 0.98
0.62 0.02
3.90 0.70
23.09 0.77
0.06 0.00
Weight
100.00
18.67
3.49
0.93
10.26
24.41
8.14
12.86
19.65
1.59
0.00
Return Contribution
3.24 3.24
‐0.92 ‐0.24
9.89 0.31
0.30 0.00
1.98 0.26
4.73 1.18
7.43 0.59
1.56 0.21
3.98 0.72
10.97 0.19
0.00 0.00
Allocation Selection
‐0.31 2.07
0.07 ‐0.01
‐0.03 0.06
‐0.37 0.13
0.01 0.77
‐0.16 0.75
0.12 0.21
0.03 ‐0.12
‐0.10 ‐0.07
0.18 0.36
‐0.05 0.00
Total
1.77
0.06
0.03
‐0.24
0.77
0.59
0.33
‐0.10
‐0.17
0.54
‐0.05
Source: FactSet. FactSet analysis includes cash & equivalents. FactSet returns may differ due to various factors, such as the way FactSet treats large portfolio flows andcorporate actions. Numbers may not add up due to rounding. 30
SJCERA2nd Quarter 2016
Appendix C.
Firm Overview and Process Snapshot
31
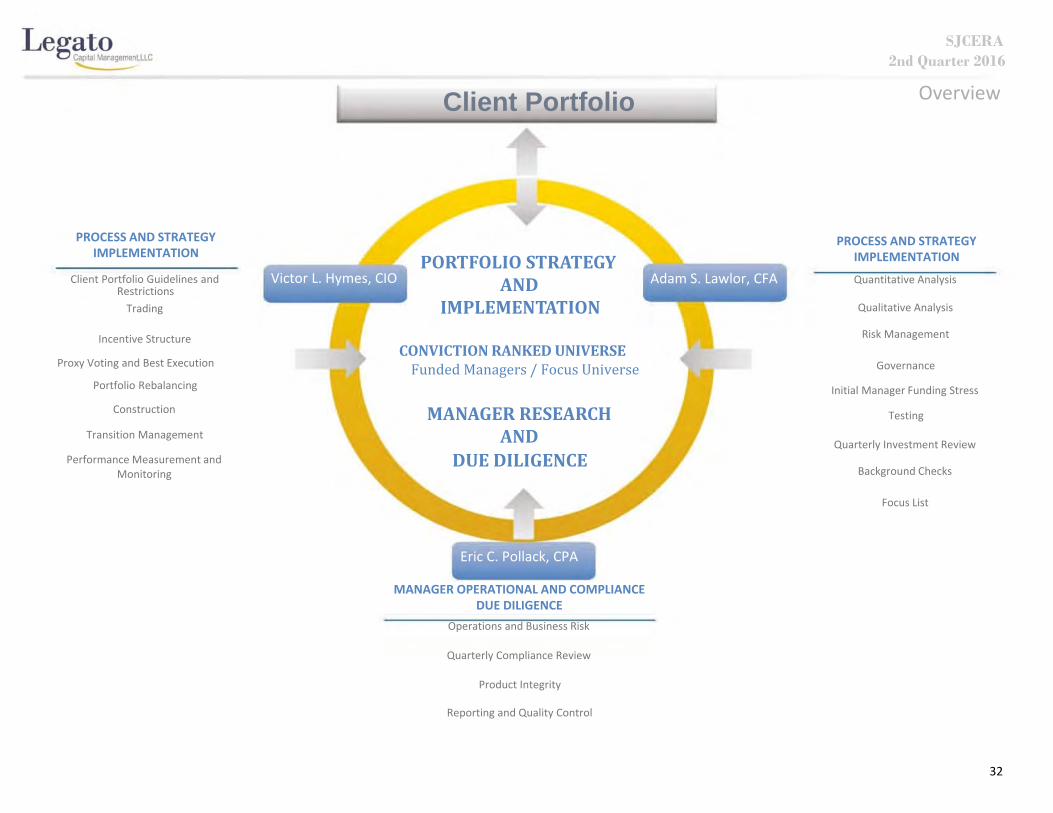
PROCESS AND STRATEGYIMPLEMENTATION
Client Portfolio Guidelines and Victor L. Hymes, CIORestrictions
Trading
Incentive Structure
Proxy Voting and Best Execution
Portfolio Rebalancing
Construction
Transition Management
Performance Measurement andMonitoring
Client Portfolio
PORTFOLIOSTRATEGYAND
IMPLEMENTATION
CONVICTIONRANKEDUNIVERSEFundedManagers/FocusUniverse
MANAGERRESEARCHAND
DUEDILIGENCE
Eric C. Pollack, CPA
Overview
PROCESS AND STRATEGYIMPLEMENTATION
Adam S. Lawlor, CFA Quantitative Analysis
Qualitative Analysis
Risk Management
Governance
Initial Manager Funding Stress
Testing
Quarterly Investment Review
Background Checks
Focus List
MANAGER OPERATIONAL AND COMPLIANCEDUE DILIGENCE
Operations and Business Risk
Quarterly Compliance Review
Product Integrity
Reporting and Quality Control
32
SJCERA2nd Quarter 2016

Firm Overview and Process SnapshotManager Research
Analysis which includes both
quantitative and qualitative
insights leads us to ask deeper
questions.
We look for:
• A disciplined and repeatableinvestment process
• An organizational structure thatsupports the investment process
• A talented and dedicated team• An entrepreneurial culture
• An ability and willingness to takecalculated risks
Quantitative Analysis
ReturnRisk
Investment Manager SkillStrategy & Style Purity
Manager Expectations
Manager Universe
Focus List
Qualitative Analysis
TeamProcess
OrganizationPerformance
Structure
33
SJCERA2nd Quarter 2016
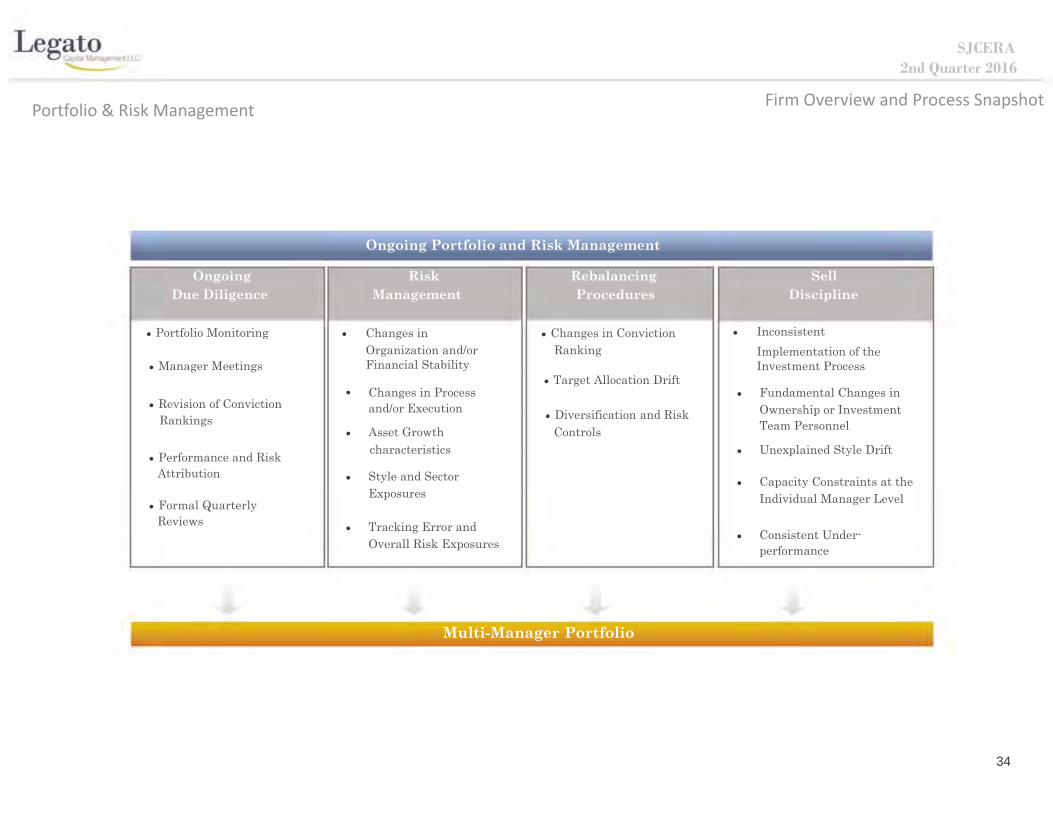
Portfolio & Risk Management
OngoingDue Diligence
• Portfolio Monitoring •
• Manager Meetings
•• Revision of Conviction
Ongoing Portfolio and Risk Management
Risk RebalancingManagement Procedures
Changes in • Changes in ConvictionOrganization and/or RankingFinancial Stability
• Target Allocation DriftChanges in Processand/or Execution
Firm Overview and Process Snapshot
SellDiscipline
• InconsistentImplementation of theInvestment Process
• Fundamental Changes inOwnership or Investment
Rankings
• Performance and RiskAttribution
• Formal QuarterlyReviews
• Diversification and Risk• Asset Growth Controls
characteristics
• Style and SectorExposures
• Tracking Error andOverall Risk Exposures
Multi-Manager Portfolio
Team Personnel
• Unexplained Style Drift
• Capacity Constraints at theIndividual Manager Level
• Consistent Under-performance
34
SJCERA2nd Quarter 2016

SJCERA2nd Quarter 2016
Appendix D.
Compliance Checklist and Investment Guidelines
35

SJCERA2nd Quarter 2016
All securities publically traded or approved by staff/consultant
No holdings of single issuer > 10% of each manager’s assets. For quantitative
investment manager, weight in one security not more than the weight of that
security in Russell 2000® Growth Index +2.5% at the time of purchase
Market cap < $4 billion at time of purchase
Foreign denominated stocks < 20% in each manager’s assets.
Sector diversification: max. limit greater of 3 times index weight or 10% of marketvalue
Directed brokerage with Northern Trust < 20% of transactions
Cash < 10%
Legato Capital Management hereby certifies that it has conducted a reasonable investigation concerning the matters stated above and that the foregoing information is true to the best of ourknowledge, information and belief. Please contact Legato if there are any changes to your contact information, your financial situation or investment objectives, or if you wish to impose new, or modifyexisting, restrictions on your account. 36
SJCERA2nd Quarter 2016
Appendix E.
Legato Style Classifications
37

SJCERA2nd Quarter 2016
Legato Style Classifications
CoreActive Quantitative
The active quantitative strategy is basedprimarily upon a numerical stock selectionprocess and builds portfolios with anactive risk level similar to the averagefundamental peer manager.
Fundamental
The fundamental strategy is executed byan individual or a team who makesdecisions based upon their independentdue diligence and research.
Enhanced Quantitative
The enhanced quantitative strategy isbased primarily upon a numerical stockselection process and builds portfolioswith a relatively low active risk level to thebenchmark.
GrowthConservative Growth
The conservative growth strategy ischaracterized by stocks with lower relativevaluations versus the market, peers, andhistory while also having lower historicaland projected revenue growthexpectations. It is also referred to as‘Growth At a Reasonable Price (GARP)’.
Pure Growth
The pure growth strategy is characterizedby a portfolio of growth stocks with similarvaluation and earnings growth
characteristics versus the benchmark.
Aggressive Growth
The aggressive growth strategy ischaracterized by stocks with higherhistorical and projected revenue growthexpectations, high institutional ownership,positive price momentum, and higherrelative valuation versus the market,peers, and their own history.
ValueRelative Value
The relative value strategy is characterizedby a portfolio of stocks that trade atrelatively small discounts to valuation versusthe market, peers, or their own history.
Pure Value
The pure value strategy is characterized by aportfolio of value stocks with similarvaluation and earnings growthcharacteristics versus the benchmark.
Deep Value
The deep value strategy is characterized bystocks that have low institutionalownership, negative price momentum, andtrade at deep discounts relative to averagevaluation levels or determined intrinsic
value.
38

M E M O R A N D U M Date: September 23, 2016 To: SJCERA Board of Retirement From: Pension Consulting Alliance, LLC (PCA) CC: David Sancewich – PCA Ryan Lobdell – PCA Annette St. Urbain – SJCERA Nancy Calkins – SJCERA Greg Frank – SJCERA RE: 11th Annual SJCERA Roundtable - Summary Summary
On August 17-18, 2016, the San Joaquin County Employees’ Retirement Association (SJCERA) held its 11th annual investment manager roundtable in Lodi, CA. The event featured a broad group discussion with SJCERA trustees, staff, consultants and investment managers as well as two breakout sessions. This memo summarizes some of the issues discussed at the event that SJCERA faces and key points from this two-day event.
Keynote Speaker:
This year’s event featured David Lafferty from Natixis. He shared his views on the capital markets and the outlook for the coming market cycle. The take-away was “slow, but positive global growth”. Trustees and participants spent a great deal of time talking about these points and its impact on investments and asset allocation.
Outlook and Capital Markets:
1. Low Return Environment: One of the key takeaways from the discussion was the continued low return environment in equities and fixed income facing SJCERA and other pension plans. Challenges in international countries and an overvalued U.S. equity market have all dampened return expectations over the next 3-5 years. The search for return has led to an increase in alternative (illiquid) investment strategies.

2
a. Return Expectations: As we did at last year’s event, participants were asked to give their return expectations for the U.S. Equity, International Equity and Fixed Income markets. In addition, we asked for expectation on inflation. The average return expectations for 2015 and 2016 are:
2. Interest Rates: General consensus among the participants was that interest rates were going to rise in 2016, either in September or December. There was some debate about the amount of the interest rate hike and whether it would be a surprise to, or consistent with, market expectations. Estimates for 2016 interest rate hikes from participants were 25-50 basis points.
Breakout Session #1: The first breakout session focused on Risk and Change. Each of the individual groups were asked to answer these questions and report out to the broad group on their thoughts. Differing responses to each of the questions are summarized below.
Risk:
1. What risks are the SJCERA managers concerned about regarding SJCERA assets?
a. Low interest rate environment
b. High equity market valuations
c. Tough investment environment with no clear direction
d. Investment managers not meeting their return expectations within their assigned mandate
2015 2016U.S. Equity (Russell 3000) 5.5% 2.4%International Equity (MSCI ACWI ex U.S. 7.6% 2.7%Fixed Income (B.C. Aggregate Index) 2.9% 2.4%Inflation (CPI) --- 2.1%

3
Change:
2. What changes would you make to the SJCERA portfolio?
a. More leverage
b. Make full use of the pension plan’s ability to take advantage of the illiquidity premium
c. Think more about Real Asset exposure with a focus on income
d. Consider alterative or smart beta investments in lieu of current cap weighted passive beta investments (better downside protection without giving up upside capture)
Breakout Session #2: The second breakout session focused on Investment opportunities for SJCERA. Differing responses to each of the questions are summarized below.
a) Think about investment opportunities both in terms of playing “defense” and “offense”
i. Defense 1. Real Estate 2. TIPS 3. Infrastructure 4. Natural Resources Equities 5. Other income-oriented strategies
ii. Offense – look for more opportunities to be a “capital provider” (like current direct-lending strategies)
b) Change from cap weighted passive strategies to alternative or smart beta strategies
c) Strategic tilt toward non-US equities – requires a long term commitment to play out vs. a short-term tactical move

4
Conclusion:
SJCERA, like many other pension plans, faces challenges in meeting an actuarial rate of return while managing risk and balancing diversification. In addition to the current 7.4% discount rate, SJCERA has focused some of its investments on protecting principal in down markets. The addition of the Crisis Risk Offset (CRO) portfolio and the continued rebalance of assets away from growth risk classes should help mitigate long-term losses. In addition, SJCERA has a meaningful allocation to private investments through real estate, private investments, and a broad global opportunistic portfolio.
5
DISCLOSURES: This document is provided for informational purposes only. It does not constitute an offer of securities of any of the issuers that may be described herein. Information contained herein may have been provided by third parties, including investment firms providing information on returns and assets under management, and may not have been independently verified. The past performance information contained in this report is not necessarily indicative of future results and there is no assurance that the investment in question will achieve comparable results or that the Firm will be able to implement its investment strategy or achieve its investment objectives. The actual realized value of currently unrealized investments (if any) will depend on a variety of factors, including future operating results, the value of the assets and market conditions at the time of disposition, any related transaction costs and the timing and manner of sale, all of which may differ from the assumptions and circumstances on which any current unrealized valuations are based. Neither PCA nor PCA’s officers, employees or agents, make any representation or warranty, express or implied, in relation to the accuracy or completeness of the information contained in this document or any oral information provided in connection herewith, or any data subsequently generated herefrom, and accept no responsibility, obligation or liability (whether direct or indirect, in contract, tort or otherwise) in relation to any of such information. PCA and PCA’s officers, employees and agents expressly disclaim any and all liability that may be based on this document and any errors therein or omissions therefrom. Neither PCA nor any of PCA’s officers, employees or agents, make any representation of warranty, express or implied, that any transaction has been or may be effected on the terms or in the manner stated in this document, or as to the achievement or reasonableness of future projections, management targets, estimates, prospects or returns, if any. Any views or terms contained herein are preliminary only, and are based on financial, economic, market and other conditions prevailing as of the date of this document and are therefore subject to change. The information contained in this report may include forward-looking statements. Forward-looking statements include a number of risks, uncertainties and other factors beyond the control of the Firm, which may result in material differences in actual results, performance or other expectations. The opinions, estimates and analyses reflect PCA’s current judgment, which may change in the future. Any tables, graphs or charts relating to past performance included in this report are intended only to illustrate investment performance for the historical periods shown. Such tables, graphs and charts are not intended to predict future performance and should not be used as the basis for an investment decision. All trademarks or product names mentioned herein are the property of their respective owners. Indices are unmanaged and one cannot invest directly in an index. The index data provided is on an “as is” basis. In no event shall the index providers or its affiliates have any liability of any kind in connection with the index data or the portfolio described herein. Copying or redistributing the index data is strictly prohibited. The Russell indices are either registered trademarks or tradenames of Frank Russell Company in the U.S. and/or other countries. The MSCI indices are trademarks and service marks of MSCI or its subsidiaries. Standard and Poor’s (S&P) is a division of The McGraw-Hill Companies, Inc. S&P indices, including the S&P 500, are a registered trademark of The McGraw-Hill Companies, Inc. CBOE, not S&P, calculates and disseminates the BXM Index. The CBOE has a business relationship with Standard & Poor's on the BXM. CBOE and Chicago Board Options Exchange are registered trademarks of the CBOE, and SPX, and CBOE S&P 500 BuyWrite Index BXM are servicemarks of the CBOE. The methodology of the CBOE S&P 500 BuyWrite Index is owned by CBOE and may be covered by one or more patents or pending patent applications. The Barclays Capital indices (formerly known as the Lehman indices) are trademarks of Barclays Capital, Inc. The Citigroup indices are trademarks of Citicorp or its affiliates. The Merrill Lynch indices are trademarks of Merrill Lynch & Co. or its affiliates. FTSE is a trademark of the London Stock Exchange Group companies and is used by FTSE under license. All rights in the FTSE indices and/or FTSE ratings vest in FTSE and/or its licensors. No further distribution of FTSE data is permitted with FTSE’s express written consent.

Table 1 Notes from SJCERA Investment Roundtable August 17-18, 2016 Table 1 J.C. Weydert, SJCERA (Breakout #1) Michael Restuccia, SJCERA (Breakout #2) Steve White, Angelo Gordon Iwan Djanali, AQR M. Freeman, Capital Prospects Sean Gannon, CrestLine Jeff Mayberry, DoubleLine Landy Pheloung, White Oak Yossi Lipsker, Rice, Hall James-Legato Breakout Session #1
1. What risks are the SJCERA managers concerned about regarding SJCERA assets?
• Is CRO the right weight? I.e. Is it too large? What is expected return for this insurance in the meantime?
• Where do you find premium returns? - "Private Markets" vs "Private Equity" lots of opportunity in: energy, hard assets/ infrastructure, opportunistic credit, distressed, special situations vs direct lending
• Inflation is large pending risk
2. What changes would you make to the SJCERA investment portfolio?
Breakout Session #2
1. Investment opportunities for SJCERA: • Explore market inefficiency themes to add incremental return • Liquid public markets - look at broader definition of small cap to include micro
cap • Private markets - hybrid or "net lease" real estate where you are financing an
operating company's mission critical real estate • Private markets - strategies in private markets that include current yield and
or a structured return - bank disintermediation theme is secular • Additional diversification - stand alone commodity strategy

Table 2 Notes from SJCERA Investment Roundtable August 17-18, 2016 Table 2 Michael Duffy, SJCERA (Breakout #1) J.C. Weydert, SJCERA (Breakout #2) Sarah Jiang, AQR Samantha Taylor, BlackRock Bruce Pflug, Crestline Mike Keough, Deutsche Asset Management John Linder, PCA Greg White, Prima Casey Jones, White Oak
Breakout Session #1
1. What risks are the SJCERA managers concerned about regarding SJCERA assets? • The “mismatch” of return expectations vs. assumed rate/liabilities
• Real return expectations – Cash return is much lower today and premium over risk-free rate more difficult to achieve
• Each manager not meeting the expectations of their own respective mandate within the broader asset allocation
• Inflation sensitivity – What if we have significant inflation? Is the portfolio vulnerable?
• Duration sensitivity – What if rates rise? How does this affect all asset classes?
2. What changes would you make to the SJCERA investment portfolio? • Continue to improve the “efficiency” of the liquid portfolio • Make full use of the pension fund’s unique ability to take advantage of the
“illiquidity premium” • Think about more “real assets” exposure – with a focus on income and
potential inflation sensitivity • More leverage, used prudently • Understand the incentives of service providers – ensure alignment

Breakout Session #2
1. Investment opportunities for SJCERA: • Think about investment opportunities both in terms of playing “defense” and
“offense” • Defense
• Real Estate • TIPS • Infrastructure • Natural Resources Equities • Other income-oriented strategies
• Offense – look for more opportunities to be a “capital provider” (like current direct-lending strategies)
• Exploit illiquidity premium – whether it’s “loan” or “own” • Real Assets multi-strategy • Strategic tilt toward non-US equities – requires a long term commitment to
play out vs. a short-term tactical move • Managed Futures?

Table 3 Notes from SJCERA Investment Roundtable August 17-18, 2016 Table 3 Cindy Garman, SJCERA (Breakout #1) Michael Duffy, SJCERA (Breakout #2) Mark Yusko, Morgan Creek Bob Smith, Bridgewater Tim Murray, BlackRock Najib Canaan, Marinus Barbara Ziegler, DoubleLine Bruce George, P/E Graham Schmidt, Cheiron
Breakout Session #1
1. What risks are the SJCERA managers concerned about regarding SJCERA assets? • Unanticipated inflation • Plan funding risks - and the correlation of those funding sources to large
segments of the portfolio i.e. the correlation of property taxes to real estate assets in the portfolio
• Uncompensated risks related to un-hedged international assets. • Spikes in Volatility • Asset valuation risk • Spread of negative rates, and the impact on asset valuation conventions that
negative rates have
2. What changes would you make to the SJCERA investment portfolio? • Consider adding an active currency overlay to manage currency risk
embedded in international assets • Are there asset classes out there that could offer a counter cyclicality to the
“long” property tax revenue risk exposure inherent in plan funding?

Breakout Session #2
1. Investment opportunities for SJCERA: Disintermediation of banks has provided investment opportunities in key areas:
• Capture illiquidity premium • Private Equity and hedge fund secondary’s • Distressed Assets – debt, real estate, energy
• Provide liquidity to “newly” illiquid markets • Real Estate • Consumer Credit • Direct Lending • Asset Backed Securities • Non-Agency Residential Mortgage Backed Securities
• Relative Value / Tactical Trading • Active currency management of embedded currency risk on international
assets • Portable Alpha/Smart Beta Strategies
• Strategic Hedges • Inflation related – commodities • Uncompensated risk related – currency risk embedded in non-us equity
assets – both private and public • Produce additional income
• Consumer Credit • Direct Lending • Asset Backed Securities • Non-Agency Residential Mortgage Backed Securities

Table 4 Notes from SJCERA Investment Roundtable August 17-18, 2016 Table 4 Raymond McCray, SJCERA (Breakout #1) Cindy Garman, SJCERA (Breakout #2) Jim Lites, Morgan Creek Patrick Dimick, Bridgewater Tracey Luke, Invesco Tony DiNota, Marinus Julia Tcherkassova, Prima Allan Emkin, PCA David Lafferty, Natixis (Breakout #1)
Breakout Session #1
1. What risks are the SJCERA managers concerned about regarding SJCERA assets?
• Liquidity Budgeting - Need to balance need for liquidity to meet benefits with the opportunity of investing in illiquid investments
• Complexity of some strategies may be difficult to unpack at a portfolio level • Long/ Short strategies may actually work against another managers strategy • Number of managers challenging (understanding what is happening within
each manager difficult) • Ensuring alignment between managers and SJCERA vis-a-vis fees
• What is the process/framework that decision about the portfolio are being made? At these round tables the lines sometimes seem blurred between alpha and beta strategies. NOTE: Allan explained the framework, etc., and the group seemed to be encouraged by this and suggested in the second question to stick with it
2. What changes would you make to the SJCERA investment portfolio? • SJCERA has just made a host of changes so the jury is still out. Need to give it
time and see how this plays out in both good and less good times • Continue with the strategic framework that you have established for asset
allocation and decision making • One person noted that the portfolio looked a bit like it had an inordinate amount
of illiquid debt (has been chased by a lot of investors)

Breakout Session #2
1. Investment opportunities for SJCERA: Overarching theme was focused on framework and governance process combined with understanding risk
• Framework: Set strategic long term portfolio that you have your long term allocations to and then set bucket for your alpha generators, mis-priced assets (essentially helps balance illiquid and liquid needs)
• Certain individuals prodded on whether the portfolio: • Provides insulation to inflation / deflation shocks • Can still perform well in a recessionary environment
• Risk/Complexity: Board is Risk Aware not Risk Averse and is working to better understand risk within the portfolio. Led to the issue of complexity within the risk and that eliminating / managing complexity can help manage risk, such as: • Number of Managers (Can you do more with the existing line up or even
fewer) • Simplify benchmarks (progress made but unclear if all the way there) • Types of strategies (complex long/shorts, etc could compound risk) • Fees - Are they simple, understood, and do they align interests between
board and managers • Governance and Processes:
Discussed need to stick with the framework/allocation strategy now that it is established but also still have work to do to ensure: • Mechanics in place to automatically rebalance when appropriate • Education to ensure board/others understand mechanics and where
tactical tilt opportunities are available and who should provide input on those tactical tilts

Table 5 Notes from SJCERA Investment Roundtable August 17-18, 2016 Table 5 Katherine MIller, SJCERA (Breakout #1) Raymond McCray, SJCERA (Breakout #2) Dean Crowe, Medley Josh Green, Raven Jeana Corker, Angelo Gordon Jerry Prior, Mt. Lucas Mark Sullivan, Keeley Asset Mgmt Tom Dugan, Dodge & Cox
Breakout Session #1
1. What risks are the SJCERA managers concerned about regarding SJCERA assets? • CRO bucket:
• Concerned that the Plan will not sell out of these assets at the right timing. Difficult to sell the one thing in your portfolio that is doing well in a time of crisis
• Private markets: Don’t have the same access as larger players, so may not get the high returns Too much money facing too little opportunities
• Geopolitical risks: China in the South China Sea. What affect would that have on Treasuries?
2. What changes would you make to the SJCERA investment portfolio? • Bifurcate portfolio:
Have a liquidity pool to cover what they need to pay benefits and then have an illiquid pool that can chase the return
• Leverage the portfolio: Done lots of work to lower the portfolio risk, so leveraging it could make it more efficient
• Make more local investments (e.g., buy the building the office is in, skilled nursing facility):
Convey to constituency that you are investing in them • Co-investment:
Have a pool to invest in unique opportunities

Breakout Session #2
1. Investment opportunities for SJCERA: • Plan should utilize its ability to take duration and try to earn returns through
an illiquidity premium • Public Equities with a focus on value stocks (looking with a longer term view –
5+ years) • REITs:
Selective types of underlying real estate (sector will also benefit from changing rules)
• Identify managers/partners to co-invest with (co-investment bucket needed)

Table 6 Notes from SJCERA Investment Roundtable August 17-18, 2016 Table 6 Chanda Bassett, SJCERA (Breakout #1) Katherine Miller, SJCERA (Breakout #2) Jacques Youssefmir, Ocean Avenue Deirdre Curry, Dodge & Cox Asish Tiwari, PIMCO Scott von Stein, Medley Tom Scibetta, Raven Bruce Eliot, P/E Max Swango, Invesco Breakout Session #1
1. What risks are the SJCERA managers concerned about regarding SJCERA assets?
• Interest rate risk: If rates go up or down from these low levels, the portfolio is impacted
• Innovation Risk in 1/3 of the portfolio with newer less traditional strategies: Risk Parity Crisis Risk Offset
• Concerns about not making the 7% return target – there is not enough alpha in the portfolio to meet the target in the systematic strategies or the fundamental strategies
• Mismatch of liabilities & concerns about lack of yield in the portfolio with not enough carry in the portfolio to pay benefits
2. What changes would you make to the SJCERA investment portfolio? • Increase Price Appreciation bucket – goal of increasing alpha in the portfolio • Decrease Stable Fixed Income bucket to fund Credit bucket as a means of
earning additional income in the portfolio • Simplify manager line-up

Breakout Session #2
1. Investment opportunities for SJCERA: Already have enough outside the box options in the plan –goal is to generate income and returns without increasing risk. Suggestions:
• Simplify Public Market • Diversify the Public Market further • Invest in Real Asset – (Infrastructure, MLP’s and Commodities) • Add Private Equity and Private Credit
Table 7 Notes from SJCERA Investment Roundtable August 17-18, 2016 Table 7 Adrian Van Houten, SJCERA (Breakout #1) Chanda Bassett, SJCERA (Breakout #2) John Madden, Stone Harbor James Medeiros, Graham Victor Hymes, Legato Mark Zytko, Mesa West Bryan Belton, Panagora Michael Humphrey, Courtland Breakout Session #1
1. What risks are the SJCERA managers concerned about regarding SJCERA assets?
• If you are not unusual, then you are a part of a crowd. An example of your willingness to innovate and focus on the discrete issues facing SJCERA is the implementation of the Crisis Risk Off Set position. You must continue to balance the competing challenges of effectively solving actual SJCERA problems, as opposed to being guided by peer universes
• There is a risk that if you embark on an expansionary vector, increasing the illiquid portion of the portfolio, you must be careful to have enough liquidity options to fund new investment should the environment of appealing opportunities in the liquid markets return
• Governance is critical. While your consultant will not always be right, you must be willing to listen to counsel, particularly when your instincts might suggest otherwise
• As you consider new investment opportunities and/or new types of risk, keep in mind other stated goals of capital appreciation and schedule of cash draw downs
2. What changes would you make to the SJCERA investment portfolio? Increase the risk aspects of the portfolio, primarily in the growth portion of your allocation by:
• Implementing micro-cap strategy through a multi-manager structure (to mute volatility) and add additional value
• Reducing the number of firms and do more with fewer (Oversight risk)

Breakout Session #2
1. Investment opportunities for SJCERA: • Micro cap investment through a multi-manager structure • Small private investment funds • Alternative assets, deployed via infrastructure, agriculture and real estate
(focus on certainty of income component, as opposed to volatility of price) • Emerging Markets (frontier and developed)
Table 8 Notes from SJCERA Investment Roundtable August 17-18, 2016 Table 8 Shabbir Khan and Margo Praus, SJCERA (Breakout #1) Adrian Van Houten, SJCERA (Breakout #2) Dave Torchia, Stone Harbor Thomas Feng, Graham Kevin Chin, Keely Asset Mgmt Jessica Hobbs, Mesa West Mike Anderson, Panagora Josh Lenhert, Deutsche Breakout Session #1
1. What risks are the SJCERA managers concerned about regarding SJCERA assets?
• High market equity valuations • Low interest rate environment • Compressed market premia across the globe • Tough investment environment with no clear direction
2. What changes would you make to the SJCERA investment portfolio? • Consider increasing the private equity and real estate allocation • Consider alterative or smart beta investments in lieu of current cap weighted
passive beta investments (better downside protection without giving up upside capture)
Breakout Session #2
1. Investment opportunities for SJCERA: • Consider Long/Short absolute return strategies that have low correlation to
the market and plan returns • Incrementally increase risk in the overall portfolio, consider an increase in real
estate allocation and private equity • Change from cap weighted passive strategies to alternative or smart beta
strategies

Table 9 Notes from SJCERA Investment Roundtable August 17-18, 2016 Table 9 Michael Restuccia, SJCERA (Breakout #1) Shabbir Khan and Margo Praus, SJCERA (Breakout #2) Cathy Nolan, Stone Harbor Tim Rudderow, Mt. Lucas Matt Clark, PIMCO Ben Lazarus, Parametric Tom Hester, Courtland Robert Palmer, Consultant Breakout Session #1
1. What risks are the SJCERA managers concerned about regarding SJCERA assets?
• Hidden bond trades (closet 10-year Treasury trades) in various places of the portfolio
• Cap rate compression in real estate • Risk on how rates go up could be a risk. If it is because of global growth that it is
good and if it is because of inflation that is bad • Understand and being able to act on different factors across asset classes
(equity risk, rate risk, currency risk, etc.)
2. What changes would you make to the SJCERA investment portfolio? • Application of derivatives at the funds level. Suggestion was made to buy
Eurodollar puts, equity puts, and sell equity options • Income focused commercial real estate • Enough in the portfolio to take care of the tails (left and right tail).
Breakout Session #2
1. Investment opportunities for SJCERA: • Expand bank loans and income focused commercial real estate debt • Income producing strategies to protect against the downside • Leverage and possibly doing some of the Crisis Risk Offset allocation in an
overlay • Trading off a volatility risk premium for an equity risk premium • Possibly using a hedge for a low growth high inflation environment

RATING SCALE:(2) (1)
INDIVIDUAL MANAGER MEETINGS# Avg # Avg # Avg # Avg
1. Roundtable Format 7 4.71 34 4.56 6 4.83 47 4.62(Mix of general and breakout sessions)
COMMENTS:
2. Wednesday Discussions:# Avg # Avg # Avg # Avg
Pension Challenges and SJCERA Overview 7 4.43 33 4.52 6 4.17 46 4.46Global Macro Review and Outlook 7 4.57 34 4.09 6 4.17 47 4.17 (Key Note Speaker)Capital Markets Review and Outlook 7 4.29 34 3.97 6 4.50 47 4.09
COMMENTS:
The capital markets review felt a little long and didn't allow enough time in the breakout session.
Very engaging sessions and I like the alternating format between general and breakout sessions. (2)Interesting discussion, but very broad. I think helpful to understand current economic landscape. (2)Good mix. Time allotment was fine. Great interaction. Outstanding format. Open square is best tool for discussion. Very well moderated and great quality of participants. Wonderful format for all participants to contribute. (2)I have low confidence that listening to tons of managers disagree about their tactical calls and pushing their products will help SJCERA's returns.
Would have been helpful to have a longer discussion on SJCERA's concerns and thoughts. The discussion portion was the best in my five years of attendance.Great discussion with managers and key note speaker after presentation. (2)
ALL
Poor
STAFF/CNSLT/Guest
TRUSTEES MANAGERS STAFF/CNSLT/Guest
SAN JOAQUIN COUNTY EMPLOYEES' RETIREMENT ASSOCIATIONALL ASSETS MANAGER ROUNDTABLE
AUGUST 17-18, 2016SUMMARY OF EVALUATIONS
(3)(5) (4)SatisfactoryExcellent
TRUSTEES MANAGERS
Lots of redundancy. Bravo! Very well done; I am a tough grader. Needed more time on breakouts.
ALL
Discussion was great and break out sessions were worth the time spent. Actually felt like more time was needed. Need to figure out how to extend the total time together; always feels too short. Worked well, but might benefit from a format refresh; perhaps smaller. (2)Good spirited discussions; could have taken a heavier hand in guiding and focusing commentators. Great to have a mix of discussions; got people moving and greater participation. (4)Great guest speaker. Appreciated hearing more managers speak on the second day.
Solid presentation from key note speaker. People were a little cautious on follow-up discussion.
Great, we always need macro to start. Good to have the event started with a keynote speaker to spark ideas for discussion the rest of the day. (2)Please add a mission statement from the Board to address any current issues the Board is facing. Very substantive and informative.Thought it was great.

RATING SCALE:(2) (1)
3. Wednesday Break-Out Session I: # Avg # Avg # Avg # AvgWhat risks are SJCERA managers concerned about? 7 4.71 34 4.29 5 4.60 46 4.39What changes would you make to SJCERA's portfolio? 6 4.00 33 4.18 5 4.20 44 4.16Breakout Session Summary/Discussion 4 4.25 32 4.19 6 4.67 42 4.26
COMMENTS:
Difficult to know SJCERA's total portfolio.
# Avg # Avg # Avg # Avg4. Organization of Event 7 4.86 34 4.88 5 4.80 46 4.87
5. Hotel Reservations & Reception 2 5.00 33 4.73 5 # 4.80 40 4.75(if applicable)
markets based. Prior to general discussion, perhaps each manager should provide brief view of valuation and opportunities in their
(3)
I have trouble seeing how disagreements amongst managers will yield better portfolios for SJCERA. Key note speaker was good, but a little too much commercial for himself and his company.
respective asset class.
Table 7 was a thoughtful group. I think we were able to convey return challenges in a low growth, low inflation environment.Overall it was decent. I think covering more on policy and how we should make decisions, rather than what trade to
Didn't think the key note speaker was spectacular.
Excellent Satisfactory Poor(5) (4)
How can SJCERA realistically leverage the dialogue on Fed projections, interest rates, etc., when the managers do not even have a consensus. (2)I thought David did a nice job in a difficult assignment. Discussion was more economic based rather than capital
Most tables said what risks SJCERA should be concerned about versus what managers are concerned about. Clearer outline for discussion leader to ensure staying on topic and come to proper conclusions.
ALL
know.
Answers to the second question were biased based on each manager's own agenda. Good topics. I thought it was informative for the Trustees. (2)Very constructive format.Needed more time for the summary portion.
TRUSTEES MANAGERS
Are we confusing the Board members with too much investment jargon?
Helpful, but needed more time. (4)
do would make it better.
STAFF/CNSLT/Guest
STAFF/CNSLT/Guest ALLWEDNESDAY DINNER
Very good idea to document. Please compel tables to actually answer the questions.
TRUSTEES MANAGERS
Key note speaker provided scant detail about the macro environment.
This was done with little insight into SJCERA, PCA, and Courtland's outlook on recent changes. Very helpful to me. Managers were not familiar with operations of SJCERA and helped to identify things I should
Great group for this session. Very diverse perspectives. Participants stayed focused on topics. Great discussion. (3)
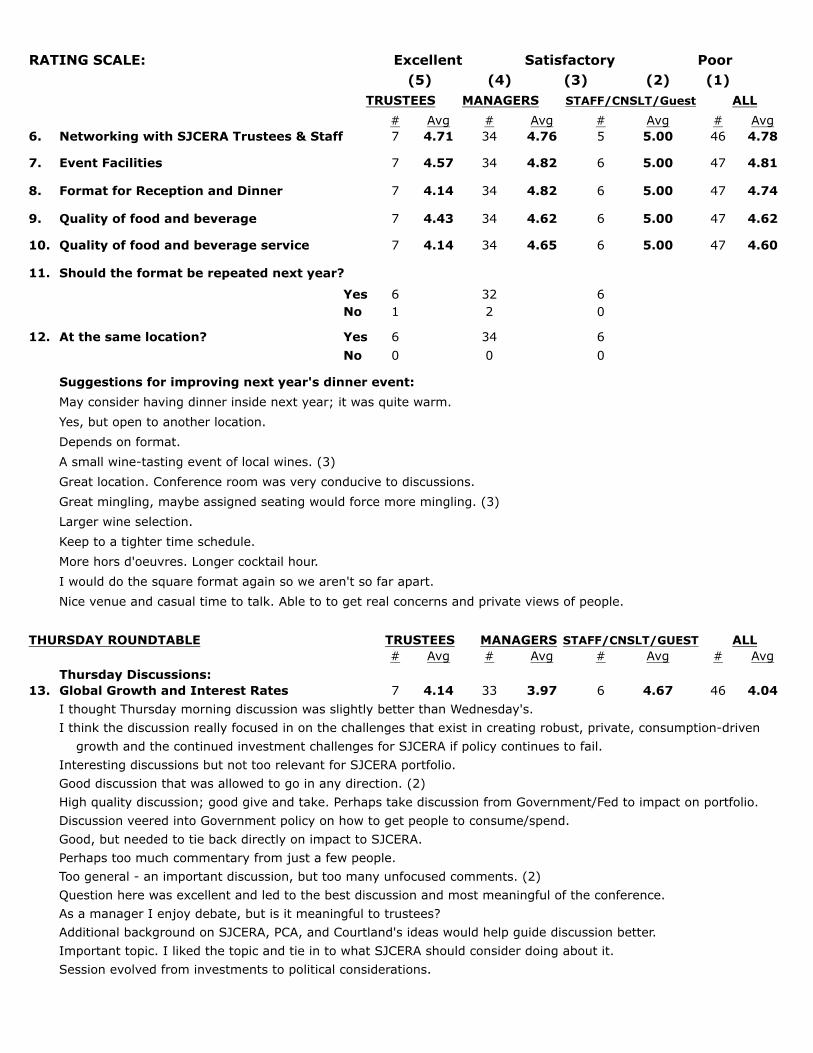
RATING SCALE:(2) (1)
# Avg # Avg # Avg # Avg6. Networking with SJCERA Trustees & Staff 7 4.71 34 4.76 5 5.00 46 4.78
7. Event Facilities 7 4.57 34 4.82 6 5.00 47 4.81
8. Format for Reception and Dinner 7 4.14 34 4.82 6 5.00 47 4.74
9. Quality of food and beverage 7 4.43 34 4.62 6 5.00 47 4.62
10. Quality of food and beverage service 7 4.14 34 4.65 6 5.00 47 4.60
11.
Yes 6 32 6No 1 2 0
12. At the same location? Yes 6 34 6No 0 0 0
Suggestions for improving next year's dinner event:
THURSDAY ROUNDTABLE# Avg # Avg # Avg # Avg
Thursday Discussions:13. Global Growth and Interest Rates 7 4.14 33 3.97 6 4.67 46 4.04
TRUSTEES MANAGERS STAFF/CNSLT/Guest ALL
Satisfactory Poor(5) (4) (3)
Excellent
Yes, but open to another location.
Discussion veered into Government policy on how to get people to consume/spend. Good, but needed to tie back directly on impact to SJCERA.
Good discussion that was allowed to go in any direction. (2)
A small wine-tasting event of local wines. (3)
TRUSTEES
High quality discussion; good give and take. Perhaps take discussion from Government/Fed to impact on portfolio.
MANAGERS
Nice venue and casual time to talk. Able to to get real concerns and private views of people.
STAFF/CNSLT/GUEST
Should the format be repeated next year?
Great location. Conference room was very conducive to discussions.
ALL
Larger wine selection.
Depends on format.
May consider having dinner inside next year; it was quite warm.
Great mingling, maybe assigned seating would force more mingling. (3)
Perhaps too much commentary from just a few people.
Keep to a tighter time schedule.More hors d'oeuvres. Longer cocktail hour. I would do the square format again so we aren't so far apart.
I thought Thursday morning discussion was slightly better than Wednesday's.I think the discussion really focused in on the challenges that exist in creating robust, private, consumption-driven growth and the continued investment challenges for SJCERA if policy continues to fail.Interesting discussions but not too relevant for SJCERA portfolio.
Too general - an important discussion, but too many unfocused comments. (2)Question here was excellent and led to the best discussion and most meaningful of the conference. As a manager I enjoy debate, but is it meaningful to trustees?Additional background on SJCERA, PCA, and Courtland's ideas would help guide discussion better. Important topic. I liked the topic and tie in to what SJCERA should consider doing about it. Session evolved from investments to political considerations.

RATING SCALE:(2) (1)
# Avg # Avg # Avg # Avg14. Break-out Session II - Investment 7 4.43 34 4.29 5 4.20 46 4.30
Opportunities for SJCERAComments:
Needed more time.
# Avg # Avg # Avg # Avg15. Moderators' facilitation of discussion 7 5.00 33 4.76 6 4.67 46 4.78
16.
Satisfactory Poor
Maybe more specific on micro versus macro opportunities.
(5) (4) (3)
Willingness of managers to be honest with Trustees. Impressed by PCA's solicitation of honest feedback.
I believe managers should try to come up with very specific opportunities, even if it means our lists are shorter. Very lively discussion. (2)Avoided specific - general was already understood.
Had a good discussion with Trustee Bassett about opportunities in isolation, but also where opportunities are funded
STAFF/CNSLT/GUEST ALL
Excellent
from in an Asset Allocation perspective.
Comments:
CRO - Color coding.
What aspect of the roundtable session was most beneficial to you?Different perspectives of the different asset classes representatives. (9)
Breakout sessions. (5)When each participant debated. (2)
Great job including all the managers and splitting time amongst them. (6)
David did a great job! (10)
Discussion Pros and Cons.
Really strong moderation. As a guy who does a lot of this; Well Done!PCA's moderation was very good; breakout session moderation was less focused. David is excellent at: keeping it moving forward, getting people to talk, and keeping people from selling their own book.
Great topic. (2)Got confused with polls.Hard to get any opportunities at this time, but everyone had decent ideas.
Good job, well organized. David does a nice job keeping on schedule and drawing people out. (3)
TRUSTEES MANAGERS STAFF/CNSLT/GUEST ALL
TRUSTEES MANAGERS
Great discussions at table, but reports back were a little vague.
Providing managers with insight on recent policy changes would help guide discussion. Dealing with plan risk aversion is a major challenge. Maybe try to find a way to avoid duplication of comments. Try different questions to different groups.
Tables have to actually answer the question!I question if Trustees should be considering individual investment opportunities. The most important work is their asset allocation.Most of the answers are biased based on the manager's own book.
Managers kept pitching their own ideas instead of thinking about SJCERA's portfolio as a whole.Our group was unclear on the exact question(s).
Face to face contacts. (2)
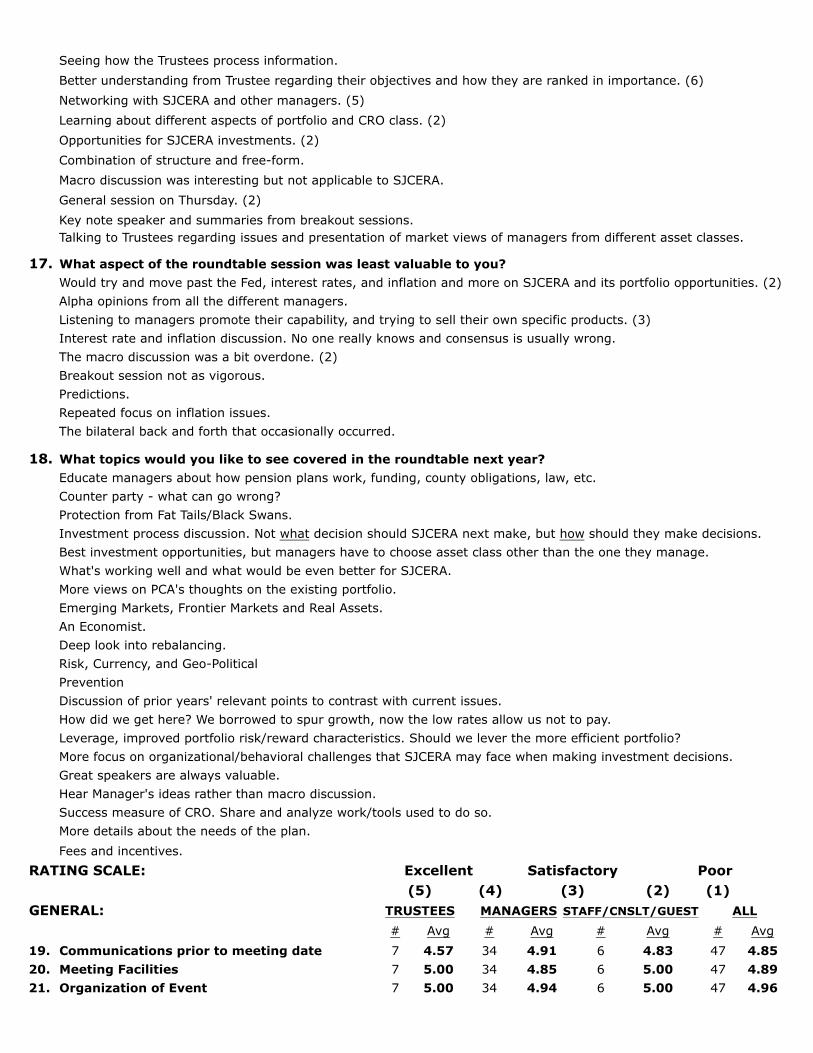
17.
18.
RATING SCALE: Excellent Satisfactory Poor(3) (2) (1)
GENERAL:# Avg # Avg # Avg # Avg
19. Communications prior to meeting date 7 4.57 34 4.91 6 4.83 47 4.8520. Meeting Facilities 7 5.00 34 4.85 6 5.00 47 4.8921. Organization of Event 7 5.00 34 4.94 6 5.00 47 4.96
The bilateral back and forth that occasionally occurred.
Counter party - what can go wrong?
Would try and move past the Fed, interest rates, and inflation and more on SJCERA and its portfolio opportunities. (2)
How did we get here? We borrowed to spur growth, now the low rates allow us not to pay.
Risk, Currency, and Geo-Political
Protection from Fat Tails/Black Swans.
Better understanding from Trustee regarding their objectives and how they are ranked in importance. (6)Networking with SJCERA and other managers. (5)Learning about different aspects of portfolio and CRO class. (2)
MANAGERS(4)(5)
More views on PCA's thoughts on the existing portfolio.What's working well and what would be even better for SJCERA.
TRUSTEES
Investment process discussion. Not what decision should SJCERA next make, but how should they make decisions. Best investment opportunities, but managers have to choose asset class other than the one they manage.
Leverage, improved portfolio risk/reward characteristics. Should we lever the more efficient portfolio?
STAFF/CNSLT/GUEST ALL
Talking to Trustees regarding issues and presentation of market views of managers from different asset classes.
Alpha opinions from all the different managers.
An Economist.Deep look into rebalancing.
More focus on organizational/behavioral challenges that SJCERA may face when making investment decisions.Great speakers are always valuable.
Educate managers about how pension plans work, funding, county obligations, law, etc.
What aspect of the roundtable session was least valuable to you?
Listening to managers promote their capability, and trying to sell their own specific products. (3)
What topics would you like to see covered in the roundtable next year?
Seeing how the Trustees process information.
The macro discussion was a bit overdone. (2)
PreventionDiscussion of prior years' relevant points to contrast with current issues.
Emerging Markets, Frontier Markets and Real Assets.
Combination of structure and free-form.
Interest rate and inflation discussion. No one really knows and consensus is usually wrong.
Opportunities for SJCERA investments. (2)
Breakout session not as vigorous. Predictions.Repeated focus on inflation issues.
Key note speaker and summaries from breakout sessions.
Macro discussion was interesting but not applicable to SJCERA. General session on Thursday. (2)
Hear Manager's ideas rather than macro discussion.Success measure of CRO. Share and analyze work/tools used to do so.More details about the needs of the plan.Fees and incentives.

RATING SCALE: Excellent Satisfactory Poor(3) (2) (1)
GENERAL:# Avg # Avg # Avg # Avg
22. Meeting Materials 7 4.86 34 4.79 6 4.83 47 4.8123. Food and Beverage 7 4.71 34 4.74 6 4.83 47 4.74
Comments:
Overall, very beneficial! (2)Fantastic event and well organized. Staff and David did a great job! I learned a lot.Liked the grouping of Asset Classes by color.Please invite Annette to next year's event. Box lunches were great for on the way to the airport.Time very well spent. Possible to make this event one full day instead of two half days?
It would be great to have PCA briefly present the plan at the beginning. We got the great materials, but it would set the backdrop.I am always amazed at the consensus that develops about both markets and conditions. For example, almost 100% certainty on no inflation. What actually impacts the portfolio in a negative way will almost largely be unseen. The plan is certainly addressing this with the CRO Allocation, which I support. The challenges are many and the world is complex.
Appointing discussion leaders and scribes in advance was helpful to making the breakouts efficient. Should compare the index and CPI survey by color code group.The U shape worked for opening the room to the audience at the round tables, but there was a lot of distance between the sides of the U shape. Not sure how to solve; maybe fewer manager attendees.
Other remarks:
House, and I knew about POB's, that the bulk of 1937 Act county contributions basically come from property
crowd and better facilitates roundtable format.
TRUSTEES MANAGERS STAFF/CNSLT/GUEST ALL(5) (4)
Might have group concerns of what asset class might add to the portfolio.David, Andrea, and Jessica did a great job. Open the event with a networking event or coffee hour; warms up the
Staff did a great job. This is a valuable networking opportunity. I am impressed that the managers think this is a very valuable use of time.It is apparent that managers do NOT understand public pension funding. Only Graham, the guest from Mountain
Too much discussion on macro, which is interesting but not as applicable to the portfolio. It's hard to know where the Fed will move growth rates, etc., so a bit fruitless to discuss this stuff. Maybe a bit more from managers on their best ideas. We didn't talk much about opportunities in Fixed Income, Credit, Equities, Relative Value, etc.Consider selecting a representative from each sector of your managers for a presentation on their industry, specific focus, and concerns. Show insights across disciplines.
taxes.
on the Fed. (2)
Thanks for having me and the opportunity to participate.
breakout sessions to be more specific to SJCERA than the group discussion.
The best interactive and functional gathering I attend.
It would be helpful to start the discussion with a brief explanation of funding, percent funded issues, etc.
Color coding the Attendees was a good idea! What really is the role of the fund? Next year maybe some facts
Surprised at how many managers in my groups did not know anything about SJCERA, except what was in the handout.
Maybe we should consider a more intimate Roundtable; rotating a quarter of managers every four years. I found the
Overall, a very nice event. The Trustees might benefit from hearing from some of the more thoughtful managers;

Enjoyed the company and found this very informative.
much understanding as possible. Many of the managers use technical jargon that I don't even understand. Follow that through with focusing on investing in things you understand. You have a great group of Trustees and
Really valuable to hear from all of the managers and the Board. Still continues as a unique experience. Fantastic moderator!! The last section where we went through almost every manager should've gone first.
Please improve the audio quality. (2)
I think the impact could be increased by shrinking the numbers at the event and upping the preparation required by managers. Example: Invite one-fifth of your managers, possibly one from every category, and rotate the invitations so that over a five-year period every manager appears once. With a slimmer attendance, focused of discussion, and future of the plan, the results would lead to a deeper discussion with more engaged, prepared
meeting room can often sound like a "doom and gloom" echo chamber. While I believe some of the passive equity
managers. It would make greater opportunities for interaction given a less overwhelming number of managers fighting for air time. (2)
It was nice to see the Board's engagement and interest. Not all board's do this and care as much. Ensure you gain as
clear and passionate case for the role of public equities in helping meet long-term investment goals. I know SJCERA has moved away from public equities in recent years, and active large cap in particular. With that absence among
investment teams are present, it doesn't seem that they are very effective conjuring up organic enthusiasm for the asset class, obsessed as they are with tracking error and basis risk versus an index.
consultants. I have participated in group sessions where they used "Quick Tally", where everyone has a remote device that allows them to vote on questions posed by the moderator. It led to lively discussions. I would enjoy hearing from managers from the Equity side, and Fixed Income market, present their views. For the sake of balance and perspective, the Roundtable needs a public equity evangelist. Someone willing to make a
they tend to be over-shadowed.
the managers, and the large number of Real Estate, Fixed Income, Credit, and CRO managers represented, the
Knowledge of SJCERA's tolerance would be helpful. For example, No leverage or not interested in 'X' based off 'Y'.
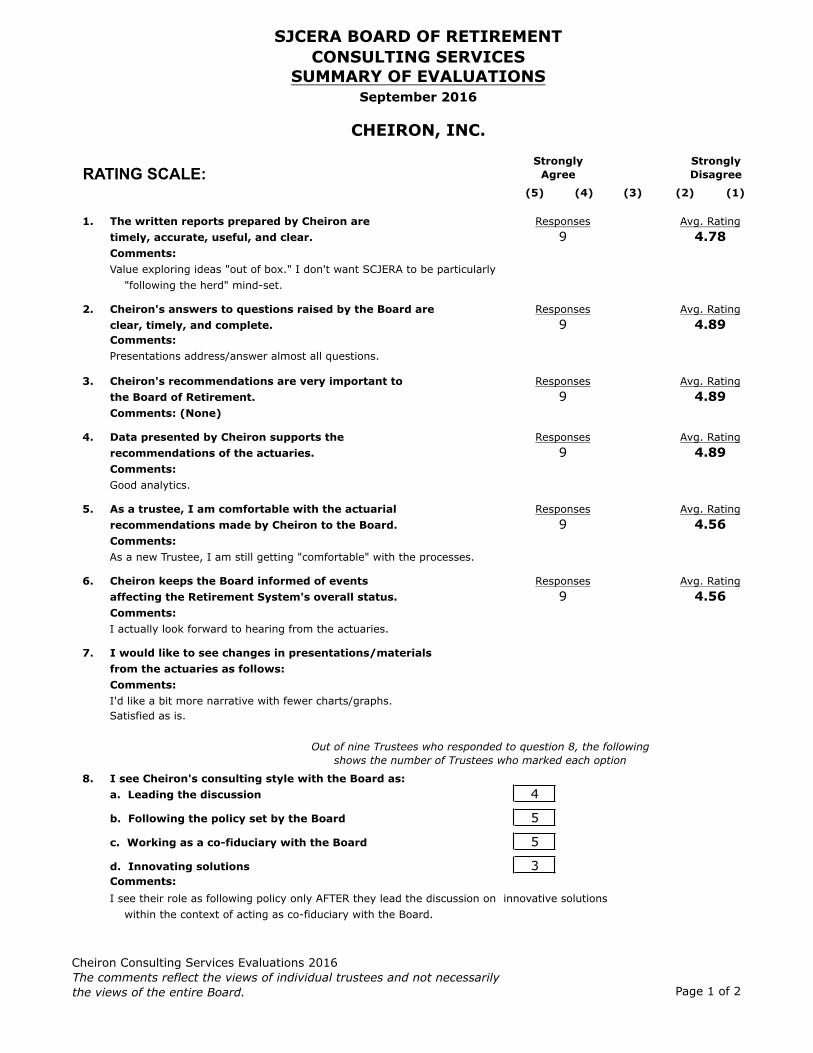
Cheiron Consulting Services Evaluations 2016The comments reflect the views of individual trustees and not necessarilythe views of the entire Board. Page 1 of 2
RATING SCALE:(5) (4) (3) (2) (1)
1. The written reports prepared by Cheiron aretimely, accurate, useful, and clear.Comments:
"following the herd" mind-set.
2. Cheiron's answers to questions raised by the Board are clear, timely, and complete.Comments: Presentations address/answer almost all questions.
3. Cheiron's recommendations are very important tothe Board of Retirement.Comments: (None)
4. Data presented by Cheiron supports therecommendations of the actuaries.Comments: Good analytics.
5. As a trustee, I am comfortable with the actuarialrecommendations made by Cheiron to the Board.Comments: As a new Trustee, I am still getting "comfortable" with the processes.
6. Cheiron keeps the Board informed of eventsaffecting the Retirement System's overall status.Comments:
7. I would like to see changes in presentations/materialsfrom the actuaries as follows:Comments:
8. I see Cheiron's consulting style with the Board as:a. Leading the discussion 4
b. Following the policy set by the Board 5
c. Working as a co-fiduciary with the Board 5
d. Innovating solutions 3Comments:
within the context of acting as co-fiduciary with the Board.
Satisfied as is.
9
Responses Avg. Rating9
Responses
I'd like a bit more narrative with fewer charts/graphs.
4.89
4.56
Responses Avg. Rating9 4.56
Value exploring ideas "out of box." I don't want SCJERA to be particularly
SJCERA BOARD OF RETIREMENT
Strongly Agree
SUMMARY OF EVALUATIONS
CHEIRON, INC.
September 2016
CONSULTING SERVICES
9 4.78
Avg. Rating
Avg. RatingResponses
4.89Responses Avg. Rating
9
Avg. Rating
I actually look forward to hearing from the actuaries.
Responses4.899
I see their role as following policy only AFTER they lead the discussion on innovative solutions
Strongly Disagree
Out of nine Trustees who responded to question 8, the following shows the number of Trustees who marked each option

Cheiron Consulting Services Evaluations 2016The comments reflect the views of individual trustees and not necessarilythe views of the entire Board. Page 2 of 2
9. The consulting role I would prefer from Cheiron is:a. Leading the discussion 2
b. Following the policy set by the Board 3
c. Working as a co-fiduciary with the Board 4
d. Innovating solutions 2
Comments:
recommended.
RATING SCALE:(5) (4) (3) (2) (1)
10. I have no concerns with Cheiron as a firm.If you "disagree" (2 or less), please explain.
11. I have no concerns with the consulting actuariesassigned to SJCERA? If you "disagree" (2 or less), please explain.Comments:Now who could have concerns about Graham?Some of the best in the business.
12. I think there is a need for more training by the actuary on the fundamentals of plan funding and cost. Comments:
13. The plan and/or funding issues or areas of concern I would like the actuaryto address in the next twelve months are:(Please rank in order of importance to you with "1"the highest priority)
SJCERA Funding Policy
Impact of 2012 Pension Reform Act
Volatility of employer contributions
Mortality assumptions and experience
Economic Assumptions (real rate of return, inflation, etc.)
"Stable Funding" (asset/liability matching as introduced May 2008)
Other (please describe below and rank): (None)
14. What additional information or services would you like to see from the actuaries?
15. Other remarks: (None)
9
Responses
Avg. Rating
Responses Avg. Rating9 3.67
This underpins all our decisions, so I believe we cannot have "too much" training on
1
4.67
Responses
I think there is a need for ongoing training.
3
RANK
(None)
these fundamentals of plan funding and cost.
I think the actuary is a good partner with SJCERA and appreciate the work they do for us. No changes
5
4.67
Strongly Agree
Avg. Rating9
I want, and expect, their experienced input, expertise and strong leadership to help us develop
At this point, I have no reason for concern; that could change.
6
Strongly Disagree
Out of eight Trustees who responded to question 9, the following shows the number of Trustees who marked each option
42
policies. Then I want them to implement those policies.

Pension Consulting Alliance, LLC. Evaluations 2016The comments reflect the views of individual trustees and not necessarilythe views of the entire Board. Page 1 of 3
RATING SCALE:(5) (4) (3) (2) (1)
1. The written reports prepared by PCA are timely, accurate, useful, and clearComments:
2. PCA's answers to questions raised by the Board are clear, timely, and completeComments:
3. PCA's recommendations are very important to the Boardof Retirement.Comments:
4. Data presented by PCA supports the recommendationsof the consultant.Comments: (None)
5. As a trustee, I am comfortable with the consultantrecommendations to the BoardComments:
6. PCA keeps the Board informed of eventsaffecting the fund's investments.Comments: (None)
7. Is it important to meet with the consultant every month?Comments:
8. I would like to see changes in presentations/materials from the
consultant as follows:
Highly valued.
Responses
4.89
The market sentiment charts are a bit over-the-top, maybe not necessary.
SJCERA BOARD OF RETIREMENT
Strongly Agree
Strongly Disagree
SUMMARY OF EVALUATIONS
PENSION CONSULTING ALLIANCE, LLC.
September 2016
CONSULTING SERVICES
9
9
9
4.89
Avg. Rating
Would like a little more Pros/Cons of possible alternatives.
4.89
Responses Avg. Rating4.89
Reports are still excellent.
Avg. Rating9
Responses
Avg. Rating9
Avg. Rating9 4.78
Responses Avg. Rating9 4.78
4.89
Show clear understanding and depth of knowledge.
Responses
Responses
Avg. Rating
Responses
Their input and analysis of the most current market impacts are critical
As a new Trustee, I am still getting comfortable with the processes.
Mostly; maybe skip one month during the year depending on events.
Both have excellent depth and breath of knowledge.
to the informed and appropriate decision-making process of the Board.
Appreciate that we continue to evolve in reporting and presentation.No. I like the format of the reports and find them user-friendly.

Pension Consulting Alliance, LLC. Evaluations 2016The comments reflect the views of individual trustees and not necessarilythe views of the entire Board. Page 2 of 3
making good decisions.
9. I see PCA's consulting style with the Board as:a. Leading the discussion 5
b. Following the policy set by the board 3
c. Working as a co-fiduciary with the Board 6
d. Innovating solutions 4Comments:
10. The consulting style I would prefer from PCA is:a. Leading the discussion 4
b. Following the policy set by the board 1
c. Working as a co-fiduciary with the Board 5
d. Innovating solutions 3
Comments: I see them as our CIO.
11. The investment issues or areas of concern I would like the consultant to addressin the next twelve months are:Continue on the same direction.
anticipated benchmark/goals.
portfolio.
I think PCA is doing exactly what I hoped they would. To the point, I am thrilled to have them!
Continue to seek ways to maximize return in a low interest rate environment at a reasonable rate of risk.Given our implementation of CRO, how can SJCERA hit our investment return targets and implement
Nothing specific I would change.
did not take, how it would have looked. Looking for confirmation that the Board is
meeting expectations. Monitor and adjust benchmarks if it becomes obvious they do not align with our
changes in style or portfolio strategies.
that is being presented by the Consultant, but I would like to say that I appreciate the
PCA has made great strides in providing the Board a new way to view our portfolio. No
Out of seven Trustees who responded to question 10, the following shows the number of Trustees who marked each option
Out of nine Trustees who responded to question 9, the following shows the number of Trustees who marked each option
information. It is very detailed and easy to understand, even for a beginner. Maybe not helpful but sometimes wonder if shadowed/tracked a fund or allocation the Board
We set policy after the first three have been completed. Co-fiduciary is a given.
How to "mechanically" maintain the desired asset allocation. Monitor returns and risk to assure they are
objectives. Conversely, monitor the investments to assure the managers have not deviated from our
Parametric has product "Defense Equity"; evaluate if it has value and if there's room to include in the our policy of 85% funding?
I want and expect PCA to continue providing their strong leadership and industry expertise to assist the Board in making sound policy decisions. Really very comfortable with relationship.
I do not have any changes I would like to see as I am still getting used to the information
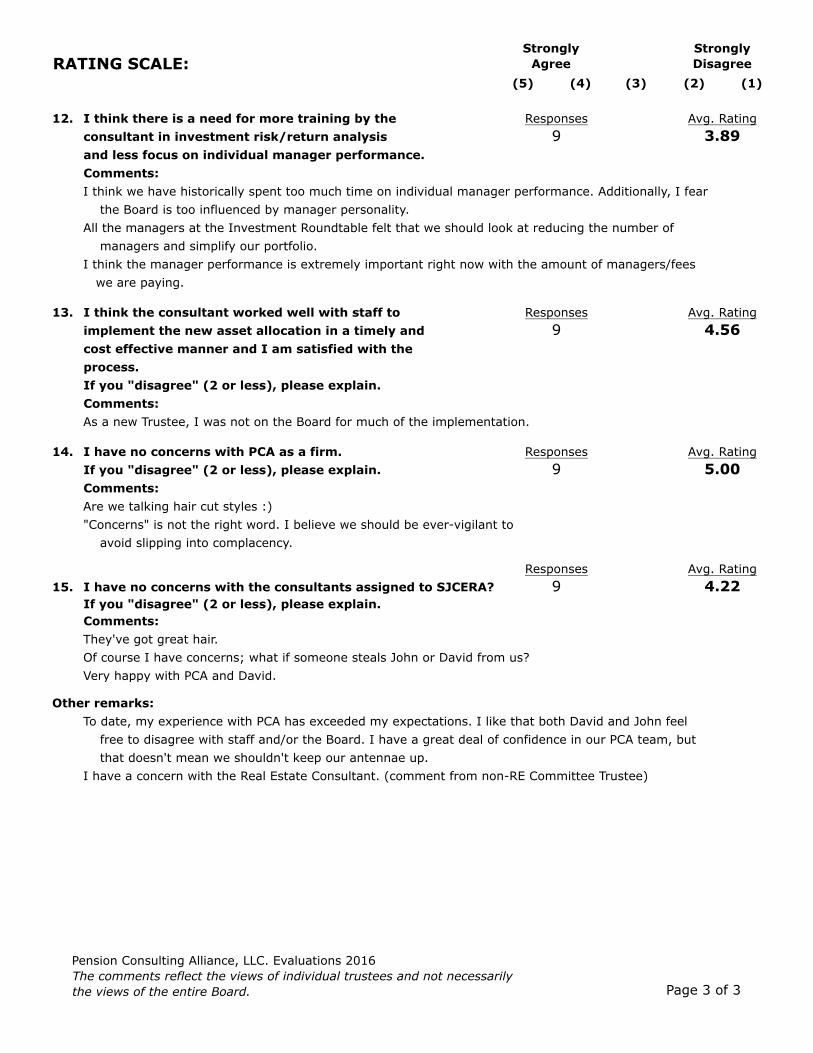
Pension Consulting Alliance, LLC. Evaluations 2016The comments reflect the views of individual trustees and not necessarilythe views of the entire Board. Page 3 of 3
RATING SCALE:(5) (4) (3) (2) (1)
12. I think there is a need for more training by theconsultant in investment risk/return analysis and less focus on individual manager performance.Comments:
managers and simplify our portfolio.
13. I think the consultant worked well with staff toimplement the new asset allocation in a timely andcost effective manner and I am satisfied with theprocess.If you "disagree" (2 or less), please explain.
14. I have no concerns with PCA as a firm. If you "disagree" (2 or less), please explain.Comments: Are we talking hair cut styles :)
15. I have no concerns with the consultants assigned to SJCERA?If you "disagree" (2 or less), please explain.Comments:
Very happy with PCA and David.
Other remarks:
9Responses
As a new Trustee, I was not on the Board for much of the implementation.
9 4.22
Responses
They've got great hair.
Avg. Rating
Comments:
Strongly Agree
Strongly Disagree
3.89
5.00Avg. Rating
Responses
Responses Avg. Rating
9 4.56
9
that doesn't mean we shouldn't keep our antennae up. I have a concern with the Real Estate Consultant. (comment from non-RE Committee Trustee)
the Board is too influenced by manager personality.All the managers at the Investment Roundtable felt that we should look at reducing the number of
"Concerns" is not the right word. I believe we should be ever-vigilant to avoid slipping into complacency.
Of course I have concerns; what if someone steals John or David from us?
Avg. Rating
I think the manager performance is extremely important right now with the amount of managers/fees we are paying.
To date, my experience with PCA has exceeded my expectations. I like that both David and John feel free to disagree with staff and/or the Board. I have a great deal of confidence in our PCA team, but
I think we have historically spent too much time on individual manager performance. Additionally, I fear

Courtland Consulting Services Evaluations 2016The comments reflect the views of individual trustees and not necessarilythe views of the entire Real Estate Committee. Page 1 of 2
RATING SCALE:(5) (4) (3) (2) (1)
1. The written reports prepared by CP are timely, accurate,useful, and clear.Comments:
needs to be addressed.
2. CP's answers to questions raised by the Real Estate Committee are clear, timely, and complete.
Comments: (None)
3. CP's recommendations are very important to the RE Committee.Comments: (None)
4. Data presented by CP supports the recommendations of the consultant.
Comments:
5. As a trustee, I am comfortable with the consultantrecommendations to the RE Committee.Comments: (None)
6. CP keeps the RE Committee informed of events affecting the fund's real estate investments.Comments: (None)
7. Is it important to meet with the consultant every quarter?Comments: (None)
8. I would like to see changes in presentations/materials from the consultant as follows:
9. I see CP's consulting style with the RE Committee as:
a. Leading the discussion 1
b. Following the policy set by the RE Committee 1
c. Working as a co-fiduciary with the RE Committee
d. Innovating solutionsComments:
Responses Avg. Rating3 4.00
Responses Avg. Rating
When the CIO can't explain the numbers, there is something that
CONSULTING SERVICESSJCERA BOARD OF RETIREMENT
Strongly Agree
SUMMARY OF EVALUATIONS
COURTLAND PARTNERS
September 2016
5.00
As requested several times, we need an extensive education session for the entire Board (because the RE Committee changes) on how to read and interpret return numbers.
I don't feel like they do items a, c, or d.All of the above.
be omitted data that might support other recommendations.
3
The data presents the recommendations, but there seems to
3 3.33
The RE Committee requests changes in reporting as appropriate when they come up.
Responses
Responses Avg. Rating
Responses Avg. Rating
5.00
2
Avg. Rating3 4.67
3 4.00
Responses Avg. Rating3
5.00
Responses Avg. Rating
Out of two Trustees who responded to question 9, the following shows the number of Trustees who marked each option
Strongly Disagree

Courtland Consulting Services Evaluations 2016The comments reflect the views of individual trustees and not necessarilythe views of the entire Real Estate Committee. Page 2 of 2
10. The consulting style I would prefer from CP is:
a. Leading the discussion
b. Following the policy set by the RE Committee
c. Working as a co-fiduciary with the RE Committee 2
d. Innovating solutions
Comments:
11.address in the next twelve month are:
RATING SCALE:(5) (4) (3) (2) (1)
12. I think there is a need for more training by theconsultant in investment risk/return analysis and less focus on individual manager performance.Comments:
13. I have no concerns with CP as a firm.If you "disagree" (2 or less), please explain.Comments: (None)
14. I have no concerns with the consultant assigned to SJCERA. If you "disagree" (2 or less), please explain.Comments: (None)
15. Other remarks: (None)
More training is always good! Appreciate the upcoming information on IRR versus time-weighted return comparisons.
The Consultant is doing a good job for SJCERA's RE program.
but we spend entirely too much time on real estate and individual managers. I feel the real estate
Can SJCERA make its 7.5% return target? someone doesn’t mean we should invest funds assets with them.
2
Responses Avg. Rating2.00
Responses
portfolio is too personality/relationship driven; just because we like going out to dinner with
Avg. Rating
Strongly Agree
It seems that the Consultant has a list of favored vendors and is reluctant to entertain the idea that other managers should be considered. I feel the Consultant is too easily influenced by one or two staff or Committee members and disregards the comments or concerns of others. Not their fault
Responses Avg. Rating
Out of two Trustees who responded to question 9, the following shows the number of Trustees who marked each option
The real estate investment issues or areas of concern I would like the consultant to
Strongly Disagree
2 4.50
3.00
2

September 2016
PCA INVESTMENT MARKET RISK METRICS
Monthly Report

PENSION CONSULTING ALLIANCE, LLC.• Investment Market Risk Metrics 2
• The 10-year Treasury interest rate ended the month at 1.6%, near all-time lows.
• U.S. public equity and private equity valuations remain extended.
• Private real estate valuations are historically high, but not relative to their financing, which tends to be driven by 10-year Treasury rates.
• Non-U.S. developed and emerging market valuations are historically cheap.
• Bond spreads continued tightened and are picking up some positive (tightening) momentum.
• 10-year breakeven inflation remains near 1.5%, (bottom decile territory), and commodity prices remain at decades-low levels inflation adjusted. (page 10)
• The yield curve flattened more (page 9), as the 10-year Treasury yield declined, and the 1-year yield hardly moved.
• Real yields (page 9) are revisiting negative levels seen in 2011 to 2013, indicating growth concerns, particularly outside the U.S.
• The PCA Market Sentiment Indicator switched to green at the end of August(page 4), with spreads narrowing, and turning positive year-over-year, in conjunction with year-over-year positive equity returns.
Takeaways
1See Appendix for the rationale for selection and calculation methodology used for the risk metrics.

Monthly Report - September 2016
Risk Overview
US Equity(page 5)
Dev ex‐USEquity(page 5)
EM EquityRelative toDM Equity(page 6)
PrivateEquity(page 6)
PrivateRealEstate
Cap Rate(page 7)
PrivateRealEstateSpread(page 7)
US IG CorpDebtSpread(page 8)
US HighYield DebtSpread(page 8)
Valuation Metrics versus Historical Range A Measure of Risk
Top Decile
Bottom Decile
Average
UnfavorablePricing
Favorable Pricing
Neutral
Equity Volatility(page 9)
Yield Curve Slope(page 9)
Breakeven Inflation(page 10)
Interest Rate Risk(page 11)
Other Important Metrics within their Historical RangesPay Attention to Extreme Readings
Top Decile
Bottom Decile
Average
Attention!
Attention!
Neutral
PENSION CONSULTING ALLIANCE, LLC. • Investment Market Risk Metrics 3

Monthly Report - September 2016
Market Sentiment
Information Behind Current Sentiment Reading
Bond Spread Momentum Trailing‐Twelve Months PositiveEquity Return Momentum Trailing‐Twelve Months PositiveAgreement Between Bond Spread and Equity Spread Momentum Measures? Agree
Growth Risk Visibility (Current Overall Sentiment) Positive
PCA Market Sentiment Indicator (1995‐Present)
Avoid Growth Risk Growth Risk Neutral Embrace Growth Risk PCA Sentiment Indicator
Positive
Negative
Neutral
Positive
Neutral
Negative
PCA Market Sentiment Indicator ‐ Most Recent 3‐Year Period
Avoid Growth Risk Growth Risk Neutral Embrace Growth Risk PCA Sentiment Indicator
Positive
Negative
Neutral
Positive
Neutral
Negative
PENSION CONSULTING ALLIANCE, LLC. • Investment Market Risk Metrics 4
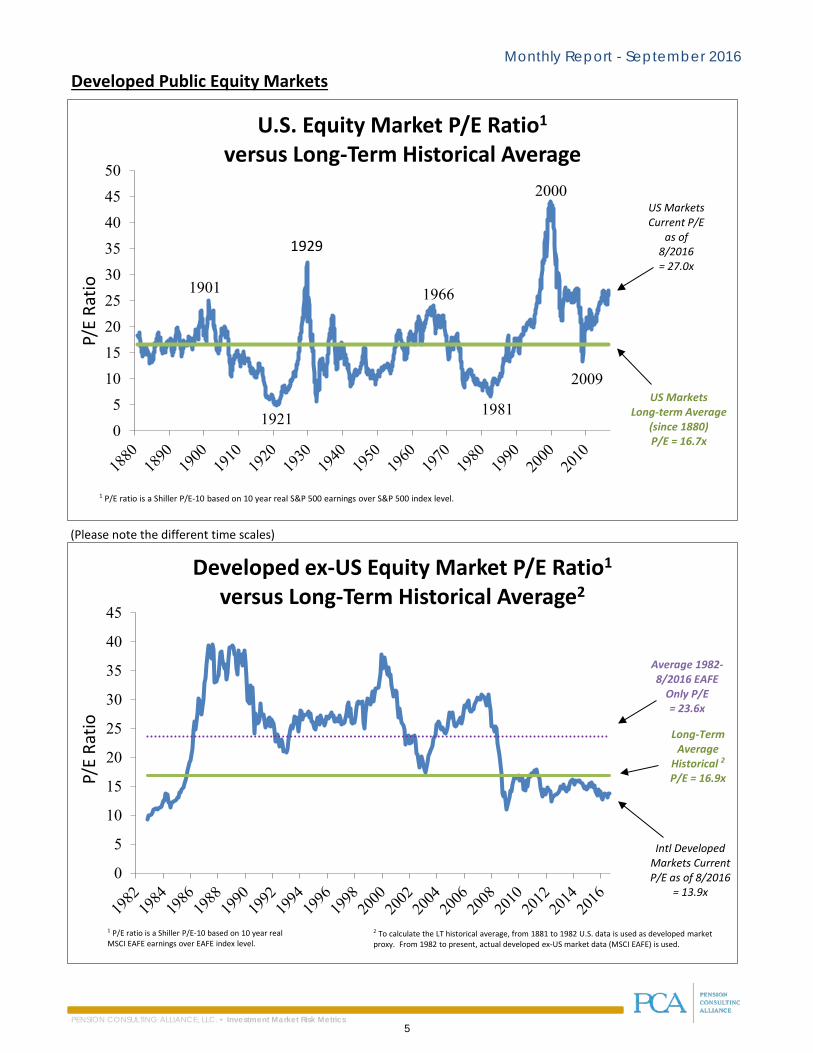
Monthly Report - September 2016
PENSION CONSULTING ALLIANCE, LLC. • Investment Market Risk Metrics 5
Developed Public Equity Markets
(Please note the different time scales)
0
5
10
15
20
25
30
35
40
45
P/E
Ratio
Developed ex-US Equity Market P/E Ratio1
versus Long-Term Historical Average2
Long-Term Average
Historical 2
P/E = 16.9x
Intl Developed Markets Current P/E as of 8/2016
= 13.9x
1 P/E ratio is a Shiller P/E-10 based on 10 year real MSCI EAFE earnings over EAFE index level.
2 To calculate the LT historical average, from 1881 to 1982 U.S. data is used as developed market proxy. From 1982 to present, actual developed ex-US market data (MSCI EAFE) is used.
Average 1982-8/2016 EAFE
Only P/E = 23.6x
05
101520253035404550
P/E
Ratio
U.S. Equity Market P/E Ratio1
versus Long-Term Historical Average
1966
2000
19811921
1929
US MarketsLong-term Average
(since 1880) P/E = 16.7x
US Markets Current P/E
as of 8/2016 = 27.0x
1 P/E ratio is a Shiller P/E-10 based on 10 year real S&P 500 earnings over S&P 500 index level.
2009
1901

Monthly Report - September 2016
PENSION CONSULTING ALLIANCE, LLC. • Investment Market Risk Metrics 6
Emerging Market Public Equity Markets
US Private Equity Quarterly Data, Updated to June 30th.
0%25%50%75%
100%125%150%175%200%225%250%275%
Emerging Markets PE / Developed Markets PE(100% = Parity between PE Ratios)
EM/DM PE Average EM/DM PE ParitySource: Bloomberg, MSCI World, MSCI EMF
Asian Crisis
Russian Crisis, LTCM implosion, currency devaluations
Technology and Telecom Crash
Commodityprice runup
WorldFinancial Crisis
EM/DM relative PE ratio is slightly below the historical average
5.0
6.0
7.0
8.0
9.0
10.0
11.0
Price to EBITDA Multiples Paid in LBOs
(updated to July 31st)
Source: S&P LCD study, data presented is on 1-month lag
Average since 1997.
0
50
100
150
200
250
Billi
ons
($)
Disclosed U.S. Quarterly Deal Volume*
Source: Thomson Reuters Buyouts* quarterly total deal size (both equity and debt)
Deal volume has decreased to its lowest level since
Multiples have risen above the pre-crisis highs.
Mexican Peso Crisis

Monthly Report - September 2016
PENSION CONSULTING ALLIANCE, LLC. • Investment Market Risk Metrics 7
Private Real Estate Markets Quarterly Data, Updated to June. 30th
0.0%1.0%2.0%3.0%4.0%5.0%6.0%7.0%8.0%9.0%
10.0%
Cap
Rat
e
Core Real Estate Current Value Cap Rates1
Core Cap RateLT Average Cap Rate10 Year Treasury Rate
Sources: NCRIEF, www.ustreas.gov 1A cap rate is the current annual income of the property divided by an estimate of the current value of the property . It is the current yield of the property. Low cap rates indicate high valuations.
Core real estate cap rates remain low by historical standards (expensive).
0.00%
5.00%
10.00%
15.00%
20.00%
Transactions as a % of Market Value Trailing-Four Quarters (a measure of property turnover activity)
Source: NCREIF, PCA calculation
Activity has slowly been increasing since Q4 2014.
0.0%
1.0%
2.0%
3.0%
4.0%
5.0%
Cap
Rat
e Sp
read
Core Cap Rate Spread over 10-Year Treasury Interest Rate
Core Cap Rate Spread to Treasuries
LT Average Spread
Spread to the 10-year Treasury ticked up due to a decline in the 10-year yield.
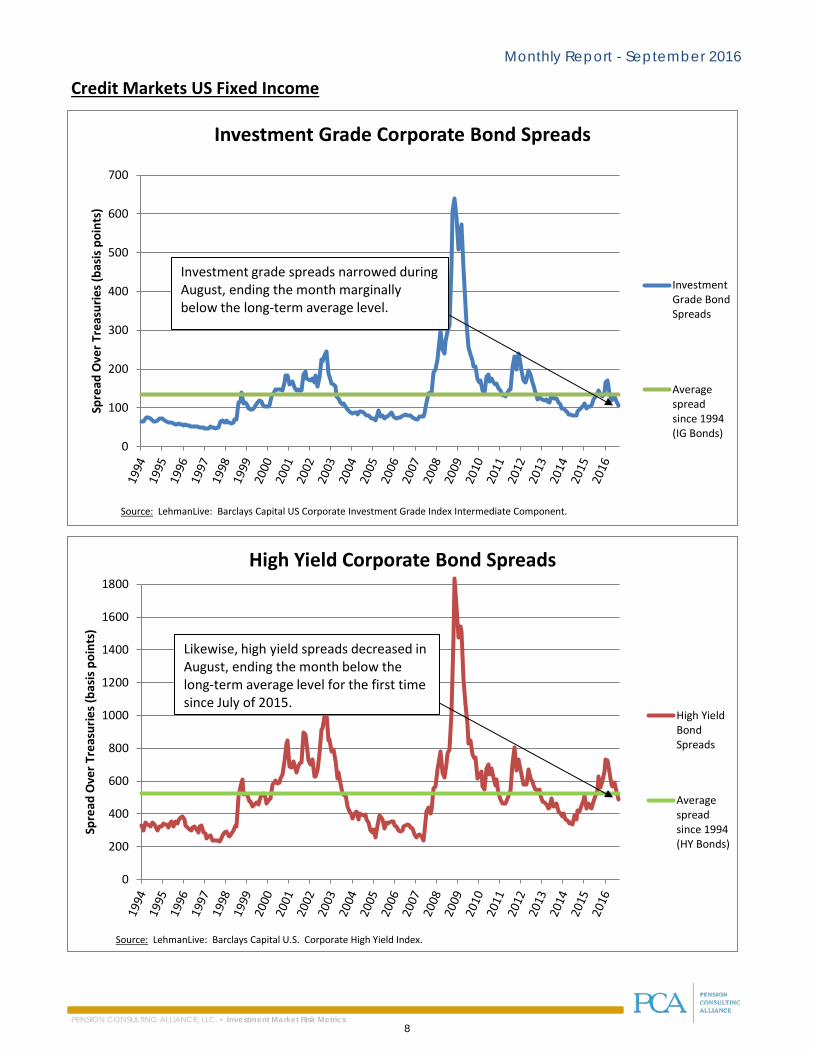
Monthly Report - September 2016
PENSION CONSULTING ALLIANCE, LLC. • Investment Market Risk Metrics 8
Credit Markets US Fixed Income
0
100
200
300
400
500
600
700
Spre
ad O
ver T
reas
urie
s (ba
sis p
oint
s)
Investment Grade Corporate Bond Spreads
InvestmentGrade BondSpreads
Averagespreadsince 1994(IG Bonds)
Source: LehmanLive: Barclays Capital US Corporate Investment Grade Index Intermediate Component.
Investment grade spreads narrowed during August, ending the month marginally below the long-term average level.
0
200
400
600
800
1000
1200
1400
1600
1800
Spre
ad O
ver T
reas
urie
s (ba
sis p
oint
s)
High Yield Corporate Bond Spreads
High YieldBondSpreads
Averagespreadsince 1994(HY Bonds)
Source: LehmanLive: Barclays Capital U.S. Corporate High Yield Index.
Likewise, high yield spreads decreased in August, ending the month below the long-term average level for the first time since July of 2015.

Monthly Report - September 2016
PENSION CONSULTING ALLIANCE, LLC. • Investment Market Risk Metrics 9
Other Market Metrics
0
10
20
30
40
50
60
70
80
VIX - a measure of equity market fear / uncertainty
Source: http://www.cboe.com/micro/vix/historical.aspx
Equity market volatility (VIX) was essentially unchanged throughout August, ending the month meaningfully below the long-term average level (≈ 20) at 13.4.
-3.0
-2.0
-1.0
0.0
1.0
2.0
3.0
4.0
5.0
Yield Curve Slope
Source: www.ustreas.gov (10 yr treasury yield minus 1 year treasury yield)Recession Dating: NBER http://www.nber.org/cycles.html
Yield curve slopes that are negative (inverted) portend a recession.
The average 10-year Treasury interest rate ticked up in August. The average one-year Treasury interest rate also ticked up during the month. There was no change in slope for the month, and the yield curve remains upward sloping.

Monthly Report - September 2016
PENSION CONSULTING ALLIANCE, LLC. • Investment Market Risk Metrics 10
Measures of Inflation Expectations
(Please note the different time scales)
0.00%
0.50%
1.00%
1.50%
2.00%
2.50%
3.00%
10-Year Breakeven Inflation(10-year nominal Treasury yield minus 10-year TIPS yield)
Source: www.ustreas.gov
Breakeven inflation ended August at 1.47%, slightly decreasing from the end of July. The 10-year TIPS real-yield rose to 0.11%, and the nominal 10-year Treasury yield ticked up to 1.58%.
0
20
40
60
80
100
120
140
160
Inflation Adjusted Dow Jones UBS Commodity Price Index (1991 = 100)
Broad commodity prices ticked down in August but continue to remain marginally above the historical lows set in early 2016.
Source: Bloomberg Commodity Index, St. Louis Fed for US CPI all urban consumers.
Monthly Report - September 2016
PENSION CONSULTING ALLIANCE, LLC. • Investment Market Risk Metrics 11
Measures of U.S. Treasury Interest Rate Risk
-2.0
0.0
2.0
4.0
6.0
8.0
10.0
Expe
cted
Rea
l Yie
ld o
f 10-
Year
Tre
asur
y
Estimate of 10-Year Treasury Forward-Looking Real Yield
Sources: www.ustreas.gov for 10-year constant maturity rates*Federal Reserve Bank of Philadelphia survey of professional forecasts for inflation estimates
The forward-looking annual real yield on 10-year Treasuries is estimated at approximately -0.59% real, assuming 10-year annualized inflation of 2.15%* per year.
4.00
4.50
5.00
5.50
6.00
6.50
7.00
7.50
8.00
8.50
9.00
9.50
10-Y
ear T
reas
ury
Bond
Dur
atio
n
10-Year Treasury Duration (Change in Treasury price with a change in interest rates)
Source: www.ustreas.gov for 10-year constant maturity rates, calculation of duration
Lower Risk
Higher Risk Interest rate risk is at an all-time high.
If the 10-year Treasury yield rises by 100 basis points from today's levels, the capital loss from the change in price is expected to be -9.2%.

PENSION CONSULTING ALLIANCE, LLC • Investment Market Risk Metrics
Appendix

PENSION CONSULTING ALLIANCE, LLC • Investment Market Risk Metrics
Appendix
METRIC DESCRIPTION, RATIONALE FOR SELECTION AND CALCULATION METHODOLOGY
US Equity Markets:
Metric: P/E ratio = Price / “Normalized” earnings for the S&P 500 Index
To represent the price of US equity markets, we have chosen the S&P 500 index. This index has thelongest published history of price, is well known, and also has reliable, long-term, published quarterlyearnings. The price=P of the P/E ratio is the current price of the market index (the average daily price ofthe most recent full month for the S&P 500 index). Equity markets are very volatile. Prices fluctuatesignificantly during normal times and extremely during periods of market stress or euphoria. Therefore,developing a measure of earnings power (E) which is stable is vitally important, if the measure is toprovide insight. While equity prices can and do double, or get cut in half, real earnings power does notchange nearly as much. Therefore, we have selected a well known measure of real, stable earningspower developed by Yale Professor Robert Shiller known as the Shiller E-10. The calculation of E-10 issimply the average real annual earnings over the past 10 years. Over 10 years, the earnings shenanigansand boom and bust levels of earnings tend to even out (and often times get restated). Therefore, thisearnings statistic gives a reasonably stable, slow-to-change estimate of average real earnings power forthe index. Professor Shiller’s data and calculation of the E-10 are available on his website athttp://www.econ.yale.edu/~shiller/data.htm. We have used his data as the base for our calculations.Details of the theoretical justification behind the measure can be found in his book Irrational Exuberance[Princeton University Press 2000, Broadway Books 2001, 2nd ed., 2005].
Developed Equity Markets Excluding the US:
Metric: P/E ratio = Price / “Normalized” earnings for the MSCI EAFE Index
To represent the price of non-US developed equity markets, we have chosen the MSCI EAFE index. Thisindex has the longest published history of price for non-US developed equities. The price=P of the P/Eratio is the current price of the market index (the average daily price of the most recent full month for theMSCI EAFE index). The price level of this index is available starting in December 1969. Again, for thereasons described above, we elected to use the Shiller E-10 as our measure of earnings (E). Since12/1972, a monthly price earnings ratio is available from MSCI. Using this quoted ratio, we have backedout the implied trailing-twelve month earnings of the EAFE index for each month from 12/1972 to thepresent. These annualized earnings are then inflation adjusted using CPI-U to represent real earnings inUS dollar terms for each time period. The Shiller E-10 for the EAFE index (10 year average real earnings) iscalculated in the same manner as detailed above.
However, we do not believe that the pricing and earnings history of the EAFE markets are long enough tobe a reliable representation of pricing history for developed market equities outside of the US. Therefore,in constructing the Long-Term Average Historical P/E for developed ex-US equities for comparisonpurposes, we have elected to use the US equity market as a developed market proxy, from 1881 to 1982.This lowers the Long-Term Average Historical P/E considerably. We believe this methodology provides amore realistic historical comparison for a market with a relatively short history.

PENSION CONSULTING ALLIANCE, LLC • Investment Market Risk Metrics
Appendix
METRIC DESCRIPTION, RATIONALE FOR SELECTION AND CALCULATION METHODOLOGY
Emerging Market Equity Markets:
Metric: Ratio of Emerging Market P/E Ratio to Developed Market P/E Ratio
To represent the Emerging Markets P/E Ratio, we have chosen the MSCI Emerging Market Free Index, whichhas P/E data back to January 1995 on Bloomberg. To represent the Developed Markets PE Ratio, we havechosen the MSCI World Index, which also has data back to January 1995 on Bloomberg. Although thereare issues with published, single time period P/E ratios, in which the denominator effect can cause largemovements, we feel that the information contained in such movements will alert investors to market activitythat they will want to interpret.
US Private Equity Markets:
Metrics: S&P LCD Average EBITDA Multiples Paid in LBOs and US Quarterly Deal Volume
The Average Purchase Price to EBITDA multiples paid in LBOs is published quarterly by S&P in their LCD study.This is the total price paid (both equity and debt) over the trailing-twelve month EBITDA (earnings beforeinterest, taxes, depreciation and amortization) as calculated by S&P LCD. This is the relevant, high-levelpricing metric that private equity managers use in assessing deals. Data is published monthly.
US quarterly deal volume for private equity is the total deal volume in $ billions (both equity and debt)reported in the quarter by Thomson Reuters Buyouts. This metric gives a measure of the level of activity inthe market. Data is published quarterly.
U.S Private Real Estate Markets:
Metrics: US Cap Rates, Cap Rate Spreads, and Transactions as a % of Market Value
Real estate cap rates are a measure of the price paid in the market to acquire properties versus theirannualized income generation before financing costs (NOI=net operating income). The data, published byNCREIF, describes completed and leased properties (core) on an unleveraged basis. We chose to usecurrent value cap rates. These are capitalization rates from properties that were revalued during thequarter. This data relies on estimates of value and therefore tends to be lagging (estimated prices areslower to rise and slower to fall than transaction prices). The data is published quarterly.
Spreads between the cap rate (described above) and the 10-year nominal Treasury yield, indicate ameasure of the cost of properties versus a current measure of the cost of financing.
Transactions as a % of Market Value Trailing-Four Quarters is a measure of property turnover activity in theNCREIF Universe. This quarterly metric is a measure of activity in the market.
Credit Markets US Fixed Income:
Metric: Spreads
The absolute level of spreads over treasuries and spread trends (widening / narrowing) are good indicatorsof credit risk in the fixed income markets. Spreads incorporate estimates of future default, but can also bedriven by technical dislocations in the fixed income markets. Abnormally narrow spreads (relative tohistorical levels) indicate higher levels of valuation risk, wide spreads indicate lower levels of valuation riskand / or elevated default fears. Investment grade bond spreads are represented by the Barclays CapitalUS Corporate Investment Grade Index Intermediate Component. The high yield corporate bond spreadsare represented by the Barclays Capital US Corporate High Yield Index.
PENSION CONSULTING ALLIANCE, LLC • Investment Market Risk Metrics
Appendix
METRIC DESCRIPTION, RATIONALE FOR SELECTION AND CALCULATION METHODOLOGY
Measure of Equity Market Fear / Uncertainty
Metric: VIX – Measure of implied option volatility for U.S. equity markets
The VIX is a key measure of near-term volatility conveyed by implied volatility of S&P 500 index optionprices. VIX increases with uncertainty and fear. Stocks and the VIX are negatively correlated. Volatilitytends to spike when equity markets fall.
Measure of Monetary Policy
Metric: Yield Curve Slope
We calculate the yield curve slope as the 10 year treasury yield minus the 1 year treasury yield. When theyield curve slope is zero or negative, this is a signal to pay attention. A negative yield curve slope signalslower rates in the future, caused by a contraction in economic activity. Recessions are typicallypreceded by an inverted (negatively sloped) yield curve. A very steep yield curve (2 or greater)indicates a large difference between shorter-term interest rates (the 1 year rate) and longer-term rates(the 10 year rate). This can signal expansion in economic activity in the future, or merely higher futureinterest rates.
Measures of US Inflation Expectations
Metrics: Breakeven Inflation and Inflation Adjusted Commodity Prices
Inflation is a very important indicator impacting all assets and financial instruments. Breakeven inflation iscalculated as the 10 year nominal treasury yield minus the 10 year real yield on US TIPS (treasury inflationprotected securities). Abnormally low long-term inflation expectations are indicative of deflationary fears.A rapid rise in breakeven inflation indicates an acceleration in inflationary expectations as marketparticipants sell nominal treasuries and buy TIPs. If breakeven inflation continues to rise quarter overquarter, this is a signal of inflationary worries rising, which may cause Fed action and / or dollar decline.
Commodity price movement (above the rate of inflation) is an indication of anticipated inflation causedby real global economic activity putting pressure on resource prices. We calculate this metric byadjusted in the Dow Jones UBS Commodity Index (formerly Dow Jones AIG Commodity Index) by US CPI-U.While rising commodity prices will not necessarily translate to higher US inflation, higher US inflation will likelyshow up in higher commodity prices, particularly if world economic activity is robust.
These two measures of anticipated inflation can, and often are, conflicting.
Measures of US Treasury Bond Interest Rate Risk
Metrics: 10-Year Treasury Forward-Looking Real Yield and 10-Year Treasury Duration
The expected annualized real yield of the 10 year U.S. Treasury Bond is a measure of valuation risk for U.S.Treasuries. A low real yield means investors will accept a low rate of expected return for the certainly ofreceiving their nominal cash flows. PCA estimates the expected annualized real yield by subtracting anestimate of expected 10 year inflation (produced by the Survey of Professional Forecasters as collectedby the Federal Reserve Bank of Philadelphia), from the 10 year Treasury constant maturity interest rate.
Duration for the 10-Year Treasury Bond is calculated based on the current yield and a price of 100. This is ameasure of expected percentage movements in the price of the bond based on small movements inpercentage yield. We make no attempt to account for convexity.
Definition of “extreme” metric readings
A metric reading is defined as “extreme” if the metric reading is in the top or bottom decile of its historicalreadings. These “extreme” reading should cause the reader to pay attention. These metrics havereverted toward their mean values in the past.

PCA Market Sentiment Indicator
Explanation, Construction and Q&A
© 2012 Pension Consulting Alliance, LLC. Reproduction of all or any part of this report is permissible ifreproduction contains notice of Pension Consulting Alliance’s copyright as follows: “Copyright © 2012by Pension Consulting Alliance, LLC.” Information is considered to be reliable but not guaranteed.This report is not intended to be an offer, solicitation, or recommendation to purchase any security ora recommendation of the services supplied by any money management organization unlessotherwise noted.
By:
Pension Consulting Alliance, LLC.
John Linder, CFA, CPA
Neil Rue, CFA
PCA has created the PCA Market Sentiment Indicator (PMSI) tocomplement our valuation-focused PCA Investment Market RiskMetrics. This measure of sentiment is meant to capture significantand persistent shifts in long-lived market trends of economic growthrisk, either towards a risk-seeking trend or a risk-aversion trend.
This paper explores:
What is the PCA Market Sentiment Indicator (PMSI)? How do I read the indicator graph? How is the PCA Market Sentiment Indicator (PMSI) constructed? What do changes in the indicator mean?
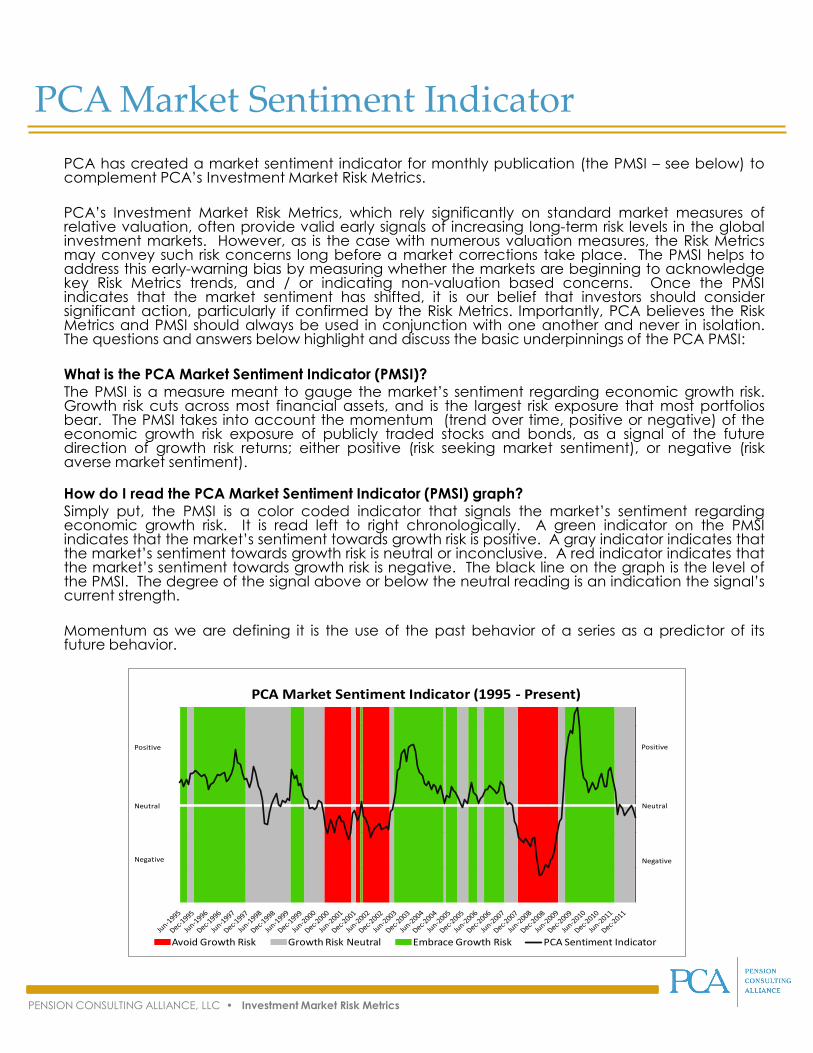
PENSION CONSULTING ALLIANCE, LLC • Investment Market Risk Metrics
PCA has created a market sentiment indicator for monthly publication (the PMSI – see below) tocomplement PCA’s Investment Market Risk Metrics.
PCA’s Investment Market Risk Metrics, which rely significantly on standard market measures ofrelative valuation, often provide valid early signals of increasing long-term risk levels in the globalinvestment markets. However, as is the case with numerous valuation measures, the Risk Metricsmay convey such risk concerns long before a market corrections take place. The PMSI helps toaddress this early-warning bias by measuring whether the markets are beginning to acknowledgekey Risk Metrics trends, and / or indicating non-valuation based concerns. Once the PMSIindicates that the market sentiment has shifted, it is our belief that investors should considersignificant action, particularly if confirmed by the Risk Metrics. Importantly, PCA believes the RiskMetrics and PMSI should always be used in conjunction with one another and never in isolation.The questions and answers below highlight and discuss the basic underpinnings of the PCA PMSI:
What is the PCA Market Sentiment Indicator (PMSI)?The PMSI is a measure meant to gauge the market’s sentiment regarding economic growth risk.Growth risk cuts across most financial assets, and is the largest risk exposure that most portfoliosbear. The PMSI takes into account the momentum (trend over time, positive or negative) of theeconomic growth risk exposure of publicly traded stocks and bonds, as a signal of the futuredirection of growth risk returns; either positive (risk seeking market sentiment), or negative (riskaverse market sentiment).
How do I read the PCA Market Sentiment Indicator (PMSI) graph?Simply put, the PMSI is a color coded indicator that signals the market’s sentiment regardingeconomic growth risk. It is read left to right chronologically. A green indicator on the PMSIindicates that the market’s sentiment towards growth risk is positive. A gray indicator indicates thatthe market’s sentiment towards growth risk is neutral or inconclusive. A red indicator indicates thatthe market’s sentiment towards growth risk is negative. The black line on the graph is the level ofthe PMSI. The degree of the signal above or below the neutral reading is an indication the signal’scurrent strength.
Momentum as we are defining it is the use of the past behavior of a series as a predictor of itsfuture behavior.
PCA Market Sentiment Indicator (1995 - Present)
Avoid Growth Risk Growth Risk Neutral Embrace Growth Risk PCA Sentiment Indicator
Positive
Negative
Neutral
Positive
Neutral
Negative
PCA Market Sentiment Indicator

PENSION CONSULTING ALLIANCE, LLC • Investment Market Risk Metrics
How is the PCA Market Sentiment Indicator (PMSI) Constructed?
The PMSI is constructed from two sub-elements representing investor sentiment in stocks andbonds:
1. Stock return momentum: Return momentum for the S&P 500 Equity Index (trailing 12-months)2. Bond yield spread momentum: Momentum of bond yield spreads (excess of the measured
bond yield over the identical duration U.S. Treasury bond yield) for corporate bonds (trailing12-months) for both investment grade bonds (75% weight) and high yield bonds (25% weight).The scale of this measure is adjusted to match that of the stock return momentum measure.
The black line reading on the graph is calculated as the average of the stock return momentummeasure and the bonds spread momentum measure. The color reading on the graph isdetermined as follows:
1. If both stock return momentum and bond spread momentum are positive = GREEN (positive)2. If one of the momentum indicators is positive, and the other negative = GRAY (inconclusive)3. If both stock return momentum and bond spread momentum are negative = RED (negative)
What does the PCA Market Sentiment Indicator (PMSI) mean? Why might it be useful?
There is strong evidence that time series momentum is significant and persistent. In particular,across an extensive array of asset classes, the sign of the trailing 12-month return (positive ornegative) is indicative of future returns (positive or negative) over the next 12 month period. ThePMSI is constructed to measure this momentum in stocks and corporate bond spreads. A readingof green or red is agreement of both the equity and bond measures, indicating that it is likely thatthis trend (positive or negative) will continue over the next 12 months. When the measuresdisagree, the indicator turns gray. A gray reading does not necessarily mean a new trend isoccurring, as the indicator may move back to green, or into the red from there. The level of thereading (black line) and the number of months at the red or green reading, gives the useradditional information on which to form an opinion, and potentially take action.
I Momentum as we are defining it is the use of the past behavior of a series as a predictor of its future behavior.
ii “Time Series Momentum” Moskowitz, Ooi, Pedersen, August 2010
http://pages.stern.nyu.edu/~lpederse/papers/TimeSeriesMomentum.pdf
PCA Market Sentiment Indicator

SJCERA - CIO Report August 17, 2016Calendar Year 2016 Proposed Topics and Meeting Schedule
January 22, 2016 February 26, 2016 March 25, 2016
1. Monthly Flash Report (Dec 2016) 1. Monthly Flash Report (January) 1. Monthly Flash Report (February)2. CRO Systematic Trend Following Manager 2. Quarterly Reports (4Q15) 2. CRO: Alt. Risk Premia Manager Interviews Interviews: Man AHL, AlphaSimplex, Graham 3. CRO: Alt Risk Premia Search Memo AQR and P/E 3. 2016 Investment Program Plan 4. Real Estate Implementation Plan Approval 3. Continue rebalancing to the new AA targets4. Risk Parity Investment Policy Revisions 5. Manager DD Memos and Review Schedule
6. Rebalancing to new AA targets; funded Long Duration portfolio
5. RE Committee Meeting 2016 RE Implementation Plan Recomm. 7. RE Committee Meeting
Quarterly Report (3Q15)
8. CRO Investment Policy INV -1400 2/12/2016April 29. 2016 May 20, 2016 June 24, 2016
1. Monthly Flash Report (March) 1. Monthly Flash Report (April) 1. Monthly Flash Report (May)2. Mt. Lucas Managed Futures Review 2. Manager Compliance (1Q16) 2. Manager Meeting (1)3. Manager DD Memos and Review Schedule 3. Review of SJCERA Investment Policies 3. Policy Revisions
4. Adding Treasuries to PIOS IMA 4. Proposal for Investment Mgr. Roundtable 4. RE Committee recommendation - investment 5. Manager DD Memos and Review Schedule 5. Mgr Mtgs & Education for remainder 2016 over $25 million
6. Portfolio Rebalancing Update 6. Mgr.DD Meetings & Reports7. Investment Contracts June 9, 2016 RE Committee
Quarterly reports and RE RoundtableJune 10, 2016 Regular Mtg.
Quarterly Performance report (1Q16)
July 22, 2016 August 2016 September 23, 2016
1. Monthly Flash Report (June) August 17 & 18 1. Monthly Flash Report (August)2. Educational Session - Global Equity Financial Board meeting (August 17) 2. Capital Prospects Presentation3. Policy Revisions Monthly Flash Report (July) 3. Legato Presentation4. All Asset Investment Mgr, Roundtable Agenda Quarterly Reports (2Q16) 4. Roundtable Recap Memo
Demographic & Economic Actuarial Assumptions 5. Annual Roundtable Summary/Evaluation Small Cap Equity Review 6. Consultants and Actuary Evaluations11th Annual Investment Roundtable (8/17 & 18) 7. Accept and Refer Actuarial Reports to Audit
Actuary RE Committee (August 17) Quarterly Report (1Q16)
October 28, 2016 November 18, 2016 December 16, 2016
1. Monthly Flash Report (September) 1. Monthly Flash Report (September) 1. Monthly Flash Report (October)2. Mt. Lucas Presentation 2. Quarterly Reports (3Q15) 2. PE Global Presentation
3. Graham Presentation 3. PanAgora Presentation4 Final Actuarial Reports5. Global Public Equity Review and Discussion
Quarterly RE Committee meeting 1. Quarterly Reports (2Q16) 2. RE Delegation Policy Review
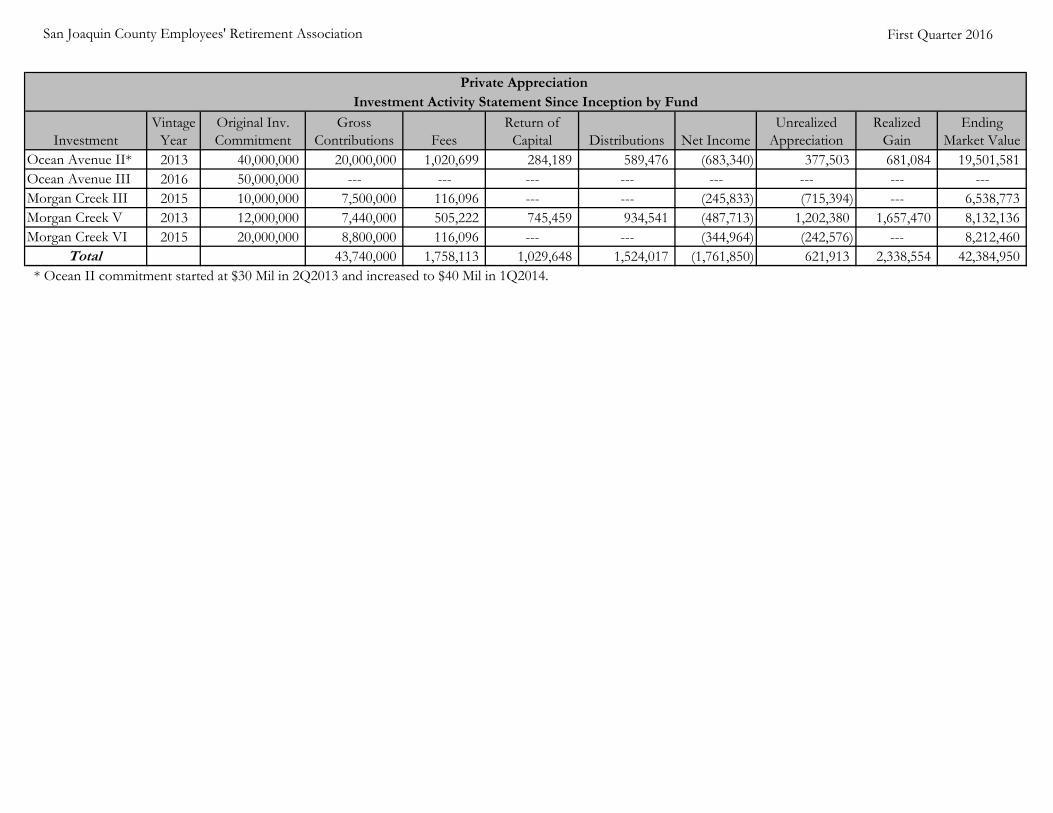
InvestmentVintage
YearOriginal Inv. Commitment
Gross Contributions Fees
Return of Capital Distributions Net Income
Unrealized Appreciation
Realized Gain
Ending Market Value
Ocean Avenue II* 2013 40,000,000 20,000,000 1,020,699 284,189 589,476 (683,340) 377,503 681,084 19,501,581 Ocean Avenue III 2016 50,000,000 --- --- --- --- --- --- --- ---Morgan Creek III 2015 10,000,000 7,500,000 116,096 --- --- (245,833) (715,394) --- 6,538,773 Morgan Creek V 2013 12,000,000 7,440,000 505,222 745,459 934,541 (487,713) 1,202,380 1,657,470 8,132,136 Morgan Creek VI 2015 20,000,000 8,800,000 116,096 --- --- (344,964) (242,576) --- 8,212,460
Total 43,740,000 1,758,113 1,029,648 1,524,017 (1,761,850) 621,913 2,338,554 42,384,950
Private Appreciation Investment Activity Statement Since Inception by Fund
* Ocean II commitment started at $30 Mil in 2Q2013 and increased to $40 Mil in 1Q2014.
San Joaquin County Employees' Retirement Association First Quarter 2016
brandonross
PCA Logo

Glossary of Private Appreciation Terms Acquisitions - See Leveraged Buyouts.
Acquisitions - Add on - Add-on acquisitions, or platform investing, are a growth strategy, which involves the acquisition of a company that will be the base (or platform) from which future acquisitions will be made. This strategy invests in consolidating industries by teaming with key industry management to build companies through acquisition and internal growth. Initially, an industry with an unrecognized market niche, high growth potential and no clear market leader is identified. If a suitable company can not be identified, the investment manager may recruit a management team to run the new business. The company’s management and the investment manager, acting as a team, will identify and negotiate to buy additional companies within the target industry. A “critical mass” is achieved when the investment manager consolidates formerly entrepreneurial-managed, fragmented operating units into a single portfolio company with standard operating procedures. As a result, the larger company becomes visible and attractive to a wider group of potential buyers. Other companies in the market typically are willing to pay a higher price earnings multiple to buy the portfolio company than paid by the investment manager for its component parts.
Advisory Board - Advisory Boards play a role in the governance issues relating to the fundamental aspects of the fund, such as decisions on valuations and management conflicts of interests. Generally, a majority of the composition of the Advisory Board is comprised of the largest limited partners in the limited partnership.
Aggregation of profits and losses - Aggregation of profit and losses ensures a fairer profit sharing between the general partner and the limited partners. This calculation is based on the entire performance of the portfolio rather than on a deal by deal basis.
Buyouts - See Leveraged Buyouts.
CAGR – Compound annual growth rate
Capital commitment - A partner’s obligation to provide a certain amount of capital to a private equity fund for investments
Capital contribution – The total capital that a partner actually contributes to the partnership
Capital distribution – The total proceeds that are distributed back to partners by GPs as they exit their investments
Carried Interest - The mechanism by which general partners are compensated for their performance. The general partner’s carried interest is its share of the partnership’s profits, and generally ranges from 10% to 30% of the total. A 20% carried interest has become the industry norm.
Cash in - The total capital contributed to a private equity fund by a limited partner for making investments and paying for the fund’s expenses and management fees

Cash out - The total proceeds distributed by the fund to the limited partner. Proceeds may include both return of capital and gain distributions
Clawback/lookback provision – Guarantees that the stated profit allocation is met at the end of a partnership's term with respect to the limited partners
Co-investments - Privately negotiated purchase of equity or quasi-equity from private or publicly traded entities. Such investments involve the purchase of non-registered securities, which by their private, illiquid nature command a premium over comparable publicly traded securities. These will not be stand-alone investments and will always be made alongside a partnership investment or pari-passu, or better terms, than the partnership is making its direct investment.
Convertible Preferred Stock - A class of stock having different rights than Common Stock, including a liquidation preference over Common Stock; and allowing the Preferred Shareholder to convert Preferred shares into Common shares at some specified conversion ratio. Conversion typically occurs in conjunction with and initial public offering, providing a means of liquidation for the Preferred Shareholder.
Cost multiple –Value of the investment (proceeds plus value of unrealized investment) divided over the cost of the investment (original capital commitment). It measures how many times the money multiplied regardless of how long it took to achieve the multiple
Debt Related Investment Strategies - Debt related investments include subordinated debt and distressed debt investment strategies. Subordinated debt is often used to help finance leveraged buyouts or other similar transactions. Subordinated debt typically takes the form of mezzanine securities, junk bonds, convertible preferred stock, and other high yielding debt oriented securities. Although considered debt-oriented, securities at the subordinated debt or mezzanine level typically possess equity conversion features, rights, and warrants. Investors at the subordinated debt level are junior to the senior debt holders in a leveraged buyout transaction, meaning they receive interest payments after the senior debt has been satisfied and they share in a liquidation after the senior paper holders have made their claims. However, subordinated debt suppliers are senior to the common equity holders of the company. Distressed debt investments are a form of recovery investing that focus on the debt of a distressed company. Distressed debt investing is defined as the investment in debt securities(generally senior-secured debt) of troubled or bankrupt companies. Also see Restructuring/Recovery investments.
Direct investment – Direct investments are similar to co-investments in that the investment is made outside of a limited partnership structure, and made directly into the target company. However, direct investments differ from co-investments in that they are not made alongside an existing partnership. Direct investments require a greater amount of time to pursue on due diligence, and they also involve a greater level of risk in comparison to co-investments

Distressed debt – Investments in debt securities (generally senior-secured debt) of troubled or bankrupt companies. Investments may be made based on non-control arbitrage strategies (short term) or control style turnaround opportunities (long term)
Distributions – Cash and/or securities paid out to the limited partners from the limited partnership
Equity expansion – Similar to late stage venture capital, except that equity expansion investments are generally larger, and are typically less technology orientated. These small- and medium-sized companies have grown from the start-up stage to profitability and are poised from continued rapid growth
Exposure – Total market value of all investments plus any unfunded commitments
General partner – Managing partners of a limited partnership responsible for performing the day-to-day administrative operations of the limited partnership and acting as investment advisor to the partnership. The general partner typically invests 1% of the capital and retains 20 percent of the profits
Hedge funds – Unregulated funds that use a wide range of securities in a variety of skill-based investment strategies
Hurdle rate – A rate of return that must be met before the General Partner can share in the carried interest
Initial public offering (IPO) – The sale or distribution of a stock or portfolio company to the public for the first time
Internal rate of return (IRR) – The discount rate at which the present value of future cash flows of an investment equals the cost of the investment. It is determined when the net present value of the cash outflows (the cost of the investment) and the cash inflows (returns on the investment) equal zero, with the discount rate equal to the IRR
International Buyout - An international buyout fund is a limited partnership that generally focuses on acquisition, equity expansion, or later stage investment strategies, however, the fund’s primary geographic focus is outside of the United States.
J-curve – The J-curve phenomenon is the effect of the cash flow behavior of a partnership. It can be summarized as the first year's investment expenses of investing in a fund that has yet to harvest its capital gains in the future. This normally translates into a negative IRR in the early years of the fund. The plot of the partnership value versus time generally resembles a "J"
Key man provision - Limited partners are demanding the right to suspend the funding of the partnership if some of the key people were to leave the firm. This provision is designed to assure the continuity of the firm, and to assure that success (if related to various individuals) stays within the firm.
Leveraged Buyouts (Acquisitions) - Acquisitions involve the purchase of all or part of the stock or assets of a company utilizing a significant amount of borrowed capital and a relatively small portion of equity capital. Borrowed capital typically consists of some combination of senior and subordinated debt. The company may be privately or publicly owned, or a subsidiary or division of a privately or publicly owned company. Acquisitions generally include companies with stable cash flows, high market share, and high profit margins, selling low or non-technology products in industries not subject to wide profitability swings.
The general goal behind an acquisition investment is to acquire a company, division or subsidiary that is currently undervalued, and whose assets may be underutilized, and restructure and revitalize it. Ideally, the revitalized company can then be sold, recapitalized, or taken public at a substantial premium to its pre-buyout value.
Limited partner – The investors in a limited partnership, generally providing 99 percent of the capital and receiving 80 percent of the profits. Limited partners are not involved in the day-to-day management of the partnership and generally cannot lose more than their capital contribution
Limited Partnership – The majority of private equity funds are legally structured as limited partnerships. They are typically fixed-life investment vehicles (with an average term being 10 years). Limited partnerships have General Partners and Limited Partners. The General Partners manage the day-to-day operations and receive a management fee and a percentage of the profits. The Limited Partners invest in the fund and receive income, capital gains, and tax benefits.
Market value – The current value of a limited partner’s outstanding investments
Management fees – The management fee is designed to compensate the General Partner. This fee is used to provide the partnership with such resources as investment and clerical personnel, office space, and administrative services required by the partnership. Generally, the fee ranges from 1.0 percent to 2.5 percent of capital commitments
Mezzanine – Investments in unsecured or junior obligations that typically earn a coupon or dividend payment and have warrants on common stock or conversion features to enhance returns
Multiple of Money - Multiple of money is often used to measure performance. This is a cumulative return, identifying the return on an investment over the term of the partnership. A multiple that is greater than one indicates that the partnership’s total value exceeds the amount of capital contributed to date, whereas, a multiple less than one indicates that the partnership’s total value is less than the amount of capital contributed. In summary, achieving a high annualized rate of return over a long period of time is more impressive than achieving a high annualized rate of return over a shorter period of time.
Natural Resources - These investments utilize investment strategies that derive their return from the management of and the independent price movements in a particular resource. These investments are more specialized with a corresponding increase in risk. Sub-categories of this group include Oil and Gas (provides funding for the purchase or development of energy producing properties or companies operating within that sector), and Timberland or Farmland (provides funding for the purchase, development and/or lease of land for both growth and income-oriented strategies).

Overhang – Overhang is defined as the amount of capital committed to general partners that has yet to be invested and is calculated as the 5-year rolling difference between LP commitments and investments
Partnership Expenses - Expenses borne by the partnership including costs associated with the organization of the partnership, the purchase, holding or sale of securities, and legal and auditing expenses.
Partnership Term - The term of the partnership is normally ten years, with the general partner reserving the right to terminate the partnership early or extend the term for a set period of time. This is generally subject to the approval by the limited partners.
Pooled returns – Composite return measuring all private equity cash flows and valuation changes over a specific period of time
Portfolio companies – Any of the companies in which the private equity partnerships have an investment
Restructuring/Recovery - Recovery investments involve the investment of capital in companies experiencing anywhere from relatively minor, to extreme difficulties, to companies involved in bankruptcy proceedings. Recovery investing takes advantage of discounted securities of unhealthy, bankrupt (or near), under-performing, and/or under-capitalized companies and either ride or steer them back to recovery. To accomplish this goal, the various funds available use a variety of strategies. The strategies vary by the activity level and/or degree of control required by the acquirers, types of securities utilized, and the relative health of the target companies sought (from bankrupt to nearly healthy). Also, like LBO and venture capital managers, managers of ailing company funds each have a particular target company size preference, and some have industry or sector preferences.
Distressed debt investments are a form of recovery investing that focus on the debt of a distressed company. Distressed debt investing is defined as the investment in debt securities (generally senior-secured debt) of troubled or bankrupt companies.
Secondary limited partnership – Privately negotiated purchase of limited partnership interests or investment company interest. Such investments involve the purchase of a pro-rata ownership of non-registered securities, which are currently in, or will be a future purchase of, the partnership portfolio
Special Equity - See all non-venture capital related investment strategies, such as Leveraged Buyouts, Acquisitions, Special Situations, Mezzanine Investments, Subordinated Debt, Hedge Funds and Natural Resources.
Special Situations - Special Situation funds represents a “catchall” for non-traditional investments that do not fit in traditional groupings. These will include minority, but often control positions in public companies, “white knight” efforts to support managements, turnarounds and bankruptcy reorganizations, and other special situation profit opportunities. It is not the intention to invest in “unfriendly” business take-overs.
Top quartile returns – Average return earned by the highest performing 25 percent of capital in the private equity industry
Total value – A limited partner’s total market value plus any capital distributions received

Unfunded commitments – Money that has been committed to an investment but not yet transferred to the General Partner
Venture capital – Investments in young, emerging growth companies in different stages of development. The stages of venture capital investing include seed stage (entrepreneur seeking capital to conduct research or finish a business plan), early stage (company developing products and seeking capital to commence manufacturing), and late stage (profitable or near-profitable high-growth company seeking further expansion capital)
Venture Economics – Venture Economics is a leading compiler and publisher of private equity investment data
Vintage year – The year of fund formation and its first takedown of capital. By placing a fund into a particular vintage year, the limited partner can compare the performance of a given fund with all other similar types of funds formed in that particular year

Printed 9/12/16 12:08 PM
REG. WEBLINKBEGIN END FEE FOR MORE INFO
Sep 26 Sep 28 Napa Investment Retreat Morgan Creek Capital Napa, CA N/A morgancreekcap.com
Sep 30 Sep 30 Trustees Roundtable CALAPRS Burbank, CA $100 calaprs.org
Oct 17 Oct 19 CRCEA Fall Conference CRCEA Walnut Creek, CA $45 crcea.org
Oct 23 Oct 26 2016 Annual Conference Public Pension Financial Forum
Charleston, SC $475 p2f2.org
Oct 27 Oct 28 Public Pensions and Investments Fiduciaries' Forum
Nossaman San Francisco, CA $275 nossaman.com
Nov 8 Nov 10 Invesco Real Estate US Client Conference
Invesco La Jolla, CA N/A invesco.com
Nov 8 Nov 11 SACRS Fall Conference SACRS Indian Wells, CA $120 sacrs.org
REG. WEBLINKBEGIN END FEE FOR MORE INFO
Jan 25 Jan 27 2017 Visions, Insights & Perspectives Institutional Real Estate Inc. Carlsbad, CA N/A irei.com
Mar 4 Mar 7 CALAPRS General Assembly CALAPRS Monterey, CA $100 calaprs.org
2016 CONFERENCES AND EVENTS SCHEDULE 2016
2017 CONFERENCES AND EVENTS SCHEDULE 2017
EVENT DATES 2017 EVENT TITLE EVENT SPONSOR LOCATION
EVENT DATES 2016 EVENT TITLE EVENT SPONSOR LOCATION

NAPA INVESTMENT RETREAT
The Carneros Inn, Napa Valley HBC Mega Trends Fund Agenda Monday, September 26, 2016 7:00 pm Casual dinner at the Carneros Inn resort in the FARM Dining Room Tuesday, September 27, 2016 8:00 am Breakfast 8:30 am Welcome with Up Close & Personal Time with Mark W. Yusko, CIO,
Morgan Creek Capital Management Topic: Current State of the Market
9:15 am Working Break and Q&A 9:30 am HBC Mega Trends Portfolio Review 12:30 pm Luncheon in the Carneros Courtyard 1:30 pm End of Sessions 3:00 pm Wine Tour – Cuvaison Winery 6:00 pm Reception at Hilltop Patio, Carneros Inn 7:30 pm Dinner at Hilltop Patio & Dining Room (agenda continued below)

NAPA INVESTMENT RETREAT
Special Guest Speaker Day Agenda Wednesday, September 28, 2016 On Wednesday please join us for our “guest speaker day” where we will bring you five managers who will present and discuss opportunities they are seeing in today’s investment environment. Some primary themes will be Healthcare and Demographics, Acceleration of New Technologies, Emergence of the Emerging Markets Consumer and Intellectual Property. There will also be discussions surrounding compelling ideas that are created by dislocations in the market. Each manager will present for 30 minutes, we will then break for lunch and come back together for a talk show interview session with Mark W. Yusko as moderator. Enough time will be allocated for our intimate group of investors to ask questions to each of the speakers at the end of the talk show. 8:00 am Breakfast & Welcome by Mark W. Yusko, CEO & CIO, Morgan Creek 8:15 am Fireside chat: John Burbank, Founder and CEO, Passport Capital and Mark W. Yusko, CEO and CIO, Morgan Creek 9:00 am Manager: Pantera Capital Management
Speaker: Dan Morehead, Founder and CEO 9:30 am Manager: Light Street
Speakers: Jay Kahn, Partner 10:00 am Break 10:30 am Manager: Four Rivers
Speaker: Farouk Ladha, Managing Partner 11:00 am Manager: Peakspan
Speaker: Phil Dur, Co-Founder and Managing Partner 11:30 am Manager: Red Mile
Speaker: Gerard van Hamel Platerink, Managing Director
12:00 pm Luncheon in the Carneros Courtyard
(agenda continued below)

NAPA INVESTMENT RETREAT
Wednesday, September 28, 2016 (continued) 1:00 pm Talk Show Format: Interview with our Special Guest Speakers
Moderator: Mark W. Yusko Special Guest Panelists: Dan Morehead
John Burbank Jay Kahn Farouk Ladha Phil Dur Gerard van Hamel Platerink
2:15 pm Audience Q & A Session
There will be 30 minutes dedicated to this panel for audience participation to get your questions answered.
3:00 pm End of Session 3:45 pm Departure for the Private Wine Tour – Venue TBD 6:30 pm Dinner with Michael Green attending as the wine “edu-trainer” – Tre Posti
Estate
For more than 25 years, Michael Green has worked for hundreds of companies
creating compelling and memorable food and drink experiences that resonate
with audiences. The former consultant to Gourmet Magazine for 20 years,
Michael is a highly sought personality on national television, including
MSNBC, CNN, The Food Network, and Today Show, and at major wine and
food festivals worldwide.
Michael will host a private vineyard tour and dinner to create an unforgettable wine experience for all in attendance.
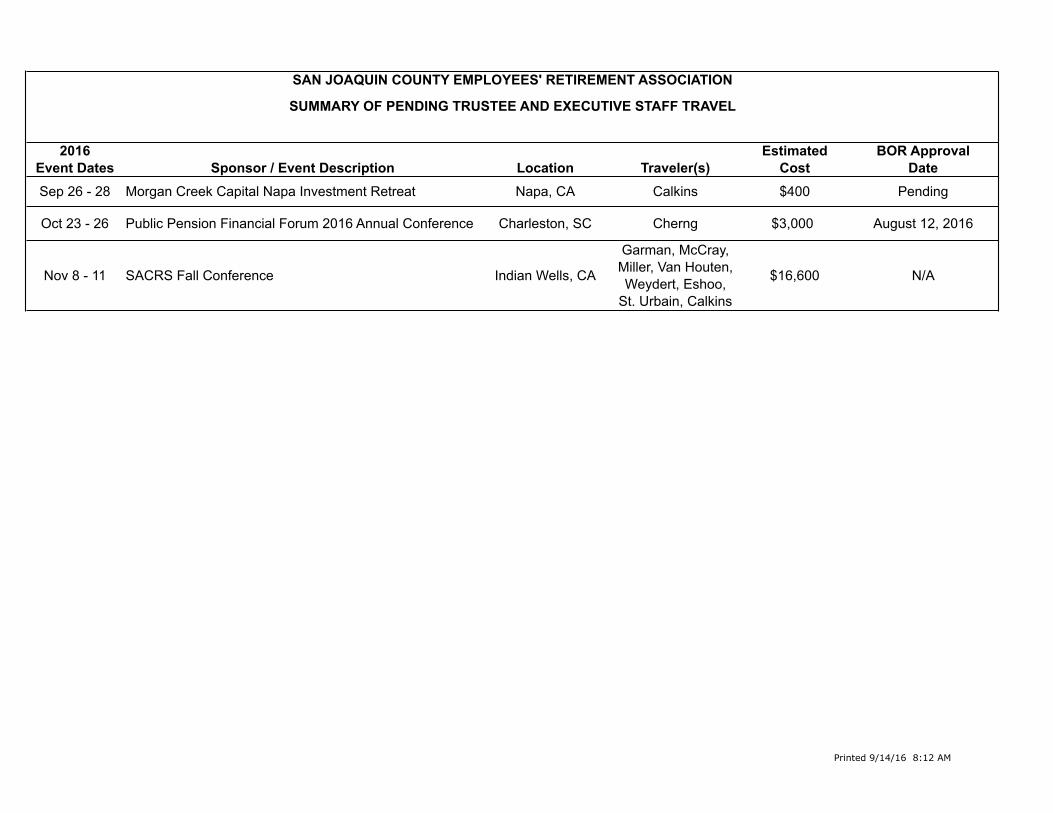
Printed 9/14/16 8:12 AM
2016 Estimated BOR ApprovalEvent Dates Sponsor / Event Description Location Traveler(s) Cost DateSep 26 - 28 Morgan Creek Capital Napa Investment Retreat Napa, CA Calkins $400 Pending
Oct 23 - 26 Public Pension Financial Forum 2016 Annual Conference Charleston, SC Cherng $3,000 August 12, 2016
Nov 8 - 11 SACRS Fall Conference Indian Wells, CA
Garman, McCray, Miller, Van Houten, Weydert, Eshoo,
St. Urbain, Calkins
$16,600 N/A
SAN JOAQUIN COUNTY EMPLOYEES' RETIREMENT ASSOCIATION
SUMMARY OF PENDING TRUSTEE AND EXECUTIVE STAFF TRAVEL
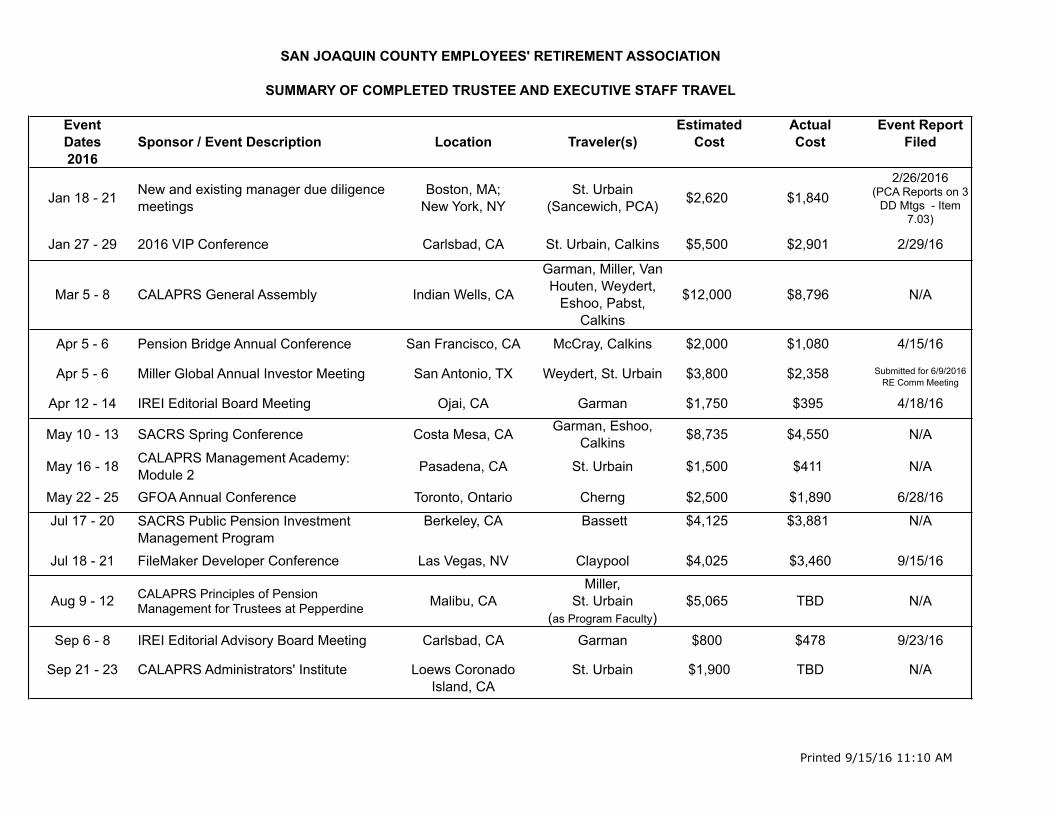
Printed 9/15/16 11:10 AM
Event Estimated Actual Event ReportDates Sponsor / Event Description Location Traveler(s) Cost Cost Filed2016
Jan 18 - 21 New and existing manager due diligence meetings
Boston, MA; New York, NY
St. Urbain (Sancewich, PCA) $2,620 $1,840
2/26/2016 (PCA Reports on 3
DD Mtgs - Item 7.03)
Jan 27 - 29 2016 VIP Conference Carlsbad, CA St. Urbain, Calkins $5,500 $2,901 2/29/16
Mar 5 - 8 CALAPRS General Assembly Indian Wells, CA
Garman, Miller, Van Houten, Weydert,
Eshoo, Pabst, Calkins
$12,000 $8,796 N/A
Apr 5 - 6 Pension Bridge Annual Conference San Francisco, CA McCray, Calkins $2,000 $1,080 4/15/16
Apr 5 - 6 Miller Global Annual Investor Meeting San Antonio, TX Weydert, St. Urbain $3,800 $2,358 Submitted for 6/9/2016 RE Comm Meeting
Apr 12 - 14 IREI Editorial Board Meeting Ojai, CA Garman $1,750 $395 4/18/16
May 10 - 13 SACRS Spring Conference Costa Mesa, CA Garman, Eshoo, Calkins $8,735 $4,550 N/A
May 16 - 18 CALAPRS Management Academy: Module 2 Pasadena, CA St. Urbain $1,500 $411 N/A
May 22 - 25 GFOA Annual Conference Toronto, Ontario Cherng $2,500 $1,890 6/28/16
Jul 17 - 20 SACRS Public Pension Investment Management Program
Berkeley, CA Bassett $4,125 $3,881 N/A
Jul 18 - 21 FileMaker Developer Conference Las Vegas, NV Claypool $4,025 $3,460 9/15/16
Aug 9 - 12 CALAPRS Principles of Pension Management for Trustees at Pepperdine Malibu, CA
Miller, St. Urbain
(as Program Faculty)$5,065 TBD N/A
Sep 6 - 8 IREI Editorial Advisory Board Meeting Carlsbad, CA Garman $800 $478 9/23/16
Sep 21 - 23 CALAPRS Administrators' Institute Loews Coronado Island, CA
St. Urbain $1,900 TBD N/A
SAN JOAQUIN COUNTY EMPLOYEES' RETIREMENT ASSOCIATION
SUMMARY OF COMPLETED TRUSTEE AND EXECUTIVE STAFF TRAVEL

San Joaquin County Employees' Retirement Association
6 South El Dorado Street, Suite 400 • Stockton, CA 95202 (209) 468-2163 • Fax (209) 468-0480 • www.sjcera.org
M E M O R A N D U M TO: Annette H. St. Urbain, Chief Executive Officer FROM: Tallie M. Claypool, Information Systems Manager DATE: September 15, 2016 SUBJECT: FileMaker Developer Conference 2016 Filemaker Developer Conference 2016 or DevCon 2016 was held in Las Vegas Nevada. The day started much like the movie “Planes, Trains, and Automobiles”. I thought that I would never make it to Las Vegas from Stockton. My flight was delayed 3 times and by the time I arrived after midnight, the baggage claim area was down to one carousel working for all the incoming flights. Then, of course, my shuttle was cancelled and I had to take a taxi at 1:00 am. It was quite the travel experience and the sites in Las Vegas after midnight are very interesting. After a rocky start to the trip, the conference itself went very smoothly. The conference theme this year was Aptitude for Apps. Over 1,500 developers with varying degrees of experience attended the conference from 18+ Countries and a wide array of industries. There were 60 sessions available to attend this year. The sessions were divided into tracks: Core, Design, Mobility, Innovation, Business, and Web. The Core track is for those that are learning or need to brush up on their skills for developing. The Design track is for setting and reaching design goals and working with the users on interactive design techniques. The Mobility track is focused around the capabilities and design templates for FileMaker Go and FileMaker WebDirect, to use your application on smart phones and tablets. The Innovation track is centered on emerging trends in social, on-demand, and virtualization. There were iBeacons placed through out the conference area with information as you approached them, such as where is the next session located. The Business track is for those that want to market their solution. The Web track was diving deeper into FileMaker web tools and real life cases where web services are used. The underlying current of the conference was philanthropy and moving to the cloud. In an effort to use the strength of the product and the talent at the conference a Developer Challenge was set. This year’s challenge was to create a software product for a Non-Profit company in 3 days. Not knowing the project they would be assigned to or who they would be working with on those teams, programmers applied to be part of a team.

SJCERA / FileMaker Developer Conference 2016 / September 15, 2016 / Page 2 of 3
Of those that applied three to five programmers were placed on a team. Three area nonprofits were chosen that needed software to assist in streamlining their processes and managing their business. The teams were given specifications for an application and competed against other teams to create the application during 3 days at the conference. The winning applications were given to the non-profit organizations in Las Vegas and/or Nevada, along with software and technical support. The event gave the best and brightest FileMaker developers from around the world a chance to work with others and learn techniques from each other and for the FileMaker community to give back to the community. Our consultant, Brian Currell of IG, was chosen as one of the programmers and worked with his team during his off conference hours to create a wonderful product. I appreciate the opportunity to attend the FileMaker Developer Conference. The conference is important for me to attend to gain a more in-depth knowledge of the software in which our Pension System software, Core-37, was created and is maintained. FileMaker is a database programming software that allows applications to be built that are easy to use and flexible to maintain. By attending the conferences I have the chance to network with other FileMaker developers and I have developed skills over the years that allow me to create processing which enhances data collection, extraction, and reporting at a faster rate of speed. I use these skills to trouble shoot system issues and to create or modify reports and forms. There are times where I can solve issues without involving our consultant or give them the information needed to speed up development. It also provides me with the knowledge of the programming, which gives me the advantage to be able to discuss system changes with our consultants. I know the strengths and weaknesses of our system and what the tools are available to assist the consultants. This year I expanded my knowledge by attending a training day at the conference. I attended the Intermediate Training 202. This session allowed me to dive deeper into security, reporting, and integration. I gained more information on how to create complex relationships between data sources and how to make sure our application has all the security that is offered by the product. These sessions were based on best practices under the application and how to use these features to create a better system. Listed below are names of the sessions that I attended. My favorite sessions are the Security and Under the Hood sessions. These sessions give me very good information. This year there was much discussion on moving to the cloud and the security needed to do that move. I have always been apprehensive to offering access to live data via the web because of the sensitive nature of our data. This year it went further to discuss the issues around having your server in the Cloud and the risks and gains that you face by moving to the cloud. The only way to ensure your data is completely safe from outside risks, is to make sure that your security is strong on the FileMaker Server and to ensure

SJCERA / FileMaker Developer Conference 2016 / September 15, 2016 / Page 3 of 3
that inside risks are isolated using audit trail tracking within your product and at the server level. Another interesting session this year was on how to appropriately size virtual machines. This session provided good information for backup and disaster recovery setups and techniques. Most Interesting Sessions that I attended included:
Opening Key Note General Session – AWS Deployment Introduction to the UI Design Executing Design: from Ideas to Actions Security and the Cloud iOS App SDK: The Launcher File Deployment and Configuring Mobile Custom Apps with MDM Speedy Server Side Data import Techniques Powerful Event Management with Perform Script on Server Under the Hood: Draco Database Engine User Experience vs Usability Under the hood: Server performance Under the Hood: PSR Benchmarking Methodology Closing Session
Once again, thank you for the opportunity to attend this conference. I always feel that this conference is beneficial to SJCERA. I bring back information and use much of what I have learned immediately. By attending I gain a greater knowledge of the platform and security of the system. The conference also affords me the access to network with other Information Technology individuals in other industries that face some of the same issues that I have and offer a broader focus to solving some of those issues.

IREI Fall Editorial Advisory Board Meeting Sept. 6-‐8, 2016 Carlsbad, California Cindy Garman, Trustee
The IREI editorial advisory board meeting offered few new ideas, directions or concepts that have not been promulgated at other conferences and/or meetings over the past year. The consensus was that the industrial sector offers the best investment opportunity, but that it just might be the “tallest midget in the room” to quote one attendee. The primary niche area of interest was storage facilities, but it was felt they are not sufficiently scalable to be of much value. The general feeling was that all sectors of real estate are fully or possibly over-‐ valued.
Noteworthy discussion involved: REITs, suburban office, and corporate headquarter migration back to CBD’s, style drift, and separate accounts
There were two main points regarding REITs. The first has to do with REITs recently being designated a distinct investment class according to Global Industry Classification Standard (GICS.) It was felt that this new recognition could lead to further demand for REITs, lend support to values, and possibly attract funds that would otherwise have gone to private real estate. The second point was a study published in the Sept. issue of Institutional Real Estate Americas comparing returns of REITs and private real estate. This study found that REITs outperformed private real estate when the lagging valuation of private real estate was accounted for.
It was mentioned that there is a move afoot for major corporations that have traditionally maintained suburban office headquarters (think McDonald’s) to build new, smaller headquarters in major CBD’s in an effort to attract talent. These new headquarters are smaller than their suburban predecessors and are meant to house only high-‐value employees. This movement is alluded to in the article sent by Trustee Duffy regarding California recruiting woes.
The pluses and minuses of suburban office were hotly debated with no resulting consensus.
Style drift was conceded and seemed rather acceptable to the managers, less acceptable to the investors. As return becomes more difficult to achieve, it was acknowledged that managers will change direction/focus and it is incumbent upon investors to be alert to managers who are prone to drift or are already doing so. It is imperative to ask each manager to define their concept of core, value-‐added, opportunistic, etc. and under what circumstances they will “re-‐focus”/drift.
There is a decided difference between investors depending upon size, and this seems to result in a disconnect with managers. For example, CalPERS and LACERA reported investing 100% and 80-‐85% respectively in separate account real estate investments, while smaller investors (SJCERA) report little or no investment in separate accounts. It seemed as if it is the accepted role of smaller investors to pay higher fees to “keep the lights on” for managers. It was illuminating to listen to the discussion and to realize that many managers don’t have the faintest idea of the underlying differences between $2 billion and $200 billion plans except the for the size of the check they write.
It is notable that for the first time in recent memory, the term “Millennial” was hardly mentioned. Maybe with the industrial sector now most favored, the conceit of Millennials is not a factor.

DoubleLine Capital LP || 333 S. Grand Ave., 18th Floor || Los Angeles, CA 90071 || 213.633.8200 main
DoubleLine® is a registered trademark of DoubleLine Capital LP.
Robert Cohen Appointed Director of Global Developed Credit at DoubleLine
LOS ANGELES, September 6, 2016 /PRNewswire/ – Portfolio manager Robert Cohen has been promoted
by DoubleLine Capital CEO Jeffrey Gundlach to director of the firm’s Global Developed Credit team. Mr.
Cohen succeeds Bonnie Baha. Ms. Baha, founder of the GDC team, passed away on August 21.
The GDC team invests in the debt of corporate and sovereign issuers in developed economies. The team
comprises 20 portfolio managers, analysts and traders.
“On what is a somber occasion for DoubleLine, I wish to congratulate Robert as he takes his place as
director of the Global Developed Credit team,” Mr. Gundlach said. “One of Bonnie’s many achievements
was to bring together people with the qualities of team leadership and investment experience to carry
on after her.”
Mr. Cohen joined GDC in 2012 where he has served as a portfolio manager within the team and
participated on DoubleLine’s Fixed Income Asset Allocation Committee. Before DoubleLine, he was a
senior credit analyst at West Gate Horizons Advisors (including its predecessor ING Capital Advisors)
since 2001. Previously, he was an assistant vice president in the Asset Management Group of Union
Bank, managing portfolios of leveraged loans and CDO securities. Mr. Cohen began his investment
career in 1997 as an associate at the Bank of Montreal (now BMO Capital Markets). Mr. Cohen holds a
BA in economics from the University of Arizona and an MBA from the University of Southern California.
He is a CFA charterholder.
As director of GDC, Mr. Cohen reports to Mr. Gundlach, CEO and chief investment officer of DoubleLine
Capital. Reporting directly to Mr. Cohen are portfolio manager Monica Erickson, who heads investment
grade GDC; portfolio manager Kapil Singh, head of high yield GDC; and Philip Kenney, director of
corporate research.
“On behalf of Monica, Kapil, Phil and all the members of GDC, I would like to thank our clients for their
years of support and, over the past two weeks, their kind thoughts and condolences,” Mr. Cohen said.
“We will give our best to continue to deserve that trust.”
About DoubleLine Capital LP
DoubleLine Capital LP is a registered investment adviser under the Investment Advisers Act of 1940.
DoubleLine Capital and its related companies (“DoubleLine”) managed $102 billion in assets across all
vehicles, including open‐end mutual funds, closed‐end funds, exchange‐traded funds, hedge fund,
variable annuities, UCITS and separate accounts, as of the June 30, 2016 end of the second quarter.
DoubleLine's offices in Los Angeles can be reached by telephone at (213) 633‐8200 or by e‐mail at
[email protected]. Media can reach DoubleLine by e‐mail at [email protected]. DoubleLine® is
a registered trademark of DoubleLine Capital LP.
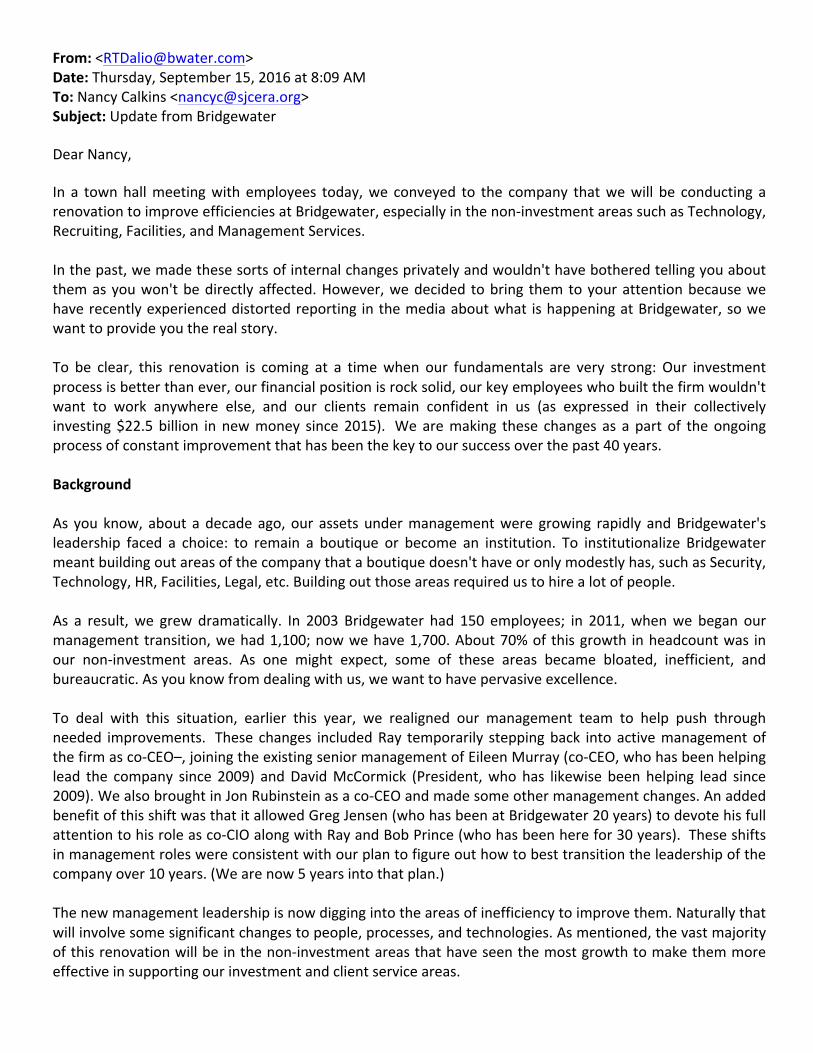
From: <[email protected]> Date: Thursday, September 15, 2016 at 8:09 AM To: Nancy Calkins <[email protected]> Subject: Update from Bridgewater Dear Nancy, In a town hall meeting with employees today, we conveyed to the company that we will be conducting a renovation to improve efficiencies at Bridgewater, especially in the non-‐investment areas such as Technology, Recruiting, Facilities, and Management Services. In the past, we made these sorts of internal changes privately and wouldn't have bothered telling you about them as you won't be directly affected. However, we decided to bring them to your attention because we have recently experienced distorted reporting in the media about what is happening at Bridgewater, so we want to provide you the real story. To be clear, this renovation is coming at a time when our fundamentals are very strong: Our investment process is better than ever, our financial position is rock solid, our key employees who built the firm wouldn't want to work anywhere else, and our clients remain confident in us (as expressed in their collectively investing $22.5 billion in new money since 2015). We are making these changes as a part of the ongoing process of constant improvement that has been the key to our success over the past 40 years. Background As you know, about a decade ago, our assets under management were growing rapidly and Bridgewater's leadership faced a choice: to remain a boutique or become an institution. To institutionalize Bridgewater meant building out areas of the company that a boutique doesn't have or only modestly has, such as Security, Technology, HR, Facilities, Legal, etc. Building out those areas required us to hire a lot of people. As a result, we grew dramatically. In 2003 Bridgewater had 150 employees; in 2011, when we began our management transition, we had 1,100; now we have 1,700. About 70% of this growth in headcount was in our non-‐investment areas. As one might expect, some of these areas became bloated, inefficient, and bureaucratic. As you know from dealing with us, we want to have pervasive excellence. To deal with this situation, earlier this year, we realigned our management team to help push through needed improvements. These changes included Ray temporarily stepping back into active management of the firm as co-‐CEO–, joining the existing senior management of Eileen Murray (co-‐CEO, who has been helping lead the company since 2009) and David McCormick (President, who has likewise been helping lead since 2009). We also brought in Jon Rubinstein as a co-‐CEO and made some other management changes. An added benefit of this shift was that it allowed Greg Jensen (who has been at Bridgewater 20 years) to devote his full attention to his role as co-‐CIO along with Ray and Bob Prince (who has been here for 30 years). These shifts in management roles were consistent with our plan to figure out how to best transition the leadership of the company over 10 years. (We are now 5 years into that plan.) The new management leadership is now digging into the areas of inefficiency to improve them. Naturally that will involve some significant changes to people, processes, and technologies. As mentioned, the vast majority of this renovation will be in the non-‐investment areas that have seen the most growth to make them more effective in supporting our investment and client service areas.

As always our evolutionary process will be imperfect, iterative, and transparent, and it will make us more efficient. What is of paramount importance is our sticking to the culture that has led to our excellent results. It is best summarized in the following sentence: We want meaningful work and meaningful relationships through radical truth and radical transparency. Transparently bringing problems to the surface and regarding them as intolerable might lead some people to wrongly conclude that we have more problems than organizations that don't transparently bring problems to the surface. Our employees and our clients understand that this difference is essential to our success. It is also through this radical truth and transparency that they have learned to trust our integrity as well as our abilities. As always, if you have any questions, let us know. With appreciation for your understanding, Ray, Bob, Greg, Eileen, David, and Jon

Rethinking Conventional Wisdom: Why Not a Value Bias?John West, CFA, and Amie Ko, CFA
An equity bias is deemed conventional wisdom in its ability to generate a reli-able source of excess return, but a value bias no longer is. Statistics and theory reinforce the robustness of value strategies as a structural source of excess return for those with a long horizon and the staying power to hold through peri-ods of adversity. Yet value investing is increasingly overlooked as a meaningful contributor in portfolio construction, and for many investors, is actually viewed as a risk to be diversified away.
We owe it to investors to question why all long-term sources of excess return are not treated equally in their portfolios and to take steps to correct this
August 2016
March 2016
Greetings from the ColdCharles Aram, Jonathan Treussard
September 2015
The Evolution of Value Investing“In Focus” Series
August 2012
Rebalancing and the Value EffectRob Arnott, Denis Chaves
Key Points1. Investors with both a long horizon and the courage to stay the course
during market downturns, often still fail to harvest the structural excess
return offered by value strategies whose robustness is supported by both
data and theory.
2. An inherent desire to conform to conventional wisdom combined with
the classic owner–agent conflict may help explain why an equity bias
is deemed conventional wisdom and a value bias is no longer seen as a
reliable source of excess return.
3. To manifest the benefit of all long-term sources of structural excess
return—such as value—let’s challenge conventional wisdom and open a
candid conversation between owners and agents.
RELATED ARTICLES
CONTACT US
Web: www.researchaffiliates.com
Americas
Phone: +1.949.325.8700
Email: [email protected]
Media: [email protected]
EMEA
Phone: +44.2036.401.770
Email: [email protected]
Media: [email protected]

August 2016 . West & Ko . Rethinking Conventional Wisdom: Why Not a Value Bias? 2
www.researchaffiliates.com
longstanding and entrenched bias against value in the conventional wisdom of the collective investment commu-nity. We examine a possible explanation for why a value bias does not figure more prominently in investors’ conven-tional wisdom.
The ChallengeWelcome to the classic blind taste test—The Pepsi Challenge. You approach a table with two white cups, one Pepsi and the other Coke. You take a sip of each and select your preference. With an upward sweep, the Pepsi rep sitting behind the table lifts the yellow blind, revealing two glass bottles. Drum roll, please. The results: most Americans preferred Pepsi! The outcome of “The Challenge” was hardly a surprise, and it was deemed one of Madison Avenue’s greatest ad campaigns.1
We’ve got our own “challenge” for you! We compare two anonymous sources of excess return and their long-term
characteristics. Both represent robust sources of return premia2 very likely present in your portfolio today. We invite you to take a swig, compare the characteristics, and decide: Which do you prefer?
Lifting the Blind on ValueWe won’t keep you in suspense. You’ve made your selection. It’s time to lift the blind!
Strategy A is a buy-and-hold investment in the S&P 500 Index, measured relative to 20-year US Treasuries.3 It represents the excess return of stocks versus bonds, the
“go-to” source for leveraging the long-term investment horizon of pensions into meaningfully higher returns. The conventional wisdom is that stocks deliver higher long-term returns than bonds: on average, stocks are more vola-tile, creating the rational expectation that equity investors will be compensated with higher returns. This notion is
1962–2015 Strategy A Strategy B
Full Span
Excess Return, Annualized 2.9% 1.8%
Risk,1 Annualized 16.3% 4.3%
Excess Return to Risk Ratio 0.18x 0.42x
Rolling 15-Year
Win Rate 82% 96%
Average Excess Return, Annualized 2.8% 2.1%
Worst Excess Return, Annualized -4.0% -1.3%
Rolling 3-Year
Win Rate 68% 74%
Average Excess Return, Annualized 3.2% 1.8%
Worst Excess Return, Annualized -26.3% -7.8%
Source: Research Affiliates, LLC, using data from Ibbotson, Schwert Darnell, FRED from the Federal Reserve Bank of St. Louis, and CRSP/Compustat. Note: Risk is calculated as the tracking error of the strategy against its corresponding benchmark. Our analysis begins in 1962, the first year hypothetical return data are available for Strategy B. A very long span of 200 years reveals Strategy A’s excess return to be approximately 1.8% (net of valuation changes, the excess return is a little over 2.0%). Since 1962, the lower historical return for Strategy B versus Strategy A may be partially explained by the discovery and exploitation of anomalies.
Any use of the above content is subject to all important legal disclosures, disclaimers, and terms of use found at www.researchaffiliates.com, which are fully incorporated by reference as if set out herein at length.
The Research Affiliates Challenge

August 2016 . West & Ko . Rethinking Conventional Wisdom: Why Not a Value Bias? 3
www.researchaffiliates.com
further supported by the inherent risk premium for stocks over bonds because stockholders are behind bondholders in the first lien on a company’s resources in bankruptcy.
Strategy B is a value investing approach relative to the S&P 500 and is represented by the Fundamental Index™. Compared to a traditional value strategy, the Fundamental Index more robustly harnesses a “value premium” by using a rebalancing process, which generates a dynamic expo-sure to value.4 Over 50 years of empirical evidence show that long-term value investors outper-form. Why is that? Those who subscribe to efficient markets argue that value investors extract a risk premium. Others contend investors have preferences broader than risk and return,5 making them prone to behav-ior that results in a value anomaly.
Although we don’t know which strategy you chose, we do know most investors make a much bigger bet on Strategy A than on Strategy B. In a typical pension plan, equities repre-sent 60% of aggregate stock and bond holdings, whereas value constitutes less than 20% of all equity holdings.6
If the combined 15-year win rate7 of 82% and an average annualized excess return of 2.8% leads to a 2-to-1 alloca-tion of stocks to bonds, why doesn’t the combination of a 96% win rate and an average annualized excess return of 2.1% over the same rolling 15-year span lead to a similar size bet on value? There seems to be a disconnect: Owners of capital should be demanding an overwhelming value bias8 in their portfolios.
What Puts the “Convention” in Conventional Wisdom?Personal experience feeds into expectations, which in turn anchor the perception of what constitutes conven-tional wisdom. It then follows that the range of excess returns experienced by investment professionals over their
careers must influence their investment decision making. For instance, a 65-year old who began a 40-year career in 1975 witnessed stocks soar by an annualized 7.8% net of inflation, beating the return of long bonds by 3.7% a year. That’s a heck of an equity return premium baked into her frame of reference.
When we repeat this exercise across current practitioners divided into five-year age cohorts from ages 25 to 70, the collective investment experience over the 1970–2015
period reveals that nearly 90% has lived through sustained periods of soaring stock prices. Collec-tively, these inves-tors experienced
stocks outperforming bonds by an average of 1.9% a year.9 Not surprisingly, the “stocks for the long run” mantra has dominated the conventional thinking around port-folio construction. The collective experience effectively
“defaults” to a belief that this relationship should continue.
Indeed, all age cohorts, except for one, have experienced stocks outperforming bonds by at least 1.0% a year. The single cohort whose members over their careers have experienced stocks underperforming bonds is the now 35- to 40-year-old who began working at the peak of the tech bubble. From January 2000 to December 2015, equities deliv-ered an annualized real return of 1.9%, underperforming long bonds by 2.9% a year. Understandably, this cohort may not be as enthusiastic about the stocks-for-the-long-run story.
During the same 45-year period ending 2015, investment practitioners’ personal experience with value invest-ing has been far less buoyant, and the range of outcomes much more modest, than their experience with equities versus bonds. These investors have known value investing to deliver and average excess return of 1.1% a year, about half the annualized excess return generated by stocks over bonds. Although investors could not invest in the Funda-mental Index—introduced only 12 years ago by Arnott, Hsu, and Moore (2005)—over the entire period, the principle of value investing has been well understood and practiced
“We should question why all long-term sources of excess return are not
treated equally in our portfolios.”
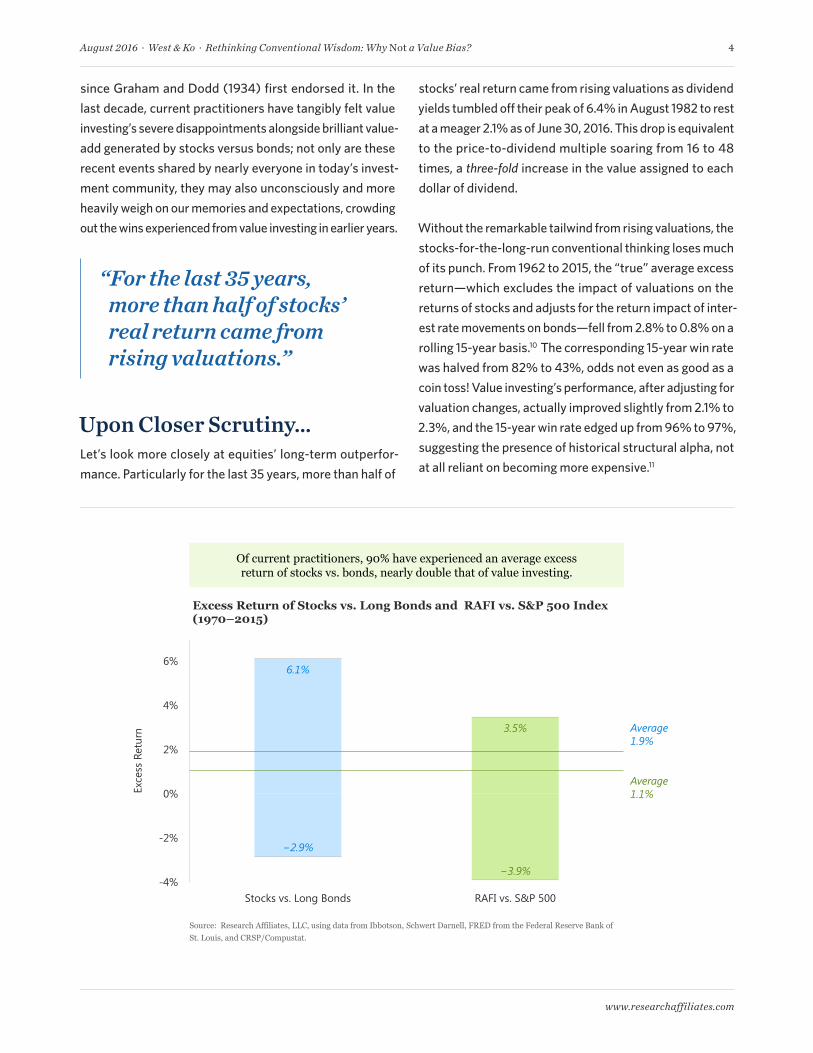
August 2016 . West & Ko . Rethinking Conventional Wisdom: Why Not a Value Bias? 4
www.researchaffiliates.com
since Graham and Dodd (1934) first endorsed it. In the last decade, current practitioners have tangibly felt value investing’s severe disappointments alongside brilliant value-add generated by stocks versus bonds; not only are these recent events shared by nearly everyone in today’s invest-ment community, they may also unconsciously and more heavily weigh on our memories and expectations, crowding out the wins experienced from value investing in earlier years.
Upon Closer Scrutiny…Let’s look more closely at equities’ long-term outperfor-mance. Particularly for the last 35 years, more than half of
stocks’ real return came from rising valuations as dividend yields tumbled off their peak of 6.4% in August 1982 to rest at a meager 2.1% as of June 30, 2016. This drop is equivalent to the price-to-dividend multiple soaring from 16 to 48 times, a three-fold increase in the value assigned to each dollar of dividend.
Without the remarkable tailwind from rising valuations, the stocks-for-the-long-run conventional thinking loses much of its punch. From 1962 to 2015, the “true” average excess return—which excludes the impact of valuations on the returns of stocks and adjusts for the return impact of inter-est rate movements on bonds—fell from 2.8% to 0.8% on a rolling 15-year basis.10 The corresponding 15-year win rate was halved from 82% to 43%, odds not even as good as a coin toss! Value investing’s performance, after adjusting for valuation changes, actually improved slightly from 2.1% to 2.3%, and the 15-year win rate edged up from 96% to 97%, suggesting the presence of historical structural alpha, not at all reliant on becoming more expensive.11
“For the last 35 years, more than half of stocks’ real return came from rising valuations.”
-4%
-2%
0%
2%
4%
6%
Stocks vs. Long Bonds RAFI vs. S&P 500
Exce
ss R
etur
n
Excess Return of Stocks vs. Long Bonds and RAFI vs. S&P 500 Index (1970–2015)
Of current practitioners, 90% have experienced an average excess return of stocks vs. bonds, nearly double that of value investing.
Source: Research Affiliates, LLC, using data from Ibbotson, Schwert Darnell, FRED from the Federal Reserve Bank of St. Louis, and CRSP/Compustat.
Any use of the above content is subject to all important legal disclosures, disclaimers, and terms of use found at www.researchaffiliates.com, which are fully incorporated by reference as if set out herein at length.
6.1%
Average1.9%
−2.9%
3.5%
Average1.1%
−3.9%

August 2016 . West & Ko . Rethinking Conventional Wisdom: Why Not a Value Bias? 5
www.researchaffiliates.com
Reconciling Owner’s Dream with Agent’s Sleepless NightReverting to the challenge we posed earlier—the choice between Strategy A and Strategy B—we can see how selection is influenced by the decision maker’s experience.
The choice is also impacted by the decision-maker’s role: owner or agent. The misalignment between beneficiaries and their agents, fueled by the classic time-horizon conflict and an inherent desire to conform to conventional wisdom,
may be factors in the lack of a prevalent value bias as well as to falling short of attaining the “owner’s dream”—that is, reaching the asset owner’s financial goal manifested over the long run by stacking multiple sources of risk premium. For example, a 60/40 portfolio is expected to produce a long-term real return of approximately 1.0% a year.12 If the 60% equity bucket holds value stocks, the value premium of 1.5–2.0% boosts the portfolio’s prospective long-term real return by another 1.2–1.5 times a year!
Principal–agent conflicts arise from contradictory motiva-tions between the owner (the principal)13 and the person delegated to act on behalf of the owner (the agent). The time horizon for owners can span decades. For example, according to a 2015 study by Willis Towers Watson (McFar-land, 2016), the average duration of pension plan obligations of more than 400 Fortune 1000 companies was approxi-mately 13 years.14 Among defined contribution plans, for which lifecycle/target date funds are among the most popu-
“Owners of capital should be demanding an over-whelming value bias in their portfolios.”
2.8%
2.1%
0.8%
2.3%
0.0%
3.0%
Stocks vs. LongBonds
RAFI vs. Cap-weighted Equity
Annu
aliz
ed R
etur
nAverage Excess Returns, Rolling 15-Year
(1962–2015)
Valuation changes matter when assessing excess returns and win rates!
Source: Research Affiliates, LLC, using data from Ibbotson, Schwert Darnell, FRED from the Federal Reserve Bank of St. Louis, and CRSP/Compustat.
Any use of the above content is subject to all important legal disclosures, disclaimers, and terms of use found at www.researchaffiliates.com, which are fully incorporated by reference as if set out herein at length.
82%
96%
43%
97%
0%
100%
Stocks vs. LongBonds
RAFI vs. Cap-weighted Equity
Win Rate
Win Rates, Rolling 15-Year(1962–2015)
15-Year Rolling Average Excess Return and Win Rates (1962–2015)

August 2016 . West & Ko . Rethinking Conventional Wisdom: Why Not a Value Bias? 6
www.researchaffiliates.com
lar investment vehicles, over 70% of all lifecycle/target date assets are invested in vintages of 2025 or later, with the larg-est amount of assets in the 2030 vintage (15-year horizon).15 The time horizon for agents is the span over which their own performance is judged—years or even shorter time periods. As such, agents face a powerful incentive to minimize short-term drawdowns relative to peers and benchmarks.
Long-term investors, by contrast, have time on their side to cushion short-term fluctuations in performance. For instance, during the global financial crisis from January 2007 to Febru-ary 2009, an equity investor underperformed a bond inves-tor (Strategy A) by 58%. Value investors (Strategy B) also experienced disappointment. From January 1994 to Febru-ary 2002, a Fundamental Index investor underperformed an investor in the plain-vanilla S&P 500 by 22%.16 Investors who sold at the troughs of these drawdowns experienced pain, and then locked in their losses. Others benefited.
“Buy low, sell high” is easy to say and very, very hard to do because what’s cheap today has typically hurt us badly on the way down. Continuing to invest in this same asset, even if future returns are poised to be marvelous, takes a hardy soul. Courageous capital owners who hunker down and fight against the natural human instinct to eliminate whatever inflicts pain and loss (and to seek more of what gives joy and profit) are rewarded both by keeping current yield and regaining lost capital as prices rebound to fair value. Such resilient investors often reap handsome excess returns17 following bear-market troughs.
ConclusionInvestors appear to be conditioned to honor the virtue of some long-term sources of excess return, but not others.
Can we learn from this seeming contradiction, and if so, how do we apply what we learn?
In the Pepsi Challenge, some of the tests used two cups arbitrarily labeled L and S. Studies of the Pepsi Challenge, such as McClure et al. (2014) and Woolfolk, Castellan, and Brooks (1983), have shown that labels, even if seemingly unrelated to the two sodas, can influence the decision of taste testers. The perceived preference creates a cognitive bias, or framing effect, which impacts a person’s decision.
Likewise, a framing effect may sway investor perceptions of long-term sources of excess return. For instance, the success of the stocks-for-the-long-run mantra over the last three decades leaves a refreshing aftertaste for invest-ment practitioners. Investors’ past lukewarm encoun-ters with value investing—especially during the recent difficult decade for value—may similarly unconsciously affect their assessment of a value strategy. Such expe-riences, in turn, frame what’s conventional and prudent, which agents prefer.
As a first step toward bucking the constraints of conven-tional wisdom, we should acknowledge that cognitive biases may surreptitiously influence our investment deci-sion making. We owe it to ourselves to question why all long-term sources of excess return are not treated equally in our portfolios. A candid conversation between owners and agents should also help: Agents may need to justify to asset owners why value is de-emphasized in their port-folios, and owners have a responsibility to extend agents’ measurement horizon to be consistent with what’s required to harvest multiple sources of return premiums. It’s time to act: agents deserve restful nights, and beneficiaries deserve the “owner’s dream.”
“It’s time to act: agents deserve restful nights, and beneficiaries deserve the
‘owner’s dream.”
August 2016 . West & Ko . Rethinking Conventional Wisdom: Why Not a Value Bias? 7
www.researchaffiliates.com
Endnotes1 It’s no wonder Pepsi was presented as the winner. In similar fashion,
no one is surprised when brilliant backtests roll off quant desks year after year. We’re reminded of an old joke among consultants: There’s no such thing as a bad backtest!
2 We believe a strategy must pass certain tests to be considered a robust source of return premium. For example, a strategy should deliver long-term excess return 1) across various geographies, 2) after reasonable variations in the definition or construction of the factor underlying the strategy, and 3) after surviving extensive out-of-sample data and stringent data-snooping thresholds. The return premium should also be founded on a credible rationale, whether related to a macro risk exposure or a behavioral bias. More criteria and details are available in Hsu and Kalesnik (2014).
3 Most investors—even today—would be shocked to learn the excess return of stocks was negative for the 40-year span ending Febru-ary 2009. From early 1969 through early 2009, US Treasury bonds beat the S&P 500. More details are available in Arnott (2011, p. 74).
4 The rebalancing orientation of the Fundamental Index strategy increases the exposure to value when value is attractively priced and lessens exposure to value when value is fully priced.
5 One of our three core investment beliefs, the statement leads to our central investment philosophy that the largest and most persistent active investment opportunity is long-horizon mean reversion. Count us in the behavioral camp! Read more about our three investment beliefs in Brightman, Treussard, and Masturzo (2014).
6 RVKuhns conducted a survey that analyzes the portfolio allocations of 116 US public retirement plans as of June 30, 2015.
7 A win rate is calculated as the number of observations in which stocks beat bonds or RAFI™ beats the S&P 500, divided by the total number of observations. For example, on a 15-year rolling basis over the period 1962–2015, stocks beat bonds 384 times out of a total of 469 outcomes, resulting in a win rate of 82% (384/469).
8 Excess return is a zero-sum game: in aggregate, all investors earn the market return. To understand more about why investors take the other side of “value trades” and therefore may be funding the value premium, please see Hsu and Viswanathan (2015) and West and Larson (2014).
9 Our analysis assumes professionals begin working at the age of 25. All calculations are as of December 31, 2015. For instance, the 25- to 30-year-old worker cohort has an experience set from January 2010 through December 2015, and a 30- to 35-year-old worker
cohort has an experience set from January 2005 through Decem-ber 2015. We continue this exercise using five-year increments until we reach the 65- to 70-year-old worker cohort, which has an experience set from January 1970 through December 2015. The average collective experience is computed as the simple equal-weighted average of annualized excess returns (of stocks versus bonds, or of RAFI versus the S&P 500) across all cohort experience sets.
10 Over rolling 15-year periods from January 1962 through December 2015, the annualized real return of stocks averaged 6.2%. Exclud-ing the impact of rising valuations, the real return is 4.6% a year. Thus, more than 150 basis points of performance a year was earned solely because stocks became more expensive. Over the same period, 20-year US Treasuries reduced their annualized aver-age 15-year rolling real return from 3.2% to 2.8%, after adjusting for the return effect of interest rate changes. The return increase from an overall decline in 20-year US bond yields, from a high of 14.1% in September 1981 to 3.0% in December 2015, may have been largely offset by lower income on reinvested cash flows.
11 Value is currently cheaper than at any time other than the height of the Nifty Fifty, the tech bubble, and the global financial crisis. For more information, we invite you to read Arnott et al. (2016).
12 Our long-term return estimate for a 60/40 portfolio is found on our Asset Allocation site.
13 Pensions have many stakeholders, not one “owner.” Stakeholders include the eventual pension beneficiaries, the pension spon-sor that officially owns the assets, the future shareholders and taxpayers who are impacted if returns fail to match the pension return expectations, and so forth.
14 More details from the survey can be found at “Corporate Pension Plan Funding Levels Showed Little Change in 2015.”
15 The eVestment Alliance’s All Lifecycle/Target Date universe includes more than 380 funds across 10 designated retirement-year vintages. The analysis is as of March 31, 2016.
16 As noted earlier, although the concept of value investing has long been understood, investors could not actually invest in the Funda-mental Index until after its introduction in 2005.
17 Over the five years following February 28, 2009, US stocks returned 154.7% and 20-year US Treasuries returned 6.3%, represent-ing a cumulative excess return of 148.4%. Over the five years following February 29, 2002, RAFI returned 44.3% and the S&P 500 returned −15.8%, representing a cumulative excess return of 60.1%.

August 2016 . West & Ko . Rethinking Conventional Wisdom: Why Not a Value Bias? 8
www.researchaffiliates.com
Arnott, Robert. 2011. “Equity Risk Premium Myths.” In Rethinking the Equity Risk Premium. Edited by P. Brett Hammond, Jr., Martin L. Leibowitz, and Laurence B. Siegel. Charlottesville, VA: Research Foundation of CFA Institute.
Arnott, Robert, Noah Beck, Vitali Kalesnik, and John West. 2016. “How Can ‘Smart Beta’ Go Horribly Wrong?” Research Affiliates, February.
Arnott, Robert, Jason Hsu, and Philip Moore. 2005. “Fundamental Indexation.” Financial Analysts Journal, vol. 61, no. 2 (March/April):83–99.
Brightman, Chris, Jonathan Treussard, and Jim Masturzo. 2014. “Our Investment Beliefs.” Research Affiliates, October.
Graham, Benjamin, and David Dodd. 1934. Security Analysis. New York, NY: McGraw-Hill.
Hsu, Jason, and Vitali Kalesnik. 2014. “Finding Smart Beta in the Factor Zoo.” Research Affiliates, July.
Hsu, Jason, and Vivek Viswanathan. 2015. “Woe Betide the Value Investor.” Research Affiliates, February.
McClure, Samuel, Jian Li, Damon Tomlin, Kim Cypert, Latane Montague, and P. Read Montague. 2014. “Neural Correlates of Behavioral Preference for Culturally Familiar Drinks.” Neuron, vol. 44, no. 2, (October):379–387.
McFarland, Brendan. 2016. “Corporate Pension Plan Funding Levels Showed Little Change in 2015.” Willis Towers Watson, February 10.
West, John, and Ryan Larson. 2014. “Slugging It Out in the Equity Arena.” Research Affiliates, April.
Woolfolk, Mary, William Castellan, and Charles Brooks. 1983. “Pepsi versus Coke: Labels, Not Tastes, Prevail.” Psychological Reports, vol. 52 (February):185–186.
References
The material contained in this document is for general information purposes only. It is not intended as an offer or a solicitation for the purchase and/or sale of any security, deriva-tive, commodity, or financial instrument, nor is it advice or a recommendation to enter into any transaction. Research results relate only to a hypothetical model of past performance (i.e., a simulation) and not to an asset manage-ment product. No allowance has been made for trading costs or management fees, which would reduce investment performance. Actual results may differ. Index returns represent back-tested performance based on rules used in the creation of the index, are not a guaran-tee of future performance, and are not indica-tive of any specific investment. Indexes are not managed investment products and cannot be invested in directly. This material is based on information that is considered to be reliable, but Research Affiliates™ and its related enti-ties (collectively “Research Affiliates”) make this information available on an “as is” basis without a duty to update, make warranties, express or implied, regarding the accuracy of the informa-tion contained herein. Research Affiliates is not responsible for any errors or omissions or for results obtained from the use of this information. Nothing contained in this material is intended
to constitute legal, tax, securities, financial or investment advice, nor an opinion regarding the appropriateness of any investment. The infor-mation contained in this material should not be acted upon without obtaining advice from a licensed professional. Research Affiliates, LLC, is an investment adviser registered under the Investment Advisors Act of 1940 with the U.S. Securities and Exchange Commission (SEC). Our registration as an investment adviser does not imply a certain level of skill or training.
Investors should be aware of the risks associated with data sources and quantitative processes used in our investment management process. Errors may exist in data acquired from third party vendors, the construction of model portfolios, and in coding related to the index and portfolio construction process. While Research Affiliates takes steps to identify data and process errors so as to minimize the potential impact of such errors on index and portfolio performance, we cannot guarantee that such errors will not occur.
The trademarks Fundamental Index™, RAFI™, Research Affiliates Equity™, RAE™, and the Research Affiliates™ trademark and corporate name and all related logos are the exclusive intel-lectual property of Research Affiliates, LLC and
in some cases are registered trademarks in the U.S. and other countries. Various features of the Fundamental Index™ methodology, including an accounting data-based non-capitalization data processing system and method for creating and weighting an index of securities, are protected by various patents, and patent-pending intel-lectual property of Research Affiliates, LLC. (See all applicable US Patents, Patent Publica-tions, Patent Pending intellectual property and protected trademarks located at http://www.researchaffiliates.com/Pages/ legal.aspx#d, which are fully incorporated herein.) Any use of these trademarks, logos, patented or patent pending methodologies without the prior writ-ten permission of Research Affiliates, LLC, is expressly prohibited. Research Affiliates, LLC, reserves the right to take any and all necessary action to preserve all of its rights, title, and inter-est in and to these marks, patents or pending patents.
The views and opinions expressed are those of the author and not necessarily those of Research Affiliates, LLC. The opinions are subject to change without notice.
©2016 Research Affiliates, LLC. All rights reserved.
Disclosures


Source(s): fool.com, amazon.com, futureblind.com


View reprint options Order a reprint article now
Allan Emkin said the next decade won’t replicate historical returns.
This copy is for your personal, non-commercial use only. Reproductions and distribution of this news story are strictly prohibited.
Between a rock and a hard placeDismal returns, poor projections push public plans to pare investment gainexpectationsBy: Randy DiamondPublished: August 22, 2016
As public pension plans disclose a secondconsecutive fiscal year of lackluster returns,amid projections of diminished investmentearnings for the next decade, more publicasset owners will have little choice but tolower rate of return expectations, consultantsand analysts said.
U.S. public pension plans earned a medianreturn of 1.07% in the fiscal year ended June30, according to the Wilshire Trust UniverseComparison Service, worse than the median3.43% in the prior fiscal year. It is the secondyear in a row that returns were nearly flat andwell below the yearly 7.5% return target ofmany plans.
“I think they have to lower their rate of return;and if you look at the trend, that is what has,in fact, been happening,” said Allan Emkin,whose firm, Pension Consulting Alliance,consults for some of the largest definedbenefit plans in the U.S., including the $303.3billion California Public Employees'Retirement System and the $188.7 billionCalifornia State Teachers' Retirement System.
“There are unprecedented headwinds: the lowest historic rates of return in the bond market, and risk assets are all fullypriced,” said Mr. Emkin, co-founder and managing director at PCA in Los Angeles.
“It's really difficult to see how historic rates of return will be replicated in the next 10 years,” he said.
The investment performance of the past 30 years reflected a “golden era” that won't likely be repeated, said SreeRamaswamy, a Washington-based senior fellow at the McKinsey Global Institute. He projects that total returns for U.Sequities over the next 20 years could average 4% to 5%, because of slowing GDP growth and increased competition fromabroad, roughly 250 basis points below the average from 1985 to 2014.
One challenge for pension plans is the assumed inflation rate, which is factored into expected rates of return, and the
Between a rock and a hard place - Pensions & Investments http://www.pionline.com/article/20160822/PRINT/308229981/bet...
1 of 3 8/22/16, 9:50 AM

question of whether plans have reduced those assumptions enough to account for what economists believe will be along-term, low-rate inflation environment. Another issue: Most public pension plans are paying out more in benefitsthan they take in from contributions and investment income in a given year, meaning they have to sell assets to payretirees, a problematic answer when markets are struggling.
In any case, lowering return assumptions can have big implications. It increases the unfunded liabilities of U.S. publicpension plans, a figure that the Federal Reserve says increased to $1.7 trillion in calendar year 2015, from $1.4 trillion in2014 and $354 billion in 2005. As a result, governmental units must make larger pension contributions.
Florida RetirementOne pension system that is considering lowering its rate of return is the $141.4 billion Florida Retirement System,Tallahassee, which earned a return of 0.61% in the fiscal year ended June 30.
“Obviously the persistent low interest rate environment we have been in has depressed returns and likely will continueto do so,” said Dennis MacKee, director of communications for the Florida State Board of Administration, whichoversees the fund. Mr. MacKee said the SBA would likely be supportive of a reduction in the system's 7.65% assumedrate of return. The actual rate, he said, is set by the Actuarial Assumption Conference, a government body that meetseach fall and evaluates adjusting the rate of return.
Dick Ingram, the executive director of the $43.8 billion Illinois Teachers' Retirement System, Springfield, is still waitingfor a calculation of the fund's June 30 fiscal year returns but noted, “It wasn't a lights-out year for anyone.”
Mr. Ingram said a review of the system's rate of return should be completed by spring. He said he didn't want toprejudge what will ultimately be a retirement system board decision but did say, “Certainly there's plenty of evidencethat we're in a protracted low-return environment.”
The largest public pension plan to lower its assumption in the last 12 months is the $181 billion New York StateCommon Retirement Fund, Albany, which cut its rate of return assumption to 7%, from 7.5%, in September 2015.
Most recently, the $8.4 billion Oklahoma Public Employees Retirement System, Oklahoma City, lowered its rate to7.25% from 7.5%.
Other plans that have made reductions include: the $7.2 billion New Hampshire Retirement System, Concord, whichlowered its rate of return to 7.25% from 7.75%, the $48.5 billion Pennsylvania Public School Employees' RetirementSystem, Harrisburg, which lowered its rate of return to 7.25% from 7.5%, and the $8 billion Missouri State Employees'Retirement System, Jefferson City, which lowered its rate of return to 7.65% from 8%, show data from the NationalAssociation of State Retirement Administrators.
Two pension plans reduced their rate of return to less than 7% in 2016. The $12.3 billion Maine Public Employees'Retirement System, Augusta, went to 6.875% from 7.125% and the $10.8 billion Kentucky Retirement Systems,Frankfort, went to 6.75% from 7.5%. They joined the $24 billion Texas Municipal Retirement System, Austin, whoseboard in July 2015 approved reducing its rate of return to 6.75% from 7%.
Continuing trendKeith Brainard, research director of NASRA, said the latest round of reductions is a continuation of a trend that beganafter the financial crisis when many public pension plans began cutting their rate of return assumptions to 7.5% from8%. Currently, he said, the average public pension plan anticipates a 7.5% rate of return, but he added a number ofplans have begun to review those assumptions given the cloudy economic forecast for coming years.
But many plans, including CalPERS and CalSTRS, have not made a decision yet on lowering the assumed return.CalPERS earned 0.6% in its most recent fiscal year, while CalSTRS did slightly better at 1.4%; both significantlyunderperformed their 7.5% return assumptions.
CalPERS Chief Investment Officer Theodore Eliopoulos told the system's investment committee on Aug. 15 that the
Between a rock and a hard place - Pensions & Investments http://www.pionline.com/article/20160822/PRINT/308229981/bet...
2 of 3 8/22/16, 9:50 AM

View reprint options Order a reprint article now
retirement system's general investment consultant, Wilshire Associates, expects an annualized average investmentreturn of 6.21% over the next decade, 90 basis points lower than its prediction two years earlier.
“The next two years, the next five years and, perhaps, the next 10 years are shaping up to be the most challengingmarket environment for us, for institutional investors and for pension funds going forward,” Mr. Eliopoulos told theinvestment committee.
Wilshire Associates did issue a rosier long-term prediction for CalPERS: an annualized 7.83% return for 30 years.
The CalPERS investment committee voted last November to lower the fund's rate of return to 6.5% from 7.5% over 20years, but the plan only lowers the rate of return and reduces the amount of riskier assets, like equities, in extendedperiods during which the system has returns over 7.5%.
Last year's action doesn't prevent CalPERS from making a more immediate rate of return reduction, but Mr. Eliopouloswould not comment on that possibility. The investment committee is scheduled to review rate of return assumptionsstarting next year.
Increasing strainEven without lowering return assumptions, the $1.7 trillion in U.S. public pension plan unfunded liabilities already isputting increasing strain on state, local governments and school districts, said Thomas Aaron, a Chicago-based vicepresident and senior analyst at Moody's Investors Service.
He said a Moody's sample of 108 public pension plans across 50 states shows the median government contribution raterelative to payroll reached 16.3% in 2015, up from 9.9% in 2006. Another concern is that many public pension plans arerelying on riskier assets to drive returns of more than 7%, he said.
“We currently have heightened unfunded liabilities and contribution requirements, which are pressuring governmentbudgets like never before, and at the same time there still remains a lot of downside asset risk that could further resultin more unfunded liabilities and even higher contribution requirements,” Mr. Aaron said. n
Original Story Link: http://www.pionline.com/article/20160822/PRINT/308229981/between-a-rock-and-a-hard-place-dismal-returns-poor-projections-push-public-plans-to-pare-investment-gain-expectations
This copy is for your personal, non-commercial use only. Reproductions and distribution of this news story are strictly prohibited.
To order presentation-ready copies for distribution to your colleagues, clients or customers and/or request permission to use the articlein full or partial format please contact our Reprint Sales Manager at 732-723-0569.
Copyright © 2016 Crain Communications Inc. All Rights Reserved.
Privacy Policy | Terms & Conditions
Between a rock and a hard place - Pensions & Investments http://www.pionline.com/article/20160822/PRINT/308229981/bet...
3 of 3 8/22/16, 9:50 AM