Investment management report (BAT, Sainsbury's, Gold, FTSE100, GSK, Portfolio, Report, Variance )
19
1 Table of Figures Figure 1: Monthly Closing Prices of J Sainsbury PLC ............................................................................... 2 Figure 2: Monthly Rates o f Return o f J Sainsbury PLC ............... ............................................................. 2 Figure 3: Monthly Closing Prices of BAT PLC .......................................................................................... 3 Figure 4: Monthly Rates of Return of BAT PLC ....................................................................................... 3 Figure 5: Monthly Closing Prices of GSK PLC .......................................................................................... 3 Figure 6: Monthly Rates of Return of GSK PLC ....................................................................................... 4 Figure 7: Average Monthly R eturns and Standard Deviation of Monthly Returns (Sains., BAT, GSK) ... 4 Figure 8: UK Food Retail Market Players (2010) ..................................................................................... 4 Figure 9: Global food retail industry segmentation 2009e ..................................................................... 5 Figure 10: Sainsbury's Property Management 2010 ............................................................................... 5 Figure 11: Sainsbury's supermarket space growth from 2009 ............................................................... 6 Figure 13: Illicit cigarette market (2009)................................................................................. ................ 6 Figure 14: Forecast for numbers of smokers 2000-2050 ........................................................................ 7 Figure 15: R&D Cost in the Industry ........................................................................................................ 8 Figure 1 6: Clinical Trials .......................................................................................................................... 8 Figure 17: R&D of BAT............................................................................................................................. 8 Figure 18: Monthly Rates of Return of Gold ........................................................................................... 8 Figure19: Average Monthly Stock Returns and Standard Deviation of Monthly Returns of Gold ......... 9 Figure 20: Calculation for Beta of Gold ................................................................................................... 9 Figure 21: Gold as Hedge and Safe Haven ............................................................................................ 10 Figure 22: Evolution of the Cor relation of Gold and Global Stock Index .............................................. 11 Figure 23: Portfolio (Sainsbury-BAT)..................................................................................................... 11 Figure 24: Portfolio (Sainsbury-GSK)..................................................................................................... 12 Figure 25: Portfolio (Sainsbury-Gold) ................................................................................................... 12 Figure 26: Portfolio (BAT-GSK) .............................................................................................................. 12 Figure 27: Portfolio (BAT-Gold) ............................................................................................................. 13 Figure 28: Portfolio (GSK-Gold) ............................................................................................................. 13 Figure 29: Risk-Return Graph (Sainsbury-BAT) ..................................................................................... 14 Figure 3 0: R isk-Return Graph (Sainsbury-GSK) ................................................. .................................... 14 Figure 31: Risk-Return Graph (Sainsbury-Gold) ... ................................................................................. 15 Figure 32: Risk-Return Graph (BAT-GSK) .............................................................................................. 15 Figure 3 3: R isk-Return Graph (BAT-Gold) .................................................................... ......................... 16 Figure 3 4: R isk-Return Graph (GSK-Gold) .................................................................... ......................... 16 Figure 35: Portfolio Return and Risk Overview ..................................................................................... 17 Figure 36: Price Performance Comparison of FTSE100, BAT, GSK and Sainsbury 2004-2011 .............. 17 Figure 3 7: Gold vs. FTSE100 2005 -2011 ................................................................................................ 18
-
Upload
oleksandr-mazniker -
Category
Documents
-
view
217 -
download
0
Transcript of Investment management report (BAT, Sainsbury's, Gold, FTSE100, GSK, Portfolio, Report, Variance )
8/3/2019 Investment management report (BAT, Sainsbury's, Gold, FTSE100, GSK, Portfolio, Report, Variance )
http://slidepdf.com/reader/full/investment-management-report-bat-sainsburys-gold-ftse100-gsk-portfolio 1/19
1
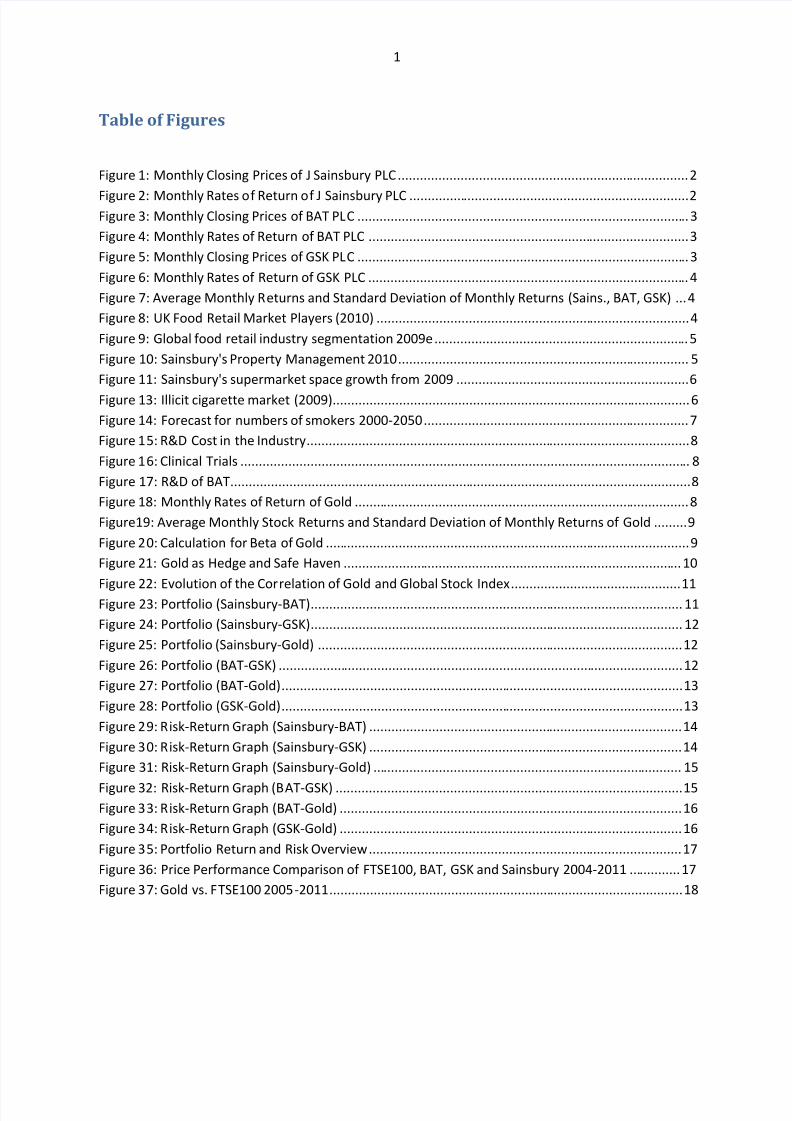
Table of Figures
Figure 1: Monthly Closing Prices of J Sainsbury PLC ............................................................................... 2
Figure 2: Monthly Rates of Return of J Sainsbury PLC ............................................................................ 2Figure 3: Monthly Closing Prices of BAT PLC .......................................................................................... 3
Figure 4: Monthly Rates of Return of BAT PLC ....................................................................................... 3
Figure 5: Monthly Closing Prices of GSK PLC .......................................................................................... 3
Figure 6: Monthly Rates of Return of GSK PLC ....................................................................................... 4
Figure 7: Average Monthly Returns and Standard Deviation of Monthly Returns (Sains., BAT, GSK) ... 4
Figure 8: UK Food Retail Market Players (2010) ..................................................................................... 4
Figure 9: Global food retail industry segmentation 2009e ..................................................................... 5
Figure 10: Sainsbury's Property Management 2010 ............................................................................... 5
Figure 11: Sainsbury's supermarket space growth from 2009 ............................................................... 6
Figure 13: Illicit cigarette market (2009)................................................................................................. 6
Figure 14: Forecast for numbers of smokers 2000-2050 ........................................................................ 7
Figure 15: R&D Cost in the Industry ........................................................................................................ 8
Figure 16: Clinical Trials .......................................................................................................................... 8
Figure 17: R&D of BAT ............................................................................................................................. 8
Figure 18: Monthly Rates of Return of Gold ........................................................................................... 8
Figure19: Average Monthly Stock Returns and Standard Deviation of Monthly Returns of Gold ......... 9
Figure 20: Calculation for Beta of Gold ................................................................................................... 9
Figure 21: Gold as Hedge and Safe Haven ............................................................................................ 10
Figure 22: Evolution of the Correlation of Gold and Global Stock Index .............................................. 11Figure 23: Portfolio (Sainsbury-BAT) ..................................................................................................... 11
Figure 24: Portfolio (Sainsbury-GSK) ..................................................................................................... 12
Figure 25: Portfolio (Sainsbury-Gold) ................................................................................................... 12
Figure 26: Portfolio (BAT-GSK) .............................................................................................................. 12
Figure 27: Portfolio (BAT-Gold) ............................................................................................................. 13
Figure 28: Portfolio (GSK-Gold) ............................................................................................................. 13
Figure 29: Risk-Return Graph (Sainsbury-BAT) ..................................................................................... 14
Figure 30: Risk-Return Graph (Sainsbury-GSK) ..................................................................................... 14
Figure 31: Risk-Return Graph (Sainsbury-Gold) .................................................................................... 15
Figure 32: Risk-Return Graph (BAT-GSK) .............................................................................................. 15Figure 33: Risk-Return Graph (BAT-Gold) ............................................................................................. 16
Figure 34: Risk-Return Graph (GSK-Gold) ............................................................................................. 16
Figure 35: Portfolio Return and Risk Overview ..................................................................................... 17
Figure 36: Price Performance Comparison of FTSE100, BAT, GSK and Sainsbury 2004-2011 .............. 17
Figure 37: Gold vs. FTSE100 2005-2011 ................................................................................................ 18
8/3/2019 Investment management report (BAT, Sainsbury's, Gold, FTSE100, GSK, Portfolio, Report, Variance )
http://slidepdf.com/reader/full/investment-management-report-bat-sainsburys-gold-ftse100-gsk-portfolio 2/19
2
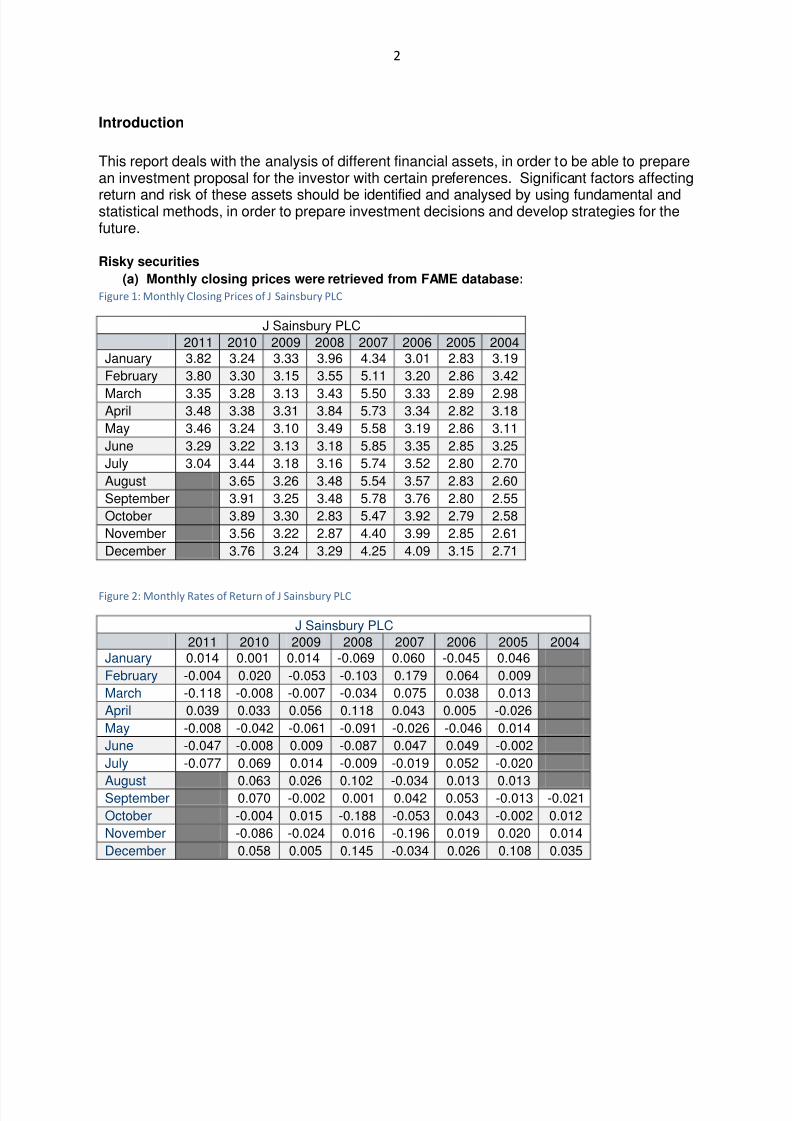
Introduction
This report deals with the analysis of different financial assets, in order to be able to preparean investment proposal for the investor with certain preferences. Significant factors affecting
return and risk of these assets should be identified and analysed by using fundamental andstatistical methods, in order to prepare investment decisions and develop strategies for thefuture.
Risky securities
(a) Monthly closing prices were retrieved from FAME database:
Figure 1: Monthly Closing Prices of J Sainsbury PLC
J Sainsbury PLC
2011 2010 2009 2008 2007 2006 2005 2004January 3.82 3.24 3.33 3.96 4.34 3.01 2.83 3.19
February 3.80 3.30 3.15 3.55 5.11 3.20 2.86 3.42
March 3.35 3.28 3.13 3.43 5.50 3.33 2.89 2.98April 3.48 3.38 3.31 3.84 5.73 3.34 2.82 3.18
May 3.46 3.24 3.10 3.49 5.58 3.19 2.86 3.11
June 3.29 3.22 3.13 3.18 5.85 3.35 2.85 3.25
July 3.04 3.44 3.18 3.16 5.74 3.52 2.80 2.70
August 3.65 3.26 3.48 5.54 3.57 2.83 2.60
September 3.91 3.25 3.48 5.78 3.76 2.80 2.55
October 3.89 3.30 2.83 5.47 3.92 2.79 2.58
November 3.56 3.22 2.87 4.40 3.99 2.85 2.61
December 3.76 3.24 3.29 4.25 4.09 3.15 2.71
Figure 2: Monthly Rates of Return of J Sainsbury PLC
J Sainsbury PLC
2011 2010 2009 2008 2007 2006 2005 2004January 0.014 0.001 0.014 -0.069 0.060 -0.045 0.046
February -0.004 0.020 -0.053 -0.103 0.179 0.064 0.009
March -0.118 -0.008 -0.007 -0.034 0.075 0.038 0.013
April 0.039 0.033 0.056 0.118 0.043 0.005 -0.026
May -0.008 -0.042 -0.061 -0.091 -0.026 -0.046 0.014
June -0.047 -0.008 0.009 -0.087 0.047 0.049 -0.002
July -0.077 0.069 0.014 -0.009 -0.019 0.052 -0.020
August 0.063 0.026 0.102 -0.034 0.013 0.013September 0.070 -0.002 0.001 0.042 0.053 -0.013 -0.021
October -0.004 0.015 -0.188 -0.053 0.043 -0.002 0.012
November -0.086 -0.024 0.016 -0.196 0.019 0.020 0.014
December 0.058 0.005 0.145 -0.034 0.026 0.108 0.035
8/3/2019 Investment management report (BAT, Sainsbury's, Gold, FTSE100, GSK, Portfolio, Report, Variance )
http://slidepdf.com/reader/full/investment-management-report-bat-sainsburys-gold-ftse100-gsk-portfolio 3/19
3
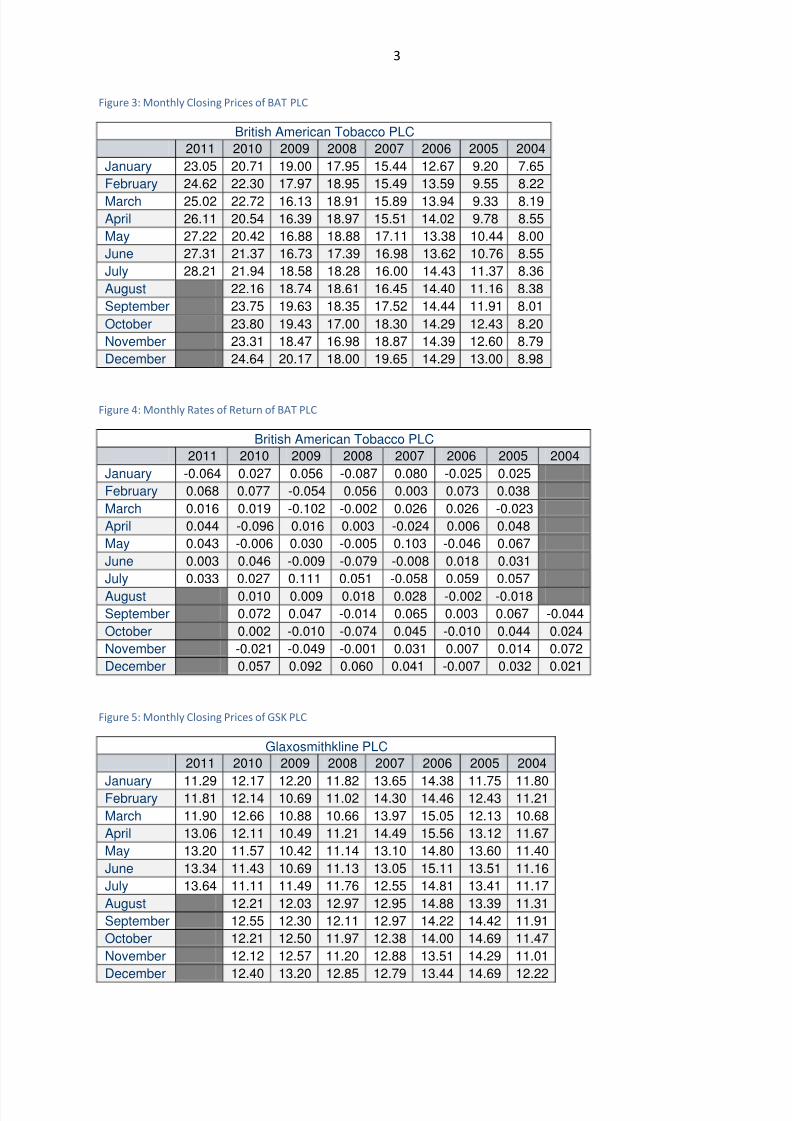
Figure 3: Monthly Closing Prices of BAT PLC
British American Tobacco PLC
2011 2010 2009 2008 2007 2006 2005 2004
January 23.05 20.71 19.00 17.95 15.44 12.67 9.20 7.65
February 24.62 22.30 17.97 18.95 15.49 13.59 9.55 8.22
March 25.02 22.72 16.13 18.91 15.89 13.94 9.33 8.19
April 26.11 20.54 16.39 18.97 15.51 14.02 9.78 8.55
May 27.22 20.42 16.88 18.88 17.11 13.38 10.44 8.00
June 27.31 21.37 16.73 17.39 16.98 13.62 10.76 8.55
July 28.21 21.94 18.58 18.28 16.00 14.43 11.37 8.36
August 22.16 18.74 18.61 16.45 14.40 11.16 8.38
September 23.75 19.63 18.35 17.52 14.44 11.91 8.01
October 23.80 19.43 17.00 18.30 14.29 12.43 8.20
November 23.31 18.47 16.98 18.87 14.39 12.60 8.79
December 24.64 20.17 18.00 19.65 14.29 13.00 8.98
Figure 4: Monthly Rates of Return of BAT PLC
British American Tobacco PLC
2011 2010 2009 2008 2007 2006 2005 2004
January -0.064 0.027 0.056 -0.087 0.080 -0.025 0.025
February 0.068 0.077 -0.054 0.056 0.003 0.073 0.038
March 0.016 0.019 -0.102 -0.002 0.026 0.026 -0.023
April 0.044 -0.096 0.016 0.003 -0.024 0.006 0.048
May 0.043 -0.006 0.030 -0.005 0.103 -0.046 0.067
June 0.003 0.046 -0.009 -0.079 -0.008 0.018 0.031
July 0.033 0.027 0.111 0.051 -0.058 0.059 0.057
August 0.010 0.009 0.018 0.028 -0.002 -0.018
September 0.072 0.047 -0.014 0.065 0.003 0.067 -0.044
October 0.002 -0.010 -0.074 0.045 -0.010 0.044 0.024
November -0.021 -0.049 -0.001 0.031 0.007 0.014 0.072
December 0.057 0.092 0.060 0.041 -0.007 0.032 0.021
Figure 5: Monthly Closing Prices of GSK PLC
Glaxosmithkline PLC
2011 2010 2009 2008 2007 2006 2005 2004
January 11.29 12.17 12.20 11.82 13.65 14.38 11.75 11.80February 11.81 12.14 10.69 11.02 14.30 14.46 12.43 11.21
March 11.90 12.66 10.88 10.66 13.97 15.05 12.13 10.68
April 13.06 12.11 10.49 11.21 14.49 15.56 13.12 11.67
May 13.20 11.57 10.42 11.14 13.10 14.80 13.60 11.40
June 13.34 11.43 10.69 11.13 13.05 15.11 13.51 11.16
July 13.64 11.11 11.49 11.76 12.55 14.81 13.41 11.17
August 12.21 12.03 12.97 12.95 14.88 13.39 11.31
September 12.55 12.30 12.11 12.97 14.22 14.42 11.91
October 12.21 12.50 11.97 12.38 14.00 14.69 11.47
November 12.12 12.57 11.20 12.88 13.51 14.29 11.01
December 12.40 13.20 12.85 12.79 13.44 14.69 12.22
8/3/2019 Investment management report (BAT, Sainsbury's, Gold, FTSE100, GSK, Portfolio, Report, Variance )
http://slidepdf.com/reader/full/investment-management-report-bat-sainsburys-gold-ftse100-gsk-portfolio 4/19
4
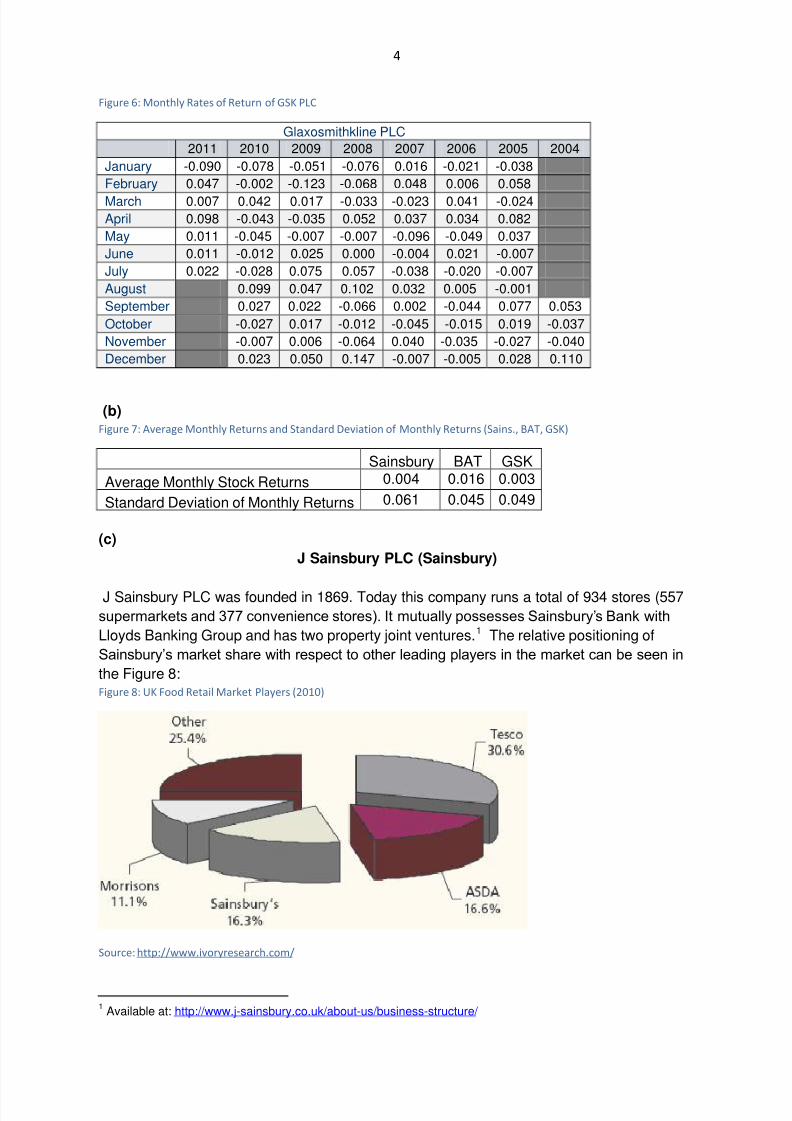
Figure 6: Monthly Rates of Return of GSK PLC
Glaxosmithkline PLC
2011 2010 2009 2008 2007 2006 2005 2004
January -0.090 -0.078 -0.051 -0.076 0.016 -0.021 -0.038
February 0.047 -0.002 -0.123 -0.068 0.048 0.006 0.058
March 0.007 0.042 0.017 -0.033 -0.023 0.041 -0.024
April 0.098 -0.043 -0.035 0.052 0.037 0.034 0.082
May 0.011 -0.045 -0.007 -0.007 -0.096 -0.049 0.037
June 0.011 -0.012 0.025 0.000 -0.004 0.021 -0.007
July 0.022 -0.028 0.075 0.057 -0.038 -0.020 -0.007
August 0.099 0.047 0.102 0.032 0.005 -0.001
September 0.027 0.022 -0.066 0.002 -0.044 0.077 0.053
October -0.027 0.017 -0.012 -0.045 -0.015 0.019 -0.037
November -0.007 0.006 -0.064 0.040 -0.035 -0.027 -0.040
December 0.023 0.050 0.147 -0.007 -0.005 0.028 0.110
(b)Figure 7: Average Monthly Returns and Standard Deviation of Monthly Returns (Sains., BAT, GSK)
Sainsbury BAT GSK
Average Monthly Stock Returns 0.004 0.016 0.003
Standard Deviation of Monthly Returns 0.061 0.045 0.049
(c)
J Sainsbury PLC (Sainsbury)
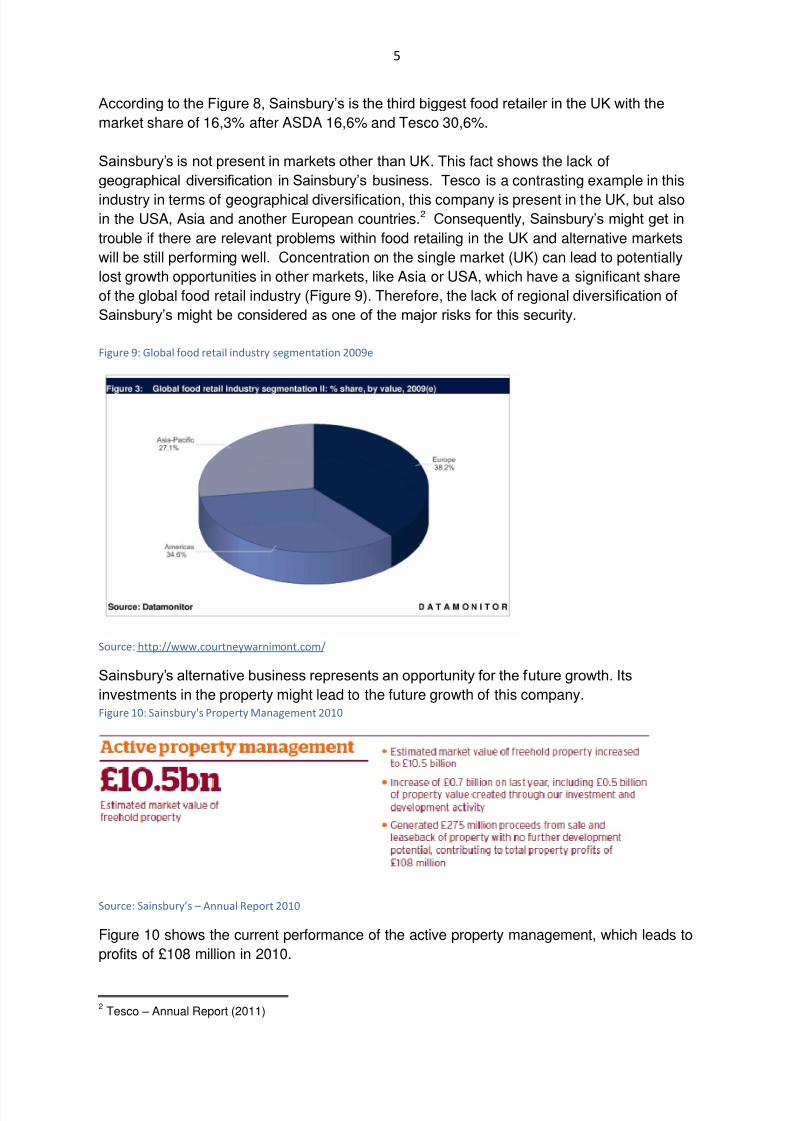
J Sainsbury PLC was founded in 1869. Today this company runs a total of 934 stores (557
supermarkets and 377 convenience stores). It mutually possesses Sainsbury’s Bank with
Lloyds Banking Group and has two property joint ventures.1 The relative positioning of
Sainsbury’s market share with respect to other leading players in the market can be seen in
the Figure 8:Figure 8: UK Food Retail Market Players (2010)
Source: http://www.ivoryresearch.com/
1Available at: http://www.j-sainsbury.co.uk/about-us/business-structure/
8/3/2019 Investment management report (BAT, Sainsbury's, Gold, FTSE100, GSK, Portfolio, Report, Variance )
http://slidepdf.com/reader/full/investment-management-report-bat-sainsburys-gold-ftse100-gsk-portfolio 5/19
5
According to the Figure 8, Sainsbury’s is the third biggest food retailer in the UK with the
market share of 16,3% after ASDA 16,6% and Tesco 30,6%.
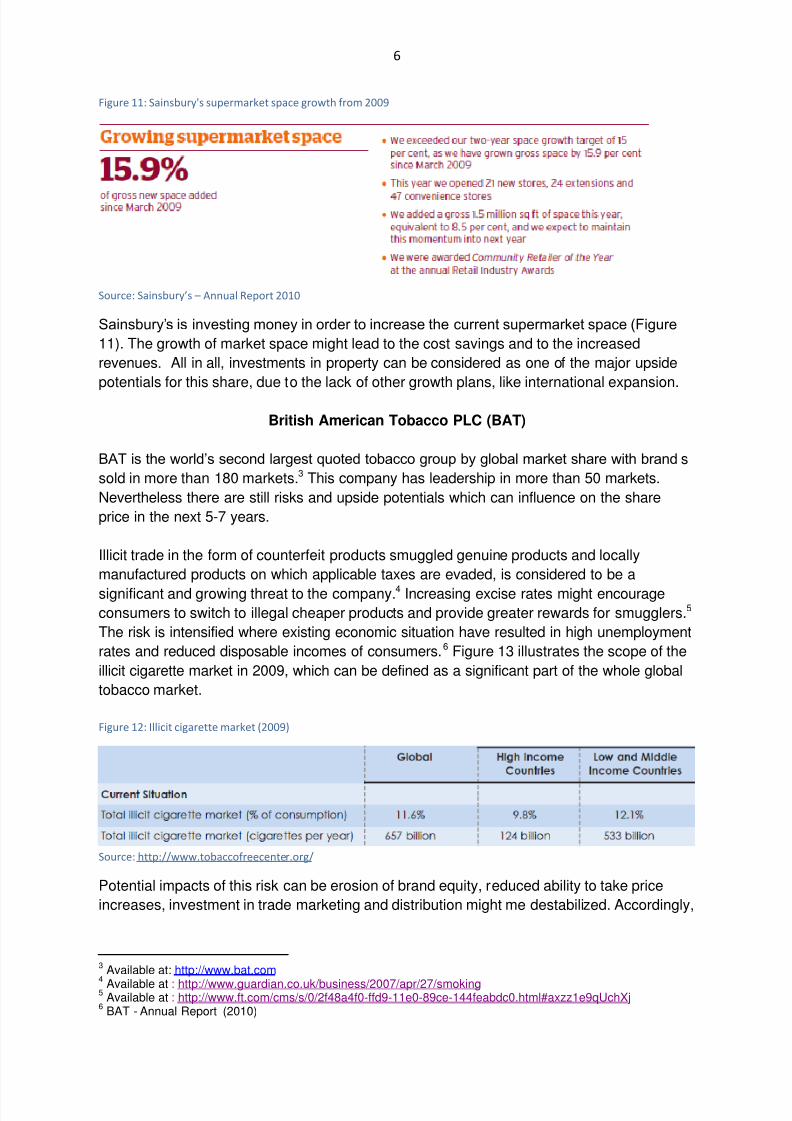
Sainsbury’s is not present in markets other than UK. This fact shows the lack of
geographical diversification in Sainsbury’s business. Tesco is a contrasting example in this
industry in terms of geographical diversification, this company is present in the UK, but alsoin the USA, Asia and another European countries.2 Consequently, Sainsbury’s might get in
trouble if there are relevant problems within food retailing in the UK and alternative markets
will be still performing well. Concentration on the single market (UK) can lead to potentially
lost growth opportunities in other markets, like Asia or USA, which have a significant share
of the global food retail industry (Figure 9). Therefore, the lack of regional diversification of
Sainsbury’s might be considered as one of the major risks for this security.
Figure 9: Global food retail industry segmentation 2009e
Source: http://www.courtneywarnimont.com/
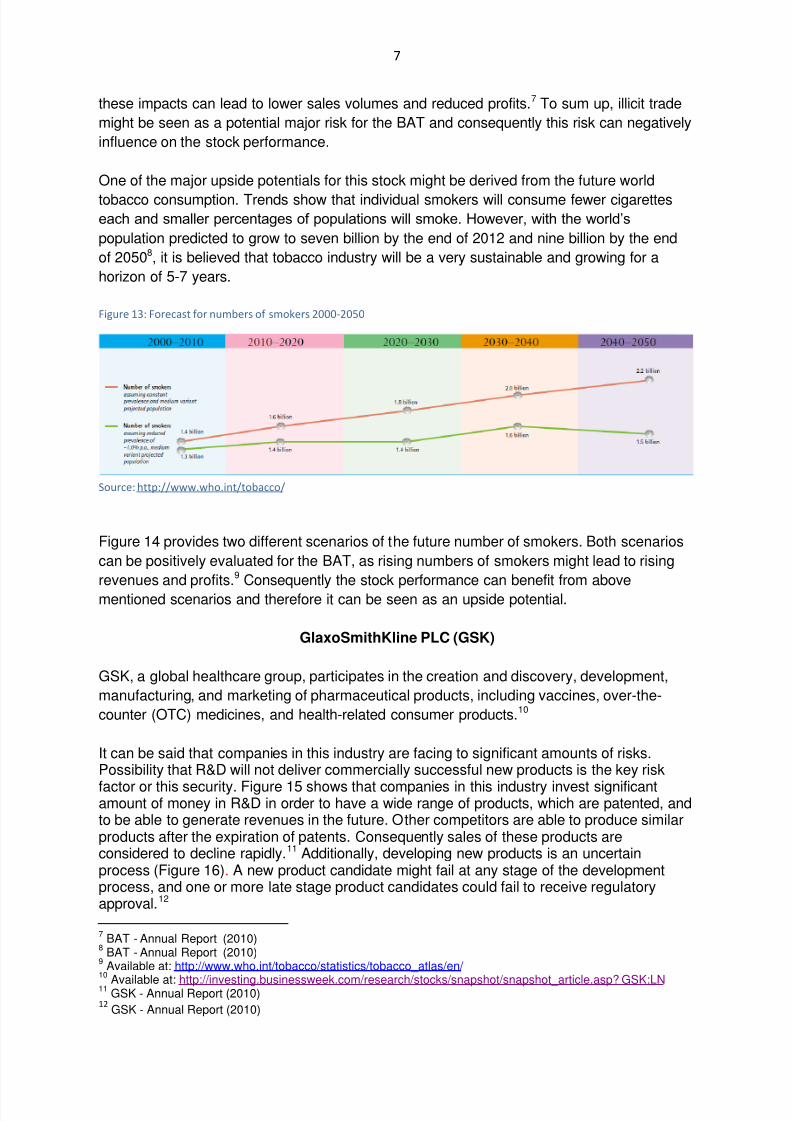
Sainsbury’s alternative business represents an opportunity for the future growth. Its
investments in the property might lead to the future growth of this company.Figure 10: Sainsbury's Property Management 2010
Source: Sainsbury’s – Annual Report 2010
Figure 10 shows the current performance of the active property management, which leads to
profits of £108 million in 2010.
2Tesco – Annual Report (2011)
8/3/2019 Investment management report (BAT, Sainsbury's, Gold, FTSE100, GSK, Portfolio, Report, Variance )
http://slidepdf.com/reader/full/investment-management-report-bat-sainsburys-gold-ftse100-gsk-portfolio 6/19
6
Figure 11: Sainsbury's supermarket space growth from 2009
Source: Sainsbury’s – Annual Report 2010
Sainsbury’s is investing money in order to increase the current supermarket space (Figure
11). The growth of market space might lead to the cost savings and to the increased
revenues. All in all, investments in property can be considered as one of the major upside
potentials for this share, due to the lack of other growth plans, like international expansion.
British American Tobacco PLC (BAT)
BAT is the world’s second largest quoted tobacco group by global market share with brand s
sold in more than 180 markets.3 This company has leadership in more than 50 markets.
Nevertheless there are still risks and upside potentials which can influence on the share
price in the next 5-7 years.
Illicit trade in the form of counterfeit products smuggled genuine products and locally
manufactured products on which applicable taxes are evaded, is considered to be a
significant and growing threat to the company.4 Increasing excise rates might encourageconsumers to switch to illegal cheaper products and provide greater rewards for smugglers.5
The risk is intensified where existing economic situation have resulted in high unemployment
rates and reduced disposable incomes of consumers.6 Figure 13 illustrates the scope of the
illicit cigarette market in 2009, which can be defined as a significant part of the whole global
tobacco market.
Figure 12: Illicit cigarette market (2009)
Source: http://www.tobaccofreecenter.org/
Potential impacts of this risk can be erosion of brand equity, reduced ability to take price
increases, investment in trade marketing and distribution might me destabilized. Accordingly,
3Available at: http://www.bat.com
4 Available at : http://www.guardian.co.uk/business/2007/apr/27/smoking 5
Available at : http://www.ft.com/cms/s/0/2f48a4f0-ffd9-11e0-89ce-144feabdc0.html#axzz1e9qUchXj 6
BAT - Annual Report (2010)
8/3/2019 Investment management report (BAT, Sainsbury's, Gold, FTSE100, GSK, Portfolio, Report, Variance )
http://slidepdf.com/reader/full/investment-management-report-bat-sainsburys-gold-ftse100-gsk-portfolio 7/19
7
these impacts can lead to lower sales volumes and reduced profits.7 To sum up, illicit trade
might be seen as a potential major risk for the BAT and consequently this risk can negatively
influence on the stock performance.
One of the major upside potentials for this stock might be derived from the future world
tobacco consumption. Trends show that individual smokers will consume fewer cigaretteseach and smaller percentages of populations will smoke. However, with the world’s
population predicted to grow to seven billion by the end of 2012 and nine billion by the end
of 20508, it is believed that tobacco industry will be a very sustainable and growing for a
horizon of 5-7 years.
Figure 13: Forecast for numbers of smokers 2000-2050
Source: http://www.who.int/tobacco/
Figure 14 provides two different scenarios of the future number of smokers. Both scenarios
can be positively evaluated for the BAT, as rising numbers of smokers might lead to rising
revenues and profits.9 Consequently the stock performance can benefit from above
mentioned scenarios and therefore it can be seen as an upside potential.
GlaxoSmithKline PLC (GSK)
GSK, a global healthcare group, participates in the creation and discovery, development,
manufacturing, and marketing of pharmaceutical products, including vaccines, over-the-
counter (OTC) medicines, and health-related consumer products.10
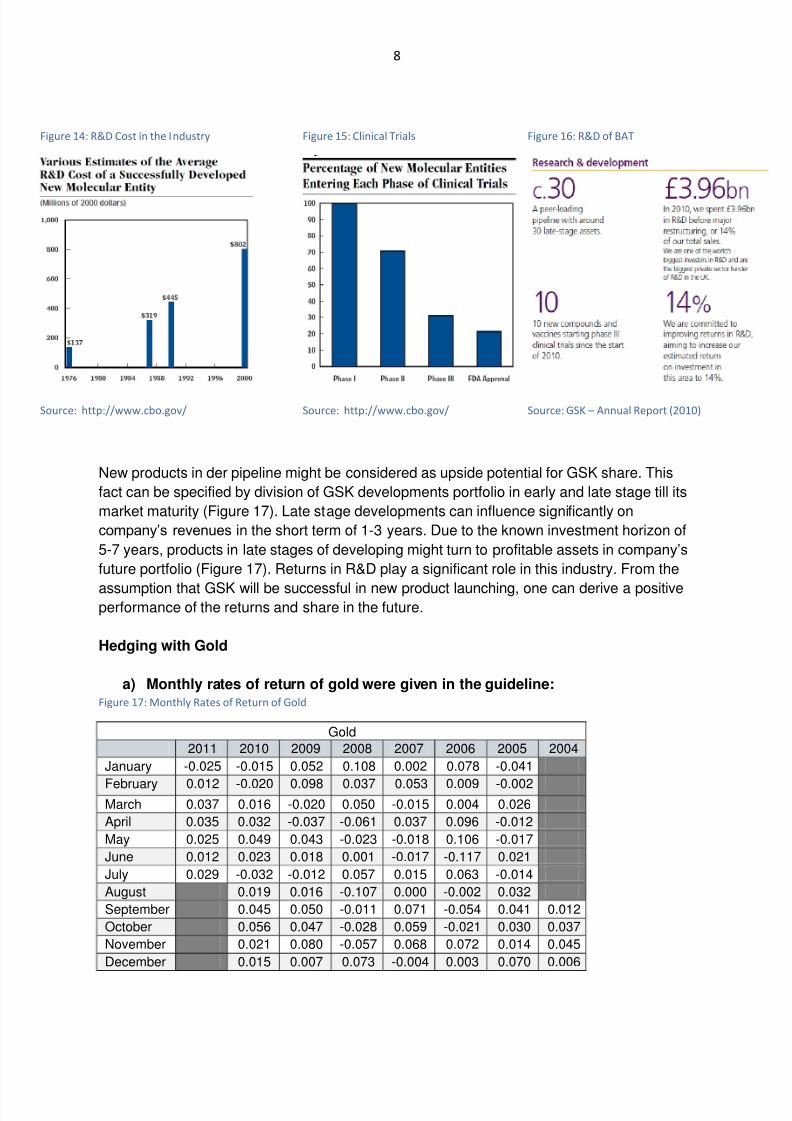
It can be said that companies in this industry are facing to significant amounts of risks.Possibility that R&D will not deliver commercially successful new products is the key risk
factor or this security. Figure 15 shows that companies in this industry invest significantamount of money in R&D in order to have a wide range of products, which are patented, andto be able to generate revenues in the future. Other competitors are able to produce similarproducts after the expiration of patents. Consequently sales of these products areconsidered to decline rapidly.11 Additionally, developing new products is an uncertainprocess (Figure 16). A new product candidate might fail at any stage of the developmentprocess, and one or more late stage product candidates could fail to receive regulatoryapproval.12
7BAT - Annual Report (2010)
8BAT - Annual Report (2010)
9Available at: http://www.who.int/tobacco/statistics/tobacco_atlas/en/
10
Available at: http://investing.businessweek.com/research/stocks/snapshot/snapshot_article.asp? GSK:LN 11GSK - Annual Report (2010)
12 GSK - Annual Report (2010)
8/3/2019 Investment management report (BAT, Sainsbury's, Gold, FTSE100, GSK, Portfolio, Report, Variance )
http://slidepdf.com/reader/full/investment-management-report-bat-sainsburys-gold-ftse100-gsk-portfolio 8/19
8
Figure 14: R&D Cost in the Industry
Source: http://www.cbo.gov/
Figure 15: Clinical Trials
Source: http://www.cbo.gov/
Figure 16: R&D of BAT
Source: GSK – Annual Report (2010)
New products in der pipeline might be considered as upside potential for GSK share. This
fact can be specified by division of GSK developments portfolio in early and late stage till its
market maturity (Figure 17). Late stage developments can influence significantly on
company’s revenues in the short term of 1-3 years. Due to the known investment horizon of
5-7 years, products in late stages of developing might turn to profitable assets in company’s
future portfolio (Figure 17). Returns in R&D play a significant role in this industry. From the
assumption that GSK will be successful in new product launching, one can derive a positiveperformance of the returns and share in the future.
Hedging with Gold
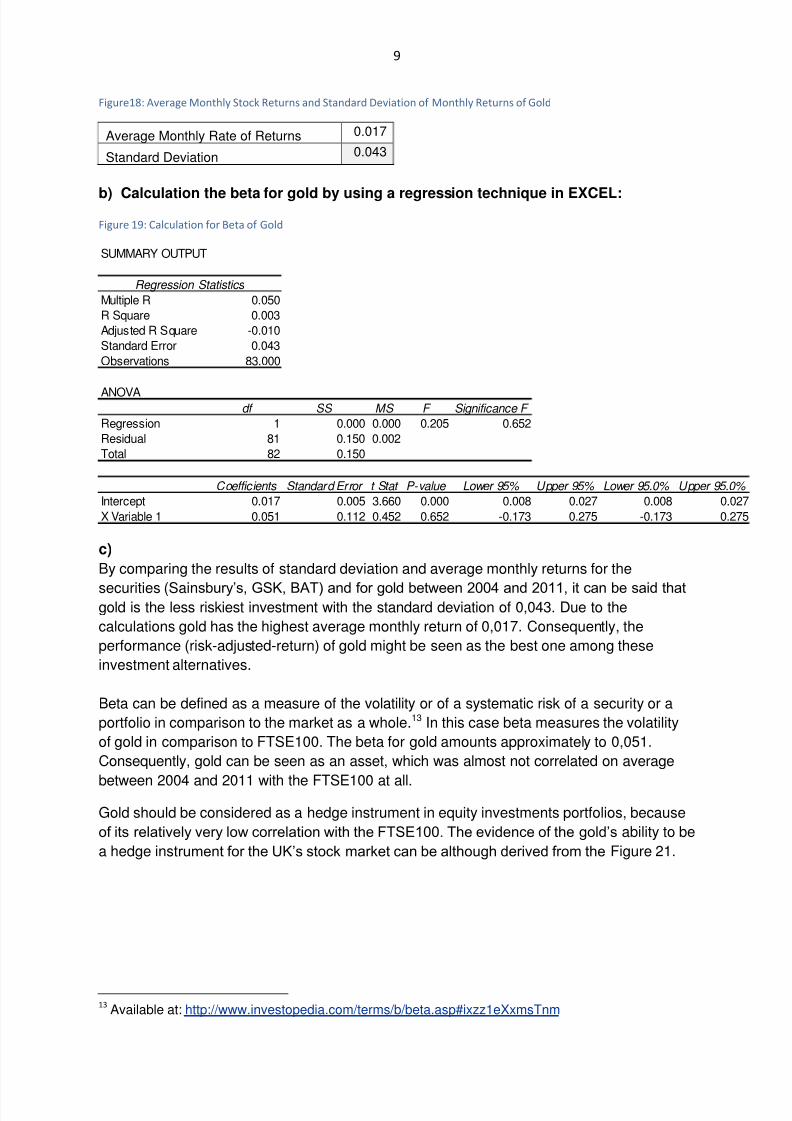
a) Monthly rates of return of gold were given in the guideline:Figure 17: Monthly Rates of Return of Gold
Gold
2011 2010 2009 2008 2007 2006 2005 2004
January -0.025 -0.015 0.052 0.108 0.002 0.078 -0.041
February 0.012 -0.020 0.098 0.037 0.053 0.009 -0.002March 0.037 0.016 -0.020 0.050 -0.015 0.004 0.026
April 0.035 0.032 -0.037 -0.061 0.037 0.096 -0.012
May 0.025 0.049 0.043 -0.023 -0.018 0.106 -0.017
June 0.012 0.023 0.018 0.001 -0.017 -0.117 0.021
July 0.029 -0.032 -0.012 0.057 0.015 0.063 -0.014
August 0.019 0.016 -0.107 0.000 -0.002 0.032
September 0.045 0.050 -0.011 0.071 -0.054 0.041 0.012
October 0.056 0.047 -0.028 0.059 -0.021 0.030 0.037
November 0.021 0.080 -0.057 0.068 0.072 0.014 0.045
December 0.015 0.007 0.073 -0.004 0.003 0.070 0.006
8/3/2019 Investment management report (BAT, Sainsbury's, Gold, FTSE100, GSK, Portfolio, Report, Variance )
http://slidepdf.com/reader/full/investment-management-report-bat-sainsburys-gold-ftse100-gsk-portfolio 9/19
9
Figure18: Average Monthly Stock Returns and Standard Deviation of Monthly Returns of Gold
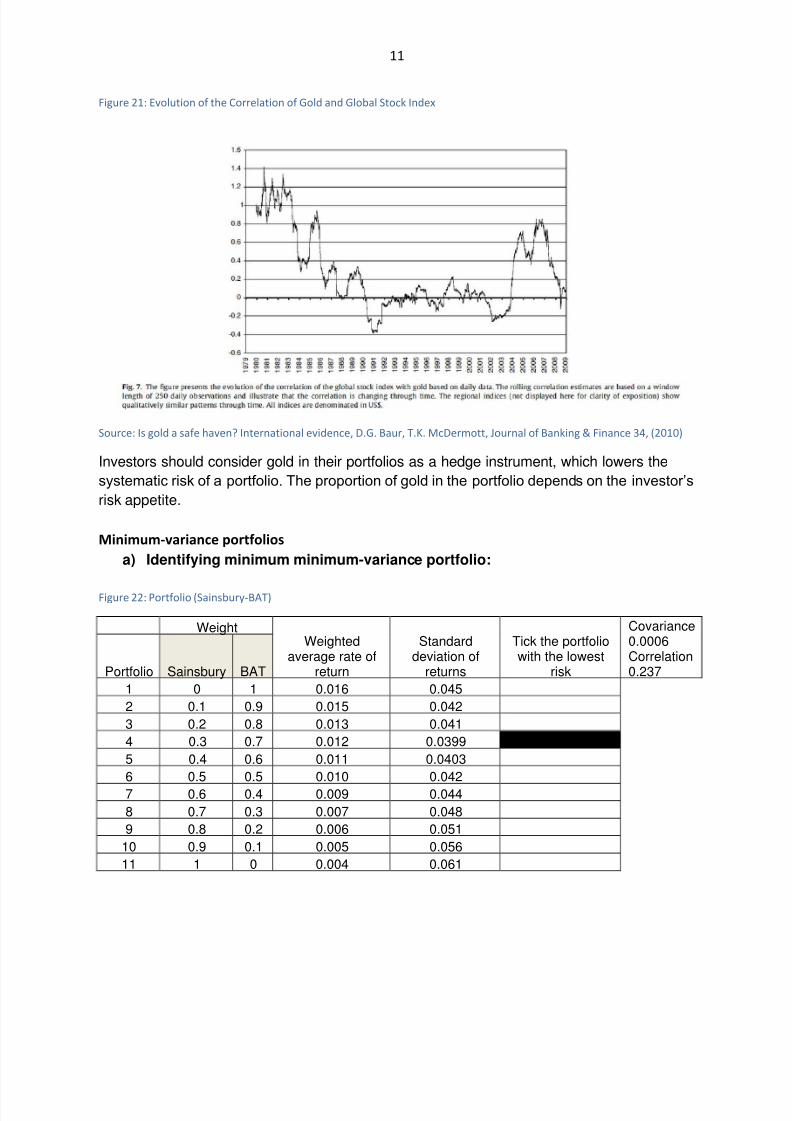
b) Calculation the beta for gold by using a regression technique in EXCEL:
Figure 19: Calculation for Beta of Gold
c)
By comparing the results of standard deviation and average monthly returns for the
securities (Sainsbury’s, GSK, BAT) and for gold between 2004 and 2011, it can be said thatgold is the less riskiest investment with the standard deviation of 0,043. Due to the
calculations gold has the highest average monthly return of 0,017. Consequently, the
performance (risk-adjusted-return) of gold might be seen as the best one among these
investment alternatives.
Beta can be defined as a measure of the volatility or of a systematic risk of a security or a
portfolio in comparison to the market as a whole.13 In this case beta measures the volatility
of gold in comparison to FTSE100. The beta for gold amounts approximately to 0,051.
Consequently, gold can be seen as an asset, which was almost not correlated on average
between 2004 and 2011 with the FTSE100 at all.
Gold should be considered as a hedge instrument in equity investments portfolios, because
of its relatively very low correlation with the FTSE100. The evidence of the gold’s ability to be
a hedge instrument for the UK’s stock market can be although derived from the Figure 21.
13 Available at: http://www.investopedia.com/terms/b/beta.asp#ixzz1eXxmsTnm
SUMMARY OUTPUT
Regression Statistics
Multiple R 0.050
R Square 0.003
Adjusted R Square -0.010
Standard Error 0.043
Observations 83.000
ANOVAdf SS MS F Significance F
Regression 1 0.000 0.000 0.205 0.652
Residual 81 0.150 0.002
Total 82 0.150
Coefficients Standard Error t Stat P-value Lower 95% Upper 95% Lower 95.0% Upper 95.0%
Intercept 0.017 0.005 3.660 0.000 0.008 0.027 0.008 0.027
X Variable 1 0.051 0.112 0.452 0.652 -0.173 0.275 -0.173 0.275
Average Monthly Rate of Returns 0.017
Standard Deviation 0.043

8/3/2019 Investment management report (BAT, Sainsbury's, Gold, FTSE100, GSK, Portfolio, Report, Variance )
http://slidepdf.com/reader/full/investment-management-report-bat-sainsburys-gold-ftse100-gsk-portfolio 10/19
10
Figure 20: Gold as Hedge and Safe Haven
Source: Is gold a safe haven? International evidence, D.G. Baur, T.K. McDermott, Journal of Banking & Finance 34, (2010)
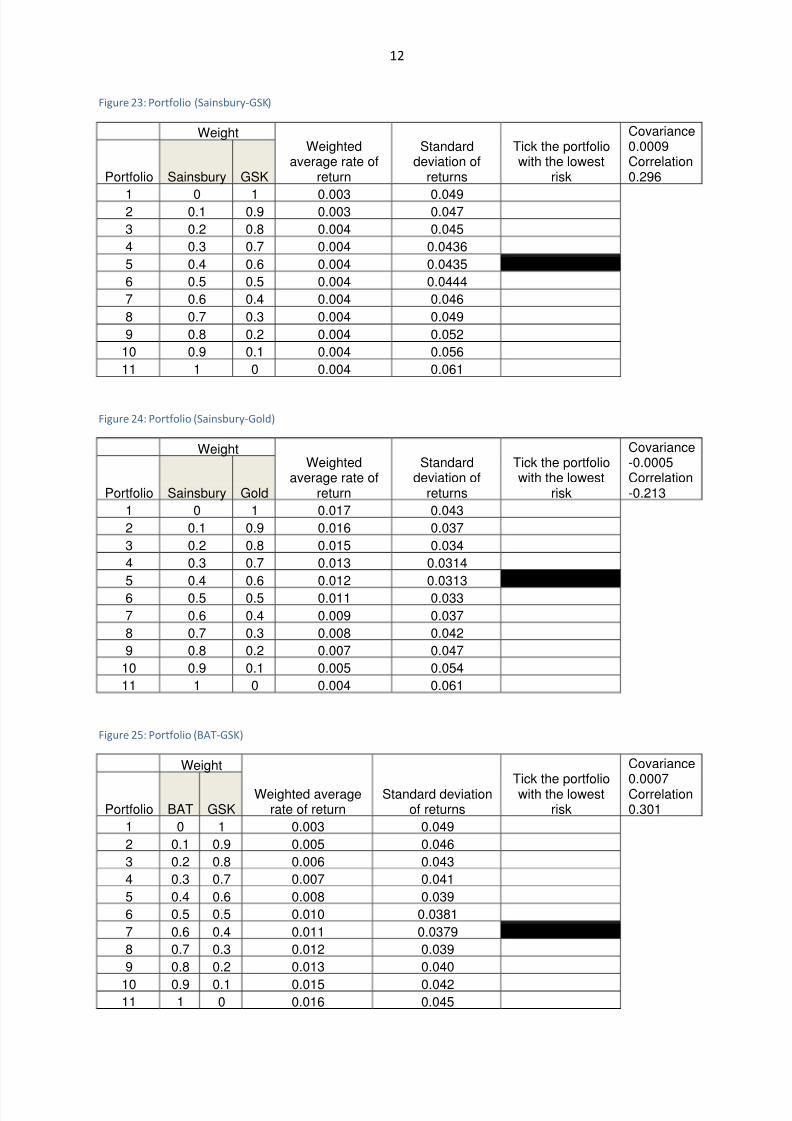
Nevertheless the correlation of gold with the market indexes is not constant, what can be
seen in the Figure 22. The correlation between gold and the global stock index was
changing during the time.14 The Figure 22 shows that gold is not a hedge at all times but
only in certain periods. In certain periods gold investments can even stabilize and/or improvethe performance of the equity portfolio because gold is also known as a safe haven for the
investors.15
14 D.G. Baur, T.K. McDermott (2010)
15 D.G. Baur, T.K. McDermott (2010)
8/3/2019 Investment management report (BAT, Sainsbury's, Gold, FTSE100, GSK, Portfolio, Report, Variance )
http://slidepdf.com/reader/full/investment-management-report-bat-sainsburys-gold-ftse100-gsk-portfolio 11/19
11
Figure 21: Evolution of the Correlation of Gold and Global Stock Index
Source: Is gold a safe haven? International evidence, D.G. Baur, T.K. McDermott, Journal of Banking & Finance 34, (2010)
Investors should consider gold in their portfolios as a hedge instrument, which lowers the
systematic risk of a portfolio. The proportion of gold in the portfolio depends on the investor’s
risk appetite.
Minimum-variance portfolios
a) Identifying minimum minimum-variance portfolio:
Figure 22: Portfolio (Sainsbury-BAT)
WeightWeighted
average rate ofreturn
Standarddeviation of
returns
Tick the portfoliowith the lowest
risk
Covariance0.0006Correlation0.237Portfolio Sainsbury BAT
1 0 1 0.016 0.045
2 0.1 0.9 0.015 0.042
3 0.2 0.8 0.013 0.041
4 0.3 0.7 0.012 0.0399
5 0.4 0.6 0.011 0.0403
6 0.5 0.5 0.010 0.042
7 0.6 0.4 0.009 0.044
8 0.7 0.3 0.007 0.048
9 0.8 0.2 0.006 0.051
10 0.9 0.1 0.005 0.056
11 1 0 0.004 0.061
8/3/2019 Investment management report (BAT, Sainsbury's, Gold, FTSE100, GSK, Portfolio, Report, Variance )
http://slidepdf.com/reader/full/investment-management-report-bat-sainsburys-gold-ftse100-gsk-portfolio 12/19
12
Figure 23: Portfolio (Sainsbury-GSK)
WeightWeighted
average rate ofreturn
Standarddeviation of
returns
Tick the portfoliowith the lowest
risk
Covariance0.0009Correlation0.296Portfolio Sainsbury GSK
1 0 1 0.003 0.0492 0.1 0.9 0.003 0.047
3 0.2 0.8 0.004 0.045
4 0.3 0.7 0.004 0.0436
5 0.4 0.6 0.004 0.0435 !!!!!!!!
6 0.5 0.5 0.004 0.0444
7 0.6 0.4 0.004 0.046
8 0.7 0.3 0.004 0.049
9 0.8 0.2 0.004 0.052
10 0.9 0.1 0.004 0.056
11 1 0 0.004 0.061
Figure 24: Portfolio (Sainsbury-Gold)
WeightWeighted
average rate ofreturn
Standarddeviation of
returns
Tick the portfoliowith the lowest
risk
Covariance-0.0005Correlation-0.213Portfolio Sainsbury Gold
1 0 1 0.017 0.043
2 0.1 0.9 0.016 0.037
3 0.2 0.8 0.015 0.034
4 0.3 0.7 0.013 0.0314
5 0.4 0.6 0.012 0.0313 !!!!!!!
6 0.5 0.5 0.011 0.033
7 0.6 0.4 0.009 0.037
8 0.7 0.3 0.008 0.042
9 0.8 0.2 0.007 0.047
10 0.9 0.1 0.005 0.054
11 1 0 0.004 0.061
Figure 25: Portfolio (BAT-GSK)
Weight
Weighted averagerate of return
Standard deviationof returns
Tick the portfoliowith the lowestrisk
Covariance
0.0007Correlation0.301Portfolio BAT GSK
1 0 1 0.003 0.049
2 0.1 0.9 0.005 0.046
3 0.2 0.8 0.006 0.043
4 0.3 0.7 0.007 0.041
5 0.4 0.6 0.008 0.039
6 0.5 0.5 0.010 0.0381
7 0.6 0.4 0.011 0.0379 !!!!!!!!
8 0.7 0.3 0.012 0.039
9 0.8 0.2 0.013 0.040
10 0.9 0.1 0.015 0.04211 1 0 0.016 0.045
8/3/2019 Investment management report (BAT, Sainsbury's, Gold, FTSE100, GSK, Portfolio, Report, Variance )
http://slidepdf.com/reader/full/investment-management-report-bat-sainsburys-gold-ftse100-gsk-portfolio 13/19
13
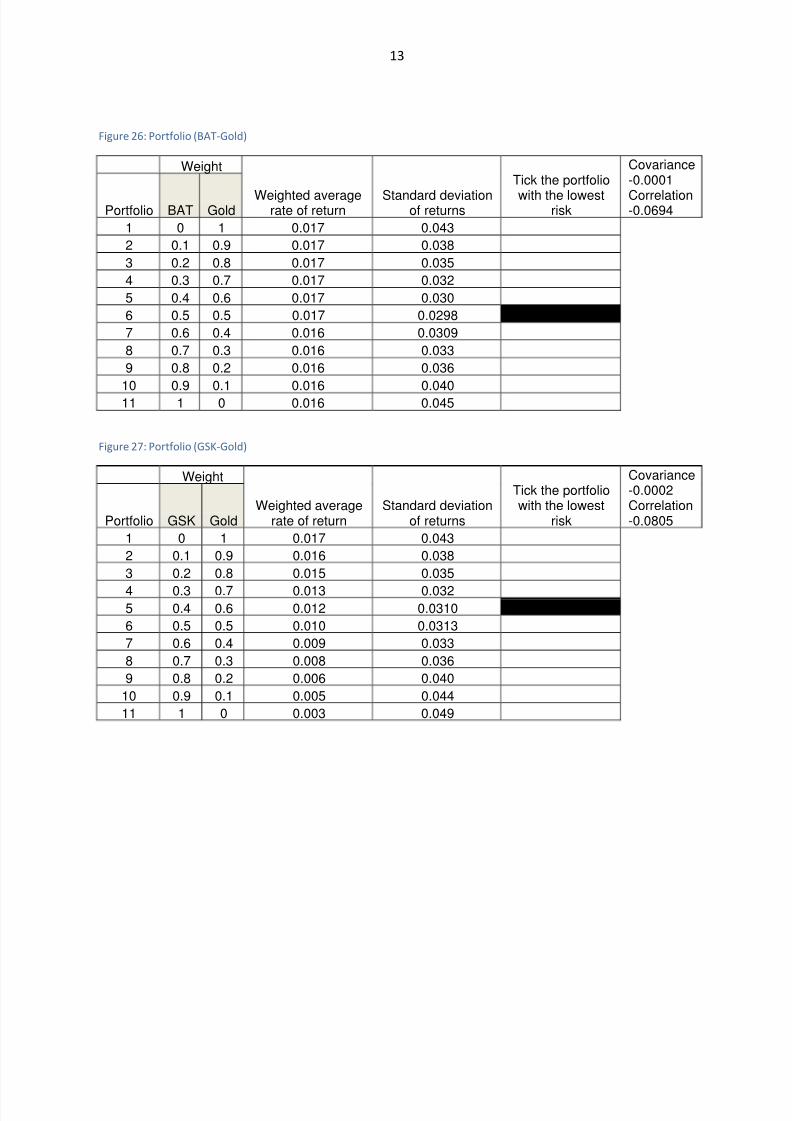
Figure 26: Portfolio (BAT-Gold)
Weight
Weighted averagerate of return
Standard deviationof returns
Tick the portfolio
with the lowestrisk
Covariance-0.0001
Correlation-0.0694Portfolio BAT Gold
1 0 1 0.017 0.043
2 0.1 0.9 0.017 0.038
3 0.2 0.8 0.017 0.035
4 0.3 0.7 0.017 0.032
5 0.4 0.6 0.017 0.030
6 0.5 0.5 0.017 0.0298 !!!!!!!
7 0.6 0.4 0.016 0.0309
8 0.7 0.3 0.016 0.033
9 0.8 0.2 0.016 0.036
10 0.9 0.1 0.016 0.04011 1 0 0.016 0.045
Figure 27: Portfolio (GSK-Gold)
Weight
Weighted averagerate of return
Standard deviationof returns
Tick the portfoliowith the lowest
risk
Covariance-0.0002Correlation-0.0805Portfolio GSK Gold
1 0 1 0.017 0.043
2 0.1 0.9 0.016 0.038
3 0.2 0.8 0.015 0.035
4 0.3 0.7 0.013 0.0325 0.4 0.6 0.012 0.0310 !!!!!!
6 0.5 0.5 0.010 0.0313
7 0.6 0.4 0.009 0.033
8 0.7 0.3 0.008 0.036
9 0.8 0.2 0.006 0.040
10 0.9 0.1 0.005 0.044
11 1 0 0.003 0.049
8/3/2019 Investment management report (BAT, Sainsbury's, Gold, FTSE100, GSK, Portfolio, Report, Variance )
http://slidepdf.com/reader/full/investment-management-report-bat-sainsburys-gold-ftse100-gsk-portfolio 14/19
14
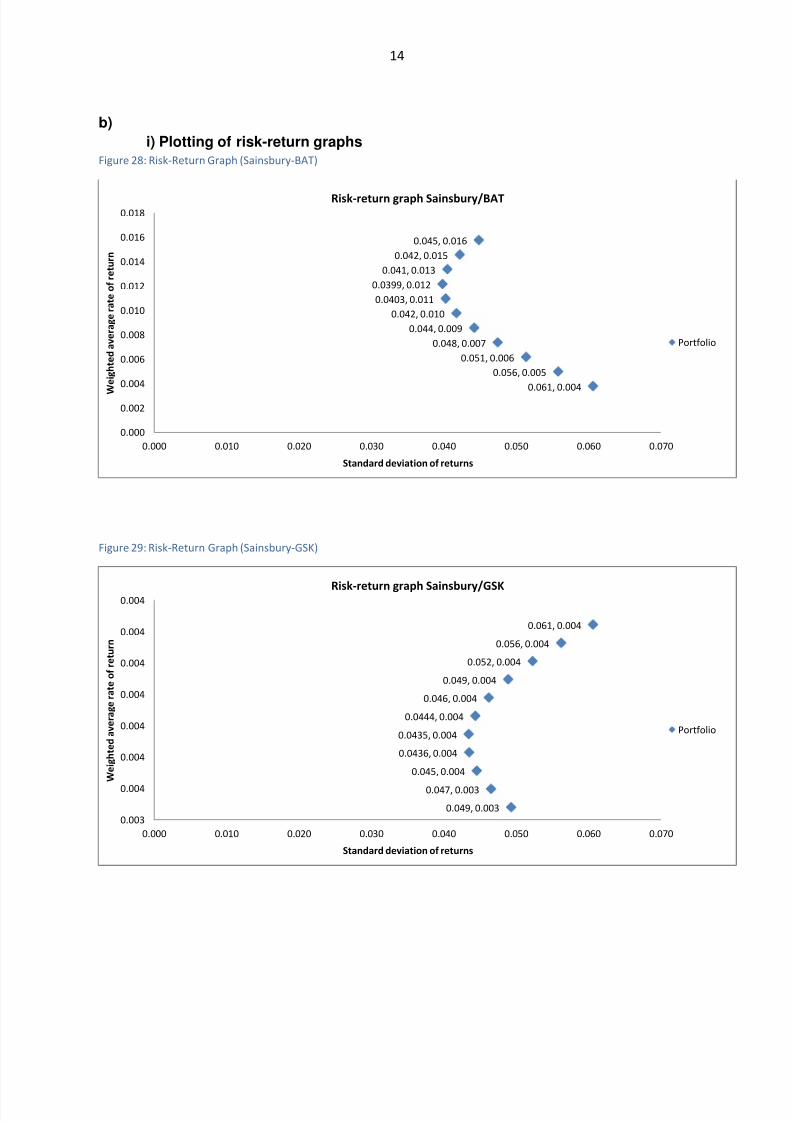
b)
i) Plotting of risk-return graphsFigure 28: Risk-Return Graph (Sainsbury-BAT)
Figure 29: Risk-Return Graph (Sainsbury-GSK)
0.045, 0.016
0.042, 0.015
0.041, 0.013
0.0399, 0.012
0.0403, 0.011
0.042, 0.010
0.044, 0.009
0.048, 0.007
0.051, 0.006
0.056, 0.005
0.061, 0.004
0.000
0.002
0.004
0.006
0.008
0.010
0.012
0.014
0.016
0.018
0.000 0.010 0.020 0.030 0.040 0.050 0.060 0.070
W
e i g h t e d a v e r a g e r a t e o f r e t u r n
Standard deviation of returns
Risk-return graph Sainsbury/BAT
Portfolio
0.049, 0.003
0.047, 0.003
0.045, 0.004
0.0436, 0.004
0.0435, 0.004
0.0444, 0.004
0.046, 0.004
0.049, 0.004
0.052, 0.004
0.056, 0.004
0.061, 0.004
0.003
0.004
0.004
0.004
0.004
0.004
0.004
0.004
0.000 0.010 0.020 0.030 0.040 0.050 0.060 0.070
W e i g h t e d a v e r a g e r a t e o f r e t u r n
Standard deviation of returns
Risk-return graph Sainsbury/GSK
Portfolio
8/3/2019 Investment management report (BAT, Sainsbury's, Gold, FTSE100, GSK, Portfolio, Report, Variance )
http://slidepdf.com/reader/full/investment-management-report-bat-sainsburys-gold-ftse100-gsk-portfolio 15/19
15
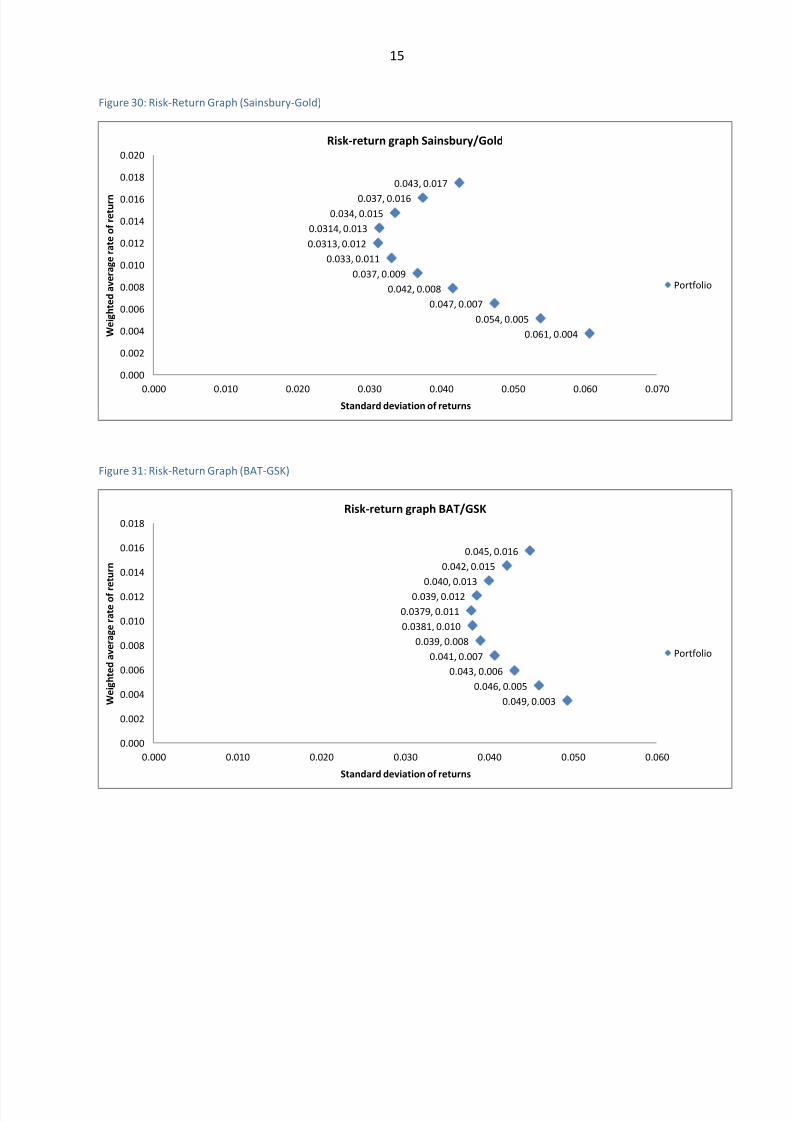
Figure 30: Risk-Return Graph (Sainsbury-Gold)
Figure 31: Risk-Return Graph (BAT-GSK)
0.043, 0.017
0.037, 0.016
0.034, 0.015
0.0314, 0.013
0.0313, 0.012
0.033, 0.011
0.037, 0.009
0.042, 0.008
0.047, 0.007
0.054, 0.005
0.061, 0.004
0.000
0.002
0.004
0.006
0.008
0.010
0.012
0.014
0.016
0.018
0.020
0.000 0.010 0.020 0.030 0.040 0.050 0.060 0.070
W e i g h t e d a v e r a g e r a t e o f r e t u r n
Standard deviation of returns
Risk-return graph Sainsbury/Gold
Portfolio
0.049, 0.003
0.046, 0.005
0.043, 0.006
0.041, 0.007
0.039, 0.008
0.0381, 0.010
0.0379, 0.011
0.039, 0.012
0.040, 0.013
0.042, 0.015
0.045, 0.016
0.000
0.002
0.004
0.006
0.008
0.010
0.012
0.014
0.016
0.018
0.000 0.010 0.020 0.030 0.040 0.050 0.060
W e i g h t e d a v e r a g e r a t e o f r e t u r n
Standard deviation of returns
Risk-return graph BAT/GSK
Portfolio
8/3/2019 Investment management report (BAT, Sainsbury's, Gold, FTSE100, GSK, Portfolio, Report, Variance )
http://slidepdf.com/reader/full/investment-management-report-bat-sainsburys-gold-ftse100-gsk-portfolio 16/19
16
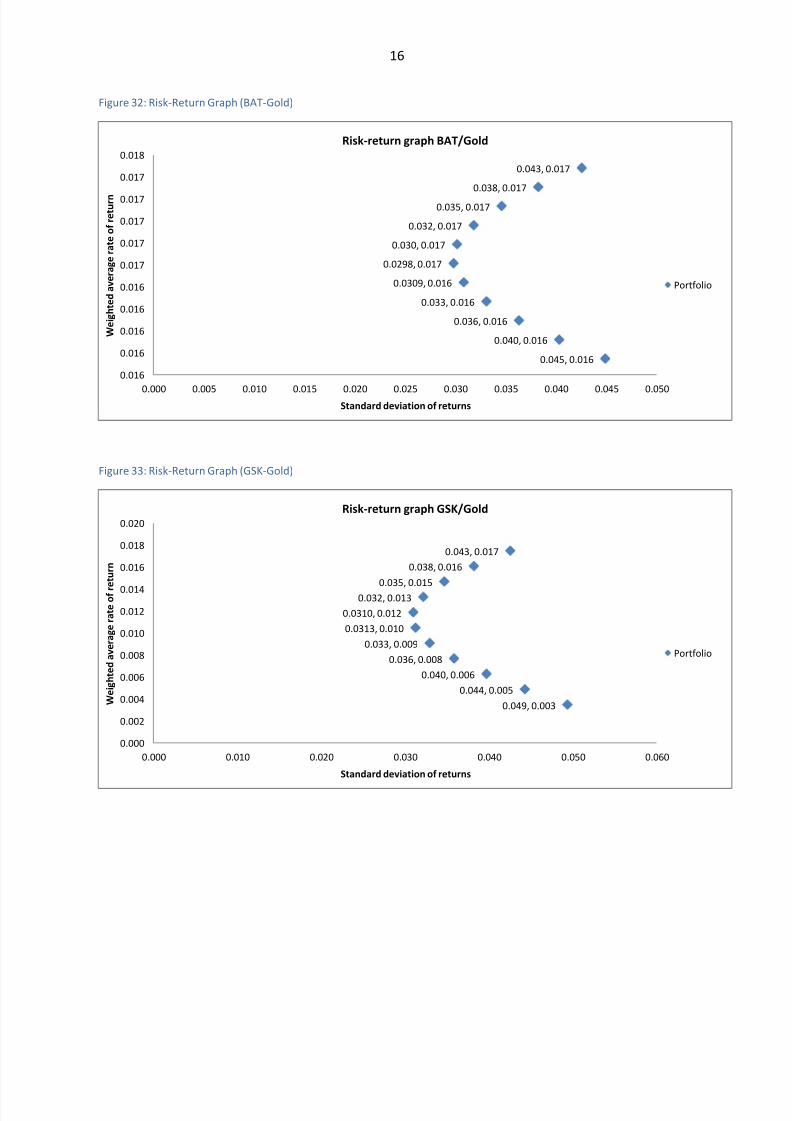
Figure 32: Risk-Return Graph (BAT-Gold)
Figure 33: Risk-Return Graph (GSK-Gold)
0.043, 0.017
0.038, 0.017
0.035, 0.017
0.032, 0.017
0.030, 0.017
0.0298, 0.017
0.0309, 0.016
0.033, 0.016
0.036, 0.016
0.040, 0.016
0.045, 0.016
0.016
0.016
0.016
0.016
0.016
0.017
0.017
0.017
0.017
0.017
0.018
0.000 0.005 0.010 0.015 0.020 0.025 0.030 0.035 0.040 0.045 0.050
W e i g h t e d a v e r a g e r a t e o f r e t u r n
Standard deviation of returns
Risk-return graph BAT/Gold
Portfolio
0.043, 0.017
0.038, 0.016
0.035, 0.015
0.032, 0.013
0.0310, 0.012
0.0313, 0.010
0.033, 0.009
0.036, 0.008
0.040, 0.006
0.044, 0.005
0.049, 0.003
0.000
0.002
0.004
0.006
0.008
0.010
0.012
0.014
0.016
0.018
0.020
0.000 0.010 0.020 0.030 0.040 0.050 0.060
W e i g h t e d a v e r a g e r a t e o f r e t u r n
Standard deviation of returns
Risk-return graph GSK/Gold
Portfolio
8/3/2019 Investment management report (BAT, Sainsbury's, Gold, FTSE100, GSK, Portfolio, Report, Variance )
http://slidepdf.com/reader/full/investment-management-report-bat-sainsburys-gold-ftse100-gsk-portfolio 17/19
17
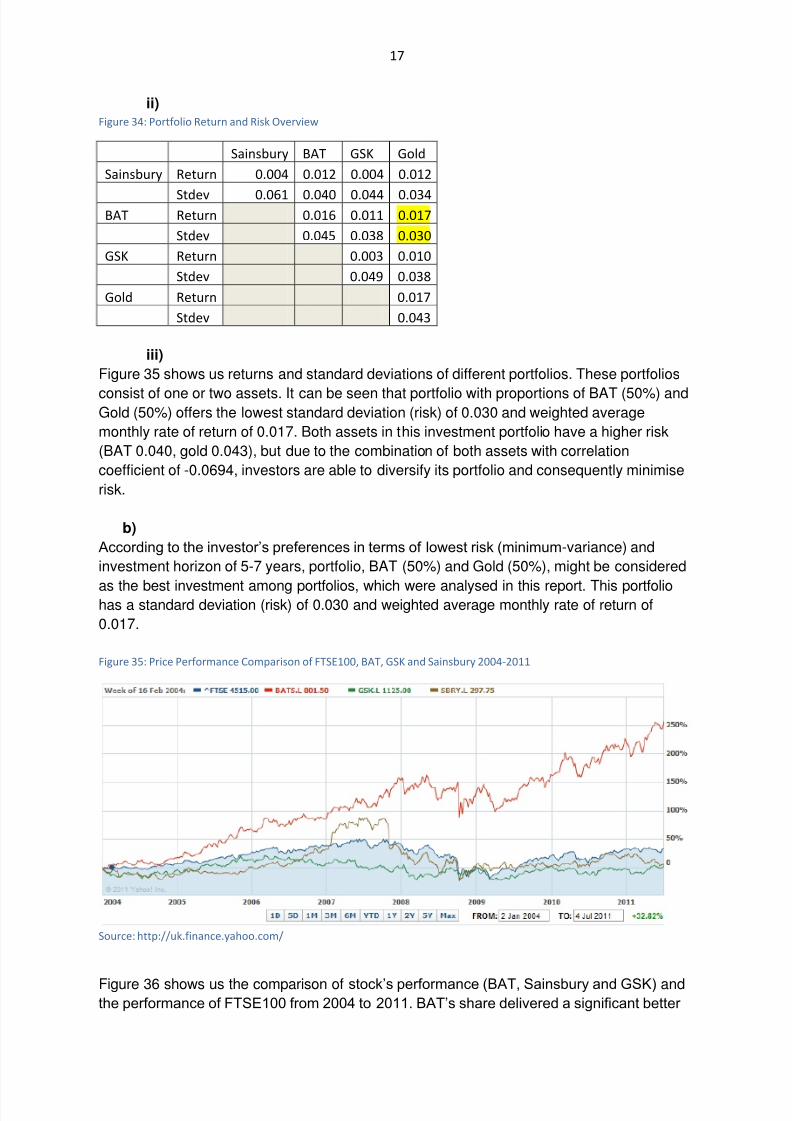
ii)Figure 34: Portfolio Return and Risk Overview
Sainsbury BAT GSK Gold
Sainsbury Return 0.004 0.012 0.004 0.012
Stdev 0.061 0.040 0.044 0.034BAT Return 0.016 0.011 0.017
Stdev 0.045 0.038 0.030
GSK Return 0.003 0.010
Stdev 0.049 0.038
Gold Return 0.017
Stdev 0.043
iii)
Figure 35 shows us returns and standard deviations of different portfolios. These portfolios
consist of one or two assets. It can be seen that portfolio with proportions of BAT (50%) andGold (50%) offers the lowest standard deviation (risk) of 0.030 and weighted average
monthly rate of return of 0.017. Both assets in this investment portfolio have a higher risk
(BAT 0.040, gold 0.043), but due to the combination of both assets with correlation
coefficient of -0.0694, investors are able to diversify its portfolio and consequently minimise
risk.
b)
According to the investor’s preferences in terms of lowest risk (minimum-variance) and
investment horizon of 5-7 years, portfolio, BAT (50%) and Gold (50%), might be considered
as the best investment among portfolios, which were analysed in this report. This portfoliohas a standard deviation (risk) of 0.030 and weighted average monthly rate of return of
0.017.
Figure 35: Price Performance Comparison of FTSE100, BAT, GSK and Sainsbury 2004-2011
Source: http://uk.finance.yahoo.com/
Figure 36 shows us the comparison of stock’s performance (BAT, Sainsbury and GSK) andthe performance of FTSE100 from 2004 to 2011. BAT’s share delivered a significant better
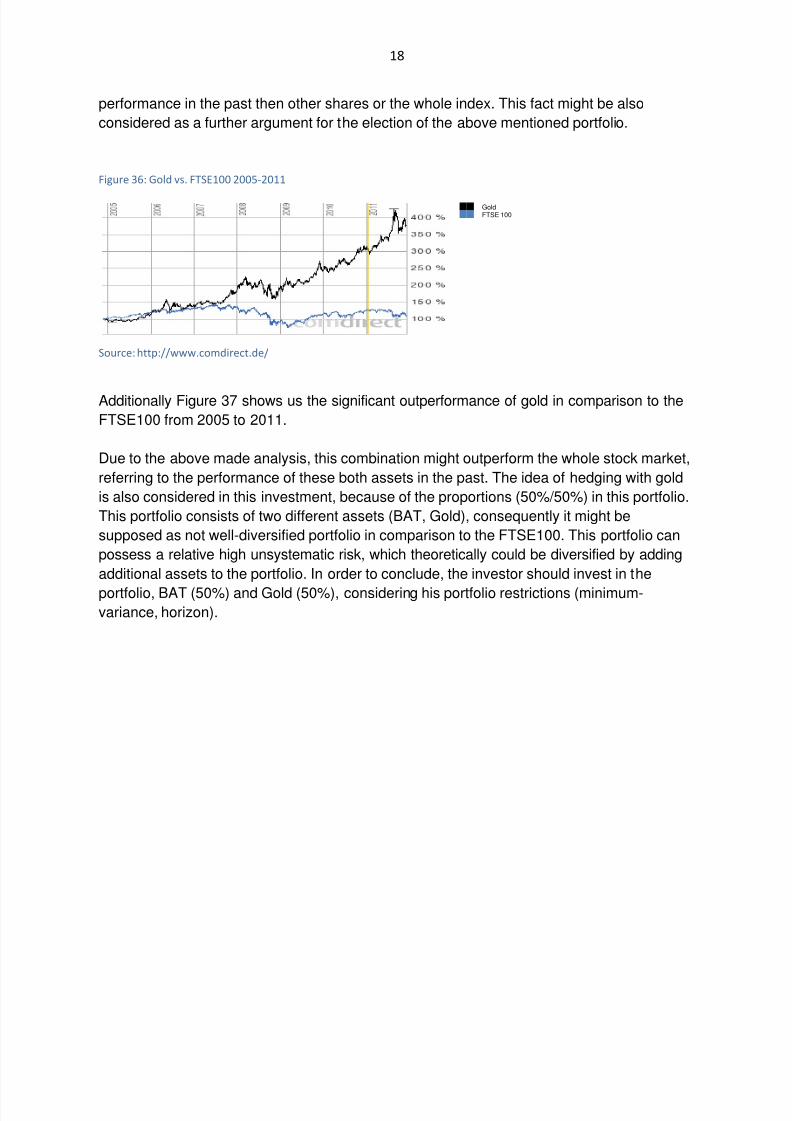
8/3/2019 Investment management report (BAT, Sainsbury's, Gold, FTSE100, GSK, Portfolio, Report, Variance )
http://slidepdf.com/reader/full/investment-management-report-bat-sainsburys-gold-ftse100-gsk-portfolio 18/19
18
performance in the past then other shares or the whole index. This fact might be also
considered as a further argument for the election of the above mentioned portfolio.
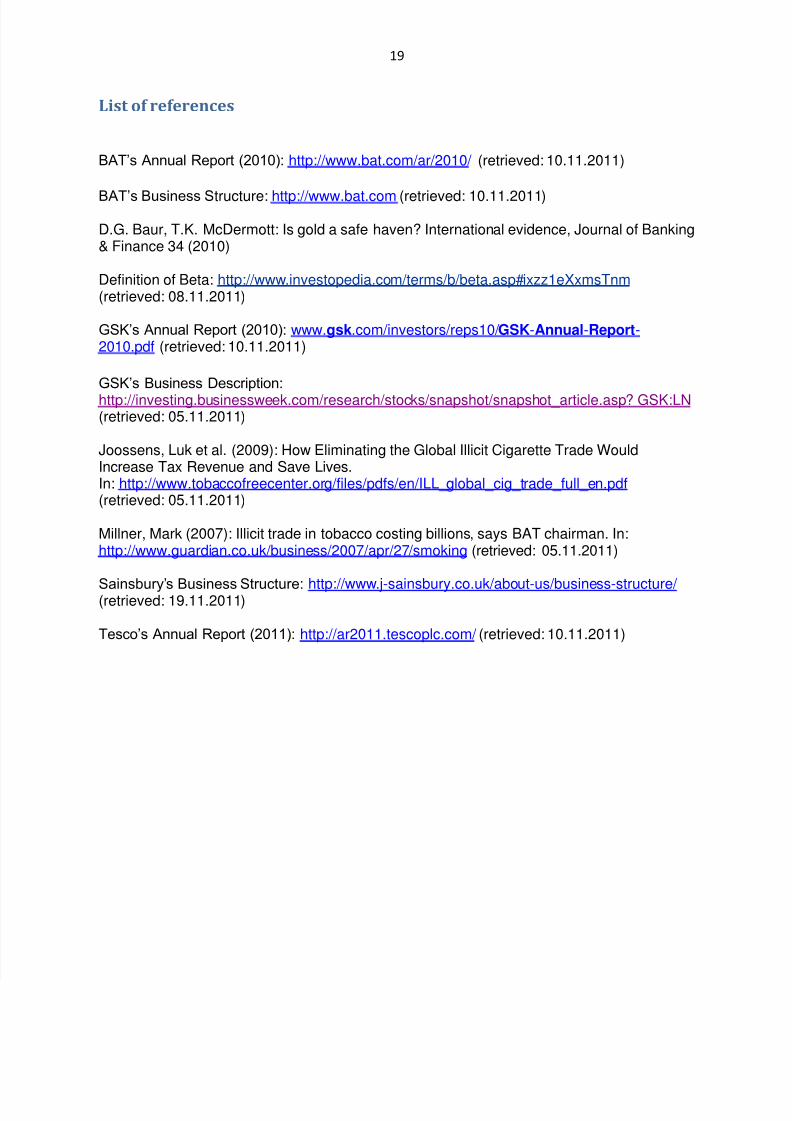
Figure 36: Gold vs. FTSE100 2005-2011
Source: http://www.comdirect.de/
Additionally Figure 37 shows us the significant outperformance of gold in comparison to the
FTSE100 from 2005 to 2011.
Due to the above made analysis, this combination might outperform the whole stock market,
referring to the performance of these both assets in the past. The idea of hedging with gold
is also considered in this investment, because of the proportions (50%/50%) in this portfolio.
This portfolio consists of two different assets (BAT, Gold), consequently it might be
supposed as not well-diversified portfolio in comparison to the FTSE100. This portfolio can
possess a relative high unsystematic risk, which theoretically could be diversified by adding
additional assets to the portfolio. In order to conclude, the investor should invest in the
portfolio, BAT (50%) and Gold (50%), considering his portfolio restrictions (minimum-variance, horizon).
GoldFTSE 100
8/3/2019 Investment management report (BAT, Sainsbury's, Gold, FTSE100, GSK, Portfolio, Report, Variance )
http://slidepdf.com/reader/full/investment-management-report-bat-sainsburys-gold-ftse100-gsk-portfolio 19/19
19
List of references
BAT’s Annual Report (2010): http://www.bat.com/ar/2010/ (retrieved: 10.11.2011)
BAT’s Business Structure: http://www.bat.com (retrieved: 10.11.2011)
D.G. Baur, T.K. McDermott: Is gold a safe haven? International evidence, Journal of Banking& Finance 34 (2010)
Definition of Beta: http://www.investopedia.com/terms/b/beta.asp#ixzz1eXxmsTnm(retrieved: 08.11.2011)
GSK’s Annual Report (2010): www.gsk.com/investors/reps10/ GSK-Annual-Report-2010.pdf (retrieved: 10.11.2011)
GSK’s Business Description:http://investing.businessweek.com/research/stocks/snapshot/snapshot_article.asp? GSK:LN (retrieved: 05.11.2011)
Joossens, Luk et al. (2009): How Eliminating the Global Illicit Cigarette Trade WouldIncrease Tax Revenue and Save Lives.In: http://www.tobaccofreecenter.org/files/pdfs/en/ILL_global_cig_trade_full_en.pdf (retrieved: 05.11.2011)
Millner, Mark (2007): Illicit trade in tobacco costing billions, says BAT chairman. In:http://www.guardian.co.uk/business/2007/apr/27/smoking (retrieved: 05.11.2011)
Sainsbury’s Business Structure: http://www.j-sainsbury.co.uk/about-us/business-structure/ (retrieved: 19.11.2011)
Tesco’s Annual Report (2011): http://ar2011.tescoplc.com/ (retrieved: 10.11.2011)