Investment Management Outsourcing: The State of the … · Primary Outsourcing Decision Drivers ......
24
October 2012 Investment Management Outsourcing: The State of the Art in 2012
Transcript of Investment Management Outsourcing: The State of the … · Primary Outsourcing Decision Drivers ......
October 2012
Investment Management Outsourcing: The State of the Art in 2012
Executive Summary . . . . . . . . . . . . . . . . . . . . . . . . . . . . .1About the Survey . . . . . . . . . . . . . . . . . . . . . . . . . . . . . . . . . 1A Summary of the Findings . . . . . . . . . . . . . . . . . . . . . . . . . 2
Insights Into the Outsourcing Advisory Practice . . . . . . . . . . . . . . . . . . . . . . . . . . . . . . .3
Scope of Outsourcing . . . . . . . . . . . . . . . . . . . . . . . . . . . . . 3Customization Enabled . . . . . . . . . . . . . . . . . . . . . . . . . . . . 4What Percentage of Client Assets? . . . . . . . . . . . . . . . . . . . 5Which Client Assets? . . . . . . . . . . . . . . . . . . . . . . . . . . . . . . 5Outsourcing Can Impact Fees Charged . . . . . . . . . . . . . . . 6
The Outsourcing Experience . . . . . . . . . . . . . . . . . . . . .7Primary Outsourcing Decision Drivers . . . . . . . . . . . . . . . . 7
The Impact of Outsourcing . . . . . . . . . . . . . . . . . . . . . .8Positive and Negative Impacts . . . . . . . . . . . . . . . . . . . . . . 9High Satisfaction Across the Board . . . . . . . . . . . . . . . . . . 10Top 10 Outsourcing Partners Named . . . . . . . . . . . . . . . . 10Reliance on Multiple Partners . . . . . . . . . . . . . . . . . . . . . . 11Expectations vs . Experience . . . . . . . . . . . . . . . . . . . . . . . 12Experience Mostly Aligns with Expectations . . . . . . . . . . 13
Advisors Who Don’t Outsource . . . . . . . . . . . . . . . . .14
What Would Have to Change . . . . . . . . . . . . . . . . . . . . . 16Where Outside Help is Relied Upon and Wanted . . . . . . 17Top Three Areas Advisors Say They Could Use Help . . . . 17 Time Spent Weekly on Investment Management-Related Tasks . . . . . . . . . . . . . . . . . . . . . . . 18
Survey . . . . . . . . . . . . . . . . . . . . . . . . . . . . . . . . . . . . . . . . .19
Thank You
Northern Trust thanks Brinker Capital and Hanlon Investment Management Inc . for their partnership in this project . A special thanks to all advisors whose thoughtful survey participation made this report possible .
Contents
1
Executive SummaryIn the summer of 2012, Northern Trust revisited a 2010 research initiative and again surveyed financial advisors about their use of investment management outsourcing . The survey enabled us to tap the experience and insights of two groups:■ Advisors whose firms are outsourcing investment management These advisors say that outsourcing has positively impacted the productivity and efficient growth of their practices . With the possible exception of disappointing investment performance, outsourcing advisors are categorically satisfied with their solution and what it achieves for their firms .
■ Advisors whose firms are not outsourcing investment management The majority of these advisors contend that their in-house management of client assets is central to their firms’ value proposition . The 2012 survey found a higher percentage of advisors maintaining this view—and across firm type, firm size and compensation model segments—than in 2010 .
As a consequence, this group reports spending a significant amount of time on related activities . Manager research, portfolio construction and monitoring tasks, in particular, consume even more time of advisors from larger firms than was reported two years ago .
In the strongest response to any survey question, many non-outsourcing advisors acknowledge that they could use outside help in specific investment management tasks (e .g ., accessing broader options, portfolio monitoring, performance reporting) .
The following pages present additional detail about what’s being outsourced, the impact of outsourcing on a practice, and gaps between outsourcing expectations and experience . Additionally, survey data sheds further light on the perspectives of advisors who don’t outsource .
Northern Trust commissioned this research to better understand advisors’ thoughts about outsourcing and where additional help may be needed . Asset Management at Northern Trust provides expertise offered through an extensive range of investment strategies and structures .
I n ve s tmen t Managemen t Ou t sou rc i ng : T he S ta t e o f t he A r t i n 20122
ABOUT THE SURVEY Over a three-week period in June and July 2012, multiple emails were sent to subscribers of AdvisorPerspectives .com with the invitation to complete an extensive survey . A total of 510 advisors responded . Answers to the survey’s first question split respondents into two groups: those who outsource and those who don’t .
Analysis of the research included consideration of the advisors’ firm type (independent financial planning/investment advisory, RIA or regional broker-dealer), firm size (our smaller firms label applies to those with $150 million in assets or less, larger firms have $150 million in assets or more) and compensation model (asset-based or a combination of commissions and fees) .
Financial advisors used the survey’s comment fields to add additional considerations or elaborate on their responses . Their verbatim comments appear throughout the report .
One-half of the outsourcing respondents outsource all investment management activities .
Six out of 10 respondents outsource more than half of their clients’ assets—37% outsource 75%-100% of clients’ assets .
While more than half (57%) of those surveyed say outsourcing has had no effect on fees charged to clients, almost one-third (28%) say they’ve increased fees and 15% say fees have decreased .
The 2012 top outsourcing drivers: Access to asset allocation models, access to managers firms could not access on their own and the potential to generate alpha through best investment ideas .
When advisors are asked for the single factor that most positively impacted the firm’s outsourcing experience, time freed up to spend on the business is valued even more highly than it was two years ago .
Ninety-four percent of advisors say they’re satisfied with their outsourcing solution . One-third says they’re “very satisfied .” This is nearly identical to the results reported in 2010 . However, advisors in 2012 are more forthcoming about the negatives—investment performance, notably .
As in 2010, the leading reason provided (by 54% of all advisors vs . 43% of respondents in 2010) for not outsourcing: Investment management is central to their firms’ value proposition .
While 67% of non-outsourcing advisors in 2010 said their position toward outsourcing won’t change, only 34% selected that response in 2012 .
Advisors from larger firms that don’t outsource are increasingly burdened with investment management-related tasks . More than six out of 10 advisors from larger firms report spending more than five hours a week—for a total of 15 hours/week or the equivalent of 1 .5 workweeks a month—on three key investment management tasks .
A Summary of the Findings
3
Insights Into the Outsourcing Advisory Practice
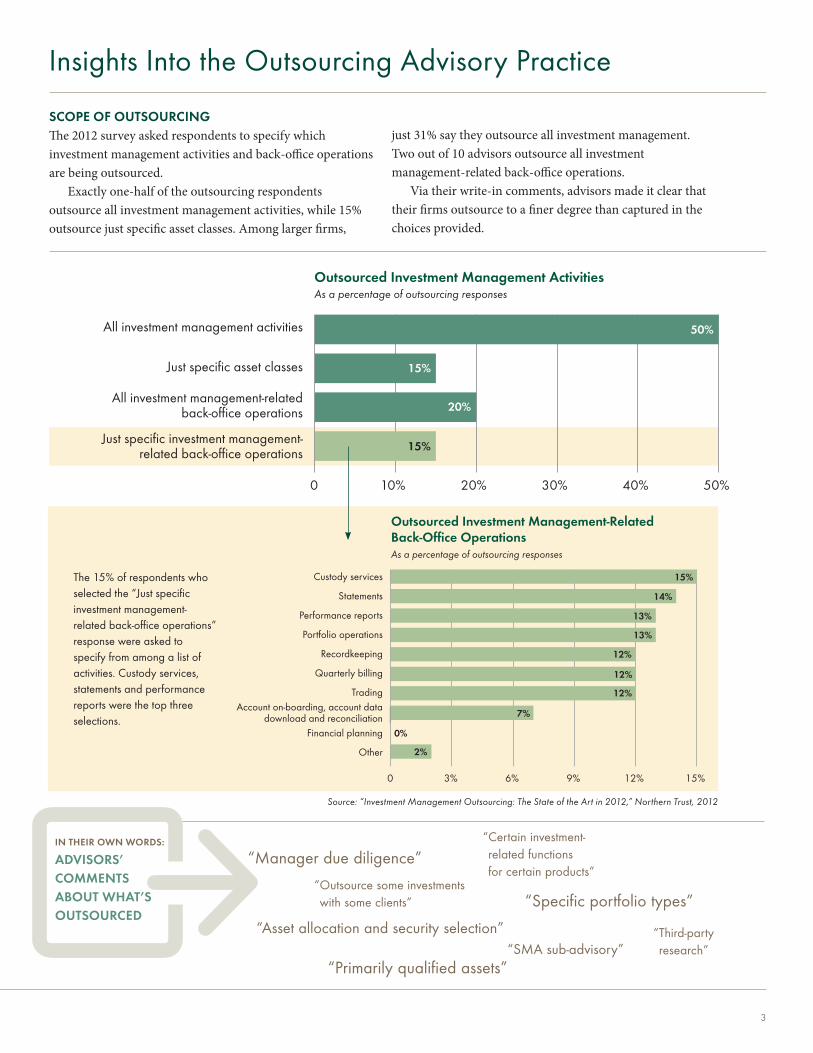
SCOPE OF OUTSOURCING The 2012 survey asked respondents to specify which investment management activities and back-office operations are being outsourced .
Exactly one-half of the outsourcing respondents outsource all investment management activities, while 15% outsource just specific asset classes . Among larger firms,
just 31% say they outsource all investment management . Two out of 10 advisors outsource all investment management-related back-office operations .
Via their write-in comments, advisors made it clear that their firms outsource to a finer degree than captured in the choices provided .
All investment management activities
Just specific asset classes
All investment management-relatedback-office operations
Just specific investment management-relatedback-office operations
Custody services
Statements
Performance reports
Portfolio operations
Record-keeping
Quarterly billing
TradingAccount on-boarding, account data
download and reconciliationFinancial planning
Other
Outsourced Investment Management ActivitiesAs a percentage of outsourcing responses
Outsourced Investment Management-Related Back-Office Operations
0 3% 6% 9% 12% 15%
0%
50%
20%
15%
15%
0 10% 20% 30% 40% 50%
2%
As a percentage of outsourcing responses
15%
14%
13%
13%
12%
12%
12%
7%
All investment management activities
Just specific asset classes
All investment management-relatedback-office operations
Just specific investment management-relatedback-office operations
Outsourced Investment Management ActivitiesAs a percentage of outsourcing responses
50%
20%
15%
15%
0 10% 20% 30% 40% 50%
The 15% of respondents who selected the “Just specific investment management-related back-office operations” response were asked to specify from among a list of activities . Custody services, statements and performance reports were the top three selections .
Source: “Investment Management Outsourcing: The State of the Art in 2012,” Northern Trust, 2012
IN THEIR OWN WORDS:
ADVISORS’ COMMENTS ABOUT WHAT’S OUTSOURCED
“ Outsource some investments with some clients”
“Asset allocation and security selection”
“ Certain investment-related functions for certain products”
“SMA sub-advisory”
“Manager due diligence”
“Specific portfolio types”
“Primarily qualified assets”
“ Third-party research”
All investment management activities
Just specific asset classes
All investment management-relatedback-office operations
Just specific investment management-relatedback-office operations
Custody services
Statements
Performance reports
Portfolio operations
Record-keeping
Quarterly billing
TradingAccount on-boarding, account data
download and reconciliationFinancial planning
Other
Outsourced Investment Management ActivitiesAs a percentage of outsourcing responses
Outsourced Investment Management-Related Back-Office Operations
0 3% 6% 9% 12% 15%
0%
50%
20%
15%
15%
0 10% 20% 30% 40% 50%
2%
As a percentage of outsourcing responses
15%
14%
13%
13%
12%
12%
12%
7%
All investment management activities
Just specific asset classes
All investment management-relatedback-office operations
Just specific investment management-relatedback-office operations
Outsourced Investment Management ActivitiesAs a percentage of outsourcing responses
50%
20%
15%
15%
0 10% 20% 30% 40% 50%
Outsourced Investment Management-Related Back-Office OperationsAs a percentage of outsourcing responses
Custody services
Statements
Performance reports
Portfolio operations
Recordkeeping
Quarterly billing
TradingAccount on-boarding, account data
download and reconciliationFinancial planning
Other
All investment management activities
Just specific asset classes
All investment management-related back-office operations
Just specific investment management-related back-office operations
Outsourced Investment Management ActivitiesAs a percentage of outsourcing responses
I n ve s tmen t Managemen t Ou t sou rc i ng : T he S ta t e o f t he A r t i n 20124
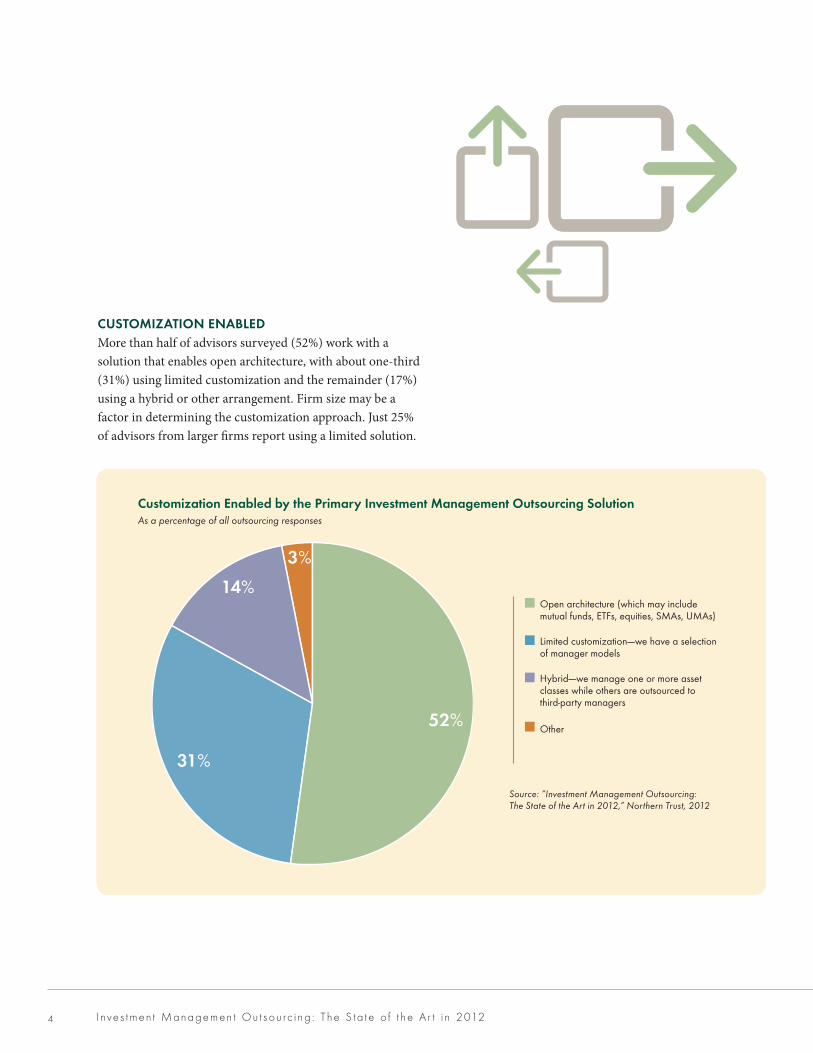
CUSTOMIZATION ENABLEDMore than half of advisors surveyed (52%) work with a solution that enables open architecture, with about one-third (31%) using limited customization and the remainder (17%) using a hybrid or other arrangement . Firm size may be a factor in determining the customization approach . Just 25% of advisors from larger firms report using a limited solution .
Source: “Investment Management Outsourcing: The State of the Art in 2012,” Northern Trust, 2012
Less than 10%
11%-24%
25%-50%
51%-74%
75%-100%18%
25%
37%12%
8%
Percentage of all outsourcing responsesThe Percentage of Clients‘ Assets Outsourced
Less than 10%
11%-24%
25%-50%
51%-74%
75%-100%
16%
24%
46%
6%8%
Outsourcing of Clients‘ Assets By Firm Size — Smaller Firms(AUM>$150M)As a percentage of outsourcing responses
20%
20%
10%
25%
25%
Open architecture (which may include mutual funds, ETFs, equities, SMAs, UMAs)
Limited customization--we have a selection of manager models
Hybrid--we manage one or more asset classes while others are outsourced to third-party managers
Other
52%
31%
14%
3%
Customization Enabled By The Primary Investment Management Outsourcing SolutionAs a percentage of all outsourcing responses
Less than 10%
11%-24%
25%-50%
51%-74%
75%-100%
Outsourcing of Clients‘ Assets By Firm Size — Larger Firms(AUM<$150M)As a percentage of outsourcing responses
62%
70%
50%
Customization Enabled by the Primary Investment Management Outsourcing SolutionAs a percentage of all outsourcing responses
Less than 10%
11%-24%
25%-50%
51%-74%
75%-100%18%
25%
37%12%
8%
Percentage of all outsourcing responsesThe Percentage of Clients‘ Assets Outsourced
Less than 10%
11%-24%
25%-50%
51%-74%
75%-100%
16%
24%
46%
6%8%
Outsourcing of Clients‘ Assets By Firm Size — Smaller Firms(AUM>$150M)As a percentage of outsourcing responses
20%
20%
10%
25%
25%
Open architecture (which may include mutual funds, ETFs, equities, SMAs, UMAs)
Limited customization--we have a selection of manager models
Hybrid--we manage one or more asset classes while others are outsourced to third-party managers
Other
52%
31%
14%
3%
Customization Enabled By The Primary Investment Management Outsourcing SolutionAs a percentage of all outsourcing responses
Less than 10%
11%-24%
25%-50%
51%-74%
75%-100%
Outsourcing of Clients‘ Assets By Firm Size — Larger Firms(AUM<$150M)As a percentage of outsourcing responses
62%
70%
50%
Open architecture (which may include mutual funds, ETFs, equities, SMAs, UMAs)
Limited customization—-we have a selection of manager models
Hybrid—-we manage one or more asset classes while others are outsourced to third-party managers
Other
5
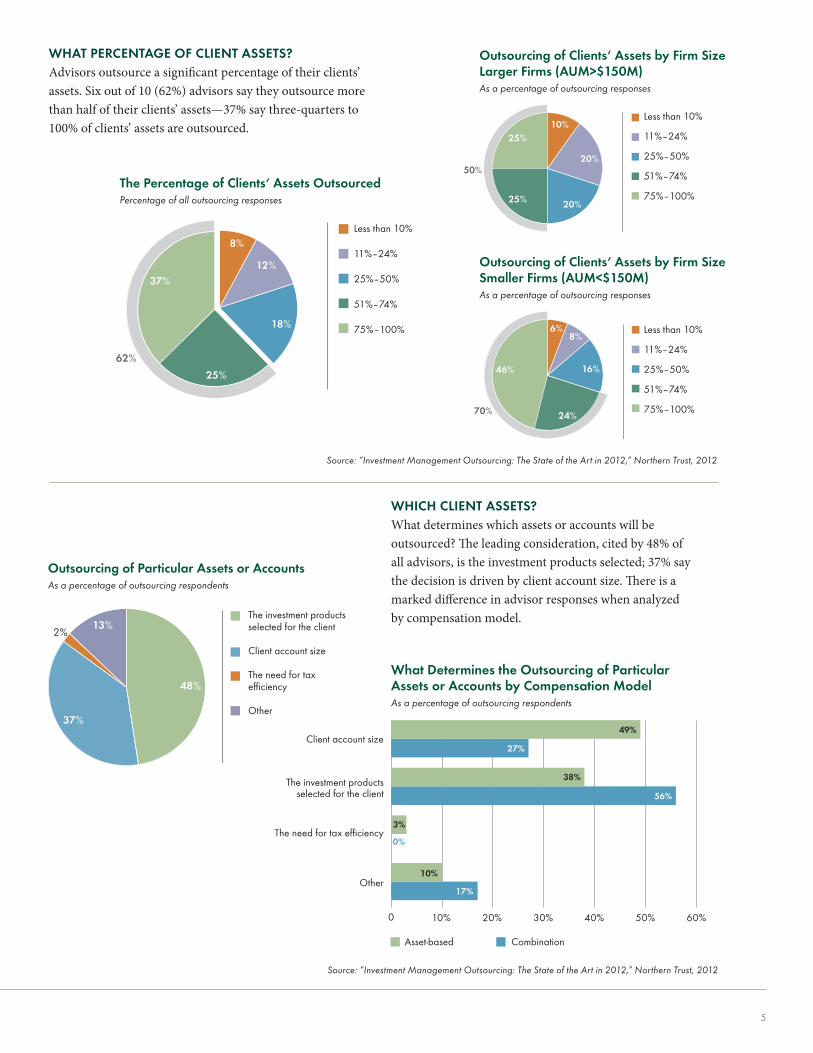
WHAT PERCENTAGE OF CLIENT ASSETS?Advisors outsource a significant percentage of their clients’ assets . Six out of 10 (62%) advisors say they outsource more than half of their clients’ assets—37% say three-quarters to 100% of clients’ assets are outsourced .
Source: “Investment Management Outsourcing: The State of the Art in 2012,” Northern Trust, 2012
The investment products selected for the client
Client account size
The need for tax efficiency
Other
28%Fees have increased
15%Fees have decreased
57%No change
in fees
13%2%
Outsourcing of Particular Assets or AccountsAs a percentage of outsourcing respondents
What Determines the Outsourcing of Particular Assets or Accounts By Compensation ModelAs a percentage of outsourcing respondents
0 10% 20% 30% 40% 50% 60%
Asset-based Combination
Client account size
The investment products selectedfor the client
The need for tax efficiency
Other
49%
27%
38%
10%
17%
56%
3%
What Determines the Outsourcing of Particular Assets or Accounts By Compensation ModelAs a percentage of outsourcing respondents
0 10% 20% 30% 40% 50% 60%
Asset-based Combination
Client account size
The investment products selectedfor the client
The need for tax efficiency
Other
49%
27%
10%
17%
38%
56%
3%
48%
37%
0%
Outsourcing of Particular Assets or Accounts
Outsourcing’s Effect on Fees ChargedAs a percentage of outsourcing respondents
WHICH CLIENT ASSETS?What determines which assets or accounts will be outsourced? The leading consideration, cited by 48% of all advisors, is the investment products selected; 37% say the decision is driven by client account size . There is a marked difference in advisor responses when analyzed by compensation model .
Source: “Investment Management Outsourcing: The State of the Art in 2012,” Northern Trust, 2012
Less than 10%
11%-24%
25%-50%
51%-74%
75%-100%18%
25%
37%12%
8%
Percentage of all outsourcing responsesThe Percentage of Clients‘ Assets Outsourced
Less than 10%
11%-24%
25%-50%
51%-74%
75%-100%
16%
24%
46%
6%8%
Outsourcing of Clients‘ Assets By Firm Size — Smaller Firms(AUM>$150M)As a percentage of outsourcing responses
20%
20%
10%
25%
25%
Open architecture (which may include mutual funds, ETFs, equities, SMAs, UMAs)
Limited customization--we have a selection of manager models
Hybrid--we manage one or more asset classes while others are outsourced to third-party managers
Other
52%
31%
14%
3%
Customization Enabled By The Primary Investment Management Outsourcing SolutionAs a percentage of all outsourcing responses
Less than 10%
11%-24%
25%-50%
51%-74%
75%-100%
Outsourcing of Clients‘ Assets By Firm Size — Larger Firms(AUM<$150M)As a percentage of outsourcing responses
62%
70%
50%
The Percentage of Clients‘ Assets OutsourcedPercentage of all outsourcing responses
Less than 10%
11%–24%
25%–50%
51%–74%
75%–100%
Less than 10%
11%-24%
25%-50%
51%-74%
75%-100%18%
25%
37%12%
8%
Percentage of all outsourcing responsesThe Percentage of Clients‘ Assets Outsourced
Less than 10%
11%-24%
25%-50%
51%-74%
75%-100%
16%
24%
46%
6%8%
Outsourcing of Clients‘ Assets By Firm Size — Smaller Firms(AUM>$150M)As a percentage of outsourcing responses
20%
20%
10%
25%
25%
Open architecture (which may include mutual funds, ETFs, equities, SMAs, UMAs)
Limited customization--we have a selection of manager models
Hybrid--we manage one or more asset classes while others are outsourced to third-party managers
Other
52%
31%
14%
3%
Customization Enabled By The Primary Investment Management Outsourcing SolutionAs a percentage of all outsourcing responses
Less than 10%
11%-24%
25%-50%
51%-74%
75%-100%
Outsourcing of Clients‘ Assets By Firm Size — Larger Firms(AUM<$150M)As a percentage of outsourcing responses
62%
70%
50%
Less than 10%
11%–24%
25%–50%
51%–74%
75%–100%
Outsourcing of Clients‘ Assets by Firm Size Larger Firms (AUM>$150M)As a percentage of outsourcing responses
Less than 10%
11%-24%
25%-50%
51%-74%
75%-100%18%
25%
37%12%
8%
Percentage of all outsourcing responsesThe Percentage of Clients‘ Assets Outsourced
Less than 10%
11%-24%
25%-50%
51%-74%
75%-100%
16%
24%
46%
6%8%
Outsourcing of Clients‘ Assets By Firm Size — Smaller Firms(AUM>$150M)As a percentage of outsourcing responses
20%
20%
10%
25%
25%
Open architecture (which may include mutual funds, ETFs, equities, SMAs, UMAs)
Limited customization--we have a selection of manager models
Hybrid--we manage one or more asset classes while others are outsourced to third-party managers
Other
52%
31%
14%
3%
Customization Enabled By The Primary Investment Management Outsourcing SolutionAs a percentage of all outsourcing responses
Less than 10%
11%-24%
25%-50%
51%-74%
75%-100%
Outsourcing of Clients‘ Assets By Firm Size — Larger Firms(AUM<$150M)As a percentage of outsourcing responses
62%
70%
50%
Less than 10%
11%–24%
25%–50%
51%–74%
75%–100%
Outsourcing of Clients‘ Assets by Firm Size Smaller Firms (AUM<$150M)As a percentage of outsourcing responses
The investment products selected for the client
Client account size
The need for tax efficiency
Other
28%Fees have increased
15%Fees have decreased
57%No change
in fees
13%2%
Outsourcing of Particular Assets or AccountsAs a percentage of outsourcing respondents
What Determines the Outsourcing of Particular Assets or Accounts By Compensation ModelAs a percentage of outsourcing respondents
0 10% 20% 30% 40% 50% 60%
Asset-based Combination
Client account size
The investment products selectedfor the client
The need for tax efficiency
Other
49%
27%
38%
10%
17%
56%
3%
What Determines the Outsourcing of Particular Assets or Accounts By Compensation ModelAs a percentage of outsourcing respondents
0 10% 20% 30% 40% 50% 60%
Asset-based Combination
Client account size
The investment products selectedfor the client
The need for tax efficiency
Other
49%
27%
10%
17%
38%
56%
3%
48%
37%
0%
Outsourcing of Particular Assets or Accounts
Outsourcing’s Effect on Fees ChargedAs a percentage of outsourcing respondents
The investment products selected for the client
Client account size
The need for tax efficiency
Other
Outsourcing of Particular Assets or AccountsAs a percentage of outsourcing respondents
The investment products selected for the client
Client account size
The need for tax efficiency
Other
28%Fees have increased
15%Fees have decreased
57%No change
in fees
13%2%
Outsourcing of Particular Assets or AccountsAs a percentage of outsourcing respondents
What Determines the Outsourcing of Particular Assets or Accounts By Compensation ModelAs a percentage of outsourcing respondents
0 10% 20% 30% 40% 50% 60%
Asset-based Combination
Client account size
The investment products selectedfor the client
The need for tax efficiency
Other
49%
27%
38%
10%
17%
56%
3%
What Determines the Outsourcing of Particular Assets or Accounts By Compensation ModelAs a percentage of outsourcing respondents
0 10% 20% 30% 40% 50% 60%
Asset-based Combination
Client account size
The investment products selectedfor the client
The need for tax efficiency
Other
49%
27%
10%
17%
38%
56%
3%
48%
37%
0%
Outsourcing of Particular Assets or Accounts
Outsourcing’s Effect on Fees ChargedAs a percentage of outsourcing respondents
What Determines the Outsourcing of Particular Assets or Accounts by Compensation ModelAs a percentage of outsourcing respondents
Client account size
The investment products selected for the client
The need for tax efficiency
Other
Asset-based Combination
I n ve s tmen t Managemen t Ou t sou rc i ng : T he S ta t e o f t he A r t i n 20126
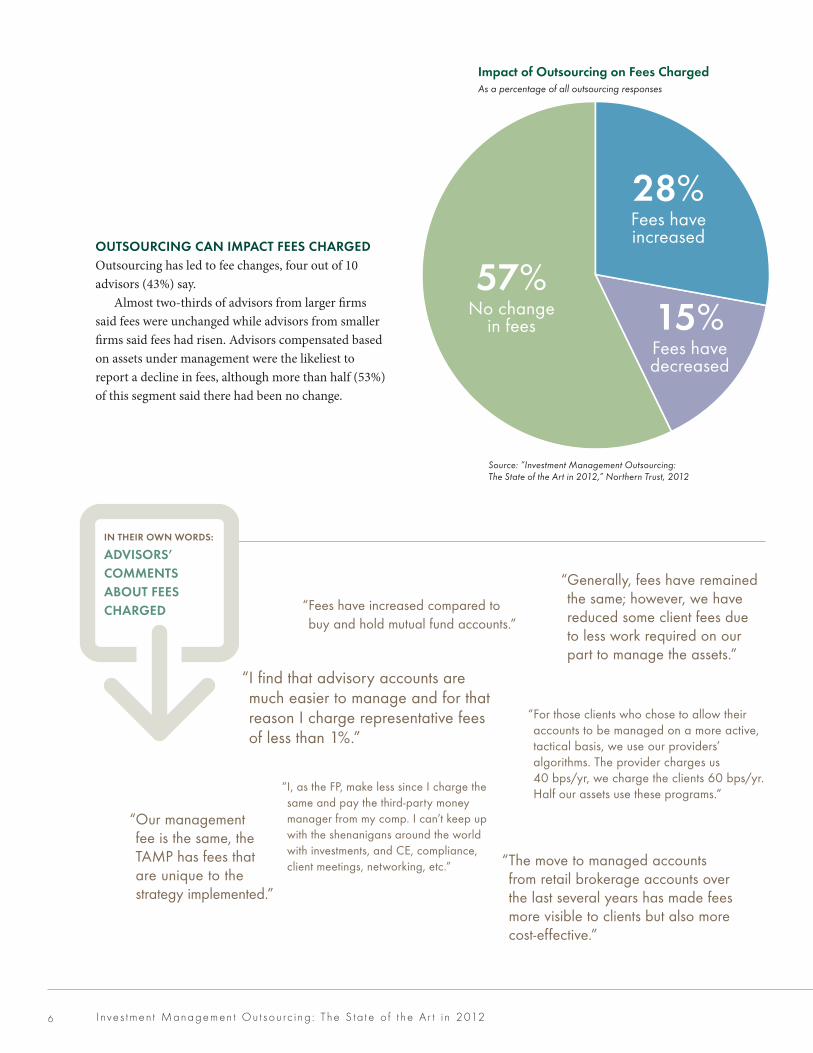
OUTSOURCING CAN IMPACT FEES CHARGEDOutsourcing has led to fee changes, four out of 10 advisors (43%) say .
Almost two-thirds of advisors from larger firms said fees were unchanged while advisors from smaller firms said fees had risen . Advisors compensated based on assets under management were the likeliest to report a decline in fees, although more than half (53%) of this segment said there had been no change .
The investment products selected for the client
Client account size
The need for tax efficiency
Other
28%Fees have increased
15%Fees have decreased
57%No change
in fees
13%2%
Outsourcing of Particular Assets or AccountsAs a percentage of outsourcing respondents
What Determines the Outsourcing of Particular Assets or Accounts By Compensation ModelAs a percentage of outsourcing respondents
0 10% 20% 30% 40% 50% 60%
Asset-based Combination
Client account size
The investment products selectedfor the client
The need for tax efficiency
Other
49%
27%
38%
10%
17%
56%
3%
What Determines the Outsourcing of Particular Assets or Accounts By Compensation ModelAs a percentage of outsourcing respondents
0 10% 20% 30% 40% 50% 60%
Asset-based Combination
Client account size
The investment products selectedfor the client
The need for tax efficiency
Other
49%
27%
10%
17%
38%
56%
3%
48%
37%
0%
Outsourcing of Particular Assets or Accounts
Outsourcing’s Effect on Fees ChargedAs a percentage of outsourcing respondents
“ The move to managed accounts from retail brokerage accounts over the last several years has made fees more visible to clients but also more cost-effective .”
IN THEIR OWN WORDS:
ADVISORS’ COMMENTS ABOUT FEES CHARGED
“ Our management fee is the same, the TAMP has fees that are unique to the strategy implemented .”
Source: “Investment Management Outsourcing: The State of the Art in 2012,” Northern Trust, 2012
Impact of Outsourcing on Fees ChargedAs a percentage of all outsourcing responses
“ Fees have increased compared to buy and hold mutual fund accounts .”
“ I find that advisory accounts are much easier to manage and for that reason I charge representative fees of less than 1% .”
“ I, as the FP, make less since I charge the same and pay the third-party money manager from my comp . I can’t keep up with the shenanigans around the world with investments, and CE, compliance, client meetings, networking, etc .”
“ For those clients who chose to allow their accounts to be managed on a more active, tactical basis, we use our providers’ algorithms . The provider charges us 40 bps/yr, we charge the clients 60 bps/yr . Half our assets use these programs .”
“ Generally, fees have remained the same; however, we have reduced some client fees due to less work required on our part to manage the assets .”
7
The Outsourcing Experience
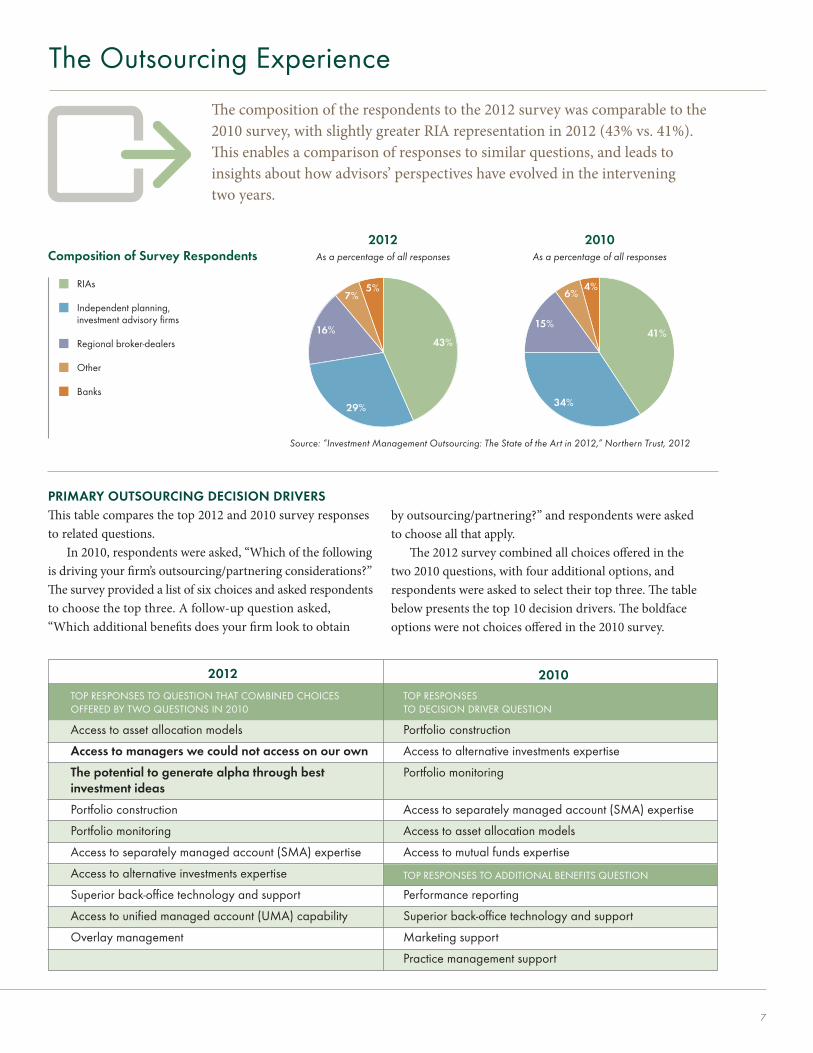
The composition of the respondents to the 2012 survey was comparable to the 2010 survey, with slightly greater RIA representation in 2012 (43% vs . 41%) . This enables a comparison of responses to similar questions, and leads to insights about how advisors’ perspectives have evolved in the intervening two years .
PRIMARY OUTSOURCING DECISION DRIVERS This table compares the top 2012 and 2010 survey responses to related questions .
In 2010, respondents were asked, “Which of the following is driving your firm’s outsourcing/partnering considerations?” The survey provided a list of six choices and asked respondents to choose the top three . A follow-up question asked, “Which additional benefits does your firm look to obtain
2012
TOP RESPONSES TO QUESTION THAT COMBINED CHOICES OFFERED BY TWO QUESTIONS IN 2010
Access to asset allocation models
Access to managers we could not access on our own
The potential to generate alpha through best investment ideas
Portfolio construction
Portfolio monitoring
Access to separately managed account (SMA) expertise
Access to alternative investments expertise
Superior back-office technology and support
Access to unified managed account (UMA) capability
Overlay management
2010TOP RESPONSES TO DECISION DRIVER QUESTION
Portfolio construction
Access to alternative investments expertise
Portfolio monitoring
Access to separately managed account (SMA) expertise
Access to asset allocation models
Access to mutual funds expertise
TOP RESPONSES TO ADDITIONAL BENEFITS QUESTION
Performance reporting
Superior back-office technology and support
Marketing support
Practice management support
by outsourcing/partnering?” and respondents were asked to choose all that apply .
The 2012 survey combined all choices offered in the two 2010 questions, with four additional options, and respondents were asked to select their top three . The table below presents the top 10 decision drivers . The boldface options were not choices offered in the 2010 survey .
RIAs
Independent planning, investment advisory firms
Regional broker-dealers
Other
Banks
34%
15%
6%
41%
4%
2010As a percentage of all responses
RIAs
Independent planning, investment advisory firms
Regional broker-dealers
Other
Banks
29%
16%
7%
43%
5%
2012As a percentage of all responses
Composition of Survey RespondentsRIAs
Independent planning, investment advisory firms
Regional broker-dealers
Other
Banks
34%
15%
6%
41%
4%
2010As a percentage of all responses
RIAs
Independent planning, investment advisory firms
Regional broker-dealers
Other
Banks
29%
16%
7%
43%
5%
2012As a percentage of all responses
RIAs
Independent planning, investment advisory firms
Regional broker-dealers
Other
Banks
34%
15%
6%
41%
4%
2010As a percentage of all responses
RIAs
Independent planning, investment advisory firms
Regional broker-dealers
Other
Banks
29%
16%
7%
43%
5%
2012As a percentage of all responses
RIAs
Independent planning, investment advisory firms
Regional broker-dealers
Other
Banks
2010As a percentage of all responses
2012As a percentage of all responses
Source: “Investment Management Outsourcing: The State of the Art in 2012,” Northern Trust, 2012
I n ve s tmen t Managemen t Ou t sou rc i ng : T he S ta t e o f t he A r t i n 20128
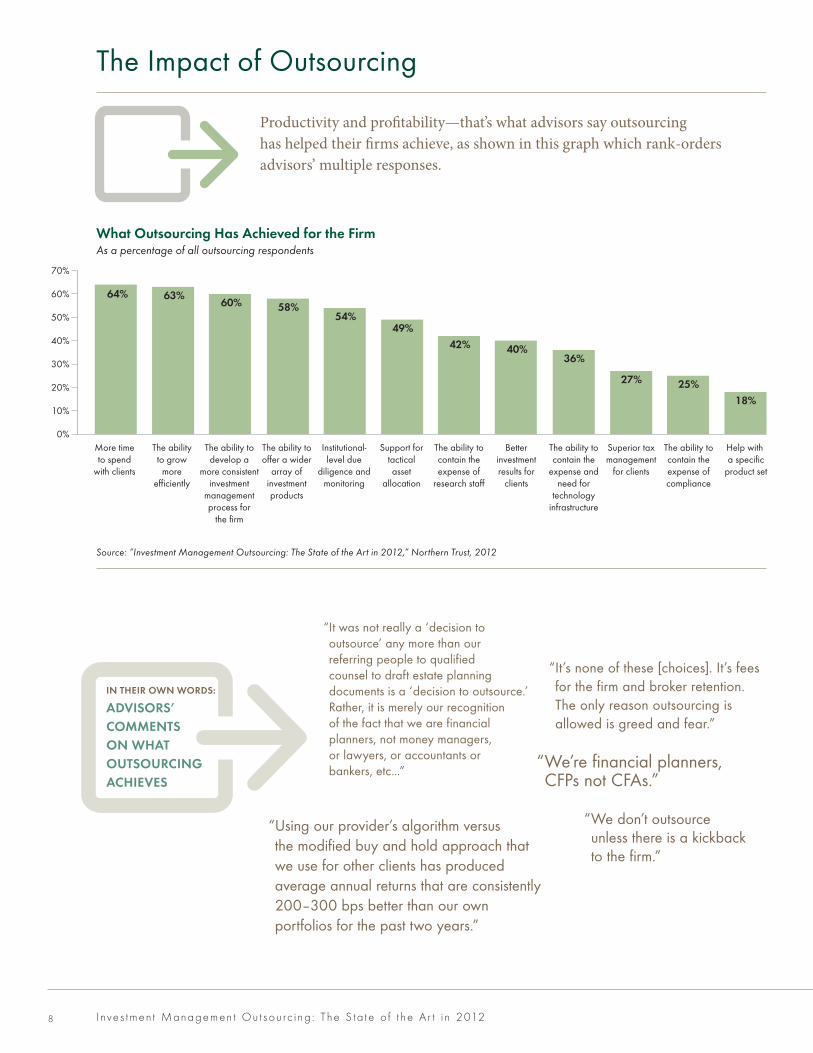
Productivity and profitability—that’s what advisors say outsourcing has helped their firms achieve, as shown in this graph which rank-orders advisors’ multiple responses .
More timeto spend
with clients
The abilityto grow
moreefficiently
The ability todevelop a
more consistentinvestment
managementprocess for
the firm
The ability tooffer a wider
array ofinvestmentproducts
Institutional-level due
diligence andmonitoring
Support fortacticalasset
allocation
The ability tocontain theexpense of
research staff
Betterinvestmentresults for
clients
The ability tocontain the
expense andneed for
technologyinfrastructure
Superior taxmanagement
for clients
The ability tocontain theexpense ofcompliance
Help with a specific
product set
What Outsourcing Has Achieved For The FirmAs a percentage of all outsourcing respondents
0%
10%
20%
30%
40%
50%
60%
70%
64% 63%60% 58%
54%49%
42% 40%36%
27% 25%18%
The Single Most Positive Impact Of OutsourcingAs a percentage of outsourcing respondents
0
10%
20%
30%
40%
50%
60%
55%
44%
21%
8%
13%10%
5%9%
32%
3%
More timeto focus onthe business
Favorableinvestment
performance
Strongclient
service
Goodperformance
reporting
Other
0
5%
10%
15%
20%
25%
30%
35%
33%
17%
27%
13%
6%4%
Poorinvestment
performance
Other Tooexpensive
Lack ofcommunication
Poorclient
service
Poorperformance
reporting
The Single Most Negative Impact Of OutsourcingAs a percentage of outsourcing respondents
2012
2010
2012
The Impact of Outsourcing
Source: “Investment Management Outsourcing: The State of the Art in 2012,” Northern Trust, 2012
“ It’s none of these [choices] . It’s fees for the firm and broker retention . The only reason outsourcing is allowed is greed and fear .”
IN THEIR OWN WORDS:
ADVISORS’ COMMENTS ON WHAT OUTSOURCING ACHIEVES
“ Using our provider’s algorithm versus the modified buy and hold approach that we use for other clients has produced average annual returns that are consistently 200–300 bps better than our own portfolios for the past two years .”
What Outsourcing Has Achieved for the FirmAs a percentage of all outsourcing respondents
“ We don’t outsource unless there is a kickback to the firm .”
“ We’re financial planners, CFPs not CFAs .”
“ It was not really a ‘decision to outsource’ any more than our referring people to qualified counsel to draft estate planning documents is a ‘decision to outsource .’ Rather, it is merely our recognition of the fact that we are financial planners, not money managers, or lawyers, or accountants or bankers, etc . . .”
9
More timeto spend
with clients
The abilityto grow
moreefficiently
The ability todevelop a
more consistentinvestment
managementprocess for
the firm
The ability tooffer a wider
array ofinvestmentproducts
Institutional-level due
diligence andmonitoring
Support fortacticalasset
allocation
The ability tocontain theexpense of
research staff
Betterinvestmentresults for
clients
The ability tocontain the
expense andneed for
technologyinfrastructure
Superior taxmanagement
for clients
The ability tocontain theexpense ofcompliance
Help with a specific
product set
What Outsourcing Has Achieved For The FirmAs a percentage of all outsourcing respondents
0%
10%
20%
30%
40%
50%
60%
70%
64% 63%60% 58%
54%49%
42% 40%36%
27% 25%18%
The Single Most Positive Impact Of OutsourcingAs a percentage of outsourcing respondents
0
10%
20%
30%
40%
50%
60%
55%
44%
21%
8%
13%10%
5%9%
32%
3%
More timeto focus onthe business
Favorableinvestment
performance
Strongclient
service
Goodperformance
reporting
Other
0
5%
10%
15%
20%
25%
30%
35%
33%
17%
27%
13%
6%4%
Poorinvestment
performance
Other Tooexpensive
Lack ofcommunication
Poorclient
service
Poorperformance
reporting
The Single Most Negative Impact Of OutsourcingAs a percentage of outsourcing respondents
2012
2010
2012
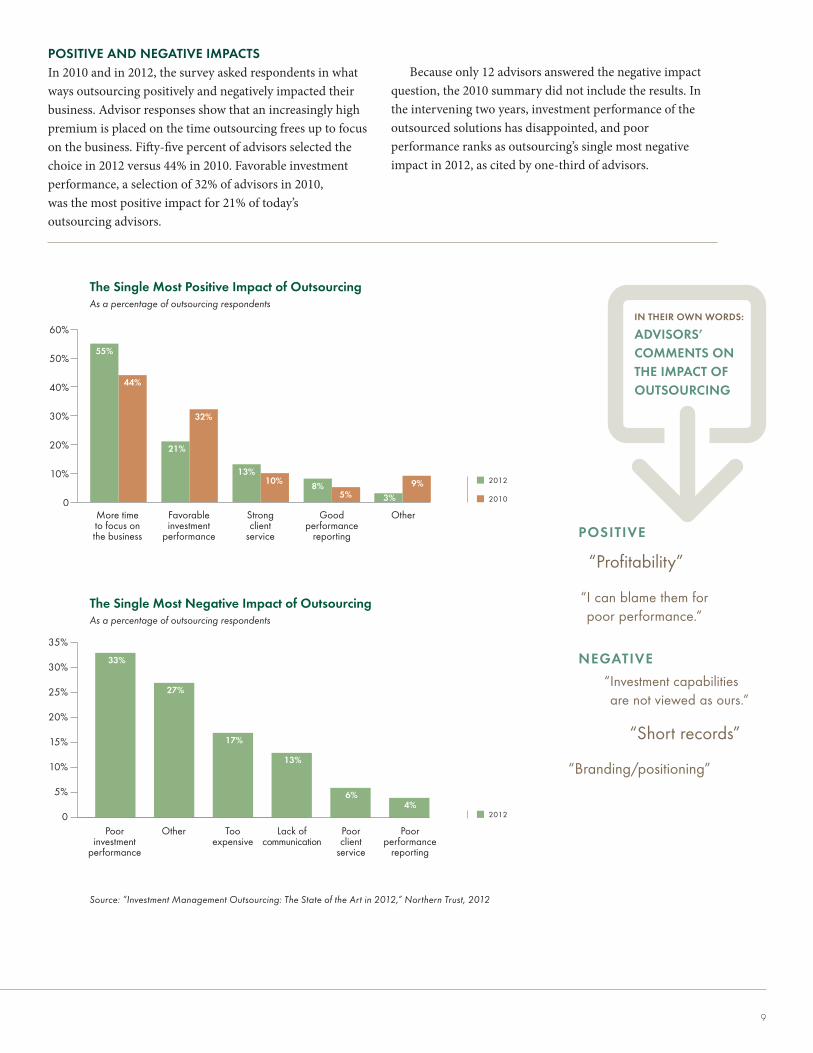
POSITIVE AND NEGATIVE IMPACTSIn 2010 and in 2012, the survey asked respondents in what ways outsourcing positively and negatively impacted their business . Advisor responses show that an increasingly high premium is placed on the time outsourcing frees up to focus on the business . Fifty-five percent of advisors selected the choice in 2012 versus 44% in 2010 . Favorable investment performance, a selection of 32% of advisors in 2010, was the most positive impact for 21% of today’s outsourcing advisors .
Because only 12 advisors answered the negative impact question, the 2010 summary did not include the results . In the intervening two years, investment performance of the outsourced solutions has disappointed, and poor performance ranks as outsourcing’s single most negative impact in 2012, as cited by one-third of advisors .
POSITIVE
“Profitability”
“ I can blame them for poor performance .”
NEGATIVE
“ Investment capabilities are not viewed as ours .”
“Short records”
“Branding/positioning”
IN THEIR OWN WORDS:
ADVISORS’ COMMENTS ON THE IMPACT OF OUTSOURCING
Source: “Investment Management Outsourcing: The State of the Art in 2012,” Northern Trust, 2012
More time to focus on the business
Favorable investment
performance
Strong client
service
Good performance
reporting
Other
The Single Most Positive Impact of OutsourcingAs a percentage of outsourcing respondents
More timeto spend
with clients
The abilityto grow
moreefficiently
The ability todevelop a
more consistentinvestment
managementprocess for
the firm
The ability tooffer a wider
array ofinvestmentproducts
Institutional-level due
diligence andmonitoring
Support fortacticalasset
allocation
The ability tocontain theexpense of
research staff
Betterinvestmentresults for
clients
The ability tocontain the
expense andneed for
technologyinfrastructure
Superior taxmanagement
for clients
The ability tocontain theexpense ofcompliance
Help with a specific
product set
What Outsourcing Has Achieved For The FirmAs a percentage of all outsourcing respondents
0%
10%
20%
30%
40%
50%
60%
70%
64% 63%60% 58%
54%49%
42% 40%36%
27% 25%18%
The Single Most Positive Impact Of OutsourcingAs a percentage of outsourcing respondents
0
10%
20%
30%
40%
50%
60%
55%
44%
21%
8%
13%10%
5%9%
32%
3%
More timeto focus onthe business
Favorableinvestment
performance
Strongclient
service
Goodperformance
reporting
Other
0
5%
10%
15%
20%
25%
30%
35%
33%
17%
27%
13%
6%4%
Poorinvestment
performance
Other Tooexpensive
Lack ofcommunication
Poorclient
service
Poorperformance
reporting
The Single Most Negative Impact Of OutsourcingAs a percentage of outsourcing respondents
2012
2010
2012
Poor investment
performance
Other Too expensive
Lack of communication
Poor client
service
Poor performance
reporting
The Single Most Negative Impact of OutsourcingAs a percentage of outsourcing respondents
I n ve s tmen t Managemen t Ou t sou rc i ng : T he S ta t e o f t he A r t i n 201210
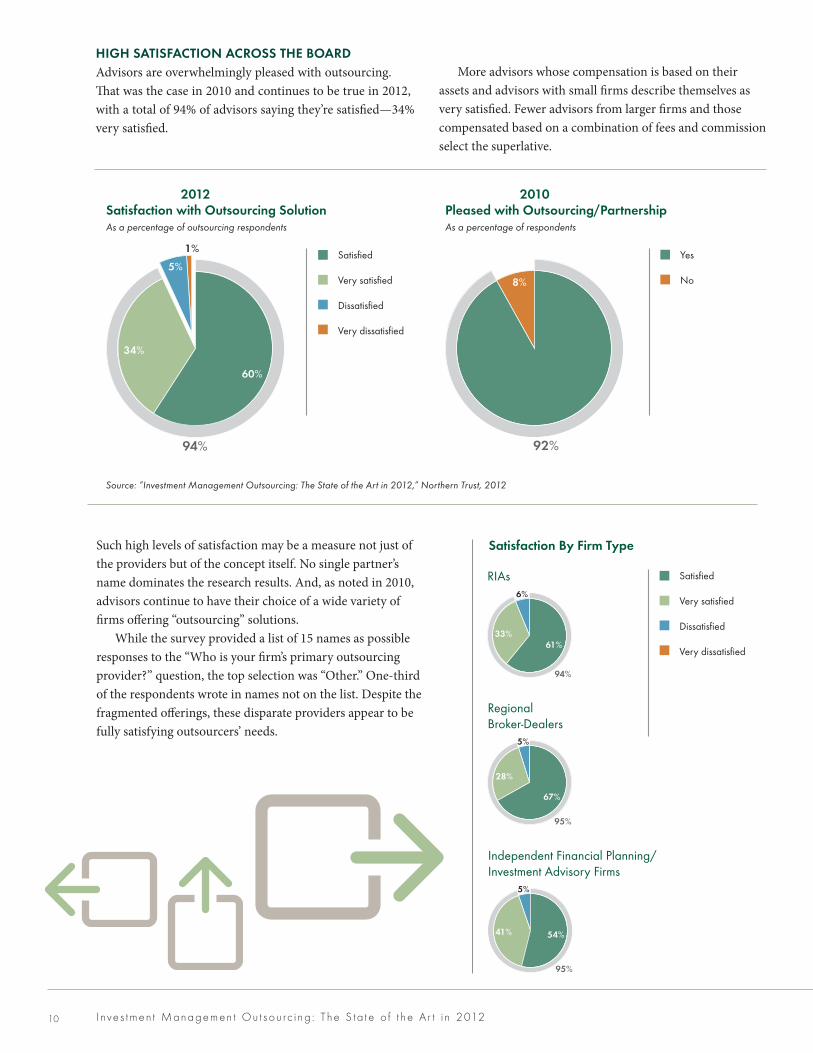
Such high levels of satisfaction may be a measure not just of the providers but of the concept itself . No single partner’s name dominates the research results . And, as noted in 2010, advisors continue to have their choice of a wide variety of firms offering “outsourcing” solutions .
While the survey provided a list of 15 names as possible responses to the “Who is your firm’s primary outsourcing provider?” question, the top selection was “Other .” One-third of the respondents wrote in names not on the list . Despite the fragmented offerings, these disparate providers appear to be fully satisfying outsourcers’ needs .
HIGH SATISFACTION ACROSS THE BOARD Advisors are overwhelmingly pleased with outsourcing . That was the case in 2010 and continues to be true in 2012, with a total of 94% of advisors saying they’re satisfied—34% very satisfied .
More advisors whose compensation is based on their assets and advisors with small firms describe themselves as very satisfied . Fewer advisors from larger firms and those compensated based on a combination of fees and commission select the superlative .
Yes
No
92%
8%
2010 Pleased With Outsourcing/Partnership?As a percentage of respondents
Satisfied
Very satisfied
Dissatisfied
Very dissatisfied
34%
5%
1%
60%
2012 Satisfaction With Outsourcing SolutionAs a percentage of outsourcing respondents
94%
Yes
No
92%
8%
2010 Pleased With Outsourcing/Partnership?As a percentage of respondents
Satisfied
Very satisfied
Dissatisfied
Very dissatisfied
34%
5%
1%
60%
2012 Satisfaction With Outsourcing SolutionAs a percentage of outsourcing respondents
94%
Source: “Investment Management Outsourcing: The State of the Art in 2012,” Northern Trust, 2012
Satisfied
Very satisfied
Dissatisfied
Very dissatisfied
Pleased with Outsourcing/PartnershipAs a percentage of respondents
Satisfaction with Outsourcing SolutionAs a percentage of outsourcing respondents
Yes
No
92%
8%
2010 Pleased With Outsourcing/Partnership?As a percentage of respondents
Satisfied
Very satisfied
Dissatisfied
Very dissatisfied
34%
5%
1%
60%
2012 Satisfaction With Outsourcing SolutionAs a percentage of outsourcing respondents
94%
Yes
No
2012 2010
Satisfaction By Firm Type
Regional Broker-Dealers
Satisfied
Very satisfied
Dissatisfied
Very dissatisfied
34%
5%
1%
60%
2012 Satisfaction With Outsourcing SolutionAs a percentage of outsourcing respondents
Satisfied
Very satisfied
Dissatisfied
Very dissatisfied41%
5%
54%
Independent Financial Planning/Investment Advisory Firms
Satisfied
Very satisfied
Dissatisfied
Very dissatisfied33%
6%
61%
RIAs
Satisfied
Very satisfied
Dissatisfied
Very dissatisfied28%
6%
67%
41%
5%
54%
33%
6%
61%
28%
67%
Regional broker-dealers
94%
95%
95%
5%
94%
RIAs
Satisfied
Very satisfied
Dissatisfied
Very dissatisfied
34%
5%
1%
60%
2012 Satisfaction With Outsourcing SolutionAs a percentage of outsourcing respondents
Satisfied
Very satisfied
Dissatisfied
Very dissatisfied41%
5%
54%
Independent Financial Planning/Investment Advisory Firms
Satisfied
Very satisfied
Dissatisfied
Very dissatisfied33%
6%
61%
RIAs
Satisfied
Very satisfied
Dissatisfied
Very dissatisfied28%
6%
67%
41%
5%
54%
33%
6%
61%
28%
67%
Regional broker-dealers
94%
95%
95%
5%
94%
Independent Financial Planning/Investment Advisory Firms
Satisfied
Very satisfied
Dissatisfied
Very dissatisfied
34%
5%
1%
60%
2012 Satisfaction With Outsourcing SolutionAs a percentage of outsourcing respondents
Satisfied
Very satisfied
Dissatisfied
Very dissatisfied41%
5%
54%
Independent Financial Planning/Investment Advisory Firms
Satisfied
Very satisfied
Dissatisfied
Very dissatisfied33%
6%
61%
RIAs
Satisfied
Very satisfied
Dissatisfied
Very dissatisfied28%
6%
67%
41%
5%
54%
33%
6%
61%
28%
67%
Regional broker-dealers
94%
95%
95%
5%
94%
Yes
No
92%
8%
2010 Pleased With Outsourcing/Partnership?As a percentage of respondents
Satisfied
Very satisfied
Dissatisfied
Very dissatisfied
34%
5%
1%
60%
2012 Satisfaction With Outsourcing SolutionAs a percentage of outsourcing respondents
94%
Satisfied
Very satisfied
Dissatisfied
Very dissatisfied
11
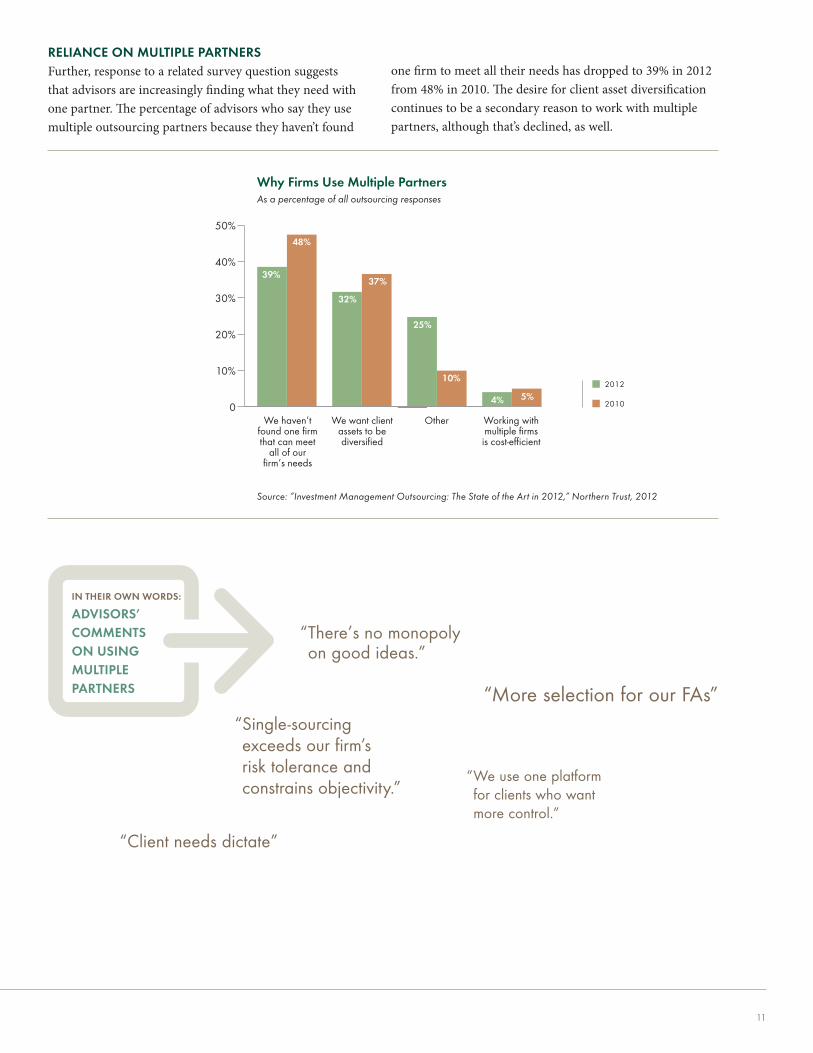
RELIANCE ON MULTIPLE PARTNERS Further, response to a related survey question suggests that advisors are increasingly finding what they need with one partner . The percentage of advisors who say they use multiple outsourcing partners because they haven’t found
one firm to meet all their needs has dropped to 39% in 2012 from 48% in 2010 . The desire for client asset diversification continues to be a secondary reason to work with multiple partners, although that’s declined, as well .
We haven’tfound one firmthat can meet
all of ourfirm’s needs.
We want clientassets to bediversified.
Working withmultiple firms
is cost-efficient.
Other
Why Firms Use Multiple PartnersAs a percentage of all outsourcing responses
0
10%
20%
30%
40%
50%
39%
48%
32%
37%
25%
10%
4% 5%2012
2010
Source: “Investment Management Outsourcing: The State of the Art in 2012,” Northern Trust, 2012
“ There’s no monopoly on good ideas .”
“More selection for our FAs”
IN THEIR OWN WORDS:
ADVISORS’ COMMENTS ON USING MULTIPLE PARTNERS
“ We use one platform for clients who want more control .”
“ Single-sourcing exceeds our firm’s risk tolerance and constrains objectivity .”
We haven’t found one firm that can meet
all of our firm’s needs
We want client assets to be diversified
Other Working with multiple firms is cost-efficient
Why Firms Use Multiple PartnersAs a percentage of all outsourcing responses
“Client needs dictate”
I n ve s tmen t Managemen t Ou t sou rc i ng : T he S ta t e o f t he A r t i n 201212
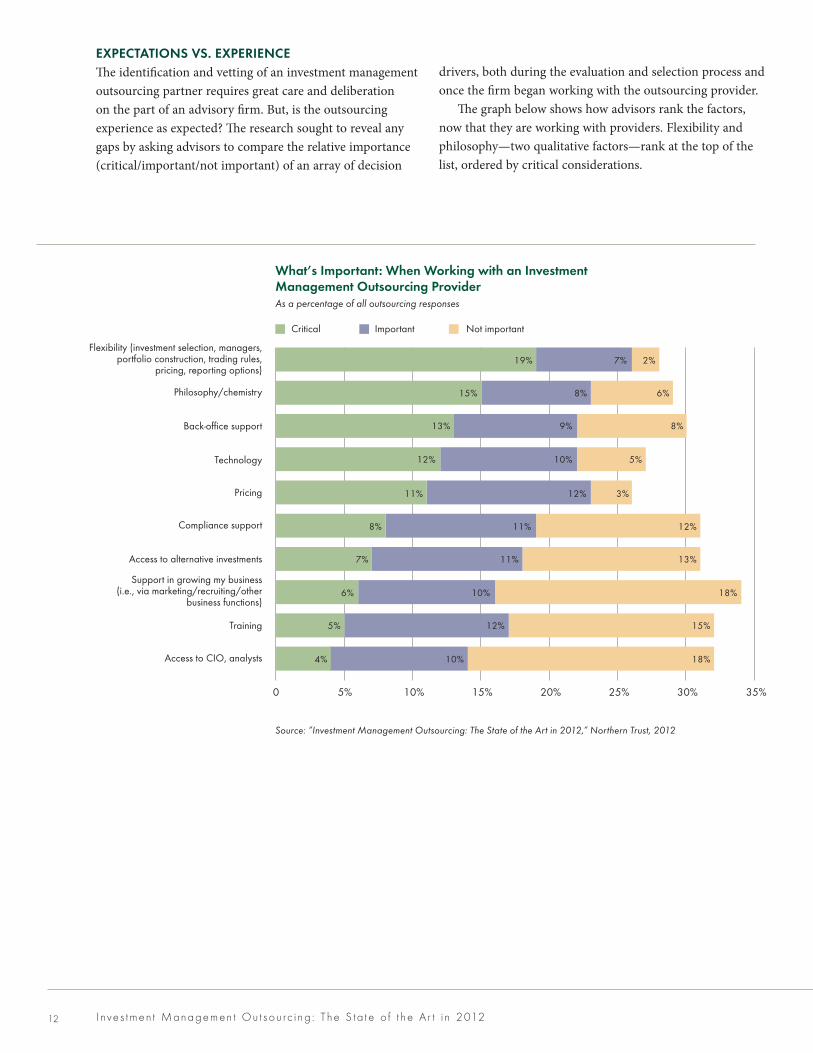
EXPECTATIONS VS. EXPERIENCE The identification and vetting of an investment management outsourcing partner requires great care and deliberation on the part of an advisory firm . But, is the outsourcing experience as expected? The research sought to reveal any gaps by asking advisors to compare the relative importance (critical/important/not important) of an array of decision
drivers, both during the evaluation and selection process and once the firm began working with the outsourcing provider .
The graph below shows how advisors rank the factors, now that they are working with providers . Flexibility and philosophy—two qualitative factors—rank at the top of the list, ordered by critical considerations .
Flexibility (investment selection, managers,portfolio construction, trading rules, pricing,
reporting options)
Philosophy/chemistry
Back-office support
Technology
Pricing
Compliance support
Access to alternative investments
Support in growing my business (i.e., via marketing/recruiting/other business functions)
Training
Access to CIO, analysts
What's Important: When Working With An Investment Management Outsourcing ProviderAs a percentage of all outsourcing responses
Outsourcing Expectations Vs. Experience As a percentage of all outsourcing responses
Not important expectation
Not important experience
Critical expectation
Critical experience Important experience
Important expectation
Critical Important Not important
0 5% 10% 15% 20%
Flexibility (investment selection,managers, portfolio construction,
trading rules, pricing, reporting options)
Philosophy/chemistry
Back-office support
Technology
Pricing
Compliance support
Access to alternative investments
Support in growing my business (i.e., via marketing/recruiting/other business functions)
Training
Access to CIO, analysts
0 5% 20%10% 15% 30%25% 35%
19% 7% 2%
15% 8% 6%
13% 9% 8%
12% 10% 5%
11% 12% 3%
8% 11% 12%
7% 11% 13%
6% 10% 18%
5% 12% 15%
4% 10% 18%
Source: “Investment Management Outsourcing: The State of the Art in 2012,” Northern Trust, 2012
Flexibility (investment selection, managers, portfolio construction, trading rules,
pricing, reporting options)
Philosophy/chemistry
Back-office support
Technology
Pricing
Compliance support
Access to alternative investments
Support in growing my business (i .e ., via marketing/recruiting/other
business functions)
Training
Access to CIO, analysts
What’s Important: When Working with an Investment Management Outsourcing ProviderAs a percentage of all outsourcing responses
Critical Important Not important
13
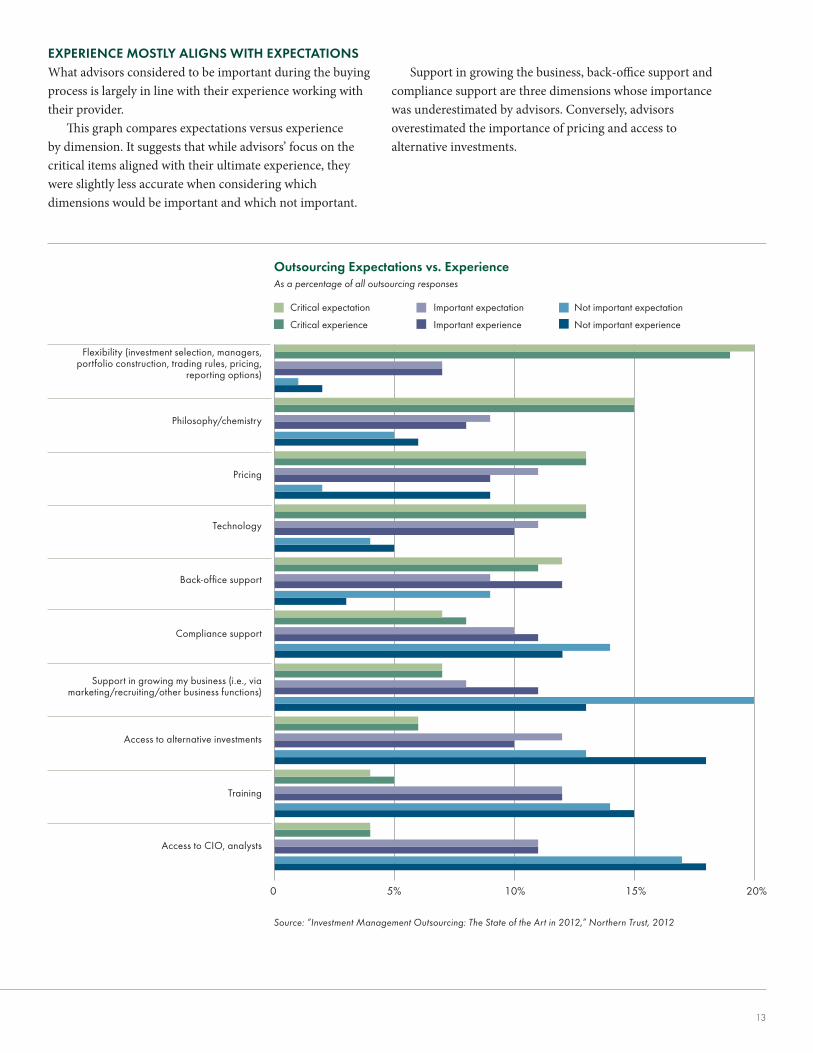
EXPERIENCE MOSTLY ALIGNS WITH EXPECTATIONS What advisors considered to be important during the buying process is largely in line with their experience working with their provider .
This graph compares expectations versus experience by dimension . It suggests that while advisors’ focus on the critical items aligned with their ultimate experience, they were slightly less accurate when considering which dimensions would be important and which not important .
Support in growing the business, back-office support and compliance support are three dimensions whose importance was underestimated by advisors . Conversely, advisors overestimated the importance of pricing and access to alternative investments .
Source: “Investment Management Outsourcing: The State of the Art in 2012,” Northern Trust, 2012
Flexibility (investment selection, managers, portfolio construction, trading rules, pricing,
reporting options)
Philosophy/chemistry
Pricing
Technology
Back-office support
Compliance support
Support in growing my business (i .e ., via marketing/recruiting/other business functions)
Access to alternative investments
Training
Access to CIO, analysts
Flexibility (investment selection, managers,portfolio construction, trading rules, pricing,
reporting options)
Philosophy/chemistry
Back-office support
Technology
Pricing
Compliance support
Access to alternative investments
Support in growing my business (i.e., via marketing/recruiting/other business functions)
Training
Access to CIO, analysts
What's Important: When Working With An Investment Management Outsourcing ProviderAs a percentage of all outsourcing responses
Outsourcing Expectations Vs. Experience As a percentage of all outsourcing responses
Not important expectation
Not important experience
Critical expectation
Critical experience Important experience
Important expectation
Critical Important Not important
0 5% 10% 15% 20%
Flexibility (investment selection,managers, portfolio construction,
trading rules, pricing, reporting options)
Philosophy/chemistry
Back-office support
Technology
Pricing
Compliance support
Access to alternative investments
Support in growing my business (i.e., via marketing/recruiting/other business functions)
Training
Access to CIO, analysts
0 5% 20%10% 15% 30%25% 35%
19% 7% 2%
15% 8% 6%
13% 9% 8%
12% 10% 5%
11% 12% 3%
8% 11% 12%
7% 11% 13%
6% 10% 18%
5% 12% 15%
4% 10% 18%
Outsourcing Expectations vs. ExperienceAs a percentage of all outsourcing responses
Not important expectation
Not important experience
Critical expectation
Critical experience
Important expectation
Important experience
I n ve s tmen t Managemen t Ou t sou rc i ng : T he S ta t e o f t he A r t i n 201214
Advisors Who Don’t Outsource
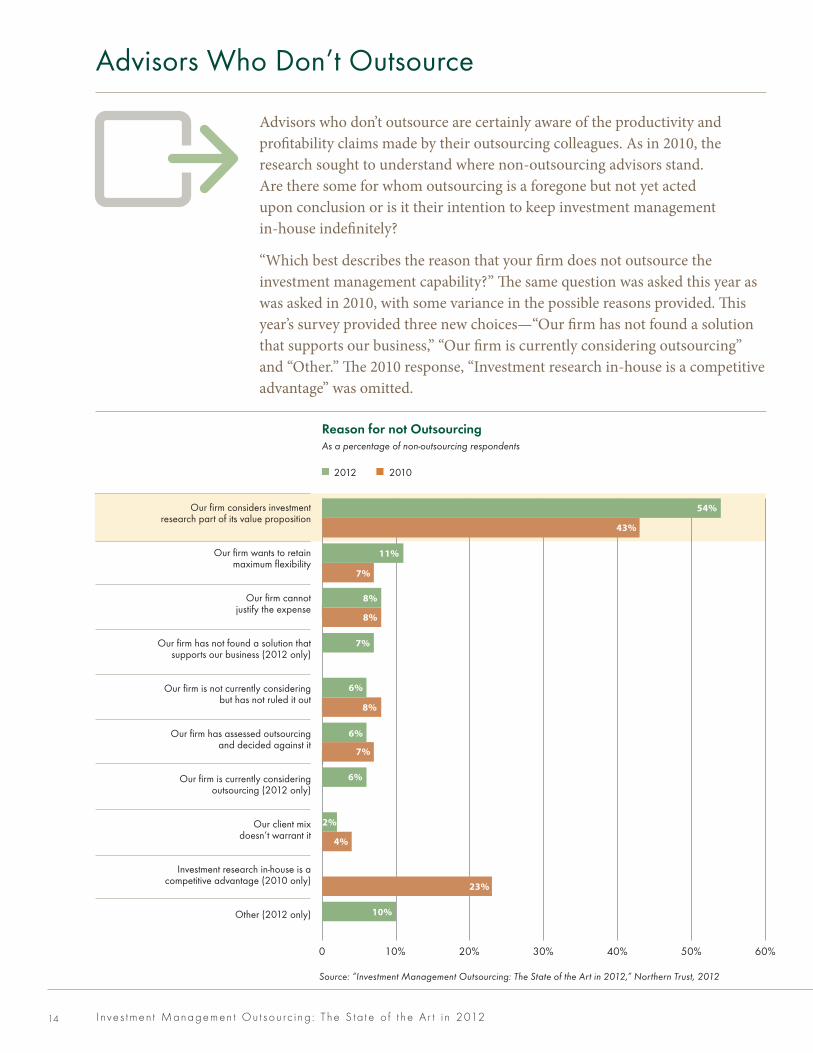
Advisors who don’t outsource are certainly aware of the productivity and profitability claims made by their outsourcing colleagues . As in 2010, the research sought to understand where non-outsourcing advisors stand . Are there some for whom outsourcing is a foregone but not yet acted upon conclusion or is it their intention to keep investment management in-house indefinitely?
“Which best describes the reason that your firm does not outsource the investment management capability?” The same question was asked this year as was asked in 2010, with some variance in the possible reasons provided . This year’s survey provided three new choices—“Our firm has not found a solution that supports our business,” “Our firm is currently considering outsourcing” and “Other .” The 2010 response, “Investment research in-house is a competitive advantage” was omitted .
Our firm considers investment research part of its value proposition
Our firm wants to retainmaximum flexibility
Our firm cannotjustify the expense
Our firm has not found a solution thatsupports our business (2012 only)
Our firm is not currently consideringbut has not ruled it out
Our firm has assessed outsourcingand decided against it
Our firm is currently consideringoutsourcing (2012 only)
Our client mixdoesn’t warrant it
Investment research in-house is a competitive advantage (2010 only)
Other (2012 only)
Reason For Not OutsourcingAs a percentage of non-outsourcing respondents
0 30%20%10% 40% 50% 60%
2012 2010
54%43%
11%7%
8%8%
7%
6%8%
6%7%
6%
2%4%
23%
10%
Our firm considers investment research part of its value proposition
Our firm wants to retainmaximum flexibility
Our firm cannotjustify the expense
Our firm has not found a solution thatsupports our business (2012 only)
Our firm is not currently consideringbut has not ruled it out
Our firm has assessed outsourcingand decided against it
Our firm is currently consideringoutsourcing (2012 only)
Our client mixdoesn’t warrant it
Investment research in-house is a competitive advantage (2010 only)
Other (2012 only)
Reason For Not OutsourcingAs a percentage of non-outsourcing respondents
0 30%20%10% 40% 50% 60%
2012 2010
54%
43%
11%
7%
8%
8%
6%
8%
6%
7%
6%
2%
4%
23%
10%
7%
Source: “Investment Management Outsourcing: The State of the Art in 2012,” Northern Trust, 2012
Our firm considers investment research part of its value proposition
Our firm wants to retain maximum flexibility
Our firm cannot justify the expense
Our firm has not found a solution that supports our business (2012 only)
Our firm is not currently considering but has not ruled it out
Our firm has assessed outsourcing and decided against it
Our firm is currently considering outsourcing (2012 only)
Our client mix doesn’t warrant it
Investment research in-house is a competitive advantage (2010 only)
Other (2012 only)
Reason for not OutsourcingAs a percentage of non-outsourcing respondents
2012 2010
15
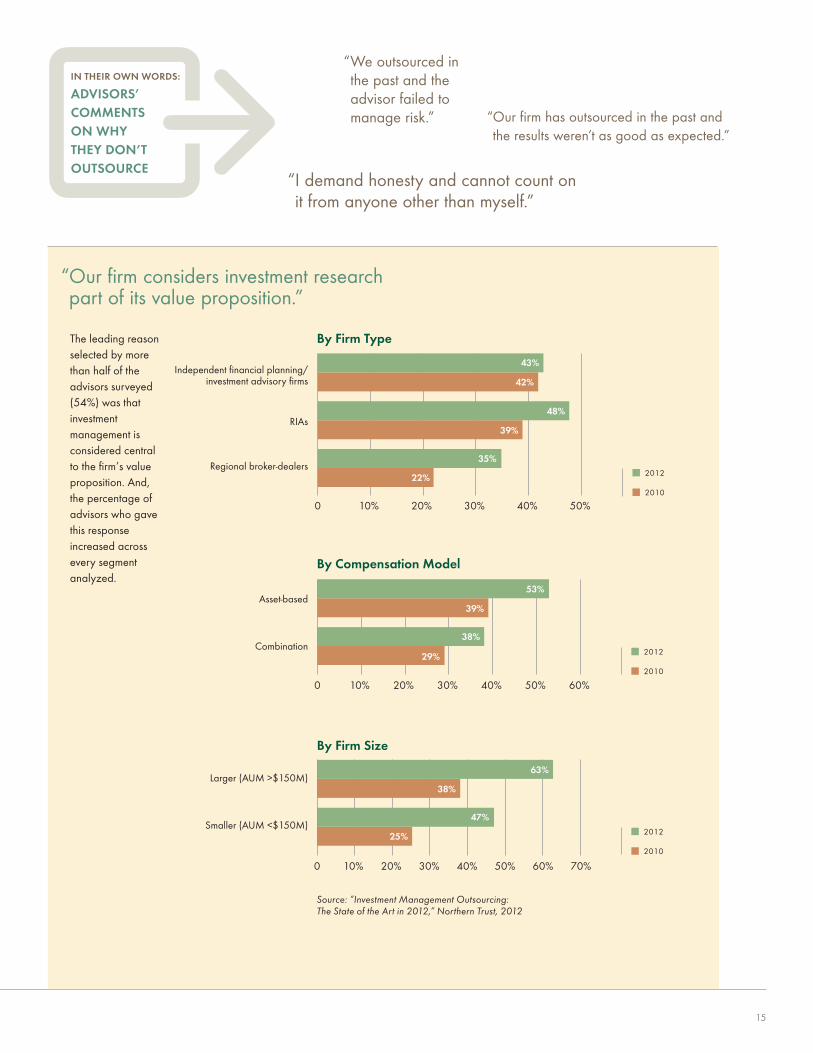
The leading reason selected by more than half of the advisors surveyed (54%) was that investment management is considered central to the firm’s value proposition . And, the percentage of advisors who gave this response increased across every segment analyzed .
“ We outsourced in the past and the advisor failed to manage risk .” “ Our firm has outsourced in the past and
the results weren’t as good as expected .”
IN THEIR OWN WORDS:
ADVISORS’ COMMENTS ON WHY THEY DON’T OUTSOURCE
“ I demand honesty and cannot count on it from anyone other than myself .”
By Firm Size
Independent financial planning/investment advisory firms
RIAs
Regionalbroker-dealers
By Firm Type
0 10% 20% 30% 40% 50%
2012
2010
Larger (AUM >$150M)
Smaller (AUM <$150M)
0 10% 20% 30% 40% 50% 60% 70%
By Compensation Model
Asset-based
Combination
0 10% 20% 30% 40% 50% 60%
2012
2010
2012
2010
43%
42%
48%
22%
39%
35%
53%
39%
38%
29%
63%
38%
47%
25%
Source: “Investment Management Outsourcing: The State of the Art in 2012,” Northern Trust, 2012
Larger (AUM >$150M)
Smaller (AUM <$150M)
By Firm Type
Independent financial planning/ investment advisory firms
RIAs
Regional broker-dealers
By Compensation Model
Asset-based
Combination
By Firm Size
“ Our firm considers investment research part of its value proposition .”
I n ve s tmen t Managemen t Ou t sou rc i ng : T he S ta t e o f t he A r t i n 201216
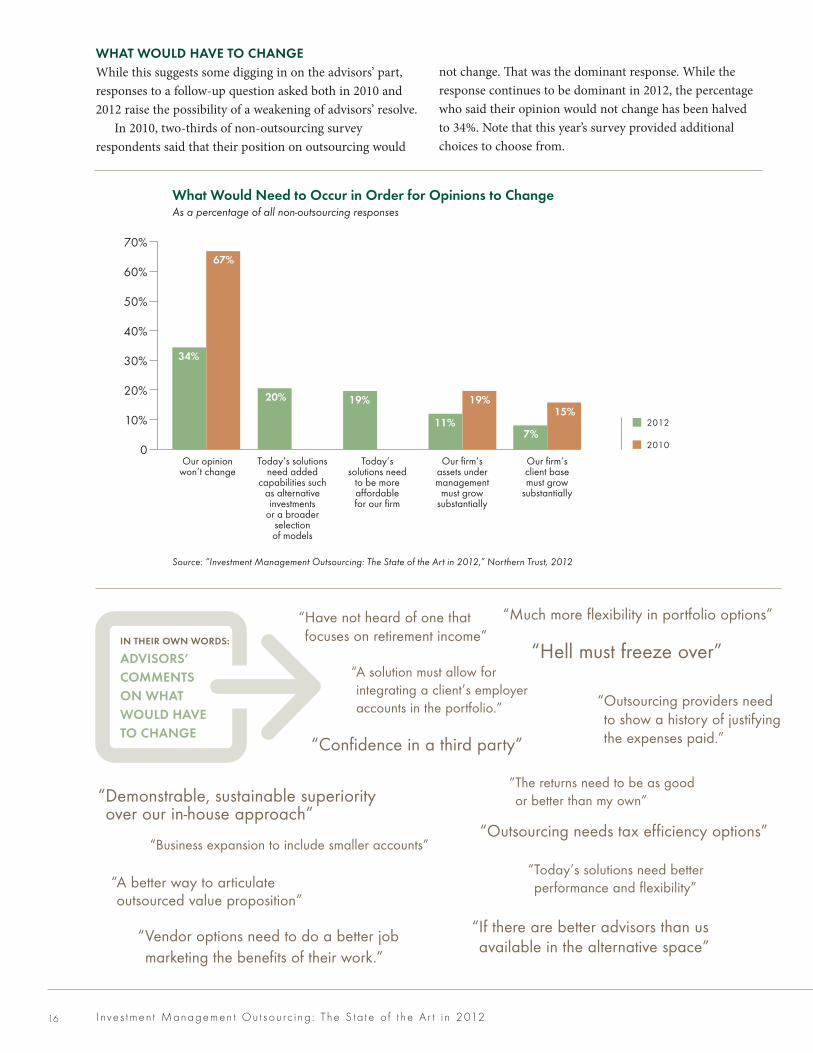
WHAT WOULD HAVE TO CHANGE While this suggests some digging in on the advisors’ part, responses to a follow-up question asked both in 2010 and 2012 raise the possibility of a weakening of advisors’ resolve .
In 2010, two-thirds of non-outsourcing survey respondents said that their position on outsourcing would
not change . That was the dominant response . While the response continues to be dominant in 2012, the percentage who said their opinion would not change has been halved to 34% . Note that this year’s survey provided additional choices to choose from .
14%9%
What Would Need To Occur In Order For Opinions To ChangeAs a percentage of all non-outsourcing responses
0
10%
20%
30%
40%
50%
70%
60%
34%
67%
20%
11%
19% 19%15%
7%
Our opinionwon’t change
Today’s solutionsneed added
capabilities suchas alternativeinvestments or a broader
selectionof models
Today’ssolutions need
to be moreaffordablefor our firm
Our firm’sassetsunder
managementmust grow
substantially
Our firm’sclient basemust grow
substantially
Other
2012
2010
Source: “Investment Management Outsourcing: The State of the Art in 2012,” Northern Trust, 2012
“ A solution must allow for integrating a client’s employer accounts in the portfolio .”
“Confidence in a third party”
“Much more flexibility in portfolio options”
“Hell must freeze over”IN THEIR OWN WORDS:
ADVISORS’ COMMENTS ON WHAT WOULD HAVE TO CHANGE
“ Outsourcing providers need to show a history of justifying the expenses paid .”
“ Have not heard of one that focuses on retirement income”
“ Demonstrable, sustainable superiority over our in-house approach”
“ Business expansion to include smaller accounts”
“ A better way to articulate outsourced value proposition”
“ Vendor options need to do a better job marketing the benefits of their work .”
“Outsourcing needs tax efficiency options”
“ Today’s solutions need better performance and flexibility”
“ If there are better advisors than us available in the alternative space”
“ The returns need to be as good or better than my own”
Our opinion won’t change
Today’s solutions need added
capabilities such as alternative investments
or a broader selection of models
Today’s solutions need
to be more affordable for our firm
Our firm’s assets under management
must grow substantially
Our firm’s client base must grow
substantially
What Would Need to Occur in Order for Opinions to ChangeAs a percentage of all non-outsourcing responses
14%9%
What Would Need To Occur In Order For Opinions To ChangeAs a percentage of all non-outsourcing responses
0
10%
20%
30%
40%
50%
70%
60%
34%
67%
20%
11%
19% 19%15%
7%
Our opinionwon’t change
Today’s solutionsneed added
capabilities suchas alternativeinvestments or a broader
selectionof models
Today’ssolutions need
to be moreaffordablefor our firm
Our firm’sassetsunder
managementmust grow
substantially
Our firm’sclient basemust grow
substantially
Other
2012
2010
17
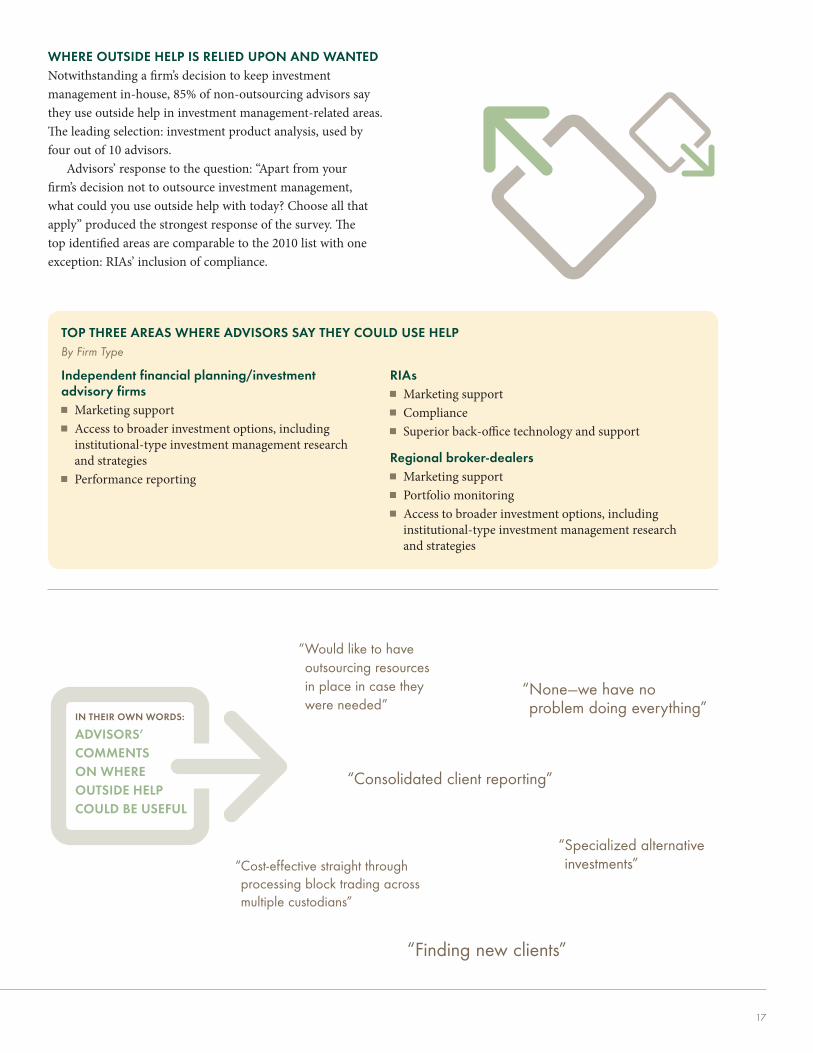
WHERE OUTSIDE HELP IS RELIED UPON AND WANTED Notwithstanding a firm’s decision to keep investment management in-house, 85% of non-outsourcing advisors say they use outside help in investment management-related areas . The leading selection: investment product analysis, used by four out of 10 advisors .
Advisors’ response to the question: “Apart from your firm’s decision not to outsource investment management, what could you use outside help with today? Choose all that apply” produced the strongest response of the survey . The top identified areas are comparable to the 2010 list with one exception: RIAs’ inclusion of compliance .
TOP THREE AREAS WHERE ADVISORS SAY THEY COULD USE HELP By Firm Type
Independent financial planning/investment advisory firms Marketing support Access to broader investment options, including
institutional-type investment management research and strategies
Performance reporting
RIAs Marketing support Compliance Superior back-office technology and support
Regional broker-dealers Marketing support Portfolio monitoring Access to broader investment options, including
institutional-type investment management research and strategies
“Consolidated client reporting”
IN THEIR OWN WORDS:
ADVISORS’ COMMENTS ON WHERE OUTSIDE HELP COULD BE USEFUL
“ Would like to have outsourcing resources in place in case they were needed”
“ None—we have no problem doing everything”
“ Cost-effective straight through processing block trading across multiple custodians”
“Finding new clients”
“ Specialized alternative investments”
I n ve s tmen t Managemen t Ou t sou rc i ng : T he S ta t e o f t he A r t i n 201218 I nve s tmen t Managemen t Ou t sou rc i ng : T he S ta t e o f t he A r t i n 201218
Less than1 hour
Less than 1 hour
1-2 hour
1-2 hours
5 hoursor more
5 hours or more
2-5 hours
2-5 hours
Investment Manager ResearchAs a percentage of non-outsourcing responses
Investment Manager ResearchAs a percentage of non-outsourcing responses
0
10%
20%
30%
40%
25%26%
16%
30%
13%
30%
21%
39%
2012
2010
Less than1 hour
1-2 hour 5 hoursor more
2-5 hours
Portfolio Construction As a percentage of non-outsourcing responses
0
10%
20%
30%
40%
13%
9%
24%
36%
24%27%27%
40%
2012
2010
Less than1 hour
1-2 hour 5 hoursor more
2-5 hours
Portfolio MonitoringAs a percentage of non-outsourcing responses
0
10%
20%
30%
60%
40%
50%
4%2%
15%
48%
13%
33%
27%
57%
2012
2010
0 10% 20% 30% 40%
2012
2010
25%
26%
16%
13%
30%
21%
30%
39%
Less than 1 hour
1-2 hours
5 hours or more
2-5 hours
Portfolio Construction As a percentage of non-outsourcing responses
0 10% 20% 30% 40%
2012
2010
24%
24%
27%
27%
36%
40%
Less than 1 hour
1-2 hours
5 hours or more
2-5 hours
Portfolio Monitoring As a percentage of non-outsourcing responses
0 10% 20% 40%30% 50% 60%
2012
2010
4%
2%
15%
13%
33%
27%
48%
57%
13%
9%
Less than1 hour
Less than 1 hour
1-2 hour
1-2 hours
5 hoursor more
5 hours or more
2-5 hours
2-5 hours
Investment Manager ResearchAs a percentage of non-outsourcing responses
Investment Manager ResearchAs a percentage of non-outsourcing responses
0
10%
20%
30%
40%
25%26%
16%
30%
13%
30%
21%
39%
2012
2010
Less than1 hour
1-2 hour 5 hoursor more
2-5 hours
Portfolio Construction As a percentage of non-outsourcing responses
0
10%
20%
30%
40%
13%
9%
24%
36%
24%27%27%
40%
2012
2010
Less than1 hour
1-2 hour 5 hoursor more
2-5 hours
Portfolio MonitoringAs a percentage of non-outsourcing responses
0
10%
20%
30%
60%
40%
50%
4%2%
15%
48%
13%
33%
27%
57%
2012
2010
0 10% 20% 30% 40%
2012
2010
25%
26%
16%
13%
30%
21%
30%
39%
Less than 1 hour
1-2 hours
5 hours or more
2-5 hours
Portfolio Construction As a percentage of non-outsourcing responses
0 10% 20% 30% 40%
2012
2010
24%
24%
27%
27%
36%
40%
Less than 1 hour
1-2 hours
5 hours or more
2-5 hours
Portfolio Monitoring As a percentage of non-outsourcing responses
0 10% 20% 40%30% 50% 60%
2012
2010
4%
2%
15%
13%
33%
27%
48%
57%
13%
9%
Portfolio MonitoringAs a percentage of non-outsourcing responses
Less than 1 hour
1-2 hours 2-5 hours 5 hours or more
Investment Manager ResearchAs a percentage of non-outsourcing responses
Less than 1 hour
1-2 hours 2-5 hours 5 hours or more
Portfolio ConstructionAs a percentage of non-outsourcing responses
Less than 1 hour
1-2 hours 2-5 hours 5 hours or more
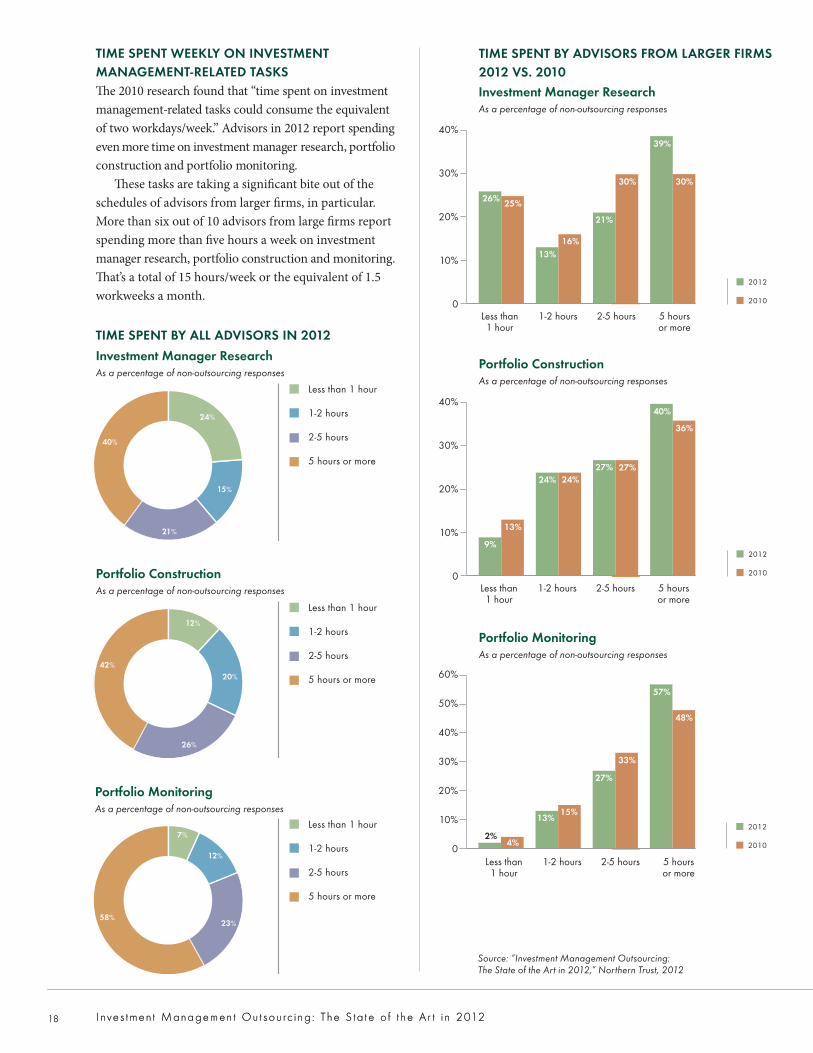
TIME SPENT WEEKLY ON INVESTMENT MANAGEMENT-RELATED TASKS The 2010 research found that “time spent on investment management-related tasks could consume the equivalent of two workdays/week .” Advisors in 2012 report spending even more time on investment manager research, portfolio construction and portfolio monitoring .
These tasks are taking a significant bite out of the schedules of advisors from larger firms, in particular . More than six out of 10 advisors from large firms report spending more than five hours a week on investment manager research, portfolio construction and monitoring . That’s a total of 15 hours/week or the equivalent of 1 .5 workweeks a month .
Source: “Investment Management Outsourcing: The State of the Art in 2012,” Northern Trust, 2012
TIME SPENT BY ADVISORS FROM LARGER FIRMS 2012 VS. 2010
Less than 1 hour
1-2 hours
2-5 hours
5 hours or more
15%
21%
24%
40%
Investment Manager ResearchAs a percentage of non-outsourcing responses
Less than 1 hour
1-2 hours
2-5 hours
5 hours or more20%
26%
12%
42%
Portfolio ConstructionAs a percentage of non-outsourcing responses
Less than 1 hour
1-2 hours
2-5 hours
5 hours or more
12%
23%
7%
58%
Portfolio MonitoringAs a percentage of non-outsourcing responses
Less than 1 hour
1-2 hours
2-5 hours
5 hours or more
15%
21%
24%
40%
Investment Manager ResearchAs a percentage of non-outsourcing responses
Less than 1 hour
1-2 hours
2-5 hours
5 hours or more20%
26%
12%
42%
Portfolio ConstructionAs a percentage of non-outsourcing responses
Less than 1 hour
1-2 hours
2-5 hours
5 hours or more
12%
23%
7%
58%
Portfolio MonitoringAs a percentage of non-outsourcing responses
TIME SPENT BY ALL ADVISORS IN 2012
Investment Manager ResearchAs a percentage of non-outsourcing responses
Portfolio ConstructionAs a percentage of non-outsourcing responses
Portfolio MonitoringAs a percentage of non-outsourcing responses
19
Survey
19
1.
2.
3.
5.
Does your firm currently outsource its investment management
capability, including one or more of the following: investment
manager research, product selection, due diligence and ongoing
monitoring and management?
Yes
No (if no, direct respondents to the ‘no’ track)
If the respondent answered YES to question 1 they were directed to the
following questions Q2–Q16 below . If the respondent answered NO to
question 1 they were directed to the set of questions Q17–Q21 beginning
on page 20 . All respondents were asked the profiling questions .
Which of the following investment management activities does
your firm outsource? (Choose all that apply)
We outsource all investment management activities
We outsource just specific asset classes
We outsource all investment management-related back-office operations
We outsource just specific investment management-related back-office
operations (if you selected this please answer the following question)
Which specific investment management-related back-office
operations do you outsource? Please only answer if you outsource
just specific back-office operations. (Choose all that apply)
Portfolio operations Financial Planning
Performance reports Quarterly Billing
Statements Trading
Recordkeeping Account on-boarding, account data
Custody Services download and reconciliation
Other
Who is your firm’s primary outsourcing provider? (Choose one)
Adhesion Wealth Advisor Solutions
Brinker Capital
Curian Capital
Dorsey Wright
Envestnet | PMC
Fidelity
Fortigent
FTJFund Choice
If your firm outsources to multiple partners, please select the answer
that best explains your rationale. (Choose one)
We want client assets to be diversified
We haven’t found one firm that can meet all of our firm’s needs
Working with multiple firms is cost-efficient
Other
What level of customization does your primary investment
management outsourcing solution enable? (Choose one)
Limited customization—we have a selection of manager models
Hybrid—we manage one or more asset classes while others are
outsourced to third-party managers
Open architecture, which may include mutual funds, ETFs, equities,
SMAs, UMAs
What percentage of clients’ assets does your firm outsource?
(Choose one)
Less than 10%
11%–24%
25%–50%
51%–74%
75%–100%
Has outsourcing all or some of your investment activities resulted
in a change in fees charged to clients? (Choose one)
Fees have increased
Fees have decreased
There has been no change
Comment
Which of the following primarily drove the decision to outsource your
firm’s investment management? (Choose the top three that apply)
Access to separately managed account (SMA) expertise
Access to unified managed account (UMA) capability
Access to alternative investments expertise
Access to mutual funds expertise
Access to asset allocation models
The potential to generate alpha through best investment ideas
Portfolio construction
Portfolio monitoring
Overlay management
Access to managers we could not access on our own
Superior back-office technology and support
Performance reporting
Client profiling
Production of client proposals
Education and training
Marketing support
Practice management support
Other
Please indicate the importance of each to your firm when evaluating
and selecting an investment management outsourcing provider.
Flexibility (investment selection, managers,
portfolio construction, trading rules, pricing,
reporting options)
Pricing
Access to alternative investments
Access to CIO, analysts
Back-office support
Technology
Training
Support in growing my business (i .e ., via
marketing/recruiting/other business functions)
Compliance support
Philosophy/chemistry
Comment
8.
9.
10.
7.
Critical Important Not a factor
4.
6.
Genworth
Hanlon Investment Management
Lockwood Advisors
Loring Ward
Morningstar Managed Portfolios
Placemark Investments
SEI Advisor Network
Other
I n ve s tmen t Managemen t Ou t sou rc i ng : T he S ta t e o f t he A r t i n 201220
11. Please indicate the importance of each to your firm when now that you
are working with your investment management outsourcing provider.
Flexibility (investment selection, managers,
portfolio construction, trading rules, pricing,
reporting options)
Pricing
Access to alternative investments
Access to CIO, analysts
Back-office support
Technology
Training
Support in growing my business (i .e ., via
marketing/recruiting/other business functions)
Compliance support
Philosophy/chemistry
Comment
What has your decision to outsource investment management
achieved for your firm? (Choose all that apply)
Better investment results for clients
The ability to grow more efficiently
The ability to offer a wider array of investment products
The ability to develop a more consistent investment management
process for the firm
More time to spend with clients
Help with a specific product set
Support for tactical asset allocation
The ability to contain the expense and need for technology infrastructure
The ability to contain the expense of research staff
The ability to contain the expense of compliance
Institutional-level due diligence and monitoring
Superior tax management for clients
Other
What’s your level of satisfaction with your outsourcing solution?
(Choose one)
Very satisfied Dissatisfied
Satisfied Very dissatisfied
Which of the following has most negatively impacted your firm’s
outsourcing experience? (Choose one)
Poor investment performance Poor client service
Poor performance reporting Too expensive
Lack of communication Other
Which of the following has most positively impacted your firm’s
outsourcing experience? (Choose one)
Favorable investment performance
Good performance reporting
Strong client service
More time to focus on the business
Other
Which of the following factors determines whether your firm
will outsource the investment management of particular assets
or accounts? (Choose one)
Client account size
The investment products selected for the client
The need for tax efficiency
Other
If the respondent answered NO to question 1, they were asked to answer
this set of questions .
Which best describes the reason that your firm does not outsource
the investment management capability?
Our firm has assessed outsourcing and decided against it
Our firm considers investment research part of its value proposition
Our firm cannot justify the expense
Our firm wants to retain maximum flexibility
Our client mix doesn’t warrant it
Our firm has not found a solution that supports our business
Our firm is itself an advisory solutions provider
Our firm is currently considering outsourcing
Our firm is not currently considering outsourcing but has not ruled it out
Other
Which of the following needs to occur for your opinion on investment
management outsourcing to change? (Choose all that apply)
Our firm’s client base must grow substantially
Our firm’s assets under management must grow substantially
Today’s solutions need added capabilities such as alternative
investments or a broader selection of models
Today’s solutions need to be more affordable for our firm
Our opinion won’t change
Other
Apart from your firm’s decision not to outsource investment
management, what could you use outside help with today?
(Choose all that apply)
Access to broader investment options, including institutional-type
investment management research and strategies
Access to asset allocation models
Portfolio construction
Portfolio monitoring
Portfolio operations
Compliance
Superior back-office technology and support
Performance reporting
Client profiling
Production of client proposals
Education and training
Marketing support
Practice management support
Recruiting support
Other
Critical Important Not a factor
16.
12.
13.
14.
15.
17.
18.
19.
Do you use outside help for any of the following? (Choose all that apply)
Multi-manager mutual funds
Asset allocation models
Investment product analysis (e .g ., Morningstar)
Web-based practice management sites
Marketing agencies
I don’t use any outside help for these
Other
How much time per week do you estimate that your firm spends on:?
Investment manager research
Portfolio construction
Portfolio monitoring
These questions answered by all respondents .
Are you associated with any of the following?
Independent financial planning firm or investment advisory firm
Registered investment advisory firm
Regional broker-dealer
Bank
Other
Please indicate your firm’s current AUM. This information is
strictly confidential.
$50 million and under
$50 million–$150 million
$150 million–$500 million
$500 million–$1 billion
$1 billion and more
Which best represents the bulk of your firm’s revenues?
Asset-based fee
Commission
Combination of commission and asset-based fee
Hourly or planning fees
21
1 hour 1–2 hours 2–5 hours 5 or more hours
20.
21.
ABOUT ASSET MANAGEMENT AT NORTHERN TRUST
Finding the right financial partner is more important than ever
in helping your clients prepare for today and tomorrow .
Northern Trust is the asset management arm of Northern Trust
Corporation . Our client base includes financial advisors,
analysts, investment management solutions providers and
institutional portfolio managers .
We employ an investment process—across all product
lines—that seeks to balance risk with return . Returns on the
investments we manage have always been framed in terms of
the risks we took and those we chose not to take . We provide
financial advisors access to a broad array of 100% no-load
mutual funds including multi-manager funds and managed
accounts solutions . Northern Trust’s size, scale and staff tenure
provide tangible benefits for you and your clients . Call our
financial intermediaries consulting group at 877-867-1259
to learn more .
www.northerntrustinvestments.com/outsourcing
IRS CIRCULAR 230 NOTICE: To the extent that this message or any attachment concerns tax matters, it is not intended to be used and cannot be used by a taxpayer for the purpose of avoiding penalties that may be imposed by law . For more information about this notice, see http://www .northerntrust .com/circular230 .
This material is provided for informational purposes only and does not constitute an offer of any security . Any opinions expressed herein are subject to change at any time without notice . Information state is believed to be reliable but its accuracy and completeness are not guaranteed . Past performance is not indicative of future returns . This information is general in nature and should not be construed as legal, investment or tax advice . Your own advisors should be consulted as to how this information affects your personal circumstances .
NOT FDIC INSURED | May lose value/No bank guarantee
NT
WPR
AO
UT
(10/
12)