
INVESTMENT MANAGEMENT COMMITTEE - Texas Documents/board_meeting_investment... · Mr. Balachandran...
50
INVESTMENT MANAGEMENT COMMITTEE March 2014
Transcript of INVESTMENT MANAGEMENT COMMITTEE - Texas Documents/board_meeting_investment... · Mr. Balachandran...

INVESTMENT MANAGEMENT COMMITTEE
March 2014


NOTE: The Board of Trustees (Board) of the Teacher Retirement System of Texas will not consider or act upon any item before the Investment Management Committee (Committee) at this meeting of the Committee. This meeting is not a regular meeting of the Board. However, because the full Investment Management Committee constitutes a quorum of the Board, the meeting of the Committee is also being posted as a meeting of the Board out of an abundance of caution.
TEACHER RETIREMENT SYSTEM OF TEXAS MEETING BOARD OF TRUSTEES
AND INVESTMENT MANAGEMENT COMMITTEE
(Mr. Barth, Committee Chair; Mr. Colonnetta; Mr. Corpus; Mr. Kelly; & Ms. Sissney,
Committee Members)
AGENDA
March 27, 2014 – 8:30 a.m. TRS East Building, 5th Floor, Boardroom
1. Consider the approval of the proposed minutes of the December 12, 2013 committee meeting – Todd Barth.
2. Receive the annual Internal Public Markets review – Chi Chai, Janis Hydak, David DeStefano, and Shayne McGuire.
3. Receive the annual Trading Management Group review – Bernie Bozzelli, Jaime Llano, and Jared Morris.
4. Receive report on proxy votes for which TRS' outside advisor provided no recommendation – Janis Hydak and Tim Wei.


Minutes of the Investment Management Committee
December 12, 2013
The Investment Management Committee of the Board of Trustees of the Teacher Retirement System of Texas met on December 12, 2013 in the boardroom located on the Fifth Floor of the TRS East Building offices at 1000 Red River Street, Austin, Texas. The following committee members were present: Todd Barth, Chair Joe Colonnetta David Corpus David Kelly Nanette Sissney
Others present: Chris Moss, TRS Trustee Janis Hydak, TRS Anita Palmer, TRS Trustee Dan Junell, TRS Dolores Ramirez, TRS Trustee Eric Lang, TRS Brian Guthrie, TRS Lynn Lau, TRS Britt Harris, TRS Scot Leith, TRS Ken Welch, TRS Denise Lopez, TRS Amy Barrett, TRS Hugh Ohn, TRS Carolina de Onís, TRS Mike Simmons, TRS Jerry Albright, TRS Sharon Toalson, TRS Thomas Albright, TRS Ann Fickel, Texas Classroom Teachers Association Jase Auby, TRS Derly Rivera, Austin Retired Teachers Association Mohan Balachandran, TRS Dr. Keith Brown, Investment Advisor Sylvia Bell, TRS Steven Huff, Fiduciary Counsel Grant Birdwell, TRS Steve Voss, Hewitt EnnisKnupp Ronnie Bounds, TRS Brady O’Connell, Hewitt EnnisKnupp Dan Herron, TRS
Mr. Barth called the meeting to order at 8:50 a.m. A quorum of the committee was present.
1. Consider the approval of the proposed minutes of the September 12, 2013
committee meeting – Todd Barth.
On a motion by Mr. Colonnetta, the committee approved the minutes of the September 12, 2013 meeting as presented.
2. Review Risk Management and Strategies – Jase Auby.
Mr. Auby described the investment risk group, including its mandate, composition, functions, accomplishments, and priorities. He explained key risk signals, including the process for detecting and responding to a potential bubble. Responding to a question from Mr. Barth regarding the Chinese market, Mr. Auby stated that TRS allocated a small percentage of the portfolio to China. He noted that, although the Chinese market was a major contributor to global equity growth, as an emerging market it could be difficult to observe and penetrate. He confirmed for Mr. Kelly that the CUSUM tool would track the performance of a manager that had been terminated after receiving a “sell” rating. Per Mr. Barth’s request, Mr. Harris discussed currency hedging. Mr. Auby confirmed for Dr. Brown that the portfolio currently factored in the

December 12, 2013 Investment Management Committee Minutes, Page 2 of 2
cost of currency hedging in calculating investment returns. Mr. Auby presented the new political risk model as one of the 2013 priorities. He explained for Mr. Colonnetta that the political risk model indexed statistical compilations of qualitative opinions gathered by external researchers. He also provided an update on the status and performance of the research and development investment portfolios. Concerning the 2014 priority for quantifying the value of trust liquidity, Mr. Kelly and Mr. Auby discussed refining quantitative data to determine what premiums should be received for liquidity.
3. Review Strategic Asset Allocation/Stable Value and Tactical Asset Allocation –
Mohan Balachandran.
Mr. Balachandran presented information about the asset allocation team. He described the strategic asset allocation group and its special opportunities initiative, the tactical asset allocation group, beta management group, and the market strategy development group. He said the key priority for 2014 would be the strategic asset allocation study. He presented the projected timeline for the study and stated that the final recommendation would be presented to the board in September 2014. Committee members generally concurred on the projected timeline.
Mr. Balachandran noted that in the slide "Strategic Asset Allocation – Current Situation" presented on page 6 of the committee meeting book, the GRS 30-year Asset Growth Rate should have read "4.1%" and the GRS 30-year Liability Growth Rate should have read "3.6%." In response to Mr. Barth’s question about asset smoothing, Mr. Guthrie explained the related methodology used.
The meeting adjourned at 11:15 a.m.
Internal Active Management
Chi Kit ChaiSenior Managing Director
March 2014

2
Agenda
Overview• TRS IMD Internal Active Management
Internal Actively Managed Equity Portfolios• TRS Investment Division
• IPM Organizational Chart
Market Update• Regional Returns
• Sector Returns
• Correlation
GBI Flagship• Investment Results
• Competitive Landscape
• Region and Sector Positioning
• Top Holdings and Overweights
• Fundamental Characteristics
• Performance Attribution
GBI Gold• Investment Results
GBI US High Quality• Investment Results
Trust-wide Initiatives
IPM Timeline
Accomplishments and Priorities
Summary
Appendix
3
TRS IMD Internal Active ManagementOverview
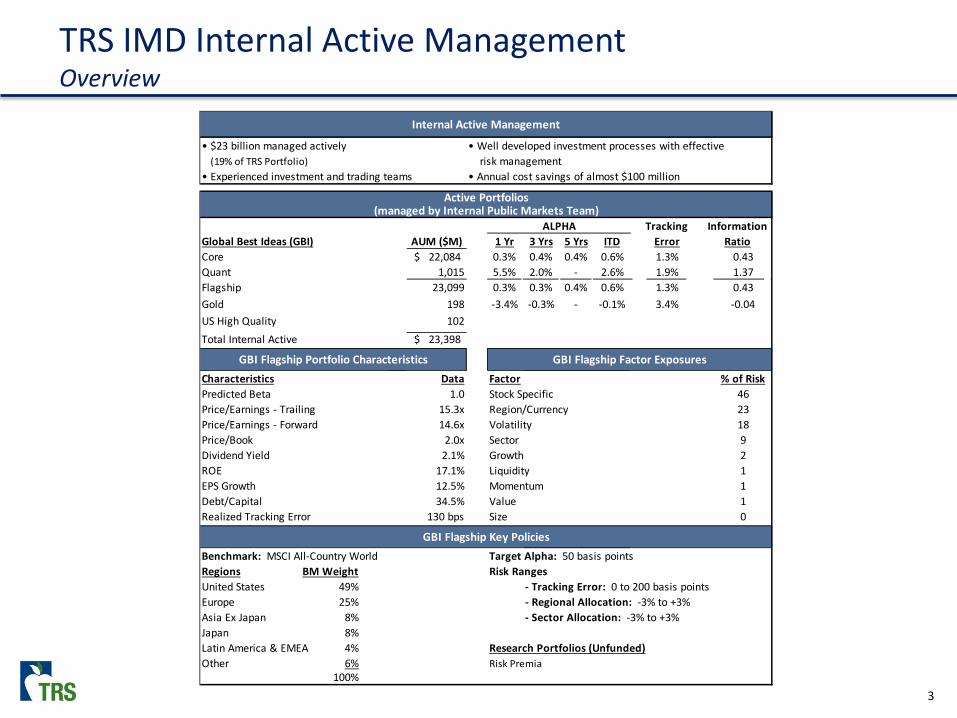
• $23 billion managed actively • Well developed investment processes with effective (19% of TRS Portfolio) risk management• Experienced investment and trading teams • Annual cost savings of almost $100 million
ALPHA TrackingGlobal Best Ideas (GBI) AUM ($M) 1 Yr 3 Yrs 5 Yrs ITD ErrorCore 22,084$ 0.3% 0.4% 0.4% 0.6% 1.3% 0.43Quant 1,015 5.5% 2.0% - 2.6% 1.9% 1.37Flagship 23,099 0.3% 0.3% 0.4% 0.6% 1.3% 0.43Gold 198 -3.4% -0.3% - -0.1% 3.4% -0.04US High Quality 102 Total Internal Active 23,398$
Characteristics Data Factor % of RiskPredicted Beta 1.0 Stock Specific 46Price/Earnings - Trailing 15.3x Region/Currency 23Price/Earnings - Forward 14.6x Volatility 18Price/Book 2.0x Sector 9Dividend Yield 2.1% Growth 2ROE 17.1% Liquidity 1EPS Growth 12.5% Momentum 1Debt/Capital 34.5% Value 1Realized Tracking Error 130 bps Size 0
Benchmark: MSCI All-Country World Target Alpha: 50 basis pointsRegions BM Weight Risk RangesUnited States 49% - Tracking Error: 0 to 200 basis pointsEurope 25% - Regional Allocation: -3% to +3%Asia Ex Japan 8% - Sector Allocation: -3% to +3%Japan 8%Latin America & EMEA 4% Research Portfolios (Unfunded)Other 6% Risk Premia
100%
GBI Flagship Key Policies
Internal Active Management
Active Portfolios(managed by Internal Public Markets Team)
RatioInformation
GBI Flagship Portfolio Characteristics GBI Flagship Factor Exposures

4
GBI Flagship, $23.1B , 19%
GBI Gold, $0.2B, 0%
GBI US High Quality, $0.1B, 0%
SPN, $6.0B, 5%
Passive, $22.9B, 19%
Real Assets, $14.6B, 12%
Private Equity, $13.4B, 11%
Hedge Funds, $11.4B, 9%
External Absolute
Return, $0.2B, 0%
External Equities, $28.8B, 23%
Emerging Managers, $0.8B, 1%
Risk, $0.1B, 0% Energy & Natural Resources, $2.1B, 2%
Internal Public MarketsInvestment Management Division as of December 31, 2013
Total Trust Value: $124 billion

5
Jeremy Aston Stacey Peot, CFA
Rich Campbell, CFA Marshall Reid, CFA
Mark Cassens, CFA Corina Scoggins, CFA
Richard Garchitorena, CFA KJ Van Ackeren, CFA
Marissa Hogan John Watkins
Kevin Lincoln, CFA Jackson Wu
Internal Public MarketsOrganizational Chart
Chi Kit Chai, CFAManagement Committee
Macro/Quant Research Portfolio Management Fundamental ResearchJanis Hydak, CFA David DeStefano, CFA Shayne McGuire
Mark Albert, CFA
Wayne Speer, CFA
Phillip Auth, CFA
Solomon Gold
Terri Krumnow
Monica Larson
Ralph Linn, CFA
Patrick Cosgrove, CFA
Kay Cuclis
Mark Albert, CFA
Lee Carter
GBI US High Quality GBI GoldGBI Quant GBI Core
• 16 CFA Charterholders • 15 Average Years of Experience • 28 MBAs/Other Graduate Degrees
GBI Flagship

6
Global Regional Returns
Source: MSCI
Annual Annualized

7
Global Sector Returns
Source: MSCI
AnnualizedAnnual

8
US Stock Correlation is Low
Source: Instinet, Quantitative Desk Strategies, “Why is there a flight now from active management?”, December 30, 2013

9
GBI QUANT
YearAUM
($ in millions)Investment Return
(%)Alpha
(bps)
2013 1,015 28.2 545
2012 547 18.6 245
2011 250 -8.4 -101
2010 182 14.2 158
20095 170 23.8 449
GBI Flagship (Core Plus Quant)Performance as of December 31, 2013
GBI CORE
YearAUM
($ in billions)Investment Return
(%)Alpha
(bps)
2013 22.1 23.1 162012 19.8 16.8 662011 17.6 -7.1 232010 19.0 12.8 92009 16.4 35.3 672008 12.1 -41.6 5920074 3.9 2.8 37
YearAUM
($ in billions)Investment Return
(%)Alpha
(bps)
2013 23.1 23.1 312012 20.4 16.8 652011 18.2 -7.3 72010 19.4 12.8 162009 16.7 35.4 772008 12.1 -41.5 722007¹ 3.9 2.8 43
GBI FLAGSHIP
Risk Metrics
Annualized
Investment Return
(%)Alpha
(bps)
Tracking Error2
Information Ratio3
1-Year 23.1 31 0.5% 0.63-Year 10.1 33 0.9% 0.45-Year 15.3 37 1.1% 0.3Since Inception¹ 3.4 56 1.3% 0.4
Notes Benchmark is MSCI All Country World¹Inception: December 20072Tracking Error: annualized standard deviation of monthly excess returns3Information Ratio: annualized excess returns/tracking error4Inception: December 20075 Inception: June 2009
GBI FLAGSHIP

10
GBI Flagship Competitive Landscape
Launched
Only 5% have 6 Years of Consecutive Alpha
Source: eVestments
6th Largest Global Fund
0
10
20
30
40
50
60
Fran
klin
Res
ourc
es, T
empl
eton
Capi
tal R
esea
rch
New
Per
spec
tive
Baill
ie G
iffor
d L
ong
Term
Glo
bal
Baill
ie G
iffor
d G
loba
l Alp
ha
Capi
tal R
esea
rch
New
Wor
ld F
und
TRS
GBI
Fla
gshi
p
OFI
Glo
bal E
quity
IVA
Dive
rsifi
ed G
loba
l
Artis
an P
artn
ers G
loba
l Val
ue
M&
G G
loba
l Div
iden
d Fu
nd
Ten Largest Actively Managed Global Funds, AUM ($ Billions)
72%
48%
22%18%
12%
5%
0%
10%
20%
30%
40%
50%
60%
70%
80%
90%
100%
1 yr. 2 yr. 3 yr. 4 yr. 5 yr. 6 yr.
Percentage of Global Equity Funds Outperforming Their Benchmarks in
Consecutive Years

11
GBI FlagshipPositioning
GBI Over/Under
Regions 2013 2012 2013 2012Asia Ex Japan 10.4% 12.6% 2.1% 2.8%Japan 9.8% 7.0% 2.0% -0.4%Europe 25.7% 24.1% 0.9% -0.1%EMEA & Lat Am 3.7% 5.7% -0.4% 0.3%Canada 2.7% 3.5% -1.0% -0.7%Australia/New Zealand 1.1% 2.5% -1.7% -0.9%United States 46.5% 44.7% -2.1% -0.9%
GBI Over/Under
Sectors 2013 2012 2013 2012Telecommunication Svcs. 5.8% 5.1% 1.7% 0.8%Consumer Discretionary 13.3% 10.6% 1.4% -0.1%Information Technology 13.5% 12.4% 1.0% 0.3%Energy 10.6% 11.2% 0.8% 0.6%Financials 21.5% 21.0% -0.1% -0.2%Industrials 10.6% 11.3% -0.3% 0.9%Materials 5.2% 7.7% -0.8% 0.1%Health Care 9.4% 9.0% -0.9% -0.3%Utilities 2.2% 3.2% -0.9% -0.3%Consumer Staples 7.6% 8.3% -2.2% -2.1%
Benchmark: MSCI ACWI -3% -2% -1% 0% 1% 2% 3%
Telecommunication Services
Consumer Discretionary
Information Technology
Energy
Financials
Industrials
Materials
Health Care
Utilities
Consumer Staples
-3% -1% 1% 3%
Asia Ex Japan
Japan
Europe
EMEA & Lat Am
Canada
Australia/New Zealand
United States
GBI 2013 GBI 2012

12
GBI FlagshipTop Holdings and Overweights as of December 31, 2013
CompanyMarket Value($ in millions)
Overweight(%)
BT Group 133.4 0.4Unitedhealth Group 148.4 0.4Metlife 130.8 0.4Tyco International 107.9 0.4Ameriprise Financial 109.0 0.4Capital One Financial 121.3 0.4Union Pacific 142.1 0.4Gilead Sciences 164.9 0.4Ace Limited 112.9 0.4Valeo SA 95.3 0.4
Deutsche Telekom 121.6 0.4The Boeing Company 151.0 0.4International Business Machines 212.9 0.4Total $1,751.5 5.2
CompanyMarket Value($ in millions)
GBI (%)
Benchmark(%) Difference
Apple 345.9 1.5 1.4 0.1Google 234.8 1.0 0.9 0.2Wells Fargo & Company 213.2 0.9 0.6 0.3International Business Machines 212.9 0.9 0.5 0.4Pfizer 192.3 0.8 0.6 0.3Toyota Motor 185.8 0.8 0.5 0.3General Electric 180.4 0.8 0.8 0.0Exxon Mobil 179.6 0.8 1.2 -0.5Vodafone Group 173.9 0.8 0.5 0.2Roche Holding 172.1 0.7 0.6 0.2Total $2,091.0 9.1 7.6 1.4
HOLDINGS
OVERWEIGHTS

13
GBI FlagshipPortfolio Characteristics as of December 31, 2013
GBI Flagship MSCI ACWIPortfolio Characteristics 2013 2012 2013 2012
Valuation Metrics
Market Capitalization $87.9B $77.3B $86.5B $74.9B
Price/Earnings – Trailing 15.3x 13.5x 15.7x 13.9x
Price/Earnings – Forward 14.6x 12.6x 15.3x 13.1x
Price/Book 2.0x 1.7x 2.0x 1.7x
Dividend Yield 2.1% 2.7% 2.3% 2.8%
Quality Metrics
Estimated 3-5 Year EPS Growth 12.5% 11.3% 11.7% 10.6%
Return on Equity 17.1% 18.0% 16.6% 17.6%
Long-Term Debt/Capital 34.5% 31.5% 34.0% 32.6%
Risk Metrics Beta 1.0 1.0 1.0 1.0

14
GBI FlagshipPerformance Attribution and Risk
LaunchedGBI Relative Performance and RiskAnnualized
2013 2012 2011 2010 2009 2008 2007 Cumulative 3-Year ITDAlpha Attribution (bps)
Stock 62 33 (7) (10) 27 6 41 243 37 35 Region (33) 37 5 21 49 17 1 116 (9) 16 Sector 2 (5) 9 5 1 49 1 33 5 5 Total 31 65 7 16 77 72 43 392 33 56
Risk Factors (%) Stock Specific 46% 46% 33% 32% 49% 53% 52% 43% 42% 43%Region 23% 31% 34% 34% 14% 5% 7% 24% 29% 24%Sector 9% 11% 21% 14% 12% 9% 5% 13% 14% 13%Volatility 18% 4% 7% 12% 7% 2% 7% 8% 9% 8%Momentum 1% 7% 4% 5% 13% 22% 13% 9% 4% 9%Growth 2% 1% 0% 2% 3% 2% 3% 2% 1% 2%Value 1% -1% 0% 0% 0% 3% 6% 1% 0% 1%Size 0% 0% 0% 0% 0% 1% 0% 0% 0% 0%Leverage 0% 1% 0% 0% 2% 3% 5% 1% 0% 1%Liquidity 1% 1% 0% 1% 0% 0% 1% 0% 1% 0%Total 100% 100% 100% 100% 100% 100% 100% 100% 100% 100%
Source: FactSet and Barra
15
GBI GoldPerformance as of December 31, 2013
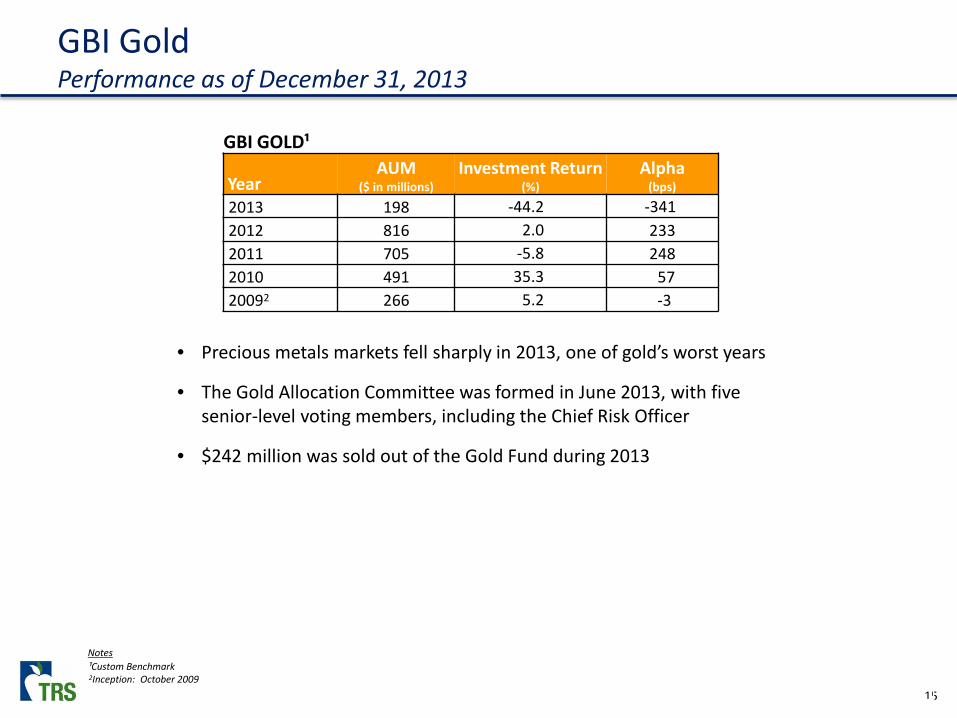
GBI GOLD¹
YearAUM
($ in millions)Investment Return
(%)Alpha
(bps)
2013 198 -44.2 -3412012 816 2.0 2332011 705 -5.8 2482010 491 35.3 5720092 266 5.2 -3
Notes¹Custom Benchmark2Inception: October 2009
• Precious metals markets fell sharply in 2013, one of gold’s worst years
• The Gold Allocation Committee was formed in June 2013, with five senior-level voting members, including the Chief Risk Officer
• $242 million was sold out of the Gold Fund during 2013

16
GBI US High QualityPerformance as of December 31, 2013
Notes1Inception: July 2011
GBI US HIGH QUALITY
YearAUM
($ in millions)Investment Return
(%)
2013 102 31.3
2012 99 17.3
20111 100 -4.8
• Performance since inception has been in line with peers
• Outperformed four out of five peers in 2013

17
Trust-wide Portfolios and InitiativesPaper portfolio
Alternative Risk Premia – Equity Names: collaborative project with Asset Allocation, part of the larger Alternative Risk Premia Multi-strategy
• Created a long short equity portfolio of alternative risk premia: Value, Momentum, and Quality
• Launched in paper form October 1, 2013
• Benchmark: MSCI World
Research
Selection Alpha: collaborative project with Asset Allocation, External Public Markets, and Strategic Partnership Research
• Began project to create a long only portfolio that combines the active weights of External US Large Cap Managers
• Benchmark: MSCI USA
Funded R&D portfolios
US High Quality: collaborative project with Asset Allocation and External Public Markets
• Defined the quality factor: Return on Equity (ROE), Gross margin, Intangible Assets as a percent of total assets (proxy for franchise value), and Beta to bond spread returns (Core – High Yield)
• Created quant portfolio that best expresses the TRS Quality factor
• Launched July 1, 2011, at $100 million
• Benchmark: MSCI USA
Low Vol With Overlay: collaborative project with the Risk Group
• Combined Low Vol Factor Portfolio with Put Selling Risk Premium
• Optimized Quantitative portfolio
• Launched January 1, 2013, at $100 million
• Benchmark: MSCI USA

18
IPM Timeline

19
IPM Accomplishments and Priorities
2013 Accomplishments
Developed a road map for the GBI 2017 vision
Expanded the Quant platform to $1 billion in size
Developed a process for the GBI Alpha Opportunity platform
Launched a 130/30 R&D US REIT Strategy
Developed an IPM Bulletin to keep the IMD informed about GBI positioning
Researched and reported on Deleveraging and asset class performance
Researched and reported on China
2014 Priorities
Strengthen the relationship with GBI Alpha Opportunity deal sourcing partners
Execute Quant platform expansion according to IPM 2017 goals
Extend the 130/30 strategy to other sectors and/or regions of GBI
Coordinate with Asset Allocation on Selection Alpha portfolios
Develop an analyst training and valuation program to transition early stage career investment professionals to mid-career
Define, develop and launch a next-generation leadership program within IPM
Streamline critical processes – 20% team productivity increase, modify email system – 50% reduction in non-critical emails, streamline research expenses – 20% savings on current research expenses

20
SummaryInternal Active Equity Portfolio Management
• GBI has produced alpha for six consecutive years
o Annualized alpha since inception of 56 basis points (above 50 basis points target)
o GBI has fulfilled its role in the overall strategy of the Fund
o GBI Quant has produced 262 basis points of alpha since inception and is growing in size
• Other Internal Portfolios have met Trust goals
o Gold: providing diversification
o US High Quality: tactical and providing diversification
• Collaboration across the IMD is effective and increasing
• IPM 2017 Plan is on track
o GBI Quant expansion is underway
o GBI Alpha Opportunity platform is up and running

APPENDIX

22
GBI Flagship STAR Report

23
GBI Gold Fund STAR Report


Trading Annual Review
Bernie BozzelliSenior Director
March 2014

2
• Mandate
• Team Profile
• Who We Serve
• Trading Partner Network
• Broker Certification
• Equity Trading Performance
• Special Topic: Foreign Exchange Benchmarking
• Corporate Action Opportunities
• Futures Rolls
• 2013 Priorities Update
• 2014 Priorities
• Appendix

3
Trading Mandate
Implementation
• Outperformed the median equity trading desk by six basis points in 2013, retaining $18.2 million of TRS alpha which placed TRS in the first quartile versus our peer universe. TRS trading has placed in the first quartile in four of the last five years
• Global execution across multiple asset classes including equities, futures, forwards, foreign exchange, and CDX
• Manage a global network of 47 brokerage firms
• Monitor key variables that contribute to trading include volatility, liquidity, and market structure
• Multi-asset execution totaled $249 billion for 2013 including $32 billion in Equities, $176 billion in Futures/Derivatives and $41 billion in Foreign Exchange
Index Management
• Passive Management
• Approximately $2 billion in Large Cap Value, Large Cap Growth, Small Cap, EAFE+Canada, and Emerging Markets
• Benchmark indices are fully replicated in the portfolio in real-time to achieve tight tracking error and in-line performance
Market Intelligence
• Collaborate across the division to provide implementation solutions. Work with Asset Allocation, IPM and EPU to develop optimal implementation strategies
• Examples include assessing the market impact of a trade, transition management between external managers, short-term technical model to aid in the timing of execution, Foreign Exchange (FX) hedging analysis, Options Analysis, Credit Default Swaps (CDX), and value added analysis of Corporate Actions
• Developed a systematic framework allowing TRS to invest directly in commodity futures
• Commission Management

4
Trading Team Bernie Bozzelli, CFASenior DirectorMPA, Accounting, UT Austin19 years TRS
Jaime LlanoUS Equity, Futures and Currency BS, Finance, UT AustinMBA, Finance, St. Edwards 9 years TRS15 years experience
Demetrius PopeGlobal Equity - EuropeBBA, Sam Houston7 years TRS13 years experience
Jared Morris, CFAUS Equity and FuturesBBA, Accounting, Texas A&MMS, Finance, Texas A&M3 years TRS8 years experience
Scott MooreGlobal Equity - AsiaMBA, Thunderbird University10 years TRS36 years experience
Steve PetersonUS Equity and Fixed Income MBA, California LutheranUniversity6 years TRS19 years experience
Pat BarkerTrading Analyst25 years TRS37 years experience
Babette RuizTeam Support3 years TRS16 years experience
3 MBA’s2 CFA’s1 Masters of Accounting1 MS, Finance20 Years Average Experience

5
Who We Serve Cross-Divisional Collaboration
TradingPE/RA
ASSET ALLOC./RISK
IPM
Total fund / quant strategies rebalancingStrategic Beta – Equity and Fixed Income Index fundsImplementation through derivatives markets and position management
Global execution offundamental and quantitative equity strategiesCorporate Action analysis
Transition Management between external managers and TRSPre- and Post-Trade analysis
Stock DistributionLiquidation Strategies
Equities$32.3B
traded in 2013Futures/
Derivatives$176.1B traded in
2013
Transactions in public markets with customized implementation
strategies across profit centers Foreign Exchange
$40.7B traded in
2013
Value Creation for TRS
MembersENR
EPU
Market Intelligence

6
Trading Partner Network
4 Firms• Deliver focused and high capacity relationships globally and across all asset
classes• Highly integrated with TRS trading, risk management, administrative systems, etc.• Leading providers of investment services – TRS is a preferred client, receiving the
highest level of service available
6 Firms• Well established firms with overall world class global services capabilities• World renowned for research and technology• Best-of-breed product process development
28 Firms• Includes firms who have a specialty in finding liquidity for hard-to-trade names or
firms who have a niche in electronic trading• Firms who have a core competency of trading internationally in particular regions
are also included
9 Firms• All newly approved firms doing business with TRS
Premier (40-60%)3-5 Firms
Core (20-30%)5-10 Firms
Execution (20-30%)15-30 Firms
Pilot(1-10%)
5-10Firms
7
Broker Certification Process
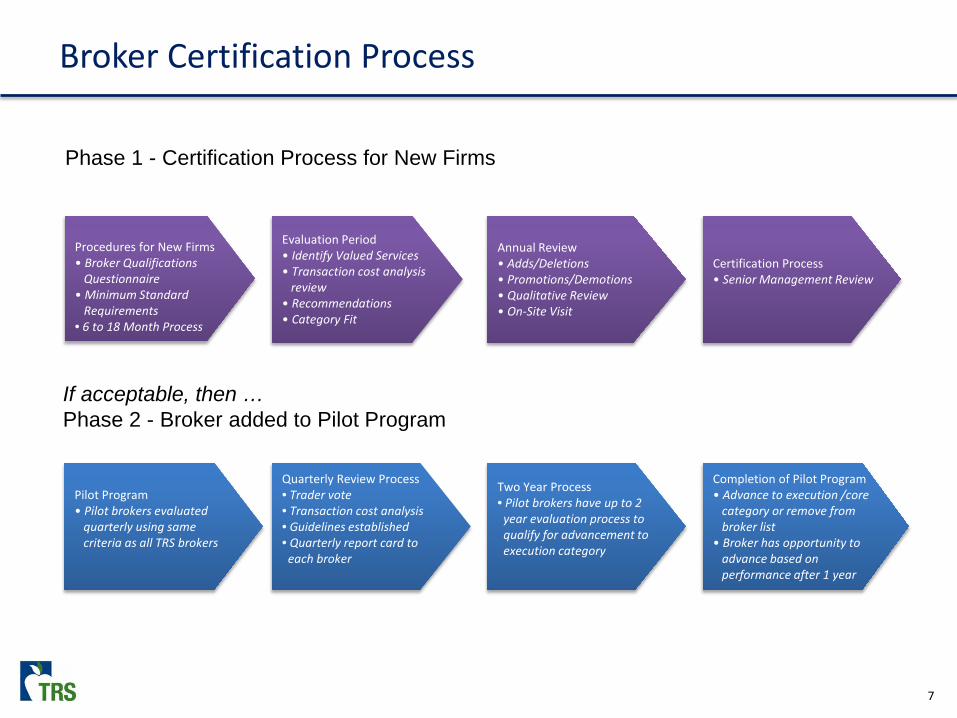
Phase 1 - Certification Process for New Firms
Procedures for New Firms• Broker Qualifications
Questionnaire• Minimum Standard
Requirements• 6 to 18 Month Process
Evaluation Period• Identify Valued Services• Transaction cost analysis
review• Recommendations• Category Fit
Annual Review• Adds/Deletions• Promotions/Demotions• Qualitative Review• On-Site Visit
Certification Process• Senior Management Review
If acceptable, then …Phase 2 - Broker added to Pilot Program
Pilot Program• Pilot brokers evaluated
quarterly using same criteria as all TRS brokers
Quarterly Review Process• Trader vote• Transaction cost analysis• Guidelines established• Quarterly report card to each broker
Two Year Process• Pilot brokers have up to 2year evaluation process to qualify for advancement toexecution category
Completion of Pilot Program• Advance to execution /core
category or remove from broker list
• Broker has opportunity toadvance based on performance after 1 year

8
Equity Trading Performance
1Q13 2Q13 3Q13 4Q13 2013 2012
TRS Performance vs. Post Trade Ace (bps) 9 8 15 -10 2 5
Median Desk Performance vs. Post Trade Ace (bps) -3 -4 -4 -4 -4 -3
TRS vs. Median Desk (bps) 12 12 19 -6 6 8
TRS vs. Median Desk ($ in millions) $7.8 $6.9 $10.3 -$6.8 $18.2 $29.3
1st Quartile Desk Performance vs. Post Trade Ace (bps) 2 1 2 1 2 3
TRS vs. 1st Quartile Desk (bps) 7 7 13 -11 0 2
TRS Quartile Placement 1st 1st 1st 3rd 1st 1st
• The total equity trading cost for 2013 includes $45 million in market impact (16 bps) and $39.3 million in commissions and fees (12 bps)
• How is trading measured?
• Consistently outperformed the peer median and has placed in the first quartile in four of the last five years
• Every order is measured versus the order arrival price and adjusted by ITG/Plexus’ Post Trade Ace benchmark in order to account for current market conditions
• Trading’s benchmark-adjusted performance is then compared to the benchmark-adjusted performance of its peers
*Source: ITG/Plexus
*ITG/Plexus is the leading independent transaction cost provider. Their client base entails the largest peer universe compared to their competitors.

9
Special TopicForeign Exchange Benchmarking
Foreign Exchange (FX) Dealers manipulate a global wide used FX benchmarkIn the last 6 months, reports have shown bank dealers suspected of colluding to manipulate the “Fix”, which is aglobal wide benchmark used by many institutional investors. This rate is marked at 4pm London time
BackgroundGlobal Equity indices utilize the Fix to value international holdings. Therefore, investment institutions trade aroundthis benchmark to minimize their tracking error. However, the costs can be much higher than trading at other times
Who uses the Fix and why• MSCI, FTSE, JPMorgan Bond Indices and Central Banks• Valuation purposes• $3.6 trillion in funds that track international Indices
How is the FX market changing?• Investors are moving away from focusing the majority of their flow at the Fix• Russell Investment Group is advising its clients to avoid the Fix where possible • Banks are no longer sharing client flow
How does this issue impact TRS?Many years ago, TRS Trading identified that the price action around this benchmark was not beneficial to the fund. TRS avoids this problem by executing their FX trades at points with high liquidity and non-event periods
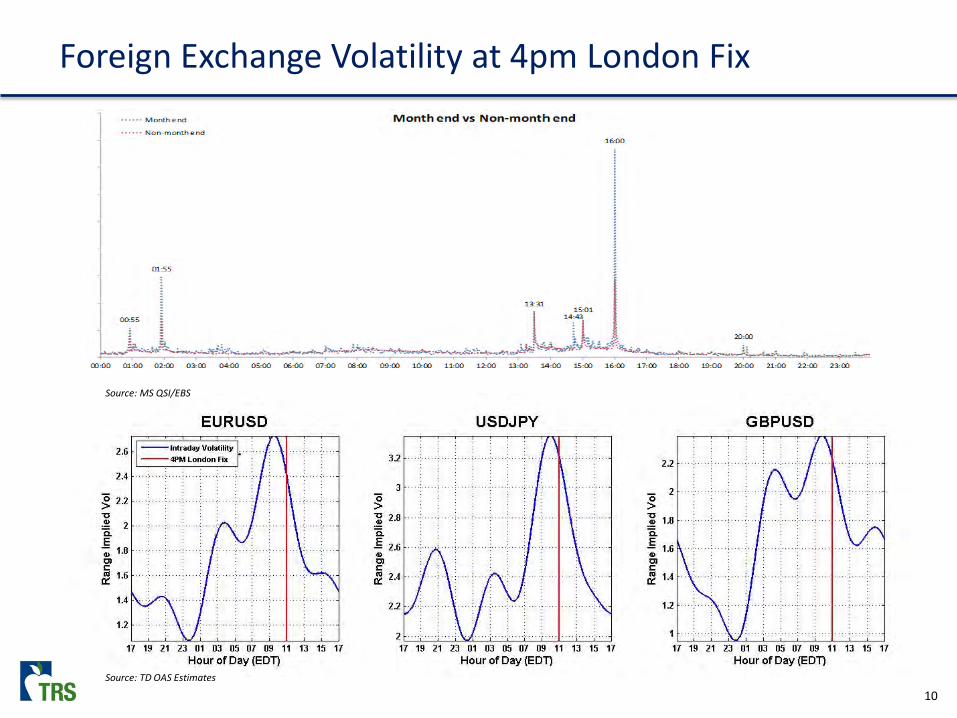
10
Foreign Exchange Volatility at 4pm London Fix
Source: TD OAS Estimates
Source: MS QSI/EBS

11
Special Topic: Corporate Action OpportunitiesPfizer Inc. (PFE) Spinoff of Zoetis Inc. (ZTS)
• Unique Situation – In May 2013, PFE announced a spinoff of ZTS and offered a 10% discount, subject to proration, to PFE shareholders willing to tender their shares away for shares of ZTS
• TRS Position – TRS was in the advantaged position of already being a long holder of both PFE and ZTS
• The Trade – Liquidate TRS position in ZTS and replace it with ZTS shares at a 10% discount by tendering shares of PFE
• Execution – Trade was implemented successfully and $656,090 of relative value was created

12
Special Topic: Corporate Action Special SituationsKinder Morgan Inc. (KMI) Warrants
• Trade value add through collaboration with Asset Allocation

13
2014 PriorityFutures Rolls
GOAL – Generate alpha for fund by achieving superior prices during the “rolling” of futures contracts
• Futures Roll – The “rolling” of a futures contract is an ongoing function in the normal course of business. It occurs from the need to move out of an expiring futures contract and into the next, most liquid contract, in order to maintain a constant level of exposure. The “roll” itself is the spread in price between two futures contracts with the same underlying but different expiration dates
• Supply/Demand – A major reason Example: Chart of December-January S&P 500 Rollmovements in the price spread between an expiring contract and next most liquid futures contract occur is because of imbalances between the total size of long and short positions engaged in “rolling” their positions to maintain exposure
• Alpha – Source of projected $3 million alpha to come from enhancing the quality of an ongoing process that occurs in the normal course of business. In 2013, TRS traded over $61 billion in rolls

14
2014 PriorityFutures Rolls
• How to Accomplish Goal – The strategy for achieving the stated goal is to maximize the value of knowledge and experience available from TRS trading relationships through creating a system to efficiently aggregate and measure views on timing and execution of “rolling” futures. These relationships consist of experienced professionals whose opinions are uniquely valuable as they are engaged in the markets and trade a majority of volume
• How to Measure Success: Example: Scoring for January Ibex Roll
Trading Relationships –Success can be measured through providing a standardized template and scoring system to evaluate effectiveness of opinions
TRS - Success can be measured by comparing executed prices to the average market price over the time period in which the most liquid days of theroll occur

15
2013 Priorities
# Priority Objective
1 Commission Restructure • Generated $3.3 million in savings through reduced commission rates on Derivatives
• Enhanced commission restructure throughout trading operation, focusing on futures and related products, Market On Close “MOC” orders, and algorithmic trading to lower cost
• Optimized commission schedule to reduce costs while generating appropriate levels of CSA to meet obligations
2 Advance Electronic Futures & FX Trading
• Implemented Bloomberg Tradebook platform to enhance the level of direct market interaction over futures trades
• Executed at a lower overall commission rate
3 Enhance Management of Treasuries/TIPS Index Fund in collaboration with Asset Allocation
• Developed a “Texas Way” analytic system for risk management, valuation and monitoring of Long Treasuries and TIPS
• Leveraged TRS’ network of investors to enhance internal fixed income capabilities
4 Re-Branding • Expanded understanding of the role and functions of the Trading group across the IMD through enhanced reporting and quarterly “Lunch & Learns”
• Conducted four Lunch & Learns on Transition Management and Passive Index Replication, The US Yield Curve – It’s More Than Just a Line, Foreign Exchange, and Futures
• Significantly improved and enhanced trade related reporting. See appendix for Trading Activity Report and Broker Report Card

16
2014 Priorities
# Priority Objective
1 Process Map/Cross Training • Develop detailed process maps for each major function of the Trading. Then, develop a rotational program where each trader will perform another trader’s responsibilities for a set period of time
• Process Improvement as part of the Division-wide 20% mandate: Doing what we do better
2 Futures Roll/Spread Trading Strategies
• Develop a systematic framework to evaluate quarterly/monthly future roll/spreads and develop trading strategies based on that analysis. Each month/quarter we will gather spread/roll outlooks from each of our executing brokers and monitor performance versus actual market spreads. We will use this collected information to help develop our trading strategy associated with rolling future positions
• Cost Savings: Our goal with this priority is to improve our execution with future rolls. We will analyze our roll/spread cost versus the average cost (VWAP) for each individual roll
3 Modify Email System • 50% reduction in non-critical emails

APPENDIX

27
Technical Analysis

1
To: Investment Management Committee of the Board of Trustees
From: Janis Hydak, Chair of the Proxy Committee
Copies: Board of Trustees Brian Guthrie, Executive Director Britt Harris, Chief Investment Officer
Date: March 19, 2014
Re: Exception Report for Vote on Proxy Items for which ISS Did Not Provide Recommendations
The TRS Proxy Voting Policy requires the Proxy Committee to report “exception votes” to the Board when a proxy item is voted for which the independent advisory service does not provide a recommendation. The report must document (1) the exception votes, (2) the reasons supporting each vote, (3) the number of shares voted, and (4) the date of each corporate meeting at which exception votes were cast. Such an exception vote will occur in March 2014. The details regarding that vote follow.
Exception Votes
Meeting For Preferred Shareholders of Banco Bradesco S.A.
Item 1. Elect Director Nominated by Preferred Shareholders
Item 2. Elect Fiscal Council Member(s) Nominated by Preferred Shareholders
Special Meeting Date: March 10, 2014
Shares Voted: 2,659,787
TRS Vote Instruction: FOR both Items 1 and 2

2
Rationale
Banco Bradesco, a Brazilian entity in which TRS held shares on the record date, is holding a separate meeting for preferred shareholders to vote on items for which they have voting rights. A separate meeting is a new process for Banco Bradesco. The new process allows preferred shareholders to present the names of their nominees up to the time of or at the meeting. ISS did not provide a recommendation because they did not have names of any nominees for director or the fiscal council prior to the date when international investors had to submit their voting instructions. The Proxy Committee decided to vote for both items for the following reasons. TRS’ primary interest in Banco Bradesco is that of a preferred shareholder. Brazilian law allows preferred shareholders to appoint one member to the board of directors and to the fiscal council, respectively, in a separate election. Candidates presented by preferred shareholders are generally independent nominees. Without independence from management, the board may be unwilling or unable to effectively set company strategy and scrutinize performance or executive compensation. Hence, the independence of directors tends to promote the interests of shareholders. The same reasoning applies to the fiscal council—independent nominees promote effective corporate governance.


