Investment Characteristics of Latin American Art by Jill Kreps
35
Investment Characteristics of Latin American Art by Jill Kreps An honors thesis submitted in partial fulfillment of the requirements for the degree of Bachelor of Science Undergraduate College Leonard N. Stern School of Business New York University May 2007 Professor Marti G. Subrahmanyam Professor Michael Moses Faculty Adviser Thesis Advisor
Transcript of Investment Characteristics of Latin American Art by Jill Kreps
Investment Characteristics of
Latin American Art
by
Jill Kreps
An honors thesis submitted in partial fulfillment of
the requirements for the degree of
Bachelor of Science
Undergraduate College
Leonard N. Stern School of Business
New York University
May 2007
Professor Marti G. Subrahmanyam Professor Michael Moses
Faculty Adviser Thesis Advisor
Latin American Art 2
Table of Contents
1 Abstract ................................................................................................................................... 3
2 Introduction ............................................................................................................................. 4
3 Art as a Good and an Asset: .................................................................................................... 5
3.1 Earlier Research in Art as an Investment ........................................................................ 7
3.2 Methodology and Data .................................................................................................. 10
4 Latin American Art Category ............................................................................................... 11
4.1 Return and Risk for Latin American Art ...................................................................... 13
4.2 Latin American Art Compared to Earlier Findings ...................................................... 16
4.3 The “Masterpiece” Effect and Other Findings .............................................................. 19
5 Latin American Art Index Compared to the Region ............................................................. 24
5.1 The Latin American Art Index and Major Regional Indices ........................................ 24
5.2 The Latin American Art Index and Foreign Direct Investment .................................... 27
6 Conclusions and Areas for Further Research ........................................................................ 32
Latin American Art 3
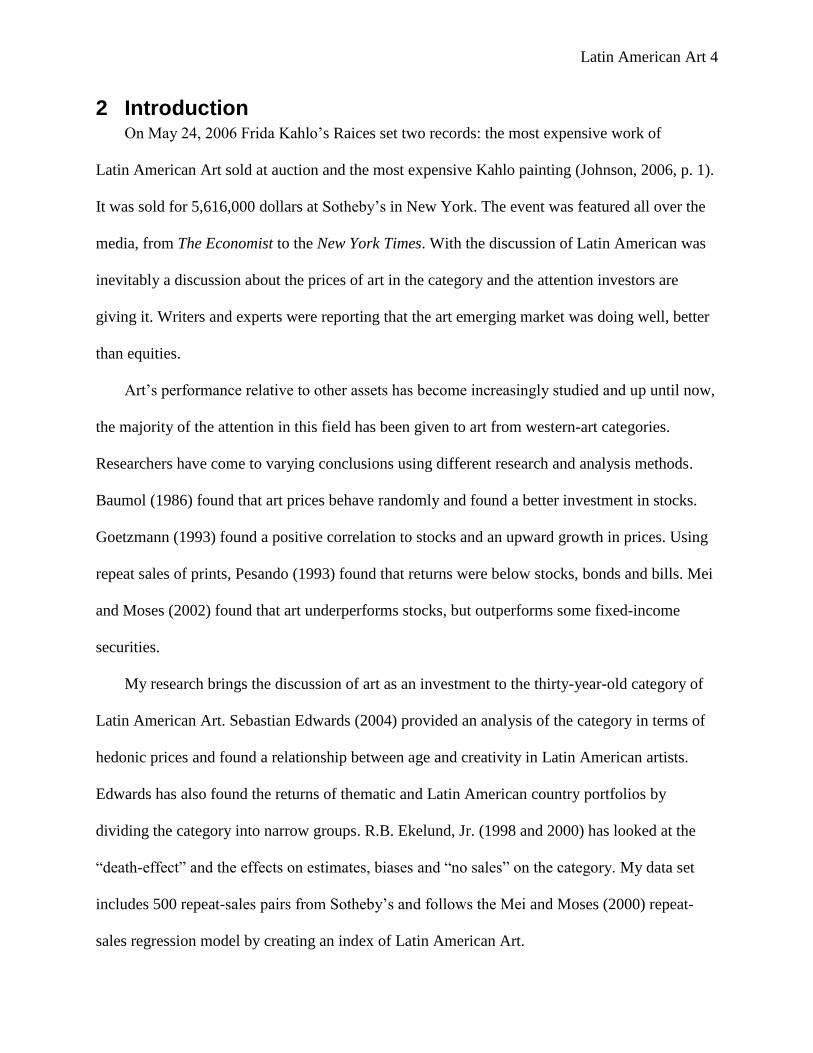
1 Abstract Latin American art as an investment is a growing area of interest which has the financial and
art markets discussing its value to an investor’s portfolio. 500 repeat-sale pairs of Latin
American art were collected from Sotheby’s auction catalogues and with purchase and sell
price information a Latin American art index was created. Index prices are increasing with
moderate compound annual returns; however returns from the art do not perform better than
the S&P500 and some of the regional indices in Latin America. The art index has lower
volatility than the regional markets which suggests that the index’s inclusion of art from
more than one country reduces risk for an investor investing in art not from his or her home
country.
Latin American Art 4
2 Introduction On May 24, 2006 Frida Kahlo’s Raices set two records: the most expensive work of
Latin American Art sold at auction and the most expensive Kahlo painting (Johnson, 2006, p. 1).
It was sold for 5,616,000 dollars at Sotheby’s in New York. The event was featured all over the
media, from The Economist to the New York Times. With the discussion of Latin American was
inevitably a discussion about the prices of art in the category and the attention investors are
giving it. Writers and experts were reporting that the art emerging market was doing well, better
than equities.
Art’s performance relative to other assets has become increasingly studied and up until now,
the majority of the attention in this field has been given to art from western-art categories.
Researchers have come to varying conclusions using different research and analysis methods.
Baumol (1986) found that art prices behave randomly and found a better investment in stocks.
Goetzmann (1993) found a positive correlation to stocks and an upward growth in prices. Using
repeat sales of prints, Pesando (1993) found that returns were below stocks, bonds and bills. Mei
and Moses (2002) found that art underperforms stocks, but outperforms some fixed-income
securities.
My research brings the discussion of art as an investment to the thirty-year-old category of
Latin American Art. Sebastian Edwards (2004) provided an analysis of the category in terms of
hedonic prices and found a relationship between age and creativity in Latin American artists.
Edwards has also found the returns of thematic and Latin American country portfolios by
dividing the category into narrow groups. R.B. Ekelund, Jr. (1998 and 2000) has looked at the
“death-effect” and the effects on estimates, biases and “no sales” on the category. My data set
includes 500 repeat-sales pairs from Sotheby’s and follows the Mei and Moses (2000) repeat-
sales regression model by creating an index of Latin American Art.
Latin American Art 5
This paper explores the investment characteristics of Latin American art and attempts to
answer the following questions: How does the Latin American category compare to other
categories explored? Does the art index show the effects of major political and economic events
in the Latin American region? How does the index compare the major indices of the home
countries? Is there a relationship in the trend of foreign direct investment in the home countries
and the prices of the index? What are some other investment characteristics the data exhibits?
3 Art as a Good and an Asset: Art as an economic good or a tangible asset is “an asset having physical existence” (Shim,
1995, p.326). Utility is defined as “A qualitative measure of the degree to which a good or
service satisfies human wants” (Moffat, 1983, p.311). In the Dictionary of Economics, an asset is
defined as “an economic resource having future earning potential” (Shim, 1995, p.18). Moffat
further divides assets into different categories, placing art in the nonliquids. “An example of a
nonliquid asset is an art treasure because there are relatively few potential buyers and converting
it to another form of asset would involve considerable effort and maybe a loss” (1983, p.12).
Applying these definitions to art, art provides utility to its owner in the form of consumptive
value, which is the enjoyment it brings to its owner. It also has a wealth value that owners wish
to leverage as a profitable asset.
Gerald Reitlinger (1961) wrote that the money value of art is “also a yardstick of taste”
(p.xi). Money value (prices) measures taste, fashion and interest in art and prices used in the
sample come from auction houses because prices in the art market tend to be non-transparent
especially when transactions take place between dealers and private collectors. The prices used
in this analysis have been settled in auction houses, Sotheby’s in particular, that use the English
auctioning system. Ashenfelter and Graddy described how prices are determined:
Latin American Art 6
Almost all art is auctioned in this ascending prices format. Bidding starts low, and
the auctioneer subsequently calls out higher and higher prices. When the bidding
stops, the item is said to be “knocked down” or “hammered down,” and the final
price is the “hammer price.” […] Sellers of individual items will set a reserve
price, which is usually secret, and if the bidding does not reach this level, the item
will go unsold. Auctioneers say that an unsold item has been “bought in.”(2003,
p.764).
Auction houses publish catalogues for each sale and provide information for each item
(lot) including medium, dimensions and provenance. Included with lot information are high and
low estimates provided by the specialists of the category. “The auction houses do commonly
observe an unwritten rule of setting the secret reserve price at or below the low estimate, but the
auctioneer is careful about revealing anything about the reserve price during the bidding process”
(Ashenfelter & Graddy, 2003, p.765). “Some sellers influence the low estimate; in particular,
they set a reserve price that is above the level that the auction house would choose” (Ekelund,
1998, p.40).
Later in this paper, Latin American art, through the use of the Latin American Art Index
(LAAI), is compared to some of the major indices from the Latin American region as well as the
S&P500. In 1986, Baumol described the differences between securities and arts:
First the inventory of a particular stock is made up of a large number of
homogeneous securities, all perfect substitutes for one another. Widely known
paintings and sculptures are unique, and even two works on the same theme by a
given artist are imperfect substitutes.
Latin American Art 7
Second, a given stock is held by many individuals who are potentially
independent traders on the near perfectly competitive stock market. The owner of
a Cranach or a Caravaggio holds what may be interpreted as a monopoly on that
work of art.
Third transactions in a given stock take place frequently, indeed, almost
continuously. The resale of a given art object may not even occur once in a
century.
Fourth, the price at which a stock is exchanged is, generally, public
information. The price at which an art is acquired is frequently known only to the
parties immediately involved […].
Finally, in the case of a stock we know, at least in principle, what its
“true” (equilibrium) price should be—it is the stock’s pro rata share of the
discounted present value of the company’s expected stream of future earnings.
But, for a work of art, who would dare to claim to know the true equilibrium
price? (p. 10-11).
This paper, along with earlier research done by others in this and related fields, reconciles these
distinctions through improved data collection and the regression model used which is discussed
below.
3.1 Earlier Research in Art as an Investment
The field of research in art as an investment got its initial attention from Gerald
Reitlinger (1961) who studied the value of certain artists’ art sold in London from 1760 to 1960.
He did this by creating exchange rates for different periods within the sample period. He stated,
Latin American Art 8
“For a picture truly to have retained its standing over the past two hundred years, it will have
multiplied its first price a hundred times over and more (p. xii-xiii).
William Baumol in 1986 concluded that art prices behave randomly. He revisited
Reitlinger’s data and found “a substantial number of cases in which a given work of art was
resold two times and more during a 300-year period” (p. 12). Baumol also found the rates of
return, on average, to be “remarkably low, they were also remarkably dispersed, meaning that
this form of investment was quite risky” (1986, p.13).
In 1993, William Goetzmann created an art return index expanding on Reitlinger’s data.
This allowed “a comparison of painting price movements to stock-market fluctuations, and also
an evaluation of the risk and return characteristics of art investment” (p. 1370). He created the
index using a repeat-sale regression and after comparing it to the London Stock Exchange, he
found a strong relationship; “evidence that the demand for art increases with the wealth of art
collectors” (Baumol, 1993, p.1370).
James Pesando (1993) explored the risk-return characteristics of art by looking at the
repeat-sales for modern prints. Pesando found “no evidence a masterpiece portfolio of higher-
priced prints will outperform the market as a whole. […] There is substantial price variation in
the contemporaneous sale of identical prints” (1993, p. 1088). He also found similarly to Baumol,
a low mean return as well as an underperformance compared to stocks, U.S. government bonds
and T-bills.
Art traded in London and modern prints had been the focus of the field up until Jianping
Mei and Michael Moses in 2000 explored the risk-return characteristics of art work traded in
New York for the categories, American, Old Master, Impressionist and Modern. By creating a
repeat-sales index, Mei and Moses found that their index underperformed the S&P500 and
Latin American Art 9
outperformed fixed income investments. They also found their index had a low correlation with
the S&P500 which suggested the importance of art in portfolio diversification. Similar to
Pesando’s (1993) masterpiece underperformance, Mei and Moses stated, “Our results on the
performance of masterpieces suggest that investors should not be obsessive with masterpieces
and they need to guard against overbidding” (2000, p. 1666).
The Latin American category was introduced into this area of research by Robert
Ekelund, Jr. (1998) who discussed the investment characteristics of art by focusing on estimates,
bias and “no sales” from 1977 to 1996. He found that for Latin American art, auction houses
overestimate the prices of oil-on-canvas art by 2.7 percent and “the higher the reserve price
relative to the true market value of the work, the greater the probability of a ‘no sale’” (Ekelund,
1998, p. 40). Then in 2000, Ekelund found a “death-effect” in art prices by examining twenty-
one deceased Latin American artists which revealed “that prices do increase substantially just
after death (but fall immediately thereafter)” (p. 295).
The most recent study in this category by Sebastian Edwards (2004) looked at the risk-
return of the Latin American art category from 1981-2000. He used hedonic prices to look at the
whole market then divided the market up into national portfolios, country portfolios based on the
artists’ home countries. Edwards also divided the category based on themes such as young artists,
female artists and traditionalists. Comparing the returns on art and return on the Morgan Stanley
Capital International (MSCI) World portfolio, Edwards (2000) found a low correlation using the
CAPM and a risk-free rate of a 3-month U.S. Treasury bill.
Latin American Art 10
3.2 Methodology and Data
The homogeneity of art, the transparency of prices and the infrequency of trading was a
concern of Baumol (1986) and many of the researchers discussed above have worked to mitigate
these weaknesses through repeat-sales and auction published data. I collected repeat-sale pairs
from the Watson Library in the Metropolitan Museum of Art. The sell information (most recent
price) of the repeat-sales pairs are derived from Sotheby’s New York catalogues with the
purchase information (earlier price) coming mainly from Sotheby’s New York and a few prices
from Sotheby’s London and Christie’s New York and London. Pairs with sell information from
Christies remain to be collected.
I collected data in the same fashion data was collected for the Mei and Moses art index.
“If a painting had listed in its provenance a prior public sale at any auction house anywhere, [I]
went back to that auction catalogue and recorded the sale price. […] Some paintings had multiple
resales over many years, resulting in up to [three] resales from some works of art. Each resale
pair was considered a unique point in [my] database that now totals over [500] entries” (Mei &
Moses, 2000, p.1657).
The compound annual returns for the underlying assets ranged from a loss of nearly 30
percent for Alicia Penalba’s Oiseau-Sirene, held from 1999 to 2001 and a gain of 86.67 percent
for Tomas Sanchez’s Meditacion en la Selva Ideal which was held from 1995 to 2000. Matta’s
The Disasters of Mysticism was the most expensive piece sold in the sample at 2,642,500 dollars.
There are auction intervals as short as 2 years and as long as 45 years, with an average of 11
years found. Study for Nude for "The Flowering" Panel (Chapingo Mural, Chapel, East Wall), a
Diego Rivera drawing, was the longest held piece in the sample for 45 years, purchased in 1961

Latin American Art 11
and sold in 2005.1 11 pieces were held for 2 years, some losing as much as 18 percent and others
gaining as much as 82 percent. 119 artists were included in the sample.
The database of over 500 entries contains contiguous data beginning in 1975 which
allowed me to begin the index in 1975. I created an index using a simplified repeat-sale
regression based on the regression used in Mei and Moses (2000).2 The response variable, y, in
the regression is the log of the sale price divided by the purchase price. Dummy variables were
used for βk to control for how long a piece of art was held. For example, if it was purchased in
1975 and sold in 1980, the dummy variable accounted for years 1976 to 1980, but not 1975 or
after 1980. From the regression, the index was created by setting the base year, 1975, to 1 and
each year thereafter was the previous year’s value times the current year coefficient, which is
produced by the regression. The regression formula used is below:
(1) y = β0 + β1x1 + β2x2 + … + βkxk + e
where: y = log of (sale price divided by purchase price)
β0 = No intercept was used because sample is too small.3
Βk = Coefficient created by the regression
x = 0 or 1; 1 if the piece of art was held in that year, 0 if it wasn’t
e = Standard error term
4 Latin American Art Category In 1977, Sotheby’s held its first Mexican Art auction. The category was then expanded in
1979 to include all Latin American art. Christie’s followed in 1980 with the beginning of its
Latin American auctions. In an interview with Maria Bonta de la Pezuela, vice president and
1 This piece, along with others that were purchased or sold before 1975, was left out of the repeat-sales regression
index. However with the addition of Christie’s repeat-sale pairs to the sample, it may be returned to the sample. 2 Index was created with the assistance of Professor Avi Giloni of the New York University Stern Business School.
3 Simplified regression was used because of small sample size. With the inclusion of Christie’s data, a more
complex regression, similar to the regression used in Mei and Moses (2000), could be used.
Latin American Art 12
specialist of the Sotheby’s Latin American Art department, the category has seen changes,
inclusions and exclusions of certain artists and certain regions, because of the “changes in
fashion” (personal communication, April 13, 2007). For an artist or region to be included in the
auction, specialists look to see if the artist has support in his or her local market. Bonta de la
Pezuela mentioned that some artists and regions may have come to auction in the earlier years,
but not longer are sold because the local market loses interest. Her example was the Haitian art
that was very active in the 1980s, but is not longer included in the category.
Some artists have markets in other categories besides Latin American art. Specialists
decide which category the piece should be sold in based on whether the artist’s main identity lies
with the country he or she is from or the style of art he or she works in. The Latin American
specialists sometimes “cross-market” a piece and work with specialists from other categories to
find the piece’s largest market. My Latin American Art Index includes data from 1975, but has
purchase information as early has 1943 because some pieces were sold earlier in other categories
such as the Modern and Impressionist sales. Bonta de la Pezuela discussed Roberto Matta as an
example of cross-marketing. While he is Chilean, he’s more of an impressionist artist; his work
is sometimes sold in the impressionist sales (M. Bonta de la Pezuela, personal communication,
April 13, 2007).
For investors, Maria Bonta de la Pezuela said risk is spread throughout the category
because, for example, uncertainty in Mexico does not affect Colombian artists’ art prices.
According to Bonta de la Pezuela, similar to financial markets, the Latin American art category
at Sotheby’s is affected by political and economic local events in the region. Bonta de la Pezuela
said if it is an election year in Mexico, Sotheby’s will not market Mexican artists to the same
Latin American Art 13
extent that artists from other countries are marketed because Mexican pieces won’t do as well as
they could (personal communication, April 13, 2007).
Initially the buyers were majority Latin American, only buying art from artists that came
from their own country. Mary-Anne Martin, creator of the Mexican and Latin American art
categories at Sotheby’s, wrote in 1998:
The audience at those first auctions tended to sit together in little groups
according to nationality. In the greatest numbers were the Mexicans, who bought
about 40 percent of the offerings. Another group was the Venezuelans, more "pan
Latin" in that they were interested in art from a variety of countries. For example,
a Venezuelan might buy a Mexican painting like a Rivera or a Tamayo, but a
Mexican would not buy a Reverón. The remaining Latin Americans bought art
from their own country only and failed to see any parallels with the art of close
neighbors. The Americans who did collect tended to favor Mexican art, with
which they were familiar from years of shared history […] (p.1).
Eventually, the buyers began buying art from other countries, which is where Bonta de la
Pezuela believes investors reduce risk. A Colombian purchasing Mexican art during an unstable
time in Colombia will mitigate the risk of the investor’s Colombian assets. In the November
2006 auction, more than 50 percent of the participants were American, which I believe will
change the effects local events have on prices since interest is no longer majority local. 4
4.1 Return and Risk for Latin American Art
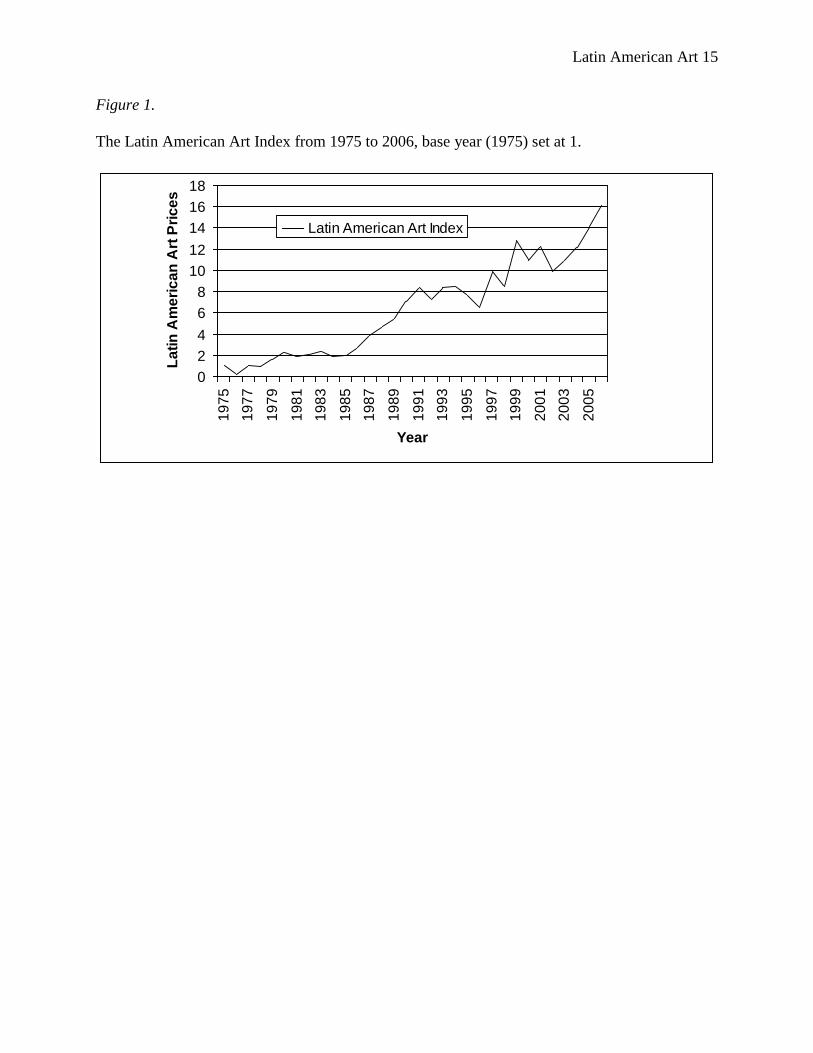
The created Latin American Art index (LAAI) has an adjusted R-square of 0.54. 54
percent of the art’s return variance is explained by the index. In Figure 1 below, a linear graph of
4 For confidentiality reasons, Sotheby’s does not provide seller and buyer information.
Latin American Art 14
the index shows the base year set to 1 and Latin American art prices increasing. The compound
annual return for the index is 9.42 percent; the mean annual return is 20.65 percent and a
standard deviation of 70.65 percent for years 1976 to 2006. The index has a moderate return and
a very high standard deviation; it is a very volatile. With the inclusion of Christie’s repeat-sale
pairs, I expect the compound annual return to be similar to its current value, but I expect the
volatility to decrease. This prediction is based on the earlier findings of Mei and Moses (2000)
which is discussed further below.
The pieces of Latin American Art, the index’s underlying assets, have a mean compound
average return of 8.73 percent and a standard deviation of 11.6 percent. The median return of the
500 pairs provided 7.63 percent return. The average auction interval (holding period) found for
the art is 11 years.
Latin American Art 15
Figure 1.
The Latin American Art Index from 1975 to 2006, base year (1975) set at 1.
0
2
4
6
8
10
12
14
16
18
19
75
19
77
19
79
19
81
19
83
19
85
19
87
19
89
19
91
19
93
19
95
19
97
19
99
20
01
20
03
20
05
Year
La
tin
Am
eri
ca
n A
rt P
ric
es
Latin American Art Index
Latin American Art 16
In comparing the index with what business periodicals and newspapers projected for the
Latin American art category, the data generally overlaps with the increases and decreases
anticipated. For example, in 1981, the Financial Times of London World Business Weekly found
interest in 19th
- and 20th
-century Latin American art had increased from 1977 to 1981. In Figure
1, from 1977 to 1981, there is an increase in prices.5 In 1991 the Wall Street Journal reported
Sotheby’s cancellation of the spring sale and the unevenness the market experienced because 28
percent of the pieces failed to sell in Sotheby’s fall sale. It is clear from Figure 1 that 1991 was
an irregular year.
1996 similarly shows a drop in Latin American art prices which Thane Peterson attributes
to the change in the Daily Telegraph Art 100 Index; it “fell 1.3% in 1996, largely because of
weak demand for Latin American art” (p.148). Figure 1 shows a 15 percent drop in the index
from 1995 to 1996. The positive feeling written in 2000 by Paul Sullivan for the Financial Times
does not present itself in the index (p.7). From 1999 to 2000, Figure 2 shows a drop, similar to
1996, of 15 percent. This sale was also the first one in which Sotheby’s introduced “its website
to sell Latin American art” (p.7). The projection might have been influenced on the Latin
American category earning a return of 51 percent in the previous year, 1999, a sharp increase
from the loss of 14 percent experienced in 1998.
4.2 Latin American Art Compared to Earlier Findings
Comparing my results with the results Edwards (2004) found through a hedonic pricing
model, I re-calculated the mean annual return for the index for the same sample period that
Edwards uses. See Table 1 for LAAI comparison to Edwards. “For the total portfolio and the
complete 1981-2000 period, the overall mean annual (real) return was a hefty 9 percent, with a
5 As noted above, increase in prices indicates an increase in interest.
Latin American Art 17
standard deviation of 12.6 percent” (Edwards, 2004, p.25). My index outperformed Edwards for
the same period with a 10.37 percent mean annual return, but was more volatile with a 23.81
percent standard deviation. This volatility and greater return could be do to sample size; my
sample includes 500 repeat-sale pairs whereas Edwards used 6,000 to 7,000 observations (2004,
p.8).6
Mei and Moses (2000) found for the categories of American, Impressionist and Old
Masters sold in Christie’s and Sotheby’s, a compound annual return of 8.2 percent and a standard
deviation of 21.3 percent, from 1950-1999. It wasn’t possible to re-calculate the compound
annual return for the LAAI in the same sample period because the category is much younger than
the categories observed by Mei and Moses. However, comparing the studies, my compound
annual return is higher but with much more volatile. See Table 1 below. This is could be due to
the sample size which is what Mei and Moses (2000) said created a less volatile portfolio when
they compared their index to Goetzmann (1993). “In comparison to Goetzmann’s findings, our
art index also has less volatility (and lower correlation with other asset class). This could be the
result of our larger sample, which makes our art index portfolio better diversified and less
volatile” (Mei & Moses, 2000, p. 1662).
6 Edwards (2004) uses a data set which includes international auctions; my data set is much narrower in scope.
Edwards also places a minimum of 35 works per artist sold to be included in his data set; there is no minimum in my
data set.
Latin American Art 18
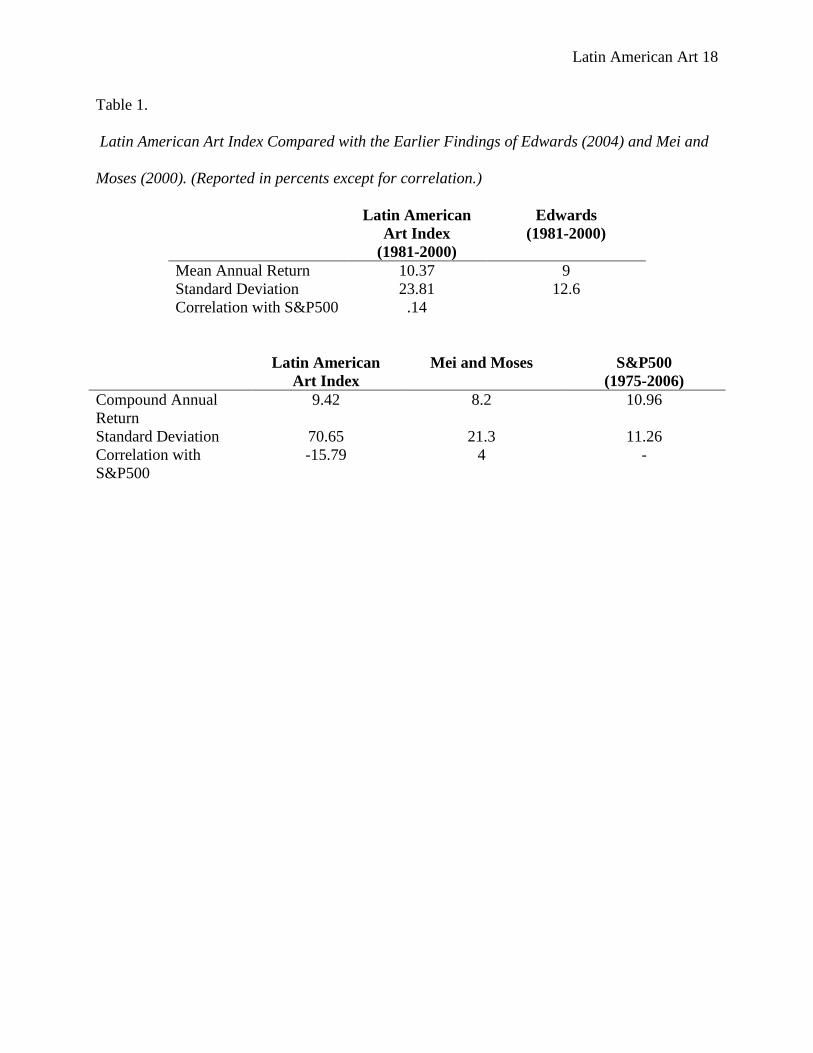
Table 1.
Latin American Art Index Compared with the Earlier Findings of Edwards (2004) and Mei and
Moses (2000). (Reported in percents except for correlation.)
Latin American
Art Index
(1981-2000)
Edwards
(1981-2000)
Mean Annual Return 10.37 9
Standard Deviation 23.81 12.6
Correlation with S&P500 .14
Latin American
Art Index
Mei and Moses S&P500
(1975-2006)
Compound Annual
Return
9.42 8.2 10.96
Standard Deviation 70.65 21.3 11.26
Correlation with
S&P500
-15.79 4 -
Latin American Art 19
I compared the Latin American Art Index to the S&P 500 because the art was sold in
New York and sold in dollars. Using a simple linear regression model, Formula 2:
(2) y = β0 + β1x + e
where: y = Latin America Index Return
β0 = Value of the Latin American Art Index when the S&P500 Index return is 0.
β1 = For every one unit change in the return of S&P500 Index, a corresponding change of
a unknown value (known once regression is run) will change in the Latin American Index
x = Value of S&P500 Index return for a given year
e = Standard error term
I found a negative correlation of -.158. This suggests that the Latin American art category and
American securities do not move together; they move in opposite directions which is favorable
for portfolio diversification. This finding is adds to what Mei and Moses found in 2000 regarding
portfolio management; “our study suggests that a diversified portfolio of artworks may play a
somewhat more important role in portfolio diversification” (p.1663).7 Mei and Moses found a
correlation between their art index and the S&P500 of .04. The S&P 500 outperforms the LAAI
from years 1975 to 2006. The S&P500’s compound annual return is 10.96 percent with a
standard deviation of 11.26 percent. See Table 1 above. This underperformance is consistent
with what Mei and Moses found for their index.
4.3 The “Masterpiece” Effect and Other Findings
Pesando (1993) and Mei and Moses (2000) found in their research that masterpieces
under perform. Edward Merrin, art dealer quoted in Pesando’s article, tells customers, “‘...it’s
always better to buy one $10,000 object than ten $1,000 objects, or one $100,000 object—if that
7 Mei and Moses (2000) also compare their index to the Dow Jones, government bonds, corporate bonds and T-Bills.
This comparison cannot be made for the Latin American Art Index as there is more than one country represented in
the sample.
Latin American Art 20
is what you can afford—than ten $10,000 ones’” (1993, p.1083). Pesando’s and Mei and Moses’
findings suggest lower prices paintings to the masterpieces based on compound average returns
compared to purchase prices of the underlying pieces of art. I was interested to see if this holds
true for Latin American art. See Figure 2 below.
Latin American Art 21
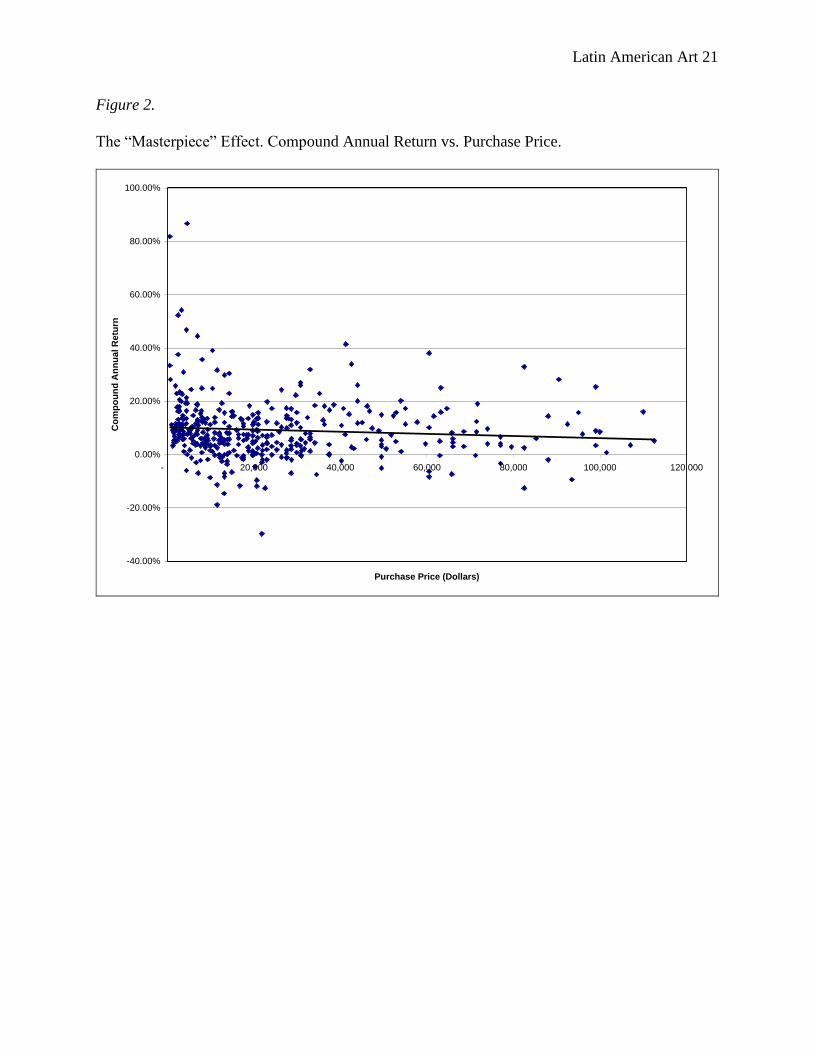
Figure 2.
The “Masterpiece” Effect. Compound Annual Return vs. Purchase Price.
-40.00%
-20.00%
0.00%
20.00%
40.00%
60.00%
80.00%
100.00%
- 20,000 40,000 60,000 80,000 100,000 120,000
Purchase Price (Dollars)
Co
mp
ou
nd
An
nu
al R
etu
rn
Latin American Art 22
From the scatter plot and trend line in Figure 2 above, a slight negative relationship exists,
but the line is nearly flat. This suggests that masterpieces do under perform and is consistent with
Pesando (1993) and Mei and Moses (2000) who also found larger returns are for lower priced
pieces. However, this sample is small so the trend line might move once the Christie’s
observations are added. I would expect a more negative relationship similar to Mei and Moses’
findings.
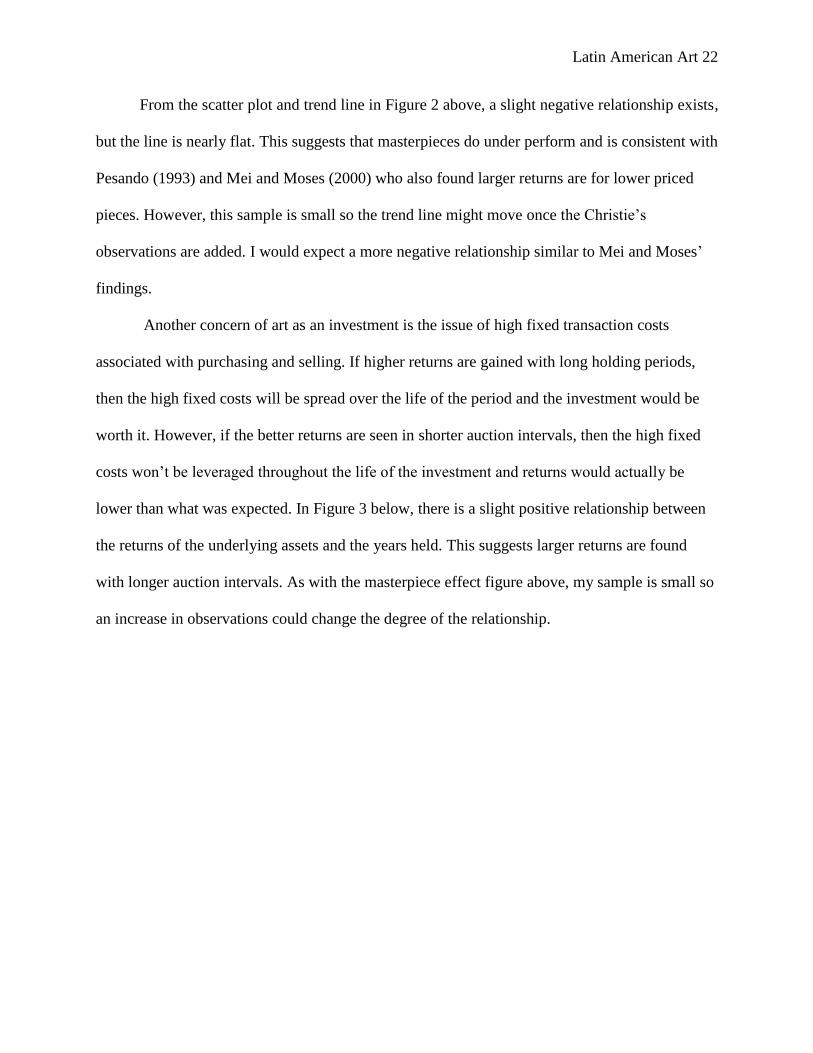
Another concern of art as an investment is the issue of high fixed transaction costs
associated with purchasing and selling. If higher returns are gained with long holding periods,
then the high fixed costs will be spread over the life of the period and the investment would be
worth it. However, if the better returns are seen in shorter auction intervals, then the high fixed
costs won’t be leveraged throughout the life of the investment and returns would actually be
lower than what was expected. In Figure 3 below, there is a slight positive relationship between
the returns of the underlying assets and the years held. This suggests larger returns are found
with longer auction intervals. As with the masterpiece effect figure above, my sample is small so
an increase in observations could change the degree of the relationship.
Latin American Art 23
Figure 3.
Compound Annual Return vs. Auction Interval
-40.00%
-20.00%
0.00%
20.00%
40.00%
60.00%
80.00%
100.00%
- 5 10 15 20 25 30 35
Aucation Interval (Years)
Co
mp
ou
nd
An
nu
al R
etu
rn
Latin American Art 24
5 Latin American Art Index Compared to the Region
5.1 The Latin American Art Index and Major Regional Indices
After comparing the index to the S&P 500 and finding a negative correlation, I expected
there to be a positive, high correlation between the returns of the index with the returns of the
major indices of the Latin American region based on the information from Bonta de la Pezuela
and Martin.8 Using data through Global Insight Financial Market Indexes, accessed through
Wharton Research Data Services, I ran a regression of the LAAI annual returns on the annual
returns of the indexes from Argentina, Brazil, Chile and Mexico.9 I used a similar formula to the
one used for the S&P500 regression. See Formula 3 below:
(3) y = β0 + β1x + e
where: y = Latin America Art Index return
β0 = Value of the Latin American Art Index when the Country’s Index return is 0.
β1 = For every one unit change in the return of the Country’s Index, a corresponding
change of a unknown value (known once regression is run) will change in the Latin
American Index
x = Value of the Country’s Index return for a given year
e = Standard error term
The following table provides the regression output between the LAAI and the major
indices.
8 The returns and standard deviations of the indices in the Latin American region follow the characteristics of an
emerging market. See below Table 2. 9 The data for the Bolsa de Valores Lima of Peru was incomplete.
Latin American Art 25
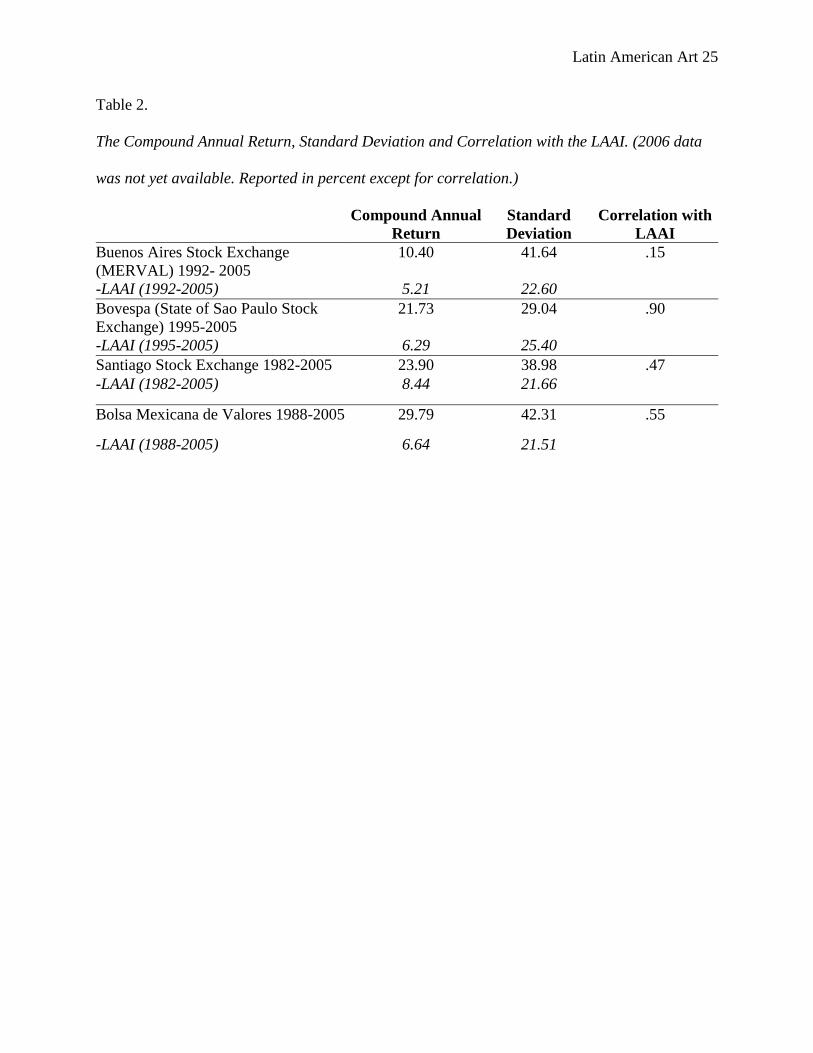
Table 2.
The Compound Annual Return, Standard Deviation and Correlation with the LAAI. (2006 data
was not yet available. Reported in percent except for correlation.)
Compound Annual
Return
Standard
Deviation
Correlation with
LAAI
Buenos Aires Stock Exchange
(MERVAL) 1992- 2005
10.40 41.64 .15
-LAAI (1992-2005) 5.21 22.60
Bovespa (State of Sao Paulo Stock
Exchange) 1995-2005
21.73 29.04 .90
-LAAI (1995-2005) 6.29 25.40
Santiago Stock Exchange 1982-2005 23.90 38.98 .47
-LAAI (1982-2005) 8.44 21.66
Bolsa Mexicana de Valores 1988-2005 29.79 42.31 .55
-LAAI (1988-2005) 6.64 21.51
Latin American Art 26
Only three of the four major indices have a correlation with the LAAI worth discussing.
See Table 2 above. The Bovespa in Brazil has a .90 correlation, the Santiago (Chile) Stock
Exchange has a .47 correlation and the Bolsa Mexicana de Valores has a .55 correlation with the
LAAI. This suggests that annual returns of the LAAI and of the Brazil’s, Chile’s and Mexico’s
indices have a positive relationship; this suggests buyers and sellers in the auctions are more
closely aligned with Latin America.
All the LAAI returns for the same sample periods of the regional indices underperformed
the four indices examined. However, the standard deviations of the LAAI for the same sample
period were lower which indicates the art from the region is a less volatile investment. Lower
volatility could be due to the multiple countries included in the LAAI. This corroborates with
what Maria Bonta de la Pezuela said about the participants and the risk they can defray if they
invest in artists that do not come from their own country or countries where they are heavily
invested in.
The lower volatility found in the sample periods of Table 2 also indicate that Latin
American art sold in New York was a riskier asset in years prior to 1982. The standard deviation
of the whole index is 70.65 percent. This suggests that there are large changes in return from
years 1975 to 1982. It will be interesting to see once Christie’s auction prices are included in the
sample whether or not volatility changes and whether or not there are large changes in the period
prior to 1982.
Since emerging financial markets show local events, the Latin American Art index should
then show local events of the Latin American region because of the strong relationships found
above. It should also show how multiple countries represented in the index lessen the effect of
Latin American Art 27
local event on the index because of the lower standard deviations found compared to the regional
indices. A few events are discussed below.
5.2 The Latin American Art Index and Foreign Direct Investment
The countries within the Latin American region that this paper focuses on are emerging
markets which are characterized by high returns with high volatility. “Probably the most relevant
definition of an emerging market is an economy whose political outcomes and uncertainties
(such as a presidential election or a cabinet reshuffle) tend to have high impacts on financial
variables and therefore on stock markets” (Martinez and Santiso, 2003, p.365). This definition
relates to Maria Bonta de la Pezuela’s comments above about Sotheby’s response it takes when
local events in Latin American are making markets volatile.
The Latin American art category, according to Bonta de la Pezuela should provide
reduced risk for an investor because of the variety of countries involved in the category. Using
FDI to follow the uncertainties in the emerging markets of Latin America and to see if the impact
of one country would affect the index to the same degree FDI flows were affected. I used FDI
flows from the United States into Argentina, Brazil, Chile, Colombia, Mexico, Peru and
Venezuela. I ran a regression using the data from the Economic Intelligence Unit, and found the
following correlations between the LAAI and the FDI flows. See Table 3 below.
Latin American Art 28
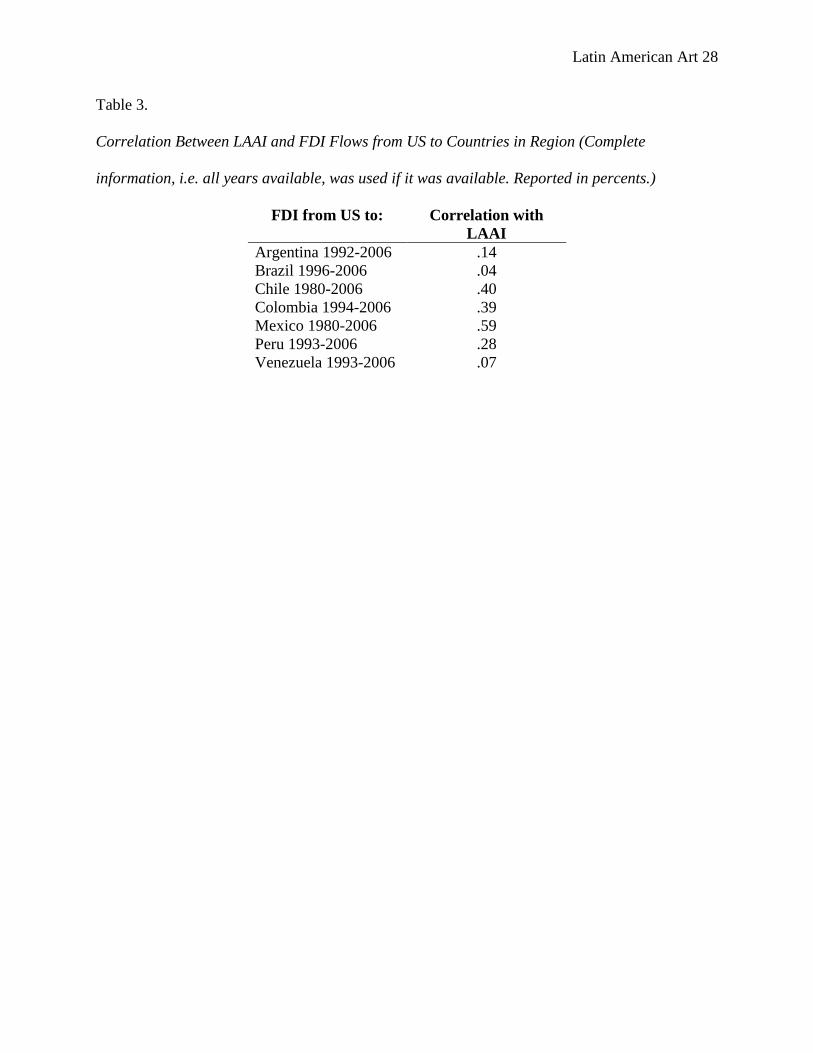
Table 3.
Correlation Between LAAI and FDI Flows from US to Countries in Region (Complete
information, i.e. all years available, was used if it was available. Reported in percents.)
FDI from US to: Correlation with
LAAI
Argentina 1992-2006 .14
Brazil 1996-2006 .04
Chile 1980-2006 .40
Colombia 1994-2006 .39
Mexico 1980-2006 .59
Peru 1993-2006 .28
Venezuela 1993-2006 .07
Latin American Art 29
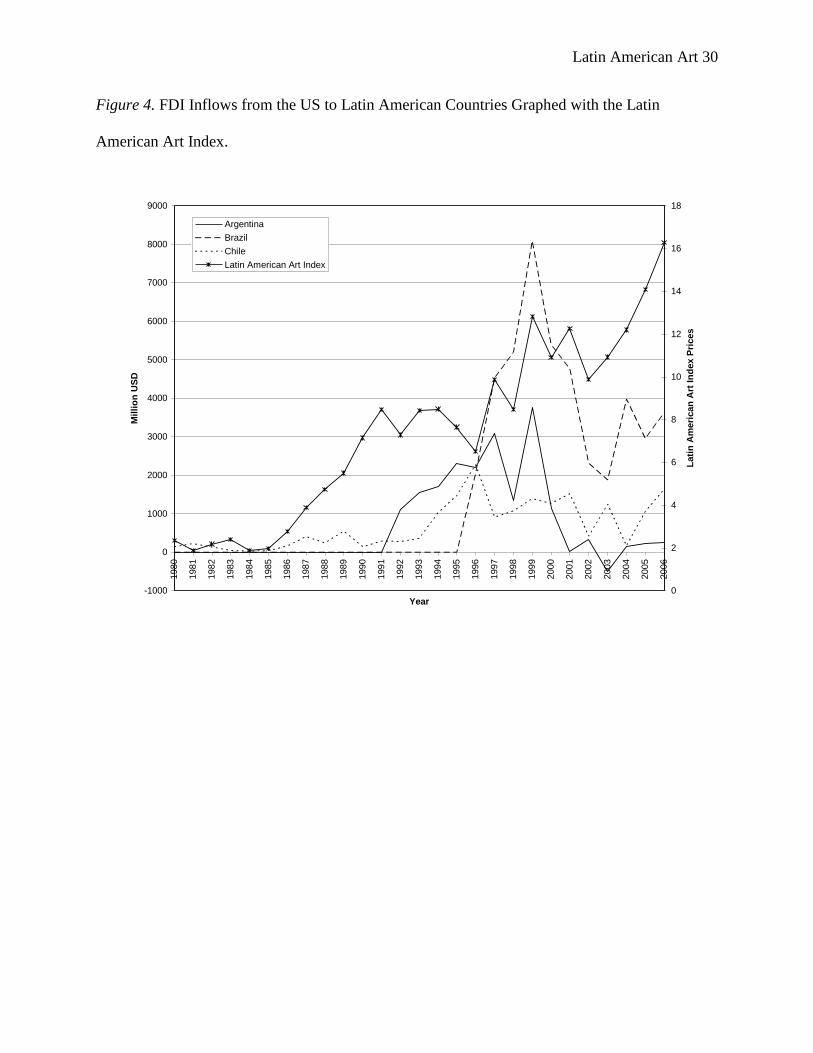
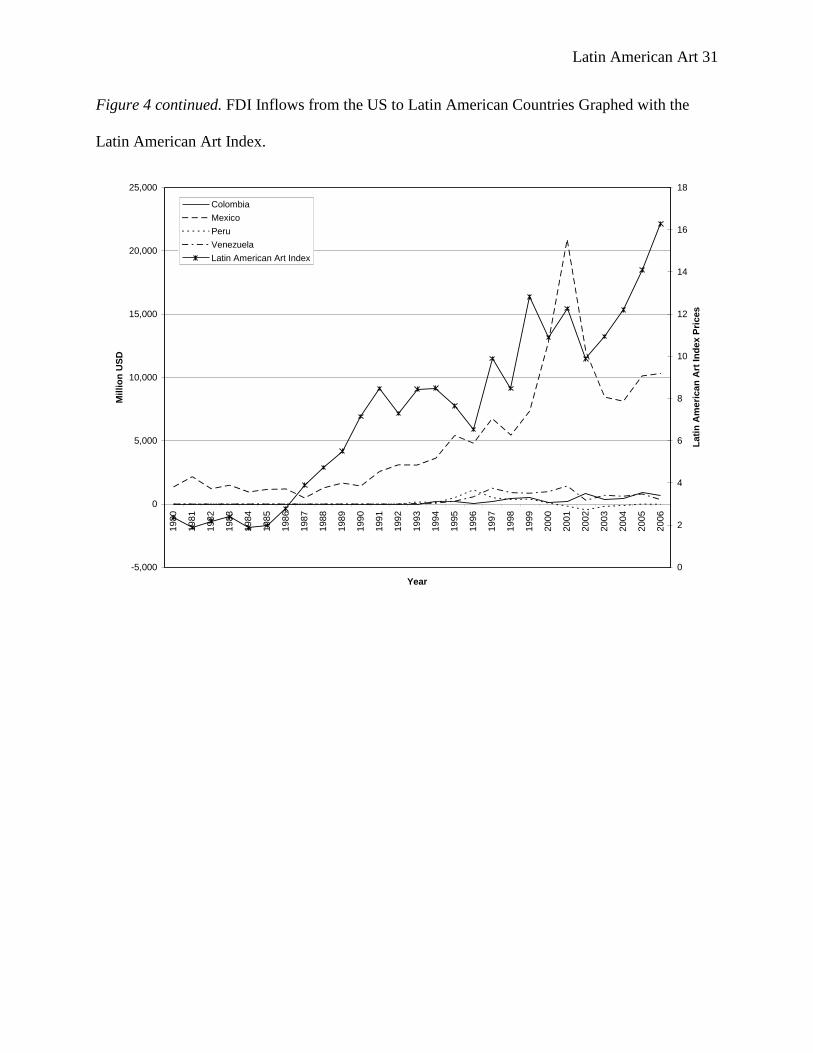
These correlations suggest there is a relationship between flows and Latin American art
prices for some countries. This would then further suggest that changes in FDI should not be
experienced to the same degree in the prices of art because there are many countries represented
in the art which mitigate the local events. The graphs below show the local events that affect FDI
inflows and art index prices. In 1999 both the LAAI and the investment in Argentina increased,
this could have been due to the economic stability the country was experiencing. However, in
2000 both Argentina and Brazil experienced sharp decreases in FDI flows from the US; the
index also experienced a sharp decrease in prices. During this year, Argentina went into a
recession and Brazil was experiencing a currency crisis.
Then in 2001 Argentina defaulted on its debt and FDI from the US went to zero, however
from 2000 to 2001 prices increased in the index. During the same period American’s investment
in Mexico increased. Mexico in 2001 experienced a change in government; it was uneventful and
there was a fiscal surplus in 2000. The index’s inclusion of art from the entire region mitigates
the effect of a local event in a specific country. This too harkens back to what Maria Bonta de la
Pezuela said about the reduced risk a Latin American investor faces when investing in the art and
countries in the region. See Figure 4 below.
Latin American Art 30
Figure 4. FDI Inflows from the US to Latin American Countries Graphed with the Latin
American Art Index.
-1000
0
1000
2000
3000
4000
5000
6000
7000
8000
9000
1980
1981
1982
1983
1984
1985
1986
1987
1988
1989
1990
1991
1992
1993
1994
1995
1996
1997
1998
1999
2000
2001
2002
2003
2004
2005
2006
Year
Mil
lio
n U
SD
0
2
4
6
8
10
12
14
16
18
Lati
n A
meri
can
Art
In
dex P
rices
Argentina
Brazil
Chile
Latin American Art Index
Latin American Art 31
Figure 4 continued. FDI Inflows from the US to Latin American Countries Graphed with the
Latin American Art Index.
-5,000
0
5,000
10,000
15,000
20,000
25,000
1980
1981
1982
1983
1984
1985
1986
1987
1988
1989
1990
1991
1992
1993
1994
1995
1996
1997
1998
1999
2000
2001
2002
2003
2004
2005
2006
Year
Mil
lio
n U
SD
0
2
4
6
8
10
12
14
16
18
Lati
n A
meri
can
Art
In
dex P
rices
Colombia
Mexico
Peru
Venezuela
Latin American Art Index
Latin American Art 32
6 Conclusions and Areas for Further Research The repeat-sale pairs collected for Latin American art helped provide a repeat-sale index
of prices that show an increase in prices as well as local events in the Latin American Region.
The negative correlation between the Latin American Art Index and the S&P500 show how art
can play a role in a multi-asset portfolio. However, the correlation between the LAAI and the
regional indices show that the investors are related to both. The LAAI has a very high standard
deviation which indicates the market is very volatile. Individual pieces show less volatility and
similar compound annual returns to the whole index.
The data shows that buying masterpieces doesn’t necessarily yield a greater return and
holding a piece of art for a longer period yields better results. These results may change once
more observations are included in the sample; trend lines used to show the relationships between
return and purchase price and return and holding period were nearly flat. Art examined by Mei
and Moses (2000) outperformed the Latin American art used in this paper; art examined by
Edwards (2004) underperformed my sample.
The LAAI underperformed the regional indices, but had lower volatility which suggests
that the inclusion of multiple countries in the LAAI helps reduce risk emerging financial markets
face to a greater degree. The lower volatility of the LAAI during the sample periods used to
compare to the regional indices also indicates that much of the volatility of the art index is seen
prior to 1982. Further research into this and the reasons for this difference should be explored.
This mitigation of multiple countries in the LAAI is seen in the comparison of trends of
art prices and FDI flows which also shows that the Latin American art category is not as
vulnerable as FDI to local events in the region. The index is also seeing interest from American
buyers which would further protect the index from Latin American political and economic
Latin American Art 33
uncertainty. This could be useful for the Latin American and American investor looking to
reduce risk in their investments.
Further research with Latin American art can be done by creating thematic and country
repeat-sale indices and comparing the findings to the hedonic pricing model used by Edwards
(2004). Special attention should be given to Mexico when creating country portfolios. Mexico
has a National Cultural Patrimony Law that prohibits artwork from certain artists from leaving
Mexico once it has entered the country. Discussing this with Maria Bonta de la Pezuela, she said
this definitely affects the price of certain works because it limits the market, minimizing
potential buyers (personal communication, April 13, 2007). An interesting study would be to find
out how this law has affected prices, if at all.
Finally, Russia, India and China have art sold at auction in New York. It would be
interesting to see the results of a comparison to the S&P500 and the regional indices of those
emerging markets and the results of the Latin American art. The Latin American art category is
affected by the Latin American region, but gaining interest with American buyers. American
investors may become more interested in the Russian, Indian and Chinese art categories if they
can diversify risk of their portfolio while increase their wealth and enjoyment similar to what is
happening in Latin American art.
Latin American Art 34
References
Ashenfelter, Orley and Kathryn Graddy. (2003). Auctions and the price of art. Journal of
Economic Literature, 41, 763-787.
Baumol, William J. (1986). Unnatural value: or art investment as floating crap game. The
American Economic Review, 76, 10-14.
Edwards, Sebastian. (2004). The Economics of Latin American art: creativity patterns
and rates of return. Economia, 4.2, 1-35.
Ekelund, Robert B. Jr. (1998). Estimates, bias and “no sales” in Latin-American art
auctions. 1977-1996, Journal of Cultural Economics, 22, 33-42.
The “Death-Effect” in art prices: a demand-side exploration. Journal of Cultural
Economics, 24, 283-300.
Goetzmann, William N. (1993). Accounting for taste: art and the financial markets over
three centuries. The American Economic Review, 83, 1370-1376.
Investing in 19th
- and 20th
-Century Latin American art. (1981, April 13). Financial Times
of Long World Business Weekly, pp. 44-45.
Johnson, Patricia C. (2006, May 25). Kahlo’s Roots sets two records. Knight Ridder
Tribune Business News, p. 1.
Martin, Mary-Anne. (1998). The Latin American market comes of age. Retrieved April
14, 2007, from Mary-Anne Martin Fine Art Web Site
http://www.mamfa.com/articles/index.html
Martínez, Juan & Javier Santiso. (2003). Financial markets and politics: the confidence
game in Latin American emerging economies. International Political Science Review /
Revue internationale de science politique, 24, 363-395.
Latin American Art 35
Mei, Jeiping & Michael Moses. (2002). Art as an investment and the underperformance
of masterpieces. The American Economic Review, 92, 1656-1668.
Moffat, Donal W. (1983). Utility. In Economics Dictionary. New York: Elsevir.
Peers, Alexandra. (1991, November 26). Looking to Latin America for the next big art
boom. Wall Street Journal, p. C1.
Pesando, James E. (1993). Art as an investment: the market for modern prints. The
American Economic Review, 83, 1075-1089.
Peterson, Thane. (1996, December 30). A Beautiful market for art; auction houses are
lively as collectors pay top dollar again. Business Week, p. 148
Reitlinger, Gerald. (1961). The Economics of Taste, The Rise and Fall of the Picture
Market, 1760-1960. (1st ed.). New York: Holt, Rinehart and Winston.
Shim, Jae and Joel Siegel. (1995). Asset. In Dictionary of Economics. New York: John
Wiley & Sons.
Sullivan, Paul. (2000, May 27). Latin American art catches the beat. Financial Times, p. 07