Investment and Finance Study for Off-Grid Lighting · Investment and Finance Study for O|-Grid...
46
Investment and Finance Study for Off-Grid Lighting An A.T. Kearney report in collaboration with GOGLA June 2014 Sponsored by GIZ | Supported by Lighting Global, Quadia, Stiftung Solarenergie, and SolarAid
Transcript of Investment and Finance Study for Off-Grid Lighting · Investment and Finance Study for O|-Grid...

1Investment and Finance Study for Off-Grid Lighting
Investment and Finance Study for Off-Grid LightingAn A.T. Kearney report in collaboration with GOGLA June 2014
Sponsored by GIZ | Supported by Lighting Global, Quadia, Stiftung Solarenergie, and SolarAid

2Investment and Finance Study for Off-Grid Lighting
Cover photograph: d.light
3Investment and Finance Study for Off-Grid Lighting
Management SummaryThis study reviews the market for solar off-grid lighting products (SOGLPs) and concludes that improved financing can promote industry growth.
The market consists of about 1.3 to 1.4 billion people at the bottom of the pyramid (BOP) who have no access to electricity. This group’s primary sources of light are kerosene lamps and battery-operated flashlights. By comparison, modern solar lamps offer lower cost, better quality of light, and an improved social and environmental impact.
Currently, this group invests an estimated $30 billion per year buying kerosene for lighting purposes. The cost to supply equivalent light with solar equipment is estimated at $2.7 billion. This frees up $27 billion for use elsewhere, such as further investments in solar systems.
While the SOGLP market is growing, improved financing of the industry’s relatively high working capital needs could help it grow faster. There are already several established solutions for meeting this financing need; however, none of them are considered best practices and there remains room for more innovative solutions.
Each investor group can play its role in the effort to grow this industry in a win-win way. From angel and philanthropic investors to established banks and private equity, the industry has the potential to offer attractive returns.

4Investment and Finance Study for Off-Grid Lighting
About GOGLA
The Global Off-Grid Lighting Association (GOGLA) is a neutral, independent, not-for-profit association created to promote lighting solutions that benefit society and businesses in developing and emerging markets. GOGLA acts as the industry advocate and supports the industry in growing and strengthening the market for clean, quality off-grid lighting and electrical systems. Its main objective is to support industry in scaling the sector based on principles of the triple bottom line, thus contributing to the objectives of Sustainable Energy for All (SE4All) and the Millennium Development Goals (MDGs).
Formed in 2012 as a public-private initiative, GOGLA was conceived out of a joint World Bank/IFC Lighting Africa and private sector effort to accelerate market development for energy access. GOGLA’s unique position as an advocate for off-grid lighting outside the philanthropic area enables it to complement the work of partners and to continue where the World Bank/IFC Lighting Global program stops.
The association welcomes the participation of all stakeholders within the off-grid lighting sector.
About GIZ
This publication is produced with the support of the German Federal Ministry of Economic Cooperation and Development (BMZ) through the sectoral program Poverty-Oriented Basic Energy Services of Deutsche Gesellschaft für International Zusammenarbeit (GIZ) GmbH. As a federally owned enterprise, GIZ supports the German government in achieving its objectives in the field of international cooperation for sustainable development. The wide range of services offered by GIZ is based on a wealth of regional and technical expertise and tested management know-how. GIZ’s sectoral program is responsible for collecting and reviewing conceptual and practical knowledge as well as implementing experiences in the field of energy access to inform the wider public of experts and practitioners about challenges and best practices.
About A.T. Kearney
A.T. Kearney is a global team of forward-thinking partners that delivers immediate impact and growing advantage for its clients. We are passionate problem solvers who excel in collaborating across borders to co-create and realize elegantly simple, practical, and sustainable results. Since 1926, we have been trusted advisors on the most mission-critical issues to the world’s leading organizations across all major industries and service sectors. A.T. Kearney has 59 offices located in major business centers across 40 countries.
Contributors
Jürgen Rothenbücher, A.T. Kearney
Volker Lindenau, A.T. Kearney
Dorian Garbe, A.T. Kearney
Robert Thatcher, A.T. Kearney
Bozhil Kondev, GIZ
Wolfgang Gregor, GOGLA
Koen Peters, GOGLA
Johanna Diecker, GOGLA
Viviane Raub, GOGLA
Kostis Tselenis, Quadia
Charlie Miller, SolarAid
Harald Schützeichel, Solar Energy Foundation

5Investment and Finance Study for Off-Grid Lighting
About the Study
Objectives: GOGLA appointed A.T. Kearney as a trusted advisor to conduct a comprehensive and informative off-grid lighting market study to raise awareness of the opportunity and support finance professionals as they evaluate it.
The study highlights creative solutions, such as collaborative financing approaches. It also highlights the need for the increased transparency of current market challenges.
The study will enable investors, financial service companies, foundations, manu- facturers, and distributors within the off-grid lighting sector, national governments, NGOs (non-governmental organizations), and international facilitators such as GOGLA to further the development of an off-grid lighting market.
Methodology: This study, the first of its kind, investigates the issues and opportu-nities specific to the financing of the off-grid lighting industry.
To do this, we relied on a three-pillar research approach:
1. We conducted in-depth literature research and desktop analysis of available data
2. We involved the top 20 industry players in interviews, face-to-face workshops, and surveys for the purposes of data collection and validation
3. We involved 13 finance industry professionals in interviews and surveys for the purposes of data collection and validation
For our first pillar we analyzed market data, key players, trends, and growth barriers through literature research. Then we combined the points of view and insights from various institutions and external consultancies into one compre-hensive market overview.
For our second pillar we turned to the major players in the off-grid lighting industry and conducted interviews, a survey, and several face-to-face workshops to under-stand their needs and challenges. This helped us discern the barriers to growth and accessing finance within the industry, as well as the firms’ perspectives on certain innovative approaches. In total, we interviewed and surveyed representatives from the top 20 companies in the off-grid lighting industry.
For our third and final pillar we wanted to understand the off-grid lighting industry’s financing barriers and the strategies it uses to address them. To do this we conducted interviews with and surveys of 13 financial professionals and involved them in workshops during the completion of this study. The results helped us determine the industry’s main barriers to growth and finance, while offering individual perspectives on several innovative approaches.

Table of Contents
Table of Figures 1
Glossary 2
The Off-Grid Lighting Market Opportunity 3
Financing Needs and Investing in the Off-Grid Lighting Industry 22
Summary and Call to Action 36
Bibliography 38

1Investment and Finance Study for Off-Grid Lighting
Table of FiguresFigure 1: World economic pyramid (Source: World Resource Institute) 3
Figure 2: African population without electricity 4
Figure 3: Three megatrends drive the SPL market 5
Figure 4: The SOGLP energy ladder 6
Figure 5: Household savings with SPLs 9
Figure 6: Scenarios achieving universal energy access 11
Figure 7: Potential market for SPLs 12
Figure 8: Market potentials in off-grid electricity 13
Figure 9: Mobile phone owners vs. grid access for select African countries, 2011 14
Figure 10: Sensitivity analysis of SOGLP affordability 15
Figure 11: Historic and future SOGLP sales 16
Figure 12: Profitability of interviewed companies 16
Figure 13: Comparing industry and investor views on barriers to growth 17
Figure 14: Barriers to growth from firm perspective 18
Figure 15: Market barriers perceived by investors 19
Figure 16: Barriers to finance from investor and industry player perspective 23
Figure 17: Barriers to finance from firm perspective 24
Figure 18: Barriers to finance from investor perspective 25
Figure 19: Off-grid lighting landscape along the value chain 26
Figure 20: Investor focus along the player value chain 27
Figure 21: Capital requirements in the SOGLP industry 28
Figure 22: Examples of capital requirements in the SOGLP industry 29
Figure 23: Investment focus of investors vis-à-vis company stage 30
Figure 24: Impact investors’ investments in energy access 30
Figure 25: Investors along the industry life cycle 31
Figure 26: Existing practices and innovative solutions to finance 32
Table 1: Solar off-grid lighting products 5
Table 2: Impacts of SOGLPs 8
Table 3: Market risks and mitigations 20

2Investment and Finance Study for Off-Grid Lighting
GlossaryBOP: Bottom of the pyramid
CAGR: Compounded annual growth rate
ECOWAS: Economic Community of West African States
GIZ: Deutsche Gesellschaft für Internationale Zusammenarbeit GmbH
GOGLA: Global Off-Grid Lighting Association
IEA: International Energy Agency
IFC: International Finance Corporation
LED: Light-emitting diode
MFI: Microfinance institution
SHS: Solar home system
SOGLP: Solar off-grid lighting product
SPL: Solar portable light
SPV: Special purpose vehicle
UNEP: United Nations Environment Program
UNF: United Nations Foundation
VC: Venture capital

3Investment and Finance Study for Off-Grid Lighting
The Off-Grid Lighting Market OpportunityOver 1 billion people have an unmet demand for cleaner and cheaper off-grid lighting
As of today, 1.4 billion people—roughly 18 percent of the earth’s population—do not have access to grid electricity. Another 1 billion people are connected to unstable grids and experience regular power outages, classifying them as “under-electrified.”1 Together, these people offer nearly $30 billion of potential business to companies working in the off-grid lighting sector.2
This segment of the population, which is sometimes classified as the bottom of the pyramid (BOP), has an unfulfilled need that represents a significant market opportunity. Sector growth rates are on a trajectory similar to the one followed by mobile phones. In other words, we can expect an outstanding market growth performance.3 Yet, historically, investors have paid little attention to the BOP energy market.
Figure 1 illustrates the world economic pyramid. Four billion people—with a cumulative market size of $5 trillion—represent the bottom of the pyramid.4
In the off-grid market, things have begun to change, but the revolution hasn’t occurred just yet. While numerous startups and established companies (such as Philips) are moving to seize the opportunity represented by the needs of the non- and under-electrified, no one group has come to dominate this area.
One of the focus markets is sub-Saharan Africa, where the off-grid population is forecast to rise from 600 million people in 2011 to 698 million in 2030 (see figure 2 on page 4).5
Figure 1 World economic pyramid
Individual annual income($ in purchasing power parity, 2005)
Population
Sources: World Resource Institute; A.T. Kearney analysis
Mature markets: >$20,000
Emerging markets: $3,260 to $20,000
Survival markets: <$3,2604 billion
2 billion
0.5billion
1 IEA (2012); IEA (2013) 2 UNEP (2013) 3 Mobile phone penetration CAGR from 2000 to 2012 accounted for 36 percent. See GSMA (2012).4 IFC and WRI (2007)5 IEA (2013); Lighting Africa (2013)

4Investment and Finance Study for Off-Grid Lighting
Macro trends
Solar portable lights are already the preferred source of lighting for households with zero or unreliable access to energy. As awareness of the advantages of such sources increases, demand will continue to grow.
Three megatrends, illustrated in figure 3 on page 5, will drive demand for solar off-grid lighting products (SOGLPs).6 First, component costs for solar lanterns will fall at a CAGR of -6 percent from 2012 to 2020.7 Second, kerosene prices will rise at a CAGR of 4 percent.8 Although many countries in sub-Saharan Africa and Asia subsidize kerosene—keeping prices artificially low over long periods of time—increases in kerosene prices entail higher subsidies and costs for governments. Eventually, higher kerosene prices will be passed on to the end consumer. Third, mobile phone penetration is expected to increase by more than 20 percentage points in Africa and Asia by 2017, at which point the power needed to charge phones will further accelerate SOGLP demand.9
The many direct benefits of solar off-grid lighting products over kerosene and conventional sources of lighting
The rationale behind offering solar-based lighting is simple: Solar off-grid lighting products are cheaper, brighter, more efficient, and healthier than kerosene lamps, and offer additional important functionalities such as mobile phone-charging outlets.
Figure 2 African population without electricity
(millions)
Sources: Lighting Asia, UN Energy Access Practitioner Network, GOGLA; A.T. Kearney analysis
2011
2030
600
698
6 GSMA.com; Lighting Africa (2013); eia.gov 7 Dalberg analysis for Lighting Africa Market Trends Report 2012 8 Kerosene cost calculations based on a consumption of 0.16 liters per day, equal to approximately six hours of daily kerosene lamp
usage: Lighting Africa (2013).9 Source: Kantar

5Investment and Finance Study for Off-Grid Lighting
Range of SOGLPsThere is a wide range of SOGLPs, from single light sources without external power outlets and with brightness levels under 100 lumens to multi-light-source applications with external power outlets and brightness levels around 200 lumens. For the purpose of this study, we differentiate between solar portable lights (SPLs), solar home systems (SHS), and large SHS. Table 1 shows the segmentation of simple SPLs, SHS, and large SHS.
Figure 3 Three megatrends drive the SPL market
Increasing kerosene spend2
($ per household, per year)Decreasing SOGLP costs($ per SOGLP1)
Increasing mobile penetration in Africa (% of SIMs)
1 Manufactured costs for a medium-level solar lantern2 Kerosene calculation based on consumption of about 60 liters per year (about 6 hours of daily usage). 3 A premium of 33.8 percent for customers in rural parts of developing countries was added to the U.S. wholesale price.
Notes: LED is light emitting diode. SIMs are subscriber identity modules. PV is photovoltaic.
Sources: GSMA, Dalberg analysis, EIA.gov; A.T. Kearney analysis
• Performance and production costs will continue to improve
• Key cost improvements from batteries, LED, and PV chips
2012 2020
15.2 9.6–6%
• Kerosene prices grow in line with the oil price
• Price premium for rural customers must be considered3
2012 2020
64%88%
• Mobile communication is a key facilitator of rural development
• Mobile charging functionality of SOGLP accelerates demand
+4%
2012 2020
67.893.1+4%
Table 1 Solar o�-grid lighting products
Solar portable lights (SPLs)• Single light sources with or with-
out mobile phone-charging outlet• Entry-level products with solar
panels of 10W and below• Prices range from less than
$10 to $40
Images: Left: © GOGLA; center: © Orb Energy; right: © Barefoot Power
Sources: GOGLA; A.T. Kearney analysis
Solar home systems (SHS)• Multi-light source applications
with mobile phone chargingoutlet
• Sources can power devices such as radios or small televisions
• Prices range from $50 to $200
Large solar home systems• 12 volt systems replace diesel
generators or car batteries• 12 volt systems can power multiple
lighting points and devices such as televisions and refrigerators
• Prices start at $200

6Investment and Finance Study for Off-Grid Lighting
Lighting as a demand enabler for more powerful solar home systemsAs technology improves and prices fall, consumers will shift to more powerful solar home systems. Consequently, with more powerful solar home systems, the markets for electrical products such as TVs and fans will also grow. Lighting is the enabler of demand evolution, and as new technologies become available at the bottom of the pyramid, demand will rise for bigger and more expensive systems (see figure 4).
More than just brighter light, SOGLP can be a key enabler for economic developmentMost SOGLPs offer brightness levels three to 10 times higher than simple kerosene lamps (10 lumens) and offer six to eight hours of quality lighting on one charge. Moreover, multi-light-source applications such as SHS can power several light sources and attain up to 300 lumens. If the light points are properly focused on the task area, the brightness levels are high enough for reading and writing.10
Simple candles or wick cans that disperse light simply do not suffice, whereas stronger solar off-grid lighting products that can focus their light on one spot (task lighting) or illuminate a space (ambient lighting) improve working and living conditions enormously.
Equally, there is strong evidence that SPL owners want to upgrade to mid-range lights such as SHS and that owners of SPLs or SHS with an integrated phone charging outlet use their mobile phones more often.
Source: A.T. Kearney analysis
Figure 4 The SOGLP energy ladder
Price
Performance and featuresLow
$200+
$50–200
$10–40
$2,000–5,000
$500–1,200
$500or less
High
Ann
ual h
ouse
hold
inco
me
SPL
• Replace kerosenelamps
• O�er USB charging
SHS
• Can supplymultiple LEDs
• Can supply radioor small TV
Large SHS
• Can supply large TV, small fridge
• Replace diesel generators and car batteries
10 Lighting Africa (2013); Lighting Africa products specification sheets; Mills (2003)

7Investment and Finance Study for Off-Grid Lighting
Low-risk, easy-to-use alternative to keroseneWith regard to ease of use, kerosene lamps are hard to light and use in extreme winds or rain. Their cheap tin construction and glass windshields make them extremely fragile, and replace-ments are necessary on a regular basis. Kerosene lamps are also a serious cause of health problems due to indoor air pollution, and damage caused by knocked-over lamps can ruin lives. SOGLPs, on the other hand, are sturdy and durable, and they resist the extreme weather of sub-Saharan and Asian countries.
The wider benefits of solar off-grid lighting products
For users and the economy as a whole, solar lanterns offer economic benefits and a positive social, health, and environmental impact, as shown in table 2 on page 8.11 GOGLA recently began an ad hoc working group on off-grid lighting impact with results expected in the 4th quarter of 2014.
Social impactsThe provision of off-grid energy enhances community development. Traditionally, in rural areas, village life continues after dark. With solar lighting, new activities that had not been possible before start to take place. For example, activities that can increase social cohesion—such as adult classes and regional town meetings—can be held after dark. SOGLPs also help reduce the risk of snake and scorpion bites and may help prevent crime, especially against women.12
Studies also suggest that households equipped with solar lanterns can extend study hours further than those dependent on traditional lighting sources, which can be beneficial for children’s education. For example, SolarAid showed that children using SOGLPs for studying prolong their study time by more than one hour per day.13 Furthermore, when parents make the move from kerosene to solar the cash savings can be re-invested to improve their children’s education.14
Health impacts
The use of SOGLPs improves health and safety on both the individual and community level. Kerosene lamps contribute to indoor air pollution, causing eye irritation, coughing, allergies,
11 UNEP (2013); GIZ (2010); SolarAid (2013); The Lumina Project – light.lbl.gov 12 SolarAid (2013) 13 Dalberg analysis for Lighting Africa Market Trends Report 2012 14 Agoramoorthy and Hsu (2009); Kesrelioglu (2011); Planète d'entrepreneurs (2012); Furukawa (2012); GIZ (2011); Gustavsson (2007);
World Bank (2010); Yayasan Dian Desa (2003); Mondal and Klein (2011); Kürschner et al. (2009)
Photos 1 and 2 Studying with fuel-based lighting versus studying with SOGLP
Images: © Lighting Africa/Wilkens
Source: A.T. Kearney analysis
Studying with fuel-based lighting Studying with a SOGLP

8Investment and Finance Study for Off-Grid Lighting
and chest pain.15 WHO/GACC studies put the number of deaths resulting from household air pollution at 4.3 million a year, higher than the number of deaths resulting from malaria, AIDS, or sanitation issues.16
Better and brighter light sources such as SOGLPs also diminish eye strain. Kerosene lamps with brightness levels lower than 10 lumens do not provide sufficient lighting, causing eye irritation and vision problems.17 In addition, SOGLPs are proven to reduce the likelihood of fires and accidents. This is especially important as 95 percent of the world’s 300,000 deaths per year caused by open flame lighting and cooking occur in developing countries.18
Unsurprisingly then, members of households equipped with SOGLPs report leading more comfortable lives and feeling healthier. Indeed, as a result of the better lighting conditions provided by SOGLPs, it is possible to extend medical care into the night.
Environmental impactsSolar lighting also offers enormous environmental benefits. On an individual and SME level, the use of solar products leads to less toxic waste around living areas, working areas, and water sources as single-use battery-powered devices such as flashlights become obsolete. The most impressive numbers, however, concern air pollution and global warming. UNEP estimates that the burning of fossil fuels for the purposes of lighting currently accounts for 90 million tons of CO2 annually.19 Recent research suggests that SOGLP customers use 1.5 fewer kerosene lamps on a regular basis, and more than 40 percent stop using kerosene completely.20
Table 2Impacts of SOGLPs
Social impacts • Longer hours and better illumination for studying• Social cohesion and community development• Safety and equitable development for women
Health impacts • Improve safety by reducing hazards associated with flammable fuels and candles• Reduce indoor air pollution with a significant e�ect on consumers’ health
Source: A.T. Kearney analysis
Environmentalimpacts
• Prevent 90 million tons of CO2 emissions annually• Reduce annual global kerosene consumption by 25 billion liters• Prevent 270,000 tons of black carbon annually, with a warming e�ect equivalent
to about 240 million tons of CO2
• Protect natural habitats against deforestation
Economic impacts • Free up $27 billion spent annually on fuel to be invested in more sustainable businesses• Reduce household spending on kerosene or candles, and increase savings up to 10 to 15
percent of a household’s income• Generate new income, stimulate economic activities, and o�er new opportunities for
small businesses by lengthening the day• Multiply trade activities and job creation to increase state income and facilitate
overall socioeconomic development
15 SolarAid (2013) 16 Household Energy Network, GACC News, Issue 61: Climate Change: Adaptation, Resilience and Energy Security 17 Mills (2012)18 WHO (2008)19 UNEP en.lighten20 SolarAid (2013)

9Investment and Finance Study for Off-Grid Lighting
Furthermore, the burning of kerosene lamps produces black carbon, the particle that is the second largest contributor to global warming. One gram of black carbon warms the atmosphere several hundred times more in just a few days than one gram of CO2 does over a century. It is estimated that 270,000 tons of black carbon are emitted annually from kerosene lamps. The warming effect of these emissions is equivalent to about 240 million tons of CO2, equaling around 4.5 percent of the United States’ annual CO2 emissions. The elimination of these emissions through off-grid lighting products would represent a 5-gigaton CO2 reduction over the next 20 years.21
Economic impactsIn off-grid households still relying on traditional fuel-based lighting, expenditures for lighting typically account for 10 to 15 percent of a household’s income and constitute a major financial strain on a household’s budget.22 While initial purchasing costs for SOGLPs are often higher than the purchasing costs for kerosene or candles, SOGLPs are cheaper to run in the long term. As with solar lights, the running costs are zero and the solar light device is just a one-time cost. Typically, the investment for a mid-priced solar lantern is repaid within four to five months.
What solar lantern owners save on kerosene they can also invest in other important things such as food, education for their children, healthcare, and general improvements to their living standards. Assuming a three-year life cycle (a conservative calculation, as the average SPL has an expected useful life of three to five years), a household can save up to 86 percent of its previous expenses for kerosene and mobile charging.23
A sample calculation for a household with six hours of kerosene lamp usage every day and a mobile phone charge every sixth day is illustrated in figure 5. Replacing one kerosene lamp with one solar lantern and using the solar lantern to charge the mobile phone can save $60
21 Jacobsen et al. (2013); Lam et al. (2012) 22 SolarAid (2013)23 Lighting Asia (2012)
Figure 5 Household savings with SPLs
($)Payback of SPL Life cycle economics of SPLLighting cost of kerosene
Example SPL
Notes: Kerosene assumptions: Six hours of kerosene lamp usage per day, about 60 liters per year. Kerosene price: $1.13 per liter. Mobile charging assumptions: One charge every sixth day at $0.25.
Sources: IFC, EIA; A.T. Kearney analysis
Upfrontcost of
kerosenelamp
0
10
20
30
50
70
90
80
60
40
Annualoperating
cost ofkerosene
lamp
Annualphone
chargingcost
Total annualexpendi-ture onlighting
and charging
Total annualexpendi-ture onlighting
and charging
Total annualexpendi-ture onlighting
and charging
68
15
85
First-yearsavings
Investmentin SPL
85
60
25
Annu-alized
savings
Annu-alizedcost
of SPL
85.076.7
8.3
2
Payback after less than4 months
• 90% of previousenergy expense saved
• Annual advan-tage of $76.70
$230 over3-year life cycle
=

10Investment and Finance Study for Off-Grid Lighting
in just the first year of use. Over the assumed three-year lifetime of the lamp, that rises to $76.70 a year, which is more than 10 percent of the total income of those living on less than $2 a day.24
Besides financial savings, solar powered lighting also increases a household’s income potential by enabling extended working hours and increased productivity at night. Additionally, while the possibilities for increased economic activity are many, a few stand out. Handcrafters and farmers can process their products after dark and sell more during the day, shop owners can attract more customers to their shops in extended opening hours, and people can use saved expenses to invest in their own small businesses.
More subtly, there is economic value in improved communication too. Readily available, charged mobile phones improve business communication, while solar-charged radios offer access to better information and opportunities for radio advertising.
Combined with purchases in nutrition, health, and entertainment and additional electronic accessories, solar lighting can be a significant economic enabler that multiplies trade activities and creates jobs at the bottom of the pyramid.25
Manufacturers and distributors will also benefit from the maturing off-grid lighting market and contribute to the government coffers of the respective countries. The manufacturing and distribution of SOGLPs will create jobs, provide more income tax, and reduce the need for public welfare. Cleaner SOGLP technology should reduce public health expenditures, too. Finally, as kerosene is heavily subsidized in most sub-Saharan African countries, the displace- ment of kerosene lamps with SOGLPs should reduce government subsidy bills.
Reaching universal access to electricity
Reaching universal access to electricity is an important objective, and there are several scenarios for how to achieve that. The International Energy Agency estimates that about $1,000 billion will need to be invested to ensure universal electricity access by the year 2030.26 Universal electricity
24 Calculations based on Lighting Africa (2013). Kerosene assumptions: six hours of usage of kerosene lamp per day, kerosene price: $1.13/liter. Mobile charging assumptions: One charge every sixth day at $0.25.
25 Adkins et al. (2010); GIZ (2011, 2012); Planète d’Entrepreneurs (2012); SolarAid (2013) 26 IEA (2011)
Photos 3 and 4 Working by candlelight versus working by solar light
Pictures © Lighting Africa/Jamie Seno
Source: A.T. Kearney analysis
Working in candle light Working with solar light

11Investment and Finance Study for Off-Grid Lighting
access by 2030 also means around 950 terawatt hours of electricity need to be generated per year. The cost per new household connection amounts to $4,000 (see figure 6).
The electrification of households through solar solutions would require a fraction of the grid investment costs. While households connected to the grid have unlimited access to electricity, off-grid energy becomes a viable alternative when the grid is not available or too costly. For $10, solar lanterns provide basic energy services while large SHS provide sufficient energy to power refrigerators. A system to light an off-grid household and power small devices can cost $120 with an expected useful life of up to 10 years. Moreover, on the basis of past trends, this cost disparity is likely to increase.
Over the past decade, clean energy technologies have become cheaper. Unit manufacturing costs have come down worldwide as clean energy policies and emerging markets bolster demand.27 Grid extensions remain costly and demonstrate declining returns on investment when expanded from heavily populated urban areas (where connections are dense) to rural areas (where villages can be miles from one another).
Where the grid extensions are currently under way, investments per household are so high that most households have to contribute by paying high connection charges for grid electricity. For example, in Kenya the highest grid connection charges are around $400. For the same amount,
Note: SE4All is Sustainable Energy for All.
Sources: International Energy Agency; A.T. Kearney analysis
Figure 6 Scenarios achieving universal energy access
Grid investmentsWorld energy access, 2012
Projection by organizations such as the International Energy Agency
Universal energy access, 2030(for example, SE4All)
GoalUniversal energy access by 2030
Necessary investments of$1,000 billion until 2030, mainly into grid and mini-grid
$4,000Average investment
per household
$25for average
SPL
$120for average
SHS
Electrification throughsolar solutions
Necessary investments based on desired electrification level per household
vs. vs.
World population: 7 billion people in 2012, 8.3 billion people in 2030
1.4 billion potential customers without electricity
27 Green Growth Action Alliance (2013)

12Investment and Finance Study for Off-Grid Lighting
a household could finance more than four entry-level SHS, which can power lamps, radios, and small TVs. Accordingly, when the grid becomes available in rural areas it is common to see adoption rates as low as 10 percent of households.28 With a more affordable, fast, and reliable solution available, many customers opt for solar-powered energy.
Solar off-grid lighting is a multibillion dollar opportunity
Today, the world’s 250 million off-grid households consume around 25 billion liters of kerosene per year and spend more than $30 billion on fuel-based lighting such as kerosene and candles, excluding expenditures on batteries and diesel generators.29,30
This $30 billion expenditure on fuel can be used as a proxy to gauge the market for innovative alternatives. With the provision of SOGLPs, energy consumption at the BOP decreases and cash flow into off-grid lighting solutions increases. SOGLP companies interviewed as part of this study noted that a few customers return within months of their initial purchase, looking for bigger solar lighting products. Vendors also noted that the current market is most interested in small solar home systems in the $60 to $100 range. However, in countries such as Kenya, Ethopia, and the Phillipines there is a clear trend toward SHS over $100.
Should current trends continue, sub-Saharan Africa will eventually overtake Asia as the biggest off-grid market in terms of people and households as a result of population growth exceeding current capacity to extend the grid.31
Globally, we estimate an annual market of up to $2.7 billion.32 As a result, $27.3 billion can be freed up as additional purchasing power for education, health, and further solar products and accessories such as solar lanterns, bigger home systems, TVs, radios, fans, and refrigerators. Figure 7 illustrates this concept.
28 UNF (2012); World Bank (2013)29 Assumption: One household uses two kerosene lamps with 50 liters kerosene usage per year. See also IFC (2012); UNEP (2013); UNF (2012).30 UNEP (2013)31 Lighting Africa (2013); OBIN World 201432 250 million households, 1.3 solar lanterns per household, life expectancy of three years, price of $25
Figure 7 Potential market for SPLs
O�-grid lighting market spend1
($ billion, 2012)
1 Current kerosene spend is based on 2012 prices.
Sources: IFC, Lighting Africa, UNEP; A.T. Kearney analysis
0
10
30
20
30.0
Determined by:• Number of households (250 million)• Average price per solar lantern ($25)• Number of lanterns per household (1.3)• Lifespan per lantern (3 years)
Currentkerosene spend
Marketfor SPLs
Marketfor SPLs
0.2 27.32.7
2.5
Freed up capital that can be invested into:• Clean energy access (for example, SHS for communication
and household appliances)• Social requirements (for example, education and health)• Economic empowerment (for example, own businesses, stores)
Potentialgrowth with kerosene prices
Only $200 million tapped today

13Investment and Finance Study for Off-Grid Lighting
Market forces will redirect the freed-up $27.3 billion toward more economically productive uses, which are likely to include significant investment in access to off-grid energy. Thus, we see solar lighting as an enabler for the solar energy access market as a whole—the industry will feed off its own success.
In conclusion, we see the following market potentials illustrated in figure 8 based upon A.T. Kearney estimates, interviews, and market data. The market for SPLs today is estimated at $200 million globally, yet if every off-grid household used SPLs instead of kerosene-fuelled lamps the market would be $2.7 billion at current prices.33,34
For SHS we estimate a market potential of $6 billion, which will appreciate as the market evolves.35 Additionally, we consider the ability of large SHS to power electrical accessories such as TVs, fans, and radios a multiplier and believe this market could total $50 billion.36
Naturally, it takes time to evolve from the $200 million market today to $50 billion in the future. Nevertheless, with appropriate expertise and capital investment this market can grow exponen- tially. It is noteworthy that these market estimations do not include the additional 1 billion people worldwide who are connected to unstable grids and experience regular power outages. Solar solutions can of course be a fallback solution for when the electricity is off, offering a further upside to the market sizing estimates.
It is clear that the market is currently underserved. Household penetration rates are estimated at 3 percent for SPLs in sub-Saharan Africa and the combination of SPLs and small solar home
Sources: Lighting Asia, Energy Practitioner Network; A.T. Kearney analysis
Figure 8 Market potentials in o�-grid electricity
SOGLP market potentialsMaximum market potential
TimeToday Short-term Mid-term Long-term
Today’s marketvolume:$0.20 billion
SPL market:$2.71 billion
Potential SHS market:$6 billion
Potential SHS and accessories market:$50 billion• Radio
• Television
• Fans
• Other (for example, hair dryers)
33 Four million SPLs sold in Africa in 2013 at an average price of $25. Doubling the African market is a fair assumption for the world market.34 250 million households, 1.3 solar lanterns per household, life expectancy of three years, price of $2535 250 million households, one SHS per household, life expectancy of five years, price of $12036 250 million households, one SHS fully equipped with TV, fan, and so forth per household, life expectancy of five years, price of $1,000

14Investment and Finance Study for Off-Grid Lighting
systems in Asia.37 However, some critics doubt the affordability of solar off-grid products and argue that the market is in fact much smaller.
At first glance, the affordability question is real: If households with a limited income must continue to purchase expensive fuel, they may not be able to save the cash to buy more economic solar lighting. However, affordability is not black and white. If devices are financed, then cash savings could go toward paying them off. Yet firms currently in the market lack the necessary capital or business models necessary to make such changes, providing a clear opportunity for innovative financing solutions and improved business models.
The mobile phone industry offers a good example of the success businesses can have if they apply the right models in sub-Saharan Africa. Figure 9 shows mobile penetration versus electrification rates for select countries.
Even in the countries with the lowest electrification rates, at least 70 percent of the population owns a mobile phone. If mobile phones and their communication charges are affordable, then so are basic solar lanterns or higher-level products with regular installments. Besides, as previously mentioned, a high mobile phone penetration implies the need for a means of electrification to charge the devices.38
Evidence suggests that the market is currently limited by the supply side, not the demand side—an assertion confirmed by interview respondents, who also stated that where there is demand a means of supply can be found.
“The demand is huge! People want to live like us, with 10 lamps, outside and inside the house and for their stores.”
“Where there is demand, people find a way to get what they want.”
The BOP market is growing fast, and its aggregated purchasing power suggests significant opportunities for market-based approaches.39 By establishing trust in technology and freeing up household income for further investment, companies can pave the way for even faster growth at higher price points.
37 Lighting Africa (2011)38 Kantar (2013); IEA (2011)39 IFC and WRI (2007)
Figure 9 Mobile phone owners vs. grid access for select African countries
(2011)
Sources: Kantar, IEA; A.T. Kearney analysis
Côte d’Ivoire
93%
47%
90%
42%
Senegal Ghana Cameroon Nigeria Tanzania Uganda Kenya
Mobile phone ownership (% of population) Electrification rate (% of population)
88%
61%
86%
49%
82%
51%
80% 79%
9%14%
71%
16%

15Investment and Finance Study for Off-Grid Lighting
Our interview respondents strongly believe that consumer finance is an important enabler and could be the way to multiply industry revenues. If industry can identify the right end-user financing mechanisms, then the market should be able to grow to its full potential. This includes existing solutions such as pay-as-you-go systems, mobile payments, and modularized systems that can be extended.
Our interviews and surveys suggest that about 50 percent of customers could afford average-priced SOGLPs without any commercial end-user financing. Affordability is increased to 60 percent if 30 percent of the price is financed through commercial end-user financing, and 80 percent if 70 percent were financed. The industry consensus is that by introducing models that enable customers to pay the full price in installments, it will be possible to realize the full market potential. Figure 10 depicts this sensitivity analysis.
The industry is growing, yet growth rates could be better with improved financing
Industry growthThe SOGLP industry is in growth mode. Lighting Africa (2013) projects the number of SPL units sold will grow at a rate of 75 percent between 2012 and 2015. Regarding the worldwide sales of SPLs, we estimate 77 percent growth in 2014 and a healthy average growth rate of 55 percent in the following years (see figure 11 on page 16).
There are three ways to promote further growth in the SOGLP industry. First and foremost, reach new customers and increase market penetration. Second, increase incremental sales to existing SOGLP customers, driven by increased household income due to savings on kerosene. Third, increase household income in order to increase consumer awareness and access to finance. Together, these aspects should increase the number of SOGLPs sold per household and open up other avenues of growth. For instance, as the warranties expire and products come to the end of their useful lives people will look for replacements. Capturing this repeat business will be crucial for the industry, and may increase margins for existing players.
Addressable SOGLP market(% of total)
Upfront payment as share of end-user price (in %)
Sources: Interviews; A.T. Kearney analysis
Figure 10 Sensitivity analysis of SOGLP a�ordability
0
20
40
60
80
100
0 10 20 30 40 50 60 70 80 90 100
70% financing of the end-userprice increases market potential by 35 percentage points versus upfront payment only
O�-grid products

16Investment and Finance Study for Off-Grid Lighting
Industry profitabilityIndustry profitability and the existence of viable business models are vital to investors. We believe that some companies in the industry have proven their viability, especially those further up the value chain; however, more scale is necessary to increase industry profitability. This is particularly true for those further down the value chain.
Our promising interview results regarding profitability are displayed in figure 12. Those companies that are profitable are relatively small or have passed their aggressive growth phase, while the majority of companies that are not profitable indicated that they are pursuing aggressive growth plans, allocating significant resources to expanding the business and scaling up. These
Figure 11 Historic and future SOGLP sales
($ million)
Note: Growth projections for sales based on expert interviews
Source: A.T. Kearney analysis
2009
17
2010 2011 2012 2015 2016 2017 20182013 2014
Studies show steady, healthy growth rates
+55%
34 68 113 200
508
899
1,245
1,771
1,485
Figure 12 Profitability of interviewed companies
Industry profitability (% of interviewed companies)
Note: Interviews and surveys with 30 manufacturers and distributors (December 2013)
Source: A.T. Kearney analysis
• Small companies still testing their business model; capital needed for expansion• Big players that have scaled up enough to realize profits
• Most companies with a proven, profitable business model• Current lack of profitability due to aggressive growth phase
0
100100%
Manufacturersand distributors
Profitablefirms
Profitablein less thantwo years
Not profitablein less thantwo years
40%
33%
27%

17Investment and Finance Study for Off-Grid Lighting
companies often demonstrate their business model’s profitability on a small-scale basis. Our interview respondents highlighted increased sales and larger, more expensive products as essential to achieving higher margins.
Market barriersThe crucial barriers to market growth cover general factors such as policy issues and factors specific to emerging industries such as consumer awareness, product quality, distribution, after-sales service, and financing on both the industry player and consumer sides (see figure 13).
When we look at industry players and investors, we see slightly different points of view. Industry players are more concerned with policy issues and access to finance for solar firms, while investors are more concerned with distribution challenges and market spoilage. In other words, industry players are concerned with topics at the macro level (policy issues) while investors are concerned with factors that limit scalability (distribution challenges) and threaten market growth (market spoilage).
Where industry players and investors cross paths is in evaluating the importance of access to finance for consumers, lack of awareness, and lack of after-sales services. These topics relate to the end user, and every player faces the same challenges when it comes to creating awareness and overcoming its customers’ limited financial purchasing power. After-sales services still represent a significant challenge for all players as very few solutions exist across all sub-Saharan and Southeast Asian countries.
Figure 13 Comparing industry and investor views on barriers to growth
Barriers to market growth
Sources: Interviews and surveys with 30 manufacturers and distributors (December 2013) and 13 investors (December 2013–February 2014), Energypedia; A.T. Kearney analysis
0No barrier Strong barrier
Policy issues3.6
2.6
Div
ergi
ng v
iew
sSi
mila
r vie
ws
Access to financefor solar firms
Distributionchallenges
Poor product quality,market spoilage
Lack of consumerawareness
Lack of after-sales services
1 2 3 4 5
Access to financefor consumers
• Lack of business development support• Lack of seed and early-stage risk capital• Lack of intermediaries, brokers, and platforms
to channel seed finance• Lack of appropriately priced growth capital• Lack of support from local banks in
local currency• Lack of investors’ knowledge about
the industry
4.03.1
3.44.1
3.42.8
3.42.9
3.22.8
3.43.0
Manufacturers and distributors
Investors

18Investment and Finance Study for Off-Grid Lighting
Both sides consider access to finance for solar firms and distribution challenges as decisive market barriers. The following section takes a closer look at the challenges surrounding access to finance.
Market barriers from an industry perspectiveAlthough the market is attractive several barriers limit its growth. The most important barriers are of a financial nature, such as getting access to working capital or long-term growth financing (see Financing Needs and Investing in the Off-Grid Lighting Industry on page 22). Their ratings are shown in figure 14.
To overcome these growth barriers companies come up with a number of creative solutions, although there is still no best practice. Multi-stakeholder partnerships between governments, the private sector, and civil societies have emerged to draw attention to the lack of energy. In early 2014 the United Nations announced the Decade of Sustainable Energy for All, lasting from 2014 until 2024, with the hope of underscoring the importance of energy access for sustainable development and encouraging the development of post-2015 agendas.
There is a clear emerging consensus on the need for policies that support market growth, provide assurance to investors, and help attract investments. Industry advocates such as the IFC and World Bank and their Lighting Global Program, UNEP, the GIZ, and GOGLA work together to encourage regulators to waive duties and taxes for clean and quality off-grid lighting products.
By promoting an integrated policy approach for efficient off-grid lighting, the UNEP Enlighten Initiative supports national adoption and best practices for the phase-out of fuel-based lighting. It also provides policy and technical support to government decision makers who quantify the opportunities of efficient off-grid lighting and focus on environmental, health, safety, and green economy benefits. Currently, UNEP is supporting ECOWAS, as the latter develops a regional, efficient lighting strategy to support market transformation in West Africa. GOGLA also contributes to this initiative, providing the necessary private-sector insight to assist with the development of policies and programs.
Under the umbrella of the joint IFC/World Bank Lighting Global program, regional programs such as Lighting Asia and Lighting Africa work toward improving access to better lighting in areas not
Figure 14 Barriers to growth from firm perspective
Top three stumbling blocks
Sources: Interviews and surveys with 30 manufacturers and distributors (December 2013) and 13 investors (December 2013–February 2014), Energypedia; A.T. Kearney analysis
0 1 2 3 4 5
Access to financefor solar firms 4.0
Policy issues 3.6
Poor product quality,market spoilage 3.4
• Limited access to financing sources in line with industry needs regarded as key challenge
• Regulatory uncertainties inhibit strategic investments for growing the market
• Low-quality players and product donations destroy existing market potentials
Manufacturers and distributors
Investors

19Investment and Finance Study for Off-Grid Lighting
yet connected to the electricity grid. It aims to support the commercial sector and eliminate market barriers so the private sector can supply high-quality, modern, off-grid lighting products. An important element of the program is providing a quality assurance framework to prevent market disenchantment as a result of low-quality products. For instance, they have worked with the IEC to develop technical specifications and standards for future SOGLPs. In line with these technical specifications, Lighting Global is running its own testing project to establish a set of minimum quality standards. The Lighting Global team is also working with GOGLA and the GIZ to develop a quality seal or label that will simplify the communication of quality products to businesses, consumers, and governments.
Local market awareness campaigns are also under way in developing countries to raise awareness among the off-grid population, initiated by Lighting Africa, GIZ, and other stakeholders.
Market barriers from the investors’ point of viewAccording to investors, the top market barrier is “distribution challenge,” scoring 4.1 points on a scale of 1 (least important) to 5 (most important), shown in figure 15. This helps explain the shift of investment priorities from design, engineering, and manufacturing to distribution. Investors see distribution and sales as the most important areas and therefore invest in companies tackling these issues.
The distribution solutions currently offered by SOGLP firms are very cost intensive, and as a result many have tried to find new, smarter distribution channels for the last mile. Unfortunately, as the supply and distribution chains within a country are often highly fragmented, economies of scale limit how low costs can go. As a result, some players only focus on distribution and sales.
Other top barriers for growth include access to finance for SOGLP firms and the lack of after-sales services.
Especially in terms of working capital, it is difficult for SOGLP to access finance solutions. As a result, several investors offer different finance solutions, such as equity, debt, and mezzanine to help firms overcome this problem. Interestingly, while consumer finance represents an attractive investment opportunity for impact investors as outlined above, access to finance for
Figure 15 Market barriers perceived by investors
Top three hurdles
Sources: Interviews and surveys with 30 manufacturers and distributors (December 2013) and 13 investors (December 2013–February 2014), Energypedia; A.T. Kearney analysis
0 1 2 3 4 5
Distributionchallenges 4.1
Access to financefor solar firms 3.1
Lack of after-sales services 3.0
• Challenging supply chain from remote manufacturing facilities into rural o�-grid areas
• Limited access to finance identified as a key issue
• After-sales service regarded as relevant buying criterion—which is insu�iciently addressed by the industry
Manufacturers and distributors
Investors

20Investment and Finance Study for Off-Grid Lighting
consumers is not interpreted as one of the top market barriers; however, finance for consumers is still viewed as a barrier. Poor product quality, market spoilage, and a lack of consumer awareness are also identified as barriers, while policy issues only rank around 2.6 and are considered to be less important than the aforementioned barriers.
Further investor barriers include the viability of business models and organizational capabilities. Building up and running an organization with a sound business plan and efficient execution are vital preconditions for successful companies. Additionally, it can be a challenge to find qualified staff willing to live and work in emerging or developing countries. Other market barriers include the scalability of companies—which is crucial to support more commercial funding sources—and a lack of management experience.
On the investors’ side, sometimes the combination of complex business models and a general lack of knowledge of the off-grid lighting industry can complicate the relationship between companies and investors. With regard to the macro level, market development must overcome subsidies, a lack of infrastructure, and ambiguous legal and regulatory environments.
Market risks cannot be ignored, but they can be mitigated
When barriers to success are overcome, market risks may still remain. In table 3 we summarize perceived risk and categorize it into market, company, and product level; we also state macro level risks.
Mitigation
• Introduce internationally recognized quality label and approval for manufacturers and distributors
• Make availability of financing subject to buying approved product from approved manufacturer and distributor
• Ensure attractive and transparent finance o�ering at point of sale
• Ensure the right investors are paired with the right type of companies
• Provide suitable advisory services to fledgling companies
• Make transparent information on firms in the market and market developments
• Introduce product guarantees• Assure good sales techniques
• Build strong, growing companies in the face of challenging macro-level circumstances. Players in the o�-grid lighting sector have proven this possible in many African and Asian countries.
Table 3Market risks and mitigations
Not exhaustive
Market level
Risk
• Counterfeits of low quality could enter the market, proving unreliable, causing brand disillusionment
• Consumer taste could evolve to shun SOGLP
• Loan sharks can decrease consumer confidence in micro loans
Company level • Business models are yet unproven in terms of ability to scale up and in terms of sustainable profitability
• Current returns are lower than expected, disappointing investors
• Some investors detected bubble e�ects around certain SOGLP companies
Sources: Interviews and surveys with 30 manufacturers and distributors (December 2013) and 13 investors (December 2013–February 2014); A.T. Kearney analysis
Product level • Products do not meet end consumer expectations (for example, in terms of battery life, quality, and performance)
Macro level • A lack of subsidies reduces the uptake of SOGLPs as they are less a�ordable to low-income customers
• Ine�icient legal systems, corruption, and ambiguous regulatory environments can lower the readiness to invest into SOGLP players, especially in the seed phase

21Investment and Finance Study for Off-Grid Lighting
While both investors and firms need to consider risks and mitigation options, a number of risk mitigation possibilities may be seen in GOGLA’s mission statement. Supporting industry and helping investors mitigate risk is part of the organization’s role in enabling a more stable and profitable market.
Because marketing resources are scarce and rural areas are widespread, companies rely primarily on word- of-mouth marketing.
Innovative business models right out of the starting blocks
Innovation is already under way in the market. Technology and business processes are adapting to the specific needs of SOGLPs and there are already many options, though there is no clear winner.
Pay-as-you-go and pay-to-own systems and cooperation with mobile technology playersPay-as-you-go solutions are well-known to the developed world from the early days of prepaid mobile phones. To make SOGLPs more affordable and establish increased possibilities for consumer finance, mobile technology is an important enabler. It also stresses the synergies between mobile penetration and off-grid lighting mentioned earlier. Pay-as-you-go solutions allow customers to take home SOGLPs such as SHS after an initial deposit. The SHS contains an embedded SIM card with which further payments are made through existing mobile money platforms. Customers have to activate their solar devices through a code that they find on a scratch card, which can be purchased at even the smallest outlets. If payments are late, units can be remotely turned off. Once the SHS is fully paid, it is permanently turned on and fully owned by the customer, allowing them to access the credit backed by this asset. For instance, in Uganda, distributor M-KOPA not only offers its customers financial payments on a pay-as-you-go basis, it is also partnering with mobile network operator Safaricom. In addition to shared promotion costs, distribution through Safaricom shops, and a revenue sharing agreement, Safaricom offers reduced pricing for mobile money payments to M-KOPA customers, enabling additional financial solutions for low-income customers. Besides these innovative solutions, traditional microfinance institutions can help increase product availability. A similar range of innovative solutions are also available from companies such as SunTransfer, Azuri, and Mobisol.
Consumer awareness and educationCompanies are also working to increase consumer awareness and education. Because marketing resources are scarce and rural areas are widespread, companies rely primarily on word-of-mouth marketing. Hence, it is important to work with well-known and respected people who will support the product. For example, SunnyMoney mainly sells through school teachers who demonstrate the advantages of SOGLPs to students’ parents. The parents then pass on what they have learned to their relatives, friends, and neighbors. Dutch electronics company Philips, which has a larger marketing budget than SunnyMoney, conducted the “From Cape Town to Cairo Roadshow” to raise awareness of sustainable healthcare and lighting solutions, visiting nearly 20 locations across Africa.

22Investment and Finance Study for Off-Grid Lighting
Distribution modelsOn the distribution front there are as many solutions as there are companies. SunnyMoney leverages its school setup. French Oil giant Total sells SOGLPs at their 3,500 outlets across sub-Saharan Africa. Greenlight Planet and other companies sell through micro entrepreneurs who belong to the middle income group and are trusted community members. This ensures that their salespeople are not solely dependent on SOGLP sales, but can multiply their income with it. They act as independent village sales agents who also take on a big role in customer education and explain the advantages to their communities, such as how much they can save on kerosene.
Capital is a barrier to the industry’s development, with companies at the distribution end of the value chain especially facing shortages. Every solution has its pros and cons. In the micro entrepreneur model, a sales force has to travel around large, sparsely populated areas. In a typical distribution-dealer concept, such as the one used by Total, the challenge lies in the last-mile distribution. Fuel stations in sub-Saharan Africa are mostly in urban or suburban areas and wait for the customers to come to them rather than going out and promoting the product. Installation and after-sales services are also a challenge to accommodate in the Total model, which makes it less suited to larger, often modular solar home systems. Especially in consumer finance and distribution models, firms continue to experi- ment and a best practice has yet to emerge. With more capital available, however, distribution models can be scaled up to more efficiently and effectively serve the rural customer base.
Another promising distribution model consists of a network of service stations—belonging to one company or consisting of independent small companies in a franchise model—that sell units, offer installation services for larger systems, provide microfinancing, and offer after-sales services. Leading firms using this model include Onergy, SunTransfer, Mobisol, SolarGrid, Orb, NRG Renewables, and Rahimafrooz.
Financing Needs and Investing in the Off-Grid Lighting IndustryCapital has been identified as one of the principle barriers for the industry’s further development. Specifically those companies at the distribution end of the value chain face capital shortages. Although there is interest from capital providers to invest, as the environmental and social impact is in most cases clear, the greatest difficulty appears to be “matching” requirements from financing providers to the company profiles. This mismatch includes size of the target, investment ticket size, geographical footprint, expectations on return, interest charge expectations, product focus, and value chain positioning, to name a few. Even if there is a match, while financing providers obviously need time to assess opportunity and risk, the target companies do not always have the capacity to handle the assessment process.

23Investment and Finance Study for Off-Grid Lighting
Barriers to finance
We interviewed both SOGLP firms and investors regarding growth-limiting market barriers (see figure 16). The chief barriers mentioned were those that include general risk factors such as currency risk and uncertain legal/policy frameworks; barriers that are caused by the early life cycle of this industry such as the limited track record of players; lack of successful invest-ments by investors; subcritical deal sizes; no common platform for impact investing; and barriers on the investors’ side such as insufficient knowledge of investors, no innovative deal/fund structures, and better investment opportunities in other industries.
In order to compare the two points of view, we divided the outcomes into two groups with opposing or similar levels of importance on the same topic.
From an investor’s perspective, the firms’ short-track records are a major hindrance to financing. From a firm’s perspective, financing is a classic “What comes first, the chicken or the egg?” scenario. With little appreciation of deal and fund structures and insufficient knowledge of financiers’ requirements, it is a challenge to secure the initial tranche of financing that will provide the necessary track record to secure financing going forward.
Both sides have a similar view regarding the foreign currency exchange risk, the lack of successful investments by investors, the policy frameworks, the lack of a common platform, and the high level of due diligence time and high transaction costs relative to deal size.
Figure 16Barriers to finance from investor and industry player perspective
Sources: Interviews and surveys with 30 manufacturers and distributors (December 2013) and 13 investors (December 2013–February 2014), Energypedia; A.T. Kearney analysis
0No barrier Strong barrier
Better investment oppor-tunities in other industries
3.22.0
Div
ergi
ng v
iew
s
Limited track recordof industry players
Insu�icient knowledgeof investors
No innovative dealor fund structures
Lack of successfulinvestments by investors
Uncertain legal andpolicy frameworks
1 2 3 4 5
Foreigncurrency risk
2.63.6
3.52.7
3.63.0
2.53.0
3.22.7
3.33.7
No common platform totalkabout impact investing
3.12.8
Subcriticaldeal sizes
3.43.3
Manufacturers and distributors
Investors
Further mentioned:• New risky markets in risky countries
scare o� investors
• Local banks do not get involvedenough and charge prohibitive interest rates
• Social institutions prefer projects in even less developed countries, expecting the impact to be higher
• Market conditions distorted by donations from social institutions
• Insu�icient ability of industry players to generate positive cash flows
Sim
ilar v
iew
s

24Investment and Finance Study for Off-Grid Lighting
Both investors and industry players consider the following to be the biggest challenges for financing: the lack of legal and policy frameworks, appropriate fund structures, and the high level of transaction cost relative to the deal sizes.
Industry view on top three barriers to financing
Despite investor interest in the industry, it is difficult for companies to secure the financing they need. To understand why, we took a closer look at the top barriers.
The results are surprising. While a lot of publications and industry experts mention firms’ missing track records, our interviews indicate that this is of relatively low importance. Investors are typically aware of the fact that startup companies cannot provide them with the same historic data and security as established firms. From the companies’ perspective it is more about investors adapting to and getting acquainted with the industry’s specifics. There is a clear need to coordinate between firms, investors, and governments to find financing solutions that share risks between the three groups of stakeholders while accommodating the industry’s needs. The barriers to finance, rated from 1 (least important) to 5 (most important) are displayed in figure 17.
All interviewees mentioned the risk and return profile of the countries they are operating in. Some found that impact investors had not lived up to their expectations because they apply predominantly commercial criteria in a business where societal gain also plays a role. Impact investors are also struggling to believe in high-impact investments that are financially sustainable and generate returns. A number of social institutions also seek to invest in the least-developed countries, and therefore reject opportunities in countries such as Nigeria for lesser-developed countries such as Ethiopia that seem to be a better fit for philanthropic missions. Finally, local banks either do not get involved in the industry at all or claim prohibitive interest rates above 20 percent. However, there is a sense that local banks would be particularly valuable as they know the local market and local working capital is lacking. To summarize, industry believes that with more innovative models, better information, and bigger deals, funds should be streaming at higher volumes moving forward.
Figure 17 Barriers to finance from firm perspective
Top three hurdles
Sources: Interviews and surveys with 30 manufacturers and distributors (December 2013) and 13 investors (December 2013–February 2014), Energypedia; A.T. Kearney analysis
0 1 2 3 4 5
No innovative deal or fund structures 3.6
Insu�icient know-ledge of investors
Subcriticaldeal sizes
• Industry players miss initiatives from investors to support building the market
• Potential investors assumed to have limited understanding of market dynamics and challenges
• Subcritical deal sizes don’t allow recovery of due diligence or transaction costs
3.5
3.4 Manufacturers and distributors
Investors

25Investment and Finance Study for Off-Grid Lighting
Investors’ view on top three barriers to financing
To understand why investors have been hesitant to invest in the energy access segment, we took a look at the top barriers from the investors’ perspective (see figure 18).
The two main barriers to finance are the uncertain legal or policy frameworks in the countries of interest (3.7 points) and companies’ small track records (3.6). Additional challenges include the level of due diligence and other transaction costs, the foreign currency risk, and the lack of innovative deal or fund structures. However, two additional problems—the lack of any common platform for bringing together companies and impact investors on one hand and a general lack of knowledge concerning the energy access industry on the other—could be solved with the creation of a space linking companies to investors and disseminating information about the energy access market and industry.
The lack of best practice examples is another major barrier for investors. This leaves investors with the impression that successful investments are rare. When it comes to measuring the impact of energy access there are no clear guidelines and inadequate practices continue to prevail. However, while many companies assume that the energy access segment has to compete with other industries where opportunities might be better for investors, investors do not appear to think that way.
Additional challenges mentioned by investors include the industry’s complex and varying business models. Business ideas and market opportunities have to be congruent and investors stumble over the complexity of many business models, requiring a disproportionate amount of time to fully understand them.
Another challenge for investors is brain drain. A highly qualified management team is crucial for investors, who throughout the interviews consistently emphasized the inability to attract and retain quality management. Further obstacles include scalability and the capacity to generate positive cash flow. Many investors also pointed out the lack of viable exit options, well-structured opportunities for equity investments, and the lack of self-claimed “debt-ready” companies.
Another significant barrier is the market distortion caused by the donation of millions of free lamps. Investors’ models are based on commercial market projections that become invalid if
Figure 18 Barriers to finance from investor perspective
Top three barriers stated by investors
Sources: Interviews and surveys with 30 manufacturers and distributors (December 2013) and 13 investors (December 2013–February 2014), Energypedia; A.T. Kearney analysis
0 1 2 3 4 5
Uncertain legal orpolicy frameworks 3.7
Limited track recordof industry players 3.6
Subcriticaldeal sizes 3.3
• Investors more concerned about uncertain market and regulatory conditions
• Limited trust in industry players’ ability to deliver on their promises
• Subcritical deal size identified as a key issue
Manufacturers and distributors
Investors

26Investment and Finance Study for Off-Grid Lighting
an institution decides to give SOGLPs out for free. Of course, these donations can produce an immediate impact in a limited geographical area and provide a proof of product need on the end-user side, but they do nothing to enhance perceptions of the industry’s long-term profit potential and do not encourage further investment. Thus, these philanthropic acts actually stand in the way of a market takeoff that could have a much greater overall impact.
Understanding the SOGLP industry value chain is key to understanding where capital is needed
Figure 19 provides an overview of the parts of the value chain for SOGLP players. However, the list is not exhaustive as the industry is quite fragmented and local players often remain under the radar.
We can categorize the focus areas of four types of players:
1. Design and engineering, manufacturing steps
2. Distribution and resale
3. Consumer financing
4. Integration along the value chain (as it is with the biggest players)
1 Manufacturing certain components at own factories2 Implementing pay-as-you-go solutions3 Distributing only in own projects
Note: MFIs are microfinance institutions.
Sources: United Nations Foundation; A.T. Kearney analysis
Figure 19 O�-grid lighting landscape along the value chain
Industry value chain coverageManufacturers Distributors and retailers Consumers
d.light/Barefoot Power
Azuri/Mobisol
Philips
Osram
NIWA
Fosera
Prosonergy
Total
SunnyMoney
SunTransfer
Solar Sisters/ARTI
KIVA/Local MFIs
Design andengineering Production International
distributionNationaldistribution Retailing After
salesConsumerfinancing
1
1
Active
3
1
1
2
Partially active

27Investment and Finance Study for Off-Grid Lighting
However, position in the value chain varies from company to company. At the one extreme, d.Light tries to cover the value chain from end to end. It appears as a manufacturer and it sells products directly to distributors in some countries while it handles product distribution in other countries. Additionally, the company is involved in intensive marketing and groundwork educating consumers.
At the more focused end of the spectrum, Prosonergy restricts itself to international and national distribution, while SunnyMoney resells products and offers after-sales services.
Last but not least, there are companies such as KIVA and local microfinance institutions that partner with the industry, offering consumer finance solutions and providing after-sales services.
With the off-grid market evolving, especially on the distribution side, we assume that players would prefer to focus on their core competencies going forward. Yet what we observe today are industry players performing activities along the value chain that—while they do not form part of their core competencies—they see as necessary to get the product to the end customer. One of the main reasons for this appears to be a scarcity of financial resources, especially on the distribution and retailing end of the value chains such as for local or national distributors and resellers, reducing their ability to operate effectively. Additionally, consumer financing for solar lights, which could partially make up for the scarcity of funding at the distribution and retail end, is underdeveloped.
Investors’ view of industry attractiveness along the value chain
Investors are very interested in investing in business models covering national distribution and consumer financing, or business models that comprise the whole value chain from design and engineering, manufacturing, international and national distribution to resell, consumer financing, and after-sales services. Mr. Samir Patil, a serial entrepreneur, once said, “Product is king, but distribution is God!” Well, in the off-grid lighting and energy sector, this idea has become the reality and distribution remains the largest industry challenge. Compared to past years, there is a downstream movement with fewer investments in design, engineering, and manufacturing. Figure 20 illustrates this development.
Design andengineering Manufacturing International
distributionNationaldistribution Retailing After sales Consumer
financing
Figure 20 Investor focus along the player value chain
Investors’ view on the attractiveness of business models (% of interviewed companies)
Sources: Interviews and surveys with 13 investors (December 2013–February 2014); A.T. Kearney analysis
15% 15%23%
62%
31%15%
62%54%
Downstreaming: Switch from design and engineering to distribution, consumer finance, and holistic approaches
Manufacturers Distributors and retailers Consumers
Number of investors (multiple answers possible)
Holistic

28Investment and Finance Study for Off-Grid Lighting
Industry capital requirements today and in the future
Figure 21 shows the industry’s capital requirements along the value chain. For logistics and distribution these requirements are determined by the time it takes for the product to get from manufacturing to the end consumer. Distributors experience a double financing burden. On the one hand, they have to finance upstream as they order from the manufacturer. For example, one interviewee noted that while shipping takes 50 days, manufacturers do not normally offer such long payment terms, especially not to smaller companies. On the other hand, they would like to pass down the best possible payment terms to customers and resellers to stimulate further demand. Due to capital constraints, national distributors and resellers can only order small batch sizes that are not efficient to ship internationally. This problem is particularly pronounced in the SOGLP industry as it takes time to sell off the products through under- developed distribution channels and consumer financing is quite complex. While delivery conditions and payment terms can be negotiated (such as payment on receipt of goods), the scale and financial position of distributors does not make for a strong negotiation position with larger manufacturers.
In summary, the bottleneck is at the level of national distributors and resellers, which have only rudimentary structures and need investments to increase their distribution network and working capital to finance their orders. This leads to significant working capital needs at every step between the manufacturer and the end consumer. Using market sizing and interview data, we estimate about $77 million is needed in transport and import and $130 million is needed in distribution and retail today, with rapidly increasing mid-term and long-term numbers that are displayed in figure 21. As per our affordability sensitivity analysis, consumer financing requires about $15 million in capital today.
1 Capital requirements satisfied or to be satisfied by equity or debt (actual financing demand should be lower than capital requirements)
Sources: Niwa, Lighting Africa, Dalberg Analysis, csimarket.com; A.T. Kearney analysis
Figure 21 Capital requirements in the SOGLP industry
Capital requirements per value chain step1
($ million)
Months
Manufacturers Distributors
and retailers Consumers
287
3,908
7,600
15
198
1,100
130
1,800
2,300
77
1,040
2,300
65
1,900
870
1 2 3 4 5 7 8 9 10 11 12 13 14 15 16 176
Transpor-tation
Total capitalrequirements
• Need capital for R&Dand to pass along good terms to logistics and distributors
• Distributors and retailers need to finance upstream and downstream
• Huge working capital needs because of long transport and distribution times
• About 50 percent of consumers need to finance their o�-gridproduct
Needed to realize themarket potential
Today
SPL
SHS

29Investment and Finance Study for Off-Grid Lighting
While manufacturers also have significant capital requirements, they are not in urgent need of new financing sources because they already have good access to financing facilities.
The total capital requirements today are modelled and estimated at about $300 million, growing to about $4 billion for the whole SPL market and $7.6 billion capital for the SHS market.
At the industry level the capital need is indeed significant, yet to nail down where the oppor-tunity really lies company-level examples of short-term needs can be useful (see figure 22):
• A single-country African distributor with $0.7 million in revenues needs about $1 million in working capital as soon as possible, while it needs a further $0.25 million of mid-term investments for R&D (for product maintenance), expanding distribution, and general capex or consumer finance. The urgent need for working capital is acute; scaling up will not be possible without it.
• A medium-sized design, engineering, and manufacturing company with $2 million in revenues needs $0.5 to $1 million in working capital and only $0.15 to $0.30 million for other purposes.
• One of the largest players in the industry that covers the whole value chain needs $5 million in working capital.
Current investment focus
As figure 23 on page 30 shows, investors offer the least funds during the seed period of the SOGLP life cycle, while early stage and growth enjoy the most investor attention. These phases are favored by investors as risks are somewhat contained and risk-adjusted returns can be higher. However, SOGLP players at the distribution end can still be in the seed phase, which is insufficiently covered due to investors’ self-perceived risk aversion. This presents a specific challenge to startup companies in this industry.
Selection
Sources: Expert interviews; A.T. Kearney analysis
Figure 22 Examples of capital requirements in the SOGLP industry
Companysales in $ 100,000 0 1,000,000 5,000,000
Workingcapital
R&D, expanddistribution,consumer finance, capex
… and needs further investments of about $1 million only mid-term
… and needs $150k to 300k to finance R&D and capex
… and has no further capital needs right now, because of an equity raise last year
A small single-countryAfrican distributor needs about $250k in working capital as soon as possible …
A medium-sized design, engineering, and manufacturing company needs $500k to $1 million working capital ...
One of the largest players in the industry that covers the whole value chain needs $5 million working capital ...
500,000 10,000,000
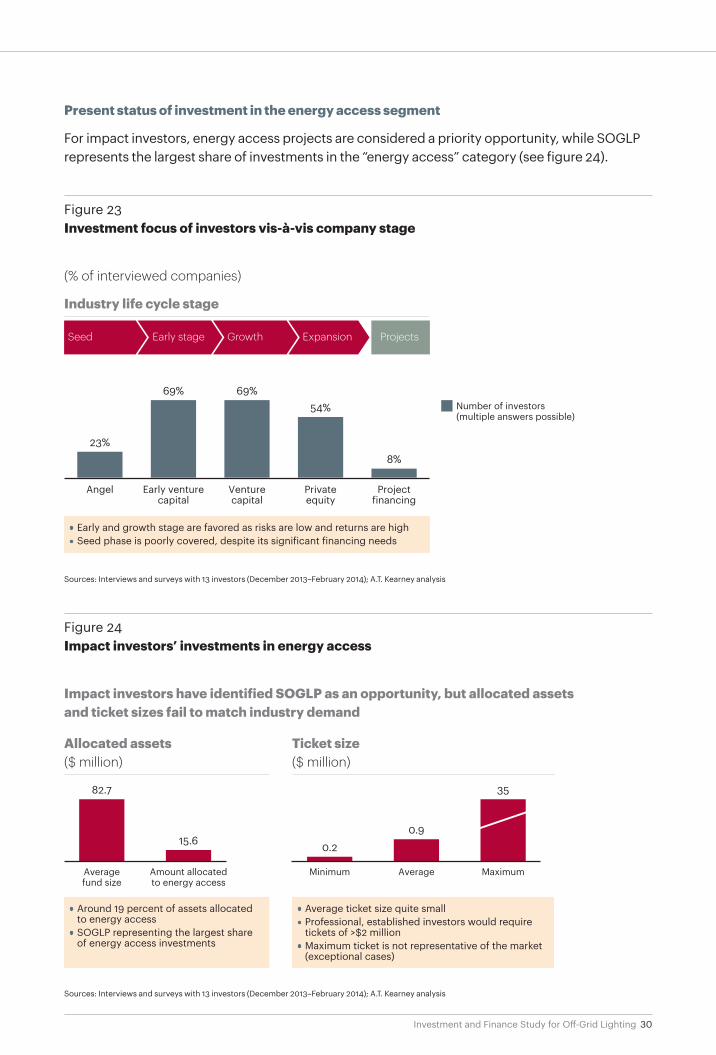
30Investment and Finance Study for Off-Grid Lighting
Present status of investment in the energy access segment
For impact investors, energy access projects are considered a priority opportunity, while SOGLP represents the largest share of investments in the “energy access” category (see figure 24).
Figure 23 Investment focus of investors vis-à-vis company stage
Industry life cycle stage
(% of interviewed companies)
Sources: Interviews and surveys with 13 investors (December 2013–February 2014); A.T. Kearney analysis
Angel Early venturecapital
Venturecapital
Privateequity
Projectfinancing
Number of investors (multiple answers possible)
23%
69% 69%54%
8%
Seed Early stage Growth Expansion Projects
• Early and growth stage are favored as risks are low and returns are high• Seed phase is poorly covered, despite its significant financing needs
Figure 24 Impact investors’ investments in energy access
Impact investors have identified SOGLP as an opportunity, but allocated assets and ticket sizes fail to match industry demand
Allocated assets ($ million)
Ticket size ($ million)
Sources: Interviews and surveys with 13 investors (December 2013–February 2014); A.T. Kearney analysis
• Around 19 percent of assets allocated to energy access
• SOGLP representing the largest share of energy access investments
82.7
15.6 0.20.9
35
• Average ticket size quite small• Professional, established investors would require
tickets of >$2 million• Maximum ticket is not representative of the market
(exceptional cases)
Averagefund size
Amount allocatedto energy access
Minimum Average Maximum

31Investment and Finance Study for Off-Grid Lighting
As it stands, 19 percent of impact investor funds are currently invested in energy access. That proportion is expected to increase as 69 percent of impact investors have already invested in energy access and now want to invest more, whereas 23 percent have not invested in the sector yet but intend to at some point. In fact, only 8 percent of impact investors show no interest in the area.
These numbers suggest that investors understand the potential of the off-grid energy market and expect the market to grow even further. With most investors operating globally, the regional focus lies on sub-Saharan Africa and Asia, more specifically on East Africa and Southeast Asia. This is in line with our market growth projections of growth rates around 77 percent in the sub-Saharan and Asian regions. Furthermore, the social impact produced by investing in the energy access segment is considered to be quite high, especially in comparison to other segments.
The issue is that the average ticket size sought by industry is $900,000. This is considered subscale, as a minimum ticket size for this class of investor is normally $2 million or more. As a result, funds and industry are encouraged to explore innovative ways of ensuring ticket sizes more closely match the needs of the off-grid lighting industry.
With regard to the financing models, there is a balanced picture between debt, equity, and mezzanine financing. However, more debt financing will be needed in the future as the energy access market grows and more companies enter the growth phase and require debt financing.
Linking financial needs to financial instruments
Investors whose investment criteria fit the current industry state will find the market attractive. Figure 25 illustrates the typical life cycle of a young company and the stages in which some types of investors typically invest. It also illustrates how the focus in financing shifts from equity to debt.
Examples
1 Given the nature of the industry, these companies are not technology-cost intensive (even at small scale and with a very local focus, low but positive profitability can be achieved at early stages)
Source: A.T. Kearney analysis
Figure 25 Investors along the industry life cycle
Seed
Equity
Debt
Early stage Growth Expansion
TimeAngel
Philanthropic
Impact investors
Private equity
Venture capital
Development banks
Strategic investors
Commercial banks
Family o�ices
Factoring service providers
Strategic investors(testing the market)
Investors with best fit industry requirements Relevance of equity versus debt Sales Profitability
Uncommonly quickbreak-even points1
Current industry state

32Investment and Finance Study for Off-Grid Lighting
Right now the off-grid lighting industry as a whole is between the early stage and the growth stage. That said, the industry average masks the variance in firms’ maturity levels that can result from their place in the value chain, geography, and capabilities. Investors need to be selective given their appetite for risk.
As the industry enters the growth phase, this opens new financing options. More mature companies can start to work with commercial banks, factoring service providers, private-equity providers, and strategic investors.
There are numerous solutions and new ideas to facilitate funding in the industry
When conducting research and interviews we found numerous examples of how SOGLP firms secure capital and what could be potentially innovative approaches. Figure 26 gives an overview of these, sorted along “innovative,” “already established,” other equity, debt, and general enablers.
Already established practices of how firms in the SOGLP industry are financed today include:
Social/impact and VC investors. Impact and VC investors with a cause are the most prevalent and often the first equity investors in the off-grid industry. They are also increasingly willing to provide loans.
Corporate investments. Corporates, which preferably already act as equity investors, can provide loans at attractive rates and help source credit and loan guarantees through their own banking connections. Corporates usually have a strategic rationale for being involved in the segment and the respective geographies (such as learning curve and developing market foothold).
EquityAlreadyestablished
Information ornew, innovative
Debt General enablers
Notes: NGOs are non-governmental organizations. SME is small and medium-sized enterprise.
Sources: Interviews and surveys with 30 manufacturers and distributors (December 2013) and 13 investors (December 2013–February 2014); A.T. Kearney analysis
Figure 26 Existing practices and innovative solutions to finance
Social impact and VC investment fundsCorporate investments Working capital funds Pooling of projects
Technical assistant facilities
Angel (loans)
Smart end-userfinancing schemes
Credit guarantees andcredit enhancements
Social institutions, NGOs, ordevelopment financing providers
Industry-specific public and private SME growth capital fundsFund with technical assistance pool
Mobile technology solutions
Crowdfunding
Local SPV financingInventory as collateral
Financing within the value chainExport guarantees
Factoring
Donor-supported businessplan competitions
Revolving working capital fundwith first-loss tranche
Revolving working capital fundwith first-loss tranche
Sharing and learning networkfor investors
Standardized objectiveimpact measurement

33Investment and Finance Study for Off-Grid Lighting
Working capital funds. International organizations can provide working capital facilities. One example is the IFC Working Capital Fund. IFC set up a $10 million working capital fund specifically for off-grid projects. The money is allocated through Shell Foundation at interest rates of 12 to 14 percent.
Angel loans. Some firms have also received small loans from angel investors. For individuals investing with a cause, return is not always the top priority, so loans can be relatively inexpensive. Furthermore, companies can build up a debt history, which opens the possibility for other sources of finance.
Social institutions/NGOs/development financing providers. Some firms have received loans at favorable interest rates from social institutions or NGOs. These are mostly non-profit institu-tions that can provide charitable money as loans. Interest rate and repayment requirements are usually very flexible, and in some cases loans can be interest free.
Smart end-user financing schemes. End-user financing is one of the main barriers for the development of the segment as mentioned already. The focus should be on clear investor offering and a professional management for such loans locally.
Credit guarantees and credit enhancements. This option exists in one or the other form, not specifically for this segment only (for example, the USAID loan guarantee program in partnership with Acumen Fund). We would expect to see more similar structures, maybe with a higher standardization degree so the industry can benefit.
Technical assistance facilities. Technical assistance facilities, as the name suggests, provide technical assistance but also commercial and strategic advice. These facilities tend to be donor funded and consist of experienced consultants who provide firms and investors with support. Working with such facilities provides potential investors reassurance that the firms they are dealing with have the necessary capabilities to manage their finances and avoid default. Specialized impact funds are starting to integrate technical assistance facilities in their overall offering, therefore going beyond a standard financial provider.
Pooling of projects. This could be a suitable financing approach. However, for investors who have encountered difficulties in the past, it is very complicated and time consuming to align different projects in various stages of development. Banks make loans to the pool rather than the individual firms, thus assuming a risk profile more closely aligned to the industry through diversification. While pooling projects might help to control risk, successful companies may be held back by losses of poorly performing companies in the same loan pool.
We also highlight approaches in formation or new approaches and setups that can facilitate funding for this industry. These still need to be investigated, taken further, and brought to life by investors, industry players, institutions, and governments.
Industry-specific public-private SME growth capital funds. Funds that bundle public and private investments have proven to catalyze other industries, such as biotech incubators. Private money is leveraged by public contribution and the whole fund is managed by financial professionals. The sole purpose of the fund is to provide growth capital. Risk sharing between the public and the private can be structured appropriately.
Fund with technical assistance pool. As mentioned already, there are several funds (either existing or newly launched) that are in the process of developing a technical assistance facility in order to increase the success rate of their investments by providing support on governance,

34Investment and Finance Study for Off-Grid Lighting
organizational matters, legal issues, business development, financial planning, budgeting, and strategy. Most of these technical facilities will be funded by third-party not-for-profit sources or development financing. At a later point, once the companies are in a position to remunerate the experts for the mentioned support, such activities could be funded or co-funded by the companies themselves.
Crowdfunding. Crowdfunding platforms such as sunfunder.org, Milaap, and Kiva have two functions. First, they fund single projects or firms with relatively small amounts of capital. The money typically comes from non-professional investors and individuals in the online community who want to invest in a cause, and the crowdfunding platforms’ experts screen potential targets and propose them for investment. In this fashion, a startup may get its first loan or equity investment, from which they can build a debt repayment history. Firms that do so become more bankable as crowdfunding platforms act as an intermediary between startups and commercial investors, conducting the due diligence of picking and pooling investment opportunities for them, as they already did for the crowd. In particular, they bridge investors’ lack of knowledge about the industry.
Donor supported business plan competitions. Donors can still play an important role in the industry when companies are not sufficiently attractive to commercial investment. One possi-bility is to have business plan competitions organized by financial professionals in order to allocate donor funds.
Local SPV financing. This might work in certain cases or in certain countries; however, it would have to be built into a structure that the investment funds are used to handling and offering to clients.
Revolving working capital fund with first loss tranche. This is one idea that could attract commercial investors to the sector and build a track record to attract further financing from investors focusing more on businesses with proven track records, sales, and a market footprint. The fund could be structured in such a way so that first losses are assumed from third-party non-profit money.
Inventory as collateral. Several companies indicated that they felt they could more easily secure financing if lenders accepted their inventory as collateral. Two of the interviewed companies already do this with social institutions. Social institutions and impact investors more easily accept inventory as collateral because they do not discount it in the way a bank does, as they know the markets and through their network they could be in a position to sell it on. The practice is not common at all among bank lenders, especially once the goods arrive in their target markets in the developing world.
Financing within the value chain. Leveraging existing relationships along the value chain or with existing investors may be one way to secure funds in countries where more formal financing is less developed. In one case, a distributor was able to get improved payment terms from its supplier because the supplier’s equity investor provided a loan to the supplier to pass down to its distributor in the form of a good payment term. More generally, the idea is that manufacturers receive a loan from a commercial bank and then allocate it in smaller tranches to its distributors in each country. The manufacturer has a deep knowledge of the capabilities of its distributors, which can reduce transaction costs and the need for due diligence. Local partners that already have a significant presence in the market can help to access much needed local banks. While companies in different stages of the value chain could partner up and apply for financing together with a well-structured plan, empowering their offering and increasing their financing probabilities.

35Investment and Finance Study for Off-Grid Lighting
Loan and export guarantees. A promising method, it is also a way of sharing risk. It is mostly governments, social institutions, and NGOs who give loan guarantees to de-risk the investment for commercial lenders. In the case of export guarantees, the private insurance industry or the exporter’s country’s government cover the credit risk and other risks involved in export transactions against a fee. Additionally, governments or national banks from the importer’s and distributor’s country can also cover their national firms’ credit defaults, as does the National Bank of Ethiopia. In the case of SOGLP manufacturers, this would not directly solve the capital shortage problem, but it would make manufacturers much more comfortable exporting to markets with a high perceived risk, such as sub-Saharan Africa. First, manufacturers get better access to money, which they could then pass on to local importers and distributors. Second, they improve credit terms and order sizes to a certain extent, because they do not have to worry about not receiving payment.
Factoring. Factoring is a common but relatively expensive approach to funding in most estab-lished industries. Receivables are “sold” at a discount to a financing company for cash in order to feed working capital. A twist on this approach comes from the impact investment manage- ment firm Invested Development, which set up the Impact Factoring Fund (IFF). The purpose of IFF is to transition this proven model into the impact world and leverage its knowledge in impact investing, credit trading, and startup development. It makes companies more attractive to potential lenders in three ways. First, it affirms the company’s growth projections. Second, it verifies invoicing and accounts receivables. Third, it schedules repayment commitments based on acceleration of growth. It gives investors the opportunity to participate in asset-based finance solutions in emerging markets that they would not seize without an intermediary due to lack of knowledge and the size of transaction costs. Thus, it seeks to help impact startups create a more continuous sales cycle, accelerate sustainable business growth, and ultimately become more attractive to commercial investors.
Other risk-sharing facilities. There are other mechanisms of risk sharing. Because global and local commercial banks—at least today—are generally too risk averse to lend to the solar lighting industry, risk sharing facilities help reduce uncertainty and risk barriers, resulting in more compet-itive interest rates. Typically, governmental or social institutions provide partial loan guarantees.
In addition, we see some enablers that do or can support financing for this industry.
Sharing and learning network for investors. The industry is still very much undeveloped and information is scarce. Firms, investors, NGOs, governments, and various institutions need to bundle their efforts and create transparency, especially to educate investors. Market investors need to know right away where they can gather market information in order to determine market transparency, support their due diligence process, and minimize transaction. This includes whom to talk to, where to talk to peer investors, and how to get in contact with potential targets. Although there were some efforts to pool deal flow and standardized information on companies to be funded in the impact segment with online platforms and resource centers, there is still no energy access or SOGLP platform to facilitate this in a professional manner.
Standardized objective impact measurement. Most investors in the segment apply their own impact measurements and reporting methodologies. Most of these methodologies are developed around the GIIN indicators (Global Impact Investing Network) and are further developed, adjusted, and customized to the investor’s internal requirements. Developing specific impact standards indicators, goals, and methodologies for this segment could provide more standardization for the industry and increase investor comfort level.

36Investment and Finance Study for Off-Grid Lighting
Mobile technology solutions. Use of pre-paid and pay-as-you-go systems and energy as utility in combination with end-user financing schemes are described above.
Consumer leasing and microfinancing
It could be possible to reduce the financing problems of the industry by financing end consumers directly. The principle is aligned with modern leasing and financing companies in the developed world. Microfinance institutions (MFIs) and small loans providers would finance the purchase toward the distributor and take a down payment on the SOGLP from the consumer. The consumer pays in monthly installments (preferably no higher than previous kerosene costs) until the product is paid off, upon which ownership is transferred to the consumer. Ideally, the distributor also improves his payment conditions and cash flow.
In this case, the idea would be to specifically target microfinancers and small loans providers with capital earmarked for SOGLP.
Summary and Call to ActionWhat this report makes clear is that the industry’s growth can be enhanced and accelerated by adequate financing. Adequate financing makes sense not just for financial returns, but also for more tangible societal benefits.
Here we summarize the top 10 reasons why investors and financial organizations should consider how they can make their investment models work in this sector:
1. There are 1.4 billion people without access to electricity and modern lighting solutions today, and the United Nations has called for strong initiatives to reach universal energy access by 2030.
2. The potential market size ranges from about $2.7 billion for solar lanterns to $50 billion including larger solar home systems and accessories such as TVs, fans, and other electrical appliances
3. Solar lanterns are brighter, healthier, and cheaper than kerosene lamps.
4. The economic advantage will increase as kerosene prices rise and SOGLP component costs fall.
5. Customers can afford SOGLPs. Right now, supply, not demand, limits the market.
6. The industry is already in strong growth mode despite being heavily underfunded; more capital will unlock its true potential.
7. The market is becoming more established with proven business models and profitable players, which greatly increases transparency and decreases risk for investors.
8. Appropriate equity and debt funding approaches are readily available, but not fully used to remove financial barriers to market growth.
9. Enablers such as technical assistance facilities, mobile solutions, sharing, and learning networks will drive further professionalization of the market.
10. Investors can have a huge impact on the life of hundreds of millions of people, enabling further economic development in the poorest parts of the world.

37Investment and Finance Study for Off-Grid Lighting
We recognize that companies in the industry and financial investors will need to adapt their existing approaches to accommodate the particularities of this industry. Specifically, we call to philanthropic and angel investors to:
• Direct philanthropic money toward a facilitator role by providing commercial loans, loan guarantees, support for seed funding, or technical assistance
• Innovate, such as by offering special funds for seed funding
• Fund mechanisms that facilitate and encourage commercial investment
We call on impact investors and venture capital providers to:
• Consider options to provide seed funding; early involvement is low-outlay and can provide early insight into company performance
• Provide technical assistance or set up sharing and learning networks
• Innovate with the industry on ticket size and mutually acceptable deal structures
• Directly influence policy to improve market conditions
We call on banks and other major lenders to:
• Work with manufacturers to stimulate downstream development
• Work with equity investors to create more transparency in the market at every level
• Initiate discussions with governments on the tradeoff between debt financing of grid expansion and SOGLP products in light of possible returns
• Adequately capitalize on credible local microfinancing institutions and small loan providers with funds earmarked for SOGLP

38Investment and Finance Study for Off-Grid Lighting
BibliographyAdkins, E; Eapen, S.; Kaluwile, F.; Nair, G.; Modi, V. (2010): “Off-Grid Energy Services for the Poor: Introducing LED lighting in the Millennium Villages Project in Malawi,” Energy Policy 38 (2), S. 10871097
Agoramoorthy, G.; Hsu, M.J. (2009): Lighting the Lives of the Impoverished in India’s Rural and Tribal Drylands
Energy Services for the Poor: Introducing LED Lighting in the Millennium Villages
Furukawa, C. (2012): Do Solar Lamps Help Children Study? Contrary Evidence from a Pilot Study in Uganda
GIZ (2011): Solar Lamps Field Test in Uganda. Final Report
GIZ (2012): Results from a PicoPV Field Test in the Amazon and Chaco Regions in Bolivia
Green Growth Action Alliance (2013): The Green Investment Report: The Ways and Means to Unlock Private Finance for Green Growth
GSMA (2012): Sub-Saharan Africa Mobile Observatory 2012
Gustavsson, M. (2007): Educational Benefits from Solar Technology—Access to Solar Electric Services and Changes in Children’s Study Routines, Experiences from Eastern Province Zambia
IEA (2011): World Energy Outlook 2011: Energy for All—Financing Access for the Poor
IEA (2012): World Energy Outlook 2012
IEA (2013): World Energy Outlook 2013
IFC (2012) From Gap to Opportunity: Business Models for Scaling Up Energy Access
IFC and WRI (2007): The Next 4 Billion: Market Size and Business Strategy at the Base of the Pyramid
Jacobson, A.; Lam, N.L.; Bond, T.C.; Hultman, N. (2013): Black Carbon and Kerosene Lighting: An Opportunity for Rapid Action on Climate
Kantar Market Research (2013): Mobile Phone Use in Africa http://uk.kantar.com/tech/mobile/mobile-phone-use-in-africa/
Kesrelioglu, S. (2011): How do Solar Portable Lighting (SPL) Products Affect the Amount of Time Spent on Educational Activities in Rwanda?
Kürschner, E; Diehl, E.; Hermann-Friede, J.; Hornikel, C.; Rosenbusch, J.; Sagmeister, E. (2009): Impacts of Basic Rural Energy Systems in Bangladesh. An Assessment of Solar Home Systems and Improved Cookstoves
Lam, N. L.; Chen, Y.; Weyant, C.; Venkataraman, C.; Sadavarte, P.; Johnson, M. A.; Smith, K. R.; Brem, B. T.; Arineitwe, J.; Ellis, J. E.; Bond, T. C., (2012): Household Light Makes Global Heat: High Black Carbon Emissions From Kerosene Wick Lamps
Lighting Africa (2011): The Off-Grid Lighting Market in Sub-Saharan Africa: Market Research Synthesis Report

39Investment and Finance Study for Off-Grid Lighting
Lighting Africa (2013): Lighting Africa Market Trends Report 2012
Lighting Asia (2012): Lighting Asia: Solar Off-Grid Lighting—Market Analysis of India, Bangladesh, Nepal, Pakistan, Indonesia, Cambodia, and Philippines
Mills, E. (2012): Health Impacts of Fuel-Based Lighting
Mondal, A.H. and Klein, D. (2011): Impacts of Solar Home Systems on Social Development in Rural Bangladesh
Planète d'entrepreneurs (Hg.) (2012): Social Impact Assessment for HSSi of a Solar Lighting Project in the Philippines
Project in Malawi: Energy Policy 38 (2), S. 1087–1097
SolarAid (2013): Impact Report
UNEP (2013): Sustainable Off-Grid Lighting Solutions Can Deliver Major Development and Climate Benefits http://unep.org/newscentre/Default.aspx?DocumentID=2704&ArticleID=9407&l=en.
UNEP en.lighten (n.a.): Climate Change Mitigation Benefits. http://www.enlighten-initiative.org/CountryLightingAssessments/ClimateChangeMitigationBenefits.aspx.
UNF (2012): Energy Access Practitioner Network. Towards Achieving Universal Energy Access by 2030
WHO (2008): A WHO Plan for Burn Prevention and Care
World Bank (2010): Renewable Energy for Rural Economic Development (RERED) Project, Sri Lanka 2004-2008. Monitoring and Evaluation Completion Report
World Bank (2013). Connection charges and electricity access in Sub-Saharan Africa
Yayasan Dian Desa (2003): The Development Impact of Solar Home Systems in the Province of Lampung, Indonesia: Final Report

A.T. Kearney is a leading global management consulting firm with offices in more than 40 countries. Since 1926, we have been trusted advisors to the world's foremost organizations. A.T. Kearney is a partner-owned firm, committed to helping clients achieve immediate impact and growing advantage on their most mission-critical issues. For more information, visit www.atkearney.com.
Americas
Asia Pacific
Europe
Middle East and Africa
AtlantaBogotáCalgary ChicagoDallas
DetroitHoustonMexico CityNew YorkPalo Alto
San FranciscoSão PauloTorontoWashington, D.C.
BangkokBeijingHong KongJakartaKuala Lumpur
MelbourneMumbaiNew DelhiSeoulShanghai
SingaporeSydneyTokyo
Abu DhabiDoha
DubaiJohannesburg
ManamaRiyadh
For more information, permission to reprint or translate this work, and all other correspondence, please email: [email protected].
The signature of our namesake and founder, Andrew Thomas Kearney, on the cover of this document represents our pledge to live the values he instilled in our firm and uphold his commitment to ensuring “essential rightness” in all that we do.
A.T. Kearney Korea LLC is a separate and independent legal entity operating under the A.T. Kearney name in Korea.
A.T. Kearney operates in India as A.T. Kearney Limited (Branch Office), a branch office of A.T. Kearney Limited, a company organized under the laws of England and Wales.
© 2014, A.T. Kearney, Inc. All rights reserved.
AmsterdamBerlinBrusselsBucharestBudapestCopenhagenDüsseldorfFrankfurtHelsinki
IstanbulKievLisbonLjubljanaLondonMadridMilanMoscowMunich
OsloParisPragueRomeStockholmStuttgartViennaWarsawZurich