Investing in the Future of California’s Fisheries “The ...€¦ · Investing in the Future of...
96
Investing in the Future of California’s Fisheries “The California Fisheries Fund” Business Framework October, 2006 Comments on this document are strongly encouraged. Those interested in providing input should contact Rod Fujita, Environmental Defense at (510) 658-8008 [email protected] or Mike Dickerson, ShoreBank Enterprise Pacific at (360) 642-4265 [email protected] Exhibit 1: California Fisheries Fund Business Plan
Transcript of Investing in the Future of California’s Fisheries “The ...€¦ · Investing in the Future of...
Investing in the Future of
California’s Fisheries
“The California Fisheries Fund”
Business Framework October, 2006
Comments on this document are strongly encouraged. Those interested in providing input should contact Rod Fujita, Environmental Defense at (510) 658-8008 [email protected] or Mike Dickerson, ShoreBank Enterprise Pacific at (360) 642-4265 [email protected]
Exhibit 1: California Fisheries Fund Business Plan
The California Fisheries Fund Business Framework
2
Executive Summary
Many California fisheries are in trouble. Declining revenues and reduced access to fish populations are hampering fishermen and their businesses – and jeopardizing California’s supply of local seafood, our working waterfronts, and the coastal communities that depend on them.
The challenge facing the state is addressing the underlying problems confronting fisheries, not just the symptoms. Many observers believe that lack of funding has been a significant impediment to fisheries reform. The Ocean Protection Council (OPC) has initiated the development of a revolving capital investment tool aimed at addressing this impediment by supporting transition to more stable and profitable fisheries in California and thus enhancing our public trust fishery and ocean ecosystem resources.
The California Fisheries Fund has several key elements:
• The primary objective of the Fund is to improve the conservation and financial performance of California’s marine fisheries. Outcomes will include improved scientific information, enhanced stewardship of fish stocks and habitats, better fishery jobs, improved profitability, and revitalized coastal communities.
• One of the key reforms necessary to achieve this objective is to transition California fisheries governance so that fishermen, cooperatives, and/or communities receive dedicated, secure access privileges to public trust resources in exchange for commitments to achieve fishery management goals, sharing of the costs of research and management, and resource stewardship.
• There is strong evidence from the 8 US fisheries (as well as from the hundreds of fisheries around the world) that have undergone such transitions that economic performance, conservation performance, cost-sharing, safety, and job quality all improve substantially as a result of governance reform.
• The California Fisheries Fund will be a permanent source of capital for funding research and planning in support of essential fishery governance reform. The Fund will make customized investments that stabilize the regulatory environment and align improved ocean stewardship with fishermen’s business interests. It is intended to ‘kick-start’ demonstrations of fisheries reform models. Examples of projects to be funded include targeted buyouts of vessels and permits, collaborative research to develop stock assessments and ecosystem-based fishery management plans, development of management measures, and planning for governance reform.
• The Fund will capitalize permanent locally based Fishery Foundations that enable fishermen to develop and implement research, local co-management entities and innovative market-based practices.
Exhibit 1: California Fisheries Fund Business Plan

The California Fisheries Fund Business Framework
3
• In fisheries that have undergone governance transitions, a “bloom of innovation” typically occurs as fishermen shift from maximizing catch to attempting to maximize value. The Fund will invest in fishery business development and innovation resulting from governance reform. Examples include targeted vessel/permit buyouts, value-added seafood products, development of new markets and distribution channels for sustainable seafood, and local fishing harbor revitalization.
• The Fund will be established in two phases:
o Start-up (2007 – 2010) – designed to demonstrate success in three targeted fisheries; and,
o Expansion (2010) – taking the Fund to full operating scale and working with additional fisheries (estimate 10 to 12, dependent on the specific attributes and needs of candidate fisheries).
• The OPC will seed the capital base of the Fund with a $2,000,000 grant. This initial equity will be used to leverage an additional $6,000,000 in capital from private resources ($3,000,000 in grants and $3,000,000 in debt) – resulting in the $8,000,000 of capital required for the start-up phase of the Fund (2007 – 2010).
• Upon successful demonstration of reform strategies in selected demonstration fisheries, a second and final phase of capitalization will occur in 2010 that secures an additional $9,000,000 in capital from private sources ($2,000,000 in grants and $7,000,000 in debt), resulting in total Fund capital of $17,000,000.
• To minimize initial operating costs associated with the start-up of the Fund and expedite successful capitalization, an existing non-profit with relevant experience will ‘incubate’ and manage the Fund through the start-up phase of operation. After successful performance over the first three years, the Fund will ‘spin-off’ and be established as an independent non-profit.
• The Fund is based on a principle of risk sharing with participating fisheries and will incorporate repayment terms that reflect uncertainty and risk associated with fish populations, management, and overall successes.
• Given the uniqueness of approach, the financial modeling for the Fund and proposed operations have been structured using conservative assumptions, relatively large reserves, and other measures to allow for a higher level of risk tolerance in investment, capitalization, and operations while ensuring solvency and ongoing reserves.
The California Fisheries Fund will provide the State and stakeholders with an innovative tool to achieve conservation and economic benefits that will help sustain our working waterfronts and coastal communities, provide fishermen a long-term stake in the future of their fisheries, and ensure sound stewardship of our ocean resources. The Fund will be operational February, 2008.
Exhibit 1: California Fisheries Fund Business Plan
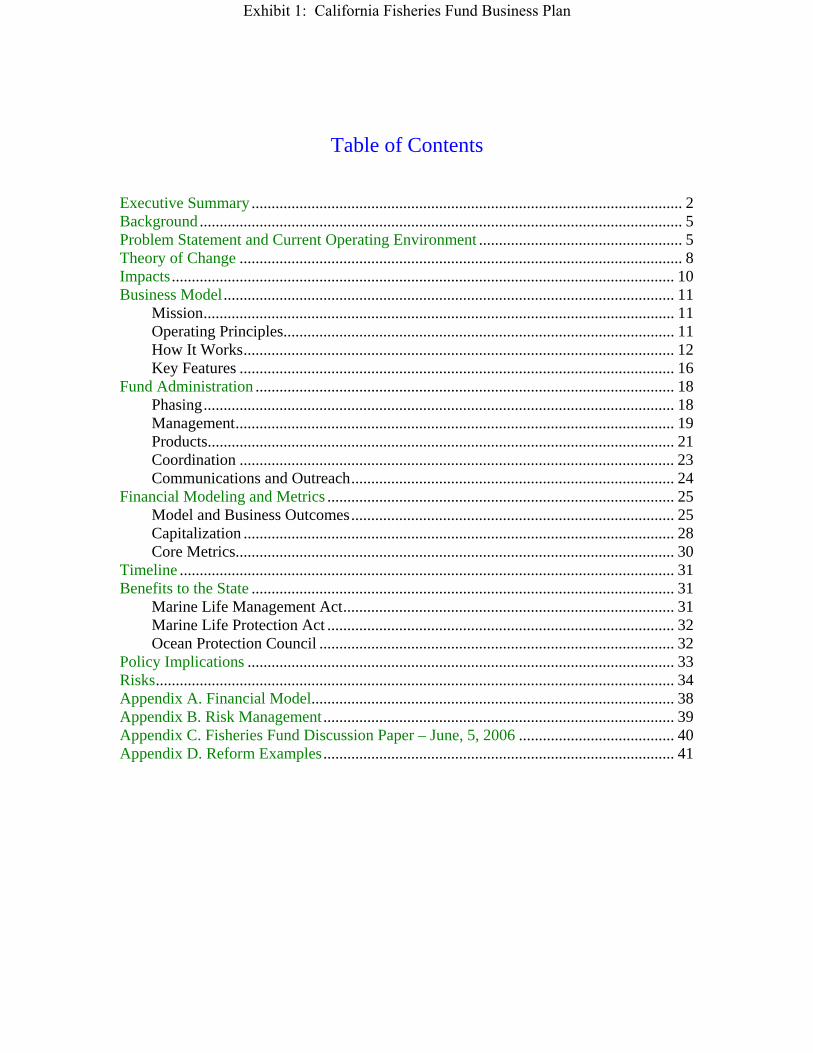
Table of Contents Executive Summary ............................................................................................................ 2 Background......................................................................................................................... 5 Problem Statement and Current Operating Environment ................................................... 5 Theory of Change ............................................................................................................... 8 Impacts.............................................................................................................................. 10 Business Model................................................................................................................. 11
Mission...................................................................................................................... 11 Operating Principles.................................................................................................. 11 How It Works............................................................................................................ 12 Key Features ............................................................................................................. 16
Fund Administration ......................................................................................................... 18 Phasing...................................................................................................................... 18 Management.............................................................................................................. 19 Products..................................................................................................................... 21 Coordination ............................................................................................................. 23 Communications and Outreach................................................................................. 24
Financial Modeling and Metrics ....................................................................................... 25 Model and Business Outcomes................................................................................. 25 Capitalization ............................................................................................................ 28 Core Metrics.............................................................................................................. 30
Timeline ............................................................................................................................ 31 Benefits to the State .......................................................................................................... 31
Marine Life Management Act................................................................................... 31 Marine Life Protection Act ....................................................................................... 32 Ocean Protection Council ......................................................................................... 32
Policy Implications ........................................................................................................... 33 Risks.................................................................................................................................. 34 Appendix A. Financial Model........................................................................................... 38 Appendix B. Risk Management........................................................................................ 39 Appendix C. Fisheries Fund Discussion Paper – June, 5, 2006 ....................................... 40 Appendix D. Reform Examples........................................................................................ 41
Exhibit 1: California Fisheries Fund Business Plan
The California Fisheries Fund Business Framework
5
Background
The Ocean Protection Council approved a planning grant for Environmental
Defense in September 2005 to investigate how capital might be used as part of a
comprehensive state strategy to improve California fisheries. Environmental Defense
secured the services of ShoreBank Enterprise Pacific (SEP), an established community
development financial institution with extensive experience in fisheries, to undertake the
assessment, feasibility, and planning effort. The planning grant is administered by the
California Coastal Conservancy (CCC).
This work involved two phases: Needs assessment/concept development; and,
Business plan development.
Phase one activities included assessment interviews with seafood and fishing
industry leaders and academic experts up and down the coast. Specifically, we met with
fishermen, processors, industry associations, agencies, university professors, community
leaders, and non-profit institutions.
(The discussion paper developed during phase one is included as Appendix C.
Readers are urged to use this companion document for background information in
support of this plan. It contains additional detail regarding needs assessment, current
operating environment, and underlying assumptions of the concept and final plan.)
Problem Statement and Current Operating Environment
In 2004, commercial fish landings in California totaled 300 million pounds,
valued at $131.6 million. The California Department of Fish and Game’s budget for
Hunting, Fishing and Public Use, which includes commercial fisheries management, was
$35.9 million, while revenues to the State from commercial fish licenses were just $3.7
million. The cost of drafting a Fisheries Management Plan for one fishery, which is
required under the Marine Life Management Act, is on the order of $2 million.
Currently, costs of managing California commercial fisheries exceed revenues (CDFG).
There are about 150 species of marine life managed by the state. As of 1999,
there were 16 fisheries with Restricted Access Policies in place, meaning there are
Exhibit 1: California Fisheries Fund Business Plan

The California Fisheries Fund Business Framework
6
limitations on the quantity of persons, vessels, fishing gear and/or catch in these fisheries
and as of 2005, the Department of Fish and Game issued permits for 28 different
fisheries. In 1999, ten fisheries (market squid, pacific sardine, chub mackerel, red sea
urchin, albacore tuna, northern anchovy, rockfish, Dungeness crab, dover sole, and
skipjack tuna) accounted for nearly 90% of landings by weight and ten fisheries (market
squid, Dungeness crab, red sea urchin, albacore tuna, swordfish, rockfish, Chinook
salmon, pacific sardine, spot prawn and sablefish) accounted for 77% of the value.
Initial estimates indicate the value of landings could increase by $27-93 million
per year, if the catch was shared rather than competed for (based on comparisons of costs
and earnings before and after transition to DAP management in other fisheries, modified
from J. Wilen in Evolving Property Rights in Marine Fisheries D. Leal, Ed.. Rowman
and Littlefield, 2005). The large range reflects uncertainty resulting from the lack of
fishery specific data on costs, earnings, and prices in California fisheries. The increased
value would come from a combination of targeting higher value fish, capturing fish in
ways that improve quality, price increases, cost reductions, and where biologically
appropriate, higher landings.
In fisheries that have undergone governance transition, capital costs are usually
reduced because there is no longer a need to compete to maximize catch. Rather, under
these management regimes, there are strong incentives to reduce fishing costs and
maximize value by modifying fishing practices or timing to maximize product quality
and value. Estimates for cost reductions and value increases associated with governance
changes were derived from the primary fisheries economic literature; gaps were filled
with estimates using professional judgment (see Appendix D for an assessment of the
conservation and economic performance of fisheries before and after governance reform).
The State does not have the resources to implement the necessary management
reforms and the public is paying most of the research and management costs. A $2
million initial investment in the California Fisheries Fund is a wise investment for
California. It will leverage an additional $15 million in capital under the base scenario
outlined in this plan and jumpstart management reform, thereby improving the financial
and conservation performance of our fisheries and making them more self-sufficient
economically.
Exhibit 1: California Fisheries Fund Business Plan

The California Fisheries Fund Business Framework
7
The needs assessment revealed broad agreement on the need for fishery
governance reform that can stabilize regulations and create a regulatory environment
more conducive to investment, innovation, and conservation. The majority of individuals
interviewed identified instability in management and the failure to tailor regulations and
stock assessments to local conditions as the most pressing issues they face. Motivating
investment and innovation requires confidence in data predictability and stable access to
fisheries over the mid- and long-term.
In this current operating environment, traditional ‘lending’ and loan products
targeting fishermen, seafood companies, and coastal communities will meet with limited
demand and result in little benefit to California fishing families, their communities, fish
populations, or ocean ecosystems. Specialized interventions--highly targeted and
customized to prevailing local conditions--will be required.
Any successful response will require changing the ‘value proposition’ currently
driving many California fisheries. We offer the following analogy:
Landlords in poor communities rely on operating income (rents) for return
on investment; they minimize investment in their property and hold
operating costs down, to get their money back out as quickly as possible
when they lack confidence in market conditions. The ‘value proposition’
is current cash flow rather than resale of the property for more than they
paid. Properties are often abandoned when their potential for current
income without capital investment is exhausted. The result is persistent
decline in housing conditions, community well-being, and confidence in
the future.
In the context of this analogy, we have concluded that most fishermen are
behaving rationally given the existing economic incentives that they face; lack of
predictability in the current regulatory regime and lack of assured access to future
harvests conspire to make anything but a near-term perspective irrational. A focus on
cash flows, driven by a race to maximize and accelerate catch within the context of
increasingly stringent conservation regulations, fuels a cycle of disinvestment supported
by regulatory practice and often results in unintended adverse environmental
Exhibit 1: California Fisheries Fund Business Plan

The California Fisheries Fund Business Framework
8
consequences, such as bycatch/discard of incidentally caught species and habitat damage
by gear used to maximize catch.
Our assignment has been to recommend ways that capital investment can drive
improved economic and ocean ecosystem health in the California fisheries sector, and,
because the California fisheries ‘value proposition’ is based on maintaining cash flow,
rather than on the building of assets, we have concluded that there is scant opportunity for
traditional debt instruments alone to achieve these goals.
Regulatory reform that provides more secure access to fisheries for communities,
cooperatives, or individuals will be necessary to deliver the appreciable assets and
confidence in the future that will be essential for improving California’s fisheries.
Regulatory reform can also offer an alternative to the outdated and unnecessary
economy versus the environment paradigm by offering solutions for improving both
conservation and financial performance. Capital can play an important role in creating
these necessary regulatory reforms and solutions for sustainable fisheries.
Theory of Change
The current operating environment forces California fishermen – despite their best
efforts – to focus on survival instead of long-term sustainability and profitability. This
business environment is harmful to California's oceans, fishermen, consumers, and the
coastal communities and working waterfronts that depend on them.
Just as Community Development Financial Institutions (CDFIs) have been
successful in improving social and economic conditions in distressed urban and rural
markets, targeted capital investments can result in similar improvements in our fisheries.
Like landlords in troubled urban communities, fishermen face a business environment
that encourages them to focus on maximizing present income (catches) rather than the
long-term value of their primary asset (healthy fish stocks).
Fishermen need predictable and stable access to fisheries and management that
allows them to adopt new business models to help improve their financial security and to
safeguard our state's invaluable marine ecosystems. The California Fisheries Fund can be
a key driver of these reforms - acting as a sustainable source of capital for fisheries
Exhibit 1: California Fisheries Fund Business Plan

The California Fisheries Fund Business Framework
9
attempting to transition towards a more secure future and healthier oceans for all
Californians.
Key Elements of a Solution
• Create stability and predictability through pursuit of rational approaches for
reform – i.e. changing the current ‘value proposition’ for fisheries
• Tailor solutions to local conditions – acknowledging and affirming the
importance of localized involvement in stewardship and management
• Demonstrate then replicate – creating replicable models for other fisheries
and communities
• Target for success – following strong, open-minded, and committed local
leadership
• Share the financial risk of change with fishermen and communities – tied
both to the degree of success or failure of reform measures and to ocean
productivity
• Build political will – through securing consistent commitment from the State
and other stakeholders to reform fisheries governance with the aim of
creating economic incentives for stewardship
• Avoid the ‘us versus them’ debate – demonstrating that economy and
environment are not mutually exclusive
• Support research and create incentives for stewardship – transitioning from
precautionary to knowledge-based fishery management
• Support innovation in fisheries – resulting in higher value products, new
markets, and improved market access
• Create metrics and generate measurable impacts – demonstrating tangible and
measurable benefits for local economic well-being, safety, marine resources,
and ocean ecosystems
Exhibit 1: California Fisheries Fund Business Plan
The California Fisheries Fund Business Framework
10
• Create financial leverage – establishing permanent assets to support ongoing
transition efforts
Impacts
As this theory of change suggests, at the core of any successful response is the
need to challenge some fundamental assumptions of current fisheries management and
examine the social and economic incentives that various kinds of management models
create. Successful management will realign these incentives to support healthier fisheries,
communities, and ocean ecosystems. This will require ongoing, constructive dialogue
about elements of reform between fisheries management agencies and local stakeholders
attempting transition.
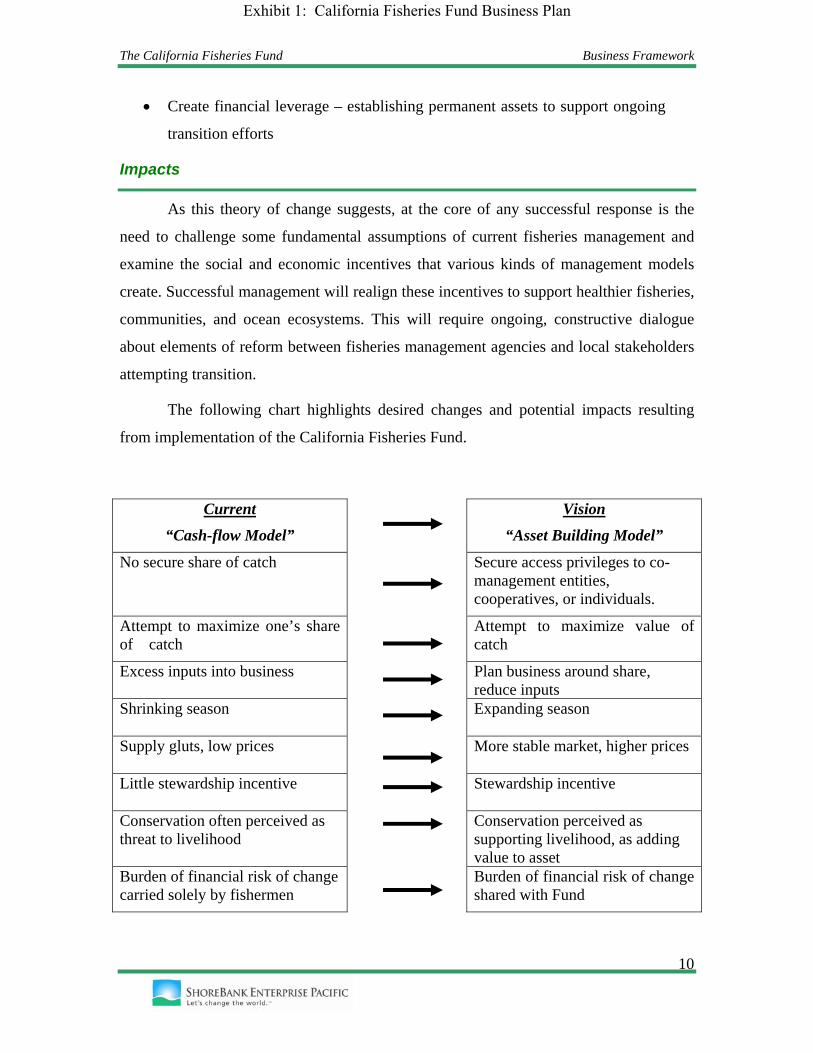
The following chart highlights desired changes and potential impacts resulting
from implementation of the California Fisheries Fund.
Current
“Cash-flow Model”
Vision
“Asset Building Model”
No secure share of catch Secure access privileges to co-management entities, cooperatives, or individuals.
Attempt to maximize one’s share of catch
Attempt to maximize value of catch
Excess inputs into business Plan business around share, reduce inputs
Shrinking season
Expanding season
Supply gluts, low prices More stable market, higher prices
Little stewardship incentive
Stewardship incentive
Conservation often perceived as threat to livelihood
Conservation perceived as supporting livelihood, as adding value to asset
Burden of financial risk of change carried solely by fishermen
Burden of financial risk of change shared with Fund
Exhibit 1: California Fisheries Fund Business Plan

The California Fisheries Fund Business Framework
11
Business Model
Mission The California Fisheries Fund is a sustainable source of capital committed to
financing fisheries reform that will result in more stable and profitable fisheries that
enhance public trust fishery resources. This is achieved through delivering customized
investments that help stabilize the regulatory environment at local and regional levels in
ways that align fishermen’s business interests with improved ocean stewardship.
Operating Principles The five operating principles of the California Fisheries Fund are:
• Design Tailored to Local Conditions: Regulatory reform that results in secure
privileges for communities, cooperatives, or individual fishermen to catch fish.
The specific management model must be sensitive to and work in concert with the
unique social, economic, and biological features of each fishery or region. These
secure privileges will lay the groundwork for stability and predictability and act as
a source of investor/investee confidence over longer terms.
• Focus on Assets: Shifting our collective mindset from an ‘income’ approach (e.g.
focused on cash-flow) to an ‘asset accumulation’ approach (e.g. focused on
building net worth through asset accumulation, including fish available for
harvest) that captures and releases entrepreneurial energy, while at the same time
ensuring the health of our ocean assets.
• Stewardship Services: Viewing science, enforcement, and management as costs of
doing business – ‘stewardship services’ – and establishing mechanisms for
internally financing these services specific to individual fisheries or geographic
areas.
• Self-Interest: Linking the value of business assets directly to the ‘environmental
performance’ of the resource – resulting in rational economic self-interest in
maintaining sound stewardship and management.
Exhibit 1: California Fisheries Fund Business Plan

The California Fisheries Fund Business Framework
12
• Align with State’s Emerging Ocean Governance: Designed to align with current
state policies and trends in ocean governance – specifically with regionalization,
restricted access, cooperative research, and participatory democracy objectives
embodied in the Marine Life Management Act, the Fish and Game Commission’s
Restricted Access Policy, and other policies and regulations.
How It Works The Fund is intended to ‘kick-start’ demonstrations of fisheries reform models at
local and regional scales. Based on successful demonstrations, the Fund will expand to
invest in other fisheries.
The primary objective is to improve the conservation and financial performance
of California’s fisheries, protecting fish stocks and habitats, creating better jobs,
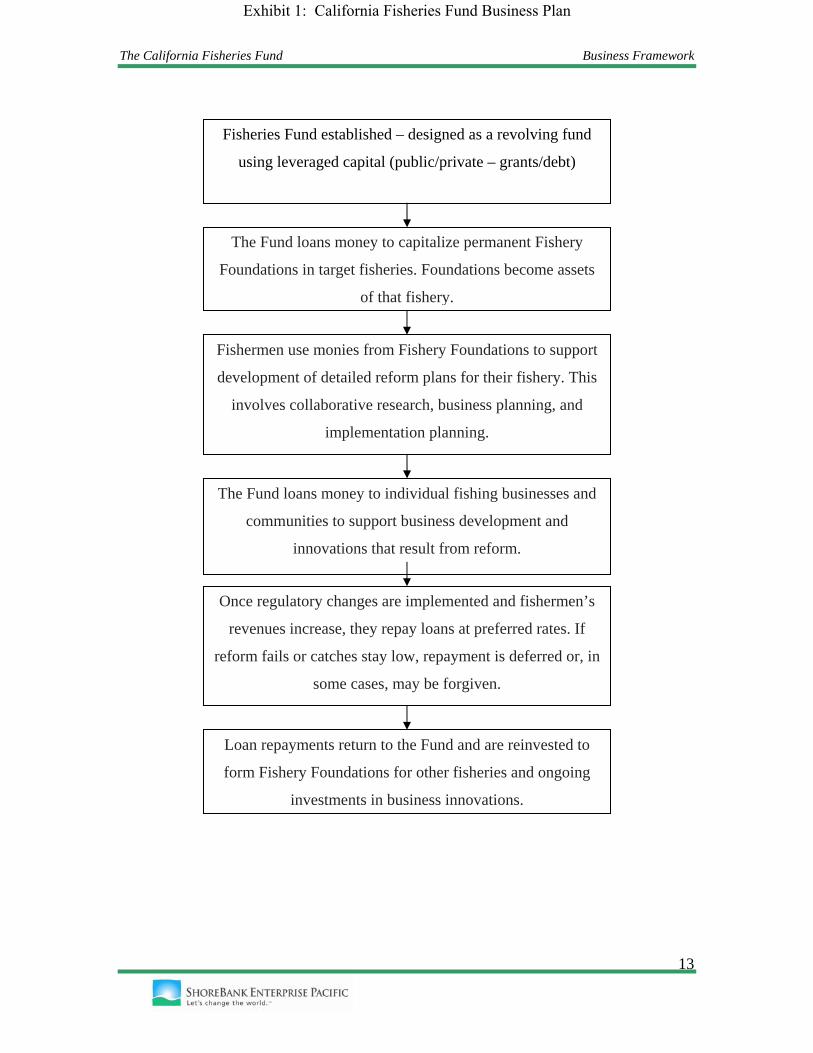
improving profits, and revitalizing coastal communities. The following is a depiction of
how the Fund will work:
Exhibit 1: California Fisheries Fund Business Plan
The California Fisheries Fund Business Framework
13
Fisheries Fund established – designed as a revolving fund
using leveraged capital (public/private – grants/debt)
The Fund loans money to capitalize permanent Fishery
Foundations in target fisheries. Foundations become assets
of that fishery.
The Fund loans money to individual fishing businesses and
communities to support business development and
innovations that result from reform.
Fishermen use monies from Fishery Foundations to support
development of detailed reform plans for their fishery. This
involves collaborative research, business planning, and
implementation planning.
Once regulatory changes are implemented and fishermen’s
revenues increase, they repay loans at preferred rates. If
reform fails or catches stay low, repayment is deferred or, in
some cases, may be forgiven.
Loan repayments return to the Fund and are reinvested to
form Fishery Foundations for other fisheries and ongoing
investments in business innovations.
Exhibit 1: California Fisheries Fund Business Plan

The California Fisheries Fund Business Framework
14
Essential to this model is the emergence of ‘demonstration’ fisheries –
communities, fisheries, and individuals willing to embrace the challenges of
implementing reform – that will be identified for initial investment from the Fund. A
number of fisheries have expressed early interest in participation and are pursuing initial
grant funding to assist them in basic organizing activities that will prepare them to seek
investment from the Fund.
Given the need to tailor solutions to conditions in a particular community or
region, it is expected that reform strategies will vary. The following example, for
illustration only, is provided to outline steps a demonstration fishery might undertake; not
all models will resemble this example:
• Step 1: Local leadership emerges and identifies ecosystem-based
management as a desired framework for change. They initiate the
process of involving stakeholders in discussions regarding design of a
management plan, resulting in the formation of a local constituency
interested in pursuing change.
• Leaders initiate discussions with agencies and resource providers on
developing a co-management strategy. A planning grant is secured to
cover initial costs of organizing and planning.
• Using cooperative partnerships to manage resources is a new approach;
a co-management organization will need to be created as well as a plan
for reform. Lack of sufficient capital may slow the process.
• Step 2: Organizational leaders approach the Fisheries Fund. Analysis
of historic data and financial modeling shows that an investment of
$1,500,000 is needed to establish a permanent Fishery Foundation
appropriate to the scale and need of the specific fishery.
• Basic terms of capitalization for the Fishery Foundation are estimated
at:
o $1,500,000 loan, 3% interest rate, 10 year term
o Interest only annual payments the first 4 years = $45,000
Exhibit 1: California Fisheries Fund Business Plan
The California Fisheries Fund Business Framework
15
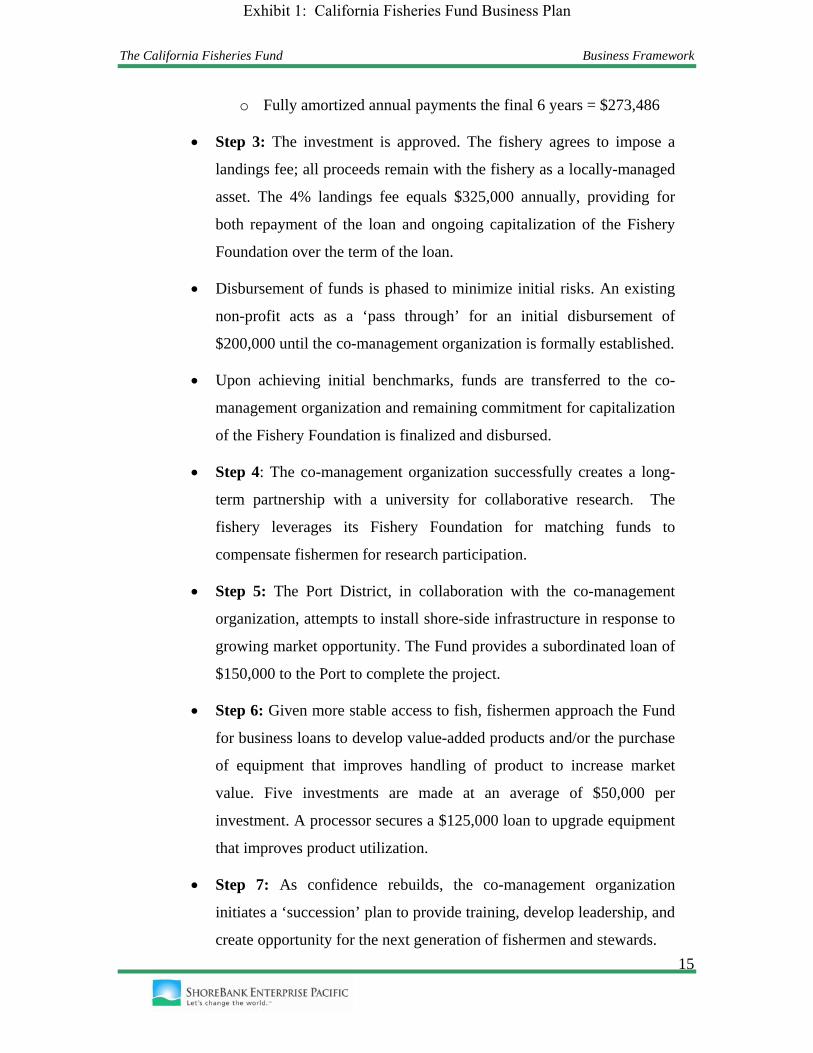
o Fully amortized annual payments the final 6 years = $273,486
• Step 3: The investment is approved. The fishery agrees to impose a
landings fee; all proceeds remain with the fishery as a locally-managed
asset. The 4% landings fee equals $325,000 annually, providing for
both repayment of the loan and ongoing capitalization of the Fishery
Foundation over the term of the loan.
• Disbursement of funds is phased to minimize initial risks. An existing
non-profit acts as a ‘pass through’ for an initial disbursement of
$200,000 until the co-management organization is formally established.
• Upon achieving initial benchmarks, funds are transferred to the co-
management organization and remaining commitment for capitalization
of the Fishery Foundation is finalized and disbursed.
• Step 4: The co-management organization successfully creates a long-
term partnership with a university for collaborative research. The
fishery leverages its Fishery Foundation for matching funds to
compensate fishermen for research participation.
• Step 5: The Port District, in collaboration with the co-management
organization, attempts to install shore-side infrastructure in response to
growing market opportunity. The Fund provides a subordinated loan of
$150,000 to the Port to complete the project.
• Step 6: Given more stable access to fish, fishermen approach the Fund
for business loans to develop value-added products and/or the purchase
of equipment that improves handling of product to increase market
value. Five investments are made at an average of $50,000 per
investment. A processor secures a $125,000 loan to upgrade equipment
that improves product utilization.
• Step 7: As confidence rebuilds, the co-management organization
initiates a ‘succession’ plan to provide training, develop leadership, and
create opportunity for the next generation of fishermen and stewards.
Exhibit 1: California Fisheries Fund Business Plan

The California Fisheries Fund Business Framework
16
Key Features The following is a summary of the key design features of the California Fisheries
Fund that correspond with our theory of change:
• Sustainable Financing: The Fisheries Fund will support management reform
and transition of fisheries towards more localized management models
consistent with existing and emerging state law and policy. The primary
foundation of this concept is based on localized design, assets, self-interest,
and stewardship services. Both public and private capital will be sought to
establish the Fund. Given the scale of need and desire for permanence, the
Fund will be established so that resources revolve, enabling the Fund to
address additional fisheries based on success. Return on these investments
and phasing of capital growth will allow the Fund to achieve the level of
stability required for long-term success.
• Investment Pipeline: Grants from other sources will be necessary to help
some fisheries prepare for investment. Grants to local communities and
groups looking to organize towards reform will need to be secured from
sources other than the Fund. Greater efficiencies and synergies will likely be
achieved through close coordination of grant making with the investment
strategy of the Fund, resulting in a ‘pipeline’ of investment opportunity for
the Fund.
• Demonstration: The Fund will be established in two phases. During the start-
up phase, up to three fisheries will be identified for initial investment from
the Fund. These fisheries will work with appropriate agencies to develop
management reform strategies. Based on lessons learned and successful
demonstration, a second expansion phase will be implemented for reforming
additional fisheries and expanding impact.
• Capitalized Science and Management: Fisheries will use capital from the
Fund to secure the reform of the fishery to improve stewardship, profits, and
investment climate. The proceeds of these investments will be used to
capitalize change through the establishment of Fishery Foundations specific
Exhibit 1: California Fisheries Fund Business Plan
The California Fisheries Fund Business Framework
17
to each fishery. These investments will ‘kick start’ the ability of a fishery to
initiate the necessary scientific programs (e.g. collection of essential fishery
information) and management reform steps (e.g. organizing and planning
appropriate reform measures). Each fishery and Fishery Foundation will have
a mechanism for self-financing to cover the on-going costs of proactive
management and ensuring healthy stocks and habitat.
• Investment Recovery: Mechanisms appropriate for each fishery will be
developed that allow for recovery of the initial investment from the Fisheries
Fund and to provide ongoing support for the associated Fishery Foundation.
It is anticipated that these investment recovery mechanisms will vary by
fishery based on current fishery status, reasonable return windows, and the
confidence of all parties in the positive impacts of management reform (i.e.
customized terms specific to the needs of each fishery). Most important,
risks will be shared with fishermen, codified in negotiated terms guiding
investment recovery (i.e. investment recovery will be tied to the extent to
which regulatory reform is achieved and to the response of fish populations
to natural conditions and management measures).
• Stewardship as an Asset: It is anticipated that the ‘beneficiaries’ of the initial
investment in specific fisheries will vary based on the management model
and co-management infrastructure developed by that fishery. Participation
will vary and, along with the required public agency representation, may
include individual fishermen, groups of fishermen, communities, and other
industry members or associations. A primary principle will be to establish the
Fishery Foundation as a financial asset of the fishery that can be used to
leverage additional resources for research and conservation activities.
• Oversight: Appropriate representation will be established for oversight of
each Fishery Foundation to ensure both protection of the public trust and
equitable distribution of access to the resource.
• Transferability: It is anticipated that parameters for establishing
transferability of access privileges will be implemented specific to each
Exhibit 1: California Fisheries Fund Business Plan
The California Fisheries Fund Business Framework
18
fishery. All models considered will have features designed to protect
environmental and cultural values, including those of inter-generational
succession and new entrants into a fishery consistent with California’s
Restricted Access Policy.
• Support for Innovation: In addition to ‘seeding’ the Fishery Foundations, the
Fund will have the capacity to invest in other business activities of fishermen,
processors and communities as transition to reform proceeds (e.g. product
innovation, business development, market development).
• Density of Impacts: Investments of the Fund will be targeted to achieve
‘density of impact’ – multiple investments in priority areas or to priority
individuals/sectors that build on each other to maximize benefits and chances
for success.
• Collaboration: Successful implementation will require committed leadership
and intensive collaboration among State and Federal agencies, fishermen,
local entities, communities, and various industry groups and NGO’s.
Fund Administration
Phasing In an effort to minimize the risks associated with launching a new initiative, we
have divided the development of the fund into two phases: start-up and expansion. From
an operational perspective, this will allow the fund to demonstrate success prior to
expansion of effort. It also results in low-overhead expenses over the first three years.
From a capitalization perspective, this will allow the fund to ‘prove-up’ the
model, develop a track record of success, and be better positioned to secure the second
phase of capital required.
Additionally, this phasing of growth allows the Fund to learn, along with the
demonstration fisheries, how it can best support reform transition efforts. Lessons learned
may offer opportunities for product refinement or improvements.
Exhibit 1: California Fisheries Fund Business Plan

The California Fisheries Fund Business Framework
19
Management In an effort to minimize start-up costs and expedite establishment of the Fund, an
‘incubation’ model is recommended. OPC staff are in discussions with an existing non-
profit qualified to ‘incubate’ and manage the Fund during the first three years of
operation (henceforth, the ‘management entity’). This process is expected to be
completed during the fourth quarter of 2006. A final management agreement with terms
and conditions for performance will be delivered to the OPC for final approval.
It is anticipated that after successful performance over the first three years, the
Fund will ‘spin-off’ and be established as a stand alone non-profit. This model of
‘incubation’ – using an experienced and qualified ‘parent’ non-profit to manage start-up
and development of the Fund and its investment functions – will keep operating costs low
during the start-up phase rather than fully capitalizing a new start-up entity. Additionally,
it enables the Fund to take advantage of the track record, existing relationships, and
management experience of an existing organization during the capitalization phase.
To ensure sound and prudent management of the investment process, the
management entity will contract for services from an existing CDFI, with CDFI
certification in good standing with the US Department of Treasury and a proven track
record in environmentally-based economic development lending. Services will include
underwriting the credit process, loan portfolio management, and risk management.
Securing these services from an established organization with a strong track record and
existing management systems will further reduce start-up costs.
A CDFI’s capacity to accept risk depends on its capacity to manage risk. Risk
management focuses on three areas: (1) the underwriting and approval process; (2)
sustained performance of the portfolio over time; and (3) use of high-level standards for
measuring risk and loss exposure. Appendix B. Risk Management, provides an overview
of accepted industry standards for risk management.
Elements of the management agreement will include:
• Oversight: The management entity will be responsible for oversight and
management of all aspects of start-up and operations for the Fund.
Exhibit 1: California Fisheries Fund Business Plan

The California Fisheries Fund Business Framework
20
• Accountability: The management entity will be accountable to criteria
associated with each source of funding, including public interest
requirements associated with state funding.
• Fund Advisory Committee: The management entity will be required to
establish a Fund Advisory Committee to provide governance and
oversight during the incubation period. This Committee will include
appropriate representation of various stakeholders including fishermen,
management agencies, industry groups, NGO’s, and community
representatives.
• Capitalization: The management entity will be responsible for
implementation of the capitalization strategy using existing relationships
and past performance to expedite this process.
• Reporting: The management agreement will include reporting
mechanisms for mission impacts and business performance. This will
include the development of standard templates used in reporting.
• Underwriting/Portfolio Management/Risk Management: The organization
selected to provide investment services and functions will be a certified
CDFI with a proven track record in successful fund management and high
quality systems, procedures, and protocols. The CDFI will be responsible
for all credit functions including underwriting, credit recommendation
process, portfolio management, and risk management.
• Investment Decisions: Investment decisions will be based on factors such
as mission impacts and achieving core metrics, support services, character,
environmental and community benefits, uses of funds, and overall
financial feasibility. The credit recommendation process for Fishery
Foundation loans will be vetted at the Advisory Committee level and a
written recommendation from the Advisory Committee will be included in
the Credit Memo. All other investments will go directly through the
established credit committee process of the underwriting entity. All credit
Exhibit 1: California Fisheries Fund Business Plan

The California Fisheries Fund Business Framework
21
practices will adhere to industry standards regarding confidentiality of
business information.
Products The Fund is designed to deliver three primary products: Fishery Foundation
Loans; Infrastructure Loans; and Business Loans. The following is a brief description of
these loan products. Rates and terms presented are averages used in development of the
financial model. Given anticipated variations in risk, asset quality, and financial
performance – loan terms, conditions, and loan loss reserve rates will vary for each
product.
Product 1 – Fishery Foundation Loans:
• Loan proceeds will capitalize permanent Fishery Foundations in selected
fisheries. Fishery Foundations will use capital to support development of
detailed reform plans for their fishery, including fishery research, business
planning, and implementation planning.
• Repayment terms are from self-taxed landings fees or other mechanisms
developed by the fishery.
• Terms are a maximum 10 years and may include deferred or interest only
periods as projects are developed and implemented and resulting reform
practices are implemented (i.e. four years interest only payments, fully
amortized over remaining six years).
• There is a 1% loan origination fee. Rates are anticipated to be below
market rates to recognize the unknown capacity to generate income and
broad environmental and economic benefits to the community. Average
interest rate is estimated to be 3%.
• Loan loss reserve for this product line is 25% of Fishery Foundation Loans
outstanding. This high level of reserve is intended to account for the
innovative nature of the product.
Exhibit 1: California Fisheries Fund Business Plan
The California Fisheries Fund Business Framework
22
Product 2 – Infrastructure Loans:
• Activities undertaken by Ports, communities, and other organizations in
support of reform may require investment in infrastructure at the fishery
level. Commercial and public agency lenders may not make loans due to
real or perceived risks. Activities may include things such as
improvements in off-loading capacity, ice machine capacity, minor cold
storage, or processing.
• It is anticipated these loans should support higher interest rates than
Fishery Foundation loans because they are supported by transition
activities resulting from regulatory reform. Average interest rate is
estimated at 6%. There is a 1% loan origination fee.
• Repayment terms will be negotiated based on cash-flow analysis and
income streams. Terms are a maximum ten years and may include
deferred or interest only periods as needed.
• Loan loss reserve projected for this product line is 10% of Infrastructure
Loans outstanding given the types and net-worth of entities seeking
investment.
Product 3 – Business Loans
• We anticipate that increased confidence in a fishery undergoing transition,
based on reform that creates stability and predictability, will result in a
bloom of innovation. Business loans will be made available to finance
efforts by individual businesses to add value to seafood or achieve other
goals consistent with the purposes of the Fund. Business development
activities may include things such as equipment, product innovations, and
market development. Commercial and public agency lenders may not
make loans due to real or perceived risks.
• Loans should support higher interest rates than Fishery Foundation and
Infrastructure loans as these are supported by a transitioning fishery.
Exhibit 1: California Fisheries Fund Business Plan

The California Fisheries Fund Business Framework
23
Average interest rate is estimated at 8%. There is a 1% loan origination
fee.
• Repayment terms will be negotiated based on cash-flow analysis and
income streams. Terms are a maximum of five years.
• Loan loss reserve projected for this product line is 15% of Business Loans
outstanding.
Coordination Successful collaborations and partnerships will be essential for ensuring that the
Fund achieves its mission and accomplishes the delivery of necessary financial services.
Implementation will require the Fund to strategically identify, select, and partner with
other individuals and organizations such as specialized consultants, NGOs, institutes,
academic institutions, private companies and government agencies. Partner selection will
correspond to the Fund’s priorities, products, and phased-growth.
The Fund is structured and designed as a capital tool to invest in change; it will
rely on others to provide direct services and assistance. It is expected that intensive
collaboration will be required during the start-up phase, particularly to support fisheries
and communities developing transition strategies. There are numerous efforts and
initiatives underway or in the planning stages that could fill this role.
It is hoped that the strategic collaborations and partnerships will:
• Provide information, resources, and direct assistance to fisheries and
communities interested in developing transition strategies;
• Provide a pipeline for investment opportunity;
• Provide ongoing support to transitioning fisheries, ensuring long-term
success; and
• Provide additional vehicles that support successful deployment of the
Fund’s product line (i.e., product development technical assistance offered
by a university).
Exhibit 1: California Fisheries Fund Business Plan

The California Fisheries Fund Business Framework
24
Successful collaborations and partnerships have the following characteristics. The
Fund will use these ‘terms of engagement’ to guide its development of strategic
relationships:
• Collaborations and partnerships are based on trust – allowing for clear and
honest communication;
• They deliver mutual benefits to all parties that are tangible, measurable,
and clearly defined;
• They are structured, formalized, and documented with clearly-defined
expectations regarding outcomes, roles, responsibilities, and reporting; and
• They are relationships that are closely managed and continually cultivated.
A supporting document will be developed during the operational start-up of the
Fund that details the partnership approach, identifies potential collaborators, and provides
templates for partnership agreements.
Communications and Outreach The first phase of outreach was completed during the development of the
Discussion Paper (Appendix C) and of this business framework. In the second phase of
the Fund’s operation, the cultivation of leaders and of potential projects that the Fund can
finance -- and the provision of assistance to fisheries to increase the probability of
success -- will require extensive outreach and a consistent and sustained communication
strategy. A detailed communication strategy will be developed during the operational
start-up phase.
The communications strategy will be designed to deploy a variety of tools,
approaches, and messages specific to each target audience. As the Fund grows, costs
associated with communications are expected to increase. The communication strategy
will focus on the following primary stakeholders:
• Potential fisheries and communities interested in pursuing reform –
focused on building a pipeline of potential investments;
Exhibit 1: California Fisheries Fund Business Plan
The California Fisheries Fund Business Framework
25
• Foundations and other financial supporters – focused on establishing a
diverse base of financial support and regional expertise;
• Public agencies and strategic partners – focused on identifying areas for
collaboration;
• Seafood Industry – focused on sharing stories of conservation and
community support behind seafood produced by fisheries supported by the
Fund;
• Broader population and end consumers – focused on creating recognition,
market opportunities, and enhancing support for change.
Financial Modeling and Metrics
Model and Business Outcomes A detailed financial model has been developed and is included as Appendix A.
This model will be used for both fund operation and for analyzing prospective fisheries.
The model includes three scenarios – low, base, and high levels of capitalization – and
was designed to allow for future flexibility in analyzing prospective fisheries for
investment. Emphasis was placed on determining whether the Fund could be financially
feasible and also on understanding how various levels of investment could impact the
ability of the Fund to achieve its mission and goals.
Two detailed case studies of Fishery Foundation loans, which are the cornerstone
and catalyst of local reform, were developed to test and analyze the overall feasibility of
the Fund model. For two fisheries, twenty years of data for one individual species was
collected and analyzed along with anecdotal information of these fisheries regarding
trends and anomalies caused by various market and environmental events. (The model
allows for multiple species or species products per fishery, if relevant.) This type of
information is critical for accurately interpreting landings trends, which are affected by
multiple factors.
Projections of future performance were developed using projected growth rate
assumptions for both pounds landed and the price per pound. The assumptions were
based on the anecdotal information noted above and the actual average growth rate for
Exhibit 1: California Fisheries Fund Business Plan

The California Fisheries Fund Business Framework
26
pounds landed and prices per pound for the past five years. Conservative growth rates
were used to ensure the feasibility of repaying Foundation loans, regardless of fishery
reform success. Given evidence that various kinds of fishery reform result in much
improved financial performance, we believe the case studies strongly support the
financial feasibility of the Fund.
This financial model will allow the Fund to collect data and work with
prospective fisheries to appropriately structure investments. Based on overall capital
need, the model can be used to establish appropriate terms for the investment by
identifying a fishery’s ability to repay the Fund using various scenarios for fishery
performance (like landings and value) and types of mechanisms identified to create a
repayment stream.
Of the three scenarios analyzed and presented in the financial model, the Base
scenario is recommended for use because mission impacts and objectives are achieved
under this scenario. It appears to be the most realistic scenario with respect to market
conditions, need, and projected ability to secure necessary capital. Below is a brief
summary of the three scenarios:
• Low scenario provides insufficient funding for even modest activity.
Results in financial losses for Fund. Assumes start-up capital of
$5,000,000 and expansion phase capital of $7,000,000 (total $12,000,000).
The overall scale and equity level of this scenario is also projected to
increase the cost of funds (Program Related Investments - PRI’s at 3% -
10 yr terms), negatively impacting cash-flow ability and overall risk
tolerance.
• Base scenario provides sufficient funding for reasonable projected activity
that best matches need. Results in solvent fund – with a 15 year life and
ending positive capital balance (approximately $5,000,000) – making
longer term operation feasible. Assumes start-up capital of $8,000,000 and
expansion phase capital of $9,000,000 (total $17,000,000). The overall
scale and equity level of this scenario provides a more reasonable cost of
funds (PRI’s at 2% - 10 yr terms). This scenario appears most realistic in
Exhibit 1: California Fisheries Fund Business Plan

The California Fisheries Fund Business Framework
27
terms of current market conditions, need, and projected ability to secure
necessary capital.
• High scenario offers optimum funding for high level of risk tolerance and
maximum flexibility of operations, including highest levels of financial
activity and reform impacts. This scenario results in a solvent fund – with
a 15 year life and ending positive capital balance. Assumes start-up capital
of $11,500,000 and expansion phase capital of $11,000,000 (total
$22,500,000). The overall scale and equity level of this scenario provides
an even more reasonable cost of funds (PRI’s at 1% - 10 yr terms).
However, this scenario appears to be unrealistic in terms of current market
conditions, need, and projected ability to secure necessary capital.
Critical assumptions used in developing the financial model include:
• Management of Fund start-up will be established at an existing parent
non-profit (‘management entity’). The management entity will obtain
underwriting and portfolio management services through a contract with a
qualified economic and environmental lender. This minimizes start-up
costs and maximizes chances for success.
• Phasing of activity (start-up phase and expansion phase) will limit initial
lending activity to three fisheries with feasible business and reform plans
(three Fishery Foundation loans and multiple related infrastructure and/or
business loans). This will allow the Fund opportunity to mature, initiate
any necessary refinements, and demonstrate success prior to expansion.
• After the three year start-up phase, the Fund will establish independent
operations as a stand alone non-profit. Projections include one-time costs
associated with spin-off; staff; and low overhead and operating expenses.
• The expansion phase will open lending activity to additional fisheries with
qualified business and reform plans, disbursing multiple new Fishery
Foundation loans and related infra-structure and/or business loans.
Exhibit 1: California Fisheries Fund Business Plan
The California Fisheries Fund Business Framework
28
• Prudent loss reserve percentages based on loans outstanding were
established based on the varying levels of risk associated with each of the
three product lines. The model was built with plenty of cushion to absorb
losses (either due to human causes or environmental variation). It is not
expected that losses will be as high as projected, but given the innovative
nature of the Fund it is prudent to err on the side of caution. As the Fund
matures, the loan loss reserve percentages are expected to be reduced,
making more working capital available.
• Model is based on low leverage (debt to equity ratio) and cost of funds,
with operational and capital phasing to allow for proving up performance
prior to expanding to scale. In the unlikely event of failure, the Fund can
cut its losses with equity, pay off the debt (PRI’s), and determine the best
distribution of any remaining equity. In this scenario, no additional equity
or PRI’s would be sought and no additional lending would occur.
Continued management of loans outstanding would be performed by the
management entity and portfolio contractor.
• Fund start-up requires low leverage and low cost of funds (i.e., grants and
low interest PRI’s) based on general risks associated with any new
initiative. During the expansion phase higher leverage will be acceptable
based on the lower risk that comes with proven success. Continued low
cost of funds will be required in the expansion phase based on continued
below market pricing of loans.
• An outside evaluation component has been built into year three that will
inform decisions on how best to proceed in the expansion stage. Annual
audit expenses have also been included.
Capitalization The capitalization strategy is based on the traditional leverage model of equity
and debt used by most revolving loan funds.
The Fund’s capital base will consist of:
Exhibit 1: California Fisheries Fund Business Plan

The California Fisheries Fund Business Framework
29
• Equity in the form of grants from public and private sources; and
• Debt in the form of Program Related Investments (PRI’s) – PRI’s are
preferred term loans from foundations, corporations, or social investors.
Capitalization is divided into two phases to allow for successful demonstration of
desired impacts prior to taking the fund to full operating scale and to minimize the risks
associated with new initiatives. Specifically, this phasing achieves a number of
objectives:
• The Fund was intentionally designed with a conservative debt to equity
ratio during the start-up phase, allowing for a higher tolerance for risk and
the ability to absorb losses if necessary without jeopardizing the ability to
repay PRI investors.
• It allows the fund time to demonstrate success and ‘prove up,’ increasing
its future chances at securing full capitalization in 2010 ($17,000,000);
• Initial investments by the fund will provide it with necessary information
regarding overall risk tolerance and identify any refinements needed. As
the fund matures, its ability to assume a higher ratio of debt to equity
increases.
Elements of the start-up phase of capitalization include:
• The OPC will seed the capital base of the Fund with a $2,000,000 grant.
• This initial equity will be used to leverage an additional $6,000,000 in
capital from private resources ($3,000,000 in grants and $3,000,000 in
debt).
• $8,000,000 of total capital is required for the start-up phase of the Fund.
Start-up phase capitalization is expected to be completed by December
2007.
Upon successful demonstration of reform strategies in selected demonstration
fisheries, a second and final phase of capitalization will occur in 2010.
Elements of the expansion phase of capitalization include:
Exhibit 1: California Fisheries Fund Business Plan

The California Fisheries Fund Business Framework
30
• Securing an additional $9,000,000 in capital from private sources
($2,000,000 in grants and $7,000,000 in debt).
• Total capitalization of fund at $17,000,000 is expected in 2010.
Core Metrics The establishment of a tangible and consistent set of baseline metrics for
evaluating mission impacts and business performance is essential for defining success. It
is expected that core metrics regarding mission impacts will be developed over the next
few months in consultation with various State agencies and other stakeholders.
Core performance targets and indicators are to be developed for the Fisheries
Fund and each Fishery Foundation addressing:
• Financial performance
• Economic performance
• Community/social performance
• Environmental performance
In addition to metrics regarding mission performance, a detailed set of measures
relevant to monitoring loan fund performance will be developed. These will include
product outputs (i.e. increase in number of transactions over baseline, increase in amount
of funds invested, etc) and internal performance outcomes (i.e. investment earnings,
delinquencies, loss rates, loss reserves, ratio of debt to equity, etc).
The majority of these measures are typical for the prudent management of loan
funds. The financial model contains standard critical measurements for business
performance. The qualified organization selected to provide underwriting and portfolio
management services will have established systems to base these measures on. Final
business performance measures will be developed over the next few months in
consultation with the State.
It is our intent that these measurement tools will also be used to establish annual
performance goals and objectives.
Exhibit 1: California Fisheries Fund Business Plan

The California Fisheries Fund Business Framework
31
Timeline
The following is a timeline of expected activities during the start-up phase:
Start Completed Activity 11/06 Business plan presented to OPC 10/06 1/07 Identify management entity and negotiate management and
funding parameters 10/06 1/07 Initiate preliminary discussions with potential funders 11/06 2/07 Secure $2 million seed funding 1/07 5/07 Develop and conclude necessary management agreements.
Finalize core metrics 1/07 9/07 Initiate first phase of capitalization strategy. Two initial
commitments secured 3/07 9/07 Develop and finalize required program material
(communications, applications, etc) 3/07 9/07 Engage in preliminary discussions with potential demonstration
fisheries 6/07 2/08 Finalize capitalization, final agreements secured. Fund
capitalized 7/07 2/08 Required operational and reporting systems developed and
finalized 2/08 California Fisheries Fund fully operational
Benefits to the State
The California Fisheries Fund has the potential to be an important tool for
achieving the mandates and goals of California’s Marine Life Management Act, Marine
Life Protection Act, and the Ocean Protection Council.
Marine Life Management Act Marine Life Management Act (MLMA) implementation will benefit from the
capitalization of stewardship activities such as the gathering of essential fishery
information, preparation of stock assessments, and the implementation of fishery
management models at the regional and local levels.
These activities will result in a more stable regulatory environment and more
secure access to fish. In the case of essential fishery information that moves fisheries
from data-poor to data-moderate and data-rich conditions, it will inspire confidence in
Exhibit 1: California Fisheries Fund Business Plan
The California Fisheries Fund Business Framework
32
fishery managers, fishermen, and the seafood industry and may increase access to fish if
justified by credible scientific analysis.
Successful implementation of the Fisheries Fund will also sustain management
reforms and conservation actions by providing opportunity for expanded economic
benefits through investing in value-added seafood products (e.g. ‘certified sustainable’)
and the creation of new distribution channels and markets for such products.
Marine Life Protection Act The Marine Life Protection Act (MLPA) implementation will also benefit. The
same management model reforms that will improve the regulatory environment and
support an environment favorable for investment will also create a positive feedback loop
that strengthens incentives for continued stewardship. Research indicates that fishermen
operating within many such management models support Marine Protected Areas if the
models are developed in the context of localized management decisions and targeted
science. The Fisheries Fund will establish local platforms for collaborative research and
information gathering.
Ocean Protection Council The California Fisheries Fund will also help the Ocean Protection Council carry
out the fisheries elements of its Strategic Plan and demonstrate the application of
Ecosystem-Based Management principles.
One of the principle tenets of Ecosystem-Based Management is to base decisions
on good information and to use adaptive management techniques (i.e. to base
management on learning). The Fishery Foundations established with capital from the
Fisheries Fund will serve as a community asset and support localized research, fishery
organizations, and reform measures. Lack of targeted on-going research specific to
individual fisheries or areas remains a large impediment to fishery reform. Increased
fishery research is needed to complement the increasing amount of Marine Protected
Area research in California waters.
The Fishery Foundations will allow more fishery scientists and fishermen to
become engaged in monitoring through collaborative research arrangements --
Exhibit 1: California Fisheries Fund Business Plan

The California Fisheries Fund Business Framework
33
stimulating the collection of essential fishery information-- some of which overlap with
Marine Protected Area monitoring programs and some of which are unique to fishery
monitoring. Essential fishery information is the basis for adaptive management of
fisheries.
The Fisheries Fund will also make use of another Ecosystem-Based Management
principle: addressing the human dimensions of fisheries management. By investing in
people, communities, product and market development, and fisheries governance reform,
the Fisheries Fund will aim to align economic and social incentives with conservation
and sustainability, thus providing financial incentives for fishermen as ‘stewards’ and
improving the prospects for preserving the fishing culture of coastal communities by
generating more revenues and investments.
Policy Implications
While it is impossible to predict all the future implications of establishing the
Fund, some potential policy implications have been identified. It is expected that
demonstration fisheries will be working closely with the state and will be undertaking
legal reviews specific to their fisheries regarding currently available options for co-
management structures.
There are many examples of co-management structures being used throughout the
world. Standards and criteria based on a broad set of desired outcomes and impacts will
likely assist the State and specific fisheries in developing models for reform. These
criteria and standards will ensure consistency as reform occurs and ensure that the public
interest purposes of the Fund are achieved.
Criteria and standards would cover such things as governance of Fishery
Foundations and co-management institutions (including representation of all appropriate
interests); economic measures that ensure equitable distribution of privileges; access
criteria; transferability of privileges; environmental performance; reporting; and metrics
used to define and evaluate success.
California state policy already allows the implementation of designated access
management regimes such as limited entry and individual fishing quota programs and
Exhibit 1: California Fisheries Fund Business Plan
The California Fisheries Fund Business Framework
34
sets forth guidance for them (Guide to the Marine Life Management Act). However,
consultation with the Department of Fish and Game and the Fish and Game Commission
on the need for new policies, regulations, or guidance may be necessary if more specific
criteria and standards for designated access privilege systems and co-management are
deemed necessary.
All Fisheries Fund projects shall be consistent with and supportive of the goals
and objectives of MLMA and other relevant state fisheries laws and policies.
Risks
During development of this plan, special attention has been paid to identifying
and mitigating risk wherever possible. The following is a brief summary of key risk
points identified during the planning process. It is expected that additional risks may be
identified during start-up and implementation phases.
• Risk 1: Inability to garner commitment from the State -- State
commitment will be needed in order to demonstrate fisheries governance
reform with the aim of creating economic incentives for stewardship and
adding value to fishery landings as a complement to local participation, as
well as potentially establishing standards and criteria for co-management.
Mitigation: Intensive collaboration amongst State and Federal agencies,
local entities, communities, and various industry groups and individuals
will be required. An executive order, resolution, or new legislation that
renews the commitment of the state to fisheries management and
conservation, without adding unnecessary layers of mandates or
bureaucracy may be helpful. Committed and consistent leadership will be
needed to address the numerous “turf” issues that will likely arise. This
will require ongoing constructive dialogue about elements of reform
between fisheries management agencies and local stakeholders as well as
a commitment to collaboration and agreement on leadership roles.
Implementation of necessary policies or regulations arising from this
Exhibit 1: California Fisheries Fund Business Plan
The California Fisheries Fund Business Framework
35
dialogue will be facilitated by the understandings and accommodations
encouraged by the dialogue.
• Risk 2: Inability to sufficiently leverage additional capital during
either the start-up or expansion phases of plan.
Mitigation: There are inherent risks in any model that requires
leverage and a diverse set of funders. Given the current state of
fisheries, there is much interest in seeking and supporting solutions.
The fact that the Fund will provide both environmental and economic
benefits helps broaden the potential base of support. An initial
commitment by the State provides a solid base for seeking additional
support.
• Risk 3: Insufficient number of communities and fisheries to undertake
and attempt fisheries reform strategies. The current environment in our
fisheries is filled with mistrust and frustration.
Mitigation: A number of fisheries have expressed early interest in
participation. It is expected that as success occurs, the momentum will
build and additional fisheries and communities will seek participation.
Clear and consistent communications on expectations for the role, use,
and phasing of the Fund will be established. If there is insufficient
demand, the Fund can unwind with remaining assets distributed
equitably.
• Risk 4: Unexpected delays prior to or during the start-up phase could
negatively impact desire of fisheries to participate. Many communities
are struggling to identify new ways to solve their fisheries issues.
Additionally, the ability to successfully leverage capital may be
hampered, with potential investors becoming unclear of the State’s
overall commitment and unable to judge the level of risk of
investment.
Exhibit 1: California Fisheries Fund Business Plan
The California Fisheries Fund Business Framework
36
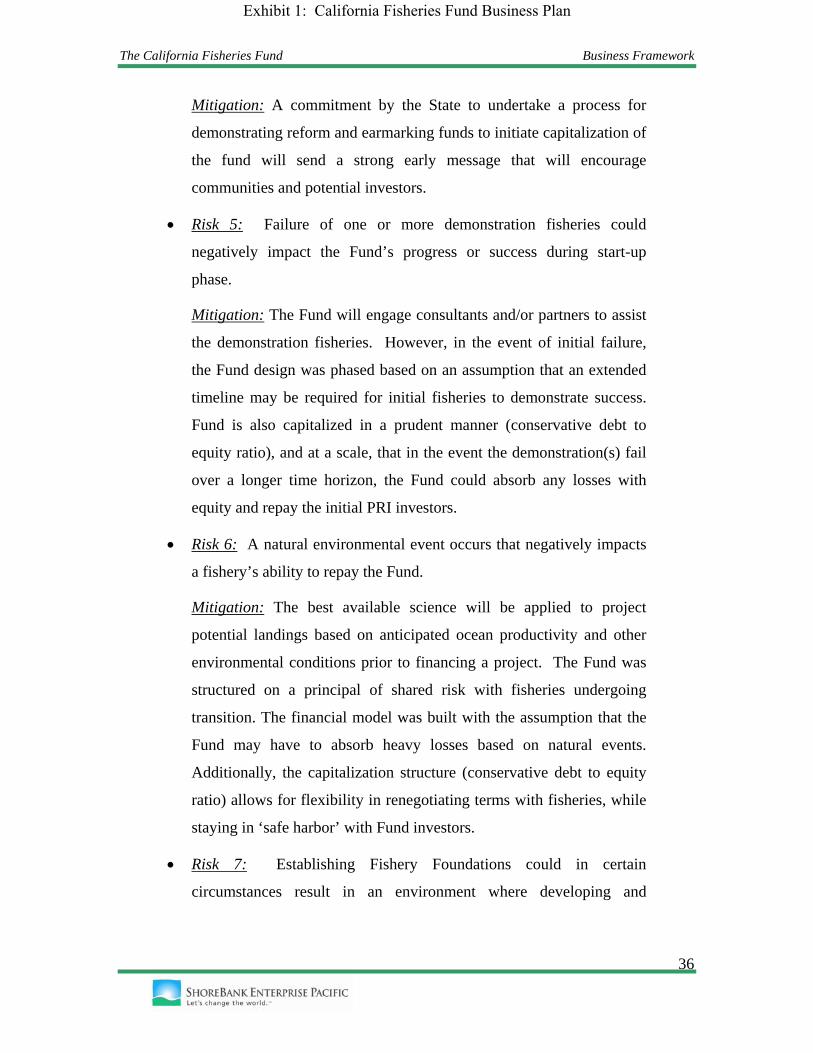
Mitigation: A commitment by the State to undertake a process for
demonstrating reform and earmarking funds to initiate capitalization of
the fund will send a strong early message that will encourage
communities and potential investors.
• Risk 5: Failure of one or more demonstration fisheries could
negatively impact the Fund’s progress or success during start-up
phase.
Mitigation: The Fund will engage consultants and/or partners to assist
the demonstration fisheries. However, in the event of initial failure,
the Fund design was phased based on an assumption that an extended
timeline may be required for initial fisheries to demonstrate success.
Fund is also capitalized in a prudent manner (conservative debt to
equity ratio), and at a scale, that in the event the demonstration(s) fail
over a longer time horizon, the Fund could absorb any losses with
equity and repay the initial PRI investors.
• Risk 6: A natural environmental event occurs that negatively impacts
a fishery’s ability to repay the Fund.
Mitigation: The best available science will be applied to project
potential landings based on anticipated ocean productivity and other
environmental conditions prior to financing a project. The Fund was
structured on a principal of shared risk with fisheries undergoing
transition. The financial model was built with the assumption that the
Fund may have to absorb heavy losses based on natural events.
Additionally, the capitalization structure (conservative debt to equity
ratio) allows for flexibility in renegotiating terms with fisheries, while
staying in ‘safe harbor’ with Fund investors.
• Risk 7: Establishing Fishery Foundations could in certain
circumstances result in an environment where developing and
Exhibit 1: California Fisheries Fund Business Plan
The California Fisheries Fund Business Framework
37
implementing necessary reforms becomes a lengthy and onerous
process, with stakeholders unable to overcome their differences.
Mitigation: The process followed during development of the Fishery
Foundations must be robust and in certain cases may require
facilitation assistance to establish clear guidelines for managing the
process in an effective and efficient manner. During the start-up phase,
emphasis will be placed on creating partnerships designed to provide
direct assistance, education, and relevant information.
Exhibit 1: California Fisheries Fund Business Plan

The California Fisheries Fund Business Framework
38
Appendix A. Financial Model
Exhibit 1: California Fisheries Fund Business Plan

CALIFORNIA FISHERY FUND
STATUS QUO 1 Risk to fish populations and ecosystemsContinued emphasis on maximizing access will result in continued pressure to maximize catch.
2 Declining fishery economic values
=> STATUS QUO Risk to marine environment and fragile California fishery economy.
FISHERY FUND1 Co-Management Empowering local fishery involvement in scientific research and management will catalyze fishery reform.
2 Fishery Foundations Fishery Foundations of permanent capital at the fishery level will act as catalysts to organizing local scientific research and reform efforts.
3 Capital Leverage
4 Loan Product 1: Fishery Foundation Loans capitalize Fishery Foundations, used to support detailed reform plans, scientific research, business planning, and implementation.• Repayment streams are from self-taxed landing fees or other mechanisms.• Terms include interest only periods as research projects are developed and resulting reform practices are implemented.• Terms are a maximum of 10 years.• Rates are appropriately below market to recognize unknown capacity to generate income and broad environmental and economic benefits to the community
5 Loan Product 2: Infrastructure
• Commercial lenders may not make loans due to real or perceived high risk.• Loans should support higher interest rates than Fishery Foundation loans, as they are supported by transition activities resulting from reform.
6 Loan Product 3: Business
• Commercial lenders may not make loans due to real or perceived high risk.• Loans should support higher interest rates than Fishery Foundation and Infrastructure loans, as these are supported by a transitioned fishery.
7 Fund phasing: Start-Up This will include:• Raising initial equity and program related investments (PRI's). Low leverage and cost of funds required based on risk.• Minimize start-up expenses by establishing Fund at a "parent" non-profit, for overall management during an "incubation" stage.• Management entity obtains loan underwriting and portfolio management services through a contract with a qualified economic and environmental lender (CDFI).• Limiting initial lending activity to up to three fisheries with qualified business and reform plans. • Disbursing up to three Fishery Foundation loans and multiple related Infrastructure and/or Business loans.• Contracting for independent evaluation of the Fishery Fund's reform impact and financial performance.
8 Fund phasing: Expansion This will include: *• Raising additional equity and PRI's. Higher leverage based on success. Continued low cost of funds required based on continued below-market pricing of loans.• Establishing independent operations as a stand alone non-profit.• Expanding lending activity to all California fisheries with qualified business and reform plans. • Disbursing multiple new Fishery Foundation loans and related Infrastructure and/or Business loans.
=> FISHERY REFORM Healthy marine environment and robust California fishery economy. Local communities and fishermen as stewards of the environment.
* If demonstration unsuccessful, there is a financial option for a wind-down phase, including:• No additional equity or PRI's into the Fishery Fund. No additional lending to three demonstration fisheries.• Continued management by parent-nonprofit and portfolio management by qualified contractor.• Repayment of initial PRI's
Increased confidence in fishery resulting from reform will require investment at the individual fishing business level for general business development, product innovations, market development, and other activities that add value.
THEORY OF CHANGE AND CRITICAL ASSUMPTIONS
Current management practices will continue to result in declining economic value of fisheries due to excessive capital investments and costs associated with attempts to maximizecatch, failure to plan business due to regulatory uncertainty, and low prices resulting from supply gluts.
Fishery Foundations properly capitalized with seed investments from the Fishery Fund will leverage additional grants and program related investments directly into the Fishery Foundations.
Investments at the fishery level supporting activities undertaken by Ports, communities, and others such as: collective shifts to new types of gear; port infrastructure; improved off-loading capacity; etc.
Attachment A - Financials, Theory
Exhibit 1: California Fisheries Fund Business Plan

CALIFORNIA FISHERY FUND
LOW Insufficient funding for even modest activity. Results in financial losses for Fishery Fund.BASE Sufficient funding for reasonable, projected activity. Results in solvent Fishery Fund with15 year life and ending positive capital balance.HIGH Optimum funding for high level of risk tolerance and maximum flexibility of operations, including highest levels of financial acitivity and reform impacts.
Results in solvent Fishery Fund with 15 year life and ending positive capital balance.
1 Capital: Equity (grants)Equity Amount ($)
2007 3,000,000 5,000,000 7,000,000 20082009
Phase 2: Expansion 2010 1,000,000 2,000,000 3,000,000 20112012201320142015201620172018201920202021
2 Capital: Debt (program related investments)Average BalloonTerm (years) 10 10 10
Average Rate (%) 3.0% 2.0% 1.0%Annual Debt Amount Raised ($)
2007 2,000,000 3,000,000 4,500,000 20082009
Phase 2: Expansion 2010 6,000,000 7,000,000 8,000,000 20112012201320142015201620172018201920202021
BASELOW HIGH
FINANCIAL PROJECTION ASSUMPTIONS
Attachment A - Financials, Assumptions
Exhibit 1: California Fisheries Fund Business Plan
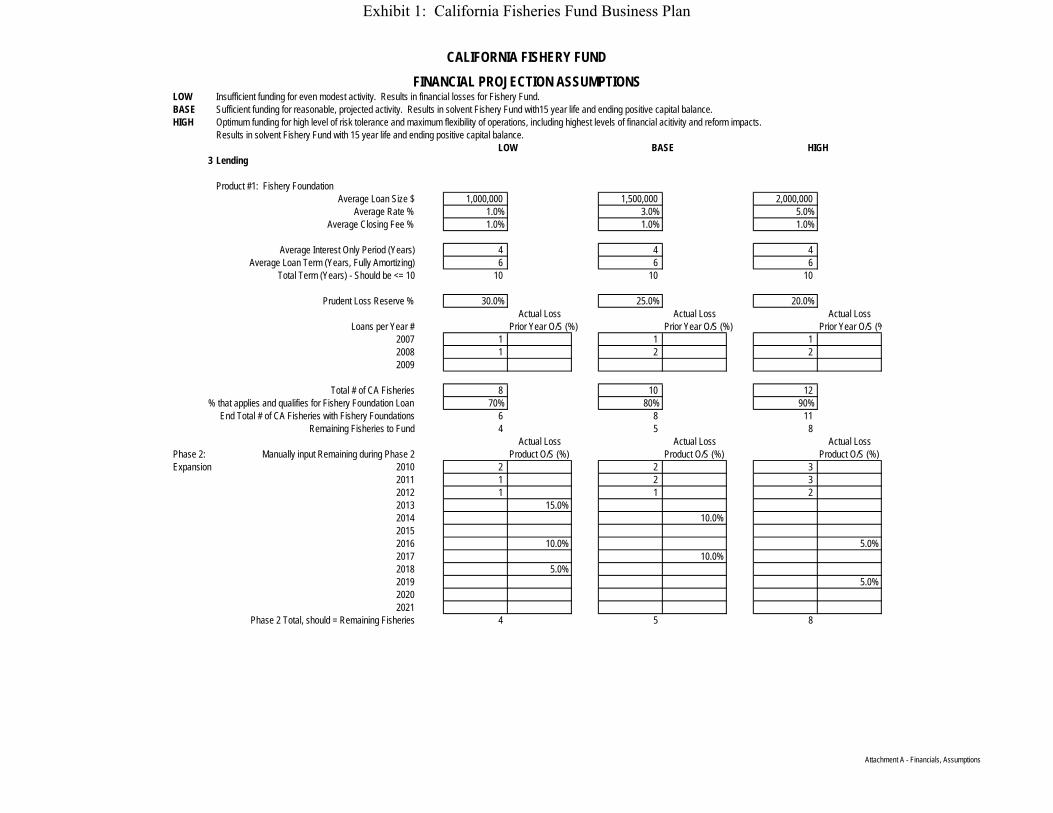
CALIFORNIA FISHERY FUND
LOW Insufficient funding for even modest activity. Results in financial losses for Fishery Fund.BASE Sufficient funding for reasonable, projected activity. Results in solvent Fishery Fund with15 year life and ending positive capital balance.HIGH Optimum funding for high level of risk tolerance and maximum flexibility of operations, including highest levels of financial acitivity and reform impacts.
Results in solvent Fishery Fund with 15 year life and ending positive capital balance.BASELOW HIGH
FINANCIAL PROJECTION ASSUMPTIONS
3 Lending
Product #1: Fishery FoundationAverage Loan Size $ 1,000,000 1,500,000 2,000,000
Average Rate % 1.0% 3.0% 5.0%Average Closing Fee % 1.0% 1.0% 1.0%
Average Interest Only Period (Years) 4 4 4 Average Loan Term (Years, Fully Amortizing) 6 6 6
Total Term (Years) - Should be <= 10 10 10 10
Prudent Loss Reserve % 30.0% 25.0% 20.0%Actual Loss Actual Loss Actual Loss
Loans per Year # Prior Year O/S (%) Prior Year O/S (%) Prior Year O/S (%2007 1 1 1 2008 1 2 2 2009
Total # of CA Fisheries 8 10 12 % that applies and qualifies for Fishery Foundation Loan 70% 80% 90%
End Total # of CA Fisheries with Fishery Foundations 6 8 11 Remaining Fisheries to Fund 4 5 8
Actual Loss Actual Loss Actual LossPhase 2: Manually input Remaining during Phase 2 Product O/S (%) Product O/S (%) Product O/S (%)Expansion 2010 2 2 3
2011 1 2 3 2012 1 1 2 2013 15.0%2014 10.0%20152016 10.0% 5.0%2017 10.0%2018 5.0%2019 5.0%20202021
Phase 2 Total, should = Remaining Fisheries 4 5 8
Attachment A - Financials, Assumptions
Exhibit 1: California Fisheries Fund Business Plan
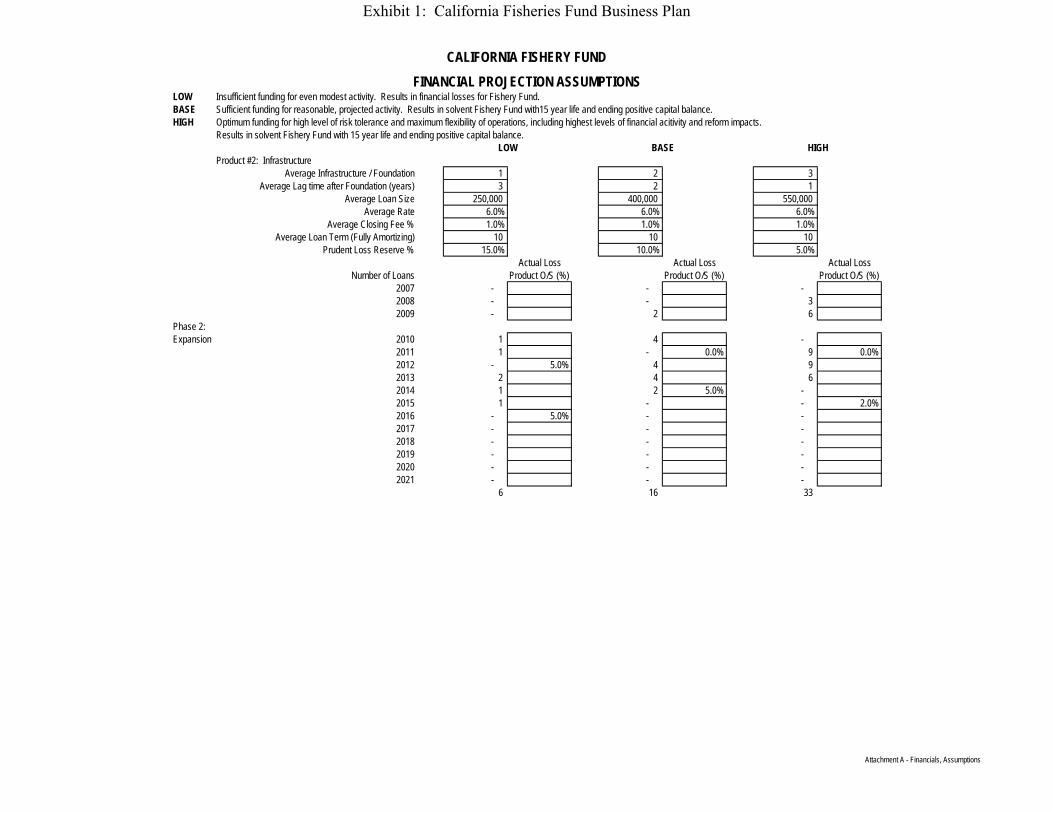
CALIFORNIA FISHERY FUND
LOW Insufficient funding for even modest activity. Results in financial losses for Fishery Fund.BASE Sufficient funding for reasonable, projected activity. Results in solvent Fishery Fund with15 year life and ending positive capital balance.HIGH Optimum funding for high level of risk tolerance and maximum flexibility of operations, including highest levels of financial acitivity and reform impacts.
Results in solvent Fishery Fund with 15 year life and ending positive capital balance.BASELOW HIGH
FINANCIAL PROJECTION ASSUMPTIONS
Product #2: InfrastructureAverage Infrastructure / Foundation 1 2 3
Average Lag time after Foundation (years) 3 2 1 Average Loan Size 250,000 400,000 550,000
Average Rate 6.0% 6.0% 6.0%Average Closing Fee % 1.0% 1.0% 1.0%
Average Loan Term (Fully Amortizing) 10 10 10 Prudent Loss Reserve % 15.0% 10.0% 5.0%
Actual Loss Actual Loss Actual LossNumber of Loans Product O/S (%) Product O/S (%) Product O/S (%)
2007 - - - 2008 - - 3 2009 - 2 6
Phase 2:Expansion 2010 1 4 -
2011 1 - 0.0% 9 0.0%2012 - 5.0% 4 9 2013 2 4 6 2014 1 2 5.0% - 2015 1 - - 2.0%2016 - 5.0% - - 2017 - - - 2018 - - - 2019 - - - 2020 - - - 2021 - - -
6 16 33
Attachment A - Financials, Assumptions
Exhibit 1: California Fisheries Fund Business Plan

CALIFORNIA FISHERY FUND
LOW Insufficient funding for even modest activity. Results in financial losses for Fishery Fund.BASE Sufficient funding for reasonable, projected activity. Results in solvent Fishery Fund with15 year life and ending positive capital balance.HIGH Optimum funding for high level of risk tolerance and maximum flexibility of operations, including highest levels of financial acitivity and reform impacts.
Results in solvent Fishery Fund with 15 year life and ending positive capital balance.BASELOW HIGH
FINANCIAL PROJECTION ASSUMPTIONS
Product #3: Business Average Business / Foundation 4 5 6
Average Lag time after Foundation (years) 3 2 1 Average Loan Size 75,000 100,000 150,000
Average Rate 8.0% 8.0% 8.0%Average Closing Fee % 1.0% 1.0% 1.0%
Average Loan Term (Fully Amortizing) 7 5 5 Prudent Loss Reserve % 20.0% 15.0% 10.0%
Actual Loss Actual Loss Actual LossNumber of Loans Product O/S (%) Product O/S (%) Product O/S (%)
2007 - - - 2008 - - 6 2009 - 5 12
Phase 2:Expansion 2010 4 10 -
2011 4 - 18 2012 - 10 18 2013 8 10.0% 10 5.0% 12 2014 4 5 - 3.0%2015 4 5.0% - - 2016 - - 2.0% - 2017 - - - 2.0%2018 - - - 2019 - - - 2020 - - - 2021 - - -
24 40 66
Attachment A - Financials, Assumptions
Exhibit 1: California Fisheries Fund Business Plan
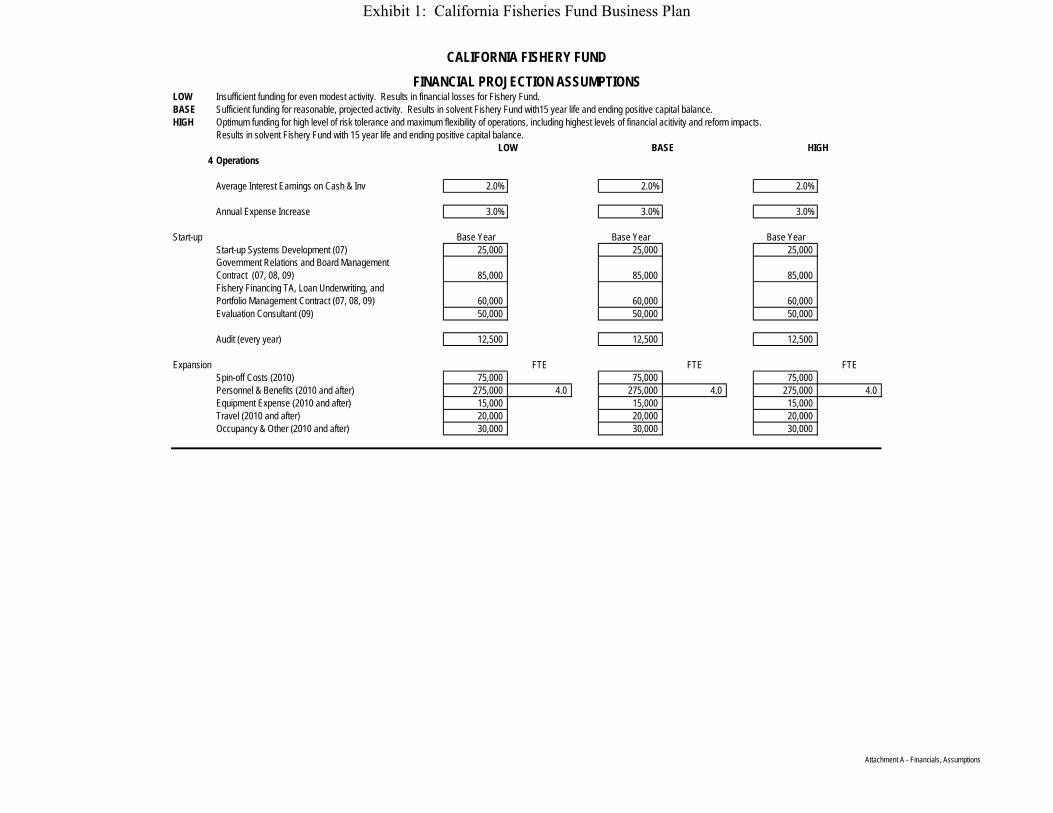
CALIFORNIA FISHERY FUND
LOW Insufficient funding for even modest activity. Results in financial losses for Fishery Fund.BASE Sufficient funding for reasonable, projected activity. Results in solvent Fishery Fund with15 year life and ending positive capital balance.HIGH Optimum funding for high level of risk tolerance and maximum flexibility of operations, including highest levels of financial acitivity and reform impacts.
Results in solvent Fishery Fund with 15 year life and ending positive capital balance.BASELOW HIGH
FINANCIAL PROJECTION ASSUMPTIONS
4 Operations
Average Interest Earnings on Cash & Inv 2.0% 2.0% 2.0%
Annual Expense Increase 3.0% 3.0% 3.0%
Start-up Base Year Base Year Base YearStart-up Systems Development (07) 25,000 25,000 25,000 Government Relations and Board Management Contract (07, 08, 09) 85,000 85,000 85,000 Fishery Financing TA, Loan Underwriting, and Portfolio Management Contract (07, 08, 09) 60,000 60,000 60,000 Evaluation Consultant (09) 50,000 50,000 50,000
Audit (every year) 12,500 12,500 12,500
Expansion FTE FTE FTESpin-off Costs (2010) 75,000 75,000 75,000 Personnel & Benefits (2010 and after) 275,000 4.0 275,000 4.0 275,000 4.0 Equipment Expense (2010 and after) 15,000 15,000 15,000 Travel (2010 and after) 20,000 20,000 20,000 Occupancy & Other (2010 and after) 30,000 30,000 30,000
Attachment A - Financials, Assumptions
Exhibit 1: California Fisheries Fund Business Plan

CALIFORNIA FISHERY FUND
2007 2010 2021 2007 2010 2021 2007 2010 2021 BALANCE SHEET
ASSETSCash 3,862,500 7,918,067 (2,874,194) 6,425,000 8,388,224 4,476,615 9,505,000 9,034,866 19,257,199
Fishery Foundation Loans 1,000,000 4,000,000 - 1,500,000 7,500,000 - 2,000,000 12,000,000 - Fishery Foundation Reserves (300,000) (1,200,000) - (375,000) (1,875,000) - (400,000) (2,400,000) - Net Fishery Foundation Loans 700,000 2,800,000 - 1,125,000 5,625,000 - 1,600,000 9,600,000 -
Infrastructure Loans - 231,182 149,110 - 2,155,415 188,661 - 4,041,832 425,680 Infrastructure Reserves - (34,677) (22,366) - (215,541) (18,866) - (202,092) (21,284) Net Infrastructure Loans - 196,505 126,743 - 1,939,873 169,795 - 3,839,740 404,396
Business Loans - 266,686 - - 1,154,088 - - 1,568,191 - Business Reserves - (53,337) - - (173,113) - - (156,819) - Net Business Loans - 213,349 - - 980,975 - - 1,411,372 -
Total Gross Loans 1,000,000.00 3,209,853 126,743 1,500,000 8,545,848 169,795 2,000,000 14,851,112 404,396 Total Loss Reserves (300,000.00) (1,288,014) (22,366) (375,000) (2,263,655) (18,866) (400,000) (2,758,911) (21,284) Net Total Loans 700,000.00 1,921,839 104,377 1,125,000 6,282,193 150,928 1,600,000 12,092,202 383,112
Total Assets 4,562,500 9,839,905 (2,769,817) 7,550,000 14,670,418 4,627,543 11,105,000 21,127,068 19,640,311
LIABILITIES AND NET ASSETSDebt 2,000,000 8,000,000 - 3,000,000 10,000,000 - 4,500,000 12,500,000 -
Beginning Net Assets - 1,952,284 (2,261,212) - 3,718,863 4,953,590 - 6,327,881 19,654,443 Operating Results (437,500) (1,112,378) (508,605) (450,000) (1,048,446) (326,047) (395,000) (700,813) (14,132) Capital Grants 3,000,000 1,000,000 - 5,000,000 2,000,000 - 7,000,000 3,000,000 - Ending Net Assets 2,562,500 1,839,905 (2,769,817) 4,550,000 4,670,418 4,627,543 6,605,000 8,627,068 19,640,311
Total Liabilities and Net Assets 4,562,500 9,839,905 (2,769,817) 7,550,000 14,670,418 4,627,543 11,105,000 21,127,068 19,640,311
LOW BASE HIGHSCENARIO COMPARISON
Attachment A - Financials, Summary
Exhibit 1: California Fisheries Fund Business Plan

CALIFORNIA FISHERY FUND
2007 2010 2021 2007 2010 2021 2007 2010 2021LOW BASE HIGH
SCENARIO COMPARISON
INCOME STATEMENT
REVENUESInterest on Loans 5,000 47,603 12,436 22,500 329,631 26,090 50,000 850,443 56,725 Interest on Cash & Investments 60,000 63,046 (48,940) 100,000 71,727 88,176 140,000 31,300 366,716 Interest Expense (30,000) (150,000) - (30,000) (130,000) - (22,500) (85,000) - Net Interest Income 35,000 (39,351) (36,504) 92,500 271,357 114,266 167,500 796,743 423,441
Loss Allocation (300,000) (688,014) 17,446 (375,000) (1,002,384) 49,234 (400,000) (1,128,898) 51,974 Net Financing Income (265,000) (727,366) (19,058) (282,500) (731,027) 163,500 (232,500) (332,154) 475,415
Loan Fees 10,000 43,647 - 15,000 111,240 - 20,000 60,000 -
Earned Income (255,000) (683,719) (19,058) (267,500) (619,787) 163,500 (212,500) (272,154) 475,415
Grants & Contributions - - - - - - - - - Total Revenue (255,000) (683,719) (19,058) (267,500) (619,787) 163,500 (212,500) (272,154) 475,415
Start-up Systems Development 25,000 - - 25,000 - - 25,000 - - Management Contract 85,000 - - 85,000 - - 85,000 - - Lending / Portfolio Contract 60,000 - - 60,000 - - 60,000 - - Evaluation Consultant - - - - - - - - - Audit 12,500 13,659 18,907 12,500 13,659 18,907 12,500 13,659 18,907 Spin-off Costs - 75,000 - - 75,000 - - 75,000 - Personnel & Benefits - 275,000 380,664 - 275,000 380,664 - 275,000 380,664 Equipment Expense - 15,000 20,764 - 15,000 20,764 - 15,000 20,764 Travel - 20,000 27,685 - 20,000 27,685 - 20,000 27,685 Occupancy & Other - 30,000 41,527 - 30,000 41,527 - 30,000 41,527 Total Operating Expenses 182,500 428,659 489,547 182,500 428,659 489,547 182,500 428,659 489,547
Operating Results (437,500) (1,112,378) (508,605) (450,000) (1,048,446) (326,047) (395,000) (700,813) (14,132)
Capital Grants 3,000,000 1,000,000 - 5,000,000 2,000,000 - 7,000,000 3,000,000 - Change in Net Assets 2,562,500 (112,378) (508,605) 4,550,000 951,554 (326,047) 6,605,000 2,299,187 (14,132)
Attachment A - Financials, Summary
Exhibit 1: California Fisheries Fund Business Plan
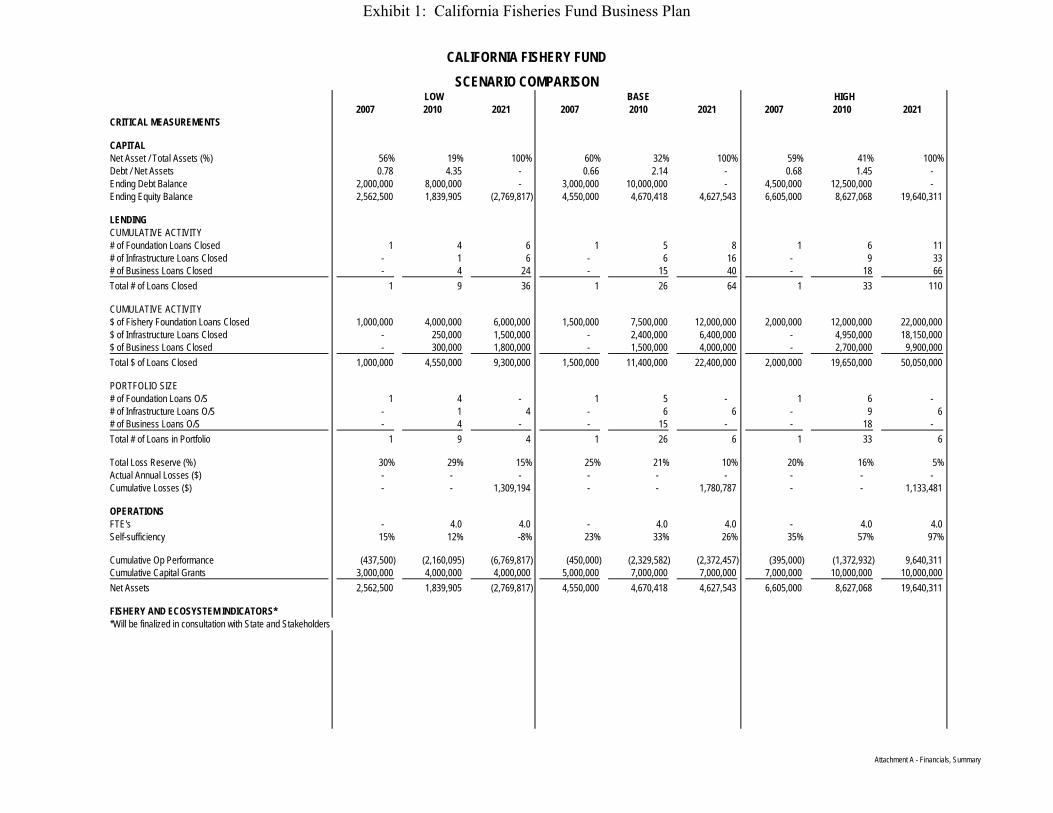
CALIFORNIA FISHERY FUND
2007 2010 2021 2007 2010 2021 2007 2010 2021LOW BASE HIGH
SCENARIO COMPARISON
CRITICAL MEASUREMENTS
CAPITALNet Asset / Total Assets (%) 56% 19% 100% 60% 32% 100% 59% 41% 100%Debt / Net Assets 0.78 4.35 - 0.66 2.14 - 0.68 1.45 - Ending Debt Balance 2,000,000 8,000,000 - 3,000,000 10,000,000 - 4,500,000 12,500,000 - Ending Equity Balance 2,562,500 1,839,905 (2,769,817) 4,550,000 4,670,418 4,627,543 6,605,000 8,627,068 19,640,311
LENDINGCUMULATIVE ACTIVITY# of Foundation Loans Closed 1 4 6 1 5 8 1 6 11 # of Infrastructure Loans Closed - 1 6 - 6 16 - 9 33 # of Business Loans Closed - 4 24 - 15 40 - 18 66 Total # of Loans Closed 1 9 36 1 26 64 1 33 110
CUMULATIVE ACTIVITY$ of Fishery Foundation Loans Closed 1,000,000 4,000,000 6,000,000 1,500,000 7,500,000 12,000,000 2,000,000 12,000,000 22,000,000 $ of Infrastructure Loans Closed - 250,000 1,500,000 - 2,400,000 6,400,000 - 4,950,000 18,150,000 $ of Business Loans Closed - 300,000 1,800,000 - 1,500,000 4,000,000 - 2,700,000 9,900,000 Total $ of Loans Closed 1,000,000 4,550,000 9,300,000 1,500,000 11,400,000 22,400,000 2,000,000 19,650,000 50,050,000
PORTFOLIO SIZE# of Foundation Loans O/S 1 4 - 1 5 - 1 6 - # of Infrastructure Loans O/S - 1 4 - 6 6 - 9 6 # of Business Loans O/S - 4 - - 15 - - 18 - Total # of Loans in Portfolio 1 9 4 1 26 6 1 33 6
Total Loss Reserve (%) 30% 29% 15% 25% 21% 10% 20% 16% 5%Actual Annual Losses ($) - - - - - - - - - Cumulative Losses ($) - - 1,309,194 - - 1,780,787 - - 1,133,481
OPERATIONSFTE's - 4.0 4.0 - 4.0 4.0 - 4.0 4.0 Self-sufficiency 15% 12% -8% 23% 33% 26% 35% 57% 97%
Cumulative Op Performance (437,500) (2,160,095) (6,769,817) (450,000) (2,329,582) (2,372,457) (395,000) (1,372,932) 9,640,311 Cumulative Capital Grants 3,000,000 4,000,000 4,000,000 5,000,000 7,000,000 7,000,000 7,000,000 10,000,000 10,000,000 Net Assets 2,562,500 1,839,905 (2,769,817) 4,550,000 4,670,418 4,627,543 6,605,000 8,627,068 19,640,311
FISHERY AND ECOSYSTEM INDICATORS**Will be finalized in consultation with State and Stakeholders
Attachment A - Financials, Summary
Exhibit 1: California Fisheries Fund Business Plan

CALIFORNIA FISHERY FUND
LOW: Insufficient funding for even modest activity. Results in financial losses for Fishery Fund.2007 2008 2009 2010 2011 2012 2013 2014 2015 2016 2017 2018 2019 2020 2021
BALANCE SHEET
ASSETSCash 3,862,500 3,342,525 3,152,284 7,918,067 6,650,522 5,911,999 4,843,000 4,741,387 4,792,511 5,311,507 3,769,875 4,031,036 3,843,573 (2,447,005) (2,874,194)
Fishery Foundation Loans 1,000,000 2,000,000 2,000,000 4,000,000 4,837,470 5,510,778 4,354,187 3,695,839 2,868,348 1,583,179 747,391 38,413 - - - Fishery Foundation Reserves (300,000) (600,000) (600,000) (1,200,000) (1,451,241) (1,653,233) (1,306,256) (1,108,752) (860,504) (474,954) (224,217) (11,524) - - -
Net Fishery Foundation Loans 700,000 1,400,000 1,400,000 2,800,000 3,386,229 3,857,545 3,047,931 2,587,087 2,007,843 1,108,225 523,173 26,889 - - -
Infrastructure Loans - - - 231,182 442,385 379,076 797,710 942,507 1,014,872 876,313 729,208 573,030 407,219 265,419 149,110 Infrastructure Reserves - - - (34,677) (66,358) (56,861) (119,656) (141,376) (152,231) (131,447) (109,381) (85,954) (61,083) (39,813) (22,366)
Net Infrastructure Loans - - - 196,505 376,027 322,215 678,053 801,131 862,641 744,866 619,827 487,075 346,136 225,606 126,743
Business Loans - - - 266,686 497,292 422,139 831,905 938,286 948,367 685,194 458,391 270,978 68,010 - - Business Reserves - - - (53,337) (99,458) (84,428) (166,381) (187,657) (189,673) (137,039) (91,678) (54,196) (13,602) - -
Net Business Loans - - - 213,349 397,834 337,711 665,524 750,628 758,694 548,155 366,713 216,783 54,408 - -
Total Gross Loans 1,000,000 1,400,000 1,400,000 3,209,853 4,160,090 4,517,471 4,391,509 4,138,847 3,629,178 2,401,246 1,509,713 730,747 400,544 225,606 126,743 Total Loss Reserves (300,000) (600,000) (600,000) (1,288,014) (1,617,057) (1,794,523) (1,592,294) (1,437,785) (1,202,409) (743,439) (425,277) (151,674) (74,685) (39,813) (22,366)
Net Total Loans 700,000 800,000 800,000 1,921,839 2,543,033 2,722,948 2,799,215 2,701,062 2,426,770 1,657,807 1,084,437 579,073 325,859 185,793 104,377
Total Assets 4,562,500 4,142,525 3,952,284 9,839,905 9,193,555 8,634,946 7,642,215 7,442,449 7,219,281 6,969,313 4,854,312 4,610,109 4,169,433 (2,261,212) (2,769,817)
LIABILITIES AND NET ASSETSDebt 2,000,000 2,000,000 2,000,000 8,000,000 8,000,000 8,000,000 8,000,000 8,000,000 8,000,000 8,000,000 6,000,000 6,000,000 6,000,000 - -
Beginning Net Assets 2,562,500 2,142,525 1,952,284 1,839,905 1,193,555 634,946 (357,785) (557,551) (780,719) (1,030,687) (1,145,688) (1,389,891) (1,830,567) (2,261,212) Operating Results (437,500) (419,975) (190,241) (1,112,378) (646,350) (558,609) (992,731) (199,767) (223,168) (249,967) (115,001) (244,203) (440,676) (430,645) (508,605) Capital Grants 3,000,000 - - 1,000,000 - - - - - - - - - - - Ending Net Assets 2,562,500 2,142,525 1,952,284 1,839,905 1,193,555 634,946 (357,785) (557,551) (780,719) (1,030,687) (1,145,688) (1,389,891) (1,830,567) (2,261,212) (2,769,817)
Total Liabilities and Net Assets 4,562,500 4,142,525 3,952,284 9,839,905 9,193,555 8,634,946 7,642,215 7,442,449 7,219,281 6,969,313 4,854,312 4,610,109 4,169,433 (2,261,212) (2,769,817)
LOW SCENARIOFINANCIAL STATEMENTS
Attachment A - Financials, Low
Exhibit 1: California Fisheries Fund Business Plan

CALIFORNIA FISHERY FUND
LOW: Insufficient funding for even modest activity. Results in financial losses for Fishery Fund.2007 2008 2009 2010 2011 2012 2013 2014 2015 2016 2017 2018 2019 2020 2021
LOW SCENARIOFINANCIAL STATEMENTS
INCOME STATEMENT
REVENUESInterest on Loans 5,000 15,000 20,000 47,603 94,953 113,162 134,790 163,264 167,008 144,336 105,562 72,171 43,159 22,900 12,436 Interest on Cash & Investments 60,000 77,250 66,851 63,046 158,361 133,010 118,240 96,860 94,828 95,850 106,230 75,398 80,621 76,871 (48,940) Interest Expense (30,000) (60,000) (60,000) (150,000) (240,000) (240,000) (240,000) (240,000) (240,000) (240,000) (210,000) (180,000) (180,000) (90,000) - Net Interest Income 35,000 32,250 26,851 (39,351) 13,315 6,173 13,030 20,124 21,836 186 1,792 (32,432) (56,220) 9,771 (36,504)
Loss Allocation (300,000) (300,000) - (688,014) (329,043) (199,585) (666,602) 154,509 141,337 172,134 318,163 236,233 76,989 34,872 17,446 Net Financing Income (265,000) (267,750) 26,851 (727,366) (315,728) (193,412) (653,572) 174,633 163,173 172,320 319,955 203,802 20,769 44,643 (19,058)
Loan Fees 10,000 10,000 - 43,647 33,647 10,000 47,293 23,647 23,647 - - - - - -
Earned Income (255,000) (257,750) 26,851 (683,719) (282,081) (183,412) (606,278) 198,280 186,820 172,320 319,955 203,802 20,769 44,643 (19,058)
Grants & ContributionsTotal Revenue (255,000) (257,750) 26,851 (683,719) (282,081) (183,412) (606,278) 198,280 186,820 172,320 319,955 203,802 20,769 44,643 (19,058)
OPERATING COSTSStart-up Systems Development 25,000 Management Contract 85,000 87,550 90,177 Lending / Portfolio Contract 60,000 61,800 63,654 Evaluation Consultant 50,000 Audit 12,500 12,875 13,261 13,659 14,069 14,491 14,926 15,373 15,835 16,310 16,799 17,303 17,822 18,357 18,907 Spin-off Costs 75,000 Personnel & Benefits 275,000 283,250 291,748 300,500 309,515 318,800 328,364 338,215 348,362 358,813 369,577 380,664 Equipment Expense 15,000 15,450 15,914 16,391 16,883 17,389 17,911 18,448 19,002 19,572 20,159 20,764 Travel 20,000 20,600 21,218 21,855 22,510 23,185 23,881 24,597 25,335 26,095 26,878 27,685 Occupancy & Other 30,000 30,900 31,827 32,782 33,765 34,778 35,822 36,896 38,003 39,143 40,317 41,527 Total Operating Expenses 182,500 162,225 217,092 428,659 364,269 375,197 386,453 398,046 409,988 422,287 434,956 448,005 461,445 475,288 489,547
Operating Results (437,500) (419,975) (190,241) (1,112,378) (646,350) (558,609) (992,731) (199,767) (223,168) (249,967) (115,001) (244,203) (440,676) (430,645) (508,605)
Capital Grants 3,000,000 - - 1,000,000 - - - - - - - - - - - Change in Net Assets 2,562,500 (419,975) (190,241) (112,378) (646,350) (558,609) (992,731) (199,767) (223,168) (249,967) (115,001) (244,203) (440,676) (430,645) (508,605)
Attachment A - Financials, Low
Exhibit 1: California Fisheries Fund Business Plan
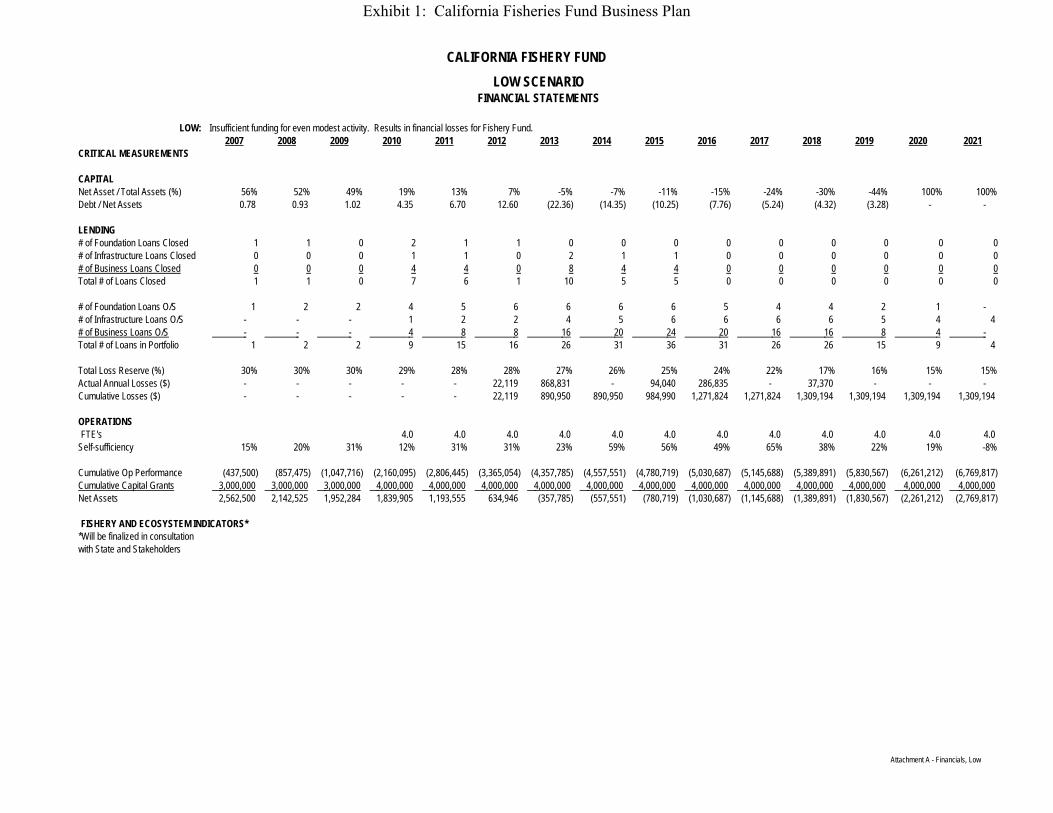
CALIFORNIA FISHERY FUND
LOW: Insufficient funding for even modest activity. Results in financial losses for Fishery Fund.2007 2008 2009 2010 2011 2012 2013 2014 2015 2016 2017 2018 2019 2020 2021
LOW SCENARIOFINANCIAL STATEMENTS
CRITICAL MEASUREMENTS
CAPITALNet Asset / Total Assets (%) 56% 52% 49% 19% 13% 7% -5% -7% -11% -15% -24% -30% -44% 100% 100%Debt / Net Assets 0.78 0.93 1.02 4.35 6.70 12.60 (22.36) (14.35) (10.25) (7.76) (5.24) (4.32) (3.28) - -
LENDING# of Foundation Loans Closed 1 1 0 2 1 1 0 0 0 0 0 0 0 0 0# of Infrastructure Loans Closed 0 0 0 1 1 0 2 1 1 0 0 0 0 0 0# of Business Loans Closed 0 0 0 4 4 0 8 4 4 0 0 0 0 0 0Total # of Loans Closed 1 1 0 7 6 1 10 5 5 0 0 0 0 0 0
# of Foundation Loans O/S 1 2 2 4 5 6 6 6 6 5 4 4 2 1 - # of Infrastructure Loans O/S - - - 1 2 2 4 5 6 6 6 6 5 4 4 # of Business Loans O/S - - - 4 8 8 16 20 24 20 16 16 8 4 - Total # of Loans in Portfolio 1 2 2 9 15 16 26 31 36 31 26 26 15 9 4
Total Loss Reserve (%) 30% 30% 30% 29% 28% 28% 27% 26% 25% 24% 22% 17% 16% 15% 15%Actual Annual Losses ($) - - - - - 22,119 868,831 - 94,040 286,835 - 37,370 - - - Cumulative Losses ($) - - - - - 22,119 890,950 890,950 984,990 1,271,824 1,271,824 1,309,194 1,309,194 1,309,194 1,309,194
OPERATIONSFTE's 4.0 4.0 4.0 4.0 4.0 4.0 4.0 4.0 4.0 4.0 4.0 4.0
Self-sufficiency 15% 20% 31% 12% 31% 31% 23% 59% 56% 49% 65% 38% 22% 19% -8%
Cumulative Op Performance (437,500) (857,475) (1,047,716) (2,160,095) (2,806,445) (3,365,054) (4,357,785) (4,557,551) (4,780,719) (5,030,687) (5,145,688) (5,389,891) (5,830,567) (6,261,212) (6,769,817) Cumulative Capital Grants 3,000,000 3,000,000 3,000,000 4,000,000 4,000,000 4,000,000 4,000,000 4,000,000 4,000,000 4,000,000 4,000,000 4,000,000 4,000,000 4,000,000 4,000,000 Net Assets 2,562,500 2,142,525 1,952,284 1,839,905 1,193,555 634,946 (357,785) (557,551) (780,719) (1,030,687) (1,145,688) (1,389,891) (1,830,567) (2,261,212) (2,769,817)
FISHERY AND ECOSYSTEM INDICATORS**Will be finalized in consultation with State and Stakeholders
Attachment A - Financials, Low
Exhibit 1: California Fisheries Fund Business Plan

CALIFORNIA FISHERY FUND
BASE: Sufficient funding for reasonable, projected activity. Results in solvent Fishery Fund with 15 year life and ending positive capital balance.2007 2008 2009 2010 2011 2012 2013 2014 2015 2016 2017 2018 2019 2020 2021
BALANCE SHEET
ASSETSCash 6,425,000 4,576,275 3,586,342 8,388,224 6,833,056 4,868,529 4,377,201 5,148,122 7,443,566 9,916,055 8,906,323 10,290,824 11,256,799 4,408,787 4,476,615
Fishery Foundation Loans 1,500,000 4,500,000 4,500,000 7,500,000 10,268,346 11,066,337 10,342,977 8,100,008 6,391,266 4,398,897 2,183,316 908,172 - - - Fishery Foundation Reserves (375,000) (1,125,000) (1,125,000) (1,875,000) (2,567,086) (2,766,584) (2,585,744) (2,025,002) (1,597,816) (1,099,724) (545,829) (227,043) - - -
Net Fishery Foundation Loans 1,125,000 3,375,000 3,375,000 5,625,000 7,701,259 8,299,753 7,757,232 6,075,006 4,793,449 3,299,172 1,637,487 681,129 - - -
Infrastructure Loans - - 739,782 2,155,415 1,959,676 3,231,429 4,362,501 4,386,307 3,793,818 3,164,786 2,496,956 1,787,936 1,144,746 681,004 188,661 Infrastructure Reserves - - (73,978) (215,541) (195,968) (323,143) (436,250) (438,631) (379,382) (316,479) (249,696) (178,794) (114,475) (68,100) (18,866)
Net Infrastructure Loans - - 665,804 1,939,873 1,763,708 2,908,286 3,926,251 3,947,676 3,414,436 2,848,307 2,247,261 1,609,143 1,030,271 612,904 169,795
Business Loans - - 415,280 1,154,088 871,217 1,395,429 1,640,938 1,440,887 935,172 368,779 28,072 - - - - Business Reserves - - (62,292) (173,113) (130,683) (209,314) (246,141) (216,133) (140,276) (55,317) (4,211) - - - -
Net Business Loans - - 352,988 980,975 740,535 1,186,114 1,394,797 1,224,754 794,896 313,462 23,861 - - - -
Total Gross Loans 1,500,000 3,375,000 4,393,792 8,545,848 10,205,503 12,394,153 13,078,280 11,247,436 9,002,782 6,460,942 3,908,609 2,290,272 1,030,271 612,904 169,795 Total Loss Reserves (375,000) (1,125,000) (1,261,270) (2,263,655) (2,893,737) (3,299,041) (3,268,135) (2,679,766) (2,117,474) (1,471,520) (799,735) (405,837) (114,475) (68,100) (18,866)
Net Total Loans 1,125,000 2,250,000 3,132,522 6,282,193 7,311,766 9,095,112 9,810,145 8,567,671 6,885,308 4,989,423 3,108,873 1,884,435 915,796 544,803 150,928
Total Assets 7,550,000 6,826,275 6,718,863 14,670,418 14,144,822 13,963,641 14,187,346 13,715,792 14,328,874 14,905,477 12,015,197 12,175,259 12,172,596 4,953,590 4,627,543
LIABILITIES AND NET ASSETSDebt 3,000,000 3,000,000 3,000,000 10,000,000 10,000,000 10,000,000 10,000,000 10,000,000 10,000,000 10,000,000 7,000,000 7,000,000 7,000,000 - -
Beginning Net Assets 4,550,000 3,826,275 3,718,863 4,670,418 4,144,822 3,963,641 4,187,346 3,715,792 4,328,874 4,905,477 5,015,197 5,175,259 5,172,596 4,953,590 Operating Results (450,000) (723,725) (107,412) (1,048,446) (525,596) (181,181) 223,706 (471,554) 613,082 576,603 109,719 160,062 (2,663) (219,006) (326,047) Capital Grants 5,000,000 - - 2,000,000 - - - - - - - - - - - Ending Net Assets 4,550,000 3,826,275 3,718,863 4,670,418 4,144,822 3,963,641 4,187,346 3,715,792 4,328,874 4,905,477 5,015,197 5,175,259 5,172,596 4,953,590 4,627,543
Total Liabilities and Net Assets 7,550,000 6,826,275 6,718,863 14,670,418 14,144,822 13,963,641 14,187,346 13,715,792 14,328,874 14,905,477 12,015,197 12,175,259 12,172,596 4,953,590 4,627,543
BASE SCENARIOFINANCIAL STATEMENTS
Attachment A - Financials, Base
Exhibit 1: California Fisheries Fund Business Plan

CALIFORNIA FISHERY FUND
BASE: Sufficient funding for reasonable, projected activity. Results in solvent Fishery Fund with 15 year life and ending positive capital balance.2007 2008 2009 2010 2011 2012 2013 2014 2015 2016 2017 2018 2019 2020 2021
BASE SCENARIOFINANCIAL STATEMENTS
INCOME STATEMENT
REVENUESInterest on Loans 22,500 90,000 173,805 329,631 470,990 566,419 670,412 662,382 557,815 422,769 284,459 176,042 101,603 54,772 26,090 Interest on Cash & Investments 100,000 128,500 91,526 71,727 167,764 136,661 97,371 87,544 102,962 148,871 198,321 178,126 205,816 225,136 88,176 Interest Expense (30,000) (60,000) (60,000) (130,000) (200,000) (200,000) (200,000) (200,000) (200,000) (200,000) (170,000) (140,000) (140,000) (70,000) - Net Interest Income 92,500 158,500 205,330 271,357 438,755 503,080 567,783 549,926 460,778 371,640 312,781 214,168 167,420 209,908 114,266
Loss Allocation (375,000) (750,000) (136,270) (1,002,384) (630,082) (405,305) (38,865) (664,054) 562,292 627,251 231,895 393,899 291,362 46,374 49,234 Net Financing Income (282,500) (591,500) 69,060 (731,027) (191,327) 97,776 528,918 (114,128) 1,023,069 998,891 544,675 608,067 458,782 256,283 163,500
Loan Fees 15,000 30,000 40,620 111,240 30,000 96,240 81,240 40,620 - - - - - - -
Earned Income (267,500) (561,500) 109,680 (619,787) (161,327) 194,016 610,158 (73,507) 1,023,069 998,891 544,675 608,067 458,782 256,283 163,500
Grants & ContributionsTotal Revenue (267,500) (561,500) 109,680 (619,787) (161,327) 194,016 610,158 (73,507) 1,023,069 998,891 544,675 608,067 458,782 256,283 163,500
OPERATING COSTSStart-up Systems Development 25,000 Management Contract 85,000 87,550 90,177 Lending / Portfolio Contract 60,000 61,800 63,654 Evaluation Consultant 50,000 Audit 12,500 12,875 13,261 13,659 14,069 14,491 14,926 15,373 15,835 16,310 16,799 17,303 17,822 18,357 18,907 Spin-off Costs 75,000 Personnel & Benefits 275,000 283,250 291,748 300,500 309,515 318,800 328,364 338,215 348,362 358,813 369,577 380,664 Equipment Expense 15,000 15,450 15,914 16,391 16,883 17,389 17,911 18,448 19,002 19,572 20,159 20,764 Travel 20,000 20,600 21,218 21,855 22,510 23,185 23,881 24,597 25,335 26,095 26,878 27,685 Occupancy & Other 30,000 30,900 31,827 32,782 33,765 34,778 35,822 36,896 38,003 39,143 40,317 41,527 Total Operating Expenses 182,500 162,225 217,092 428,659 364,269 375,197 386,453 398,046 409,988 422,287 434,956 448,005 461,445 475,288 489,547
Operating Results (450,000) (723,725) (107,412) (1,048,446) (525,596) (181,181) 223,706 (471,554) 613,082 576,603 109,719 160,062 (2,663) (219,006) (326,047)
Capital Grants 5,000,000 - - 2,000,000 - - - - - - - - - - - Change in Net Assets 4,550,000 (723,725) (107,412) 951,554 (525,596) (181,181) 223,706 (471,554) 613,082 576,603 109,719 160,062 (2,663) (219,006) (326,047)
Attachment A - Financials, Base
Exhibit 1: California Fisheries Fund Business Plan
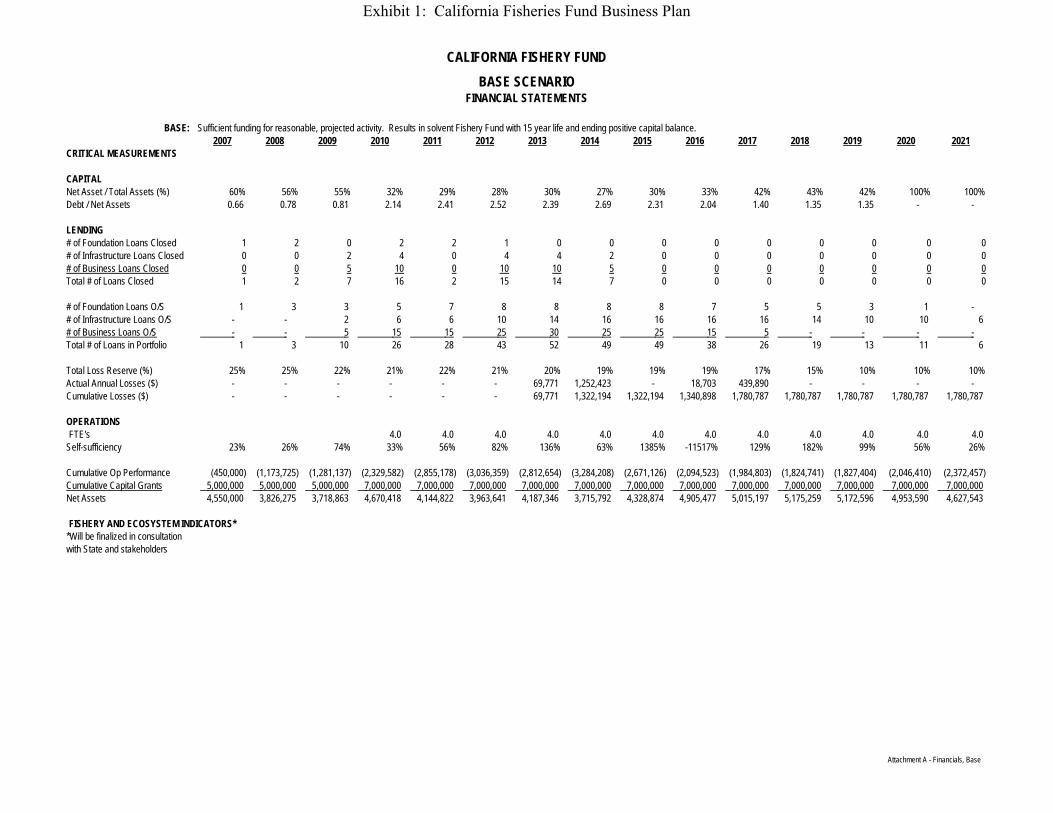
CALIFORNIA FISHERY FUND
BASE: Sufficient funding for reasonable, projected activity. Results in solvent Fishery Fund with 15 year life and ending positive capital balance.2007 2008 2009 2010 2011 2012 2013 2014 2015 2016 2017 2018 2019 2020 2021
BASE SCENARIOFINANCIAL STATEMENTS
CRITICAL MEASUREMENTS
CAPITALNet Asset / Total Assets (%) 60% 56% 55% 32% 29% 28% 30% 27% 30% 33% 42% 43% 42% 100% 100%Debt / Net Assets 0.66 0.78 0.81 2.14 2.41 2.52 2.39 2.69 2.31 2.04 1.40 1.35 1.35 - -
LENDING# of Foundation Loans Closed 1 2 0 2 2 1 0 0 0 0 0 0 0 0 0# of Infrastructure Loans Closed 0 0 2 4 0 4 4 2 0 0 0 0 0 0 0# of Business Loans Closed 0 0 5 10 0 10 10 5 0 0 0 0 0 0 0Total # of Loans Closed 1 2 7 16 2 15 14 7 0 0 0 0 0 0 0
# of Foundation Loans O/S 1 3 3 5 7 8 8 8 8 7 5 5 3 1 - # of Infrastructure Loans O/S - - 2 6 6 10 14 16 16 16 16 14 10 10 6 # of Business Loans O/S - - 5 15 15 25 30 25 25 15 5 - - - - Total # of Loans in Portfolio 1 3 10 26 28 43 52 49 49 38 26 19 13 11 6
Total Loss Reserve (%) 25% 25% 22% 21% 22% 21% 20% 19% 19% 19% 17% 15% 10% 10% 10%Actual Annual Losses ($) - - - - - - 69,771 1,252,423 - 18,703 439,890 - - - - Cumulative Losses ($) - - - - - - 69,771 1,322,194 1,322,194 1,340,898 1,780,787 1,780,787 1,780,787 1,780,787 1,780,787
OPERATIONSFTE's 4.0 4.0 4.0 4.0 4.0 4.0 4.0 4.0 4.0 4.0 4.0 4.0
Self-sufficiency 23% 26% 74% 33% 56% 82% 136% 63% 1385% -11517% 129% 182% 99% 56% 26%
Cumulative Op Performance (450,000) (1,173,725) (1,281,137) (2,329,582) (2,855,178) (3,036,359) (2,812,654) (3,284,208) (2,671,126) (2,094,523) (1,984,803) (1,824,741) (1,827,404) (2,046,410) (2,372,457) Cumulative Capital Grants 5,000,000 5,000,000 5,000,000 7,000,000 7,000,000 7,000,000 7,000,000 7,000,000 7,000,000 7,000,000 7,000,000 7,000,000 7,000,000 7,000,000 7,000,000 Net Assets 4,550,000 3,826,275 3,718,863 4,670,418 4,144,822 3,963,641 4,187,346 3,715,792 4,328,874 4,905,477 5,015,197 5,175,259 5,172,596 4,953,590 4,627,543
FISHERY AND ECOSYSTEM INDICATORS**Will be finalized in consultation with State and stakeholders
Attachment A - Financials, Base
Exhibit 1: California Fisheries Fund Business Plan

CALIFORNIA FISHERY FUND
HIGH:
2007 2008 2009 2010 2011 2012 2013 2014 2015 2016 2017 2018 2019 2020 2021 BALANCE SHEET
ASSETSCash 9,505,000 4,956,343 1,565,006 9,034,866 285,426 (5,130,618) (4,407,469) 1,336,678 7,836,253 14,102,596 15,071,693 19,444,397 23,387,753 18,335,808 19,257,199
Fishery Foundation Loans 2,000,000 6,000,000 6,000,000 12,000,000 17,706,824 20,812,295 19,872,000 18,004,068 15,161,041 10,828,153 7,465,923 4,722,674 1,602,943 - - Fishery Foundation Reserves (400,000) (1,200,000) (1,200,000) (2,400,000) (3,541,365) (4,162,459) (3,974,400) (3,600,814) (3,032,208) (2,165,631) (1,493,185) (944,535) (320,589) - -
Net Fishery Foundation Loans 1,600,000 4,800,000 4,800,000 9,600,000 14,165,459 16,649,836 15,897,600 14,403,255 12,128,832 8,662,522 5,972,738 3,778,140 1,282,354 - -
Infrastructure Loans - 1,525,801 4,445,543 4,041,832 8,190,623 11,917,400 13,670,333 12,027,846 10,284,054 8,432,709 6,467,177 4,606,382 3,082,754 1,465,151 425,680 Infrastructure Reserves - (76,290) (222,277) (202,092) (409,531) (595,870) (683,517) (601,392) (514,203) (421,635) (323,359) (230,319) (154,138) (73,258) (21,284)
Net Infrastructure Loans - 1,449,511 4,223,266 3,839,740 7,781,092 11,321,530 12,986,816 11,426,453 9,769,851 8,011,073 6,143,818 4,376,063 2,928,616 1,391,893 404,396
Business Loans - 747,504 2,077,359 1,568,191 3,259,275 4,409,131 4,452,530 2,870,946 1,302,755 285,992 - - - - - Business Reserves - (74,750) (207,736) (156,819) (325,928) (440,913) (445,253) (287,095) (130,276) (28,599) - - - - -
Net Business Loans - 672,754 1,869,623 1,411,372 2,933,348 3,968,218 4,007,277 2,583,852 1,172,480 257,392 - - - - -
Total Gross Loans 2,000,000 6,922,264 10,892,889 14,851,112 24,879,898 31,939,584 32,891,693 28,413,560 23,071,163 16,930,988 12,116,556 8,154,203 4,210,970 1,391,893 404,396 Total Loss Reserves (400,000) (1,351,040) (1,630,013) (2,758,911) (4,276,823) (5,199,242) (5,103,170) (4,489,301) (3,676,686) (2,615,865) (1,816,543) (1,174,854) (474,726) (73,258) (21,284)
Net Total Loans 1,600,000 5,571,224 9,262,876 12,092,202 20,603,075 26,740,342 27,788,523 23,924,259 19,394,477 14,315,123 10,300,012 6,979,349 3,736,244 1,318,636 383,112
Total Assets 11,105,000 10,527,567 10,827,881 21,127,068 20,888,501 21,609,724 23,381,054 25,260,937 27,230,730 28,417,719 25,371,705 26,423,745 27,123,997 19,654,443 19,640,311
LIABILITIES AND NET ASSETSDebt 4,500,000 4,500,000 4,500,000 12,500,000 12,500,000 12,500,000 12,500,000 12,500,000 12,500,000 12,500,000 8,000,000 8,000,000 8,000,000 - -
Beginning Net Assets 6,605,000 6,027,567 6,327,881 8,627,068 8,388,501 9,109,724 10,881,054 12,760,937 14,730,730 15,917,719 17,371,705 18,423,745 19,123,997 19,654,443 Operating Results (395,000) (577,433) 300,314 (700,813) (238,566) 721,223 1,771,330 1,879,883 1,969,793 1,186,989 1,453,986 1,052,040 700,252 530,446 (14,132) Capital Grants 7,000,000 - - 3,000,000 - - - - - - - - - - - Ending Net Assets 6,605,000 6,027,567 6,327,881 8,627,068 8,388,501 9,109,724 10,881,054 12,760,937 14,730,730 15,917,719 17,371,705 18,423,745 19,123,997 19,654,443 19,640,311
Total Liabilities and Net Assets 11,105,000 10,527,567 10,827,881 21,127,068 20,888,501 21,609,724 23,381,054 25,260,937 27,230,730 28,417,719 25,371,705 26,423,745 27,123,997 19,654,443 19,640,311
HIGH SCENARIOFINANCIAL STATEMENTS
Optimum funding for high level of risk tolerance and maximum flexibility of operations, including highest levels of financial acitivity and reform impacts. Results in solvent Fishery Fund with 15 year life and ending positive capital balance.
Attachment A - Financials, High
Exhibit 1: California Fisheries Fund Business Plan

CALIFORNIA FISHERY FUND
HIGH:
2007 2008 2009 2010 2011 2012 2013 2014 2015 2016 2017 2018 2019 2020 2021
HIGH SCENARIOFINANCIAL STATEMENTS
Optimum funding for high level of risk tolerance and maximum flexibility of operations, including highest levels of financial acitivity and reform impacts. Results in solvent Fishery Fund with 15 year life and ending positive capital balance.
INCOME STATEMENT
REVENUESInterest on Loans 50,000 275,674 592,135 850,443 1,302,743 1,872,955 2,139,206 2,010,786 1,665,433 1,274,783 915,788 636,922 388,815 176,511 56,725 Interest on Cash & Investments 140,000 190,100 99,127 31,300 180,697 5,709 (102,612) (88,149) 26,734 156,725 282,052 301,434 388,888 467,755 366,716 Interest Expense (22,500) (45,000) (45,000) (85,000) (125,000) (125,000) (125,000) (125,000) (125,000) (125,000) (102,500) (80,000) (80,000) (40,000) - Net Interest Income 167,500 420,774 646,262 796,743 1,358,440 1,753,663 1,911,593 1,797,637 1,567,166 1,306,508 1,095,340 858,356 697,702 604,266 423,441
Loss Allocation (400,000) (951,040) (278,973) (1,128,898) (1,517,913) (922,419) 96,072 480,293 812,614 302,769 793,602 641,689 463,994 401,469 51,974 Net Financing Income (232,500) (530,266) 367,289 (332,154) (159,472) 831,245 2,007,666 2,277,930 2,379,781 1,609,277 1,888,942 1,500,045 1,161,696 1,005,734 475,415
Loan Fees 20,000 115,058 150,117 60,000 285,175 265,175 150,117 - - - - - - - -
Earned Income (212,500) (415,208) 517,406 (272,154) 125,703 1,096,420 2,157,783 2,277,930 2,379,781 1,609,277 1,888,942 1,500,045 1,161,696 1,005,734 475,415
Grants & ContributionsTotal Revenue (212,500) (415,208) 517,406 (272,154) 125,703 1,096,420 2,157,783 2,277,930 2,379,781 1,609,277 1,888,942 1,500,045 1,161,696 1,005,734 475,415
OPERATING COSTSStart-up Systems Development 25,000 Management Contract 85,000 87,550 90,177 Lending / Portfolio Contract 60,000 61,800 63,654 Evaluation Consultant 50,000 Audit 12,500 12,875 13,261 13,659 14,069 14,491 14,926 15,373 15,835 16,310 16,799 17,303 17,822 18,357 18,907 Spin-off Costs 75,000 Personnel & Benefits 275,000 283,250 291,748 300,500 309,515 318,800 328,364 338,215 348,362 358,813 369,577 380,664 Equipment Expense 15,000 15,450 15,914 16,391 16,883 17,389 17,911 18,448 19,002 19,572 20,159 20,764 Travel 20,000 20,600 21,218 21,855 22,510 23,185 23,881 24,597 25,335 26,095 26,878 27,685 Occupancy & Other 30,000 30,900 31,827 32,782 33,765 34,778 35,822 36,896 38,003 39,143 40,317 41,527 Total Operating Expenses 182,500 162,225 217,092 428,659 364,269 375,197 386,453 398,046 409,988 422,287 434,956 448,005 461,445 475,288 489,547
Operating Results (395,000) (577,433) 300,314 (700,813) (238,566) 721,223 1,771,330 1,879,883 1,969,793 1,186,989 1,453,986 1,052,040 700,252 530,446 (14,132)
Capital Grants 7,000,000 - - 3,000,000 - - - - - - - - - - - Change in Net Assets 6,605,000 (577,433) 300,314 2,299,187 (238,566) 721,223 1,771,330 1,879,883 1,969,793 1,186,989 1,453,986 1,052,040 700,252 530,446 (14,132)
Attachment A - Financials, High
Exhibit 1: California Fisheries Fund Business Plan
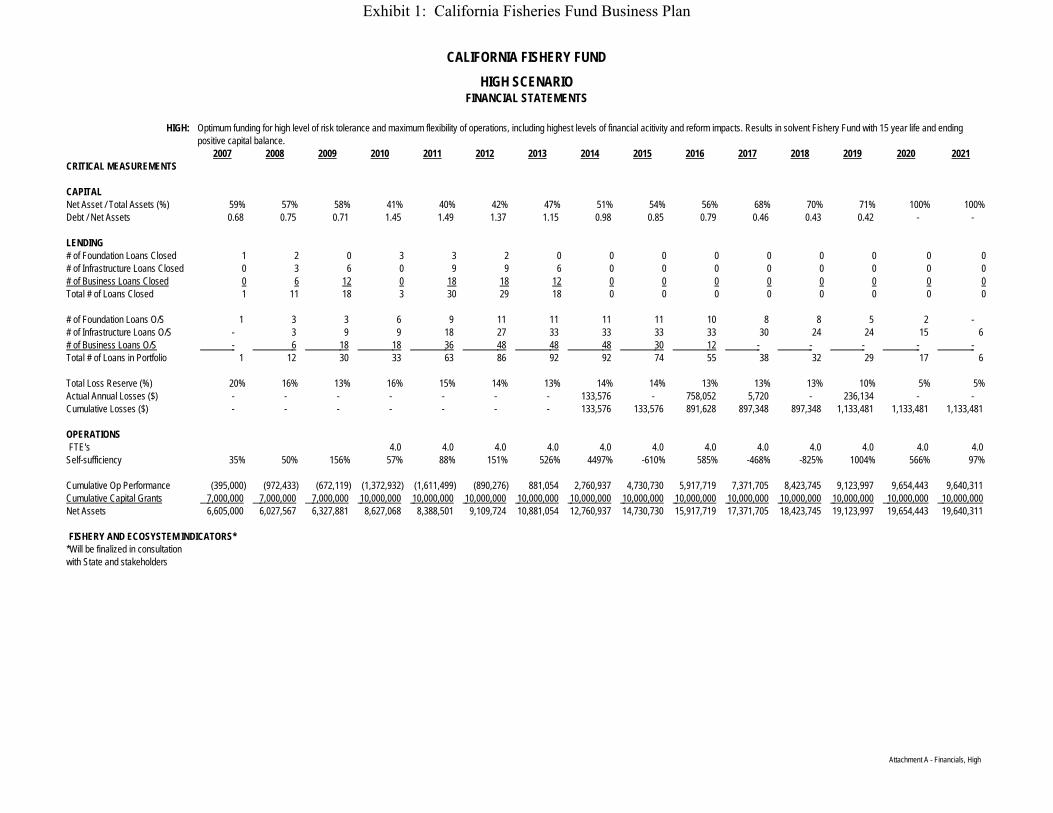
CALIFORNIA FISHERY FUND
HIGH:
2007 2008 2009 2010 2011 2012 2013 2014 2015 2016 2017 2018 2019 2020 2021
HIGH SCENARIOFINANCIAL STATEMENTS
Optimum funding for high level of risk tolerance and maximum flexibility of operations, including highest levels of financial acitivity and reform impacts. Results in solvent Fishery Fund with 15 year life and ending positive capital balance.
CRITICAL MEASUREMENTS
CAPITALNet Asset / Total Assets (%) 59% 57% 58% 41% 40% 42% 47% 51% 54% 56% 68% 70% 71% 100% 100%Debt / Net Assets 0.68 0.75 0.71 1.45 1.49 1.37 1.15 0.98 0.85 0.79 0.46 0.43 0.42 - -
LENDING# of Foundation Loans Closed 1 2 0 3 3 2 0 0 0 0 0 0 0 0 0# of Infrastructure Loans Closed 0 3 6 0 9 9 6 0 0 0 0 0 0 0 0# of Business Loans Closed 0 6 12 0 18 18 12 0 0 0 0 0 0 0 0Total # of Loans Closed 1 11 18 3 30 29 18 0 0 0 0 0 0 0 0
# of Foundation Loans O/S 1 3 3 6 9 11 11 11 11 10 8 8 5 2 - # of Infrastructure Loans O/S - 3 9 9 18 27 33 33 33 33 30 24 24 15 6 # of Business Loans O/S - 6 18 18 36 48 48 48 30 12 - - - - - Total # of Loans in Portfolio 1 12 30 33 63 86 92 92 74 55 38 32 29 17 6
Total Loss Reserve (%) 20% 16% 13% 16% 15% 14% 13% 14% 14% 13% 13% 13% 10% 5% 5%Actual Annual Losses ($) - - - - - - - 133,576 - 758,052 5,720 - 236,134 - - Cumulative Losses ($) - - - - - - - 133,576 133,576 891,628 897,348 897,348 1,133,481 1,133,481 1,133,481
OPERATIONSFTE's 4.0 4.0 4.0 4.0 4.0 4.0 4.0 4.0 4.0 4.0 4.0 4.0
Self-sufficiency 35% 50% 156% 57% 88% 151% 526% 4497% -610% 585% -468% -825% 1004% 566% 97%
Cumulative Op Performance (395,000) (972,433) (672,119) (1,372,932) (1,611,499) (890,276) 881,054 2,760,937 4,730,730 5,917,719 7,371,705 8,423,745 9,123,997 9,654,443 9,640,311 Cumulative Capital Grants 7,000,000 7,000,000 7,000,000 10,000,000 10,000,000 10,000,000 10,000,000 10,000,000 10,000,000 10,000,000 10,000,000 10,000,000 10,000,000 10,000,000 10,000,000 Net Assets 6,605,000 6,027,567 6,327,881 8,627,068 8,388,501 9,109,724 10,881,054 12,760,937 14,730,730 15,917,719 17,371,705 18,423,745 19,123,997 19,654,443 19,640,311
FISHERY AND ECOSYSTEM INDICATORS**Will be finalized in consultation with State and stakeholders
Attachment A - Financials, High
Exhibit 1: California Fisheries Fund Business Plan
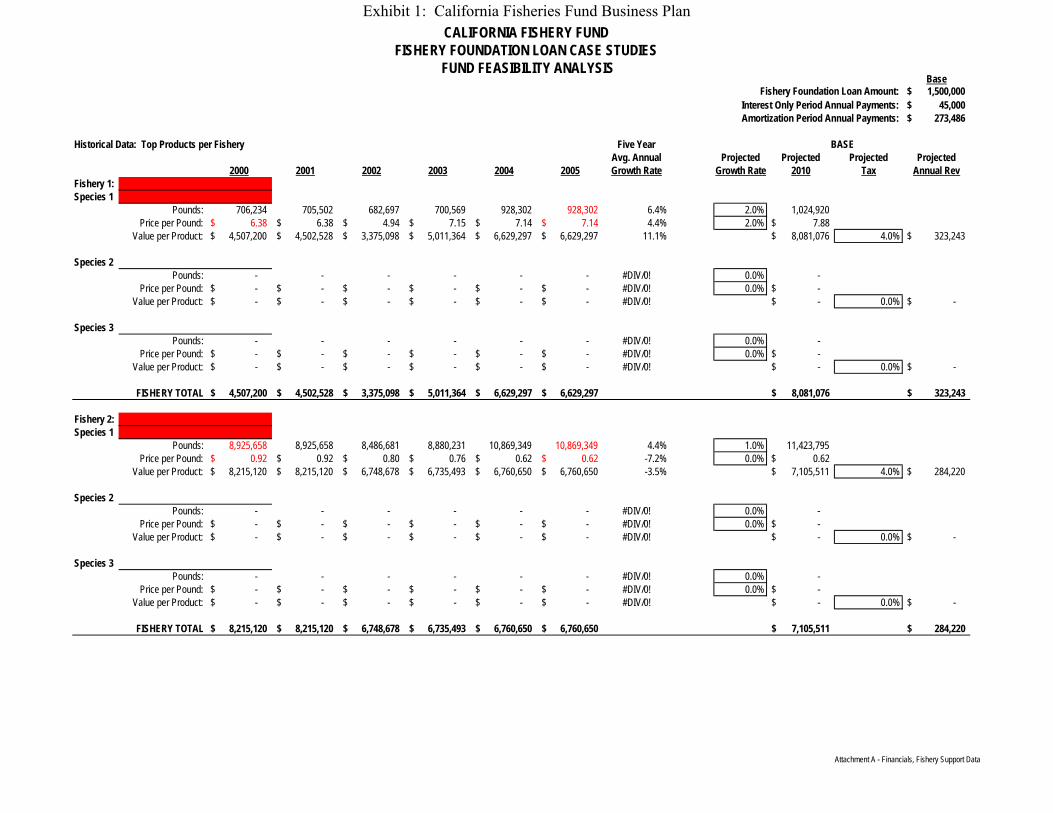
CALIFORNIA FISHERY FUNDFISHERY FOUNDATION LOAN CASE STUDIES
FUND FEASIBILITY ANALYSISBase
Fishery Foundation Loan Amount: 1,500,000$ Interest Only Period Annual Payments: 45,000$ Amortization Period Annual Payments: 273,486$
Historical Data: Top Products per Fishery Five YearAvg. Annual Projected Projected Projected Projected
2000 2001 2002 2003 2004 2005 Growth Rate Growth Rate 2010 Tax Annual RevFishery 1:Species 1
Pounds: 706,234 705,502 682,697 700,569 928,302 928,302 6.4% 2.0% 1,024,920 Price per Pound: 6.38$ 6.38$ 4.94$ 7.15$ 7.14$ 7.14$ 4.4% 2.0% 7.88$
Value per Product: 4,507,200$ 4,502,528$ 3,375,098$ 5,011,364$ 6,629,297$ 6,629,297$ 11.1% 8,081,076$ 4.0% 323,243$
Species 2Pounds: - - - - - - #DIV/0! 0.0% -
Price per Pound: -$ -$ -$ -$ -$ -$ #DIV/0! 0.0% -$ Value per Product: -$ -$ -$ -$ -$ -$ #DIV/0! -$ 0.0% -$
Species 3Pounds: - - - - - - #DIV/0! 0.0% -
Price per Pound: -$ -$ -$ -$ -$ -$ #DIV/0! 0.0% -$ Value per Product: -$ -$ -$ -$ -$ -$ #DIV/0! -$ 0.0% -$
FISHERY TOTAL 4,507,200$ 4,502,528$ 3,375,098$ 5,011,364$ 6,629,297$ 6,629,297$ 8,081,076$ 323,243$
Fishery 2:Species 1
Pounds: 8,925,658 8,925,658 8,486,681 8,880,231 10,869,349 10,869,349 4.4% 1.0% 11,423,795 Price per Pound: 0.92$ 0.92$ 0.80$ 0.76$ 0.62$ 0.62$ -7.2% 0.0% 0.62$
Value per Product: 8,215,120$ 8,215,120$ 6,748,678$ 6,735,493$ 6,760,650$ 6,760,650$ -3.5% 7,105,511$ 4.0% 284,220$
Species 2Pounds: - - - - - - #DIV/0! 0.0% -
Price per Pound: -$ -$ -$ -$ -$ -$ #DIV/0! 0.0% -$ Value per Product: -$ -$ -$ -$ -$ -$ #DIV/0! -$ 0.0% -$
Species 3Pounds: - - - - - - #DIV/0! 0.0% -
Price per Pound: -$ -$ -$ -$ -$ -$ #DIV/0! 0.0% -$ Value per Product: -$ -$ -$ -$ -$ -$ #DIV/0! -$ 0.0% -$
FISHERY TOTAL 8,215,120$ 8,215,120$ 6,748,678$ 6,735,493$ 6,760,650$ 6,760,650$ 7,105,511$ 284,220$
BASE
Attachment A - Financials, Fishery Support Data
Exhibit 1: California Fisheries Fund Business Plan
The California Fisheries Fund Business Framework
39
Appendix B. Risk Management
Exhibit 1: California Fisheries Fund Business Plan

The California Fisheries Fund .
Attachment B. Risk Management and Underwriting 1
ATTACHMENT B Risk Management and Underwriting
An organization’s capacity to accept risk depends on its capacity to manage risk.
Risk management focuses on three areas: (1) the underwriting and approval process; (2)
sustained performance of the portfolio over time; and (3) use of high-level standards for
measuring risk and loss exposure.
The organization selected to provide underwriting and portfolio management
services to the California Fishery Fund will be a certified CDFI in good standing with US
Department of Treasury and have high quality management systems, policies, and
practices. The following provides a brief summary of a high industry standard risk
management system. A final system used by the California Fishery Fund will include
modifications based on desired mission impacts and accepted risk tolerance.
• Underwriting and Review Criteria: A Credit Policy details criteria for loan
review and approval. The policy is enforced by a Risk Manager, with exceptions
granted on a case by case basis by a Credit Committee. Major components of the
underwriting and review criteria are summarized below:
Criteria Description Applications Signed original applications are required and can be submitted
electronically or in hard copy. Assistance is available with completing the standard application package.
Verifications Verifications of incomes, credit history, balance sheets, tax filings and other material claims are made. Discrepancies are cause for explanation.
Credit History Prospective borrowers’ credit histories are verified. Derogatory information is not cause for decline, but it is cause for explanation and, usually, corrections either prior to closing or as a performance condition. The Fund notes but does not use credit scores as a deciding factor in its credit decisions.
Debt Service Coverage Ability to repay, consistent with the forecast financial performance, must be demonstrated. Secondary sources of repayment are considered, but are not required. A Debt Service Credit Ratio of at least 1.05 is required after stabilization and completion of any deferral period.
Collateral Coverage There is no minimum collateral coverage requirement. The Fund looks more to cash flows than collateral in making its credit decisions. Security for loans is required when available.
Exhibit 1: California Fisheries Fund Business Plan
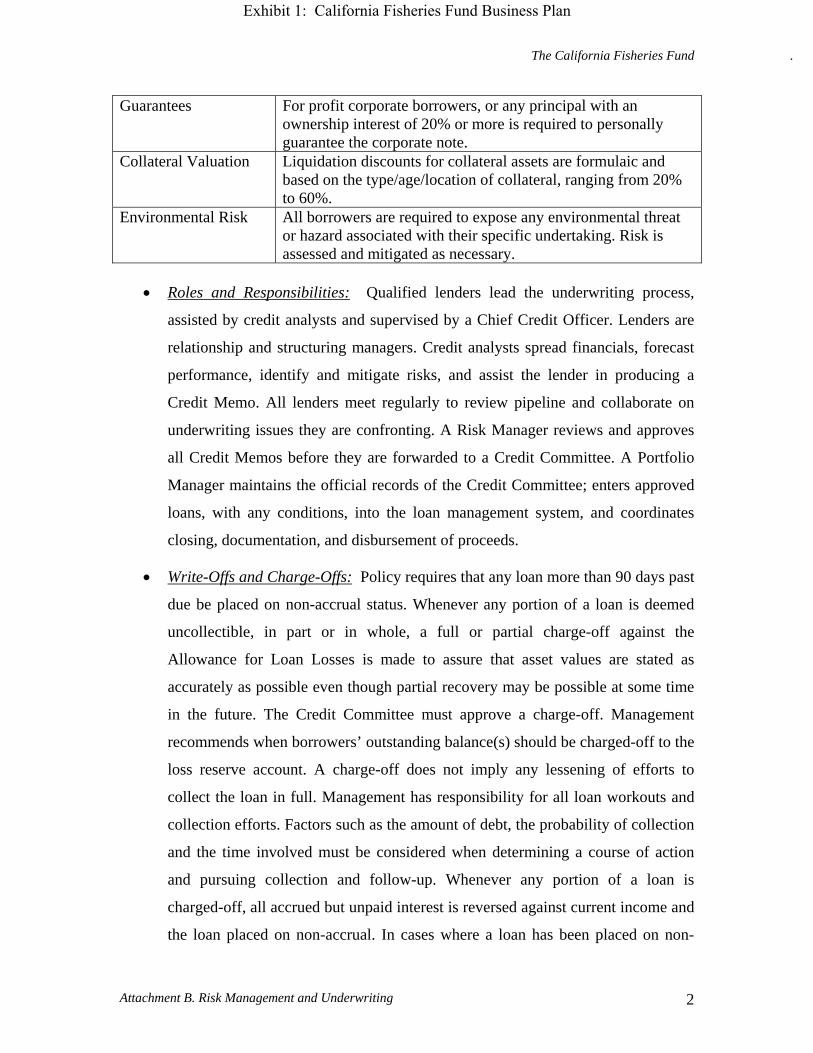
The California Fisheries Fund .
Attachment B. Risk Management and Underwriting 2
Guarantees For profit corporate borrowers, or any principal with an ownership interest of 20% or more is required to personally guarantee the corporate note.
Collateral Valuation Liquidation discounts for collateral assets are formulaic and based on the type/age/location of collateral, ranging from 20% to 60%.
Environmental Risk All borrowers are required to expose any environmental threat or hazard associated with their specific undertaking. Risk is assessed and mitigated as necessary.
• Roles and Responsibilities: Qualified lenders lead the underwriting process,
assisted by credit analysts and supervised by a Chief Credit Officer. Lenders are
relationship and structuring managers. Credit analysts spread financials, forecast
performance, identify and mitigate risks, and assist the lender in producing a
Credit Memo. All lenders meet regularly to review pipeline and collaborate on
underwriting issues they are confronting. A Risk Manager reviews and approves
all Credit Memos before they are forwarded to a Credit Committee. A Portfolio
Manager maintains the official records of the Credit Committee; enters approved
loans, with any conditions, into the loan management system, and coordinates
closing, documentation, and disbursement of proceeds.
• Write-Offs and Charge-Offs: Policy requires that any loan more than 90 days past
due be placed on non-accrual status. Whenever any portion of a loan is deemed
uncollectible, in part or in whole, a full or partial charge-off against the
Allowance for Loan Losses is made to assure that asset values are stated as
accurately as possible even though partial recovery may be possible at some time
in the future. The Credit Committee must approve a charge-off. Management
recommends when borrowers’ outstanding balance(s) should be charged-off to the
loss reserve account. A charge-off does not imply any lessening of efforts to
collect the loan in full. Management has responsibility for all loan workouts and
collection efforts. Factors such as the amount of debt, the probability of collection
and the time involved must be considered when determining a course of action
and pursuing collection and follow-up. Whenever any portion of a loan is
charged-off, all accrued but unpaid interest is reversed against current income and
the loan placed on non-accrual. In cases where a loan has been placed on non-
Exhibit 1: California Fisheries Fund Business Plan

The California Fisheries Fund .
Attachment B. Risk Management and Underwriting 3
accrual and some portion of the principal has been charged-off, any payments
received are applied to principal. In cases where a loan has been placed on non-
accrual but has not been charged-off, payments may be applied first to interest
and the balance, if any, to principal. When a loan is placed on non-accrual any
interest received is recognized on a cash basis.
• Policy Regarding Portfolio Review: The loan portfolio is audited annually for
quality and adherence to policy. Results are reported to the organizations Board of
Directors. Deficiencies are tracked for correction, and reported quarterly to
governing bodies until correction has been completed and documented. In
addition, the Risk Manager reviews the portfolio quarterly for compliance with
policy and borrower covenants, file integrity, and overall risk. If warranted,
specific files are downgraded based on objective assessment consistent with
protocol (see above). On a monthly basis, the Risk Manager produces trended
portfolio quality reports covering: (1) concentrations; (2) risk rating trends; (3)
delinquencies; (4) problem assets and repair status; (5) watch list assets and repair
status; (5) loan loss reserve exposure and adequacy; (6) non-earning assets; and
(6) material non-compliance with loan covenants and conditions. These reports
are delivered to management and the Credit Committee.
• Methodology for Portfolio Review: The methodology for portfolio review is
driven by (1) regulated bank standards; (2) third party annual audits; (3) a
subjective risk rating system designed to define risk; (4) application of the rating
system to the portfolio and its components files on an ongoing and dynamic basis;
and (5) quarterly internal portfolio reviews focused on compliance with policy
and loan terms, file and collateral integrity, and adequacy of file management.
Different levels of review are reported monthly, quarterly and annually to
management and Board. This methodology is deployed to motivate performance
on the part of lenders, analysts, and portfolio management staff.
• Methodology for Risk Rating: A risk rating system is used as a means to
consistently and objectively evaluate the strengths and weakness of credit
applications and portfolio loans. The system is not designed as a methodology for
Exhibit 1: California Fisheries Fund Business Plan

The California Fisheries Fund .
Attachment B. Risk Management and Underwriting 4
approving or denying credit. Other factors such as mission, support services,
character, community benefit and source of funding are considered as part of the
final credit decision. The system serves as a tool to summarize particular strengths
or weaknesses of the borrower or Applicant as determined by the loan officer.
Weaker rated applications and loans are recognized as having a greater credit risk
and therefore are reviewed in light of portfolio performance expectations, current
embedded risk and the adequacy of the loan loss reserve. Each Credit Memo
includes a Risk Rating Summary. Ratings that are particularly weak are fully
discussed in the Credit Memo, including mitigating factors. The Risk Rating
System employs numeric scores (1=high, 7=low) for each of the following risk
categories:
o Operating Margins/Cash Flow;
o Balance Sheet;
o Management and Credit History;
o Collateral and Source of Repayment;
o Industry, Market and Competitive Advantage; and
o Financial Statements and Controls.
Each loan is assigned a numeric grade at closing and monitored quarterly for
upgrades or downgrades, consistent with its score based on performance,
external factors, or events impacting overall risk.
• Reports Required from Borrowers: Monitoring of the loan portfolio is a major
aspect of successful community development lending. The objectives of
monitoring are: (1) Early identification of problems; (2) Maintenance of accurate
records on each customer; (3) Protection against delinquencies on each customer;
(4) Proactive identification of future customer needs; (5) Monitoring and
assessment of community development impact; and (6) Preservation of capital
and reputation. Loan monitoring activities include the following:
Exhibit 1: California Fisheries Fund Business Plan
The California Fisheries Fund .
Attachment B. Risk Management and Underwriting 5
o Meetings with borrowers at regular intervals to review company
performance, future goals, and earnings. These meetings may also include
discussions on broader operational and management issues, as a means of
managing any inherent risks.
o Financial statement review, comparing and analyzing actual performance
to budget. Inability to achieve forecast financial goals is an indication of
future problems, typically resulting in a downgrade to the risk rating.
o Determining if selected performance goals or financial milestones are
being achieved, particularly if additional funding is a condition of these
measurements.
o Monitoring of industry and market conditions affecting key portfolio
segments (wood products, fisheries, select agricultural and food products,
tourism, real estate).
All loan agreements require the borrower to provide interim financial
statements in accordance with the suggested frequency based on the Risk
Grade. All customers and guarantors are required to submit financial
statements and copies of tax returns annually. Basic financial reporting
generally includes the balance sheet, income statement, cash flow statement,
and aging of accounts receivable and payable, while other information may
include:
o Staff changes
o Capital acquisitions, expenditures, and new indebtedness
o Litigation, new liens, or evidence of tax payments
o Violations of loan agreement covenants
o Loans or advances to owners and others, officer compensation
o Job and payroll reports
Exhibit 1: California Fisheries Fund Business Plan

The California Fisheries Fund .
Attachment B. Risk Management and Underwriting 6
Non-financial loan covenants (insurance, taxes, hiring practices, etc.) are
reviewed at least annually. Borrowers experiencing cash flow difficulties are
required to provide proof of quarterly required tax payments (including
FICA). The frequency of customer contact and review of their financials is
driven by the loan risk rating and any conditions placed on the loan, either
through the credit memorandum approval process, terms and conditions letter,
and/or any adjustments made to the credit subsequent to closing.
• Corrective Action and Enforcement: Internal practice should be zero tolerance
for non-compliance with the provisions of loan documentation. Forbearance is
available in the course of normal business but is always documented to ensure the
integrity of the asset. Penalty fees are applied and capitalized in instances of
chronic non-compliance. Work outs and restructuring is not encouraged, but are
available in the interests of maximizing forecast outcome achievements of the
borrower. Enforcement is always a last resort, and usually follows protracted
indifference to the agreements between the parties. When all other avenues are
exhausted, enforcement measures are referred to the Applicant’s General Counsel
for action.
Exhibit 1: California Fisheries Fund Business Plan

The California Fisheries Fund Business Framework
40
Appendix C. Fisheries Fund Discussion Paper – June, 5, 2006
Exhibit 1: California Fisheries Fund Business Plan

Investing in the Future of
California’s Fisheries
“The California Fisheries Fund”
Discussion Paper June 5, 2006
Comments on this discussion document and proposed concept are strongly encouraged. Those interested in providing input should contact Rod Fujita of Environmental Defense at (510) 658-8008 [email protected] or Mike Dickerson of ShoreBank Enterprise at (360) 642-4265 [email protected]
Exhibit 1: California Fisheries Fund Business Plan

The California Fisheries Fund Discussion Paper
2
Table of Contents Background ......................................................................................................................... 3 Needs Assessment............................................................................................................... 4 Concept Development......................................................................................................... 6 Implications for a Solution.................................................................................................. 7 Financial Concept ............................................................................................................. 10 Change .............................................................................................................................. 16 State Policy Implications .................................................................................................. 16 Next Steps ......................................................................................................................... 18
Exhibit 1: California Fisheries Fund Business Plan

The California Fisheries Fund Discussion Paper
3
The goal is to support
transition toward more
stable and profitable
California fisheries.
Background
Many California fisheries are in trouble. Declining revenues and reduced access
to fish populations as a result of increasingly stringent conservation regulations are
hampering fishermen and their businesses. The challenge
facing the state is to address the underlying problems
facing fisheries, not just the symptoms. Because many
observers believe that lack of funding has been a
significant impediment to fisheries reform, the Ocean Protection Council approved a
planning grant for Environmental Defense in September 2005 to investigate how capital
might be used as part of a comprehensive state strategy to improve California fisheries.
Environmental Defense secured the services of ShoreBank Enterprise Pacific, an
established community development financial institution with extensive experience in
nearshore Pacific fisheries, to undertake the assessment, feasibility, and planning effort.
The planning grant is administered by the California Coastal Conservancy. The desire of
the parties involved is to develop a capital investment tool that supports transition
towards more stable and profitable fisheries in California and enhances our public
trust fishery resources. The concept we present here has the potential to achieve this
goal, as well as help fulfill the mandates of the Marine Life Management Act and Marine
Life Protection Act.
This work involves two phases: 1) Needs Assessment and Concept Development;
and 2) Business Plan Development. This document represents work being performed
during Phase One. Phase Two work will commence after securing broad-based input into
the concepts presented in this document. During Phase One, assessment interviews were
held with seafood and fishing industry leaders and academic experts in San Diego, La
Jolla, Santa Barbara, Avila Beach, Morro Bay, Monterey, San Francisco, Half Moon Bay,
Bolinas, and Bodega Bay. Specifically, we met with fishermen, processors, industry
associations, agencies, university professors, community leaders, and non-profit
institutions. A standardized set of interview questions was used to ensure consistency in
information collection. Additionally, numerous documents relevant to California fisheries
and policy were reviewed.
Exhibit 1: California Fisheries Fund Business Plan

The California Fisheries Fund Discussion Paper
4
Investment and innovation
require predictable and stable
access to fisheries.
The overall purpose was to assess the need for various types of capital and more
generally, to assess opinions on the priority needs of specific California fisheries.
Future interviews are scheduled to be conducted in other coastal communities, including
the Northern California communities of Fort Bragg, Arcata, Eureka, and Crescent City.
Follow-up meetings will also be scheduled to secure ongoing feedback as this work
proceeds. We encourage anyone interested in providing input into this process to contact
the project principals.
Individuals interviewed to date are being asked to review and comment on these
draft findings and initial concept. It is anticipated that as this process proceeds, specific
elements included in this document will be modified to reflect input received. The project
principals would also like to acknowledge and thank all of those who have provided
valuable insight and given freely of their time and ideas.
Needs Assessment
Our initial needs assessment has revealed that there is broad agreement on the
need for fishery governance reform that can stabilize regulations and create a regulatory
environment conducive to investment, innovation, and conservation. The majority of
individuals interviewed identified instability in management and the failure to tailor
regulations and stock assessments to local conditions as the most pressing issues they
face. Motivating investment and innovation requires confidence in predictable and
stable access to fisheries over the mid- and long-terms.
In many instances, current management approaches do not deliver predictability,
stability, or confidence. In this operating environment, traditional “lending” and loan
products targeting fishermen, seafood companies,
and coastal communities will meet with limited
demand and result in little benefit to California
fishing families, their communities, fish populations, or ocean ecosystems. Specialized
interventions, highly targeted and customized to prevailing local conditions, will be
required.
The needs assessment led to several other key findings:
Exhibit 1: California Fisheries Fund Business Plan

The California Fisheries Fund Discussion Paper
5
Coastal communities are at
risk of losing vibrant working
waterfronts and the cultural
heritage of fishing.
• Fisheries are in a state of flux and reform is needed. In many ways, our
current management structures make capital investment, innovation, and
stewardship “irrational behavior.”
• Overall, fishery landings plummeted from billions of pounds to millions of
pounds in the last thirty years (the peak was 1.3 billion pounds in 1976,
dropping to 650 million pounds in 2000 – a 50% decrease). The economic
performance of California’s fisheries has also declined. From 1990 to 2000,
employment in the fishery sector dropped 11%, wages fell 20%, and the
contribution of fisheries to the Gross State Product dropped by 28% - adding
up to a loss of over $160 million.
• Fisheries reform has been impeded by lack of resources. Policies such as the
Marine Life Management Act and the State’s Restricted Access Policy are
under-funded and not supported with sufficient science, political will, or
information on biological, social, and economic impacts of reform options.
The lack of a strong State commitment to reform that will lead to more secure
access to fisheries, coupled with ongoing confusion and suspicion of such
reforms within the industry and among diverse stakeholders, has led to lack
of consensus and impetus for reform.
• Numerous types of management reform show promise, but none are perfect –
one size does not fit all – requiring that
specific management reform measures
must be tailored to fit each fishery, each
region, and/or each fishing community.
• In addition to regulatory issues, many of California’s fisheries face additional
pressures including consolidations of the product value chain (vertical
integration of the seafood processing industry), commodity pricing (low
prices resulting from supply gluts), changing market forces, and an escalating
media focus on various issues (e.g. environment, food safety, etc).
Exhibit 1: California Fisheries Fund Business Plan

The California Fisheries Fund Discussion Paper
6
• Failure to overcome the mistrust, aggression, and antagonism associated with
many fisheries debates will eliminate chances for any long-term success.
Concept Development
To address these issues, we recommend designing a fund to capitalize change that
is targeted, relevant, and responsive to local variations. We offer an analogy of how
capital can be used to change a “value proposition” that is based on our own experiences.
The work of ShoreBank over the past 30 years has focused on troubled urban
communities which some people call “ghettos.” As an organization that uses capital as a
change agent, ShoreBank is well acquainted with how people behave when it comes to
investing. Landlords in poor communities rely on operating income (rents) for return on
investment; they minimize investment in their property, and hold operating costs down,
to get their money back out as quickly as possible because they lack confidence in
market conditions. The “value proposition” is current cash flow and not resale of the
property for more than they paid. Properties are often abandoned when their potential for
current income without capital investment is exhausted. The result is persistent decline in
housing conditions, community well-being, and confidence in the future.
ShoreBank has helped to finance change in its urban markets by incrementally
shifting the mindset of landlords from near term income to longer term assets by
financing major improvements to old, dilapidated apartments with loan products
customized to the market conditions of specific communities. By targeting its diverse (for
profit and not for profit) investments to specific areas of its target neighborhoods, and by
making multiple investments and efforts in the same communities, ShoreBank has
succeeded in shifting the “value proposition” toward appreciation in real estate value and
away from near term profits. This reverses the cycle of decline that has doomed many
American inner cities, and now nearby suburbs, to the pejorative status of “ghetto.”
California fishermen, fishing families and fishing communities, largely as a result of
current management systems and market pressures, are in a downward cycle of “ghetto”
economics.
Exhibit 1: California Fisheries Fund Business Plan

The California Fisheries Fund Discussion Paper
7
Bold steps and cooperative
approaches are required to improve
both the conservation and financial
performance of our fisheries.
In the context of this analogy, we have concluded that most fishermen are
behaving rationally given the existing economic incentives that they face -- lack of
predictability in the current regulatory regime and lack of assured access to future
harvests conspire to make anything but a near term perspective irrational. A focus on
cash flows, driven by a race to maximize and accelerate catch within a context of
increasingly stringent conservation regulations, fuel a cycle of disinvestment supported
by regulatory practice.
It was the federal Community Reinvestment Act that delivered the regulatory
reforms necessary to begin to shift the cycle of “ghetto” economics. Adopted by
Congress in 1977, the Community Reinvestment Act is intended to encourage banks to
meet the credit needs of the communities in which they operate, including low- and
moderate-income neighborhoods. It further requires that each bank’s record in helping
meet the credit needs of its entire community be evaluated and made public.
Our assignment has been to recommend ways that capital investment can drive
improved economic and ocean ecosystem health in the California fisheries sector.
Because the California fisheries "value proposition" is based on maintaining cash flow,
rather than on the building of assets, we have concluded that there is scant opportunity for
traditional debt instruments alone to achieve these goals.
Regulatory reform that provides
more secure access to fisheries for
communities, cooperatives, or individuals
will be necessary to deliver the appreciable
assets and confidence in the future that will be essential for improving California’s
fisheries. It is also regulatory reform that can offer an alternative to the outdated and
unnecessary economy versus the environment paradigm by offering solutions for
improving both conservation and financial performance. Capital can play an important
role in creating these necessary regulatory reforms.
Implications for a Solution
Our assessment indicates a need to develop a regulatory environment conducive
to innovation, investment, and improvement of the conservation and financial
Exhibit 1: California Fisheries Fund Business Plan

The California Fisheries Fund Discussion Paper
8
Improving profitability,
protecting the environment, and
providing community benefit
can work together.
performance of California fisheries. The assessment suggests that use of a traditional
revolving loan fund concept (debt financing to existing businesses) would not be
responsive to the priority needs of many California fisheries. The project principals
believe a more sophisticated funding concept – one that capitalizes reform and shares in
the risk of change – is required to make the best use of capital investment to improve the
financial performance of California fisheries AND the health of ocean ecosystems.
Achieving reform will require more than establishing an investment fund alone.
We would emphasize that establishment of the investment fund will not replace the need
for ongoing grant support from various sources to fisheries and communities. In many
communities, grants may be needed to improve
the local capacity for undertaking regulatory
reform and establishing a good climate for
successful investment.
Implications for establishing an investment fund include:
• Pursue Rational Approaches to Reform: Focus must be on identifying
management models that deliver the stability and predictability (e.g.
confidence) that make capital investment, innovation, adding value, and
stewardship “rational behavior.” Many fisheries around the world (including
some in the U.S.) have been reformed successfully, resulting in reduced
costs, increased value, and improved financial and conservation performance.
Exploration of opportunities for demonstrating management reform will
place an emphasis on cooperation, maximizing flexibility, and aligning
incentives with desired social, economic, and environmental goals.
• Create Stability and Predictability: Any attempt to support the fishing
industry – with the aim of preserving working waterfronts and retaining the
fishing heritage of coastal communities – must include stability and
predictability of the regulatory environment as part of the value proposition
and outcome.
Exhibit 1: California Fisheries Fund Business Plan

The California Fisheries Fund Discussion Paper
9
The pathway to change must
be paved with affirmative
acknowledgement of the
importance of localized
involvement in stewardship
and management.
• Support Research: Research needs to be better funded, targeted, and carried
out in a more participatory and pertinent fashion. Lack of essential fishery
information has been an important obstacle to improved access to the
nearshore fishery (due to the catch-control rule of the Nearshore Fishery
Management Plan) and will limit the transition from precautionary to
knowledge-based fishery management generally. Both basic and applied
science must be integrated to support fisheries management. Management
reforms should be designed to create incentives for stewardship – and the
financial capacity for the fishing industry to fund stewardship – including
investment in relevant monitoring and research programs.
• Share the Financial Risk: Sharing the financial risks of change with
fishermen and communities willing to undertake transition will be required.
A California Fisheries Fund will likely initially include investment terms not
generally associated with “debt” like: (1) shared risk; (2) longer recovery
periods than are typical of conventional investments; and (3) subsidy to allow
for below market rate returns. Investing in change, such as is being proposed,
will require that risk sharing must be directly tied to the degree of success or
failure of reform measures and to ocean productivity.
• Support Innovation: An approach that combines the support of fisheries
science with management reform, and then supports the business innovations
that “bloom” as a result of reform, will achieve longer-term impacts and have
greater appeal to a broader set of stakeholders and resources.
• Build Political Will: Successful implementation will require a commitment
from the State to reform fisheries governance with the aim of creating
economic incentives for stewardship and adding value to fishery landings
as a complement to local participation.
• Avoid the “Us versus Them” Debate:
Improving profitability, maximizing
value, providing community and social
Exhibit 1: California Fisheries Fund Business Plan

The California Fisheries Fund Discussion Paper
10
Initial targets for demonstrating
reform models must include
strong, open-minded and
committed leadership
benefits, and protecting our fisheries resources and ocean ecosystems are not
mutually exclusive.
• Design Localized Solutions: A monolithic state-wide solution is not
appropriate. Success will come through marshalling resources and efforts in
various targeted regional approaches, finding and cultivating results-driven
and solution-oriented individuals, and then providing them with relevant
information and tools from which to build.
• Target for Success: Initial focus on certain state regulated fisheries where
successful reform is likely in order to provide effective opportunities for
collaboration and demonstration.
• Demonstrate then Replicate: Given regional variations, a meaningful
demonstration(s) of how capital can assist in transitioning management and
unify historically competing interests is required. Basic principles can then
be used to create replicable models for other fisheries and/or communities.
• Generate Measurable Impacts:
Increasing opportunity for securing
private resources and long-term
financial support at a significant
enough scale to achieve meaningful improvement of California’s fisheries
will require a focused effort. This effort must be able to demonstrate tangible
and measurable benefits for local economic well-being, safety, marine
resources, and ocean ecosystems.
• Create Leverage: Shrinking government monies for research and
management require development of an approach that can leverage private
resources to support transition efforts.
Financial Concept
At the core of any successful response to the decline of California fisheries is the
need to challenge some fundamental assumptions of current fisheries management and
examine the social and economic incentives that various kinds of management models
Exhibit 1: California Fisheries Fund Business Plan

The California Fisheries Fund Discussion Paper
11
Cultivating leadership,
innovation and investment will
maximize the probability of
success and replication.
create. Successful management will realign these incentives to support healthier
fisheries, communities, and ocean ecosystems. This will require a constructive dialogue
about elements of reform between the Ocean Protection Council, fisheries management
agencies, and all other stakeholders.
The four cornerstones of a foundation for a meaningful response will include:
• Localized Design: Regulatory reform that results in secure privileges for
communities, cooperatives, or individual fishermen to catch fish. The specific
management model must be sensitive to and work in concert with the unique
social, economic, and biological features of each fishery or region. These secure
privileges will lay the groundwork for stability and predictability, and act as a
source of investor/investee confidence over longer terms.
• Focus on Assets: Shifting our collective mindset from an “income” approach (e.g.
focused on cash-flow) to an “asset accumulation” approach (e.g. focused on
building net worth through asset accumulation, including fish available for
harvest) that captures and releases
entrepreneurial energy, while at the same
time ensuring the health of our ocean
assets.
• Self-Interest: Linking the value of business assets directly to the “environmental
performance” of the resource – resulting in rational economic self-interest in
maintaining sound stewardship and management.
• Stewardship Services: Viewing science and management as costs of doing
business – “stewardship services” – and establishing mechanisms for internally
financing these services specific to individual fisheries or geographic areas.
Design of the Fisheries Fund
While additional work will be required to develop the specific operational design
of the fund and assess its feasibility, the project principals believe that the following
Exhibit 1: California Fisheries Fund Business Plan
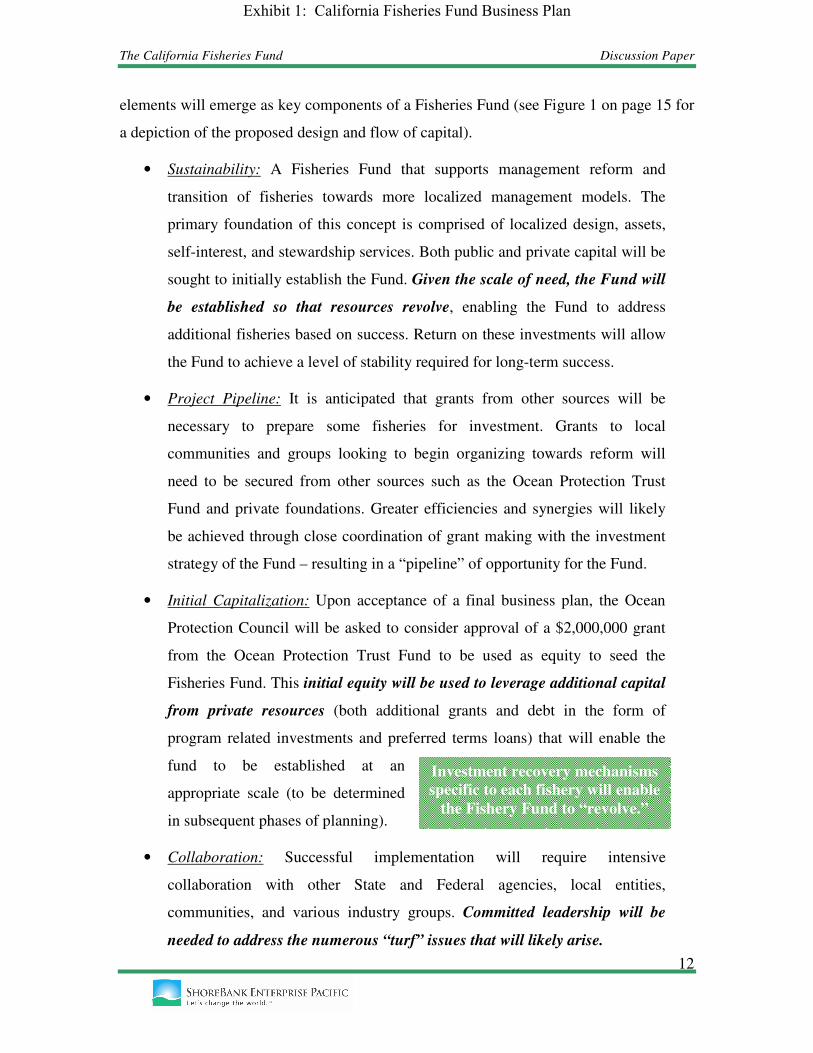
The California Fisheries Fund Discussion Paper
12
Investment recovery mechanisms
specific to each fishery will enable
the Fishery Fund to “revolve.”
elements will emerge as key components of a Fisheries Fund (see Figure 1 on page 15 for
a depiction of the proposed design and flow of capital).
• Sustainability: A Fisheries Fund that supports management reform and
transition of fisheries towards more localized management models. The
primary foundation of this concept is comprised of localized design, assets,
self-interest, and stewardship services. Both public and private capital will be
sought to initially establish the Fund. Given the scale of need, the Fund will
be established so that resources revolve, enabling the Fund to address
additional fisheries based on success. Return on these investments will allow
the Fund to achieve a level of stability required for long-term success.
• Project Pipeline: It is anticipated that grants from other sources will be
necessary to prepare some fisheries for investment. Grants to local
communities and groups looking to begin organizing towards reform will
need to be secured from other sources such as the Ocean Protection Trust
Fund and private foundations. Greater efficiencies and synergies will likely
be achieved through close coordination of grant making with the investment
strategy of the Fund – resulting in a “pipeline” of opportunity for the Fund.
• Initial Capitalization: Upon acceptance of a final business plan, the Ocean
Protection Council will be asked to consider approval of a $2,000,000 grant
from the Ocean Protection Trust Fund to be used as equity to seed the
Fisheries Fund. This initial equity will be used to leverage additional capital
from private resources (both additional grants and debt in the form of
program related investments and preferred terms loans) that will enable the
fund to be established at an
appropriate scale (to be determined
in subsequent phases of planning).
• Collaboration: Successful implementation will require intensive
collaboration with other State and Federal agencies, local entities,
communities, and various industry groups. Committed leadership will be
needed to address the numerous “turf” issues that will likely arise.
Exhibit 1: California Fisheries Fund Business Plan

The California Fisheries Fund Discussion Paper
13
The Stewardship Management
Pools will be governed to ensure
protection of the public trust
and equitable distribution of
access to the resource.
• Demonstration: Criteria will be established to identify not more than two or
three fisheries to initially work with appropriate agencies to develop
management reform strategies. These fisheries will have initial access to
resources from the Fund. Based on lessons learned and successful
demonstration, a process for reforming additional fisheries will be
implemented.
• Capitalized Science and Management: Fishermen will use capital from the
Fisheries Fund to secure the reform of specific fisheries to improve
stewardship, profits, and investment climate. The proceeds of these
investments will be used to capitalize change through the establishment of
Stewardship Management Pools specific to each fishery. These investments
will “kick start” the ability of fisheries to initiate the necessary scientific
programs (e.g. collection of essential fishery information) and management
reform steps (e.g. organizing and planning appropriate reform measures).
Each fishery and Stewardship
Management Pool will have a mechanism
for self-financing to cover the on-going
costs of proactive management and
ensuring healthy stocks and habitat.
• Investment Recovery: Mechanisms appropriate for each fishery will be
developed that allow for recovery of the initial investment from the Fisheries
Fund and subsequently provide ongoing support for the associated
Stewardship Management Pool. It is anticipated these investment recovery
mechanisms will vary by fishery based on current fishery status, reasonable
return windows, and the confidence of all parties in the positive impacts of
management reform (i.e. customized terms specific to needs of each fishery).
Most important, risks will be shared with fishermen, codified in negotiated
terms guiding investment recovery (e.g., investment recovery will be tied to
the extent to which regulatory reform is achieved and to the response of fish
populations to natural conditions and management measures).
Exhibit 1: California Fisheries Fund Business Plan
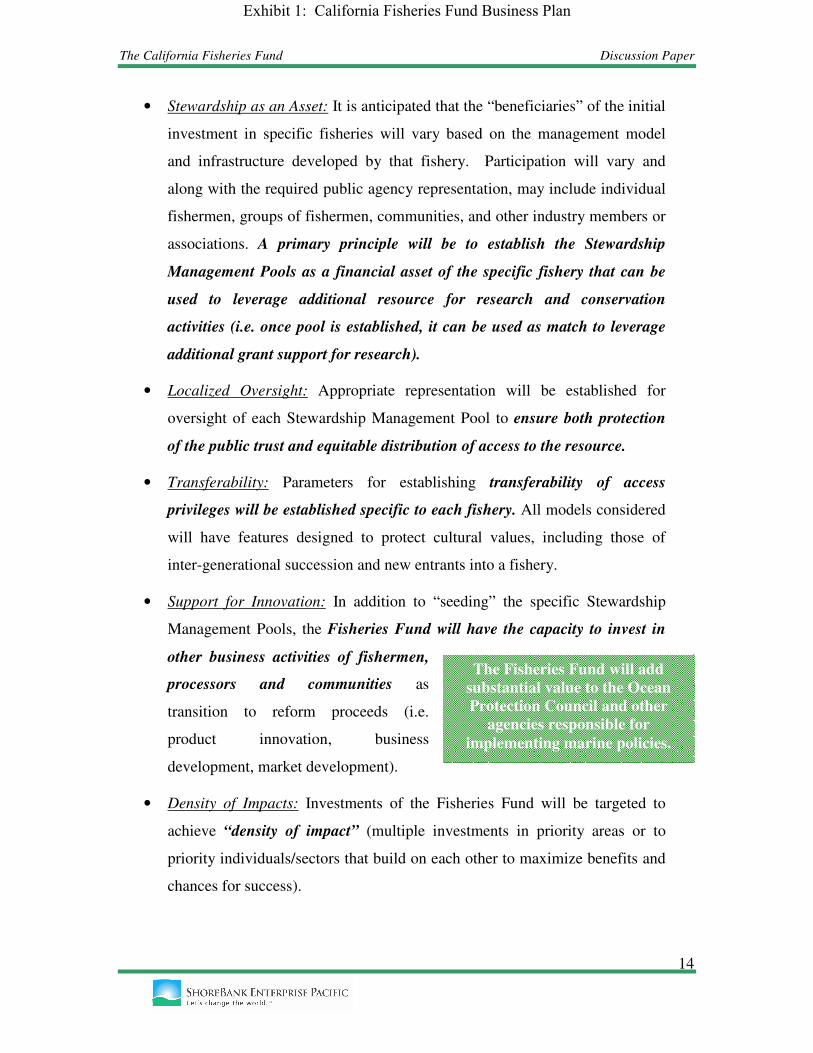
The California Fisheries Fund Discussion Paper
14
The Fisheries Fund will add
substantial value to the Ocean
Protection Council and other
agencies responsible for
implementing marine policies.
• Stewardship as an Asset: It is anticipated that the “beneficiaries” of the initial
investment in specific fisheries will vary based on the management model
and infrastructure developed by that fishery. Participation will vary and
along with the required public agency representation, may include individual
fishermen, groups of fishermen, communities, and other industry members or
associations. A primary principle will be to establish the Stewardship
Management Pools as a financial asset of the specific fishery that can be
used to leverage additional resource for research and conservation
activities (i.e. once pool is established, it can be used as match to leverage
additional grant support for research).
• Localized Oversight: Appropriate representation will be established for
oversight of each Stewardship Management Pool to ensure both protection
of the public trust and equitable distribution of access to the resource.
• Transferability: Parameters for establishing transferability of access
privileges will be established specific to each fishery. All models considered
will have features designed to protect cultural values, including those of
inter-generational succession and new entrants into a fishery.
• Support for Innovation: In addition to “seeding” the specific Stewardship
Management Pools, the Fisheries Fund will have the capacity to invest in
other business activities of fishermen,
processors and communities as
transition to reform proceeds (i.e.
product innovation, business
development, market development).
• Density of Impacts: Investments of the Fisheries Fund will be targeted to
achieve “density of impact” (multiple investments in priority areas or to
priority individuals/sectors that build on each other to maximize benefits and
chances for success).
Exhibit 1: California Fisheries Fund Business Plan

The California Fisheries Fund Discussion Paper
15
Figure 1 THE CALIFORNIA FISHERIES FUND
FLOW OF CAPITAL
Other Resources
Research & Management
Sources of Capital - State money invested into the California Fisheries Fund as a grant and used to leverage additional private grants and program related investments (PRI’s) to capitalize the fund at the appropriate level. The Fund will be designed as a “revolving fund.” The result will be a corpus of money that supports transition of fisheries by capitalizing reform, local stewardship and ongoing business innovation.
Uses of Capital – Demonstration fisheries are identified to work with agencies and initiate process for organizing and planning reform. Based on local management and organizing model determined – regarding access, privileges, and value – the Fisheries Fund will invest in individuals or cooperatives who in turn receive a determined “share” of the fishery.
Recovery of Capital – Recovered investments on shared risk terms are realized from investees (cooperatives and/or individuals) and revolved back into Fisheries Fund. Investments made into individual businesses for innovation and growth will also be recovered based on terms established when investment is made.
Reuse of Capital – As capital is recovered, funds will be reused to invest in additional fisheries and fishing businesses. Initial PRI investors in the fund will be repaid based on the established terms of their investment.
Public $ Private $
Fisheries Fund $$ F
Fisheries Fund $$ F
Fisherman, Coop or Co-management entity F
Transfer Proceeds – The proceeds of the exchange (the investment amount, minus Fund costs), are directed to a Stewardship Pool dedicated to the target fishery and used to leverage additional financial support for research, fisheries management, and best available science. Control of use of the Fund is shared with those individuals or cooperatives participating in the fishery.
Investment Proceeds F
Steward-ship Pool F
Fisherman, Coop, or Co-management entity F
Fisheries Fund $$ F
Return to Top and Expand to More Fisheries
Exhibit 1: California Fisheries Fund Business Plan

The California Fisheries Fund Discussion Paper
16
Change
While specific outcomes and impacts will be identified and established as part of
the business planning process, it is anticipated that the following changes could result
from implementation of the Fisheries Fund.
Current
“Cash-flow Model”
Vision
“Asset Building Model”
No secure share of catch Secure access privileges to cooperatives, co-management entities or individuals.
Attempt to maximize one’s share of catch
Attempt to maximize value of catch
Excess inputs into business Plan business around share, reduce inputs
Shrinking season
Season expands
Supply gluts, low prices More stable market, higher prices
No stewardship incentive
Stewardship incentive
Conservation often perceived as threat to livelihood
Conservation perceived as adding value to asset
Burden of financial risk of change carried by fishermen
Burden of financial risk of change shared with Fund
State Policy Implications
The Fisheries Fund has the potential to be an important tool for achieving the
mandates and goals of California’s Marine Life Management Act, Marine Life Protection
Act, and the Ocean Protection Council.
Marine Life Management Act implementation will benefit from the
capitalization of stewardship activities such as the gathering of essential fishery
information, preparation of stock assessments, and the implementation of fishery
management models at the regional and local levels.
Exhibit 1: California Fisheries Fund Business Plan
The California Fisheries Fund Discussion Paper
17
The Fisheries Fund will
establish a platform for
collaborative research and
information gathering.
These activities will result in a more stable regulatory environment and more
secure access to fish. In the case of essential fishery information that moves fisheries
from data-poor to data-moderate and data-rich conditions, it will inspire confidence in
fishery managers, fishermen, and the seafood industry and may increase access to fish if
justified by credible scientific analysis. Successful implementation of the Fisheries Fund
will also sustain management reforms and conservation actions by providing opportunity
for expanded economic benefits through investing in value-added seafood products (i.e.
certified sustainable) and the creation of new distribution channels and markets for such
products.
Marine Life Protection Act implementation will also benefit. The same
management model reforms that will improve the regulatory environment and create
an environment favorable for investment will also create strong incentives for
continued stewardship. Research indicates that fishermen operating within many such
management models support Marine Protected
Areas if they are devised in the context of
localized management decisions and targeted
science.
The Fisheries Fund will also help the Ocean Protection Council demonstrate
the application of Ecosystem-Based Management principles. One of the principle tenets
of Ecosystem-Based Management is to base decisions on good information and to use
adaptive management (i.e. to base management on learning). The Stewardship
Management Pools established with capital from the Fisheries Fund will serve as a
community asset and support localized research, fishery organization, and reform
measures. Lack of targeted on-going research specific to individual fisheries or areas
remains a large impediment to fishery reform. Increased fishery research is needed to
complement the increasing amount of Marine Protected Area research in California
waters.
The Stewardship Management Pools will allow more fishery scientists and
fishermen to become engaged in monitoring through collaborative research arrangements,
stimulating the collection of essential fishery information – some of which overlaps with
Exhibit 1: California Fisheries Fund Business Plan
The California Fisheries Fund Discussion Paper
18
Establish initial fund
parameters and seek
approval of draft concept
from the Ocean
Protection Council.
Marine Protected Area monitoring programs and some of which is unique to fishery
monitoring. Essential fishery information is the basis for adaptive management of
fisheries.
The Fisheries Fund will also make use of another Ecosystem-Based Management
principle: addressing the human dimensions of fisheries management. By investing in
people, communities, product and market development, and fisheries governance reform,
the Fisheries Fund will aim to align economic and social incentives with conservation
and sustainability, thus providing financial incentives for fishermen as “stewards” and
improving the prospects for preserving the fishing culture of coastal communities by
generating more revenues and investments.
Next Steps
These findings and draft concept establishing the initial parameters for pursuing
development of a Fisheries Fund will be presented to the Ocean Protection Council. If it
meets with their approval, the project principals will
undertake additional feasibility work and begin
preparation of a business plan for implementation and
operation of the fund. It is expected that the business plan
will be completed and presented to the Ocean Protection
Council by September 2006.
The following is a summary of expected activities and projected timeline:
• Establish Initial Broad Objectives and Impacts (June 2006): Continue to
secure input from all interested parties. Confirm the elements of the concept
paper and ensure all involved parties are in basic agreement.
• Research, Reconnaissance, and Analysis (June-July 2006): Continue
collection and analysis of available relevant information specific to California
fisheries (effort, landings, value, markets, infrastructure, etc). Continue
discussions with key players, including: State, Ports, and other relevant local
agencies; Industry (advocacy groups, fisherman, processors, off-loaders,
markets); Recreational fishery groups; environmental groups and relevant
Exhibit 1: California Fisheries Fund Business Plan

The California Fisheries Fund Discussion Paper
19
Assessment and planning
throughout summer 2006,
deliver final business plan to
the Ocean Protection
Council by September 2006.
science-based institutions; California based Community Development
Financial Institutions; and other interests. The purpose of these activities is to
define strategic opportunities that will inform the business planning process
going forward.
• Refine Objectives (July 2006): Upon
completing reconnaissance, refine initial
objectives and land on specific targets and
desired impacts. Reconnect with key
parties and secure consensus for moving forward.
• Model (July-August 2006): Develop model that will best meet proposed
objectives. Include: Structure; Governance; Management; Operations:
Products; Expected Portfolio Profile; Financial Projections; Risk Analysis;
Capitalization Strategy; and Timeline.
• Final Business Plan (September 2006): Present final business plan to Ocean
Protection Council at September 2006 meeting.
Exhibit 1: California Fisheries Fund Business Plan

The California Fisheries Fund Business Framework
41
Appendix D. Reform Examples
Exhibit 1: California Fisheries Fund Business Plan

The California Fisheries Fund
Attachment D. Reform Examples 1
ATTACHMENT D – REFORM EXAMPLES A Review of the Conservation and Economic Impacts of Fisheries Governance Reform STATUS OF FISHERIES MANAGEMENT TODAY
Fisheries are usually managed as common property, open-access resources,
making them vulnerable to the “tragedy of the commons” as described by Garrett Hardin
(8). Common property is property held collectively by a group of people. In the case of
domestic fish populations, this group of common rights holders is typically an entire
nation; when fish populations occur outside national exclusive economic zones, the entire
human population is the property holder. The common property arrangement creates
competition between fishermen for the available catch, which is limited by nature;
because individual shares of the catch are not specified, many fishermen compete to
maximize their catch. Under this system, individual fishermen have incentives to catch
as much as possible before other fishermen have decimated the populations. To do so,
fishermen invest in excessive fishing capital, such as bigger and faster boats, and adjust
their fishing practices in socially detrimental ways for example, by fishing under
dangerous ocean conditions. Powerful fishing fleets, advanced fish-finding technology,
and gear capable of catching large numbers of fish (and damaging ocean habitats) are all
logical outcomes of competition for fish in a commons. Additionally, new entrants will
seek access to the fishery and expansion of the fishery will occur as long as it is
individually profitable (or at least perceived as such). These incentives remain until the
populations of fish have been reduced to the level where all profits have disappeared and
economic rents1 are completely dissipated.
The situation described above is referred to as the “race for fish”. While the “race
for fish” often creates severe economic, biological, and safety problems, traditional
fisheries management has generally failed to address this problem. In fact, one of the
most common management methods, the imposition of a total allowable catch (TAC),
1 Defined as the difference between the price and production cost of the good. For a natural resource, like fisheries, this is often referred to as resource rent or the productive value of the natural resource (long-run profits earned when the property owner limits inputs to an economically efficient level).
Exhibit 1: California Fisheries Fund Business Plan

The California Fisheries Fund
Attachment D. Reform Examples 2
only exacerbates the economic problem. Faced with an overall catch limit (TAC), the
incentive of individual fishermen to fish as fast as possible before the TAC is reached is
significantly increased. Therefore, the fishery proceeds even more quickly and more
wastefully. The results are economically inefficient fisheries in which there is too much
capital and effort, deployed over seasons that are artificially shortened, catching fish that
are not as valuable, sometimes damaging habitats, and often inadvertently taking
seabirds, mammals, small fish, and non-targeted species as unintended victims of this
race. Economic distress in turn tends to exacerbate conservation problems, because
conservation measures such as marine reserves, bycatch controls, and catch reductions
are perceived as threats to livelihood rather than as investments in the future. The race
for fish is thus responsible for not only many of the environmental problems plaguing the
worlds' oceans, but also for the fact that living ocean resources are not generating any net
economic surplus, and actually result in a net economic loss. This impoverishes
fishermen, as well as the environment.
Analysis shows just how economically inefficient world capture fisheries are, and
roughly what the benefits of ending the “race to fish” might be. Applying estimates of
cost reductions and revenue increases observed in fisheries that under management
reforms that end the race for fish to California fisheries, we estimate that total revenue
from all California fisheries could increase by $27 – 93 million per year from 2004 levels
($140 million), resulting in an increased net present value of $53 million to $1.9 billion.
Peak revenues were $315 million in 1980. The broad ranges reflect a high degree of
uncertainty and variability in cost and earnings estimates.
This analysis is necessarily incomplete, because it only includes the direct costs of
overcapitalization and poor fish quality. It does not include indirect costs that are
difficult to calculate, but are most likely very high: the ecosystem values being lost from
excessive by-kill, the excess management costs incurred by having to contain the impacts
of excessive latent fishing effort, and the value of habitat lost or degraded by fishing in
the “race to fish”.
The extent of inadequate protection of ecosystem values and underproduction of
potential economic surplus differs from fishery to fishery, and between management
Exhibit 1: California Fisheries Fund Business Plan

The California Fisheries Fund
Attachment D. Reform Examples 3
regimes. Some of the state’s fisheries are dispersed over wide areas, while others are
concentrated in relatively small areas. Some are based on high volumes of catch, while
others are much lower in volume. Each of these situations has spawned management
structures unique in design, enforcement, and performance, ranging from lack of
regulation to complex gear restrictions, seasonal restrictions, closures, limited entry
(permits), and other measures. However, most fisheries have not yet managed to solve
the common property problem.
MINIMIZING IMPACTS, MAXIMIZING PROFITS
Given that the common property problem and the “race to fish” are the root
causes of both environmental problems and poor income generation from the rich
resources of the oceans, what are the possible solutions? The most effective solutions
revolve around replacing the perverse incentives operating under “race to fish” conditions
with incentives aimed at conservation and generating value from the worlds' oceans. As
it turns out, there are several tried and true ways to alter incentives. All of these methods
closely emulate a private property rights system – but with a major difference. Instead of
granting direct property rights to the resource itself, most of these systems are based on
the granting of transferable privileges to harvest a certain fraction of the total allowable
catch to various kinds of entities. When privileges are granted to communities, the
dedicated access privilege is termed a Community Development Quota or CDQ, or
community-based fisheries management. When granted to groups of fishermen, the
dedicated access privilege often takes the form of a sector allocation or an allocation to a
harvest cooperative. When the dedicated access privilege is granted to a group of
fishermen who gain exclusive access to resources in a specific area, it is termed a
Territorial Use Right Fishery, or TURF. Dedicated access privileges (shares of the
allowable catch) allocated to individuals are called Individual Transferable Quotas (ITQs)
or Individual Fishing Quotas (IFQs) or Individual Vessel Quotas (IVQs). The specific
method of designating harvest privileges depends on the unique social, cultural,
biological, and economic attributes of the fishery.
Exhibit 1: California Fisheries Fund Business Plan

The California Fisheries Fund
Attachment D. Reform Examples 4
COMMUNITY-BASED FISHERY MANAGEMENT
Community-based fishery management (CBFM) has been promoted in developing
countries such as the Philippines, Thailand, and Indonesia since the 1980’s. In North
America, the principal examples include Maine lobster, Massachusetts hook sector
allocation, and the Bay of Fundy Marine Resources Centre of Nova Scotia. The
following descriptions are taken from the Cape Cod Commercial Hook Fisherman’s
Association website (http://www.ccchfa.org/index.php).
Maine Lobster
Since 1954, the Maine Lobsterman’s Association (MLA) has facilitated a
lasting relationship between local fisherman, the surrounding community and
the ocean leading to the successful management of the lobster fishery. In
1995, the Maine Legislature enacted a co-management law in the lobster
fishery, dividing it into seven distinct lobster zones which are managed by
lobster zone councils. In the new co-management plan, the fishermen
collaborate with the government by participating on the lobster zone councils
and aiding in the creation of new management practices. The MLA played a
crucial role in establishing the lobster zone councils which are managed
under the supervision of the Maine Department of Marine Resources. The
commitment, unity and support from the members of MLA have driven the
success of the lobster fishery and distributed power more equitably
throughout the industry.
Massachusetts Hook Sector Allocation
The Georges Bank Cod Hook Sector allows hook and line fishermen to be
engaged in creating rules and regulations for their sector. The Sector is
allowed up to 20% of the total allowable catch (TAC) for Georges Bank cod,
and the members determine how to harvest the cod. This prevents the race for
fish, in which fishermen rush out at once and catch the fish in a short period
of time, rapidly catching the TAC and potentially glutting the market. The
Sector also provides opportunities for fishermen to work with scientists and
observers to conduct research and monitor their bycatch, proving that they
Exhibit 1: California Fisheries Fund Business Plan

The California Fisheries Fund
Attachment D. Reform Examples 5
are capable of handling the responsibilities of management. While the Sector
is a relatively new concept, it has unified fishermen in the area, connected the
community with the fishermen, promoted sustainable fishing practices and
formed a bond of trust between fishermen and the scientific community.
Bay of Fundy Marine Resources Centre, Nova Scotia
The Bay of Fundy Marine Resource Centre (MRC) was established in 1997
in response to the massive decline in groundfish stocks off the coast of Nova
Scotia. Fishermen, communities and scientist work in cooperation to protect
the declining fish populations while providing opportunities for the fishermen
to maintain their livelihood. The “Local Stocks and Local Knowledge”
project allowed fishermen to work alongside scientists to discover fish
spawning areas which fostered a relationship based on trust between the two
groups. Traditionally fishermen and scientists have not seen eye to eye on
many issues, but given the chance to work together, alliances are formed,
which facilitates greater communication and promotes better science.
Community Development Quotas (CDQs) are another form of community-based
fishery management. There are few examples of Community Development Quotas
(CDQs) in the U.S., in which shares of the allowable catch are granted to isolated, rural
communities primarily as an economic development tool. Such communities that border
the Bering Sea have recently become beneficiaries of community development quotas
(CDQs). Fish harvested off these coasts include Walleye pollock, Pacific halibut,
sablefish, other groundfish and crab. Unfortunately this area of ocean has been under
open-access management prior to establishment of the CDQ program, and so the effects
of this program are largely unknown. Stock levels are also uncertain in these areas,
although bycatch has been reduced from previous levels.
Established in the early 1990s, CDQs seek to augment economic opportunities for
communities that lack full-time employment opportunities and to also develop the
community as a whole. Ideally the initial profits would be reinvested in fishery-related
activities (providing much needed capital), then later possibly allowing for investment of
Exhibit 1: California Fisheries Fund Business Plan
The California Fisheries Fund
Attachment D. Reform Examples 6
other community development projects. The program here in Alaska also seeks to
provide the resources for these communities to have more freedom over choosing their
future, and preserving their subsistence lifestyles.
TURFs
Territorial Use Right Fisheries exist throughout the world. The principal
examples are for benthic species in Mexico (where the government has granted sea area
concessions to harvest cooperatives for lobster off Quintana Roo coast and in the Sea of
Cortez), Chile (for sea urchin), and other countries with strong traditions of local marine
tenure (e.g., Indonesia, Philippines, Vanuatu, etc.). Japanese fishing cooperatives have
also been highly successful at sustaining catches and mitigating for habitat damage over
several decades.
Benthic (shellfish) fisheries are substantially different from finfish fisheries.
Since these species are sedentary in rocky coastal areas or sandy sediments, fishing
practices and technology tend to be quite idiosyncratic. For example, lobster species are
harvested with special cages designed to exploit lobster behavior (e.g. Ford, 2001; Harper
and Muller, 2001). Also, the spatial distribution of a species might change year by year
and be heterogeneous because of fluctuations in recruitment (e.g. Biron et al., 2004;
Campbell et al., 1998; Prince et al., 1998). Such fisheries often lend themselves to
TURF management.
The artisanal Chilean sea urchin fishery has been regarded as a critical social
sector in Chile for several reasons. It has provided the substantial amount of high-value
sea products. As of 1995, the artisanal fishery sector supplied 22% of total exported
value of fishery products (Bernal et al., 1999). Also, it was reported that 446,500 out of
about 516,000 all fishery-related jobs were offered in the artisanal fishery sector
according to a 1992 survey (Bernal et al., 1999).
The Chilean government renovated its fishery policies by introducing the Fishing
and Aquaculture General Act (FAGA) in 1989. Under a specific management plan,
every member of a community was allowed to harvest multiple benthic resources,
Exhibit 1: California Fisheries Fund Business Plan

The California Fisheries Fund
Attachment D. Reform Examples 7
including highly valuable “loco” clam (Concholepas concholepas), within a designated
area. A fairly substantial annual fee and some technological restrictions were required
(Bernal et al., 1999).
Catch per unit effort (CPUE) for loco, sea urchin, and limpets significantly
increased under TURF management. Also, the mean sizes of these three species within
TURFs were significantly larger than in open-access areas. Castilla et al. (1998)
compared the data from four different “sindicatos” (co-management entities) and also
concluded that the best-organized one (El Quisco) enjoyed the highest catches and value
for loco. It also had the highest CPUE and mean size. On the other hand, poorly-managed
sindicatos with open-access policies fared much worse.
The effects of management quality can also be seen in the spiny lobster
(Panulirus argus ) fishery in Punta Allen, Mexico (Castilla and Defeo, 2001). This
geographical concession fishery (TURF) has enjoyed a relatively stable harvest and
generated unusually high levels of value under strict self-regulation such as season, size,
and area allocation to each fisher. Castilla and Defeo (2001) concluded that the keys to its
success are: 1) since the lobster fishery is the only notable economic engine in that
remote area, people are highly motivated to manage the resource sustainably; 2) its
magnitude is small enough to ensure the enforcement of rules; and 3) the TURF system
appears to be suitable for the lobster’s spatial distribution dynamics (i.e., reproduction,
migration, grow-out, etc). The Mexican spiny lobster fishery was recently certified as
sustainable by the Marine Stewardship Council.
INDIVIDUAL TRANSFERABLE QUOTAS OR FISHING QUOTAS
When harvest privileges are held by individuals, they are termed Individual
Transferable Quotas, or ITQs (also known as Individual Fishing Quotas, or IFQs).2 ITQs
represent individual percentage shares of scientifically determined allowable catches,
thus removing the need to race to catch fish before one's competitors do.
2 Individual Quotas (IQs), Individual Fishing Quotas (ITQs), and Individual Transferable Quotas (ITQs) are all similar management structures. IQs assign a specified portion or percentage of the Total Allowable Catch to a fisherman. If the individual quota is tradable or can be sold to others, then it is an ITQ or an IFQ.
Exhibit 1: California Fisheries Fund Business Plan
The California Fisheries Fund
Attachment D. Reform Examples 8
ITQs have been adopted in several hundred fisheries in over 16 countries, and the
results have generally been very positive for both conservation and income generation.
We believe that having an ITQ changes the focus of fishermen from maximizing one’s
share of allowable catch (which is uncertain under open or limited access programs) to
maximizing the value derived from a secure share of the total allowable catch. Following
ITQ implementation, it has been suggested that fishermen in the British Columbia halibut
fishery now time their halibut fishing trips according to expected ex-vessel prices (11),
and Bering Sea Pollock fishermen have altered their fishing to achieve a per unit increase
in value (12). Freed of the need to compete with other fishermen to catch as many fish as
fast as possible, a fisherman can tune his/her operation to maximize profits by fishing at
times when market prices for his catch are high or when product quality is high.
Fishermen can also reduce costs by trading his/her large boat for a smaller vessel more
closely aligned with his/her fish quota. This can result in more income with less
investment, and cleaner, less destructive fishing.
In the vast majority of ITQ fisheries that have been established around the world,
the “race for fish” has ended, profits have increased, and environmental performance has
improved substantially. For example, ITQs transformed the Alaskan and British
Columbia halibut fishery from a five day frenzied race, prosecuted by a bloated and
overcapitalized fleet, into a much less intense fishery delivering fresh fish nearly
continuously throughout the year. In British Columbia, ex-vessel halibut prices3 rose by
40% following ITQ introduction and total ex-vessel revenues4 increased by an average of
Can$5,8 million per year (12). ITQs, introduced in stages from 1976 to 1990 in various
Icelandic fisheries, greatly reduced both fishing effort and vessel numbers and
transformed a previously loss making industry into a profitable one: In 1988, profits as a
percentage of gross revenue for all Icelandic fisheries was –5%, compared to +12% in
2002 (13). Similar results apply to the New Zealand fisheries, where ITQs were
introduced between 1982-1984, as well as other ITQ fisheries around the world. The
value of New Zealand fisheries doubled in real terms between 1990 and 2000, much of
which is attributable to having dedicated use privileges in the form of ITQs, as well as
3 Ex-vessel prices are prices paid to fishermen for seafood products right off the boat. 4 Ex-vessel revenues are revenues obtained from the sale of seafood products right off the boat.
Exhibit 1: California Fisheries Fund Business Plan

The California Fisheries Fund
Attachment D. Reform Examples 9
gains from trade (14, 15)5. After its transition to ITQs, the multi-species groundfish
fishery off British Columbia, Canada, improved compliance with catch limits and
virtually eliminated bykill and unaccounted fish mortality (12). This fishery also
substantially improved its economic performance. Ex-vessel prices increased by
US$0.32 per pound for Pacific Ocean Perch and US$0.37 per pound for lingcod and the
landed value of the total catch increased by $13 million (12).
ITQs generally result in improved environmental performance, with respect to
compliance with total allowable catch levels, bykill reduction, and other measures.
Rather than opposing conservation measures and complaining about the lack of adequate
research, ITQ holders in some ITQ fisheries have actually invested in conservation,
research, and management6 (13). Fisheries become profitable and able to thrive, even
without indirect government subsidies. Increased profitability may reduce opposition to
conservation measures, because under an ITQ regime they may be perceived as
investments in the future of the fishery, producing a flow of increased benefits to the ITQ
holder. Also as a result of increased profitability, ITQ fisheries are often able to pay
management costs formerly paid by the government. For example, New Zealand
fisheries achieve almost full cost recovery and now pay annual fees that cover nearly all
management and research costs (15).
Despite strong evidence that secure access to a guaranteed share of sustainable
catch cures many of the environmental and economic ills present in modern fisheries,
progress toward adopting these measures has been disappointingly slow. In some
countries, there is a deeply-felt concern about the allocation of exclusive use of resources
that have traditionally been open to everyone. These sentiments must be balanced against
the economic, biological and environmental gains of dedicating use privileges. Other
more specific concerns focus on the potential difference between individual and
collective economic gains or losses, the potential for economic windfalls resulting from
the sale of harvest privileges, the possibility of excessive levels of industry consolidation,
5 Value is the market capitalization (quota price*TAC), which summarizes gains from trade and ownership (14). 6 For example, in New Zealand, quota shareholders have asked for voluntary reductions in TAC to improve population status and have funded consultants to carry out research related to population assessments, enhancement programs, bathymetric surveys, etc.
Exhibit 1: California Fisheries Fund Business Plan
The California Fisheries Fund
Attachment D. Reform Examples 10
and, related to all this, perceived inequitable distribution of harvest privileges. However,
both theory and experience shows that it is possible to design programs in such a way to
adequately address these concerns. For example, Alaskan fishermen insisted on a
requirement that ITQ holders be on board the vessel to prevent a fishery dominated by
"absentee landlords". They also implemented a cap on the maximum amount of ITQ that
an individual or firm can accumulate (one percent of the allowable catch) to prevent a
large change from a fleet dominated by small businesses to one dominated by large firms.
In Sharing the Fish, the National Academy of Sciences recommended ways to allocate
ITQs more fairly and to address other concerns (13). But fear of change and deeply held
concerns, coupled with a lack of funding for education, consensus building, and
implementation, continue to block the road to a more rational way of managing precious
marine resources. This applies especially to less developed countries which, in addition
to the above, face the difficulties of limited alternative employment opportunities,
inadequate financial resources, and in many cases, the lack of administrative and fisheries
management capacity and infrastructure.
Literature Cited
1. D. Pauly, V. Christensen, J. Dalsgaard, R. Froese, F. Torres Jr., Science 279, 860 (1998).
2. R. Arnason. 1991. "Efficient Management of Ocean Fisheries", European Economic Review 35: 408-17.
3. W. Schrank, R. Arnason and R. Hannesson, The Cost of Fisheries Management, Ashgate Aldershot (2003).
4. Food and Agriculture Organization Fisheries Department, The State of World Fisheries and Aquaculture 2002 (FAO Publication, 2002; http://www.fao.org/docrep/005/y7300e/y7300e00.htm).
5. PEW Oceans Commission, America’s Living Oceans: Charting a Course for Sea Change (PEW report, 2003; http://www.pewoceans.org/oceans/index.asp).
6. M. Milazzo, “Subsidies in World Fisheries: A Reexamination” (World Bank Tech. Pap. No. 406, Fisheries Series, Washington D.C., 1998).
7. “Hard Facts, Hidden Problems: A Review of Current Data on Fishing Subsidies,” (World Wildlife Fund Tech. Pap., 2001; http://www.worldwildlife.org/oceans/hard_facts.pdf).
8. G. Hardin, Science 162 1243 (1968). 9. Afkoma Sjávarútvegs, (Statistics Iceland, Reykjavik 2003). 10. J. Wilen in Evolving Property Rights in Marine Fisheries D. Leal, Ed. (PERC,
Bozeman, in press) Prepared for PERC’s 13th Political Economy Forum: Evolving Property Rights in Marine Fisheries, Big Sky Montana, March 21-24, 2002.
Exhibit 1: California Fisheries Fund Business Plan

The California Fisheries Fund
Attachment D. Reform Examples 11
11. K. Casey, C. Dewees, B. Turris, J. Wilen, Marine Resource Economics 10, 211 (1995).
12. S. Nelson, “British Columbia Individual Vessel Quota Experience: Lessons for the West Coast Trawl Groundfish Fishery”, unpublished data.
13. Sharing the Fish: Towards a National Policy on Individual Fishing Quotas, (National Academy of Sciences, Washington D.C., 2003).
14. J. Sanchirico, R. Newell, “Catching Market Efficiencies: Quota-Based Fisheries Management” (Resources for the Future, 2003; http://www.rff.org/Documents/RFF-Resources-150-catchmarket.pdf)
15. J. Sanchirico, personal communication. 16. R.E. Johannes, Annu. Rev. Ecol. Syst., 33, 317 (2002). 17. M. King, U. Faasili, Fisheries Management and Ecology, 6, 133 (1999). 18. G. R. Russ, A. C. Alcala, Coral Reefs, 18, 307 (1999). 19. Pacific Fisheries Management Council, Amendment 16-2: Rebuilding plans for
darkblotched rockfish, Pacific ocean perch, canary rockfish, and lingcod. Draft environmental impact statement and regulatory analyses (2003, http://www.pcouncil.org/groundfish/gffmp/gfa16-2.html).
20. U. S. General Accounting Office, Report to House Committee on Resources: Commercial Fisheries, Entry of Fishermen Limits Benefits of Buyback Programs (GAO/RCED-00-120, 2000, http://frwebgate.access.gpo.gov/cgi-bin/oseftp.cgi?Ipaddress=162.140.64.21&filename=rc001.pdf&directory=/diskb/wais/data/gao).
21. Conservation International, Conservation Programs: Policy and Economics (http://www.conservation.org/xp/CIWEB/programs/policy_economics/policy_economics.xml#rep; 2003).
22. D. Pauly, The Sea Around Us Project Newsletter (Issue 12, July/August 2002; http://www.conservation.org/xp/CIWEB/programs/policy_economics/policy_economics.xml#rep).
23. At-Sea Processors Association, A Case Study of Fish Harvesting Cooperatives: The Pacific Whiting Conservation Cooperative (PWCC) (http://www.atsea.org/concerns/pwcc.html).
24. Marine Fisheries and the Law of the Sea: A Decade of Change – Special Chapter (revised) of the State of Food and Agriculture (Food and Agriculture Organization, Rome, 1993).
Exhibit 1: California Fisheries Fund Business Plan