INVESTING IN MARITIME INDONESIA - Mare Forum · Investing in Maritime Indonesia 2 Total area + 1.9...
28
INVESTING IN MARITIME INDONESIA BANI M MULIA
-
Upload
truongminh -
Category
Documents
-
view
216 -
download
0
Transcript of INVESTING IN MARITIME INDONESIA - Mare Forum · Investing in Maritime Indonesia 2 Total area + 1.9...

INVESTING IN MARITIME INDONESIA
BANI M MULIA

2 Investing in Maritime Indonesia
Total area + 1.9 milllion sq km. 2/3 is covered by
water
95,181 km of sea line 4th longest in the world after
Canada, USA and Russia
Approx 17, 480 islands separated by sea
Archipelago
Growing conomy
Sea Transportation

3 Indonesia
Fourth largest population in the world : 241
million
Substantial natural resources
6.5% economic growth in 2011.
GDP per capita is predicted to reach USD 4,140
in 2013

4
Sources : McKinsey


Jakarta-based Routes
BELAWAN
PADANG BATAM
PANJANG
JAKARTA
SURABAYA
PONTIANAK
SEMARANG
BANJARMASIN
SAMARINDA
TARAKAN
BONTANG BITUNG
`` GORONTALO PANTOLOAN
KENDARI
MAKASAR
TERNATE
AMBON
MANOKWARI
SORONG
MERAUKE
KUPANG
BENETTE BENOA
BIAK
PEKANBARU
PERAWANG
PALEMBANG
JAYAPURA BENGKULU
BALIKPAPAN

Surabaya-based Routes
BELAWAN
PADANG
PERAWANG
BATAM
PANJANG
JAKARTA
SURABAYA
PONTIANAK
SAMPIT
SAMARINDA
TARAKAN
BONTANG
`` GORONTAL
O PANTOLOAN
TERNATE
AMBON
MANOKWARI
SORONG JAYAPURA
MERAUKE
KUPANG
BIAK
DILI
TIMIKA
KENDARI
MAKASAR
LUWU
K
TOLI-
TOLI
TOBELO
BATULICIN
KUMAI
BALIKPAPAN
BANJARMASIN
BITUNG BERAU
NUNUKAN
TUAL
FAK-FAK
KAIMANA
SERUI
NABIRE
LEMBAR MAUMERE
BENOA

Container Throughput Jakarta & Surabaya Based
DESCRIPTION 2010 2011 2012
JKT BASED 810,086 906,292 1,066,037
SUB BASED 652,905 758,553 784,405
TOTAL 1,462,991 1,664,845 1,850,442
(in TEUs)
Sources : Samudera Internal Data

9 Pendulum Nusantara
Belawan
Batam
Jakarta
Surabaya
Sorong
Makassar

Source : Ministry of Transportation Republic of Indonesia
KALIBARU TERMINAL DEVELOPMENT PLAN
JAKARTA
Descriptions Stage I
(2011–2013)
Stage II
(2013–2016)
Stage III
(2016–2019)
INFRASTRUCTURE - WHARF (Draft -18m LWS)
- BACK UP AREA
- CAPACITY
1.000 m’
60 ha
1.5 Million TEU
1.200 m’
108 ha
1.8 Million TEU
1.500 m’
90 ha
2.2 Million TEU
EQUIPMENTS
- Quay Container Crane
- Rubber Tired Gantry Cr
- Head Truck
- Chassis
- Reefer
10 units
30 units
62 units
70 units
200 units
12 units
40 units
83 units
90 units
200 units
15 units
46 units
104 units
110 units
200 units
Current terminal capacity
5.8 mio teus

PORT DEVELOPMENT TO SUPPORT PENDULUM NUSANTARA
TANJUNG EMAS
TELUK LAMONG TANJUNG PRIOK
BELAWAN

12
Palaran Container Terminal
Samarinda
• BOT contract 50 years concession
• Wharf 270 meter.
• Draft 6 meter.
• Capacity of 200,000 TEUs per year (phase 1)
• Provided with :
• 2 Unit CC 40 ton
• 5 Unit RTGC
• Start Operation : end of 2009

158 174 193 220 242 266 293
322 354 379 406
434 464
497 522 548
-
100
200
300
400
500
600
700
2009 2010 2011 2012 2013 2014 2015 2016 2017 2018 2019 2020 2021 2022 2023 2024
Tho
usa
nd
s
TPK Palaran Volume Projection (in TEUs)
CY existing CY existing + extension Existing+extension+ TPK 2
TPK 1+ext 1+ TPK 2+ext 2 Volume
Container Volume Projection – TPK Palaran
Existing Capacity
Add Capacity by CY Extension
Add Capacity by TPK-2
Add Capacity by CY Extention 2

Confidential & proprietary of PT. Samudera Indonesia Tbk
TPK PALARA
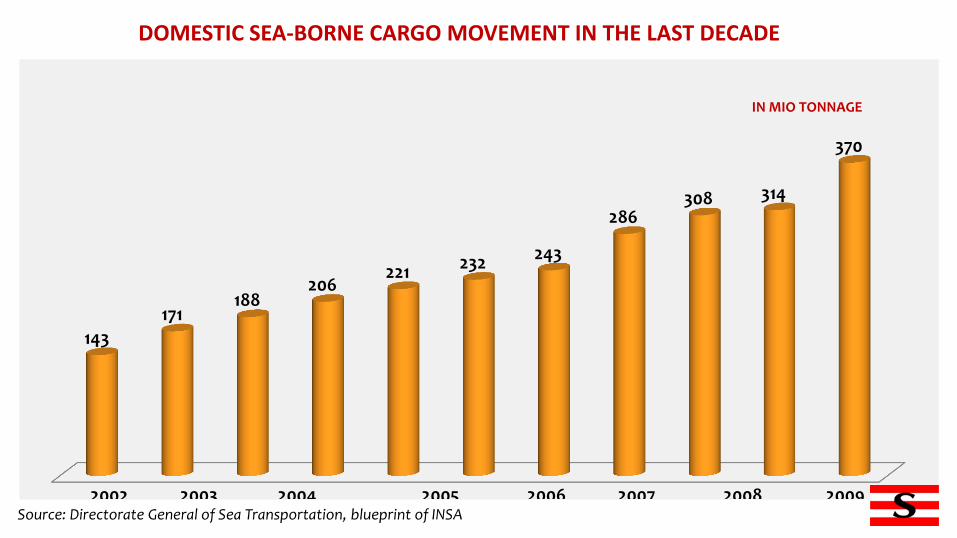
143
171 188
206 221 232 243
286 308 314
370
2002 2003 2004 2005 2006 2007 2008 2009 2010 2011 2012
IN MIO TONNAGE
DOMESTIC SEA-BORNE CARGO MOVEMENT IN THE LAST DECADE
Source: Directorate General of Sea Transportation, blueprint of INSA

DOMESTIC SEA-BORNE CARGO MOVEMENT IN THE LAST DECADE
Source: Directorate General of Sea Transportation, blueprint of INSA
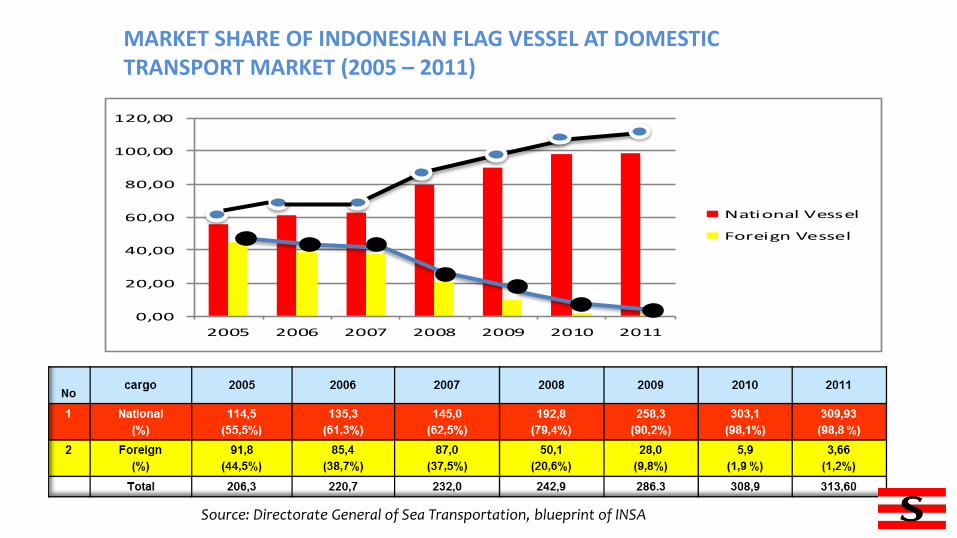
MARKET SHARE OF INDONESIAN FLAG VESSEL AT DOMESTIC TRANSPORT MARKET (2005 – 2011)
Source: Directorate General of Sea Transportation, blueprint of INSA
0,00
20,00
40,00
60,00
80,00
100,00
120,00
2005 2006 2007 2008 2009 2010 2011
National Vessel
Foreign Vessel

MARKET SHARE OF INDONESIAN FLAG VESSEL AT EXPORT-IMPORT
Source: Directorate General of Sea Transportation, blueprint of INSA
No Cargo 2006 2007 2008 2009 2010
1 National
(%)
29,4
(5,7%)
31,4
(5,9%)
38,2
(7,1%)
49,3
(9,0%)
51,2
(9,0%)
2 Foreign
(%)
485,8
(94,3%)
500,5
(94,1%)
498,2
(92,9)
501,7
(91,0)
516,1
(91,0)
Total 515,2 541,0 536,4 551,0 567,2

INDONESIAN SEA-BORNE CARGO MOVEMENT SOON TO HIT NEW RECORD
TOTAL Indonesian Sea-Borne Cargo
Will soon to reach
1 Billion Tonnage in 2—3 years ahead , with potential Freight business
turnover to reach
US$25 Billion. Indonesian Shipping Industry will have to be prepared
to grab opportunities arising from this

• Number of vessels as per 31st October 2012 are 11.628 units (16,08 mio GT) • Number of vessels as per 31st March 2005 are 6.041 unit (5,67 mio GT) • Therefore there increasing number of vessel 5.587 units (92%) with total tonnage
10.41 mio GT (184%)
31st March 2005 31st Oct 2012
No. of Ships 6.041 11.628
0
1.500
3.000
4.500
6.000
7.500
9.000
10.500
12.000
13.500
Un
it V
esse
l
5.587 units (92 %)
11.628
6.041
NUMBER OF INDONESIAN FLAG VESSELS
> 16 mio GT
11.628 vessels
> 19 mio DWT

Indonesian Economic Overview
1989
(306)
1999
(747)
2009
(1.064)
2011
(1.168)
2013
(1.293)
THE GROWTH OF INSA MEMBERS

2.150
2.200
2.250
2.300
2.350
2.400
2.450
2.500
2.273
2.655
382 unit (16,8%)
• Based on Shipping Licenses (SIUPAL and SIOPSUS) issued by Sea Com DG - Ministry of Transport, Republic of Indonesia, the number of shipping companies in Indonesia as per October 2012 is 2.655 units
2010 2012
THE GROWTH OF SHIPPING COMPANIES

NATIONAL SHIPPING COMPANIES LISTED IN IDX
Number of national shipping companies listed in the Indonesian Stock Exchange increased 320 % from 5 companies in 2000 to 21 companies in 2013 (including those consolidated in respectives holding companies)
0
2
4
6
8
10
12
14
16
18
7
21
5
Units
2000 2005 2013

No Company ID Activity Registered
1 PT Berlian Laju Tanker Tbk BLTA Transport - Marine 26-Mar-90
2 PT Rig Tenders Indonesia Tbk RIGS Transport - Marine 26-Mar-90
3 PT AKR Corporindo Tbk AKRA Distribution/Wholesale Sep-94
4 PT Mitra Internasional Resources MIRA Transport - Marine 30-Jan-97
5 PT Samudera Indonesia Tbk SMDR Transport - Marine 05-Jul-99
6 PT Tanah Laut Tbk INDX Infrastructure, Utilities and Transport
17-Mei-01
7 PT Arpeni Pratama Ocean Line Tbk APOL Transport - Marine 22-Jun-05
8 PT Ancora Indonesia Resources Tbk OKAS Petrochemicals 29-Mar-06
9 PT Radiant Utama Interinsco Tbk RUIS Oil Comp-Explor&Prodtn 12-Jul-06
10 PT Humpuss Intermoda Trans Tbk HITS Transport - Marine 15-Des-07
11 PT Elnusa Tbk ELSA Oil-Field Services 06-Feb-08
12 PT Trada Maritime Tbk TRAM Transport - Marine 10-Sep-08
13 PT Pelayaran Tempuran Emas Tbk TMAS Transport - Marine 31-Des-09
14 PT Wintarmar Offshore Marine Tbk WINS Transport - Marine 29-Nop-10
15 PT Mitrabahtera Segara Sejati Tbk MBSS Transport - Marine 06-Apr-11
16 PT Buana Listya Tama Tbk BULL Transport - Marine 23-Mei-11
17 PT Indo Straits Tbk PTIS Transport - Marine 12-Jul-11
18 PT ABM Investama Tbk ABMM Diversified Operations 06-Des-11
19 PT Pelayaran Nelly Dwi Putri Tbk NELY Transport - Marine 10-Nop-12
20 PT Pelayaran Nasional Bina Guna Raya Tbk BRRM Transport - Marine 09-Jan-13
21 PT Trans Power Marine Tbk TPMA Transport - Marine 20-Feb-13
List of Shipping Companies Listed in IDX


OPPORTUNITY FOR SHIPYARD INDUSTRY
• Number of shipyards in Indonesia is approx 250 shipyards, local shipyard capacity for docking and repair is approx 12 mio DWT
• Given such fact, the capacity of shipyards in Indonesia is still under the amount of 19,5 mio DWT Indonesian vessel (current condition)
• There’s an opportunity for shipyard industry to grow in order to support demand from Indonesian shipping industry

Current issue • On 27th February 2013, Indonesia Ministry of Trade signed
MoU with several industry Associations : – INSA (Indonesia National Shipowners' Association),
– Apindo (Employers' Association of Indonesia),
– ALFI/INFA (Indonesian Forwarders' Association),
– Indonesia Eximbank
• The MoU is related to the conversion the term of delivery from FOB to CIF for export activities
• The Aim is to boost Indonesian export. It will also have a direct impact to shipping industry, as it will encourage Indonesian investors to invest more on shipping sector

THANK YOU