INVESTING IN ICAP - NEX · • ICAP is committed to a truly hybrid model based on - Combined voice...
89
INVESTING IN ICAP Michael Spencer
Transcript of INVESTING IN ICAP - NEX · • ICAP is committed to a truly hybrid model based on - Combined voice...

INVESTING IN ICAPMichael Spencer

2
INTRODUCTION
• The world’s largest voice and electronicinterdealer broker
• Daily average transaction volume in excessof $550 billion, 40% of which is electronic
• 2800 staff operating from 21 officesworldwide
• One of the UK’s 130 largest quotedcompanies. A FTSE 250 company with amarket capitalisation of circa £1.4bn(US$2.3bn)
• The Total Shareholder Return since themerger (Sept 99) up to the close on23 Sept 03 has been 463%
INT
RO
DU
CT
ION

3
IDB SERVICE
• Wholesale intermediary
• Anonymity/execution/liquidity/information
• No principal trading
• Where settlement systems areestablished, operates as “matchedprincipal”
• In markets where credit risk existsbetween counter parties, “name give up”
• Similar to an exchange
INT
RO
DU
CT
ION

4
HYBRID CLARIFICATION
• Many different definitions
• ICAP is committed to a truly hybridmodel based on- Combined voice and electronic liquidity
- Customers choice of either voice orelectronic deal execution

5
INDUSTRY DEVELOPMENTS
• Rapid consolidation of previously fragmentedindustry driven by:
- Impact of the Euro- Merger of customers- Increasing impact of technology- The emergence of e-broking- Weakness of some balance sheets- Operational leverage and economies of scale
• Continued belief that further consolidation will resultin the emergence of 2 or 3 global interdealerbrokers with a small number of niche players
INT
RO
DU
CT
ION

6
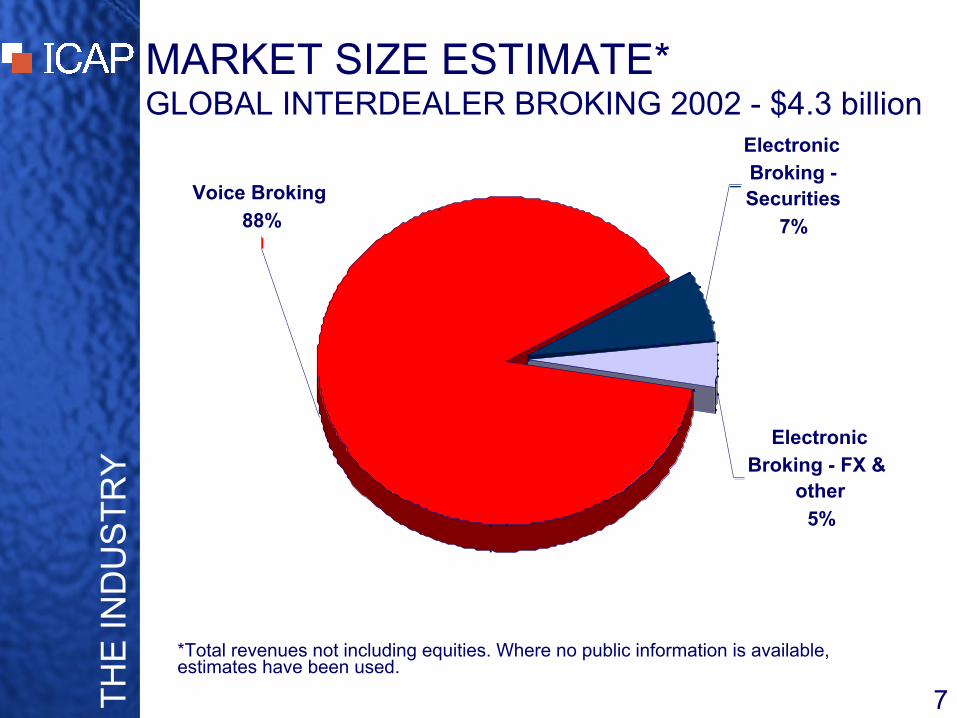
MARKET SIZE ESTIMATE*GLOBAL INTERDEALER BROKING 2002 - $4.3 billion
ICAP plus BrokerTec
Collins Stewart Tullett
Tradition
Other Voice brokers
Prebon
Cantor/Espeed
GFI
Other Electronic brokers
Other Energy brokers
* Total revenues not including equities. Where no public information is available,estimates have been used.
TH
E IN
DU
ST
RY
7
MARKET SIZE ESTIMATE*GLOBAL INTERDEALER BROKING 2002 - $4.3 billion
Electronic
Broking - FX & other
5%
Electronic
Broking - Securities
7%
Voice Broking
88%
*Total revenues not including equities. Where no public information is available,estimates have been used.
TH
E IN
DU
ST
RY

8
INTERNATIONAL BONDS AND NOTESAMOUNTS OUTSTANDING (US$ billions)
0
1000
2000
3000
4000
5000
6000
7000
8000
9000
10000
1993 1994 1995 1996 1997 1998 1999 2000 2001 2002
Source: BIS
DR
IVE
RS
FO
R G
RO
WT
H

9
MARKET GROWTHINTEREST RATE SWAPS OUTSTANDING (US$ trillions)
0
10
20
30
40
50
60
70
80
Dec-90Dec-91Dec-92Dec-93Dec-94Dec-95Dec-96Dec-97Dec-98Dec-99Dec-00Dec-01Dec-02
Source: BIS
DR
IVE
RS
FO
R G
RO
WT
H

10
ELECTRONIC BROKING VOLUMESALL PRODUCTS (average $ billion/day)
0
50
100
150
200
250
1Q01 2Q01 3Q01 4Q01 1Q02 2Q02 3Q02 4Q02 1Q03 2Q03
ICAP/ETC
MTS Group
BrokerTec
eSpeed
Sources: BrokerTec, ICAP, estimates from eSpeed and MTS websites - counting only trades executed electronically
ELE
CT
RO
NIC
BR
OK
ING
INVESTING IN ICAPSteve McDermott

12
AMERICAS
• American operations- 35+% of ICAP’s global profit
- 116% profit growth for the region
between 2002 and 2003
- Growth has been both organic and
through acquisitions
- The larger ICAP acquisitions have
been in North America.
BU
SIN
ES
S A
NA
LY
SIS

13
AMERICAS
• The merger between Garban and theIntercapital Group.
- Garban brought a leading Americanpresence
- Intercapital a leading Europeanpresence
- The combination created the world’slargest interdealer broker.
BA
CK
GR
OU
ND
14
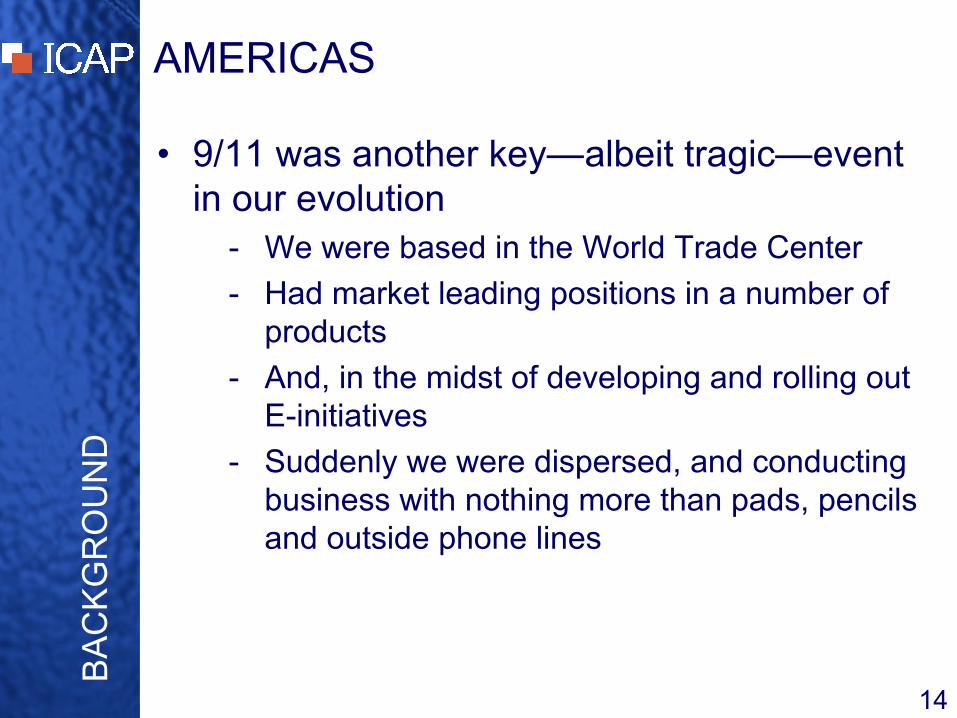
AMERICAS
• 9/11 was another key—albeit tragic—eventin our evolution
- We were based in the World Trade Center
- Had market leading positions in a number ofproducts
- And, in the midst of developing and rolling outE-initiatives
- Suddenly we were dispersed, and conductingbusiness with nothing more than pads, pencilsand outside phone lines
BA
CK
GR
OU
ND

15
AMERICAS
• Background- We survived and succeeded.
- In the two years since the attacks onthe Trade Center we have achievedgrowth in every measurable way.
BA
CK
GR
OU
ND

16
AMERICAS
• Background- In the past 18 months, we have completed
three major acquisitions
• First Brokers in April 2002 expanded
• APB (now ICAP Energy) in October 2002
• BrokerTec in May 2003
- Headcount in all US operations is 1170
- New North American headquarters is a stateof the art facility, which can be expanded.
BA
CK
GR
OU
ND

17
AMERICAN MANAGEMENT
• Ron Purpora is CEO of our Securitiesbusiness in North America. Thisincludes products such as:
- US Treasury products- U.S. Repo agreements- U.S Mortgages- U.S. Agencies- U.S. Corporates- Credit Derivatives- Equity NYSE floor business
INT
RO
DU
CT
ION
S

18
AMERICAN MANAGEMENT
• Doug Rhoten, CEO, Garban CapitalMarkets. Doug is responsible for
- Money Markets
- Spot and Forward Foreign Exchange
- Emerging Market Derivatives
- Derivatives, including options andInterest Rate Swaps
- Energy
INT
RO
DU
CT
ION
S
19
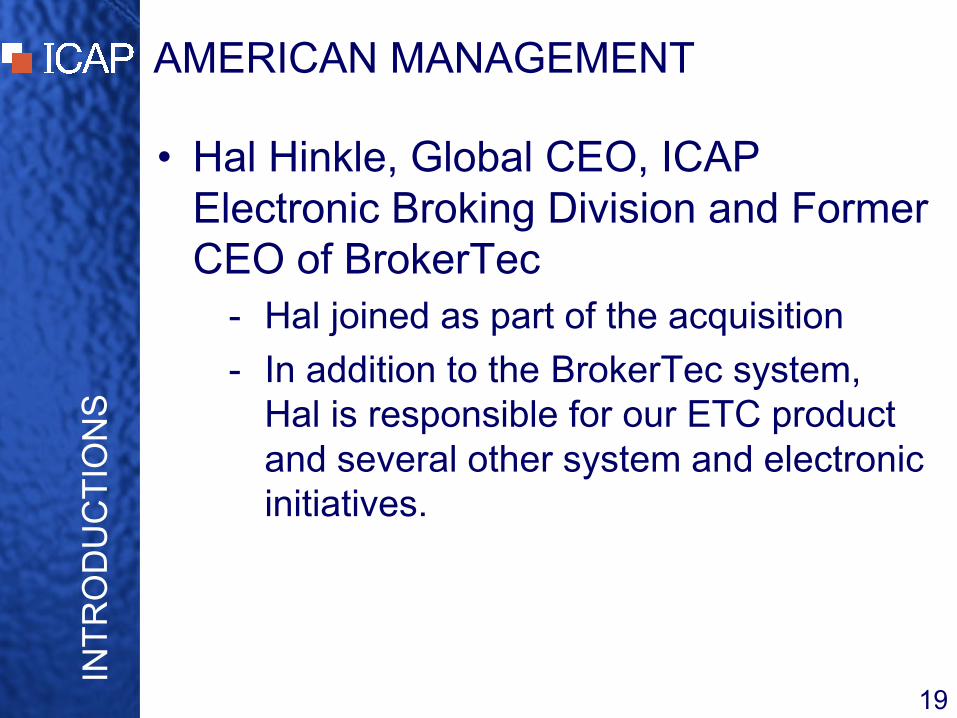
AMERICAN MANAGEMENT
• Hal Hinkle, Global CEO, ICAPElectronic Broking Division and FormerCEO of BrokerTec
- Hal joined as part of the acquisition
- In addition to the BrokerTec system,Hal is responsible for our ETC productand several other system and electronicinitiatives.
INT
RO
DU
CT
ION
S

INVESTING IN ICAPRon Purpora

21
AMERICAN SECURITIES MARKETS
• Core Divisions• Treasury Products
• Mortgage Securities
• Federal Agency Issues
• Corporate Products including– Corporate Bonds
– Emerging Markets
– Credit Derivatives
– Equity and related
INT
RO
DU
CT
ION

22
AMERICAN SECURITIES MARKETS
• 350 Brokers servicing
• Voice and Electronic Capabilities
• Market leading positions in all coredivisions
• 67% revenue increase from fiscal 2001to fiscal 2003
INT
RO
DU
CT
ION

23
OVERVIEW – RECENT EVENTS
• Cemented dominance in CorporateBonds with First Brokers purchase
• Expanded Credit Derivatives group
• Rolled out new technologies to exploitSTP capabilities across products
• Historically strong performancesrelated to overall growth in FixedIncome arena
OV
ER
VIE
W

24
TREASURIES - HYBRID BROKING
41%
44%
11%1% 3%
ICAP-BTEC
E-Speed
TTL
Maxcor
Hill
Source: Federal Reserve Bank of New York Data, ICAP estimates
MA
RK
ET
S
Estimated Market Share – US Treasury Trading
25
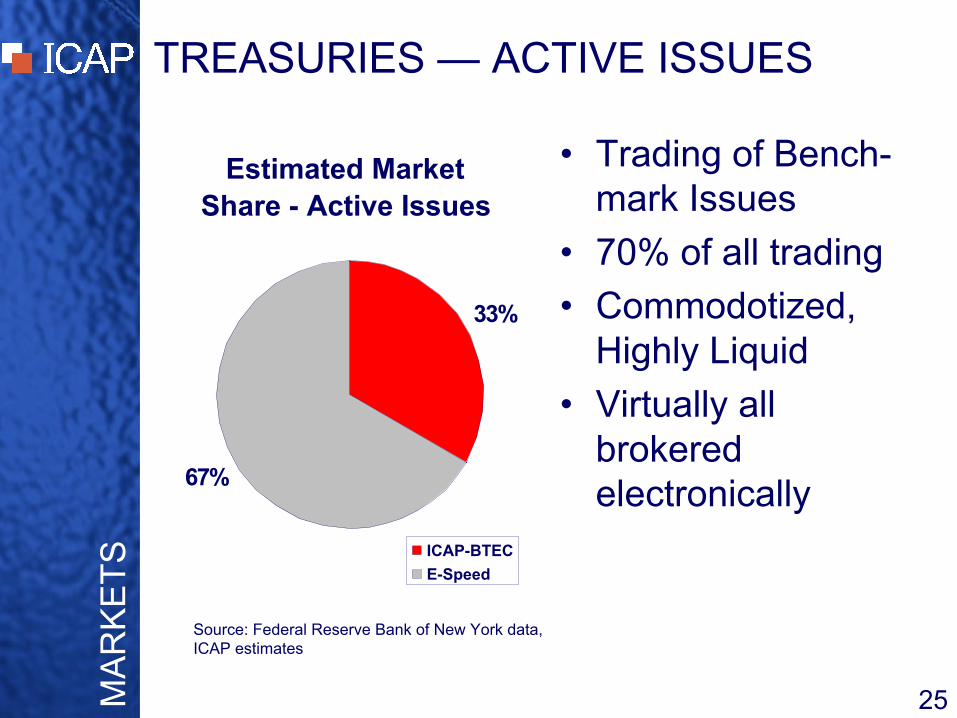
TREASURIES — ACTIVE ISSUES
Estimated Market Share - Active Issues
33%
67%
ICAP-BTEC
E-Speed
• Trading of Bench-mark Issues
• 70% of all trading
• Commodotized,Highly Liquid
• Virtually allbrokeredelectronically
Source: Federal Reserve Bank of New York data,ICAP estimates
MA
RK
ET
S
26
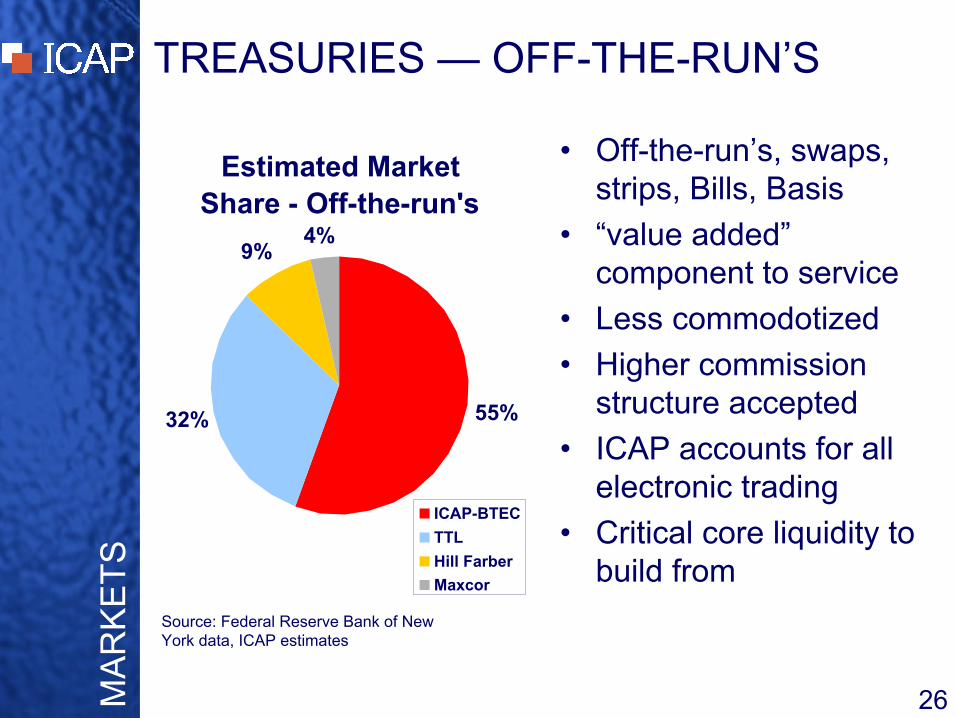
TREASURIES — OFF-THE-RUN’S
Estimated Market Share - Off-the-run's
55%32%
9%4%
ICAP-BTEC
TTL
Hill Farber
Maxcor
• Off-the-run’s, swaps,strips, Bills, Basis
• “value added”component to service
• Less commodotized
• Higher commissionstructure accepted
• ICAP accounts for allelectronic trading
• Critical core liquidity tobuild from
Source: Federal Reserve Bank of NewYork data, ICAP estimates
MA
RK
ET
S

27
Average Daily Volume US Treasury Securities
1994 1995 1996 1997 1998 1999 2000 2001 2002 2003
source: Federal Reserve Bank of New York
TREASURIES - PERFORMANCEM
AR
KE
TS

28
MORTGAGE SECURITIES
• ICAP has strongest presence acrossproduct base- TBA Collateral market
- Specified Pools
- Collateralized Mortgage Obligations
- ARM’s, ABS and Commercials
• 36 Brokers servicing these products
• Strong operating margin
MA
RK
ET
S
29
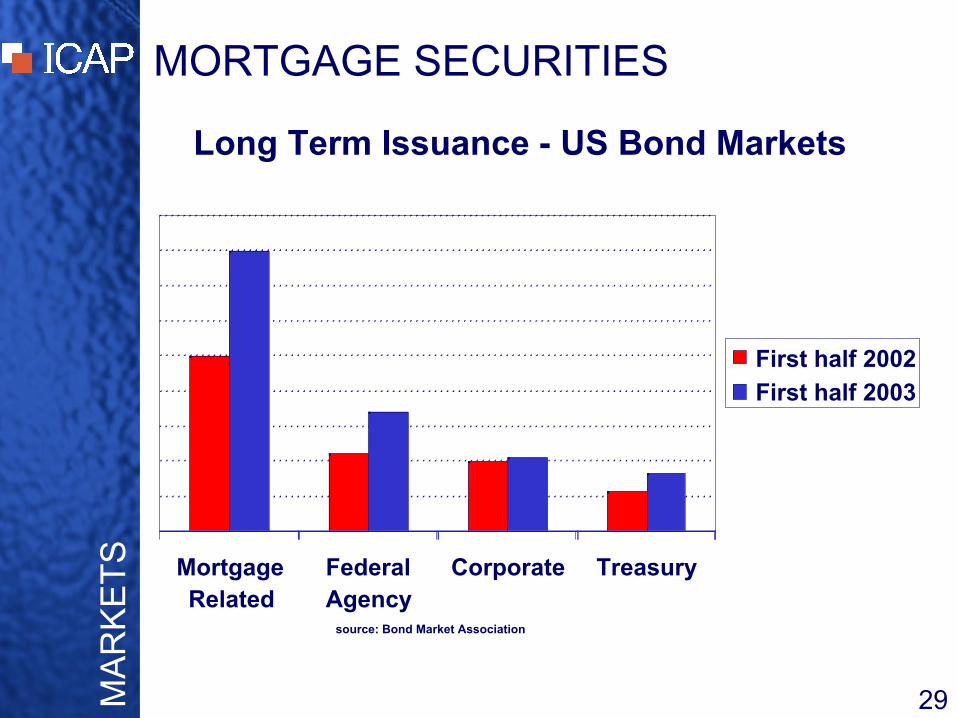
MORTGAGE SECURITIES
MortgageRelated
FederalAgency
Corporate Treasury
source: Bond Market Association
First half 2002
First half 2003
MA
RK
ET
SLong Term Issuance - US Bond Markets
30
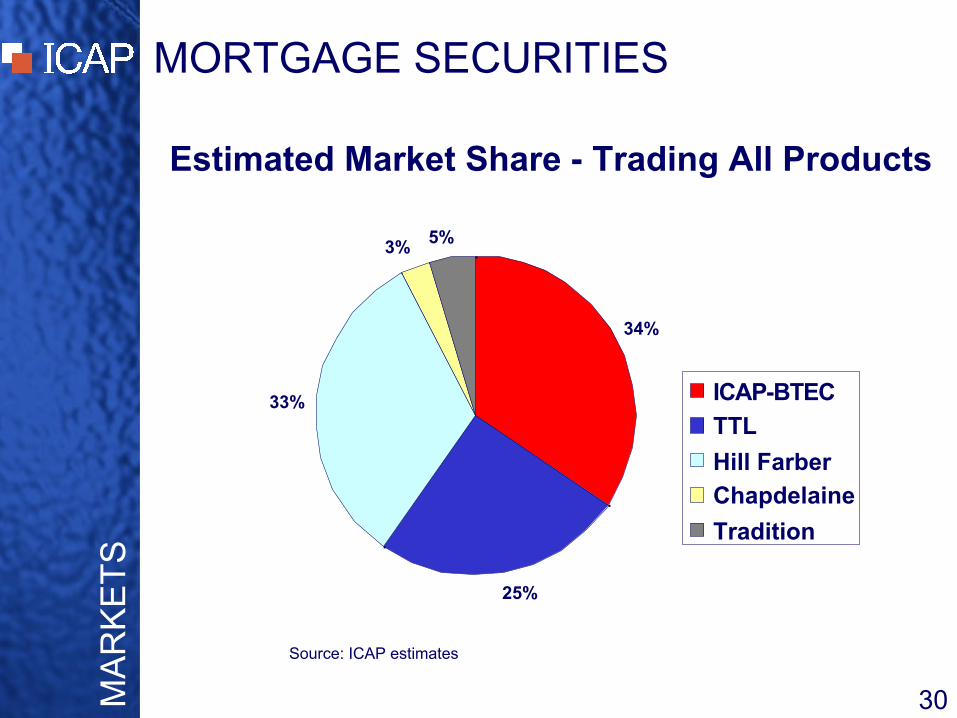
MORTGAGE SECURITIES
34%
25%
33%
3%5%
ICAP-BTEC
TTL
Hill Farber
Chapdelaine
Tradition
Source: ICAP estimates
MA
RK
ET
SEstimated Market Share - Trading All Products

31
MORTGAGE SECURITIES
• Electronic participation
• Trading volumes up strongly- Explosion in refinancing activity
- Unprecedented market volatility
• Offer full suite of mortgage products
MA
RK
ET
S
32
AGENCY ISSUES
• Government Sponsored Enterprises –FNMA and FHLMC-Notes and bonds
-Callables
• Staff of 30 brokers offering screen-based voice execution
• ICAP is by far the leading broker-Voice capabilities
-Electronic capabilities
MA
RK
ET
S

33
AGENCY ISSUES
71%
23%
5% 1%
ICAP-BTEC
TTL
Maxcor
Tradition
Source: Federal Reserve Bank of New York data, ICAP estimates
MA
RK
ET
S
Estimated Market Share – Agency Trading
34
CORPORATE PRODUCTS
• With Acquisition of First Brokersestablished dominance in this sector
• Traded in a voice environment
• Staff of 176 Brokers
• High technology deployment- Straight Through Processing Initiatives
- Regulatory Requirements
- Market data dissemination
MA
RK
ET
S
35
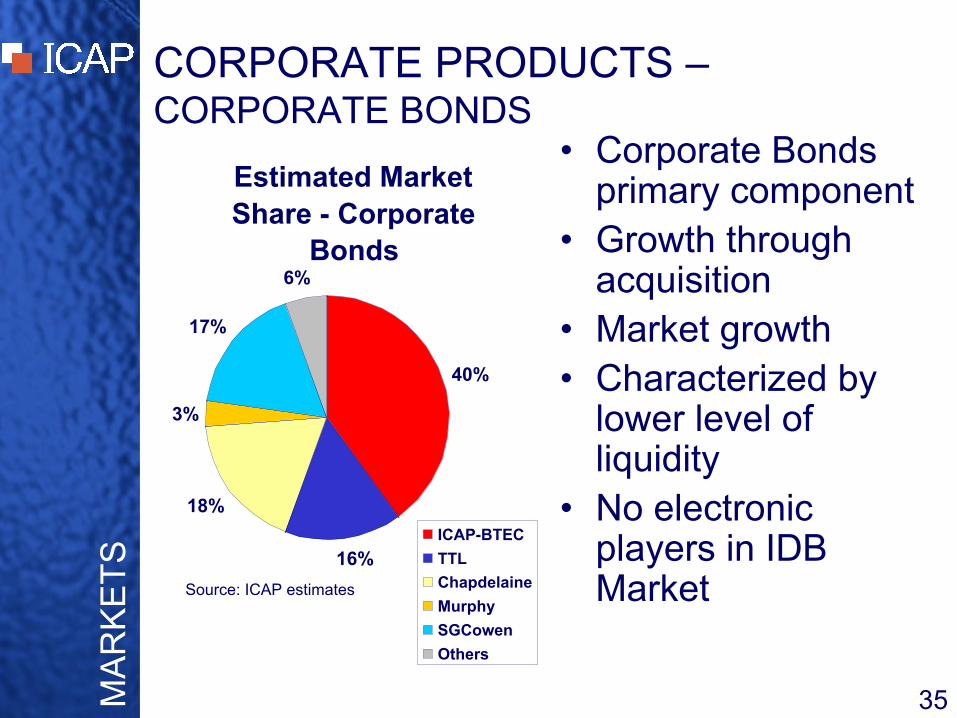
CORPORATE PRODUCTS –CORPORATE BONDS
Estimated Market Share - Corporate
Bonds
40%
16%
18%
3%
17%
6%
ICAP-BTEC
TTL
Chapdelaine
Murphy
SGCowen
Others
• Corporate Bondsprimary component
• Growth throughacquisition
• Market growth• Characterized by
lower level ofliquidity
• No electronicplayers in IDBMarketSource: ICAP estimates
MA
RK
ET
S

36
CORPORATE PRODUCTSMARKET EXTENSION
• Developments-Credit Derivatives
• High growth area +275% year on year
• Rapidly attained a top position
• Strong Margins
-Equities• Direct Access Unit
• NYSE seat holder
• Equity Derivatives
• Institutional Equity Brokerage
MA
RK
ET
S

37
MARKET BREADTH
• Treasury Products• A Market leader - +40% share
• Hybrid brokerage
• Agency Issues• Dominant share in voice and electronic brokerage
• 70% market share
• Mortgage Securities• Market leader - +30% share
• Full suite of mortgage products
• Corporate Products• Dominant broker of corporate bonds
• 40% market share
SU
MM
AR
Y

INVESTING IN ICAPDoug Rhoten

39
CAPITAL MARKETS INTRODUCTION
• Money Market• Foreign Exchange
- Spot- Forwards- NDF’s
• Derivatives• Canadian Products• Emerging Market Derivatives• Repurchase Agreements• Energy• Latin America
INT
RO
DU
CT
ION

40
VOTED TOP BROKER IN…
Source: Risk Magazine; Global Derivatives Rankings, September 2003
Short-Dated IRS Exotic Interest Rate ProductsUS Dollar Volatility/Variance SwapsJapanese Yen Constant Maturity - US DollarEuro Bermudan/American - EuroSterling (jointly with Prebon) Bermudan/American - US Dollar
QuantosIRS 2-10 years Inflation Swaps - Eurozone US Dollar Inflation Swaps - North AmericaJapanese YenEuro Cross Currency Swaps
Sterling Euro/US Dollar (jointly with Tullett)Euro/Japense Yen
IRS 10 years + Sterling/US DollarUS Dollar Euro/SterlingEuro US Dollar/Swiss France (jointly with Tullett)Sterling Dollar/Norwegian Krone (jointly with Tullett)Canadian DollarAustralian Dollar Overnight Index Swaps
US DollarInterest Rate Caps/Floors EuroUS Dollar Danish KroneEuroSterling Repo
Canadian Dollar US DollarAustralian Dollar Euro
SterlingInterest Rate Swaptions Canadian Dollar
EuroSterling FRA's
Canadian Dollar EuroAustralian Dollar Japanese YenNorwegian Krone Danish Krone

41Source: Risk Magazine; Global Derivatives Rankings, September 2003
ICAP:Credit Derivatives Currency Forwards Vanilla Default Swaps US Dollar/Canadian DollarInvestment Grade Asia US Dollar/Danish KroneHigh Yield AsiaEmerging Markets - East Europe
TFS-ICAP:Vanilla Currency Options Exotic Currency Options Euro/US Dollar Euro/US Dollar BarrierEuro/Japanese Yen US Dollar/Yen BarrierUS Dollar/Swiss Franc Sterling/US Dollar BarrierUS Dollar/Canadian Dollar (jointly with GFI) Other BarrierUS Dollar/Australian Dollar Binary/DigitalUS Dollar/Swedish Krona HybridsUS Dollar/Danish Krone Long-datedUS Dollar/Emerging Mkts Europe Average RateUS Dollar/Emerging Mkts Americas
VOTED TOP BROKER IN…
42
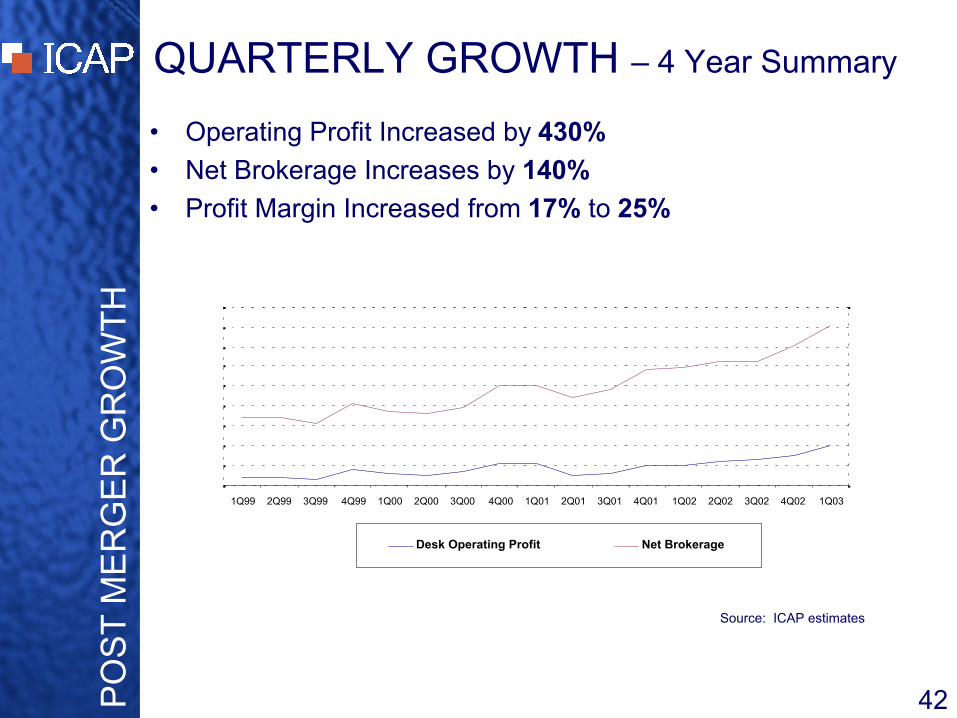
QUARTERLY GROWTH – 4 Year Summary
1Q99 2Q99 3Q99 4Q99 1Q00 2Q00 3Q00 4Q00 1Q01 2Q01 3Q01 4Q01 1Q02 2Q02 3Q02 4Q02 1Q03
Desk Operating Profit Net Brokerage
• Operating Profit Increased by 430%
• Net Brokerage Increases by 140%
• Profit Margin Increased from 17% to 25%
PO
ST
ME
RG
ER
GR
OW
TH
Source: ICAP estimates

43
OTC BUSINESS MODEL
• Premiere Brokers
• Production Management
• Build and Consolidate Voice Liquidity
• Integrate Technology
• Create Indices and Distribute Data
• Pursue Partnerships With IndustryLeaders

44
MANAGEMENT
• Flat Management Structure
• Unmatched Product Knowledge
• Long Term Tenure
• Broker Loyalty
• Customer-centric Approach
OT
C B
US
INE
SS
MO
DE
L

45
BUILD VERBAL LIQUIDITY
• Market Share Goal: 35%
• Product Specialization
• Continued Expansion
• Customers Help Drive Process
OT
C B
US
INE
SS
MO
DE
L

46
COMPLEMENTARY TECHNOLOGY
• Pre-trade pricing and analytics
• Straight Through Processing
• Electronic trading capabilities
OT
C B
US
INE
SS
MO
DE
L

47
CREATING INDICES
• 19900 Telerate
• ISDA Swapfix
• Fed Funds (Telerate page 5)
• SwapPX
• GovPX
OT
C B
US
INE
SS
MO
DE
L

48
PARTNERSHIPS
• STP- Swapswire- Financial Oxygen
• Expansion- Mexican, Chilean, Peruvian & ColumbianStock Exchanges- GovPX- Shorcan
• Market Practices- ISDA Swapfix
OT
C B
US
INE
SS
MO
DE
L

49
OTC BUSINESS MODEL
• Production Management
• Build and Consolidate Voice Liquidity
• Integrate Technology
• Create Indices and Distribute Data
• Pursue Partnerships With IndustryLeaders

50
$ INTEREST RATE DERIVATIVES• Market Share – 40%
- Rank #1
• Benchmark Index- Telerate 19900- SwapPX- ISDA Swapfix
• Technology- FRACross- Swapswire STP- CAS- Datatec- I-Swap
• Partnership- Swapswire- ISDA- NumeriX- Tri-Optima- GovPX
Prebon15%
Tullett25%
ICAP40%
Others20%
MA
RK
ET
SH
AR
E &
OV
ER
VIE
W

51
MONEY MARKET
• Market Share – 35%- Rank #1
• Technology- Bank Oxygen
• Benchmark Index- Telerate page 5
• Partnership- Financial Oxygen(Chase & BOA)
MA
RK
ET
SH
AR
E &
OV
ER
VIE
WEurobrokers
15%
Prebon20%
Tradition22%
ICAP35%
Tullett8%

52
REPURCHASE AGREEMENTS
• Market Share – 54%- Rank #1- $750+ Billion per day
turnover
• Technology- BrokerTec/ETC
• “Franchise” approach- Extend capital and
technologyinfrastructure
• 3 Voice BrokerageDesks
MA
RK
ET
SH
AR
E &
OV
ER
VIE
W
TTL7%
Tradition7%
Maxcor7%
Prebon
25%
ICAP-
BTEC54%
53
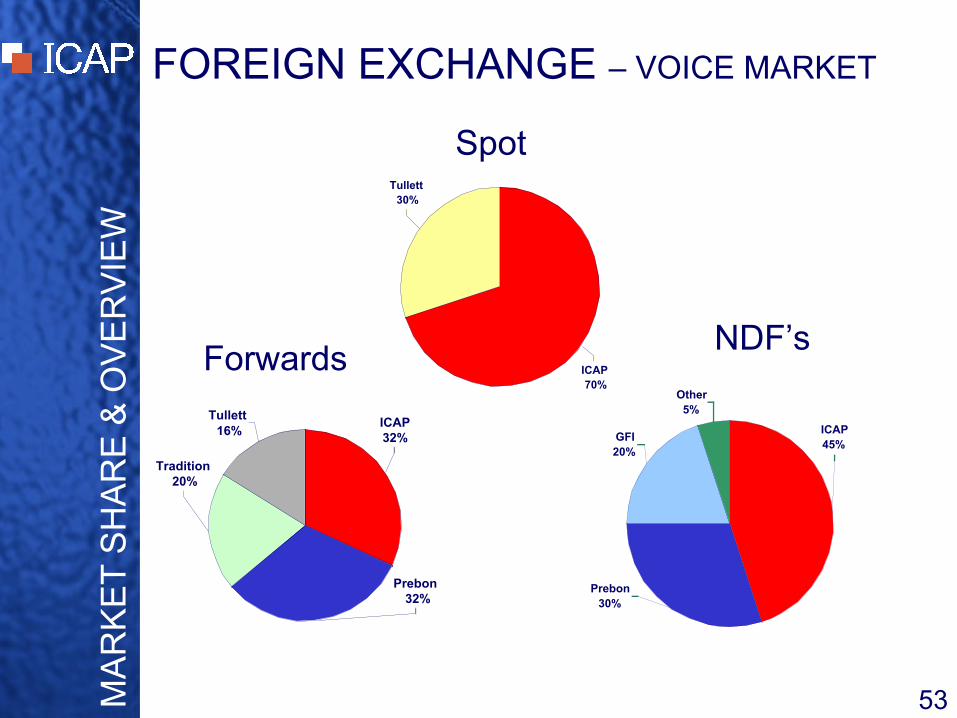
FOREIGN EXCHANGE – VOICE MARKET
ICAP32%
Prebon32%
Tullett16%
Tradition20%
ICAP45%
Prebon30%
GFI20%
Other5%
Tullett30%
ICAP70%
MA
RK
ET
SH
AR
E &
OV
ER
VIE
W
ForwardsNDF’s
Spot
54
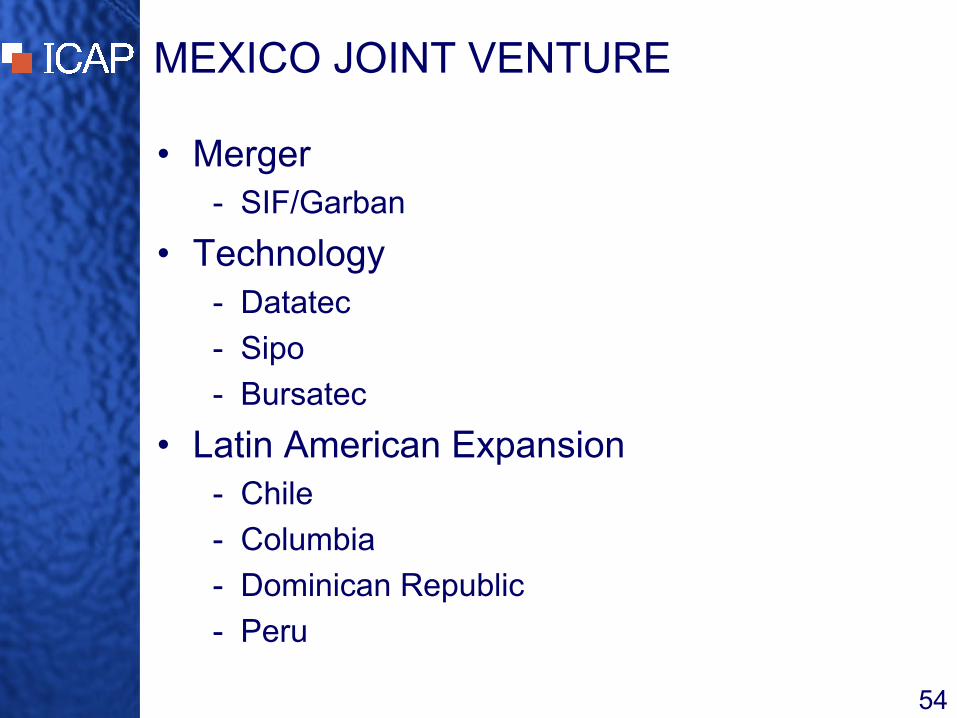
MEXICO JOINT VENTURE
• Merger- SIF/Garban
• Technology- Datatec
- Sipo
- Bursatec
• Latin American Expansion- Chile
- Columbia
- Dominican Republic
- Peru

55
ENERGY
Prebon13%
Others31%
ICAP21%
Amerex24%
GFI11%
Prebon16%
Amerex20%
Others35%
ICAP16%
ICE13%
MA
RK
ET
SH
AR
E &
OV
ER
VIE
W
• APB Energy Acquisition- October 2002
• Technology- Datatec/ETC
• Benchmark Index- Under NDA
• Partnership- TBD
Natural GasElectricity

56
EMERGING MARKET DERIVATIVES
ICAP30%
GFI23%
Prebon23%
Local Brokers
24%
• Market Share – 30%- Rank #1
• Technology- Datatec
- CAS
- Kalahari
- Mavis
• Partnership- TBD
MA
RK
ET
SH
AR
E &
OV
ER
VIE
W

57
OTC CANADIAN PRODUCTS
• Market Share – 40%- Rank #1
• Technology- Datatec
- CAS
- BrokerTec/ETC
• Benchmark Index- Telerate 19900
• Partnership- Shorcan
Prebon15%
Tradition22%
ICAP40%
Other5%
Tullett18%
MA
RK
ET
SH
AR
E &
OV
ER
VIE
W

58
OTHER INITIATIVES
• Wembley Asset Management
• Wrightson
• Pari-mutual Derivatives
• Mortgage Prepayments
• Whole Loan Broking
• Broader Energy Market
INIT
IAT
IVE
S

59
CLOSING
What differentiates us from ourcompetitors-Highest Quality Brokers
-Production Management
-Specialized Structure
-Constant Customer Contact
-Leverage Complimentary Technologies
-Customer Responsiveness
-Commitment to Growth
INVESTING IN ICAPICAP E-Broking / E-Markets
Hal Hinkle

OVERVIEW
• Overview-BrokerTec
-ICAP E-Broking• Product Comparison• Cross Connect• Revenue Commitment Agreements• Hybrid Brokering

• 3 year old global platform
• 184 Customers worldwide
• Executed 6.8 million sides
• Executed $94.1 trillion in single count volume
• 99+% STP
WHAT IS BROKERTEC? -SNAPSHOT

+
WHAT IS ICAP E-BROKING? – BEFOREMERGER
•3.
•E-Markets
•PlatformProvider
•2.
•VoiceSupport +
Development
•1.
•HybridCustomer
Broker
•Pure Customer
•E-Broking
•99+ % Central Clearing
•(fully electronic)
ETCBTEC US / EU

•Third PartyProvisions
•VoiceSupport andDevelopment
Voice - Third Party
WHAT IS ICAP E-BROKING? – AFTERMERGER
Customer E-Broking
US EU and Asia

PRIMARY ELECTRONIC COMPETITORS
EU
Wholesale
US / EU
Retail
Global
Wholesale andRetail
Global
WholesaleFootprint
Request ForQuote
UST
Money Markets
TradeWeb MTSESPDBTEC
MatchingMatchingMatchingPlatform
Euro-Govs
Italian RepoUST
UST
US Repo
US Agencies
US Repo
PrincipalProduct

WHO IS THE ELECTRONICCOMPETITION?
400 connections1,400+700+184Customers
8
$28.2 trillion
US: 14.5 hours
Europe: 8.5hours
TradeWeb MTSESPDBTEC
100+319115Total Employees
$94.4 million$76.8 millionTotal Expenses(2002)
$60 million – est.$126 million$97.3 millionTotal Revenue(2002) 2
13 systems1226Total Products
40 trillion
$47.8 trillion(fully electronic)
$77.8 trillion(total electronic)
$81.7 trillion
(fully electronic)Total Volume 1
Cash: 10 hours
Repo: 11.5 hours23 hours23 hours
Operating Hours
2 ESPD’s 2002 revenues exclude a one-time business interruption insurance gain. Expenses exclude non-cashbusiness partner activities.
1 BTec and ESPD as of 06/03; TradeWeb – public statement 7/7/03; MTS– company estimates as of 6/03.
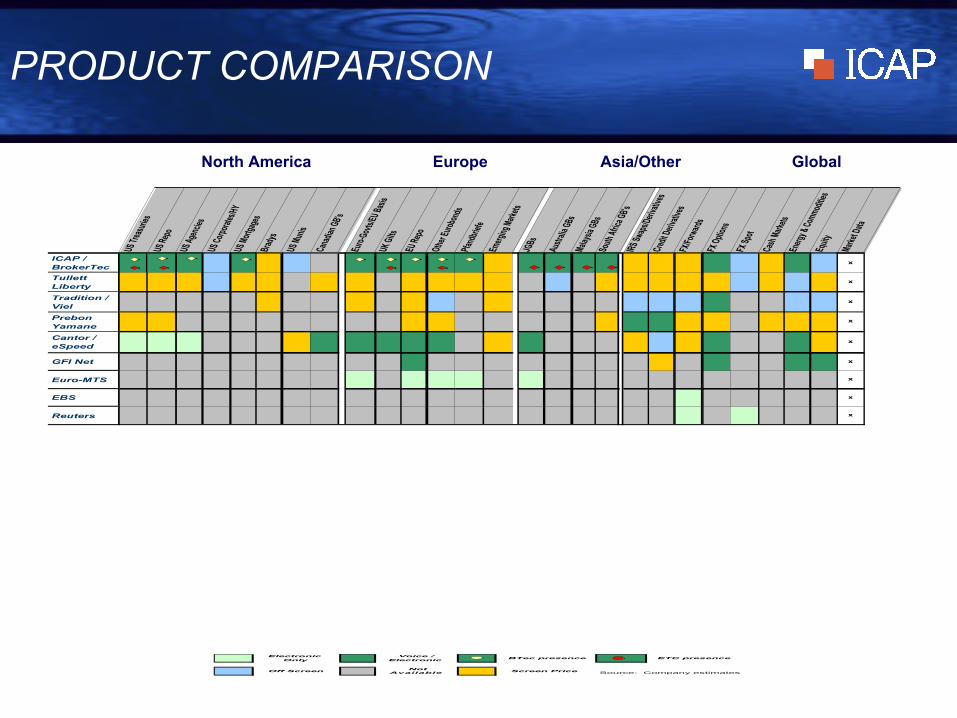
North America Europe Asia/Other Global
PRODUCT COMPARISONUS
Trea
surie
sUS
Repo
US Ag
encie
sUS
Corpo
rates
/HYUS
Mort
gage
sBr
adys
US M
unis
Cana
dian G
B's
Euro-
Govts
/EU Ba
sisUK
Gilts
EU Re
po
Othe
r Euro
bond
sPfa
ndbri
efeEm
erging
Mark
etsJG
Bs
Austr
alia G
BsMa
laysia
GBs
South
Afric
a GB's
IRS Sw
aps/D
eriva
tives
Cred
it Deri
vativ
esFX
/Forw
ards
FX O
ption
s
FX Sp
ot
Cash
Mark
etsEn
ergy &
Commod
ities
Equit
y
Marke
t Data
ICAP / BrokerTec
x
Tullett Liberty
x
Tradition / Viel
x
Prebon Yamane
x
Cantor / eSpeed
x
GFI Net x
Euro-MTS x
EBS x
Reuters x
Electronic Only
Voice / Electronic
BTec presence ETC presence
Off Screen Not
Available Screen Price Source: Company estimates

PRODUCT COMPARISON – NORTHAMERICA
North America
US
T
US
Rep
o
US
Age
ncie
s
US
Cor
ps/H
Y
US
Mor
tgag
es
Bra
dys
US
Mun
is
Can
adia
n G
B's
ICAP / BrokerTec
Cantor / eSpeed
Euro-MTS
Electronic Only
Voice / Electronic
BTec presence ETC presence
Off Screen Not
AvailableScreen Price Source: Company estimates

PRODUCT COMPARISON – EUROPE
Europe
Eur
o-G
ovs/
EU
Bas
is
UK
Gilt
s
EU
Rep
o
Oth
er E
urob
onds
Pfa
ndbr
iefe
Em
ergi
ng M
arke
ts
ICAP / BrokerTec
Cantor / eSpeed
Euro-MTS
Electronic Only
Voice / Electronic
BTec presence ETC presence
Off Screen Not
AvailableScreen Price Source: Company estimates

PRODUCT COMPARISON– ASIA / OTHER / GLOBAL
Asia/Other GlobalJG
Bs
Austr
alia G
Bs
Malay
sia G
Bs
South
Afric
a GB's
IRS Sw
aps/D
eriva
tives
Cred
it Deri
vative
s
FX/Fo
rward
s
FX O
ption
s
FX Sp
ot
Cash
Mark
ets
Energ
y / Co
mmod
ities
Equit
y
Marke
t Data
ICAP / BrokerTec
x
Cantor / eSpeed
x
Euro-MTS x
Electronic Only
Voice / Electronic
BTec presence ETC presence
Off Screen Not
AvailableScreen Price Source: Company estimates
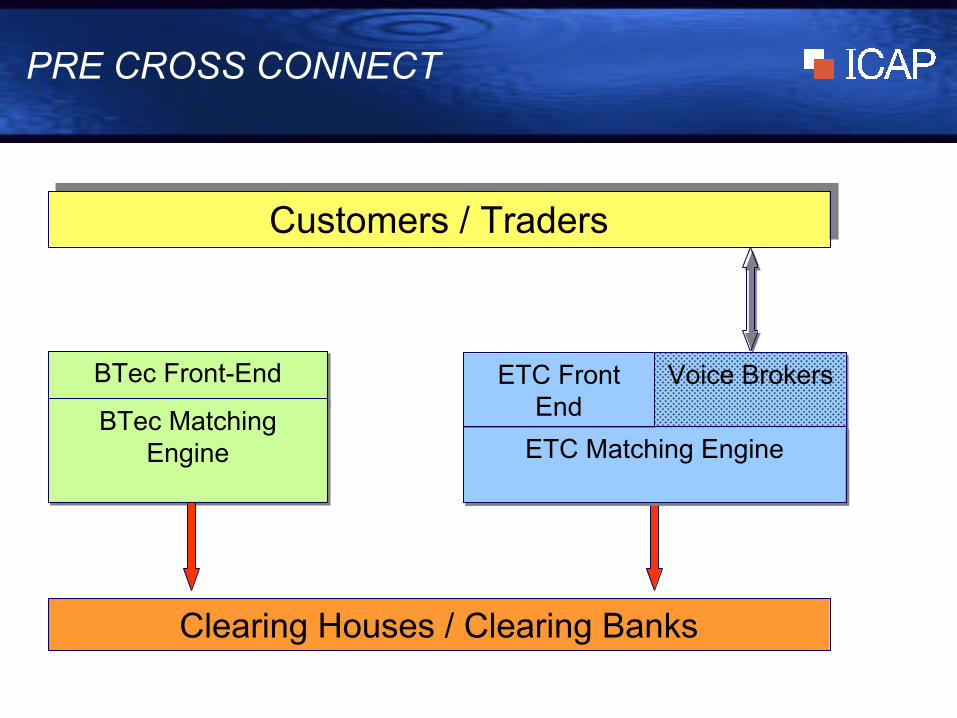
PRE CROSS CONNECT
Customers / TradersCustomers / Traders
BTec Front-EndBTec Front-End
BTec MatchingEngine
BTec MatchingEngine
ETC FrontEnd
ETC FrontEnd
Clearing Houses / Clearing BanksClearing Houses / Clearing Banks
Voice BrokersVoice Brokers
ETC Matching EngineETC Matching Engine

CROSS CONNECT
Customers / TradersCustomers / Traders
BTec Front-EndBTec Front-End
BTec MatchingEngine
BTec MatchingEngine
ETC Front
End
ETC Front
End
Clearing Houses / Clearing BanksClearing Houses / Clearing Banks
Voice
Brokers
Voice
Brokers
ETC MatchingEngine
ETC MatchingEngine

• 13 RCA Customers
• 8 Customers at $4 million floor / $5.5 millioncap
• Started June 2003
• Expect to Use “Cumulative” Accounting
REVENUE COMMISSION AGREEMENTS

HYBRID BROKING
• Voice and/or electronic access to a common pool ofliquidity
• Give customers choice between-Value-added voice support-Efficient and economical electronic option
• Provide incentives to existing voice desks to buildbalance between voice and electronic support
HYBRID BUSINESS APPROACH
• Team Manage Construction of Hybrid Business –Product Specific
• Use Flexible Broker Incentives/Transfers
• Balance Customer – Broker Transparency Needs
• Build Relationship Team from Best Voice andElectronic Coverage

CURRENT AGENDA
• Continue Implementing Cross Connect Technology
• Extend Hybrid Business Model
• Rationalize Technology and Operations
• Relocate Offices – July to December 2003
• Consolidate Corporate Administration and
Infrastructure

INVESTING IN ICAPJim Pettigrew

79
REVENUE GROWTH
0
200
400
600
800
2001 2002 2003
Headline CAGR 19%
Ex-acquisitions CAGR 10%
£m
FIN
AN
CE

80
INCREASING OPERATING MARGINS
10
12
14
16
18
20
2001 2002 2003
%
14%
15%
17%
FIN
AN
CE

81
MARGINS BY SEGMENTS
Year ended Year ended
31/03/03
31/03/02
Activity Securities broking 14% 11%
Derivatives and money broking 18% 20%
Geographic region
Americas 12% 8%
Europe 20% 19%
Asia Pacific 6% 11%
Note: Operating profit margin is profit before interest and exceptional items but after goodwill amortisation for the Group’s continuing operations.
FIN
AN
CE

82
COST CONTROL DISCIPLINE
Broker Rem.
T&E
Telecoms
Other
Overheads
Profit*0
10
20
30
40
50
60
70
80
90
100
2002 2003
Fixed Variable
Classification as a % of turnover Broker remuneration variable/fixed
* Group operating profit.
%of total broker remuneration
%
54464
1517
FIN
AN
CE

83
EPS AND DIVIDEND GROWTH
0
20
40
60
80
100
2001 2002 2003
Pence PerShare
EPS adjusted(excludesgoodwill andexceptionals).
Dividend pershare.
49.4p
77.3p
30p
20p
58.0p
24p
FIN
AN
CE

84
EFFICIENT PROFIT/CASHCONVERSION
0
20
40
60
80
100
120
140
2002 2003
* Before goodwill amortisation and exceptional items.
£m
103%
125%
Group operatingprofit*.
Cash inflowfrom operatingactivities.
FIN
AN
CE

85
CASHFLOW Year ended
31/03/03 £’m
Operating Profit 113 Depreciation 16
Working Capital 13
142
Net Capex (16)
Associates, JVs, interest and Other 6
Taxation (36)
96
Dividends (27)
Acquisitions/Investments (36)
Exceptional Items (14)
Change in Net Cas h and Investments 19
FIN
AN
CE

86
BALANCE SHEET (EXTRACT)
Year ended Year ended
31/03/03 £’m
31/03/02 £’m
Net Assets 263 196
Net Cash & Investments 185 166
FIN
AN
CE

87
THE 2003/2004 FINANCIAL YEAR
“The financial priorities for theforthcoming year are to integratesatisfactorily the BrokerTecacquisition and to increase our profitmargins through a combination ofgrowth in market share and effectivecost control. We plan to achieve thisagainst a continuing background ofstrong cash managementdisciplines.”
CFO report in ICAP’s 2003 Annual Report
FIN
AN
CE

INVESTING IN ICAPMichael Spencer

89
STRATEGY• Consolidation in the interdealer broking industry
continues in both the voice and electronic markets.
• Growth from building market share organically and,where appropriate, through selective acquisition
• Developing and delivering technology to makecross market trading possible. ICAP’s liquidity in abroad range of benchmark derivative and cashmarkets provide a significant competitive advantage
• Enlarging ICAP’s available market making it moreeconomic for banks to trade through us than direct
• Integration between ICAP’s networks and systemsand our customers’ networks and systems createsa pipeline for our products and services. Otherbrokers will find this is difficult and slow to replicate
OU
TLO
OK
90
• A unique combination: the world’s leading voiceand electronic broker
• Continue growing market share (both voice andelectronic) organically and through selectiveacquisition
• Further integration of BrokerTec with roll out of
Cross Connect
• Uncertainty in the global financial markets is likely
to continue and trading can be expected to remain
active.
OUTLOOKO
UT
LOO
K