Investing in global companies for the long term
348
American Funds Insurance Series ® Semi-annual report for the six months ended June 30, 2021 Investing in global companies for the long term
Transcript of Investing in global companies for the long term

American Funds Insurance Series®
Semi-annual reportfor the six months endedJune 30, 2021
Investing in global companies for the long term

American Funds Insurance Series, by Capital Group, is the underlying investment vehicle for many variable annuities and insurance products. For 90 years, Capital Group has invested with a long-term focus based on thorough research and attention to risk.
Investing for short periods makes losses more likely. For current information and month-end results, visit capitalgroup.com/afis. For information about your insurance contract and month-end results, go to the website of the company that issued your contract.
Investing outside the United States involves risks, such as currency fluctuations, periods of illiquidity and price volatility, as more fully described in the prospectus. These risks may be heightened in connection with investments in developing countries. Investing in small-capitalization stocks can involve greater risk than is customarily associated with investing in stocks of larger, more established companies. The return of principal for bond funds and for funds with significant underlying bond holdings is not guaranteed. Fund shares are subject to the same interest rate, inflation and credit risks associated with the underlying bond holdings. High-yield bonds are subject to greater fluctuations in value and risk of loss of income and principal than investment-grade bonds. Bond ratings, which typically range from AAA/Aaa (highest) to D (lowest), are assigned by credit rating agencies such as Standard & Poor’s, Moody’s and/or Fitch as an indication of an issuer’s creditworthiness. Hedge instruments, including exchange-traded futures contracts and exchange-traded put options, may not provide an effective hedge of the underlying securities because changes in the prices of such instruments may not track those of the securities they are intended to hedge. In addition, the managed risk strategy may not effectively protect the funds from market declines and will limit the funds’ participation in market gains. The use of the managed risk strategy could cause the funds’ returns to lag those of the applicable underlying funds in certain rising market conditions. Refer to the funds’ prospectuses and the Risk Factors section of this report for more information on these and other risks associated with investing in the funds.
Investments are not FDIC-insured, nor are they deposits of or guaranteed by a bank or any other entity, so they may lose value.

American Funds Insurance Series 1
Fellow investors:
Results for the American Funds Insurance Series for the periods ended June 30, 2021, are shown on the following pages, as well as results of the funds’ benchmarks.
For additional information about the series, its investment results, holdings and portfolio managers, visit capitalgroup.com/afis. You can also access information about Capital Group’s American Funds and read our insights about the markets, retirement, saving for college, investing fundamentals and more at capitalgroup.com.
Contents
1 Letter to investors
2 Results at a glance
Investment portfolios
28 Global Growth Fund
33 Global Small Capitalization Fund
41 Growth Fund
48 International Fund
53 New World Fund®
66 Washington Mutual Investors Fund
71 Capital World Growth and Income Fund®
80 Growth-Income Fund
86 International Growth and Income Fund
90 Capital Income Builder®
104 Asset Allocation Fund
134 Global Balanced Fund
147 The Bond Fund of America®
169 Capital World Bond Fund®
191 American High-Income Trust®
210 American Funds Mortgage Fund®
217 Ultra-Short Bond Fund
219 U.S. Government Securities Fund®
227 Managed Risk Growth Fund
229 Managed Risk International Fund
231 Managed Risk Washington Mutual Investors Fund
233 Managed Risk Growth-Income Fund
235 Managed Risk Asset Allocation Fund
237 Financial statements

2 American Funds Insurance Series
Results at a glanceFor periods ended June 30, 2021, with all distributions reinvested Inception Cumulative total returns Average annual total returns
Class 1 shares date 6 months 1 year 5 years 10 years Lifetime
Global Growth Fund 4/30/97 11.76% 40.24% 19.97% 13.82% 11.29%MSCI All Country World Index (ACWI)1 12.30 39.26 14.61 9.90 7.24
Global Small Capitalization Fund 4/30/98 10.86 48.91 18.03 10.77 10.78MSCI All Country World Small Cap Index1 15.43 54.07 14.13 9.90 8.67
Growth Fund 2/8/84 13.03 53.72 25.84 17.88 14.02Standard & Poor’s 500 Composite Index2 15.25 40.79 17.65 14.84 11.89
International Fund 5/1/90 4.71 34.76 12.27 6.96 8.42MSCI All Country World Index (ACWI) ex USA1 9.16 35.72 11.08 5.45 6.19
New World Fund 6/17/99 10.21 42.32 15.30 7.72 9.42MSCI All Country World Index (ACWI)1 12.30 39.26 14.61 9.90 6.07
Washington Mutual Investors Fund 7/5/01 15.14 36.86 12.16 12.34 7.40Standard & Poor’s 500 Composite Index2 15.25 40.79 17.65 14.84 8.64
Capital World Growth and Income Fund 5/1/06 10.06 34.95 13.80 10.54 8.08MSCI All Country World Index (ACWI)1 12.30 39.26 14.61 9.90 7.22
Growth-Income Fund 2/8/84 14.30 34.96 16.56 14.03 11.76Standard & Poor’s 500 Composite Index2 15.25 40.79 17.65 14.84 11.89
International Growth and Income Fund 11/18/08 7.20 34.10 9.45 6.04 9.29MSCI All Country World Index (ACWI) ex USA1 9.16 35.72 11.08 5.45 9.20
Capital Income Builder 5/1/14 9.85 22.58 7.22 — 5.6070%/30% MSCI ACWI/Bloomberg Barclays U.S. Aggregate Index3 7.98 26.29 11.27 — 8.26 MSCI All Country World Index (ACWI)1 12.30 39.26 14.61 — 10.10Bloomberg Barclays U.S. Aggregate Index4 –1.60 –0.33 3.03 — 3.34
Asset Allocation Fund 8/1/89 10.22 26.09 12.00 10.67 8.9560%/40% S&P 500 Index/Bloomberg Barclays U.S. Aggregate Index5 8.28 23.02 11.89 10.39 8.92Standard & Poor’s 500 Composite Index2 15.25 40.79 17.65 14.84 10.55Bloomberg Barclays U.S. Aggregate Index4 –1.60 –0.33 3.03 3.39 5.81
Global Balanced Fund 5/2/11 6.10 20.72 10.11 7.57 7.1760%/40% MSCI ACWI/Bloomberg Barclays Global Aggregate Index6 5.89 23.58 9.80 6.92 6.55 MSCI All Country World Index (ACWI)1 12.30 39.26 14.61 9.90 9.30Bloomberg Barclays Global Aggregate Index4 –3.21 2.63 2.34 2.05 2.00
The Bond Fund of America 1/2/96 –0.67 2.45 3.91 3.84 4.80Bloomberg Barclays U.S. Aggregate Index4 –1.60 –0.33 3.03 3.39 4.99
Capital World Bond Fund 10/4/06 –3.20 4.41 3.07 2.52 4.10Bloomberg Barclays Global Aggregate Index4 –3.21 2.63 2.34 2.05 3.61
American High-Income Trust 2/8/84 6.62 21.11 8.13 6.02 8.72Bloomberg Barclays U.S. Corporate High Yield 2% Issuer Capped Index4 3.61 15.34 7.47 6.65 N/A
American Funds Mortgage Fund 5/2/11 –0.57 0.53 2.63 2.86 2.91Bloomberg Barclays U.S. Mortgage Backed Securities Index4 –0.77 –0.42 2.27 2.64 2.72
Ultra-Short Bond Fund 2/8/84 –0.18 –0.27 0.88 0.33 3.26Bloomberg Barclays Short-Term Government/Corporate Index4 0.11 0.25 1.47 0.90 N/A
U.S. Government Securities Fund 12/2/85 –1.31 –0.14 2.85 3.01 5.71Bloomberg Barclays U.S. Government/ Mortgage-Backed Securities Index4 –1.79 –2.01 2.25 2.72 6.07
Fund results shown are for past periods and are not predictive of results for future periods. Current and future results may be lower or higher than those shown. Share prices and returns will vary, so investors may lose money. Investing for short periods makes losses more likely. For current information and month-end results, visit capitalgroup.com/afis. For information about your insurance contract and month-end results, go to the website of the company that issued your contract.

American Funds Insurance Series 3
Inception Cumulative total returns Average annual total returns
Class P1 shares date 6 months 1 year 5 years Lifetime
Managed Risk Growth Fund 5/1/13 7.56% 31.22% 18.32% 12.84%S&P 500 Managed Risk Index — Moderate Aggressive7 10.54 21.82 11.49 10.17
Managed Risk International Fund 5/1/13 2.73 20.86 7.91 3.94S&P EPAC Ex. Korea LargeMidCap Managed Risk Index — Moderate Aggressive7 6.70 18.87 6.94 3.87
Managed Risk Washington Mutual Investors Fund 5/1/13 9.08 17.85 7.15 6.76S&P 500 Managed Risk Index — Moderate7 8.97 19.02 10.48 9.33
Managed Risk Growth-Income Fund 5/1/13 8.82 18.76 12.42 9.64S&P 500 Managed Risk Index — Moderate 7 8.97 19.02 10.48 9.33
Managed Risk Asset Allocation Fund 9/28/12 8.62 19.69 9.27 8.33S&P 500 Managed Risk Index — Moderate Conservative7 7.57 16.61 9.55 8.86The market indexes shown are unmanaged and, therefore, have no expenses. Investors cannot invest directly in an index.
Investment results assume all distributions are reinvested and refl ect applicable fees and expenses. When applicable, investment results refl ect fee waivers and/or expense reimbursements, without which results would have been lower. The investment adviser is currently waiving a portion of its management fee for New World Fund, Washington Mutual Investors Fund, Capital World Growth and Income Fund, Capital Income Builder, The Bond Fund of America, Capital World Bond Fund, American High-Income Trust, American Funds Mortgage Fund and U.S. Government Securities Fund. This waiver will be in effect through at least May 1, 2022. The waiver may only be modifi ed or terminated with the approval of the fund’s board. Visit capitalgroup.com/afi s for more information.
1Source: MSCI. Results for MSCI indexes refl ect dividends net of withholding taxes and reinvestment of distributions. MSCI All Country World Index is a free fl oat-adjusted market capitalization weighted index that is designed to measure equity market results in the global developed and emerging markets, consisting of more than 40 developed and emerging market country indexes. MSCI All Country World Small Cap Index is a free fl oat-adjusted market capitalization-weighted index that is designed to measure equity market results of smaller capitalization companies in both developed and emerging markets. MSCI All Country World ex USA Index is a free fl oat-adjusted market capitalization weighted index that is designed to measure equity market results in the global developed and emerging markets, excluding the United States. The index consists of more than 40 developed and emerging market country indexes.
2Source: S&P Dow Jones Indices LLC. S&P 500 Index is a market capitalization-weighted index based on the results of approximately 500 widely held common stocks.
3Sources: MSCI and Bloomberg Index Services Ltd. The 70%/30% MSCI ACWI/Bloomberg Barclays U.S. Aggregate Index blends the MSCI ACWI (All Country World Index) with the Bloomberg Barclays U.S. Aggregate Index by weighting their total returns at 70% and 30%, respectively. Its result assumes the blend is rebalanced monthly.
4Source: Bloomberg Index Services Ltd. Bloomberg Barclays U.S. Aggregate Index represents the U.S. investment-grade (rated BBB/Baa and above) fi xed-rate bond market. Bloomberg Barclays Global Aggregate Index represents the global investment-grade fi xed income markets. Bloomberg Barclays U.S. Mortgage Backed Securities Index is a market-value-weighted index that covers the mortgage-backed pass-through securities of Ginnie Mae (GNMA), Fannie Mae (FNMA), and Freddie Mac (FHLMC). Bloomberg Barclays U.S. Corporate High Yield 2% Issuer Capped Index covers the universe of fi xed-rate, non-investment-grade debt. The index limits the maximum exposure of any one issuer to 2%. Bloomberg Barclays U.S. Government/Mortgage-Backed Securities Index covers obligations issued by the U.S. Treasury and U.S. government agencies. Bloomberg Barclays Short-Term Government/Corporate Index consists of investment-grade, fi xed rate, publicly placed, dollar-denominated and non-convertible securities with remaining maturity from one up to (but not including) 12 months within either the government or corporate sector.
5Sources: Bloomberg Index Services Ltd. and S&P Dow Jones Indices LLC. Blends the S&P 500 with the Bloomberg Barclays U.S. Aggregate Index by weighting their total returns at 60% and 40%, respectively. Results assume the blend is rebalanced monthly.
6Sources: MSCI and Bloomberg Index Services Ltd. The 60%/40% MSCI ACWI/Bloomberg Barclays Global Aggregate Index blends the MSCI ACWI (All Country World Index) with the Bloomberg Barclays Global Aggregate Index by weighting their cumulative total returns at 60% and 40%, respectively. Its result assumes the blend is rebalanced monthly.
7Source: S&P Dow Jones Indices LLC. Standard & Poor’s Managed Risk Index Series is designed to simulate a dynamic protective portfolio that allocates between the underlying equity index and cash, based on realized volatilities of the underlying equity and bond indexes, while maintaining a fi xed allocation to the underlying bond index.

4 American Funds Insurance Series
About the series
Unless otherwise indicated, American Funds Insurance Series investment results are for Class 1 shares (Class P1 shares for managed risk funds). Class 1A shares began operations on January 6, 2017. Class 2 shares began operations on April 30, 1997. Class 3 shares began operations on January 16, 2004. Class 4 shares began operations on December 14, 2012. Results encompassing periods prior to those dates assume a hypothetical investment in Class 1 shares and include the deduction of additional annual expenses (0.25% for Class 1A shares, 0.25% for Class 2 shares, 0.18% for Class 3 shares and 0.50% for Class 4 shares).
The variable annuities and life insurance contracts that use the series funds contain certain fees and expenses not refl ected in this report. Investment results assume all distributions are reinvested and refl ect applicable fees and expenses. When applicable, investment results refl ect fee waivers and/or expense reimbursements, without which results would have been lower. The investment adviser is currently waiving a portion of its management fee for New World Fund, Washington Mutual Investors Fund (formerly Blue Chip Income and Growth Fund), Capital World Growth and Income Fund (formerly Global Growth and Income Fund), Capital Income Builder, The Bond Fund of America (formerly Bond Fund), Capital World Bond Fund, American High-Income Trust (formerly High-Income Bond Fund), American Funds Mortgage Fund and U.S. Government Securities Fund (formerly U.S. Government/AAA-Rated Securities Fund). These waivers will be in effect through at least May 1, 2022, and may only be modifi ed or terminated with the approval of the series board. Visit capitalgroup.com/afi s for more information.
For the managed risk funds, the investment adviser is currently waiving a portion of its management fee equal to 0.05% of each fund’s net assets. In addition, the investment adviser is currently reimbursing a portion of other expenses for Managed Risk International Fund and Managed Risk Washington Mutual Investors Fund. The waivers and reimbursements will be in effect through at least May 1, 2022, unless modifi ed or terminated by the series board. After that time, the investment adviser may elect to extend, modify or terminate the reimbursements. The waivers may only be modifi ed or terminated with the approval of the series board. Applicable fund results shown refl ect the waivers and reimbursements, without which results would have been lower and the net expense ratios higher. Refer to the Financial Highlights tables in this report for details.
The Managed Risk Growth Fund pursues its objective by investing in shares of American Funds Insurance Series – Growth FundSM and American Funds Insurance Series – The Bond Fund of AmericaSM. The Managed Risk International Fund pursues its objective by investing in shares of American Funds Insurance Series – International FundSM and American Funds Insurance Series – The Bond Fund of America. The Managed Risk Washington Mutual Investors Fund pursues its objective by investing in shares of American Funds Insurance Series – Washington Mutual Investors FundSM and American Funds Insurance Series – U.S. Government Securities FundSM. The Managed Risk Growth-Income Fund pursues its objective by investing in shares of American Funds Insurance Series – Growth-Income FundSM and American Funds Insurance Series – The Bond Fund of America. The Managed Risk Asset Allocation Fund pursues its objective by investing in shares of American Funds Insurance Series – Asset Allocation Fund.SM The funds seek to manage portfolio volatility and provide downside protection, primarily through the use of exchange-traded futures contracts and exchange-traded put options. The benefi t of the funds’ managed risk strategy should be most apparent during periods of high volatility and in down markets. In steady or rising markets, the funds’ results can be expected to lag those of the underlying funds.
Funds are listed in the report as follows: equity, balanced, fi xed income and managed risk.

American Funds Insurance Series 5
Global Growth Fund
Total returns based on For periods ended June 30, 2021*a $1,000 investment Lifetime Expense
6 months 1 year 5 years 10 years (since April 30, 1997) ratio
Class 1 11.76% 40.24% 19.97% 13.82% 11.29% 0.56% Class 1A 11.62 39.88 19.68 13.54 11.01 0.81Class 2 11.60 39.87 19.67 13.53 11.01 0.81Class 4 11.47 39.53 19.37 13.30 10.75 1.06
Investment results assume all distributions are reinvested and refl ect applicable fees and expenses. When applicable, investment results refl ect fee waivers and/or expense reimbursements, without which results would have been lower. Visit capitalgroup.com/afi s for more information. Expense ratios are as of the fund’s prospectus dated May 1, 2021. See the Financial Highlights table in this report for details.
*Periods greater than one year are annualized.
Percent of net assets
Where the fund’s assets wereinvested as of June 30, 2021 The Americas 51.1%
Short-term securities & other assets
less liabilities 5.0%
Europe 24.2%
Asia/Pacifi c Basin 19.3%
Other regions .4%
Fund results shown are for past periods and are not predictive of results for future periods. Current and future results may be lower or higher than those shown. Prices and returns will vary, so investors may lose money. Investing for short periods makes losses more likely. For current information and month-end results, visit capitalgroup.com/afi s. For information about your insurance contract and month-end results, go to the website of the company that issued your contract.

6 American Funds Insurance Series
Global Small Capitalization Fund
Percent of net assets
Where the fund’s assets wereinvested as of June 30, 2021 The Americas 50.1%
Short-term securities & other assets
less liabilities 4.1%
Asia/Pacifi c Basin 25.0%
Europe 20.4%
Other regions .4%
Fund results shown are for past periods and are not predictive of results for future periods. Current and future results may be lower or higher than those shown. Prices and returns will vary, so investors may lose money. Investing for short periods makes losses more likely. For current information and month-end results, visit capitalgroup.com/afi s. For information about your insurance contract and month-end results, go to the website of the company that issued your contract.
Total returns based on For periods ended June 30, 2021*a $1,000 investment Lifetime Expense
6 months 1 year 5 years 10 years (since April 30, 1998) ratio
Class 1 10.86% 48.91% 18.03% 10.77% 10.78% 0.74% Class 1A 10.73 48.53 17.75 10.50 10.51 0.99Class 2 10.72 48.51 17.74 10.49 10.51 0.99Class 4 10.56 48.18 17.44 10.22 10.23 1.24
Investment results assume all distributions are reinvested and refl ect applicable fees and expenses. When applicable, investment results refl ect fee waivers and/or expense reimbursements, without which results would have been lower. Visit capitalgroup.com/afi s for more information. Expense ratios are as of the fund’s prospectus dated May 1, 2021. See the Financial Highlights table in this report for details.
*Periods greater than one year are annualized.

American Funds Insurance Series 7
Growth Fund
Percent of net assets
Where the fund’s assets wereinvested as of June 30, 2021
Information technology 22.4%
Other industries 15.5%
Short-term securities & other assets
less liabilities 2.8%
Communication services 20.4%
Consumer discretionary 17.5%
Health care 12.6%
Industrials 8.6%
Other securities .2%
Fund results shown are for past periods and are not predictive of results for future periods. Current and future results may be lower or higher than those shown. Prices and returns will vary, so investors may lose money. Investing for short periods makes losses more likely. For current information and month-end results, visit capitalgroup.com/afi s. For information about your insurance contract and month-end results, go to the website of the company that issued your contract.
Total returns based on For periods ended June 30, 2021*a $1,000 investment Lifetime Expense
6 months 1 year 5 years 10 years (since February 8, 1984) ratio
Class 1 13.03% 53.72% 25.84% 17.88% 14.02% 0.36%Class 1A 12.87 53.33 25.53 17.59 13.74 0.61Class 2 12.87 53.34 25.52 17.58 13.74 0.61Class 3 12.91 53.43 25.61 17.67 13.82 0.54Class 4 12.74 52.96 25.21 17.31 13.46 0.86
Investment results assume all distributions are reinvested and refl ect applicable fees and expenses. When applicable, investment results refl ect fee waivers and/or expense reimbursements, without which results would have been lower. Visit capitalgroup.com/afi s for more information. Expense ratios are as of the fund’s prospectus dated May 1, 2021. See the Financial Highlights table in this report for details.
*Periods greater than one year are annualized.

8 American Funds Insurance Series
International Fund
Percent of net assets
Where the fund’sassets wereinvested as of June 30, 2021 Asia/Pacifi c Basin 44.1%
Short-term securities & other assets
less liabilities 3.0%
Europe 33.8%
The Americas 17.5%
Other regions 1.6%
Fund results shown are for past periods and are not predictive of results for future periods. Current and future results may be lower or higher than those shown. Prices and returns will vary, so investors may lose money. Investing for short periods makes losses more likely. For current information and month-end results, visit capitalgroup.com/afi s. For information about your insurance contract and month-end results, go to the website of the company that issued your contract.
Total returns based on For periods ended June 30, 2021*a $1,000 investment Lifetime Expense
6 months 1 year 5 years 10 years (since May 1, 1990) ratio
Class 1 4.71% 34.76% 12.27% 6.96% 8.42% 0.55%Class 1A 4.61 34.42 12.00 6.70 8.15 0.80Class 2 4.61 34.46 11.99 6.69 8.15 0.80Class 3 4.67 34.52 12.07 6.77 8.23 0.73Class 4 4.47 34.11 11.72 6.45 7.89 1.05
Investment results assume all distributions are reinvested and refl ect applicable fees and expenses. When applicable, investment results refl ect fee waivers and/or expense reimbursements, without which results would have been lower. Visit capitalgroup.com/afi s for more information. Expense ratios are as of the fund’s prospectus dated May 1, 2021. See the Financial Highlights table in this report for details.
*Periods greater than one year are annualized.

American Funds Insurance Series 9
Total returns based on For periods ended June 30, 2021*a $1,000 investment Lifetime Gross Net
6 months 1 year 5 years 10 years (since June 17, 1999) expense ratio expense ratio
Class 1 10.21% 42.32% 15.30% 7.72% 9.42% 0.77% 0.59% Class 1A 10.05 41.98 15.02 7.45 9.15 1.02 0.84Class 2 10.09 41.98 15.01 7.45 9.15 1.02 0.84Class 4 9.92 41.64 14.72 7.19 8.88 1.27 1.09
Investment results assume all distributions are reinvested and refl ect applicable fees and expenses. The investment adviser is currently waiving a portion of its management fee. This waiver will be in effect through at least May 1, 2022. The waiver may only be modifi ed or terminated with the approval of the fund’s board. Net expense ratios refl ect the waiver, without which they would have been higher. When applicable, investment results refl ect fee waivers and/or expense reimbursements, without which results would have been lower. Visit capitalgroup.com/afi s for more information. Expense ratios are as of the fund’s prospectus dated May 1, 2021. See the Financial Highlights table in this report for details.
*Periods greater than one year are annualized.
New World Fund®
Percent of net assets
Where the fund’s assets wereinvested as of June 30, 2021
Asia/Pacifi c Basin 38.0%
Short-term securities & other assets
less liabilities 5.0%
The Americas 35.5%
Europe 19.2%
Other regions 2.3%
Fund results shown are for past periods and are not predictive of results for future periods. Current and future results may be lower or higher than those shown. Prices and returns will vary, so investors may lose money. Investing for short periods makes losses more likely. For current information and month-end results, visit capitalgroup.com/afi s. For information about your insurance contract and month-end results, go to the website of the company that issued your contract.

10 American Funds Insurance Series
Washington Mutual Investors Fund (formerly Blue Chip Income and Growth Fund)*
Total returns based on For periods ended June 30, 2021†
a $1,000 investment Lifetime Gross Net 6 months 1 year 5 years 10 years (since May 1, 2006) expense ratio expense ratio
Class 1 15.14% 36.86% 12.16% 12.34% 7.40% 0.43% 0.27% Class 1A 15.00 36.58 11.90 12.07 7.14 0.68 0.52Class 2 15.03 36.49 11.87 12.06 7.13 0.68 0.52Class 4 14.88 36.17 11.59 11.84 6.90 0.93 0.77
Investment results assume all distributions are reinvested and refl ect applicable fees and expenses. The investment adviser is currently waiving a portion of its management fee. This waiver will be in effect through at least May 1, 2022. The waiver may only be modifi ed or terminated with the approval of the fund’s board. Net expense ratios refl ect the waiver, without which they would have been higher. When applicable, investment results refl ect fee waivers and/or expense reimbursements, without which results would have been lower. Visit capitalgroup.com/afi s for more information. Expense ratios are as of the fund’s prospectus dated May 1, 2021. See the Financial Highlights table in this report for details.
†Periods greater than one year are annualized.
Percent of net assets
Where the fund’s assets wereinvested as of June 30, 2021 Information technology 18.0%
Other industries 26.9%
Short-term securities
& other assets less liabilities 3.0%
Financials 16.7%
Health care 16.1%
Industrials 10.8%
Communication services 7.9%
Other securities .6%
Fund results shown are for past periods and are not predictive of results for future periods. Current and future results may be lower or higher than those shown. Prices and returns will vary, so investors may lose money. Investing for short periods makes losses more likely. For current information and month-end results, visit capitalgroup.com/afi s. For information about your insurance contract and month-end results, go to the website of the company that issued your contract.
*Normally, the fund invests at least 80% of its assets in dividend-paying common stocks of larger, more established companies domiciled in the United States with market capitalizations greater than $4.0 billion. Though the fund’s investment adviser does not intend to change the manner in which the fund is managed, this investment guideline will no longer be disclosed in the fund’s registration statement as of November 1, 2021.

American Funds Insurance Series 11
Total returns based on For periods ended June 30, 2021*a $1,000 investment Lifetime Gross Net
6 months 1 year 5 years 10 years (since May 1, 2006) expense ratio expense ratio
Class 1 10.06% 34.95% 13.80% 10.54% 8.08% 0.66% 0.43% Class 1A 9.94 34.67 13.55 10.28 7.82 0.91 0.68Class 2 9.98 34.67 13.52 10.26 7.81 0.91 0.68Class 4 9.82 34.38 13.23 10.01 7.56 1.16 0.93
Investment results assume all distributions are reinvested and refl ect applicable fees and expenses. The investment adviser is currently waiving a portion of its management fee. This waiver will be in effect through at least May 1, 2022. The waiver may only be modifi ed or terminated with the approval of the fund’s board. Net expense ratios refl ect the waiver, without which they would have been higher. When applicable, investment results refl ect fee waivers and/or expense reimbursements, without which results would have been lower. Visit capitalgroup.com/afi s for more information. Expense ratios are as of the fund’s prospectus dated May 1, 2021. See the Financial Highlights table in this report for details.
*Periods greater than one year are annualized.
Capital World Growth and Income Fund® (formerly Global Growth and Income Fund)
Percent of net assets
Where the fund’s assets wereinvested as of June 30, 2021
The Americas 51.2%
Short-term securities & other assets
less liabilities 3.7%
Europe 26.1%
Asia/Pacifi c Basin 18.8%
Other regions .2%
Fund results shown are for past periods and are not predictive of results for future periods. Current and future results may be lower or higher than those shown. Prices and returns will vary, so investors may lose money. Investing for short periods makes losses more likely. For current information and month-end results, visit capitalgroup.com/afi s. For information about your insurance contract and month-end results, go to the website of the company that issued your contract.

12 American Funds Insurance Series
Total returns based on For periods ended June 30, 2021*a $1,000 investment Lifetime Expense
6 months 1 year 5 years 10 years (since February 8, 1984) ratio
Class 1 14.30% 34.96% 16.56% 14.03% 11.76% 0.30% Class 1A 14.14 34.61 16.29 13.75 11.48 0.55Class 2 14.14 34.61 16.27 13.74 11.48 0.55Class 3 14.19 34.72 16.35 13.82 11.56 0.48Class 4 14.00 34.29 15.98 13.47 11.21 0.80
Investment results assume all distributions are reinvested and refl ect applicable fees and expenses. When applicable, investment results refl ect fee waivers and/or expense reimbursements, without which results would have been lower. Visit capitalgroup.com/afi s for more information. Expense ratios are as of the fund’s prospectus dated May 1, 2021. See the Financial Highlights table in this report for details.
*Periods greater than one year are annualized.
Growth-Income Fund
Percent of net assets
Where the fund’s assets wereinvested as of June 30, 2021 Information technology 22.2%
Other industries 26.0%
Short-term securities
& other assets less liabilities 2.2%
Communication services 16.8%
Health care 11.3%
Industrials 10.3%
Financials 10.1%
Other securities 1.1%
Fund results shown are for past periods and are not predictive of results for future periods. Current and future results may be lower or higher than those shown. Prices and returns will vary, so investors may lose money. Investing for short periods makes losses more likely. For current information and month-end results, visit capitalgroup.com/afi s. For information about your insurance contract and month-end results, go to the website of the company that issued your contract.
American Funds Insurance Series 13
Total returns based on For periods ended June 30, 2021*a $1,000 investment Lifetime Expense
6 months 1 year 5 years 10 years (since November 18, 2008) ratio
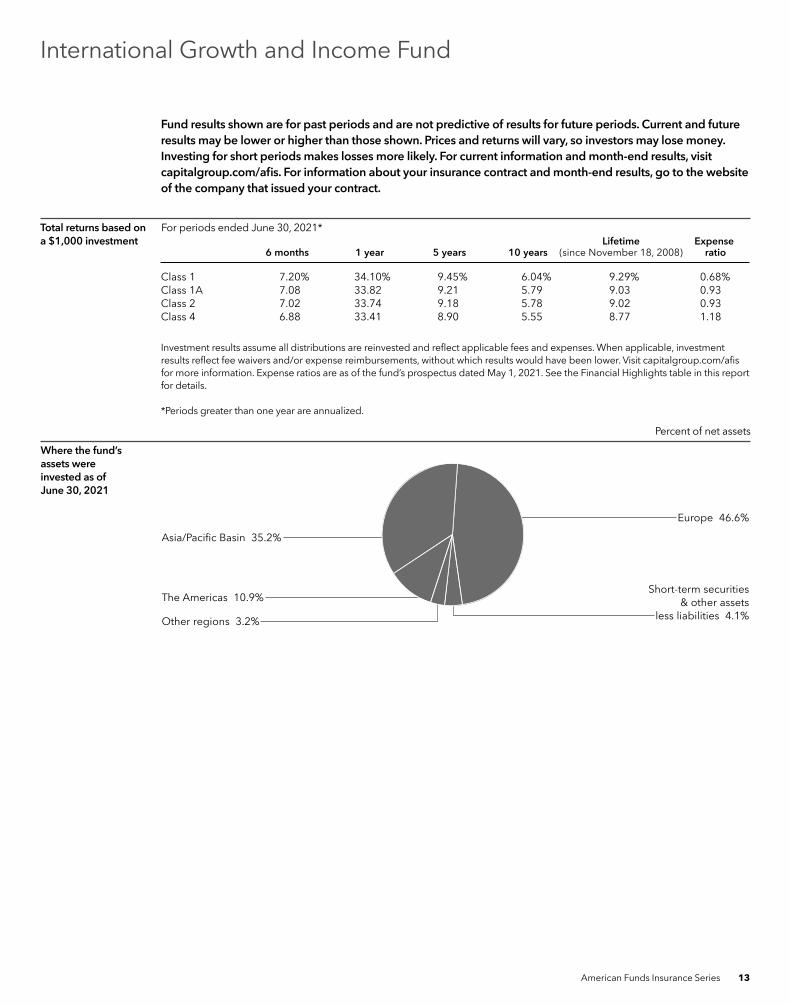
Class 1 7.20% 34.10% 9.45% 6.04% 9.29% 0.68%Class 1A 7.08 33.82 9.21 5.79 9.03 0.93Class 2 7.02 33.74 9.18 5.78 9.02 0.93Class 4 6.88 33.41 8.90 5.55 8.77 1.18
Investment results assume all distributions are reinvested and refl ect applicable fees and expenses. When applicable, investment results refl ect fee waivers and/or expense reimbursements, without which results would have been lower. Visit capitalgroup.com/afi s for more information. Expense ratios are as of the fund’s prospectus dated May 1, 2021. See the Financial Highlights table in this report for details.
*Periods greater than one year are annualized.
International Growth and Income Fund
Percent of net assets
Where the fund’s assets wereinvested as of June 30, 2021
Europe 46.6%
Short-term securities & other assets
less liabilities 4.1%
Asia/Pacifi c Basin 35.2%
The Americas 10.9%
Other regions 3.2%
Fund results shown are for past periods and are not predictive of results for future periods. Current and future results may be lower or higher than those shown. Prices and returns will vary, so investors may lose money. Investing for short periods makes losses more likely. For current information and month-end results, visit capitalgroup.com/afi s. For information about your insurance contract and month-end results, go to the website of the company that issued your contract.

14 American Funds Insurance Series
Capital Income Builder®
Total returns based on For periods ended June 30, 2021*a $1,000 investment Lifetime Gross Net
6 months 1 year 5 years (since May 1, 2014) expense ratio expense ratio
Class 1 9.85% 22.58% 7.22% 5.60% 0.53% 0.28%Class 1A 9.72 22.31 6.96 5.34 0.78 0.53Class 2 9.72 22.42 6.97 5.43 0.78 0.53Class 4 9.60 22.03 6.70 5.08 1.03 0.78
Investment results assume all distributions are reinvested and refl ect applicable fees and expenses. The investment adviser is currently waiving a portion of its management fee. This waiver will be in effect through at least May 1, 2022. The waiver may only be modifi ed or terminated with the approval of the fund’s board. Net expense ratios refl ect the waiver, without which they would have been higher. When applicable, investment results refl ect fee waivers and/or expense reimbursements, without which results would have been lower. Visit capitalgroup.com/afi s for more information. Expense ratios are as of the fund’s prospectus dated May 1, 2021. See the Financial Highlights table in this report for details.
*Periods greater than one year are annualized.
Percent of net assets
Where the fund’s assets wereinvested as of June 30, 2021
The Americas 66.8%
Short-term securities & other assets
less liabilities 3.5%
Europe 19.5%
Asia/Pacifi c Basin 10.1%
Other regions .1%
Fund results shown are for past periods and are not predictive of results for future periods. Current and future results may be lower or higher than those shown. Prices and returns will vary, so investors may lose money. Investing for short periods makes losses more likely. For current information and month-end results, visit capitalgroup.com/afi s. For information about your insurance contract and month-end results, go to the website of the company that issued your contract.

American Funds Insurance Series 15
Total returns based on For periods ended June 30, 2021*a $1,000 investment Lifetime Expense
6 months 1 year 5 years 10 years (since August 1,1989) ratio
Class 1 10.22% 26.09% 12.00% 10.67% 8.95% 0.30% Class 1A 10.10 25.75 11.74 10.40 8.68 0.55Class 2 10.06 25.75 11.72 10.40 8.68 0.55Class 3 10.14 25.85 11.81 10.47 8.76 0.48Class 4 9.97 25.47 11.45 10.16 8.42 0.80
Investment results assume all distributions are reinvested and refl ect applicable fees and expenses. When applicable, investment results refl ect fee waivers and/or expense reimbursements, without which results would have been lower. Visit capitalgroup.com/afi s for more information. Expense ratios are as of the fund’s prospectus dated May 1, 2021. See the Financial Highlights table in this report for details..*Periods greater than one year are annualized.
Asset Allocation Fund
Percent of net assets
Where the fund’s assets wereinvested as of June 30, 2021
Common stocks 69.7%
Short-term securities
& other assets less liabilities 3.6%
U.S. Treasury bonds & notes 7.2%
Corporate bonds, notes & loans 7.0%
Mortgage-backed obligations 5.5%
Investment funds 5.2%
Other bonds & notes 1.3%
Convertible stocks .5%
Fund results shown are for past periods and are not predictive of results for future periods. Current and future results may be lower or higher than those shown. Prices and returns will vary, so investors may lose money. Investing for short periods makes losses more likely. For current information and month-end results, visit capitalgroup.com/afi s. For information about your insurance contract and month-end results, go to the website of the company that issued your contract.

16 American Funds Insurance Series
Total returns based on For periods ended June 30, 2021*a $1,000 investment Lifetime Expense
6 months 1 year 5 years 10 years (since May 2, 2011) ratio
Class 1 6.10% 20.72% 10.11% 7.57% 7.17% 0.72% Class 1A 5.98 20.45 9.87 7.32 6.92 0.97Class 2 5.98 20.41 9.83 7.29 6.91 0.97Class 4 5.82 20.13 9.57 7.15 6.75 1.22
Investment results assume all distributions are reinvested and refl ect applicable fees and expenses. When applicable, investment results refl ect fee waivers and/or expense reimbursements, without which results would have been lower. Visit capitalgroup.com/afi s for more information. Expense ratios are as of the fund’s prospectus dated May 1, 2021. See the Financial Highlights table in this report for details.
*Periods greater than one year are annualized.
Global Balanced Fund
Percent of net assets
Where the fund’s assets wereinvested as of June 30, 2021
U.S. common stocks 30.5%
Common stocks of issuers outside the U.S. 30.7%
Short-term securities & other assets
less liabilities 7.9%
Bonds & notes of governments & government agencies outside the U.S. 14.0%
U.S. Treasury bonds & notes 10.5%
Corporate bonds, notes & loans 4.7%
Mortgage-backed obligations .8%
Preferred securities and convertible stocks .8%
Other bonds & notes .1%
Fund results shown are for past periods and are not predictive of results for future periods. Current and future results may be lower or higher than those shown. Prices and returns will vary, so investors may lose money. Investing for short periods makes losses more likely. For current information and month-end results, visit capitalgroup.com/afi s. For information about your insurance contract and month-end results, go to the website of the company that issued your contract.

American Funds Insurance Series 17
Total returns based on For periods ended June 30, 2021*a $1,000 investment Lifetime Gross Net
6 months 1 year 5 years 10 years (since January 2, 1996) expense ratio expense ratio
Class 1 -0.67% 2.45% 3.91% 3.84% 4.80% 0.40% 0.21% Class 1A –0.79 2.16 3.66 3.58 4.54 0.65 0.46Class 2 –0.81 2.14 3.64 3.57 4.54 0.65 0.46Class 4 –0.93 1.89 3.38 3.33 4.28 0.90 0.71
Investment results assume all distributions are reinvested and refl ect applicable fees and expenses. The investment adviser is currently waiving a portion of its management fee. This waiver will be in effect through at least May 1, 2022. The waiver may only be modifi ed or terminated with the approval of the fund’s board. Net expense ratios refl ect the waiver, without which they would have been higher. When applicable, investment results refl ect fee waivers and/or expense reimbursements, without which results would have been lower. Visit capitalgroup.com/afi s for more information. Expense ratios are as of the fund’s prospectus dated May 1, 2021. See the Financial Highlights table in this report for details.
*Periods greater than one year are annualized.
The Bond Fund of America® (formerly Bond Fund)
Percent of net assets
Where the fund’s assets wereinvested as of June 30, 2021 U.S. Treasury bonds & notes 49.6%
Short-term securities & other assets
less liabilities 3.0%
Corporate bonds, notes & loans 30.4%
Mortgage-backed obligations 11.1%
Asset-backed obligations 3.3%
Municipals 1.7%
Other bonds & notes .9%
Fund results shown are for past periods and are not predictive of results for future periods. Current and future results may be lower or higher than those shown. Prices and returns will vary, so investors may lose money. Investing for short periods makes losses more likely. For current information and month-end results, visit capitalgroup.com/afi s. For information about your insurance contract and month-end results, go to the website of the company that issued your contract.

18 American Funds Insurance Series
Total returns based on For periods ended June 30, 2021*a $1,000 investment Lifetime Gross Net
6 months 1 year 5 years 10 years (since October 4, 2006) expense ratio expense ratio
Class 1 –3.20% 4.41% 3.07% 2.52% 4.10% 0.58% 0.48%Class 1A –3.24 4.21 2.86 2.29 3.86 0.83 0.73Class 2 –3.26 4.20 2.82 2.26 3.84 0.83 0.73Class 4 –3.41 3.88 2.56 2.05 3.61 1.08 0.98
Investment results assume all distributions are reinvested and refl ect applicable fees and expenses. The investment adviser is currently waiving a portion of its management fee. This waiver will be in effect through at least May 1, 2022. The waiver may only be modifi ed or terminated with the approval of the fund’s board. Net expense ratios refl ect the waiver, without which they would have been higher. When applicable, investment results refl ect fee waivers and/or expense reimbursements, without which results would have been lower. Visit capitalgroup.com/afi s for more information. Expense ratios are as of the fund’s prospectus dated May 1, 2021. See the Financial Highlights table in this report for details.
*Periods greater than one year are annualized.
Capital World Bond Fund®
Percent of net assets
Where the fund’s assets wereinvested as of June 30, 2021
Bonds & notes of governments & government agencies outside the U.S. 53.5%
Short-term securities & other assets
less liabilities 6.8%
Corporate bonds, notes & loans 29.9%
U.S. Treasury bonds & notes 6.7%
Mortgage-backed obligations 2.8%
Other bonds & notes .2%
Common stocks .1%
Fund results shown are for past periods and are not predictive of results for future periods. Current and future results may be lower or higher than those shown. Prices and returns will vary, so investors may lose money. Investing for short periods makes losses more likely. For current information and month-end results, visit capitalgroup.com/afi s. For information about your insurance contract and month-end results, go to the website of the company that issued your contract.

American Funds Insurance Series 19
Total returns based on For periods ended June 30, 2021*a $1,000 investment Lifetime Gross Net
6 months 1 year 5 years 10 years (since February 8, 1984) expense ratio expense ratio
Class 1 6.62% 21.11% 8.13% 6.02% 8.72% 0.52% 0.33% Class 1A 6.49 20.82 7.90 5.77 8.45 0.77 0.58Class 2 6.50 20.81 7.88 5.76 8.45 0.77 0.58Class 3 6.56 20.85 7.93 5.83 8.52 0.70 0.51Class 4 6.28 20.38 7.58 5.53 8.19 1.02 0.83
Investment results assume all distributions are reinvested and refl ect applicable fees and expenses. The investment adviser is currently waiving a portion of its management fee. This waiver will be in effect through at least May 1, 2022. The waiver may only be modifi ed or terminated with the approval of the fund’s board. Net expense ratios refl ect the waiver, without which they would have been higher. When applicable, investment results refl ect fee waivers and/or expense reimbursements, without which results would have been lower. Visit capitalgroup.com/afi s for more information. Expense ratios are as of the fund’s prospectus dated May 1, 2021. See the Financial Highlights table in this report for details.
*Periods greater than one year are annualized.
American High-Income Trust® (formerly High-Income Bond Fund)
Percent of net assets
Where the fund’s assets wereinvested as of June 30, 2021
Corporate bonds, notes & loans 86.8%
Short-term securities & other assets
less liabilities 6.7%
Equity securities 6.0%
Convertible securities .4%
Other bonds & notes .1%
Fund results shown are for past periods and are not predictive of results for future periods. Current and future results may be lower or higher than those shown. Prices and returns will vary, so investors may lose money. Investing for short periods makes losses more likely. For current information and month-end results, visit capitalgroup.com/afi s. For information about your insurance contract and month-end results, go to the website of the company that issued your contract.

20 American Funds Insurance Series
American Funds Mortgage Fund®
Total returns based on For periods ended June 30, 2021*a $1,000 investment Lifetime Gross Net
6 months 1 year 5 years 10 years (since May 2, 2011) expense ratio expense ratio
Class 1 -0.57% 0.53% 2.63% 2.86% 2.91% 0.48% 0.27% Class 1A –0.60 0.38 2.40 2.61 2.66 0.73 0.52Class 2 –0.70 0.28 2.38 2.60 2.65 0.73 0.52Class 4 –0.74 0.06 2.13 2.41 2.45 0.98 0.77
Investment results assume all distributions are reinvested and refl ect applicable fees and expenses. The investment adviser is currently waiving a portion of its management fee. This waiver will be in effect through at least May 1, 2022. The waiver may only be modifi ed or terminated with the approval of the fund’s board. Net expense ratios refl ect the waiver, without which they would have been higher. When applicable, investment results refl ect fee waivers and/or expense reimbursements, without which results would have been lower. Visit capitalgroup.com/afi s for more information. Expense ratios are as of the fund’s prospectus dated May 1, 2021. See the Financial Highlights table in this report for details.
*Periods greater than one year are annualized.
Percent of net assets
Where the fund’s assets wereinvested as of June 30, 2021
Mortgage-backed obligations 57.7%
Short-term securities
& other assets less liabilities 20.9%
U.S. Treasury bonds & notes 17.6%
Asset-backed obligations 3.4%
Other bonds & notes .4%
Fund results shown are for past periods and are not predictive of results for future periods. Current and future results may be lower or higher than those shown. Prices and returns will vary, so investors may lose money. Investing for short periods makes losses more likely. For current information and month-end results, visit capitalgroup.com/afi s. For information about your insurance contract and month-end results, go to the website of the company that issued your contract.

American Funds Insurance Series 21
Total returns based on For periods ended June 30, 2021*a $1,000 investment Lifetime Expense
6 months 1 year 5 years 10 years (since February 8, 1984) ratio
Class 1 –0.18% –0.27% 0.88% 0.33% 3.26% 0.37%Class 1A –0.18 –0.27 0.85 0.19 3.03 0.62Class 2 –0.27 –0.45 0.69 0.15 3.07 0.55Class 3 -0.27 –0.54 0.62 0.08 3.01 0.62Class 4 –0.36 –0.72 0.38 -0.10 2.77 0.87
Investment results assume all distributions are reinvested and refl ect applicable fees and expenses. When applicable, investment results refl ect fee waivers and/or expense reimbursements, without which results would have been lower. Visit capitalgroup.com/afi s for more information. Expense ratios are as of the fund’s prospectus dated May 1, 2021. See the Financial Highlights table in this report for details.
*Periods greater than one year are annualized.
Percent of net assets
Where the fund’s assets wereinvested as of June 30, 2021
Commercial paper 54.7%Bonds & notes of governments & government agencies outside the U.S. 18.7U.S. Treasury bills 15.2Federal agency bills & notes 9.1Other assets less liabilities 2.3
Total 100.0%
Ultra-Short Bond Fund
Fund results shown are for past periods and are not predictive of results for future periods. Current and future results may be lower or higher than those shown. Prices and returns will vary, so investors may lose money. Investing for short periods makes losses more likely. For current information and month-end results, visit capitalgroup.com/afi s. For information about your insurance contract and month-end results, go to the website of the company that issued your contract.

22 American Funds Insurance Series
U.S. Government Securities Fund® (formerly U.S. Government/AAA-Rated Securities Fund)
Total returns based on For periods ended June 30, 2021*a $1,000 investment Lifetime Gross Net
6 months 1 year 5 years 10 years (since December 2, 1985) expense ratio expense ratio
Class 1 –1.31% –0.14% 2.85% 3.01% 5.71% 0.39% 0.23% Class 1A –1.42 –0.42 2.62 2.77 5.45 0.64 0.48Class 2 –1.36 –0.36 2.59 2.76 5.45 0.64 0.48Class 3 –1.41 –0.38 2.66 2.83 5.52 0.57 0.41Class 4 –1.58 –0.72 2.31 2.54 5.19 0.89 0.73
Investment results assume all distributions are reinvested and refl ect applicable fees and expenses. The investment adviser is currently waiving a portion of its management fee. This waiver will be in effect through at least May 1, 2022. The waiver may only be modifi ed or terminated with the approval of the fund’s board. Net expense ratios refl ect the waiver, without which they would have been higher. When applicable, investment results refl ect fee waivers and/or expense reimbursements, without which results would have been lower. Visit capitalgroup.com/afi s for more information. Expense ratios are as of the fund’s prospectus dated May 1, 2021. See the Financial Highlights table in this report for details.
*Periods greater than one year are annualized.
Percent of net assets
Where the fund’s assets wereinvested as of June 30, 2021
U.S. Treasury bonds & notes 51.7%
Short-term securities
& other assets less liabilities 18.1%
Mortgage-backed obligations 17.3%
Federal agency bonds & notes 12.9%
Fund results shown are for past periods and are not predictive of results for future periods. Current and future results may be lower or higher than those shown. Prices and returns will vary, so investors may lose money. Investing for short periods makes losses more likely. For current information and month-end results, visit capitalgroup.com/afi s. For information about your insurance contract and month-end results, go to the website of the company that issued your contract.

American Funds Insurance Series 23
Managed Risk Growth Fund
Total returns based on For periods ended June 30, 2021*a $1,000 investment Lifetime Gross Net
6 months 1 year 5 years (since May 1, 2013) expense ratio expense ratio
Class P1 7.56% 31.22% 18.32% 12.84% 0.74% 0.69%Class P2 7.53 30.94 18.02 12.52 0.99 0.94
The investment adviser is currently waiving a portion of its management fee. This waiver will be in effect through at least May 1, 2022. The waiver may only be modifi ed or terminated with the approval of the fund’s board. Net expense ratios shown refl ect the waiver, without which they would have been higher. When applicable, investment results refl ect fee waivers and/or expense reimbursements, without which results would have been lower. Visit capitalgroup.com/afi s for more information. Expense ratios are restated to refl ect current fees and are as of the fund’s prospectus dated May 1, 2021.
*Periods greater than one year are annualized.
Fund results shown are for past periods and are not predictive of results for future periods. Current and future results may be lower or higher than those shown. Prices and returns will vary, so investors may lose money. Investing for short periods makes losses more likely. For current information and month-end results, visit capitalgroup.com/afi s. For information about your insurance contract and month-end results, go to the website of the company that issued your contract.

24 American Funds Insurance Series
Managed Risk International Fund
Total returns based on For periods ended June 30, 2021*a $1,000 investment Lifetime Gross Net
6 months 1 year 5 years (since May 1, 2013) expense ratio expense ratio
Class P1 2.73% 20.86% 7.91% 3.94% 0.94% 0.86% Class P2 2.64 20.52 7.56 3.57 1.19 1.11
The investment adviser is currently waiving a portion of its management fee. In addition, the investment adviser is currently reimbursing a portion of other expenses. This waiver and reimbursement will be in effect through at least May 1, 2022. The adviser may elect at its discretion to extend, modify or terminate the reimbursement at that time. The waiver may only be modifi ed or terminated with the approval of the fund’s board. Net expense ratios shown refl ect the waiver and reimbursement, without which they would have been higher. When applicable, investment results refl ect fee waivers and/or expense reimbursements, without which results would have been lower. Visit capitalgroup.com/afi s for more information. Expense ratios are restated to refl ect current fees and are as of the fund’s prospectus dated May 1, 2021.
*Periods greater than one year are annualized.
Fund results shown are for past periods and are not predictive of results for future periods. Current and future results may be lower or higher than those shown. Prices and returns will vary, so investors may lose money. Investing for short periods makes losses more likely. For current information and month-end results, visit capitalgroup.com/afi s. For information about your insurance contract and month-end results, go to the website of the company that issued your contract.

American Funds Insurance Series 25
Managed Risk Washington Mutual Investors Fund (formerly Managed Risk Blue Chip Income and Growth Fund)
Total returns based on For periods ended June 30, 2021*a $1,000 investment Lifetime Gross Net
6 months 1 year 5 years (since May 1, 2013) expense ratio expense ratio
Class P1 9.08% 17.85% 7.15% 6.76% 0.68% 0.63%Class P2 8.99 17.61 6.81 6.41 0.93 0.88
The investment adviser is currently waiving a portion of its management fee. In addition, the investment adviser is currently reimbursing a portion of other expenses. This waiver and reimbursement will be in effect through at least May 1, 2022. The adviser may elect at its discretion to extend, modify or terminate the reimbursement at that time. The waiver may only be modifi ed or terminated with the approval of the fund’s board. Net expense ratios shown refl ect the waiver and reimbursement, without which they would have been higher. When applicable, investment results refl ect fee waivers and/or expense reimbursements, without which results would have been lower. Visit capitalgroup.com/afi s for more information. Expense ratios are restated to refl ect current fees and are as of the fund’s prospectus dated May 1, 2021.
*Periods greater than one year are annualized.
Fund results shown are for past periods and are not predictive of results for future periods. Current and future results may be lower or higher than those shown. Prices and returns will vary, so investors may lose money. Investing for short periods makes losses more likely. For current information and month-end results, visit capitalgroup.com/afi s. For information about your insurance contract and month-end results, go to the website of the company that issued your contract.

26 American Funds Insurance Series
Managed Risk Growth-Income Fund
Total returns based on For periods ended June 30, 2021*a $1,000 investment Lifetime Gross Net
6 months 1 year 5 years (since May 1, 2013) expense ratio expense ratio
Class P1 8.82% 18.76% 12.42% 9.64% 0.68% 0.63%Class P2 8.76 18.44 12.14 9.32 0.93 0.88
The investment adviser is currently waiving a portion of its management fee. This waiver will be in effect through at least May 1, 2022. The waiver may only be modifi ed or terminated with the approval of the fund’s board. Net expense ratios shown refl ect the waiver, without which they would have been higher. When applicable, investment results refl ect fee waivers and/or expense reimbursements, without which results would have been lower. Visit capitalgroup.com/afi s for more information. Expense ratios are restated to refl ect current fees and are as of the fund’s prospectus dated May 1, 2021.
*Periods greater than one year are annualized.
Fund results shown are for past periods and are not predictive of results for future periods. Current and future results may be lower or higher than those shown. Prices and returns will vary, so investors may lose money. Investing for short periods makes losses more likely. For current information and month-end results, visit capitalgroup.com/afi s. For information about your insurance contract and month-end results, go to the website of the company that issued your contract.

American Funds Insurance Series 27
Managed Risk Asset Allocation Fund
Total returns based on For periods ended June 30, 2021*a $1,000 investment Lifetime Gross Net
6 months 1 year 5 years (since September 28, 2012) expense ratio expense ratio
Class P1 8.62% 19.69% 9.27% 8.33% 0.70% 0.65% Class P2 8.46 19.38 9.00 8.06 0.95 0.90
The investment adviser is currently waiving a portion of its management fee. This waiver will be in effect through at least May 1, 2022. The waiver may only be modifi ed or terminated with the approval of the fund’s board. Net expense ratios shown refl ect the waiver, without which they would have been higher. When applicable, investment results refl ect fee waivers and/or expense reimbursements, without which results would have been lower. Visit capitalgroup.com/afi s for more information.
*Periods greater than one year are annualized.
Fund results shown are for past periods and are not predictive of results for future periods. Current and future results may be lower or higher than those shown. Prices and returns will vary, so investors may lose money. Investing for short periods makes losses more likely. For current information and month-end results, visit capitalgroup.com/afi s. For information about your insurance contract and month-end results, go to the website of the company that issued your contract.

28 American Funds Insurance Series
Common stocks 92.05% SharesValue(000)
Informationtechnology31.05%
ASML Holding NV 560,592 $ 385,140ASML Holding NV (New York registered) (ADR) 303,400 209,601Taiwan Semiconductor Manufacturing Company, Ltd. 24,817,000 529,964Taiwan Semiconductor Manufacturing Company, Ltd. (ADR) 140,000 16,822Microsoft Corp. 1,902,900 515,496PayPal Holdings, Inc.1 846,600 246,767Adyen NV1 61,500 150,259Broadcom, Inc. 233,350 111,271Adobe, Inc.1 135,000 79,061Applied Materials, Inc. 520,137 74,068PagSeguro Digital, Ltd., Class A1 1,094,000 61,176Zendesk, Inc.1 419,500 60,551Samsung Electronics Co., Ltd. 785,100 56,260EPAM Systems, Inc.1 105,240 53,773Amphenol Corp., Class A 747,000 51,102Hexagon AB, Class B 3,136,000 46,464Fiserv, Inc.1 419,103 44,798Keyence Corp. 72,300 36,490DocuSign, Inc.1 106,750 29,844Advanced Micro Devices, Inc.1 301,500 28,320Mastercard, Inc., Class A 67,500 24,644Visa, Inc., Class A 70,197 16,413TeamViewer AG1 428,000 16,098Network International Holdings PLC1 3,173,000 16,051Amadeus IT Group SA, Class A, non-registered shares1 212,301 14,933Worldline SA, non-registered shares1 152,800 14,303Jack Henry & Associates, Inc. 69,400 11,348
2,901,017
Consumerdiscretionary18.31%
Amazon.com, Inc.1 144,050 495,555Chipotle Mexican Grill, Inc.1 130,000 201,544LVMHMoët Hennessy-Louis Vuitton SE 158,900 124,599Domino’s Pizza, Inc. 230,200 107,386Floor & Decor Holdings, Inc., Class A1 914,698 96,684Ocado Group PLC1 2,881,000 79,825Renault SA1 1,688,781 68,254NIKE, Inc., Class B 383,100 59,185Booking Holdings, Inc.1 24,600 53,827Coupang, Inc., Class A1,2 906,542 37,912Naspers, Ltd., Class N 169,130 35,510Prosus NV 347,800 34,011MercadoLibre, Inc.1 21,200 33,025Xpeng, Inc., Class A (ADR)1 671,711 29,837Home Depot, Inc. 92,275 29,426Stellantis NV 1,327,055 26,027Sony Group Corp. 243,000 23,656Entain PLC1 887,000 21,417IDP Education, Ltd. 1,119,000 20,594MGM China Holdings, Ltd.1 12,708,000 19,248EssilorLuxottica 102,335 18,886Evolution AB 114,500 18,094Wynn Macau, Ltd.1 10,510,400 16,542Moncler SpA 217,370 14,707Melco Resorts & Entertainment, Ltd. (ADR)1 835,000 13,836JD Health International, Inc.1 893,550 12,809Marriott International, Inc., Class A1 74,000 10,102THG PLC1 1,026,870 8,665
1,711,163
Global Growth FundInvestment portfolio June 30, 2021 unaudited

American Funds Insurance Series 29
Common stocks (continued) SharesValue(000)
Health care11.76%
DexCom, Inc.1 253,000 $ 108,031UnitedHealth Group, Inc. 259,600 103,954Mettler-Toledo International, Inc.1 65,000 90,047AstraZeneca PLC 674,300 80,991NovoCure, Ltd.1 340,000 75,419Cigna Corp. 316,600 75,056Pfizer, Inc. 1,699,000 66,533Fisher & Paykel Healthcare Corp., Ltd. 2,550,000 55,470Regeneron Pharmaceuticals, Inc.1 95,036 53,081Merck & Co., Inc. 620,000 48,217Tandem Diabetes Care, Inc.1 379,084 36,923Silk Road Medical, Inc.1 702,000 33,598Danaher Corp. 110,000 29,520Humana Inc. 55,000 24,350Zoetis, Inc., Class A 130,000 24,227Bayer AG 363,860 22,094Catalent, Inc.1 200,000 21,624Eli Lilly and Company 92,000 21,116Zai Lab, Ltd. (ADR)1 95,400 16,885Olympus Corp. 796,800 15,836bioMérieux SA 135,000 15,687Novartis AG 165,600 15,092Rede D’Or Sao Luiz SA 1,073,663 14,901Sanofi 135,000 14,144Teladoc Health, Inc.1 79,000 13,137Vertex Pharmaceuticals, Inc.1 49,500 9,981Coloplast A/S, Class B 55,750 9,148Organon & Co.1 62,000 1,876Viatris, Inc. 110,678 1,582
1,098,520
Communicationservices9.69%
Alphabet, Inc., Class A1 95,500 233,191Alphabet, Inc., Class C1 63,852 160,033Facebook, Inc., Class A1 710,030 246,885Tencent Holdings, Ltd. 2,028,000 152,538Bilibili, Inc., Class Z1 284,200 34,993Sea, Ltd., Class A (ADR)1 95,851 26,321Altice USA, Inc., Class A1 751,200 25,646Kuaishou Technology, Class B1,3,4 571,000 13,180Kuaishou Technology, Class B1 900 22Bumble, Inc., Class A1 217,500 12,528
905,337
Financials8.84%
AIA Group, Ltd. 12,499,500 155,352Tradeweb Markets, Inc., Class A 1,685,360 142,514Kotak Mahindra Bank, Ltd.1 3,018,964 69,284JPMorgan Chase & Co. 438,700 68,235Allfunds Group PLC1 2,890,300 50,304AXA SA 1,692,893 42,927Citigroup, Inc. 497,600 35,205Prudential PLC 1,773,082 33,688Société Générale 1,011,450 29,815Moscow Exchange MICEX-RTS PJSC 12,640,000 29,504BlackRock, Inc. 26,500 23,187HDFC Life Insurance Company, Ltd. 2,064,553 19,062QBE Insurance Group, Ltd. 2,132,000 17,252Willis Towers Watson PLC 73,000 16,792CME Group, Inc., Class A 76,437 16,257Bank of America Corp. 385,000 15,874FinecoBank SpA1 893,000 15,565
Global Growth Fund (continued)

30 American Funds Insurance Series
Common stocks (continued) SharesValue(000)
Financials(continued)
Macquarie Group, Ltd. 101,500 $ 11,907Banco Santander, SA 2,946,020 11,247Lufax Holding, Ltd. (ADR)1,2 966,000 10,916Sberbank of Russia PJSC (ADR) 645,500 10,719
825,606
Consumer staples5.51%
British American Tobacco PLC 2,585,800 100,154Philip Morris International, Inc. 919,500 91,132KweichowMoutai Co., Ltd., Class A 269,957 85,928Altria Group, Inc. 1,248,500 59,529Keurig Dr Pepper, Inc. 1,624,000 57,230Nestlé SA 313,500 39,040Walgreens Boots Alliance, Inc. 657,651 34,599Associated British Foods PLC 595,000 18,239CostcoWholesale Corp. 42,170 16,685Mondelez International, Inc. 192,000 11,988
514,524
Industrials3.49%
DSV Panalpina A/S 201,000 46,875Airbus SE, non-registered shares1 327,000 42,047MTU Aero Engines AG 167,000 41,366Alliance Global Group, Inc. 156,400,700 32,552GT Capital Holdings, Inc. 2,454,611 30,522NIBE Industrier AB, Class B 2,740,000 28,821Safran SA 164,000 22,737Country Garden Services Holdings Co., Ltd. 2,003,000 21,644Nidec Corp. 149,100 17,280General Electric Co. 1,260,000 16,960SMC Corp. 22,500 13,296Boeing Company1 51,300 12,289
326,389
Materials1.76%
Sherwin-Williams Company 461,700 125,790Shin-Etsu Chemical Co., Ltd. 119,500 19,986Koninklijke DSM NV 101,700 18,981
164,757
Energy1.10%
Reliance Industries, Ltd. 1,623,617 46,104Reliance Industries, Ltd., interim shares 106,956 2,139Gazprom PJSC (ADR) 4,173,000 31,807LUKOIL Oil Co. PJSC (ADR) 246,300 22,812
102,862
Real estate0.36%
Goodman Logistics (HK), Ltd. REIT 1,276,503 20,266ESR Cayman, Ltd.1 4,100,000 13,835
34,101
Utilities0.18%
Ørsted AS 121,736 17,082
Total common stocks (cost: $4,083,141,000) 8,601,358
Preferred securities 2.91%
Health care2.01%
Sartorius AG, nonvoting non-registered preferred shares 360,500 187,656
Global Growth Fund (continued)

American Funds Insurance Series 31
Preferred securities (continued) SharesValue(000)
Informationtechnology0.90%
Samsung Electronics Co., Ltd., nonvoting preferred shares 1,289,000 $ 84,358
Total preferred securities (cost: $70,623,000) 272,014
Short-term securities 5.64%
Money market investments 5.21%
Capital Group Central Cash Fund 0.04%5,6 4,867,535 486,754
Money market investments purchased with collateral from securities on loan 0.43%
Goldman Sachs Financial Square Government Fund, Institutional Shares 0.02%5,7 22,129,193 22,129Capital Group Central Cash Fund 0.04%5,6,7 178,892 17,888Invesco Short-Term Investments Trust – Government & Agency Portfolio,
Institutional Class 0.03%5,7 117,498 118
40,135
Total short-term securities (cost: $526,921,000) 526,889
Total investment securities 100.60% (cost: $4,680,685,000) 9,400,261
Other assets less liabilities (0.60)% (56,287)
Net assets 100.00% $9,343,974
Investments in affiliates6
Value ofaffiliates at1/1/2021
(000)Additions
(000)Reductions
(000)
Netrealized
loss(000)
Netunrealized
depreciation(000)
Value ofaffiliates at6/30/2021
(000)
Dividendincome
(000)
Short-term securities 5.40%Money market investments 5.21%
Capital Group Central Cash Fund 0.04%5 $125,696 $966,146 $605,039 $(1) $(48) $486,754 $103
Money market investments purchased with collateral from securities onloan 0.19%Capital Group Central Cash Fund 0.04%5,7 — 17,8888 17,888 —9
Total short-term securities 504,642
Total 5.40% $(1) $(48) $504,642 $103
Global Growth Fund (continued)

32 American Funds Insurance Series
1Security did not produce income during the last 12 months.2All or a portion of this security was on loan. The total value of all such securities was $43,575,000, which represented .47% of the net assets of the fund. Refer toNote 5 for more information on securities lending.
3Valued under fair value procedures adopted by authority of the board of trustees. The total value of the security was $13,180,000, which represented .14% ofthe net assets of the fund.
4Acquired in a transaction exempt from registration under Rule 144A of the Securities Act of 1933. May be resold in the U.S. in transactions exempt fromregistration, normally to qualified institutional buyers. The total value of all such securities was $13,180,000, which represented .14% of the net assets of thefund.
5Rate represents the seven-day yield at 6/30/2021.6Part of the same “group of investment companies“ as the fund as defined under the Investment Company Act of 1940, as amended.7Security purchased with cash collateral from securities on loan. Refer to Note 5 for more information on securities lending.8Represents net activity. Refer to Note 5 for more information on securities lending.9Dividend income is included with securities lending income in the fund’s statement of operations and is not shown in this table.
Key to abbreviationADR = American Depositary Receipts
See notes to financial statements.
Global Growth Fund (continued)

American Funds Insurance Series 33
Common stocks 93.45% SharesValue(000)
Informationtechnology22.87%
Cree, Inc.1 1,166,056 $ 114,192Ceridian HCM Holding, Inc.1 647,135 62,073PAR Technology Corp.1,2 842,082 58,895Net One Systems Co., Ltd. 1,616,556 53,330BE Semiconductor Industries NV 610,276 51,769Silergy Corp. 275,740 37,507Kingdee International Software Group Co., Ltd.1 10,717,074 36,371Qorvo, Inc.1 181,818 35,573Unimicron Technology Corp. 6,678,300 30,920Olo, Inc., Class A1 820,670 30,685Bentley Systems, Inc., Class B2 455,043 29,478OneConnect Financial Technology Co., Ltd. (ADR)1 2,401,585 28,867Avast PLC 4,160,243 28,187eMemory Technology, Inc.1 573,000 27,455Appfolio, Inc., Class A1 193,616 27,338Asana, Inc., Class A1,2 430,100 26,679Nordic Semiconductor ASA1 992,291 25,147SUMCO Corp. 999,000 24,504Smartsheet, Inc., Class A1 337,600 24,415MACOMTechnology Solutions Holdings, Inc.1 380,000 24,350Avalara, Inc.1 149,119 24,127Pegasystems, Inc. 169,591 23,605SimCorp AS 187,352 23,517LEM Holding SA1 9,570 20,066Euronet Worldwide, Inc.1 140,000 18,949Tanla Platforms, Ltd.1 1,677,291 18,046SHIFT, Inc.1 114,800 17,784Silicon Laboratories, Inc.1 115,900 17,762Globant SA1 81,000 17,753Rapid7, Inc.1 182,297 17,251Keywords Studios PLC1 440,000 15,155ON Semiconductor Corp.1 395,000 15,121Anaplan, Inc.1 272,133 14,505Marvell Technology, Inc. 221,217 12,903Aspen Technology, Inc.1 93,100 12,805Network International Holdings PLC1 2,494,284 12,618Cognex Corp. 136,300 11,456GlobalWafers Co., Ltd. 311,000 10,258Computer Services, Inc. 163,500 9,197Megaport, Ltd.1 650,000 8,984INFICON Holding AG 7,397 8,554SINBON Electronics Co., Ltd.1 857,000 8,428MongoDB, Inc., Class A1 23,300 8,423DoubleVerify Holdings, Inc.1 188,100 7,964Extreme Networks, Inc.1 678,378 7,571ALTEN SA, non-registered shares 53,608 7,107Okta, Inc., Class A1 25,463 6,230Appier Group, Inc.1,2 422,700 6,008BigCommerce Holdings, Inc., Series 11 90,000 5,843Pexip Holding ASA1 627,882 5,608Alkami Technology, Inc.1 156,207 5,572Bechtle AG, non-registered shares 24,781 4,603Lightspeed POS, Inc., subordinate voting shares1 54,730 4,576Linklogis, Inc., Class B1,2 1,634,615 3,672Appen, Ltd. 269,793 2,752Yotpo, Ltd.1,3,4,5,6 678,736 1,418
1,193,926
Global Small Capitalization FundInvestment portfolio June 30, 2021 unaudited

34 American Funds Insurance Series
Common stocks (continued) SharesValue(000)
Health care19.30%
Insulet Corp.1 524,329 $ 143,934CanSino Biologics, Inc., Class H1 1,984,600 105,463Notre Dame Intermédica Participações SA 3,012,035 51,432Health Catalyst, Inc.1,2 922,700 51,219Applied Molecular Transport, Inc.1,2 1,071,152 48,995Cortexyme, Inc.1 689,544 36,546Integra LifeSciences Holdings Corp.1 530,900 36,229Globus Medical, Inc., Class A1 447,600 34,702Ocumension Therapeutics1,2 9,650,966 33,934Mani, Inc. 1,459,254 33,442Max Healthcare Institute, Ltd.1 9,064,851 31,037Allakos, Inc.1 354,275 30,244AddLife AB, Class B 982,427 30,191PRA Health Sciences, Inc.1 180,222 29,774New Frontier Health Corp., Class A1 2,324,870 25,969Haemonetics Corp.1 376,300 25,077Kronos Bio, Inc.1 1,006,990 24,117GVS SpA 1,350,919 22,122Nevro Corp.1 131,205 21,752CONMED Corp. 148,708 20,437Ultragenyx Pharmaceutical, Inc.1 189,727 18,090CompuGroup Medical SE & Co. KGaA 205,520 16,096Amplifon SpA 311,536 15,382Guardant Health, Inc.1 119,227 14,807New Horizon Health, Ltd.1 1,270,844 12,963Shandong Pharmaceutical Glass Co., Ltd., Class A 2,180,508 11,457Ambu AS, Class B, non-registered shares 266,155 10,232Medincell SA1,2 809,800 8,959Arjo AB, Class B 765,000 7,884BioMarin Pharmaceutical, Inc.1 92,000 7,677Alignment Healthcare, Inc.1 322,800 7,544iRhythm Technologies, Inc.1 113,527 7,533Bachem Holding AG, Class B 10,977 6,501Encompass Health Corp. 79,000 6,164Nordhealth AS, Class A1 1,279,999 5,679Angelalign Technology, Inc.1 102,000 5,263Antares Vision SpA1 281,100 3,900Madrigal Pharmaceuticals, Inc.1 38,000 3,702Innovage Holding Corp.1 52,579 1,120NMC Health PLC1,3,4 219,652 3
1,007,572
Consumerdiscretionary17.78%
Lands’ End, Inc.1,7 2,100,000 86,205Wyndham Hotels & Resorts, Inc. 768,069 55,524Shop Apotheke Europe NV, non-registered shares1 255,264 47,944Mattel, Inc.1 2,100,069 42,211Thor Industries, Inc. 369,500 41,754Coursera, Inc.1,3,6 975,534 35,119Coursera, Inc.1,2 111,000 4,391Five Below, Inc.1 199,700 38,596YETI Holdings, Inc.1 410,595 37,701Entain PLC1 1,513,050 36,533Helen of Troy, Ltd.1 160,000 36,499Everi Holdings, Inc.1 1,419,053 35,391Evolution AB 182,215 28,795Skechers USA, Inc., Class A1 550,000 27,407Tube Investments of India, Ltd. 1,627,714 25,591Tongcheng-Elong Holdings, Ltd.1 10,084,800 25,250zooplus AG, non-registered shares1 63,253 20,491SSP Group PLC1 5,542,395 20,424Inchcape PLC 1,871,000 19,890
Global Small Capitalization Fund (continued)

American Funds Insurance Series 35
Common stocks (continued) SharesValue(000)
Consumerdiscretionary(continued)
Kindred Group PLC (SDR) 1,150,611 $ 18,036Scientific Games Corp.1 223,732 17,326Arco Platform, Ltd., Class A1 538,725 16,517Asbury Automotive Group, Inc.1 87,582 15,009Melco International Development, Ltd.1 7,826,000 14,373Basic-Fit NV1,2 329,911 14,106Just Eat Takeaway (EUR denominated)1 150,679 13,913B2W - Cia. Digital, ordinary nominative shares1 1,010,093 13,456Desenio Group AB1 1,222,785 12,716Musti Group Oyj 327,550 12,126Leslie’s, Inc.1 420,664 11,564Bright Horizons Family Solutions, Inc.1 74,300 10,930Cie. Plastic Omnium SA 308,912 9,648Purple Innovation, Inc., Class A1 347,200 9,170Cairn Homes PLC1 6,829,200 8,644Golden Entertainment, Inc.1 179,300 8,033Zhongsheng Group Holdings, Ltd. 938,500 7,808Thule Group AB 155,900 6,911Elior Group SA1 882,500 6,593frontdoor, inc.1 131,200 6,536TopBuild Corp.1 32,600 6,448Sonans Gruppen AS1 802,602 5,127Dalata Hotel Group PLC1 800,000 3,740IDP Education, Ltd. 180,966 3,331DESCENTE, Ltd.1 106,700 2,973Countryside Properties PLC1 405,700 2,652OneSpaWorld Holdings, Ltd.1 245,538 2,379Leifheit AG, non-registered shares 36,773 2,045China Zenix Auto International, Ltd. (ADR)1 385,648 127
927,953
Industrials15.26%
Nihon M&ACenter, Inc. 2,077,284 53,870International Container Terminal Services, Inc. 14,412,500 48,332IMCD NV 276,065 43,897Boyd Group Services, Inc. 235,355 42,829Meggitt PLC1 6,500,850 41,474Stericycle, Inc.1 560,931 40,134Visional, Inc.1 599,900 32,939Instalco AB 730,713 30,311Interpump Group SpA 447,000 26,470Fasadgruppen Group AB 1,566,704 23,396Shoals Technologies Group, Inc., Class A1 607,450 21,564Japan Elevator Service Holdings Co., Ltd. 905,800 21,052Diploma PLC 487,000 19,563Nolato AB, Class B 1,851,000 18,211Alfen NV1 193,371 18,056Wizz Air Holdings PLC1 273,883 17,689Melrose Industries PLC 7,236,000 15,525VATGroup AG 45,815 15,231CleanawayWaste Management, Ltd. 7,580,970 15,009Centre Testing International Group Co., Ltd. 2,985,669 14,731Carel Industries SpA 583,425 14,009Vicor Corp., Class A1 131,328 13,887Avon Rubber PLC 383,500 13,878Marel hf. 1,971,482 13,833Woodward, Inc. 105,000 12,902Guangzhou Baiyun International Airport Co., Ltd., Class A 7,215,639 12,485Cargotec Corp., Class B, non-registered shares 233,700 12,082DL E&C Co., Ltd.1 87,568 11,042MDA, Ltd.1 823,400 10,794Montrose Environmental Group, Inc.1 190,800 10,238
Global Small Capitalization Fund (continued)

36 American Funds Insurance Series
Common stocks (continued) SharesValue(000)
Industrials(continued)
ACVAuctions, Inc., Class A1 362,033 $ 9,279Addtech AB, Class B 497,200 8,250IAA, Inc.1 141,750 7,731Atlas Corp. 500,000 7,125Cummins India, Ltd. 550,000 6,656Japan Airport Terminal Co., Ltd. 138,500 6,221CAE, Inc.1 200,000 6,160Kajaria Ceramics, Ltd. 450,000 5,933Rumo SA1 1,518,920 5,848Froy ASA1 873,400 5,828Imperial Logistics, Ltd. 1,643,000 5,456Sitowise Group PLC1 512,300 5,188LIXIL Corp. 196,500 5,082Granite Construction, Inc. 120,892 5,021BELIMO Holding AG 10,460 4,782Nitto Boseki Co., Ltd.2 132,500 4,091Howden Joinery Group PLC 357,556 4,039ITM Power PLC1,2 508,527 3,203Controladora Vuela Compañía de Aviación, SAB de CV,
ordinary participation certificates, Class A (ADR)1 135,800 2,609The AZEK Co., Inc., Class A1 54,400 2,310Matson, Inc. 8,674 555
796,800
Financials7.83%
Janus Henderson Group PLC 1,367,400 53,069Marqeta, Inc., Class B1,3,6 1,859,092 48,010Trupanion, Inc.1 393,869 45,334Star Health & Allied Insurance Co., Ltd.1,3,4,5 6,037,336 39,715Live Oak Bancshares, Inc. 579,250 34,176Eurobank Ergasias Services and Holdings SA1 26,815,236 27,027Cholamandalam Investment and Finance Co., Ltd. 3,684,053 25,438East West Bancorp, Inc. 287,300 20,597Independent Bank Group, Inc. 274,100 20,278Stifel Financial Corp. 271,050 17,580South State Corp. 213,300 17,439Aavas Financiers, Ltd.1 336,227 12,269IIFLWealth Management, Ltd. 677,558 10,614Indian Energy Exchange, Ltd. 2,000,000 10,094Multi Commodity Exchange of India, Ltd.1 417,000 8,536Capitec Bank Holdings, Ltd. 66,400 7,842IIFL Finance Ltd. 1,459,000 4,994SiriusPoint, Ltd.1 492,500 4,959PT Bank Rakyat Indonesia Agroniaga Tbk1 4,530,100 608
408,579
Consumer staples2.60%
Freshpet, Inc.1 300,695 49,001Grocery Outlet Holding Corp.1 911,400 31,589Monde Nissin Corp.1 76,219,800 25,794AAKAB 452,024 10,131Hilton Food Group PLC 586,277 8,872Total Produce PLC 1,292,800 4,047Vector Group, Ltd. 209,704 2,965Raia Drogasil SA, ordinary nominative shares 445,000 2,211Zur Rose Group AG1 3,131 1,200
135,810
Global Small Capitalization Fund (continued)

American Funds Insurance Series 37
Common stocks (continued) SharesValue(000)
Materials2.46%
Nanofilm Technologies International, Ltd.1 8,615,000 $ 35,172Navin Fluorine International, Ltd. 425,000 21,437PI Industries, Ltd. 537,999 21,065Lundin Mining Corp. 1,930,004 17,407MMG Ltd.1 18,704,000 8,239Vidrala, SA, non-registered shares 67,694 8,091ACC, Ltd. 230,000 6,234SKMaterials Co., Ltd. 16,400 5,128LANXESS AG 54,500 3,737Arkema SA 15,200 1,907
128,417
Communicationservices2.01%
Skillz Inc., Class A1,2 1,119,741 24,321Bandwidth, Inc., Class A1 112,900 15,571Trustpilot AS1 2,573,727 12,155DouYu International Holdings, Ltd. (ADR)1 1,435,368 9,818Boat Rocker Media, Inc.1 1,676,496 9,454Daily Mail and General Trust PLC, Class A, nonvoting shares 663,700 8,850Square Enix Holdings Co., Ltd. 143,200 7,102New York Times Co., Class A 135,000 5,879JCDecaux SA1 180,313 4,999Capcom Co., Ltd. 148,714 4,350Kamakura Shinsho, Ltd. 255,100 2,310Zee Entertainment Enterprises, Ltd. 1,815 5
104,814
Utilities1.50%
ENN Energy Holdings, Ltd. 3,249,700 61,861AC Energy Corp. 69,716,400 11,782Neoenergia SA 1,288,255 4,499
78,142
Real estate1.16%
Altus Group, Ltd. 436,402 20,225Embassy Office Parks REIT 3,656,800 17,238JHSF Participações SA 8,620,906 12,601Macrotech Developers, Ltd.1 582,697 5,359Mindspace Business Parks REIT 1,250,000 4,755Mitre Realty Empreendimentos e Participações SA 264,200 633
60,811
Energy0.68%
Pioneer Natural Resources Company 114,558 18,618Venture Global LNG, Inc., Series C1,3,4,5,6 2,760 13,392Aegis Logistics, Ltd.1 649,070 3,003NuVista Energy, Ltd.1 98,325 316Helmerich & Payne, Inc. 7,700 251
35,580
Total common stocks (cost: $2,629,196,000) 4,878,404
Preferred securities 1.88%
Informationtechnology1.30%
Avidxchange, Inc., Series F, preferred shares1,3,4,5 492,864 30,439SmartHR, Inc., Series D, preferred shares1,3,4,5 3,006 14,176Gitlab Inc., Series E, preferred shares1,3,4,5 297,916 12,092Yotpo, Ltd., Series F, preferred shares1,3,4,5,6 2,158,609 4,748Yotpo, Ltd., Series B, preferred shares1,3,4,5,6 287,894 602Yotpo, Ltd., Series C, preferred shares1,3,4,5,6 274,070 573Yotpo, Ltd., Series A-1, preferred shares1,3,4,5,6 183,819 384
Global Small Capitalization Fund (continued)

38 American Funds Insurance Series
Preferred securities (continued) SharesValue(000)
Informationtechnology(continued)
Yotpo, Ltd., Series A, preferred shares1,3,4,5,6 89,605 $ 187Yotpo, Ltd., Series C-1, preferred shares1,3,4,5,6 75,980 159Yotpo, Ltd., Series D, preferred shares1,3,4,5,6 42,368 88Yotpo, Ltd., Series B-1, preferred shares1,3,4,5,6 33,838 71Outreach Corp., Series G, preferred shares1,3,4,5 154,354 4,518
68,037
Industrials0.42%
Azul SA, preferred nominative shares (ADR)1 800,316 21,129Azul SA, preferred nominative shares1 109,500 966
22,095
Health care0.16%
PACT Pharma, Inc., Series C, 8.00% noncumulative preferred shares1,3,4,5 2,931,405 8,231
Total preferred securities (cost: $72,225,000) 98,363
Rights & warrants 0.54%
Informationtechnology0.48%
OPTMachine Vision Tech Co., Ltd., Class A, warrants, expire 20231,3,6 355,879 24,840
Consumer staples0.06%
Qingdao Richen Food Co., Ltd., Class A, warrants, expire 20221,3,6 345,000 3,333
Total rights & warrants (cost: $22,692,000) 28,173
Short-term securities 5.54%
Money market investments 4.10%
Capital Group Central Cash Fund 0.04%7,8 2,140,121 214,012
Money market investments purchased with collateral from securities on loan 1.44%
Goldman Sachs Financial Square Government Fund, Institutional Shares 0.02%8,9 41,322,097 41,322Capital Group Central Cash Fund 0.04%7,8,9 334,046 33,405Invesco Short-Term Investments Trust – Government & Agency Portfolio,
Institutional Class 0.03%8,9 219,407 219
74,946
Total short-term securities (cost: $288,962,000) 288,958
Total investment securities 101.41% (cost: $3,013,075,000) 5,293,898
Other assets less liabilities (1.41)% (73,486)
Net assets 100.00% $5,220,412
Global Small Capitalization Fund (continued)

American Funds Insurance Series 39
Investments in affiliates7
Value ofaffiliates at1/1/2021
(000)Additions
(000)Reductions
(000)
Netrealized
loss(000)
Netunrealized
appreciation(depreciation)
(000)
Value ofaffiliates at6/30/2021
(000)
Dividendincome
(000)
Common stocks 1.65%Consumer discretionary 1.65%
Lands’ End, Inc.1 $45,297 $ — $ — $ — $40,908 $ 86,205 $ —
Communication services 0.00%Boat Rocker Media, Inc.1,10 — 13,601 1,215 (321) (2,611) — —
Total common stocks 86,205
Short-term securities 4.74%Money market investments 4.10%
Capital Group Central Cash Fund 0.04%8 15,136 1,131,389 932,465 (41) (7) 214,012 68
Money market investments purchased with collateral from securitieson loan 0.64%Capital Group Central Cash Fund 0.04%8,9 — 33,40511 33,405 —12
Total short-term securities 247,417
Total 6.39% $(362) $38,290 $333,622 $68
Global Small Capitalization Fund (continued)

40 American Funds Insurance Series
1Security did not produce income during the last 12 months.2All or a portion of this security was on loan. The total value of all such securities was $83,042,000, which represented 1.59% of the net assets of the fund. Referto Note 5 for more information on securities lending.
3Valued under fair value procedures adopted by authority of the board of trustees. The total value of all such securities was $242,098,000, which represented4.64% of the net assets of the fund.
4Value determined using significant unobservable inputs.5Acquired through a private placement transaction exempt from registration under the Securities Act of 1933. May be subject to legal or contractual restrictionson resale. Further details on these holdings appear below.
6Acquired in a transaction exempt from registration under Rule 144A of the Securities Act of 1933. May be resold in the U.S. in transactions exempt fromregistration, normally to qualified institutional buyers. The total value of all such securities was $132,924,000, which represented 2.55% of the net assets of thefund.
7Affiliate of the fund or part of the same “group of investment companies“ as the fund, as defined under the Investment Company Act of 1940, as amended.8Rate represents the seven-day yield at 6/30/2021.9Security purchased with cash collateral from securities on loan. Refer to Note 5 for more information on securities lending.
10Unaffiliated issuer at 6/30/2021.11Represents net activity. Refer to Note 5 for more information on securities lending.12Dividend income is included with securities lending income in the fund’s statement of operations and is not shown in this table.
Private placement securitiesAcquisition
dateCost(000)
Value(000)
Percentof netassets
Star Health & Allied Insurance Co., Ltd. 3/30/2021 $ 40,710 $ 39,715 .76%
Avidxchange, Inc., Series F, preferred shares 12/26/2019 24,156 30,439 .58
SmartHR, Inc., Series D, preferred shares 5/28/2021 14,344 14,176 .27
Venture Global LNG, Inc., Series C 5/1/2015 8,280 13,392 .26
Gitlab Inc., Series E, preferred shares 9/11/2019 5,550 12,092 .23
PACT Pharma, Inc., Series C, 8.00% noncumulative preferred shares 2/7/2020 6,000 8,231 .16
Yotpo, Ltd., Series F, preferred shares 2/25/2021 4,748 4,748 .09
Yotpo, Ltd. 3/16/2021 1,418 1,418 .03
Yotpo, Ltd., Series B, preferred shares 3/16/2021 602 602 .01
Yotpo, Ltd., Series C, preferred shares 3/16/2021 573 573 .01
Yotpo, Ltd., Series A-1, preferred shares 3/16/2021 384 384 .01
Yotpo, Ltd., Series A, preferred shares 3/16/2021 187 187 .00
Yotpo, Ltd., Series C-1, preferred shares 3/16/2021 159 159 .00
Yotpo, Ltd., Series D, preferred shares 3/16/2021 89 88 .00
Yotpo, Ltd., Series B-1, preferred shares 3/16/2021 71 71 .00
Outreach Corp., Series G, preferred shares 5/27/2021 4,517 4,518 .09
Total private placement securities $111,788 $130,793 2.50%
Key to abbreviationsADR = American Depositary ReceiptsEUR = EurosSDR = Swedish Depositary Receipts
See notes to financial statements.
Global Small Capitalization Fund (continued)

American Funds Insurance Series 41
Common stocks 97.01% SharesValue(000)
Informationtechnology22.38%
Microsoft Corp. 8,314,185 $2,252,313Broadcom, Inc. 1,758,306 838,431ASML Holding NV 635,000 436,260ASML Holding NV (New York registered) (ADR) 352,484 243,510Taiwan Semiconductor Manufacturing Company, Ltd. 15,724,000 335,784Taiwan Semiconductor Manufacturing Company, Ltd. (ADR) 1,215,000 145,994RingCentral, Inc., Class A1 1,458,037 423,676PayPal Holdings, Inc.1 1,319,600 384,637Shopify, Inc., Class A, subordinate voting shares1 223,900 327,113Visa, Inc., Class A 1,325,853 310,011Apple, Inc. 1,750,027 239,684MicroStrategy, Inc., Class A1,2 335,914 223,215Mastercard, Inc., Class A 567,662 207,248FleetCor Technologies, Inc.1 717,832 183,808Cree, Inc.1 1,851,070 181,275Advanced Micro Devices, Inc.1 1,816,000 170,577MongoDB, Inc., Class A1 456,053 164,872Square, Inc., Class A1 642,243 156,579Applied Materials, Inc. 1,074,888 153,064Keyence Corp. 300,900 151,865Fidelity National Information Services, Inc. 884,718 125,338Micron Technology, Inc.1 1,447,335 122,995ServiceNow, Inc.1 221,680 121,824Tyler Technologies, Inc.1 263,200 119,064Ceridian HCM Holding, Inc.1 1,229,000 117,886Bill.Com Holdings, Inc.1 631,909 115,753VeriSign, Inc.1 399,943 91,063HubSpot, Inc.1 130,000 75,754Samsung Electronics Co., Ltd. 1,003,000 71,875Trimble, Inc.1 840,920 68,812Intel Corp. 1,136,000 63,775Cloudflare, Inc., Class A1 600,000 63,504ON Semiconductor Corp.1 1,622,519 62,110Elastic NV, non-registered shares1 379,422 55,305Qualtrics International, Inc., Class A1 1,396,101 53,401NetApp, Inc. 527,540 43,163Genpact, Ltd. 933,000 42,386Zendesk, Inc.1 293,000 42,292Adobe, Inc.1 69,034 40,429Flex, Ltd.1 2,234,300 39,927MKS Instruments, Inc. 217,800 38,757SK hynix, Inc. 330,800 37,452Enphase Energy, Inc.1 193,323 35,500Okta, Inc., Class A1 142,366 34,834Concentrix Corp.1 188,487 30,309EPAM Systems, Inc.1 52,839 26,999Fiserv, Inc.1 247,500 26,455Lam Research Corp. 40,617 26,429Motorola Solutions, Inc. 109,000 23,637Alteryx, Inc., Class A1 261,518 22,496Jack Henry & Associates, Inc. 137,000 22,401GoDaddy Inc., Class A1 213,800 18,592Smartsheet, Inc., Class A1 238,281 17,232Keysight Technologies, Inc.1 102,000 15,750Amadeus IT Group SA, Class A, non-registered shares1 196,096 13,793TELUS International (Cda), Inc., subordinate voting shares1 396,024 12,320SentinelOne, Inc., Class A1 218,400 9,282Stripe, Inc., Class B1,3,4,5 168,598 6,765Kulicke and Soffa Industries, Inc. 107,460 6,577
9,492,152
Growth FundInvestment portfolio June 30, 2021 unaudited

42 American Funds Insurance Series
Common stocks (continued) SharesValue(000)
Communicationservices20.43%
Facebook, Inc., Class A1 9,740,387 $3,386,830Netflix, Inc.1 3,177,003 1,678,125Alphabet, Inc., Class C1 479,158 1,200,923Alphabet, Inc., Class A1 118,216 288,659Snap, Inc., Class A1 8,109,000 552,547Charter Communications, Inc., Class A1 688,110 496,437Activision Blizzard, Inc. 4,642,429 443,074Comcast Corp., Class A 3,772,563 215,112T-Mobile US, Inc.1 1,333,440 193,122Zillow Group, Inc., Class C, nonvoting shares1 509,000 62,210Zillow Group, Inc., Class A1 245,000 30,020Live Nation Entertainment, Inc.1 517,000 45,284Pinterest, Inc., Class A1 521,333 41,159Bumble, Inc., Class A1 334,537 19,269Iridium Communications, Inc.1 245,040 9,799Match Group, Inc.1 13,602 2,193
8,664,763
Consumerdiscretionary17.50%
Tesla, Inc.1 4,564,000 3,102,151Amazon.com, Inc.1 298,383 1,026,485Dollar General Corp. 2,467,686 533,983Home Depot, Inc. 1,045,000 333,240LVMHMoët Hennessy-Louis Vuitton SE 330,000 258,765Domino’s Pizza, Inc. 433,000 201,990Toll Brothers, Inc. 3,280,000 189,617Hermès International 97,299 141,735Booking Holdings, Inc.1 64,759 141,698Airbnb, Inc., Class A1 897,564 137,453Burlington Stores, Inc.1 340,061 109,496Royal Caribbean Cruises, Ltd.1 1,272,346 108,506Caesars Entertainment, Inc.1 957,985 99,391Chipotle Mexican Grill, Inc.1 57,300 88,834YETI Holdings, Inc.1 940,000 86,311Floor & Decor Holdings, Inc., Class A1 769,300 81,315NIKE, Inc., Class B 480,400 74,217NVR, Inc.1 12,830 63,807Darden Restaurants, Inc. 433,876 63,342Aramark 1,395,000 51,964Etsy, Inc.1 202,000 41,580LGI Homes, Inc.1 248,150 40,185Westwing Group AG, non-registered shares1 707,000 38,680Norwegian Cruise Line Holdings, Ltd.1 1,182,996 34,792Flutter Entertainment PLC1 187,791 34,002Wynn Resorts, Ltd.1 276,822 33,855HiltonWorldwide Holdings, Inc.1 257,834 31,100Evolution AB 196,122 30,992adidas AG 75,097 27,952Cie. Financière Richemont SA, Class A 219,805 26,595lululemon athletica, inc.1 70,000 25,548Carvana Co., Class A1 68,400 20,644Marriott International, Inc., Class A1 128,000 17,475Dollar Tree Stores, Inc.1 172,468 17,161YUM! Brands, Inc. 129,700 14,919Aptiv PLC1 94,400 14,852EssilorLuxottica 69,400 12,808Wayfair Inc., Class A1 39,800 12,565Pool Corp. 26,203 12,018D.R. Horton, Inc. 131,644 11,897Peloton Interactive, Inc., Class A1 87,000 10,790
Growth Fund (continued)

American Funds Insurance Series 43
Common stocks (continued) SharesValue(000)
Consumerdiscretionary(continued)
Las Vegas Sands Corp.1 201,200 $ 10,601Arrival Group1 449,469 7,043Helen of Troy, Ltd.1 8,020 1,830
7,424,184
Health care12.61%
UnitedHealth Group, Inc. 1,935,186 774,926Intuitive Surgical, Inc.1 774,000 711,801Regeneron Pharmaceuticals, Inc.1 930,500 519,721NovoCure, Ltd.1 2,204,210 488,938Centene Corp.1 4,864,730 354,785Thermo Fisher Scientific, Inc. 674,500 340,265Vertex Pharmaceuticals, Inc.1 1,228,131 247,628Moderna, Inc.1 750,000 176,235Insulet Corp.1 582,500 159,902Teladoc Health, Inc.1 893,500 148,580Seagen, Inc.1 790,810 124,853Biohaven Pharmaceutical Holding Co., Ltd.1 1,012,086 98,253Exact Sciences Corp.1 610,000 75,829Abbott Laboratories 643,963 74,655Vir Biotechnology, Inc.1 1,555,475 73,543Oak Street Health, Inc.1 1,161,702 68,041DexCom, Inc.1 158,238 67,568Danaher Corp. 235,935 63,315Gilead Sciences, Inc. 899,185 61,918Edwards Lifesciences Corp.1 569,100 58,942CRISPR Therapeutics AG1 353,184 57,177Cigna Corp. 203,470 48,237Guardant Health, Inc.1 361,003 44,833Verily Life Sciences LLC1,3,4,5 300,178 44,823Catalent, Inc.1 385,000 41,626Eli Lilly and Company 169,500 38,904Galapagos NV1 527,552 36,582QIAGEN NV1 664,342 32,141AstraZeneca PLC 256,500 30,809Molina Healthcare, Inc.1 96,799 24,496Mettler-Toledo International, Inc.1 16,900 23,412Pacific Biosciences of California, Inc.1 619,579 21,667Humana Inc. 46,800 20,719Neurocrine Biosciences, Inc.1 203,800 19,834R1 RCM, Inc.1 888,000 19,749Syneos Health, Inc., Class A1 210,000 18,793Chemed Corp. 37,667 17,873Zimmer Biomet Holdings, Inc. 108,400 17,433Pfizer, Inc. 427,314 16,734Allogene Therapeutics, Inc.1 504,466 13,156Allakos, Inc.1 151,733 12,953Novavax, Inc.1 37,000 7,855Cortexyme, Inc.1 145,600 7,717Ultragenyx Pharmaceutical, Inc.1 67,100 6,398TG Therapeutics, Inc.1 155,200 6,020Incyte Corp.1 70,900 5,965Adaptive Biotechnologies Corp.1 141,048 5,763Agios Pharmaceuticals, Inc.1 95,882 5,284Global Blood Therapeutics, Inc.1 125,000 4,377Sana Biotechnology, Inc.1 179,600 3,531GoodRx Holdings, Inc., Class A1,2 97,500 3,511
5,348,070
Growth Fund (continued)

44 American Funds Insurance Series
Common stocks (continued) SharesValue(000)
Industrials8.58%
Uber Technologies, Inc.1 8,372,767 $ 419,643TransDigm Group, Inc.1 590,615 382,299Delta Air Lines, Inc.1 7,215,000 312,121Jacobs Engineering Group, Inc. 2,169,000 289,388Carrier Global Corp. 5,950,861 289,212United Rentals, Inc.1 591,000 188,535Caterpillar, Inc. 859,500 187,053MTU Aero Engines AG 687,220 170,227TuSimple Holdings, Inc., Class A1,2 1,918,260 136,657Airbus SE, non-registered shares1 944,893 121,497Dun & Bradstreet Holdings, Inc.1 4,746,028 101,423Middleby Corp.1 449,500 77,880CSX Corp. 2,335,500 74,923Ryanair Holdings PLC (ADR)1 634,951 68,708Ryanair Holdings PLC1 96,554 1,827Safran SA 489,640 67,883ArmstrongWorld Industries, Inc. 616,904 66,169Southwest Airlines Co.1 1,100,000 58,399Lockheed Martin Corp. 149,500 56,563Emerson Electric Co. 577,000 55,530BWX Technologies, Inc. 937,200 54,470Norfolk Southern Corp. 176,000 46,712HEICO Corp. 185,951 25,925HEICO Corp., Class A 148,813 18,480Equifax, Inc. 176,000 42,154Boeing Company1 170,000 40,725Rockwell Automation 126,000 36,038Northrop Grumman Corp. 98,700 35,871AMETEK, Inc. 253,600 33,856L3Harris Technologies, Inc. 155,000 33,503ITT, Inc. 343,000 31,415FedEx Corp. 99,600 29,714Waste Connections, Inc. 222,159 26,532Parker-Hannifin Corp. 71,215 21,871Komatsu, Ltd. 611,400 15,192Generac Holdings, Inc.1 31,762 13,186Lennox International, Inc. 18,700 6,560
3,638,141
Financials6.36%
Bank of America Corp. 14,780,700 609,408First Republic Bank 1,805,457 337,927Capital One Financial Corp. 1,399,000 216,411SVB Financial Group1 329,467 183,325Intercontinental Exchange, Inc. 1,517,049 180,074S&P Global, Inc. 395,300 162,251BlackRock, Inc. 150,000 131,245KKR & Co., Inc. 1,849,977 109,593Athene Holding, Ltd., Class A1 1,355,912 91,524Western Alliance Bancorporation 932,501 86,583Marsh & McLennan Companies, Inc. 546,720 76,913MSCI, Inc. 117,900 62,850Arch Capital Group, Ltd.1 1,255,267 48,880London Stock Exchange Group PLC 426,339 47,003Progressive Corp. 420,000 41,248Moody’s Corp. 102,277 37,062The Blackstone Group, Inc. 360,000 34,970East West Bancorp, Inc. 443,509 31,795Brookfield Asset Management, Inc., Class A 585,103 29,829Aon PLC, Class A 110,000 26,264CME Group, Inc., Class A 121,648 25,872American International Group, Inc. 458,394 21,820
Growth Fund (continued)

American Funds Insurance Series 45
Common stocks (continued) SharesValue(000)
Financials(continued)
Ares Management Corp., Class A 310,500 $ 19,745Bright Health Group, Inc.1 1,140,681 19,574Everest Re Group, Ltd. 66,500 16,759Berkshire Hathaway, Inc., Class A1 26 10,883Berkshire Hathaway, Inc., Class B1 17,400 4,836BNP Paribas SA 180,106 11,291PNC Financial Services Group, Inc. 51,565 9,837Trupanion, Inc.1 69,355 7,983Goosehead Insurance, Inc., Class A 15,416 1,962Brookfield Asset Management Reinsurance Partners, Ltd., Class A1 4,035 210
2,695,927
Consumer staples3.20%
Kroger Co. 8,641,839 331,069Philip Morris International, Inc. 2,865,403 283,990CostcoWholesale Corp. 496,404 196,412Constellation Brands, Inc., Class A 694,000 162,320Altria Group, Inc. 2,804,349 133,711British American Tobacco PLC 2,907,900 112,630Estée Lauder Companies, Inc., Class A 158,486 50,411Molson Coors Beverage Company, Class B, restricted voting shares1 629,400 33,793Monster Beverage Corp.1 305,000 27,862Anheuser-Busch InBev SA/NV 201,028 14,495Church & Dwight Co., Inc. 104,177 8,878
1,355,571
Materials2.91%
Vale SA, ordinary nominative shares (ADR) 14,736,177 336,132Wheaton Precious Metals Corp. 3,674,000 161,913LyondellBasell Industries NV 1,223,605 125,872Grupo México, SAB de CV, Series B 25,356,800 119,266Franco-Nevada Corp. 752,000 109,130Barrick Gold Corp. 4,058,000 83,920Royal Gold, Inc. 517,000 58,990Celanese Corp. 350,400 53,121CF Industries Holdings, Inc. 1,029,000 52,942Allegheny Technologies, Inc.1 2,070,860 43,177Sherwin-Williams Company 90,658 24,700Linde PLC 81,300 23,504PPG Industries, Inc. 103,623 17,592Ball Corp. 194,200 15,734Nucor Corp. 69,742 6,690Summit Materials, Inc., Class A1 87,600 3,053
1,235,736
Energy2.23%
Halliburton Company 12,143,661 280,761Canadian Natural Resources, Ltd. (CAD denominated) 5,420,400 196,772Canadian Natural Resources, Ltd. 105,100 3,813EOG Resources, Inc. 1,493,750 124,639Cenovus Energy ,Inc. 12,798,618 122,452Suncor Energy, Inc. 2,789,000 66,800Pioneer Natural Resources Company 328,000 53,307Cimarex Energy Co. 438,200 31,748ConocoPhillips 455,980 27,769Chesapeake Energy Corp. 345,000 17,912Schlumberger, Ltd. 363,800 11,645Equitrans Midstream Corp. 936,942 7,973
945,591
Growth Fund (continued)

46 American Funds Insurance Series
Common stocks (continued) SharesValue(000)
Utilities0.59%
NextEra Energy, Inc. 1,280,000 $ 93,799PG&E Corp.1 5,296,610 53,867Xcel Energy, Inc. 680,000 44,798AES Corp. 1,397,884 36,443Ørsted AS 146,685 20,583
249,490
Real estate0.22%
Equinix, Inc. REIT 84,384 67,727Pebblebrook Hotel Trust REIT 692,559 16,310Park Hotels & Resorts, Inc. REIT1 566,011 11,665
95,702
Total common stocks (cost: $18,214,511,000) 41,145,327
Preferred securities 0.17%
Informationtechnology0.14%
Samsung Electronics Co., Ltd., nonvoting preferred shares 531,000 34,751PsiQuantum, Corp., Series D, preferred shares1,3,4,5 906,761 23,781Stripe, Inc., Series H, 6.00% noncumulative preferred shares1,3,4,5 52,656 2,112
60,644
Health care0.03%
Grail, Inc., Series D, preferred shares1,3,4,5 1,864,884 11,115
Total preferred securities (cost: $57,568,000) 71,759
Convertible bonds & notes 0.06%Principal amount
(000)
Consumer staples0.06%
JUUL Labs, Inc., convertible notes, 7.00% 2025 (100% PIK)3,4,5,6 $ 41,866 25,195
Total convertible bonds & notes (cost: $41,200,000) 25,195
Short-term securities 2.65% Shares
Money market investments 2.57%
Capital Group Central Cash Fund 0.04%7,8 10,876,313 1,087,632
Money market investments purchased with collateral from securities on loan 0.08%
Goldman Sachs Financial Square Government Fund, Institutional Shares 0.02%7,9 19,693,764 19,694Capital Group Central Cash Fund 0.04%7,8,9 159,204 15,920Invesco Short-Term Investments Trust – Government & Agency Portfolio,
Institutional Class 0.03%7,9 104,567 104
35,718
Total short-term securities (cost: $1,123,347,000) 1,123,350
Total investment securities 99.89% (cost: $19,436,626,000) 42,365,631
Other assets less liabilities 0.11% 47,982
Net assets 100.00% $42,413,613
Growth Fund (continued)

American Funds Insurance Series 47
Investments in affiliates8
Value ofaffiliates at1/1/2021
(000)Additions
(000)Reductions
(000)
Netrealized
loss(000)
Netunrealized
depreciation(000)
Value ofaffiliates at6/30/2021
(000)
Dividendincome
(000)
Short-term securities 2.61%Money market investments 2.57%
Capital Group Central Cash Fund 0.04%7 $1,623,691 $2,514,137 $3,050,080 $(13) $(103) $1,087,632 $479
Money market investments purchased with collateral fromsecurities on loan 0.04%Capital Group Central Cash Fund 0.04%7,9 — 15,92010 15,920 —11
Total short-term securities 1,103,552
Total 2.61% $(13) $(103) $1,103,552 $479
1Security did not produce income during the last 12 months.2All or a portion of this security was on loan. The total value of all such securities was $38,885,000, which represented .09% of the net assets of the fund. Refer toNote 5 for more information on securities lending.
3Valued under fair value procedures adopted by authority of the board of trustees. The total value of all such securities was $113,791,000, which represented.27% of the net assets of the fund.
4Value determined using significant unobservable inputs.5Acquired through a private placement transaction exempt from registration under the Securities Act of 1933. May be subject to legal or contractual restrictionson resale. Further details on these holdings appear below.
6Payment in kind; the issuer has the option of paying additional securities in lieu of cash. Most recent payment was 100% cash unless otherwise noted.7Rate represents the seven-day yield at 6/30/2021.8Part of the same “group of investment companies“ as the fund as defined under the Investment Company Act of 1940, as amended.9Security purchased with cash collateral from securities on loan. Refer to Note 5 for more information on securities lending.
10Represents net activity. Refer to Note 5 for more information on securities lending.11Dividend income is included with securities lending income in the fund’s statement of operations and is not shown in this table.
Private placement securitiesAcquisition
date(s)Cost(000)
Value(000)
Percentof netassets
Verily Life Sciences LLC 12/21/2018 $ 37,000 $ 44,823 .10%
JUUL Labs, Inc., convertible notes, 7.00% 2025 (100% PIK) 2/3/2020-5/3/2021 41,200 25,195 .06
PsiQuantum, Corp., Series D, preferred shares 5/28/2021 23,781 23,781 .06
Grail, Inc., Series D, preferred shares 4/17/2020 9,526 11,115 .03
Stripe, Inc., Class B 5/6/2021 6,766 6,765 .02
Stripe, Inc., Series H, 6.00% noncumulative preferred shares 3/15/2021 2,113 2,112 .00
Total private placement securities $120,386 $113,791 .27%
Key To abbreviationsADR = American Depositary ReceiptsCAD = Canadian dollars
See notes to financial statements.
Growth Fund (continued)

48 American Funds Insurance Series
Common stocks 94.86% SharesValue(000)
Financials20.00%
AIA Group, Ltd. 27,885,576 $ 346,581HDFC Bank, Ltd. 9,334,386 188,107HDFC Bank, Ltd. (ADR) 277,000 20,254Banco Santander, SA 52,040,526 198,666Kotak Mahindra Bank, Ltd.1 8,191,348 187,989ABN AMRO Bank NV1 14,394,921 173,965Deutsche Bank AG1 11,620,682 151,379BNP Paribas SA 1,964,000 123,124Barclays PLC 46,610,000 110,331Sberbank of Russia PJSC (ADR) 4,253,000 70,621XP, Inc., Class A1 1,291,559 56,247Ping An Insurance (Group) Company of China, Ltd., Class H 4,761,500 46,638Ping An Insurance (Group) Company of China, Ltd., Class A 962,202 9,572Aegon NV2 12,263,736 50,881Axis Bank, Ltd.1 3,890,055 39,162Bajaj Finserv, Ltd.1 210,962 34,368Futu Holdings, Ltd. (ADR)1 165,300 29,604B3 SA-Brasil, Bolsa, Balcao 8,125,600 27,478KBC Groep NV 277,700 21,173FinecoBank SpA1 1,211,135 21,111Bajaj Finance, Ltd.1 244,400 19,780ING Groep NV 1,486,000 19,629Lufax Holding, Ltd. (ADR)1,2 1,655,427 18,706PICC Property and Casualty Co., Ltd., Class H 20,936,000 18,336IndusInd Bank, Ltd.1 941,500 12,874Allfunds Group PLC1 718,245 12,501
2,009,077
Health care12.53%
Daiichi Sankyo Company, Ltd. 10,688,500 230,376WuXi Biologics (Cayman), Inc.1 11,584,200 212,309Olympus Corp. 5,290,400 105,146Fresenius SE & Co. KGaA 1,675,154 87,388Grifols, SA, Class A, non-registered shares2 2,691,000 72,879Grifols, SA, Class B (ADR) 793,690 13,770Chugai Pharmaceutical Co., Ltd. 2,007,200 79,533M3, Inc. 921,200 67,273WuXi AppTec Co., Ltd., Class A 2,367,360 57,372WuXi AppTec Co., Ltd., Class H 312,000 7,285Hikma Pharmaceuticals PLC 1,772,394 59,970Teva Pharmaceutical Industries, Ltd. (ADR)1 5,673,498 56,168Aier Eye Hospital Group Co., Ltd., Class A 4,612,081 50,664Notre Dame Intermédica Participações SA 2,760,862 47,143Alcon, Inc. 439,639 30,781CanSino Biologics, Inc., Class H1 440,000 23,382Merck KGaA 110,400 21,168Ping An Healthcare and Technology Co., Ltd., Class H1 1,293,000 16,103HOYA Corp. 95,000 12,596Ambu AS, Class B, non-registered shares 205,254 7,891NMC Health PLC1,3,4 449,500 6
1,259,203
Industrials12.46%
Airbus SE, non-registered shares1 2,709,349 348,376Recruit Holdings Co., Ltd. 3,271,109 161,060Melrose Industries PLC 45,834,933 98,339NIBE Industrier AB, Class B 9,301,304 97,838Safran SA 701,300 97,227Ryanair Holdings PLC (ADR)1 787,400 85,204Ryanair Holdings PLC1 348,056 6,587International Consolidated Airlines Group SA (CDI)1 22,925,000 55,249MTU Aero Engines AG 182,000 45,082
International FundInvestment portfolio June 30, 2021 unaudited

American Funds Insurance Series 49
Common stocks (continued) SharesValue(000)
Industrials(continued)
International Container Terminal Services, Inc. 12,890,350 $ 43,228ASSAABLOYAB, Class B 1,432,047 43,138Brenntag SE 227,391 21,144ZTO Express (Cayman), Inc., Class A (ADR) 685,354 20,801SMC Corp. 34,700 20,505Nihon M&ACenter, Inc. 657,010 17,038Rumo SA1 4,301,900 16,563CCR SA, ordinary nominative shares 5,580,000 15,089Bureau Veritas SA1 386,000 12,211Airports of Thailand PCL, foreign registered shares 6,239,500 12,074LIXIL Corp. 441,700 11,423Diploma PLC 253,700 10,191Ashtead Group PLC 121,000 8,978Alliance Global Group, Inc. 20,000,000 4,163
1,251,508
Consumerdiscretionary11.84%
MercadoLibre, Inc.1 180,203 280,718Delivery Hero SE1 986,587 130,321Prosus NV 999,450 97,735Meituan, Class B1 2,368,100 97,722Sony Group Corp. 864,500 84,158Just Eat Takeaway (GBP denominated)1 452,560 41,894Just Eat Takeaway (EUR denominated)1 277,964 25,665LVMHMoët Hennessy-Louis Vuitton SE 67,873 53,222B2W - Cia. Digital, ordinary nominative shares1 3,734,000 49,744Evolution AB 305,145 48,221Kering SA 47,338 41,369Maruti Suzuki India, Ltd. 392,000 39,637Galaxy Entertainment Group, Ltd.1 4,108,000 32,883Naspers, Ltd., Class N 147,000 30,864Flutter Entertainment PLC (CDI)1 158,674 28,852Ferrari NV (EUR denominated) 111,135 22,929EssilorLuxottica 84,200 15,539H &M Hennes & Mauritz AB, Class B1 606,225 14,380adidas AG 37,538 13,972Melco Resorts & Entertainment, Ltd. (ADR)1 817,781 13,551Bandai Namco Holdings, Inc. 146,442 10,160Pan Pacific International Holdings Corp. 417,200 8,660Astra International Tbk PT 19,726,000 6,720
1,188,916
Informationtechnology10.48%
Taiwan Semiconductor Manufacturing Company, Ltd. 6,182,000 132,016ASML Holding NV 166,945 114,695PagSeguro Digital, Ltd., Class A1 1,671,400 93,465StoneCo, Ltd., Class A1 1,340,200 89,874Nomura Research Institute, Ltd. 2,361,700 78,124Nice, Ltd. (ADR) 302,700 74,906Atlassian Corp. PLC, Class A1 267,500 68,710Delta Electronics, Inc. 6,220,409 67,646Samsung Electronics Co., Ltd. 631,500 45,253Fujitsu Ltd. 222,500 41,658Keyence Corp. 77,200 38,963NXP Semiconductors NV 173,200 35,631Infineon Technologies AG 728,000 29,194Avast PLC 4,289,000 29,060Silergy Corp. 176,000 23,940Suse SA1,2 593,940 23,276Hexagon AB, Class B 1,272,600 18,855OBIC Co., Ltd. 87,900 16,386
International Fund (continued)

50 American Funds Insurance Series
Common stocks (continued) SharesValue(000)
Informationtechnology(continued)
Afterpay, Ltd.1 120,994 $ 10,723ASM International NV 31,648 10,395Xero, Ltd.1 95,031 9,771
1,052,541
Materials7.74%
Vale SA, ordinary nominative shares (ADR) 20,069,542 457,786Vale SA, ordinary nominative shares 770,681 17,548First QuantumMinerals, Ltd. 6,680,300 153,966Linde PLC (EUR denominated) 207,300 59,817Shin-Etsu Chemical Co., Ltd. 184,400 30,840BASF SE 325,193 25,619Akzo Nobel NV 112,728 13,928Koninklijke DSM NV 58,300 10,881Yunnan Energy NewMaterial Co., Ltd., Class A 141,500 5,127Ivanhoe Mines Ltd., Class A1 352,000 2,541
778,053
Energy7.33%
Reliance Industries, Ltd. 12,705,735 360,788Reliance Industries, Ltd., interim shares 196,599 3,933Petróleo Brasileiro SA (Petrobras), ordinary nominative shares (ADR) 11,598,192 141,846Neste Oyj 1,576,125 96,510TotalEnergies SE 1,147,298 51,906Cenovus Energy ,Inc. 4,993,100 47,772Canadian Natural Resources, Ltd. (CAD denominated) 558,600 20,278Royal Dutch Shell PLC, Class A (GBP denominated) 530,100 10,609Royal Dutch Shell PLC, Class B 128,207 2,481
736,123
Communicationservices6.69%
Bilibili, Inc., Class Z (ADR)1 810,306 98,728Bilibili, Inc., Class Z1 208,200 25,635Tencent Holdings, Ltd. 1,647,609 123,927Sea, Ltd., Class A (ADR)1 348,800 95,780Square Enix Holdings Co., Ltd. 1,385,200 68,702SoftBank Corp. 4,438,300 58,068SoftBank Group Corp. 690,548 48,328Bharti Airtel, Ltd. 6,504,615 46,000Kuaishou Technology, Class B1,3,5 1,378,100 31,810Kuaishou Technology, Class B1 130,900 3,284Yandex NV, Class A1 275,200 19,470Playtika Holding Corp.1 687,500 16,390Scout24 AG1 154,000 12,987Vivendi SA2 343,933 11,553América Móvil, SAB de CV, Series L (ADR) 409,657 6,145América Móvil, SAB de CV, Series L 2,139,900 1,610Z Holdings Corp. 766,200 3,840
672,257
Consumer staples2.90%
Danone SA 813,500 57,269KweichowMoutai Co., Ltd., Class A 141,840 45,148Treasury Wine Estates, Ltd. 4,942,835 43,296Heineken NV 201,973 24,476Inner Mongolia Yili Industrial Group Co., Ltd., Class A 4,219,603 24,051Swedish Match AB 2,705,450 23,071Shiseido Company, Ltd. 268,200 19,726Pernod Ricard SA 87,577 19,440
International Fund (continued)

American Funds Insurance Series 51
Common stocks (continued) SharesValue(000)
Consumer staples(continued)
CP ALL PCL, foreign registered shares 9,053,300 $ 16,954Chocoladefabriken Lindt & Sprüngli AG 102 10,682Dabur India, Ltd. 980,000 7,499
291,612
Utilities2.72%
ENN Energy Holdings, Ltd. 11,219,800 213,578China Gas Holdings, Ltd. 19,477,800 59,455
273,033
Real estate0.17%
Ayala Land, Inc. 23,109,600 17,067
Total common stocks (cost: $6,403,582,000) 9,529,390
Preferred securities 1.83%
Energy1.18%
Petróleo Brasileiro SA (Petrobras), preferred nominative shares (ADR) 6,336,898 74,839Petróleo Brasileiro SA (Petrobras), preferred nominative shares 7,331,500 43,380
118,219
Health care0.53%
Grifols, SA, Class B, nonvoting non-registered preferred shares 3,026,230 53,108
Consumerdiscretionary0.12%
Volkswagen AG, nonvoting preferred shares 49,526 12,403
Total preferred securities (cost: $154,504,000) 183,730
Rights & warrants 0.26%
Health care0.26%
WuXi AppTec Co., Ltd., Class A, warrants, expire 20221,3,5 1,075,200 26,057
Total rights & warrants (cost: $20,683,000) 26,057
Short-term securities 2.61%
Money market investments 2.45%
Capital Group Central Cash Fund 0.04%6,7 2,456,390 245,639
Money market investments purchased with collateral from securities on loan 0.16%
Goldman Sachs Financial Square Government Fund, Institutional Shares 0.02%6,8 9,073,099 9,073Capital Group Central Cash Fund 0.04%6,7,8 73,347 7,335Invesco Short-Term Investments Trust – Government & Agency Portfolio,
Institutional Class 0.03%6,8 48,175 48
16,456
Total short-term securities (cost: $262,071,000) 262,095
Total investment securities 99.56% (cost: $6,840,840,000) 10,001,272
Other assets less liabilities 0.44% 44,090
Net assets 100.00% $10,045,362
International Fund (continued)

52 American Funds Insurance Series
Investments in affiliates7
Value ofaffiliates at1/1/2021
(000)Additions
(000)Reductions
(000)
Netrealized
loss(000)
Netunrealized
depreciation(000)
Value ofaffiliates at6/30/2021
(000)
Dividendincome
(000)
Short-term securities 2.52%Money market investments 2.45%
Capital Group Central Cash Fund 0.04%6 $523,844 $2,062,229 $2,340,380 $(14) $(40) $245,639 $191
Money market investments purchased with collateral from securitieson loan 0.07%Capital Group Central Cash Fund 0.04%6,8 — 7,3359 7,335 —10
Total short-term securities 252,974
Total 2.52% $(14) $(40) $252,974 $191
1Security did not produce income during the last 12 months.2All or a portion of this security was on loan. The total value of all such securities was $18,837,000, which represented .19% of the net assets of the fund. Refer toNote 5 for more information on securities lending.
3Valued under fair value procedures adopted by authority of the board of trustees. The total value of all such securities was $57,873,000, which represented.58% of the net assets of the fund.
4Value determined using significant unobservable inputs.5Acquired in a transaction exempt from registration under Rule 144A of the Securities Act of 1933. May be resold in the U.S. in transactions exempt fromregistration, normally to qualified institutional buyers. The total value of all such securities was $57,867,000, which represented .58% of the net assets of thefund.
6Rate represents the seven-day yield at 6/30/2021.7Part of the same “group of investment companies“ as the fund as defined under the Investment Company Act of 1940, as amended.8Security purchased with cash collateral from securities on loan. Refer to Note 5 for more information on securities lending.9Represents net activity. Refer to Note 5 for more information on securities lending.
10Dividend income is included with securities lending income in the fund’s statement of operations and is not shown in this table.
Key to abbreviationsADR = American Depositary ReceiptsCAD = Canadian dollarsCDI = CREST Depository InterestEUR = EurosGBP = British pounds
See notes to financial statements.
International Fund (continued)

American Funds Insurance Series 53
Common stocks 91.07% SharesValue(000)
Informationtechnology19.77%
Microsoft Corp. 420,593 $113,939Taiwan Semiconductor Manufacturing Company, Ltd. 4,068,000 86,872PayPal Holdings, Inc.1 283,183 82,542PagSeguro Digital, Ltd., Class A1 1,143,943 63,969Silergy Corp. 407,000 55,362Adobe, Inc.1 79,315 46,450ASML Holding NV 59,957 41,192Broadcom, Inc. 79,217 37,774StoneCo, Ltd., Class A1 494,347 33,151Keyence Corp. 64,800 32,705Cree, Inc.1 296,765 29,062Mastercard, Inc., Class A 75,781 27,667EPAM Systems, Inc.1 53,051 27,107Apple, Inc. 143,063 19,594Micron Technology, Inc.1 199,960 16,993Samsung Electronics Co., Ltd. 230,894 16,546Network International Holdings PLC1 2,750,461 13,914Accenture PLC, Class A 41,622 12,270Visa, Inc., Class A 45,465 10,631Kingdee International Software Group Co., Ltd.1 2,646,000 8,980Hexagon AB, Class B 559,454 8,289TELUS International (Cda), Inc., subordinate voting shares1 250,470 7,792Nice, Ltd. (ADR) 27,289 6,753Advanced Micro Devices, Inc.1 71,707 6,735Tokyo Electron, Ltd. 15,200 6,578Edenred SA 111,695 6,364Cognizant Technology Solutions Corp., Class A 87,831 6,083Nokia Corp.1 1,085,473 5,812NetEase, Inc. 244,700 5,544Trimble, Inc.1 65,051 5,323NXP Semiconductors NV 25,406 5,226MediaTek, Inc. 147,000 5,075Atlassian Corp. PLC, Class A1 18,809 4,831Logitech International SA 35,956 4,356Halma PLC 115,640 4,306Marvell Technology, Inc. 70,257 4,098GDS Holdings, Ltd., Class A1 398,400 3,946Globant SA1 16,962 3,718Autodesk, Inc.1 11,824 3,451ON Semiconductor Corp.1 77,914 2,982Aspen Technology, Inc.1 19,914 2,739Yeahka Ltd.1 398,400 2,506Chindata Group Holdings, Ltd., Class A (ADR)1 164,996 2,490OneConnect Financial Technology Co., Ltd. (ADR)1 187,563 2,254FleetCor Technologies, Inc.1 8,136 2,083VeriSign, Inc.1 8,923 2,032KLA Corp. 5,708 1,851Hamamatsu Photonics KK 29,000 1,749Intel Corp. 30,635 1,720Linklogis, Inc., Class B1 725,500 1,630SAP SE 11,071 1,560Elastic NV, non-registered shares1 10,295 1,501CMCMaterials, Inc. 8,338 1,257Applied Materials, Inc. 8,266 1,177Infineon Technologies AG 28,823 1,156Amadeus IT Group SA, Class A, non-registered shares1 14,929 1,050Coforge, Ltd. 18,289 1,023Nu Holdings, Ltd., Class A1,2,3,4 12,397 496Fabrinet, non-registered shares1 4,700 450
914,706
NewWorld FundInvestment portfolio June 30, 2021 unaudited

54 American Funds Insurance Series
Common stocks (continued) SharesValue(000)
Health care12.77%
Zai Lab, Ltd. (ADR)1 373,043 $ 66,025Thermo Fisher Scientific, Inc. 93,089 46,961WuXi Biologics (Cayman), Inc.1 2,148,600 39,378Carl Zeiss Meditec AG, non-registered shares 197,151 38,093WuXi AppTec Co., Ltd., Class A 1,010,659 24,493WuXi AppTec Co., Ltd., Class H 525,200 12,264CanSino Biologics, Inc., Class H1 611,518 32,496Abbott Laboratories 240,086 27,833Notre Dame Intermédica Participações SA 1,412,658 24,122Pharmaron Beijing Co., Ltd., Class H 447,200 11,923Pharmaron Beijing Co., Ltd., Class A 258,000 8,664BeiGene, Ltd. (ADR)1 49,272 16,910BeiGene, Ltd.1 49,700 1,352AstraZeneca PLC 145,296 17,452PerkinElmer, Inc. 106,856 16,500Danaher Corp. 53,915 14,469BioMarin Pharmaceutical, Inc.1 167,372 13,966CSL, Ltd. 55,815 11,938Aier Eye Hospital Group Co., Ltd., Class A 1,001,253 10,999Jiangsu Hengrui Medicine Co., Ltd., Class A 958,177 10,079Koninklijke Philips NV 180,711 8,955Medtronic PLC 71,506 8,876Olympus Corp. 431,100 8,568Shionogi & Co., Ltd. 159,500 8,314Novo Nordisk A/S, Class B 94,388 7,908Straumann Holding AG 4,859 7,746Hypera SA, ordinary nominative shares 1,108,918 7,685Laurus Labs, Ltd. 816,515 7,565Asahi Intecc Co., Ltd. 296,700 7,093Hugel, Inc.1 28,025 5,963Pfizer, Inc. 141,271 5,532Teva Pharmaceutical Industries, Ltd. (ADR)1 550,859 5,454Zoetis, Inc., Class A 29,114 5,426Ping An Healthcare and Technology Co., Ltd., Class H1,5 394,900 4,918Grifols, SA, Class A, non-registered shares 177,368 4,804Eli Lilly and Company 18,928 4,344Hikma Pharmaceuticals PLC 122,808 4,155Hutchmed China Ltd. (HKD denominated)1 352,500 2,738Hutchison China MediTech Ltd. (ADR)1 24,790 973Alcon, Inc. 52,853 3,700Baxter International, Inc. 45,935 3,698HOYA Corp. 26,300 3,487Guangzhou Kingmed Diagnostics Group Co., Ltd., Class A 106,133 2,624bioMérieux SA 20,845 2,422Mettler-Toledo International, Inc.1 1,570 2,175OdontoPrev SA, ordinary nominative shares 818,190 2,143Rede D’Or Sao Luiz SA 139,666 1,938Alibaba Health Information Technology, Ltd.1 810,600 1,798Hangzhou Tigermed Consulting Co., Ltd., Class A 56,371 1,686Merck KGaA 6,156 1,180Novartis AG 9,955 907Shandong Pharmaceutical Glass Co., Ltd., Class A 66,700 350NMC Health PLC1,2,3 49,400 1
591,043
Consumerdiscretionary12.62%
MercadoLibre, Inc.1 54,559 84,991LVMHMoët Hennessy-Louis Vuitton SE 58,279 45,699General Motors Company1 669,943 39,641Meituan, Class B1 669,800 27,640Hermès International 18,887 27,513Li Ning Co., Ltd. 2,230,501 27,234
NewWorld Fund (continued)

American Funds Insurance Series 55
Common stocks (continued) SharesValue(000)
Consumerdiscretionary(continued)
Evolution AB 132,575 $ 20,950Galaxy Entertainment Group, Ltd.1 2,616,000 20,940Xpeng, Inc., Class A (ADR)1 448,338 19,915Pop Mart International Group, Ltd.5 1,895,721 18,800EssilorLuxottica 100,652 18,575Kering SA 14,165 12,379adidas AG 31,261 11,636JD Health International, Inc.1 722,450 10,356Booking Holdings, Inc.1 4,571 10,002China MeiDong Auto Holdings, Ltd. 1,816,000 9,905Naspers, Ltd., Class N 43,073 9,044Alibaba Group Holding, Ltd.1 210,800 5,973Alibaba Group Holding, Ltd. (ADR)1 13,490 3,059NIKE, Inc., Class B 56,614 8,746Marriott International, Inc., Class A1 63,151 8,621Zhongsheng Group Holdings, Ltd. 1,016,500 8,457YUM! Brands, Inc. 73,319 8,434Cie. Financière Richemont SA, Class A 68,251 8,258Delivery Hero SE1 57,692 7,621Gree Electric Appliances, Inc. of Zhuhai, Class A 933,746 7,529Wyndham Hotels & Resorts, Inc. 93,354 6,749Melco Resorts & Entertainment, Ltd. (ADR)1 388,822 6,443Jumbo SA 362,261 6,095Huazhu Group, Ltd. (ADR)1 113,439 5,991Industria de Diseño Textil, SA 167,427 5,898Trip.com Group, Ltd. (ADR)1 164,455 5,832JD.com, Inc., Class A1 147,500 5,802Midea Group Co., Ltd., Class A 510,211 5,636IDP Education, Ltd. 263,377 4,847Astra International Tbk PT 13,071,600 4,453Samsonite International SA1 2,050,500 4,194Wynn Macau, Ltd.1 2,588,400 4,074Aptiv PLC1 24,248 3,815Lojas Americanas SA, ordinary nominative shares 885,022 3,676Airbnb, Inc., Class A1 20,039 3,069Domino’s Pizza, Inc. 6,251 2,916Maruti Suzuki India, Ltd. 27,343 2,765SAIC Motor Corp., Ltd., Class A1 791,400 2,691Inchcape PLC 236,248 2,511Suzuki Motor Corp. 57,200 2,420Shangri-La Asia, Ltd.1 2,212,000 2,165Flutter Entertainment PLC (CDI)1 11,607 2,111Wynn Resorts, Ltd.1 13,198 1,614Entain PLC1 57,643 1,392Stellantis NV 67,946 1,333Levi Strauss & Co., Class A 39,011 1,081Vivo Energy PLC 795,978 1,061Jiumaojiu International Holdings, Ltd. 239,000 977Cyrela Brazil Realty SA, ordinary nominative shares 119,389 560
584,089
Financials11.81%
Kotak Mahindra Bank, Ltd.1 2,928,184 67,201HDFC Bank, Ltd. 2,839,911 57,230HDFC Bank, Ltd. (ADR) 74,181 5,424AIA Group, Ltd. 4,698,400 58,395Société Générale 1,173,681 34,598Sberbank of Russia PJSC (ADR) 1,459,582 24,255Ping An Insurance (Group) Company of China, Ltd., Class H 2,218,300 21,728Ping An Insurance (Group) Company of China, Ltd., Class A 36,100 359Capitec Bank Holdings, Ltd. 182,970 21,609B3 SA-Brasil, Bolsa, Balcao 6,200,123 20,967
NewWorld Fund (continued)

56 American Funds Insurance Series
Common stocks (continued) SharesValue(000)
Financials(continued)
Bajaj Finance, Ltd.1 252,982 $ 20,475UniCredit SpA 1,573,395 18,563Banco Santander, SA 4,561,650 17,414ICICI Bank, Ltd. (ADR)1 796,728 13,624ICICI Bank, Ltd.1 358,668 3,044XP, Inc., Class A1 328,325 14,299S&P Global, Inc. 32,531 13,352Bajaj Finserv, Ltd.1 79,103 12,887TCS Group Holding PLC (GDR) 119,451 10,452TCS Group Holding PLC (GDR)6 20,618 1,804HDFC Life Insurance Company, Ltd. 1,223,937 11,301China Merchants Bank Co., Ltd., Class H 1,129,500 9,638Hong Kong Exchanges and Clearing, Ltd. 146,200 8,714Futu Holdings, Ltd. (ADR)1 46,495 8,327Moody’s Corp. 22,106 8,011Banco Bilbao Vizcaya Argentaria, SA 1,211,896 7,513Discovery Ltd.1 753,689 6,664Fairfax Financial Holdings, Ltd., subordinate voting shares 12,758 5,595Lufax Holding, Ltd. (ADR)1,5 490,068 5,538Eurobank Ergasias Services and Holdings SA1 5,022,665 5,062AU Small Finance Bank, Ltd.1 300,953 4,194DBS Group Holdings, Ltd. 189,073 4,191Bank Mandiri (Persero) Tbk PT 8,884,800 3,615Bank Rakyat Indonesia (Persero) Tbk PT 13,089,500 3,557UBS Group AG 218,535 3,344Alpha Services and Holdings SA1 2,425,814 3,101Chubb, Ltd. 14,630 2,325Axis Bank, Ltd.1 209,315 2,107China Construction Bank Corp., Class H 1,944,000 1,530Banco Santander México, SA, Institución de Banca Múltiple, Grupo Financiero
Santander México, Class B 1,155,373 1,453Moscow Exchange MICEX-RTS PJSC 438,203 1,023Bank of the Philippine Islands 560,460 1,018Postal Savings Bank of China Co., Ltd., Class H1 1,477,000 995
546,496
Communicationservices9.62%
Tencent Holdings, Ltd. 1,028,800 77,382Sea, Ltd., Class A (ADR)1 255,605 70,189Alphabet, Inc., Class C1 20,910 52,407Alphabet, Inc., Class A1 4,250 10,378Facebook, Inc., Class A1 164,340 57,143Bilibili, Inc., Class Z (ADR)1 211,464 25,765Bilibili, Inc., Class Z1 165,720 20,404Netflix, Inc.1 44,087 23,287Yandex NV, Class A1 298,519 21,120América Móvil, SAB de CV, Series L (ADR) 1,216,260 18,244Kuaishou Technology, Class B1,2,6 370,500 8,552Kuaishou Technology, Class B1 188,100 4,719Vodafone Group PLC 6,523,370 10,949Activision Blizzard, Inc. 108,885 10,392MTN Group, Ltd.1 990,170 7,158NetEase, Inc. (ADR) 55,315 6,375Bharti Airtel, Ltd. 852,173 6,026Indus Towers, Ltd. 1,812,264 5,819JCDecaux SA1 165,485 4,588JOYY Inc., Class A (ADR) 24,450 1,613Informa PLC1 180,371 1,252SoftBank Group Corp. 15,900 1,113
444,875
NewWorld Fund (continued)

American Funds Insurance Series 57
Common stocks (continued) SharesValue(000)
Materials6.80%
Vale SA, ordinary nominative shares (ADR) 2,480,659 $ 56,584Vale SA, ordinary nominative shares 2,323,898 52,913First QuantumMinerals, Ltd. 1,402,899 32,334Sika AG 68,997 22,558Asian Paints, Ltd. 482,025 19,407Freeport-McMoRan, Inc. 393,723 14,611Shin-Etsu Chemical Co., Ltd. 52,300 8,747Rio Tinto PLC 102,377 8,425Shree Cement, Ltd.1 22,712 8,404Koninklijke DSM NV 37,642 7,025Givaudan SA 1,508 7,013Barrick Gold Corp. 289,034 5,977CEMEX, SAB de CV, ordinary participation certificates, units (ADR)1 706,208 5,932BHP Group PLC 196,384 5,786Linde PLC 18,929 5,472LANXESS AG 75,618 5,184Alrosa PJSC 2,511,114 4,615Beijing Oriental YuhongWaterproof Technology Co., Ltd., Class A 524,793 4,493CCL Industries, Inc., Class B, nonvoting shares 78,723 4,336Loma Negra Compania Industrial Argentina SA (ADR) 565,048 3,848AngloGold Ashanti, Ltd. (ADR) 112,446 2,089AngloGold Ashanti, Ltd. 70,895 1,318SIG Combibloc Group AG 115,777 3,146Arkema SA 22,838 2,865Impala Platinum Holdings, Ltd. 157,876 2,604Huntsman Corp. 97,795 2,594Chr. Hansen Holding A/S 26,439 2,386Gerdau SA (ADR) 360,285 2,126Celanese Corp. 13,955 2,116Amcor PLC (CDI) 162,847 1,848Umicore SA 29,864 1,824Albemarle Corp. 8,600 1,449BASF SE 17,068 1,345Asahi Kasei Corp. 120,900 1,328Anglo American PLC 22,331 887Ivanhoe Mines Ltd., Class A1 57,912 418Yunnan Energy NewMaterial Co., Ltd., Class A 11,400 413Navin Fluorine International, Ltd. 5,332 269
314,689
Industrials5.93%
Airbus SE, non-registered shares1 319,205 41,044Safran SA 153,091 21,224CCR SA, ordinary nominative shares 6,819,064 18,440IMCD NV 104,759 16,658DSV Panalpina A/S 66,744 15,565Wizz Air Holdings PLC1 236,177 15,254International Container Terminal Services, Inc. 4,079,710 13,681InPost SA1 613,724 12,318Nidec Corp. 105,300 12,203Copa Holdings, SA, Class A1 127,975 9,640Rumo SA1 2,492,542 9,597Shenzhen Inovance Technology Co., Ltd., Class A 730,019 8,390Ryanair Holdings PLC (ADR)1 74,848 8,099TransDigm Group, Inc.1 11,513 7,452SMC Corp. 12,100 7,150Centre Testing International Group Co., Ltd. 1,069,696 5,278Spirax-Sarco Engineering PLC 27,717 5,220Boeing Company1 20,316 4,867ZTO Express (Cayman), Inc., Class A (ADR) 148,533 4,508Fortive Corp. 62,884 4,386Epiroc AB, Class B 173,396 3,403
NewWorld Fund (continued)

58 American Funds Insurance Series
Common stocks (continued) SharesValue(000)
Industrials(continued)
Interpump Group SpA 57,089 $ 3,381Daikin Industries, Ltd. 17,000 3,166Hitachi, Ltd. 52,900 3,029Fluidra, SA, non-registered shares1 74,421 2,952ABB, Ltd. 79,505 2,697Carrier Global Corp. 54,243 2,636Havells India, Ltd. 177,904 2,346Air Lease Corp., Class A 43,452 1,814Atlas Copco AB, Class B 34,211 1,799Komatsu, Ltd. 63,800 1,585Experian PLC 34,307 1,322Contemporary Amperex Technology Co., Ltd., Class A1 14,800 1,225Zhejiang Sanhua Intelligent Controls Co., Ltd., Class A 308,200 1,144Hefei Meyer Optoelectronic Technology, Inc., Class A 97,000 837China Merchants Port Holdings Co., Ltd. 44,000 64
274,374
Consumer staples5.08%
KweichowMoutai Co., Ltd., Class A 209,807 66,782Nestlé SA 115,164 14,341Bunge, Ltd. 163,719 12,795Anheuser-Busch InBev SA/NV 170,197 12,272Foshan Haitian Flavouring and Food Co., Ltd., Class A 574,859 11,472Carlsberg A/S, Class B 53,713 10,012Pernod Ricard SA 44,752 9,934Raia Drogasil SA, ordinary nominative shares 1,529,164 7,597British American Tobacco PLC 177,641 6,880Avenue Supermarts, Ltd.1 137,253 6,175Reckitt Benckiser Group PLC 62,718 5,550Wal-Mart de México, SAB de CV, Series V 1,632,389 5,329ITC, Ltd. 1,887,463 5,147Heineken NV 40,609 4,921Constellation Brands, Inc., Class A 19,550 4,573United Spirits, Ltd.1 511,633 4,554Unilever PLC (EUR denominated) 72,965 4,271Shiseido Company, Ltd. 55,200 4,060Wuliangye Yibin Co., Ltd., Class A1 78,771 3,632Monde Nissin Corp.1 8,760,500 2,965China Feihe, Ltd. 1,342,000 2,897Kimberly-Clark de México, SAB de CV, Class A 1,587,474 2,817L’Oréal SA, non-registered shares 6,217 2,770Mondelez International, Inc. 39,158 2,445Philip Morris International, Inc. 23,692 2,348X5 Retail Group NV (GDR)1 65,840 2,305Herbalife Nutrition, Ltd.1 41,972 2,213Nongfu Spring Co., Ltd., Class H 434,805 2,181Fomento Económico Mexicano, SAB de CV 252,300 2,128Dabur India, Ltd. 240,307 1,839Inner Mongolia Yili Industrial Group Co., Ltd., Class A 318,900 1,818Danone SA 23,668 1,666Kimberly-Clark Corp. 10,828 1,449Yihai International Holding, Ltd.5 190,000 1,276Uni-Charm Corp. 20,600 829Diageo PLC 11,617 556Arca Continental, SAB de CV1 5,600 32
234,831
Energy3.10%
Reliance Industries, Ltd. 2,721,572 77,281Reliance Industries, Ltd., interim shares 151,056 3,022Petróleo Brasileiro SA (Petrobras), ordinary nominative shares (ADR) 2,526,905 30,904Gazprom PJSC (ADR) 1,153,377 8,791
NewWorld Fund (continued)

American Funds Insurance Series 59
Common stocks (continued) SharesValue(000)
Energy(continued)
New Fortress Energy, Inc., Class A 145,420 $ 5,508Rosneft Oil Company PJSC (GDR) 675,946 5,232Chevron Corp. 36,633 3,837Royal Dutch Shell PLC, Class B 165,815 3,209Schlumberger, Ltd. 88,995 2,849TotalEnergies SE 60,026 2,716Thungela Resources Ltd.1 2,233 6
143,355
Real estate1.94%
Shimao Services Holdings, Ltd. 5,650,187 19,539American Tower Corp. REIT 46,781 12,637ESR Cayman, Ltd.1 2,929,000 9,884BR Malls Participacoes SA, ordinary nominative shares1 4,247,895 8,660Longfor Group Holdings, Ltd. 1,391,500 7,796CK Asset Holdings, Ltd. 913,000 6,303China Resources Land, Ltd. 1,444,000 5,849Sunac Services Holdings, Ltd. 1,311,496 4,873KE Holdings, Inc., Class A (ADR)1 89,095 4,248CTP NV1 207,680 4,186Shimao Group Holdings, Ltd. 1,228,500 3,013Ayala Land, Inc. 3,874,200 2,861
89,849
Utilities1.63%
ENN Energy Holdings, Ltd. 1,561,800 29,730China Gas Holdings Ltd. 4,740,600 14,470AES Corp. 520,975 13,582Engie SA 568,071 7,783China Resources Gas Group, Ltd. 1,016,000 6,098Enel SpA 387,890 3,602
75,265
Total common stocks (cost: $2,427,146,000) 4,213,572
Preferred securities 1.17%
Industrials0.30%
Azul SA, preferred nominative shares (ADR)1 344,485 9,094GOL Linhas Aéreas Inteligentes SA, preferred nominative shares1,5 849,684 3,922GOL Linhas Aéreas Inteligentes SA, preferred nominative shares (ADR)1 72,525 669
13,685
Materials0.28%
Gerdau SA, preferred nominative shares 2,129,085 12,675
Consumerdiscretionary0.26%
Volkswagen AG, nonvoting preferred shares 34,304 8,591Getir BV, Series H, preferred shares1,2,3,4 7,768 3,500
12,091
Informationtechnology0.13%
Nu Holdings, Ltd., Series G, noncumulative preferred shares1,2,3,4 112,623 4,504Nu Holdings, Ltd., Series A, noncumulative preferred shares1,2,3,4 19,235 769Nu Holdings, Ltd., Series Seed, noncumulative preferred shares1,2,3,4 15,954 638Nu Holdings, Ltd., Series B, noncumulative preferred shares1,2,3,4 1,101 44Nu Holdings, Ltd., Series D, noncumulative preferred shares1,2,3,4 585 23
5,978
NewWorld Fund (continued)

60 American Funds Insurance Series
Preferred securities (continued) SharesValue(000)
Real estate0.11%
QuintoAndar Servicos Imobiliarios Ltda., Series E, preferred shares1,2,3,4 32,657 $ 5,258Ayala Land, Inc., preferred shares1,2,3 15,000,000 —7
5,258
Health care0.07%
Grifols, SA, Class B, nonvoting non-registered preferred shares 179,977 3,158
Energy0.02%
Petróleo Brasileiro SA (Petrobras), preferred nominative shares 182,615 1,081
Total preferred securities (cost: $35,099,000) 53,926
Rights & warrants 0.19%
Consumer staples0.19%
Foshan Haitian Flavouring and Food Co., Ltd., Class A, warrants, expire 20221,2,6 437,008 8,721
Consumerdiscretionary0.00%
Cie. Financière Richemont SA, Class A, warrants, expire 20231 144,354 97
Total rights & warrants (cost: $2,776,000) 8,818
Bonds, notes & other debt instruments 2.56%Principal amount
(000)
Bonds & notes of governments & government agencies outside the U.S. 2.23%
Abu Dhabi (Emirate of) 2.50% 20296 $ 1,415 1,481Abu Dhabi (Emirate of) 1.70% 20316 455 440Angola (Republic of) 8.25% 2028 200 209Angola (Republic of) 8.00% 20296 2,800 2,880Angola (Republic of) 8.00% 2029 200 206Argentine Republic 1.00% 2029 384 147Argentine Republic 0.125% 2030 (0.50% on 7/9/2021)8 757 273Argentine Republic 0.125% 2035 (1.125% on 7/9/2021)8 4,190 1,337Argentine Republic 0.125% 2038 (2.00% on 7/9/2021)8 1,318 500Argentine Republic 0.125% 2041 (2.50% on 7/9/2021)8 5,900 2,115Armenia (Republic of) 7.15% 2025 490 558Bahrain (Kingdom of) 6.75% 20296 500 550Belarus (Republic of) 6.875% 2023 1,775 1,768Belarus (Republic of) 5.875% 2026 230 213Belarus (Republic of) 7.625% 2027 335 328Colombia (Republic of) 4.50% 2026 830 908Colombia (Republic of) 3.25% 2032 900 884Colombia (Republic of) 7.375% 2037 600 791Colombia (Republic of) 4.125% 2051 350 333Costa Rica (Republic of) 4.375% 2025 234 243Costa Rica (Republic of) 6.125% 20316 1,250 1,329Costa Rica (Republic of) 6.125% 2031 593 631Cote d’Ivoire (Republic of) 4.875% 2032 € 150 178Dominican Republic 9.75% 2026 DOP18,150 360Dominican Republic 8.625% 20276 $ 575 706Dominican Republic 11.375% 2029 DOP12,800 272Dominican Republic 4.50% 20306 $ 180 184Dominican Republic 5.30% 20416 303 303Dominican Republic 7.45% 20446 1,125 1,359Dominican Republic 7.45% 2044 1,100 1,329Dominican Republic 6.85% 2045 100 113Dominican Republic 5.875% 20606 280 280Egypt (Arab Republic of) 5.75% 20246 450 480Egypt (Arab Republic of) 5.625% 2030 € 260 311
NewWorld Fund (continued)

American Funds Insurance Series 61
Bonds, notes & other debt instruments (continued)Principal amount
(000)Value(000)
Bonds & notes of governments & government agencies outside the U.S. (continued)
Egypt (Arab Republic of) 5.875% 20316 $ 365 $ 356Egypt (Arab Republic of) 7.625% 20326 1,140 1,213Egypt (Arab Republic of) 8.50% 2047 1,200 1,254Egypt (Arab Republic of) 8.15% 20596 900 903Ethiopia (Federal Democratic Republic of) 6.625% 2024 1,430 1,326Export-Import Bank of India 3.25% 2030 1,180 1,201Gabonese Republic 6.375% 2024 2,160 2,307Georgia (Republic of) 2.75% 20266 375 383Ghana (Republic of) 7.875% 2027 200 212Ghana (Republic of) 7.75% 20296 1,125 1,153Ghana (Republic of) 8.125% 2032 1,880 1,911Guatemala (Republic of) 4.375% 2027 400 437Honduras (Republic of) 6.25% 2027 1,600 1,754Indonesia (Republic of) 6.625% 2037 700 968Indonesia (Republic of) 5.25% 2042 840 1,049Iraq (Republic of) 6.752% 2023 960 985Jordan (Hashemite Kingdom of) 4.95% 20256 600 625Jordan (Hashemite Kingdom of) 5.75% 20276 1,530 1,649Jordan (Hashemite Kingdom of) 5.75% 2027 200 215Kazakhstan (Republic of) 6.50% 20456 800 1,172Kenya (Republic of) 7.25% 2028 400 443Kenya (Republic of) 8.25% 20486 2,200 2,427Malaysia (Federation of), Series 0419, 3.828% 2034 MYR430 103Malaysia (Federation of), Series 0418, 4.893% 2038 1,150 301Oman (Sultanate of) 4.875% 20256 $ 202 212Oman (Sultanate of) 6.25% 20316 890 958Pakistan (Islamic Republic of) 8.25% 20256 410 455Pakistan (Islamic Republic of) 6.00% 20266 380 386Pakistan (Islamic Republic of) 6.875% 20276 1,050 1,093Pakistan (Islamic Republic of) 7.875% 2036 400 412Panama (Republic of) 3.75% 20266 1,380 1,492Panama (Republic of) 4.50% 2047 1,155 1,317Panama (Republic of) 4.50% 2050 400 455Panama (Republic of) 4.30% 2053 400 445Paraguay (Republic of) 5.00% 20266 500 571Paraguay (Republic of) 4.70% 20276 800 911Paraguay (Republic of) 4.70% 2027 500 569Paraguay (Republic of) 4.95% 2031 320 368Peru (Republic of) 6.55% 2037 1,070 1,477Peru (Republic of) 2.78% 2060 565 505PETRONAS Capital, Ltd. 4.55% 20506 400 495Philippines (Republic of) 1.648% 2031 780 754Philippines (Republic of) 6.375% 2034 820 1,159Philippines (Republic of) 3.95% 2040 900 1,002Philippines (Republic of) 2.95% 2045 990 958PT Indonesia Asahan Aluminium Tbk 6.757% 2048 200 260Qatar (State of) 4.50% 20286 3,000 3,546Qatar (State of) 4.50% 2028 800 946Romania 2.00% 2032 €1,375 1,652Romania 2.00% 2033 530 625Romania 5.125% 20486 $ 720 884Russian Federation 4.375% 20296 800 903Russian Federation 5.10% 2035 1,200 1,430Russian Federation 5.25% 2047 1,000 1,259Senegal (Republic of) 4.75% 2028 €1,100 1,364Serbia (Republic of) 3.125% 2027 850 1,123South Africa (Republic of) 5.875% 2030 $2,110 2,412Sri Lanka (Democratic Socialist Republic of) 5.75% 2022 450 414Sri Lanka (Democratic Socialist Republic of) 5.875% 2022 1,410 1,198Sri Lanka (Democratic Socialist Republic of) 6.85% 2025 700 471Sri Lanka (Democratic Socialist Republic of) 6.825% 2026 1,270 816
NewWorld Fund (continued)

62 American Funds Insurance Series
Bonds, notes & other debt instruments (continued)Principal amount
(000)Value(000)
Bonds & notes of governments & government agencies outside the U.S. (continued)
Sri Lanka (Democratic Socialist Republic of) 7.55% 2030 $ 800 $ 506Sri Lanka (Democratic Socialist Republic of) 7.55% 20306 500 316Tunisia (Republic of) 6.75% 2023 € 310 357Tunisia (Republic of) 6.75% 2023 215 247Tunisia (Republic of) 5.625% 2024 710 787Tunisia (Republic of) 5.75% 2025 $ 875 819Turkey (Republic of) 6.375% 2025 475 498Turkey (Republic of) 11.875% 2030 600 831Turkey (Republic of) 5.875% 2031 1,170 1,140Turkey (Republic of) 4.875% 2043 1,295 1,035Turkey (Republic of) 5.75% 2047 2,205 1,890Ukraine 7.75% 2027 2,328 2,568Ukraine 9.75% 2028 700 836Ukraine 7.375% 2032 2,180 2,298United Mexican States 3.90% 2025 320 356United Mexican States 4.50% 2029 1,070 1,211United Mexican States 4.75% 2032 870 998United Mexican States 4.75% 2044 1,090 1,208United Mexican States 3.75% 2071 400 366United Mexican States, Series M, 7.50% 2027 MXN19,000 994Venezuela (Bolivarian Republic of) 7.00% 20189 $ 64 6Venezuela (Bolivarian Republic of) 7.75% 20199 1,149 124Venezuela (Bolivarian Republic of) 6.00% 20209 950 94Venezuela (Bolivarian Republic of) 12.75% 20229 85 9Venezuela (Bolivarian Republic of) 9.00% 20239 1,383 141Venezuela (Bolivarian Republic of) 8.25% 20249 299 32Venezuela (Bolivarian Republic of) 7.65% 20259 129 13Venezuela (Bolivarian Republic of) 11.75% 20269 64 7Venezuela (Bolivarian Republic of) 9.25% 20279 170 18Venezuela (Bolivarian Republic of) 9.25% 20289 319 33Venezuela (Bolivarian Republic of) 11.95% 20319 106 11Venezuela (Bolivarian Republic of) 7.00% 20389 107 11
103,403
Corporate bonds, notes & loans 0.33%
Energy0.10%
Oleoducto Central SA 4.00% 20276 255 263Petrobras Global Finance Co. 5.60% 2031 575 645Petrobras Global Finance Co. 6.75% 2050 110 129Petrobras Global Finance Co. 6.85% 2115 314 359Petróleos Mexicanos 6.875% 20256 624 692Petróleos Mexicanos 6.875% 2026 755 826Petróleos Mexicanos 7.47% 2026 MXN2,800 126Petróleos Mexicanos 6.49% 2027 $ 910 962PTT Exploration and Production PCL 2.587% 20276 320 332Sinopec Group Overseas Development (2018), Ltd. 3.10% 20516 370 359
4,693
Financials0.06%
Bangkok Bank PCL 3.733% 2034(5-year UST Yield Curve Rate T Note Constant Maturity + 1.90% on 9/25/2029)8 1,140 1,185
Power Financial Corp., Ltd. 5.25% 2028 425 478Power Financial Corp., Ltd. 6.15% 2028 432 512Power Financial Corp., Ltd. 4.50% 2029 273 293Power Financial Corp., Ltd. 3.35% 2031 310 304
2,772
NewWorld Fund (continued)

American Funds Insurance Series 63
Bonds, notes & other debt instruments (continued)Principal amount
(000)Value(000)
Corporate bonds, notes & loans (continued)
Utilities0.04%
AES Panama Generation Holdings SRL 4.375% 20306 $ 280 $ 293Empresas Publicas de Medellin ESP 4.25% 20296 412 409Empresas Publicas de Medellin ESP 4.375% 20316 360 356State Grid Overseas Investment, Ltd. 3.50% 20276 330 364State Grid Overseas Investment, Ltd. 4.25% 2028 200 230
1,652
Communicationservices0.04%
Axiata SPV5 Labuan, Ltd. 3.064% 2050 357 343PLDT, Inc. 2.50% 2031 210 208Tencent Holdings, Ltd. 3.975% 2029 400 447Tencent Holdings, Ltd. 3.24% 20506 580 569
1,567
Consumerdiscretionary0.03%
Alibaba Group Holding, Ltd. 2.125% 2031 463 456Alibaba Group Holding, Ltd. 3.15% 2051 610 601MercadoLibre, Inc. 3.125% 2031 200 197Sands China, Ltd. 4.375% 2030 220 239
1,493
Materials0.03%
Braskem Idesa SAPI 7.45% 2029 775 824Braskem Idesa SAPI 7.45% 20296 300 319GC Treasury Center Co., Ltd. 2.98% 20316 200 205
1,348
Industrials0.02%
Empresa de Transporte de Pasajeros Metro SA 4.70% 20506 270 305Mexico City Airport Trust 4.25% 2026 675 735
1,040
Consumer staples0.01%
MARB BondCo PLC 3.95% 20316 600 579
Total corporate bonds, notes & loans 15,144
Total bonds, notes & other debt instruments (cost: $114,263,000) 118,547
Short-term securities 5.15% Shares
Money market investments 5.09%
Capital Group Central Cash Fund 0.04%10,11 2,354,521 235,452
Money market investments purchased with collateral from securities on loan 0.06%
Goldman Sachs Financial Square Government Fund, Institutional Shares 0.02%10,12 1,576,823 1,577Capital Group Central Cash Fund 0.04%10,11,12 12,747 1,275Invesco Short-Term Investments Trust – Government & Agency Portfolio,
Institutional Class 0.03%10,12 8,373 8
2,860
Total short-term securities (cost: $238,326,000) 238,312
Total investment securities 100.14% (cost: $2,817,610,000) 4,633,175
Other assets less liabilities (0.14)% (6,499)
Net assets 100.00% $4,626,676
NewWorld Fund (continued)

64 American Funds Insurance Series
Futures contracts
Contracts TypeNumber ofcontracts Expiration
Notionalamount13
(000)
Value at6/30/202114
(000)
Unrealized(depreciation)appreciationat 6/30/2021
(000)
10 Year Ultra U.S. Treasury Note Futures Short 83 September 2021 $(8,300) $(12,218) $(157)30 Year Ultra U.S. Treasury Bond Futures Long 37 September 2021 3,700 7,130 147
$ (10)
Forward currency contracts
Contract amount
CounterpartySettlement
date
Unrealizedappreciationat 6/30/2021
(000)Purchases
(000)Sales(000)
USD3,426 EUR2,830 Citibank 7/16/2021 $69
Investments in affiliates11
Value ofaffiliates at1/1/2021
(000)Additions
(000)Reductions
(000)
Netrealized
loss(000)
Netunrealized
depreciation(000)
Value ofaffiliates at6/30/2021
(000)
Dividendincome
(000)
Short-term securities 5.12%Money market investments 5.09%
Capital Group Central Cash Fund 0.04%10 $224,497 $400,715 $389,733 $(5) $(22) $235,452 $115
Money market investments purchased with collateral from securities onloan 0.03%Capital Group Central Cash Fund 0.04%10,12 — 1,27515 1,275 —16
Total short-term securities 236,727
Total 5.12% $(5) $(22) $236,727 $115
1Security did not produce income during the last 12 months.2Valued under fair value procedures adopted by authority of the board of trustees. The total value of all such securities was $32,506,000, which represented.70% of the net assets of the fund.
3Value determined using significant unobservable inputs.4Acquired through a private placement transaction exempt from registration under the Securities Act of 1933. May be subject to legal or contractual restrictionson resale. Further details on these holdings appear on the following page.
5All or a portion of this security was on loan. The total value of all such securities was $11,836,000, which represented .26% of the net assets of the fund. Refer toNote 5 for more information on securities lending.
6Acquired in a transaction exempt from registration under Rule 144A of the Securities Act of 1933. May be resold in the U.S. in transactions exempt fromregistration, normally to qualified institutional buyers. The total value of all such securities was $56,217,000, which represented 1.22% of the net assets of thefund.
7Amount less than one thousand.8Step bond; coupon rate may change at a later date.9Scheduled interest and/or principal payment was not received.
10Rate represents the seven-day yield at 6/30/2021.11Part of the same “group of investment companies“ as the fund as defined under the Investment Company Act of 1940, as amended.12Security purchased with cash collateral from securities on loan. Refer to Note 5 for more information on securities lending.13Notional amount is calculated based on the number of contracts and notional contract size.14Value is calculated based on the notional amount and current market price.15Represents net activity. Refer to Note 5 for more information on securities lending.16Dividend income is included with securities lending income in the fund’s statement of operations and is not shown in this table.
NewWorld Fund (continued)

American Funds Insurance Series 65
Private placement securitiesAcquisition
dateCost(000)
Value(000)
Percentof netassets
Nu Holdings, Ltd., Series G, noncumulative preferred shares 1/27/2021 $ 3,831 $ 4,504 .10%
Nu Holdings, Ltd., Series A, noncumulative preferred shares 1/27/2021 654 769 .02
Nu Holdings, Ltd., Series Seed, noncumulative preferred shares 1/27/2021 543 638 .01
Nu Holdings, Ltd., Class A 1/27/2021 422 496 .01
Nu Holdings, Ltd., Series B, noncumulative preferred shares 1/27/2021 37 44 .00
Nu Holdings, Ltd., Series D, noncumulative preferred shares 1/27/2021 20 23 .00
QuintoAndar Servicos Imobiliarios Ltda., Series E, preferred shares 5/26/2021 5,258 5,258 .11
Getir BV, Series H, preferred shares 5/27/2021 3,500 3,500 .08
Total private placement securities $14,265 $15,232 .33%
Key to abbreviations and symbolsADR = American Depositary ReceiptsCDI = CREST Depository InterestDOP = Dominican pesosEUR/€ = EurosGDR = Global Depositary ReceiptsHKD = Hong Kong dollarsMXN =Mexican pesosMYR = Malaysian ringgitsUSD/$ = U.S. dollars
See notes to financial statements.
NewWorld Fund (continued)

66 American Funds Insurance Series
Common stocks 96.47% SharesValue(000)
Informationtechnology18.02%
Microsoft Corp. 2,106,009 $ 570,518Broadcom, Inc. 1,058,559 504,764Intel Corp. 2,929,736 164,475ASML Holding NV (New York registered) (ADR) 150,741 104,138Visa, Inc., Class A 343,359 80,284Apple, Inc. 572,719 78,440Fidelity National Information Services, Inc. 430,405 60,975Automatic Data Processing, Inc. 194,807 38,693Applied Materials, Inc. 250,964 35,737Mastercard, Inc., Class A 86,557 31,601KLA Corp. 94,273 30,564TE Connectivity, Ltd. 212,561 28,740NetApp, Inc. 296,805 24,285Paychex, Inc. 212,443 22,795Texas Instruments, Inc. 71,883 13,823Motorola Solutions, Inc. 59,914 12,992SAP SE (ADR) 77,408 10,873EPAM Systems, Inc.1 12,712 6,495Jack Henry & Associates, Inc. 24,063 3,935Analog Devices, Inc. 21,755 3,745Micron Technology, Inc.1 2,103 179
1,828,051
Financials16.72%
BlackRock, Inc. 280,039 245,026JPMorgan Chase & Co. 1,306,812 203,262CME Group, Inc., Class A 806,892 171,610PNC Financial Services Group, Inc. 720,704 137,482Bank of America Corp. 2,381,587 98,193Capital One Financial Corp. 533,487 82,525Discover Financial Services 691,594 81,809Intercontinental Exchange, Inc. 633,491 75,195Marsh & McLennan Companies, Inc. 461,667 64,947Citigroup, Inc. 898,745 63,586Travelers Companies, Inc. 361,014 54,047Nasdaq, Inc. 300,423 52,814S&P Global, Inc. 127,999 52,537Truist Financial Corp. 912,671 50,653Toronto-Dominion Bank 710,883 49,797Bank of Nova Scotia 672,679 43,771Carlyle Group, Inc. 599,419 27,861Moody’s Corp. 73,483 26,628KeyCorp 1,118,961 23,107KKR & Co., Inc. 347,353 20,577Regions Financial Corp. 974,958 19,675Citizens Financial Group, Inc. 382,827 17,560Brookfield Asset Management, Inc., Class A 258,883 13,198Fifth Third Bancorp 289,822 11,080Everest Re Group, Ltd. 39,368 9,921Brookfield Asset Management Reinsurance Partners, Ltd., Class A1 1,785 93
1,696,954
Health care16.12%
UnitedHealth Group, Inc. 853,907 341,938CVS Health Corp. 2,219,520 185,197Johnson & Johnson 999,155 164,601Pfizer, Inc. 4,126,310 161,586Humana Inc. 272,364 120,581Gilead Sciences, Inc. 1,434,225 98,761AstraZeneca PLC (ADR)2 1,432,090 85,782Abbott Laboratories 643,053 74,549
WashingtonMutual Investors Fund(formerly Blue Chip Income andGrowth Fund)Investment portfolio June 30, 2021 unaudited

American Funds Insurance Series 67
Common stocks (continued) SharesValue(000)
Health care(continued)
Cigna Corp. 271,716 $ 64,416Eli Lilly and Company 248,426 57,019Danaher Corp. 211,449 56,744Anthem, Inc. 148,502 56,698Thermo Fisher Scientific, Inc. 58,001 29,260Baxter International, Inc. 350,367 28,205GlaxoSmithKline PLC (ADR) 661,074 26,324Merck & Co., Inc. 206,593 16,067Zoetis, Inc., Class A 64,934 12,101Novo Nordisk A/S, Class B (ADR) 141,459 11,850Medtronic PLC 88,527 10,989Edwards Lifesciences Corp.1 87,569 9,069Zimmer Biomet Holdings, Inc. 56,341 9,061Roche Holding AG (ADR) 181,439 8,526Viatris, Inc. 269,185 3,847Novartis AG (ADR) 29,792 2,718Organon & Co.1 11,153 337
1,636,226
Industrials10.79%
Northrop Grumman Corp. 385,717 140,181Honeywell International, Inc. 598,303 131,238CSX Corp. 3,521,404 112,967Lockheed Martin Corp. 270,961 102,518Union Pacific Corp. 415,039 91,280Caterpillar, Inc. 340,203 74,038Norfolk Southern Corp. 243,333 64,583PACCAR, Inc. 678,643 60,569L3Harris Technologies, Inc. 233,927 50,563Raytheon Technologies Corp. 460,692 39,302ABB, Ltd. (ADR) 867,885 29,499Equifax, Inc. 114,445 27,411Waste Connections, Inc. 227,476 27,167Parker-Hannifin Corp. 85,730 26,329Emerson Electric Co. 222,632 21,426Republic Services, Inc. 188,596 20,747RELX PLC (ADR) 570,375 15,212HEICO Corp. 72,274 10,076Johnson Controls International PLC 137,777 9,456Cummins, Inc. 32,761 7,987United Parcel Service, Inc., Class B 38,200 7,944Rockwell Automation 26,600 7,608Air Lease Corp., Class A 170,858 7,132FedEx Corp. 22,467 6,703Nidec Corp. (ADR) 115,542 3,339
1,095,275
Communicationservices7.93%
Comcast Corp., Class A 7,979,670 455,001Alphabet, Inc., Class C1 33,829 84,787Alphabet, Inc., Class A1 22,982 56,117Facebook, Inc., Class A1 258,277 89,805Verizon Communications, Inc. 1,562,147 87,527AT&T, Inc. 710,704 20,454Electronic Arts, Inc. 40,638 5,845Activision Blizzard, Inc. 51,183 4,885
804,421
WashingtonMutual Investors Fund (continued)(formerly Blue Chip Income andGrowth Fund)

68 American Funds Insurance Series
Common stocks (continued) SharesValue(000)
Consumerdiscretionary6.16%
Home Depot, Inc. 599,482 $191,169General Motors Company1 1,964,542 116,242Darden Restaurants, Inc. 428,426 62,546VF Corp. 729,025 59,809Wynn Resorts, Ltd.1 417,851 51,103Amazon.com, Inc.1 7,475 25,715Dollar General Corp. 98,299 21,271Chipotle Mexican Grill, Inc.1 12,424 19,261TJX Companies, Inc. 237,016 15,980Marriott International, Inc., Class A1 93,824 12,809NIKE, Inc., Class B 81,576 12,603YUM! Brands, Inc. 105,908 12,183McDonald’s Corp. 34,091 7,875Starbucks Corp. 66,885 7,478Royal Caribbean Cruises, Ltd.1 71,567 6,103Domino’s Pizza, Inc. 6,418 2,994
625,141
Consumer staples5.63%
Nestlé SA (ADR) 798,424 99,595Keurig Dr Pepper, Inc. 1,905,860 67,163Mondelez International, Inc. 959,448 59,908Conagra Brands, Inc. 1,466,412 53,348Archer Daniels Midland Company 842,092 51,031Hormel Foods Corp. 665,594 31,782Reckitt Benckiser Group PLC (ADR) 1,699,218 30,416Procter & Gamble Company 217,700 29,374Walgreens Boots Alliance, Inc. 528,193 27,788Kraft Heinz Company 679,313 27,702Church & Dwight Co., Inc. 290,397 24,748Unilever PLC (ADR) 384,674 22,504CostcoWholesale Corp. 45,675 18,072General Mills, Inc. 196,934 11,999Kimberly-Clark Corp. 51,092 6,835Danone (ADR) 426,506 6,001Kroger Co. 68,480 2,624
570,890
Energy5.32%
Chevron Corp. 1,238,265 129,696Enbridge, Inc. 2,218,846 88,843Pioneer Natural Resources Company 473,437 76,943EOG Resources, Inc. 656,642 54,790Baker Hughes Co., Class A 2,372,089 54,250ConocoPhillips 876,699 53,391Exxon Mobil Corp. 500,717 31,585Cabot Oil & Gas Corp. 1,103,310 19,264Valero Energy Corp. 210,265 16,417TC Energy Corp. 293,686 14,543
539,722
Materials4.62%
Dow Inc. 2,088,482 132,159LyondellBasell Industries NV 936,756 96,364Nucor Corp. 653,278 62,669Air Products and Chemicals, Inc. 131,758 37,904Rio Tinto PLC (ADR) 407,632 34,196Vulcan Materials Co. 184,643 32,141Linde PLC 64,217 18,565PPG Industries, Inc. 77,713 13,194
WashingtonMutual Investors Fund (continued)(formerly Blue Chip Income andGrowth Fund)

American Funds Insurance Series 69
Common stocks (continued) SharesValue(000)
Materials(continued)
Huntsman Corp. 488,334 $ 12,951Packaging Corporation of America 85,423 11,568Corteva, Inc. 208,956 9,267Sherwin-Williams Company 27,139 7,394
468,372
Utilities3.11%
Exelon Corp. 1,448,171 64,168Sempra Energy 455,337 60,323CMS Energy Corp. 603,614 35,662Xcel Energy, Inc. 533,292 35,133DTE Energy Company 265,640 34,427NextEra Energy, Inc. 320,714 23,502Public Service Enterprise Group, Inc. 289,506 17,295American Electric Power Company, Inc. 147,763 12,499Dominion Energy, Inc. 164,082 12,072Edison International 184,742 10,682Entergy Corp. 98,358 9,806
315,569
Real estate2.05%
Digital Realty Trust, Inc. REIT 483,148 72,694Alexandria Real Estate Equities, Inc. REIT 204,208 37,154Regency Centers Corp. REIT 443,190 28,395Mid-America Apartment Communities, Inc. REIT 151,734 25,555American Tower Corp. REIT 75,937 20,514Boston Properties, Inc. REIT 121,984 13,978Extra Space Storage, Inc. REIT 61,459 10,068
208,358
Total common stocks (cost: $7,880,691,000) 9,788,979
Convertible stocks 0.57%
Utilities0.26%
NextEra Energy, Inc., convertible preferred units, 5.279% 2023 263,600 12,906Dominion Energy, Inc., Series A, convertible preferred shares, 7.25% 2022 112,000 10,878American Electric Power Company, Inc., convertible preferred units, 6.125% 2023 56,400 2,890
26,674
Health care0.17%
Danaher Corp., Series B, cumulative convertible preferred shares, 5.00% 20232 8,921 13,161Becton, Dickinson and Company, Series B, convertible preferred shares, 6.00% 20232 67,800 3,628
16,789
Financials0.08%
KKR & Co., Inc., Series C, 6.00% convertible preferred shares 100,000 7,706
Informationtechnology0.06%
Broadcom, Inc., Series A, cumulative convertible preferred shares, 8.00% 2022 4,300 6,536
Total convertible stocks (cost: $54,218,000) 57,705
Short-term securities 3.68%
Money market investments 3.02%
Capital Group Central Cash Fund 0.04%3,4 3,061,380 306,138
WashingtonMutual Investors Fund (continued)(formerly Blue Chip Income andGrowth Fund)

70 American Funds Insurance Series
Short-term securities (continued) SharesValue(000)
Money market investments purchased with collateral from securities on loan 0.66%
Goldman Sachs Financial Square Government Fund, Institutional Shares 0.02%3,5 37,307,569 $ 37,308Capital Group Central Cash Fund 0.04%3,4,5 301,593 30,159Invesco Short-Term Investments Trust – Government & Agency Portfolio,
Institutional Class 0.03%3,5 198,091 198
67,665
Total short-term securities (cost: $373,792,000) 373,803
Total investment securities 100.72% (cost: $8,308,701,000) 10,220,487
Other assets less liabilities (0.72)% (72,903)
Net assets 100.00% $10,147,584
Investments in affiliates4
Value ofaffiliates at1/1/2021
(000)Additions
(000)Reductions
(000)
Netrealized
loss(000)
Netunrealized
depreciation(000)
Value ofaffiliates at6/30/2021
(000)
Dividendincome
(000)
Short-term securities 3.32%Money market investments 3.02%
Capital Group Central Cash Fund 0.04%3 $178,532 $1,511,735 $1,384,098 $(8) $(23) $306,138 $70
Money market investments purchased with collateral from securitieson loan 0.30%Capital Group Central Cash Fund 0.04%3,5 — 30,1596 30,159 —7
Total short-term securities 336,297
Total 3.32% $(8) $(23) $336,297 $70
1Security did not produce income during the last 12 months.2All or a portion of this security was on loan. The total value of all such securities was $73,663,000, which represented .73% of the net assets of the fund. Refer toNote 5 for more information on securities lending.
3Rate represents the seven-day yield at 6/30/2021.4Part of the same “group of investment companies“ as the fund as defined under the Investment Company Act of 1940, as amended.5Security purchased with cash collateral from securities on loan. Refer to Note 5 for more information on securities lending.6Represents net activity. Refer to Note 5 for more information on securities lending.7Dividend income is included with securities lending income in the fund’s statement of operations and is not shown in this table.
Key to abbreviationADR = American Depositary Receipts
See notes to financial statements.
WashingtonMutual Investors Fund (continued)(formerly Blue Chip Income andGrowth Fund)

American Funds Insurance Series 71
Common stocks 94.60% SharesValue(000)
Informationtechnology18.57%
Microsoft Corp. 292,716 $ 79,297Broadcom, Inc. 158,869 75,755Taiwan Semiconductor Manufacturing Company, Ltd. 3,370,800 71,983ASML Holding NV 63,381 43,544Tokyo Electron, Ltd. 61,300 26,530Apple, Inc. 112,632 15,426Mastercard, Inc., Class A 29,570 10,796Logitech International SA 76,108 9,221NetEase, Inc. 405,000 9,175Keyence Corp. 16,800 8,479Delta Electronics, Inc. 764,000 8,308Accenture PLC, Class A 28,048 8,268EPAM Systems, Inc.1 14,829 7,577Hexagon AB, Class B 381,021 5,645GlobalWafers Co., Ltd. 144,000 4,750Adobe, Inc.1 8,100 4,744Capgemini SE 21,421 4,115Fujitsu Ltd. 20,600 3,857OBIC Co., Ltd. 18,500 3,449Advanced Micro Devices, Inc.1 33,699 3,165Visa, Inc., Class A 13,175 3,081PayPal Holdings, Inc.1 10,315 3,007Applied Materials, Inc. 19,258 2,742Ceridian HCM Holding, Inc.1 26,904 2,581MediaTek, Inc. 68,000 2,348RingCentral, Inc., Class A1 8,065 2,343NortonLifeLock, Inc. 80,313 2,186ServiceNow, Inc.1 3,886 2,135Shopify, Inc., Class A, subordinate voting shares (CAD denominated)1 1,337 1,955Worldline SA, non-registered shares1 20,829 1,950Snowflake, Inc., Class A1 7,760 1,876Nomura Research Institute, Ltd. 50,700 1,677Samsung Electronics Co., Ltd. 20,872 1,496Micron Technology, Inc.1 10,560 897Atlassian Corp. PLC, Class A1 3,492 897SS&C Technologies Holdings, Inc. 12,082 871Afterpay, Ltd.1 9,714 861GDS Holdings, Ltd., Class A1 58,400 578Autodesk, Inc.1 1,003 293
437,858
Financials14.65%
AIA Group, Ltd. 2,780,400 34,557Kotak Mahindra Bank, Ltd.1 869,039 19,944CME Group, Inc., Class A 92,036 19,574Zurich Insurance Group AG 47,087 18,891Toronto-Dominion Bank (CAD denominated) 249,135 17,459Sberbank of Russia PJSC (ADR) 927,306 15,398HDFC Bank, Ltd. 623,164 12,558HDFC Bank, Ltd. (ADR) 21,583 1,578JPMorgan Chase & Co. 83,900 13,050Ping An Insurance (Group) Company of China, Ltd., Class H 1,097,500 10,750Ping An Insurance (Group) Company of China, Ltd., Class A 62,500 622S&P Global, Inc. 25,987 10,666HDFC Life Insurance Company, Ltd. 1,072,357 9,901ING Groep NV 736,557 9,729DNB ASA 445,505 9,707Lufax Holding, Ltd. (ADR)1,2 763,916 8,632Nasdaq, Inc. 47,618 8,371BlackRock, Inc. 8,911 7,797M&G PLC 2,415,609 7,649
CapitalWorld Growth and Income Fund(formerly Global Growth and Income Fund)Investment portfolio June 30, 2021 unaudited

72 American Funds Insurance Series
Common stocks (continued) SharesValue(000)
Financials(continued)
KBC Groep NV 100,287 $ 7,646Citigroup, Inc. 104,865 7,419B3 SA-Brasil, Bolsa, Balcao 1,995,721 6,749PNC Financial Services Group, Inc. 34,777 6,634Intercontinental Exchange, Inc. 54,492 6,468Barclays PLC 2,633,650 6,234Discover Financial Services 50,737 6,002The Blackstone Group, Inc. 60,453 5,873Hong Kong Exchanges and Clearing, Ltd. 89,700 5,347St. James’s Place PLC 218,457 4,463American International Group, Inc. 87,991 4,188Tradeweb Markets, Inc., Class A 41,602 3,518Macquarie Group, Ltd. 29,731 3,488Bank of America Corp. 76,833 3,168Legal & General Group PLC 843,355 3,005Futu Holdings, Ltd. (ADR)1 16,335 2,926FinecoBank SpA1 157,067 2,738Banco Santander, SA 713,361 2,723BNP Paribas SA 41,532 2,604Berkshire Hathaway, Inc., Class B1 9,154 2,544Moody’s Corp. 6,973 2,527Power Corporation of Canada, subordinate voting shares 75,066 2,373National Bank of Canada 19,203 1,437AXA SA 56,201 1,425Bajaj Finance, Ltd.1 17,549 1,420Tryg A/S 48,816 1,198Swedbank AB, Class A 61,820 1,150Aegon NV2 226,986 942China Pacific Insurance (Group) Co., Ltd., Class H 286,000 901Marsh & McLennan Companies, Inc. 4,287 603BOC Hong Kong (Holdings), Ltd. 174,500 592Allfunds Group PLC1 12,918 225DBS Group Holdings, Ltd. 1,595 35
345,398
Consumerdiscretionary12.15%
LVMHMoët Hennessy-Louis Vuitton SE 52,716 41,337Amazon.com, Inc.1 10,466 36,005General Motors Company1 440,292 26,052Home Depot, Inc. 76,806 24,493MercadoLibre, Inc.1 10,746 16,740Flutter Entertainment PLC1 67,148 12,158Stellantis NV 503,618 9,880Midea Group Co., Ltd., Class A 696,900 7,698Ocado Group PLC1 267,420 7,410adidas AG 19,898 7,406Marriott International, Inc., Class A1 49,582 6,769Barratt Developments PLC 691,446 6,649Restaurant Brands International, Inc. (CAD denominated)2 98,950 6,376Restaurant Brands International, Inc. 2,330 150Chipotle Mexican Grill, Inc.1 4,023 6,237Kering SA 6,422 5,612Ferrari NV (EUR denominated) 25,598 5,281Shimano, Inc. 22,000 5,218Booking Holdings, Inc.1 2,007 4,392Cie. Financière Richemont SA, Class A 32,788 3,967Astra International Tbk PT 11,337,300 3,863NIKE, Inc., Class B 23,456 3,624Sony Group Corp. 35,000 3,407Moncler SpA 49,234 3,331Evolution AB 20,919 3,306
CapitalWorld Growth and Income Fund (continued)(formerly Global Growth and Income Fund)

American Funds Insurance Series 73
Common stocks (continued) SharesValue(000)
Consumerdiscretionary(continued)
Naspers, Ltd., Class N 14,466 $ 3,037Nokian Renkaat Oyj 71,812 2,899Taylor Wimpey PLC 1,310,386 2,881DraftKings, Inc., Class A1 49,904 2,604EssilorLuxottica 13,319 2,458Just Eat Takeaway (GBP denominated)1 24,031 2,225Meituan, Class B1 52,200 2,154SAIC Motor Corp., Ltd., Class A1 626,400 2,130Industria de Diseño Textil, SA 60,428 2,129H &M Hennes & Mauritz AB, Class B1 77,418 1,836Wayfair Inc., Class A1 3,927 1,240Peloton Interactive, Inc., Class A1 7,728 958Domino’s Pizza Enterprises, Ltd. 8,633 780Tesla, Inc.1 1,085 737InterContinental Hotels Group PLC1 10,909 726Faurecia SA 5,839 286
286,441
Health care11.16%
Abbott Laboratories 316,200 36,657UnitedHealth Group, Inc. 72,720 29,120Gilead Sciences, Inc. 377,811 26,016Novartis AG 242,534 22,103Amgen, Inc. 76,913 18,748Thermo Fisher Scientific, Inc. 33,122 16,709AstraZeneca PLC 98,167 11,791Stryker Corp. 39,293 10,206Sanofi 72,406 7,586Centene Corp.1 93,169 6,795Eli Lilly and Company 26,860 6,165Medtronic PLC 48,782 6,055Pfizer, Inc. 148,916 5,832Chugai Pharmaceutical Co., Ltd. 141,500 5,607Siemens Healthineers AG 76,722 4,701Coloplast A/S, Class B 26,296 4,315WuXi Biologics (Cayman), Inc.1 233,000 4,270Zimmer Biomet Holdings, Inc. 25,906 4,166Olympus Corp. 184,800 3,673PerkinElmer, Inc. 23,686 3,657Carl Zeiss Meditec AG, non-registered shares 17,531 3,387AbbVie, Inc. 25,247 2,844Baxter International, Inc. 30,945 2,491Intuitive Surgical, Inc.1 2,687 2,471Illumina, Inc.1 5,170 2,446Zoetis, Inc., Class A 12,774 2,381Cigna Corp. 7,371 1,747Alcon, Inc. 24,235 1,697Teva Pharmaceutical Industries, Ltd. (ADR)1 169,706 1,680M3, Inc. 22,000 1,607Vertex Pharmaceuticals, Inc.1 7,437 1,500Hypera SA, ordinary nominative shares 179,438 1,244GlaxoSmithKline PLC 57,137 1,122DexCom, Inc.1 2,076 886Insulet Corp.1 3,116 855CanSino Biologics, Inc., Class H1 11,200 595
263,125
CapitalWorld Growth and Income Fund (continued)(formerly Global Growth and Income Fund)

74 American Funds Insurance Series
Common stocks (continued) SharesValue(000)
Communicationservices10.41%
Alphabet, Inc., Class C1 13,065 $ 32,745Alphabet, Inc., Class A1 8,834 21,571Netflix, Inc.1 73,037 38,579Facebook, Inc., Class A1 101,781 35,390SoftBank Corp. 1,771,200 23,173Comcast Corp., Class A 361,394 20,607Yandex NV, Class A1 239,086 16,915Tencent Holdings, Ltd. 148,500 11,169Altice USA, Inc., Class A1 246,652 8,421SoftBank Group Corp. 89,000 6,229Bilibili, Inc., Class Z (ADR)1 24,613 2,999Bilibili, Inc., Class Z1 23,180 2,854Activision Blizzard, Inc. 50,869 4,855Sea, Ltd., Class A (ADR)1 13,375 3,673Cellnex Telecom, SA, non-registered shares 57,116 3,638Vivendi SA2 103,892 3,490Daily Mail and General Trust PLC, Class A, nonvoting shares 258,506 3,447Omnicom Group, Inc. 24,376 1,950ITV PLC1 1,096,106 1,904América Móvil, SAB de CV, Series L (ADR) 58,815 882Walt Disney Company1 3,716 653Indus Towers, Ltd. 98,788 317
245,461
Industrials8.31%
Airbus SE, non-registered shares1 155,935 20,051CSX Corp. 596,814 19,146General Electric Co. 815,977 10,983Deere & Company 24,478 8,634Safran SA 61,889 8,580LIXIL Corp. 305,600 7,903Parker-Hannifin Corp. 25,409 7,803BAE Systems PLC 1,058,265 7,642Lockheed Martin Corp. 20,004 7,568Country Garden Services Holdings Co., Ltd. 591,000 6,386Stanley Black & Decker, Inc. 28,809 5,906VINCI SA 55,293 5,900Honeywell International, Inc. 25,632 5,622Raytheon Technologies Corp. 65,196 5,562TransDigm Group, Inc.1 7,424 4,805Compagnie de Saint-Gobain SA, non-registered shares 71,621 4,717Melrose Industries PLC 2,193,953 4,707Recruit Holdings Co., Ltd. 94,000 4,628Emerson Electric Co. 47,421 4,564Nidec Corp. 36,900 4,276Johnson Controls International PLC 57,412 3,940Bunzl PLC 96,986 3,205Eiffage SA 26,656 2,712Aena SME, SA, non-registered shares 15,922 2,611ASSAABLOYAB, Class B 81,458 2,454Ryanair Holdings PLC (ADR)1 22,571 2,442Union Pacific Corp. 9,600 2,111Sydney Airport, units1 472,784 2,053Adecco Group AG 29,114 1,978RELX PLC 69,864 1,855SMC Corp. 3,100 1,832ACS, Actividades de Construcción y Servicios, SA 60,033 1,608Wizz Air Holdings PLC1 23,911 1,544AB Volvo, Class B 64,119 1,543ManpowerGroup, Inc. 12,744 1,515InPost SA1 72,793 1,461
CapitalWorld Growth and Income Fund (continued)(formerly Global Growth and Income Fund)

American Funds Insurance Series 75
Common stocks (continued) SharesValue(000)
Industrials(continued)
Atlas Copco AB, Class B 27,077 $ 1,424L3Harris Technologies, Inc. 6,496 1,404Carrier Global Corp. 26,716 1,298Ritchie Bros. Auctioneers, Inc. 12,985 770Schneider Electric SE 3,633 572Otis Worldwide Corp. 4,082 334
196,049
Consumer staples6.00%
Philip Morris International, Inc. 327,580 32,466Nestlé SA 140,236 17,463British American Tobacco PLC 375,918 14,560British American Tobacco PLC (ADR) 15,802 621Keurig Dr Pepper, Inc. 405,571 14,292Altria Group, Inc. 198,594 9,469KweichowMoutai Co., Ltd., Class A 24,100 7,671Swedish Match AB 756,927 6,455Heineken NV 52,309 6,339Imperial Brands PLC 218,629 4,709Danone SA 56,010 3,943Kirin Holdings Company, Ltd. 200,600 3,911Constellation Brands, Inc., Class A 15,800 3,696Treasury Wine Estates, Ltd. 400,908 3,512Bunge, Ltd. 44,000 3,439Mondelez International, Inc. 33,312 2,080Conagra Brands, Inc. 50,345 1,832Pernod Ricard SA 6,779 1,505Thai Beverage PCL 2,419,500 1,215ITC, Ltd. 248,407 677Arca Continental, SAB de CV1 112,300 651Oatly Group AB (ADR)1 23,567 576Inner Mongolia Yili Industrial Group Co., Ltd., Class A 82,400 470
141,552
Materials5.71%
Vale SA, ordinary nominative shares 1,379,408 31,408Vale SA, ordinary nominative shares (ADR) 986,518 22,503Rio Tinto PLC 287,922 23,694BHP Group PLC 362,100 10,669Fortescue Metals Group, Ltd. 508,556 8,902Linde PLC 20,634 5,965Freeport-McMoRan, Inc. 125,242 4,648Shin-Etsu Chemical Co., Ltd. 27,600 4,616HeidelbergCement AG 42,449 3,641Dow Inc. 47,755 3,022CRH PLC 51,660 2,603Akzo Nobel NV 20,294 2,507Amcor PLC (CDI) 165,731 1,880Albemarle Corp. 10,500 1,769Barrick Gold Corp. (CAD denominated) 79,724 1,649Koninklijke DSM NV 8,292 1,548Air Liquide SA, non-registered shares 6,629 1,161Evonik Industries AG 28,154 944Huntsman Corp. 31,500 835Lynas Rare Earths, Ltd.1 163,843 702
134,666
CapitalWorld Growth and Income Fund (continued)(formerly Global Growth and Income Fund)

76 American Funds Insurance Series
Common stocks (continued) SharesValue(000)
Energy2.76%
Canadian Natural Resources, Ltd. (CAD denominated) 535,070 $ 19,424EOG Resources, Inc. 119,710 9,989Gazprom PJSC (ADR) 1,097,013 8,361TC Energy Corp. (CAD denominated) 114,213 5,652BP PLC 994,134 4,332Chevron Corp. 40,379 4,229ConocoPhillips 57,341 3,492TotalEnergies SE 76,543 3,463Royal Dutch Shell PLC, Class B 147,294 2,851Suncor Energy, Inc. 88,930 2,130Reliance Industries, Ltd. 43,639 1,239
65,162
Utilities2.72%
Enel SpA 1,613,152 14,981DTE Energy Company 76,995 9,979China Resources Gas Group, Ltd. 1,534,000 9,207Iberdrola, SA, non-registered shares 608,791 7,421Entergy Corp. 50,365 5,021E.ON SE 380,980 4,406NextEra Energy, Inc. 50,808 3,723Ørsted AS 14,147 1,985Engie SA 141,365 1,937China Gas Holdings, Ltd. 578,200 1,765Endesa, SA 64,074 1,554AES Corp. 52,478 1,368Power Grid Corporation of India, Ltd. 239,207 748
64,095
Real estate2.16%
Crown Castle International Corp. REIT 89,497 17,461American Tower Corp. REIT 38,009 10,268Longfor Group Holdings, Ltd. 1,443,500 8,087Boston Properties, Inc. REIT 25,581 2,931VICI Properties, Inc. REIT 75,169 2,332Equinix, Inc. REIT 2,838 2,278Shimao Group Holdings, Ltd. 692,000 1,697CIFI Holdings (Group) Co., Ltd. 1,970,000 1,538Vonovia SE 17,384 1,124Sun Hung Kai Properties, Ltd. 67,000 998China Resources Land, Ltd. 206,000 834Iron Mountain, Inc. REIT 16,501 698China Resources Mixc Lifestyle Services, Ltd. 95,800 656Shimao Services Holdings, Ltd. 39,000 135
51,037
Total common stocks (cost: $1,685,564,000) 2,230,844
Preferred securities 0.90%
Consumerdiscretionary0.47%
Volkswagen AG, nonvoting preferred shares 44,378 11,114
Financials0.25%
Banco Bradesco SA, preferred nominative shares 1,072,017 5,546Fannie Mae, Series S, 8.25% noncumulative preferred shares1 58,870 125Federal Home Loan Mortgage Corp., Series Z,
8.375% noncumulative preferred shares1,2 61,516 125
5,796
CapitalWorld Growth and Income Fund (continued)(formerly Global Growth and Income Fund)

American Funds Insurance Series 77
Preferred securities (continued) SharesValue(000)
Informationtechnology0.12%
Samsung Electronics Co., Ltd., nonvoting preferred shares 44,774 $ 2,930
Health care0.06%
Grifols, SA, Class B, nonvoting non-registered preferred shares 78,875 1,384
Total preferred securities (cost: $20,947,000) 21,224
Rights & warrants 0.00%
Industrials0.00%
ACS, Actividades de Construcción y Servicios, SA, rights, non-registered shares,expire 20211 26,540 37
Total rights & warrants (cost: $40,000) 37
Convertible stocks 0.23%
Financials0.13%
2020 Cash Mandatory Exchangeable Trust, convertible preferred shares, 0% 20233 2,400 3,030
Informationtechnology0.06%
Broadcom, Inc., Series A, cumulative convertible preferred shares, 8.00% 2022 1,016 1,544
Utilities0.04%
DTE Energy Company, convertible preferred units, 6.25% 2022 20,000 989
Total convertible stocks (cost: $5,446,000) 5,563
Convertible bonds & notes 0.20%Principal amount
(000)
Communicationservices0.20%
Sea Ltd., convertibles notes, 2.375% 2025 $ 1,500 4,635
Total convertible bonds & notes (cost: $3,840,000) 4,635
Bonds, notes & other debt instruments 0.37%
Corporate bonds, notes & loans 0.32%
Health care0.12%
Teva Pharmaceutical Finance Co. BV 6.00% 2024 1,600 1,700Teva Pharmaceutical Finance Co. BV 3.15% 2026 1,100 1,048
2,748
Consumerdiscretionary0.11%
Carnival Corp. 11.50% 20233 800 901General Motors Company 5.40% 2023 300 331General Motors Financial Co. 5.20% 2023 300 323Royal Caribbean Cruises, Ltd. 11.50% 20253 800 923
2,478
Energy0.04%
TransCanada PipeLines, Ltd. 5.10% 2049 800 1,052
CapitalWorld Growth and Income Fund (continued)(formerly Global Growth and Income Fund)

78 American Funds Insurance Series
Bonds, notes & other debt instruments (continued)Principal amount
(000)Value(000)
Corporate bonds, notes & loans (continued)
Communicationservices0.04%
CenturyLink, Inc. 7.50% 2024 $ 400 $ 450Sprint Corp. 7.25% 2021 500 508
958
Consumer staples0.01%
JBS Investments GMBH II 7.00% 20263 300 319
Total corporate bonds, notes & loans 7,555
Bonds & notes of governments & government agencies outside the U.S. 0.05%
United Mexican States, Series M, 8.00% 2023 MXN20,000 1,052
Total bonds, notes & other debt instruments (cost: $8,537,000) 8,607
Short-term securities 4.24% Shares
Money market investments 3.74%
Capital Group Central Cash Fund 0.04%4,5 882,377 88,238
Money market investments purchased with collateral from securities on loan 0.50%
Goldman Sachs Financial Square Government Fund, Institutional Shares 0.02%4,6 6,422,520 6,422Capital Group Central Cash Fund 0.04%4,5,6 51,919 5,192Invesco Short-Term Investments Trust – Government & Agency Portfolio,
Institutional Class 0.03%4,6 34,102 34
11,648
Total short-term securities (cost: $99,895,000) 99,886
Total investment securities 100.54% (cost: $1,824,269,000) 2,370,796
Other assets less liabilities (0.54)% (12,619)
Net assets 100.00% $2,358,177
Investments in affiliates5
Value ofaffiliates at1/1/2021
(000)Additions
(000)Reductions
(000)
Netrealized
gain(000)
Netunrealized
depreciation(000)
Value ofaffiliates at6/30/2021
(000)
Dividendincome
(000)
Short-term securities 3.96%Money market investments 3.74%
Capital Group Central Cash Fund 0.04%4 $66,489 $397,923 $376,162 $4 $(16) $88,238 $26
Money market investments purchased with collateral from securities onloan 0.22%Capital Group Central Cash Fund 0.04%4,6 — 5,1927 5,192 —8
Total short-term securities 93,430
Total 3.96% $4 $(16) $93,430 $26
CapitalWorld Growth and Income Fund (continued)(formerly Global Growth and Income Fund)

American Funds Insurance Series 79
1Security did not produce income during the last 12 months.2All or a portion of this security was on loan. The total value of all such securities was $12,432,000, which represented .53% of the net assets of the fund. Refer toNote 5 for more information on securities lending.
3Acquired in a transaction exempt from registration under Rule 144A of the Securities Act of 1933. May be resold in the U.S. in transactions exempt fromregistration, normally to qualified institutional buyers. The total value of all such securities was $5,173,000, which represented .22% of the net assets of the fund.
4Rate represents the seven-day yield at 6/30/2021.5Part of the same “group of investment companies“ as the fund as defined under the Investment Company Act of 1940, as amended.6Security purchased with cash collateral from securities on loan. Refer to Note 5 for more information on securities lending.7Represents net activity. Refer to Note 5 for more information on securities lending.8Dividend income is included with securities lending income in the fund’s statement of operations and is not shown in this table.
Key to abbreviationsADR = American Depositary ReceiptsCAD = Canadian dollarsCDI = CREST Depository InterestEUR = EurosGBP = British poundsMXN =Mexican pesos
See notes to financial statements.
CapitalWorld Growth and Income Fund (continued)(formerly Global Growth and Income Fund)

80 American Funds Insurance Series
Common stocks 96.66% SharesValue(000)
Informationtechnology22.24%
Microsoft Corp. 10,424,024 $2,823,868Broadcom, Inc. 2,560,501 1,220,949Mastercard, Inc., Class A 1,741,921 635,958Visa, Inc., Class A 1,282,991 299,989Taiwan Semiconductor Manufacturing Company, Ltd. 13,692,000 292,391Accenture PLC, Class A 991,200 292,196Adobe, Inc.1 453,373 265,513ASML Holding NV 234,068 160,810ASML Holding NV (New York registered) (ADR) 147,800 102,106Fidelity National Information Services, Inc. 1,268,981 179,777Intel Corp. 2,996,600 168,229Automatic Data Processing, Inc. 845,000 167,834Apple, Inc. 1,220,400 167,146ServiceNow, Inc.1 281,938 154,939Autodesk, Inc.1 530,000 154,707PayPal Holdings, Inc.1 498,649 145,346Concentrix Corp.1 868,198 139,606GoDaddy Inc., Class A1 1,402,444 121,956Ceridian HCM Holding, Inc.1 1,240,574 118,996StoneCo, Ltd., Class A1 1,659,500 111,286FleetCor Technologies, Inc.1 420,507 107,675Global Payments, Inc. 572,628 107,391Euronet Worldwide, Inc.1 763,602 103,354CDK Global, Inc. 2,042,800 101,507Cognizant Technology Solutions Corp., Class A 1,345,000 93,155MKS Instruments, Inc. 481,000 85,594Applied Materials, Inc. 517,400 73,678Shopify, Inc., Class A, subordinate voting shares1 48,000 70,127Atlassian Corp. PLC, Class A1 247,800 63,650Texas Instruments, Inc. 308,278 59,282Fiserv, Inc.1 536,700 57,368QUALCOMM, Inc. 375,195 53,627Micron Technology, Inc.1 629,500 53,495Amphenol Corp., Class A 772,000 52,812Dye & Durham, Ltd. 1,322,100 50,800KLA Corp. 155,000 50,253Samsung Electronics Co., Ltd. 570,000 40,846Lam Research Corp. 62,390 40,597Analog Devices, Inc. 231,000 39,769Trimble, Inc.1 413,300 33,820NetEase, Inc. 1,093,900 24,782VeriSign, Inc.1 61,000 13,889Arista Networks, Inc.1 32,500 11,775
9,112,848
Communicationservices16.78%
Facebook, Inc., Class A1 5,728,392 1,991,819Alphabet, Inc., Class A1 408,780 998,155Alphabet, Inc., Class C1 358,167 897,681Netflix, Inc.1 2,577,884 1,361,664Comcast Corp., Class A 14,034,950 800,273Charter Communications, Inc., Class A1 573,127 413,482Electronic Arts, Inc. 1,168,000 167,993Tencent Holdings, Ltd. 1,782,100 134,043Walt Disney Company1 300,000 52,731Vodafone Group PLC 20,000,000 33,570Activision Blizzard, Inc. 262,939 25,095
6,876,506
Growth-Income FundInvestment portfolio June 30, 2021 unaudited

American Funds Insurance Series 81
Common stocks (continued) SharesValue(000)
Health care11.31%
UnitedHealth Group, Inc. 2,609,900 $1,045,108Abbott Laboratories 6,794,592 787,697Gilead Sciences, Inc. 7,260,400 499,951Amgen, Inc. 1,036,000 252,525Novo Nordisk A/S, Class B 2,446,056 204,929AstraZeneca PLC 1,249,112 150,033AstraZeneca PLC (ADR)2 721,200 43,200Anthem, Inc. 463,288 176,883Thermo Fisher Scientific, Inc. 336,353 169,680AbbVie, Inc. 1,296,036 145,986GlaxoSmithKline PLC 6,402,300 125,706PerkinElmer, Inc. 743,500 114,804Merck & Co., Inc. 1,377,900 107,159Medtronic PLC 860,000 106,752Royalty Pharma PLC, Class A 2,557,706 104,840Baxter International, Inc. 995,800 80,162Edwards Lifesciences Corp.1 712,289 73,772Eli Lilly and Company 248,703 57,082Zimmer Biomet Holdings, Inc. 342,366 55,059AmerisourceBergen Corp. 475,400 54,429NovoCure, Ltd.1 193,600 42,944Vertex Pharmaceuticals, Inc.1 192,000 38,713Roche Holding AG, nonvoting non-registered shares 93,081 35,065Seagen, Inc.1 215,292 33,990Stryker Corp. 117,135 30,424Ultragenyx Pharmaceutical, Inc.1 315,000 30,035Humana Inc. 65,300 28,910Allogene Therapeutics, Inc.1 800,000 20,864Vir Biotechnology, Inc.1 258,400 12,217Organon & Co.1 118,490 3,586
4,632,505
Industrials10.29%
Carrier Global Corp. 8,800,613 427,710CSX Corp. 8,801,100 282,339Woodward, Inc. 2,204,500 270,889Northrop Grumman Corp. 733,200 266,467Raytheon Technologies Corp. 2,574,145 219,600Equifax, Inc. 893,208 213,932Airbus SE, non-registered shares1 1,617,590 207,994TransDigm Group, Inc.1 302,520 195,818Meggitt PLC1 30,279,152 193,174Waste Connections, Inc. 1,516,231 181,084Union Pacific Corp. 697,700 153,445TFI International, Inc. 1,671,259 152,402BWX Technologies, Inc. 2,357,405 137,012Norfolk Southern Corp. 482,759 128,129General Dynamics Corp. 593,975 111,822Waste Management, Inc. 767,700 107,563Old Dominion Freight Line, Inc. 405,000 102,789L3Harris Technologies, Inc. 446,960 96,610General Electric Co. 7,022,250 94,520Honeywell International, Inc. 409,067 89,729Air Lease Corp., Class A 2,097,300 87,541Lockheed Martin Corp. 230,000 87,021Fortive Corp. 1,085,000 75,668Safran SA 539,713 74,825ITT, Inc. 750,836 68,769Ryanair Holdings PLC (ADR)1 445,550 48,213Ryanair Holdings PLC1 611,907 11,580Fastenal Co. 635,000 33,020Montana Aerospace AG1 658,516 27,721
Growth-Income Fund (continued)
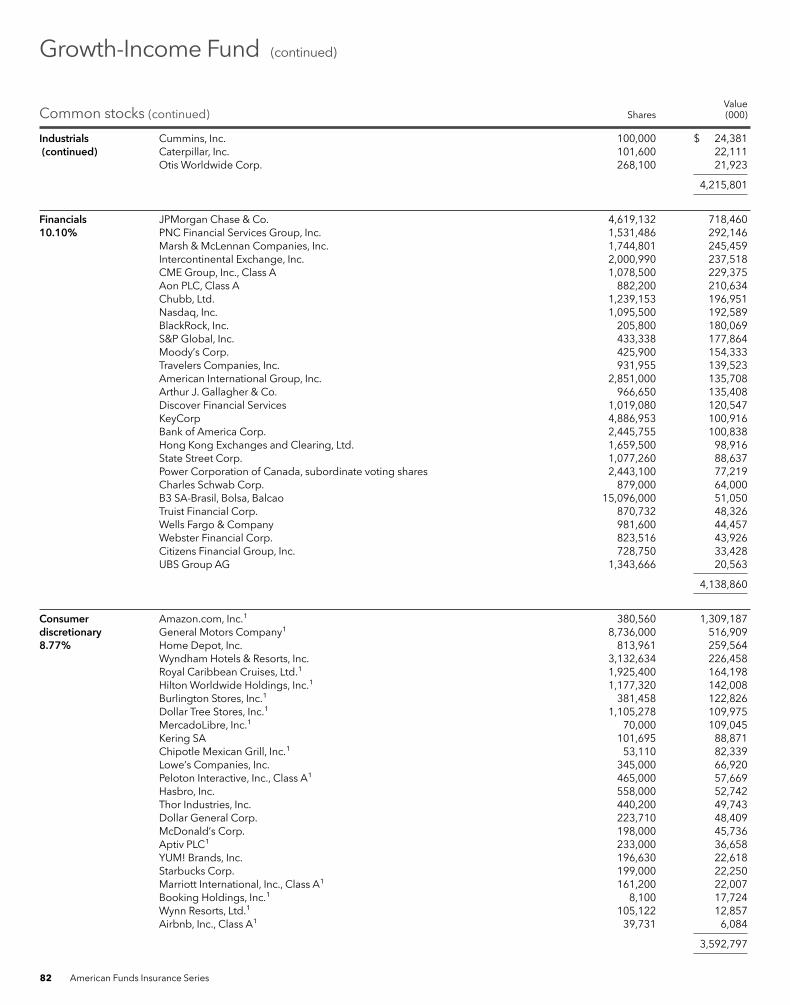
82 American Funds Insurance Series
Common stocks (continued) SharesValue(000)
Industrials(continued)
Cummins, Inc. 100,000 $ 24,381Caterpillar, Inc. 101,600 22,111Otis Worldwide Corp. 268,100 21,923
4,215,801
Financials10.10%
JPMorgan Chase & Co. 4,619,132 718,460PNC Financial Services Group, Inc. 1,531,486 292,146Marsh & McLennan Companies, Inc. 1,744,801 245,459Intercontinental Exchange, Inc. 2,000,990 237,518CME Group, Inc., Class A 1,078,500 229,375Aon PLC, Class A 882,200 210,634Chubb, Ltd. 1,239,153 196,951Nasdaq, Inc. 1,095,500 192,589BlackRock, Inc. 205,800 180,069S&P Global, Inc. 433,338 177,864Moody’s Corp. 425,900 154,333Travelers Companies, Inc. 931,955 139,523American International Group, Inc. 2,851,000 135,708Arthur J. Gallagher & Co. 966,650 135,408Discover Financial Services 1,019,080 120,547KeyCorp 4,886,953 100,916Bank of America Corp. 2,445,755 100,838Hong Kong Exchanges and Clearing, Ltd. 1,659,500 98,916State Street Corp. 1,077,260 88,637Power Corporation of Canada, subordinate voting shares 2,443,100 77,219Charles Schwab Corp. 879,000 64,000B3 SA-Brasil, Bolsa, Balcao 15,096,000 51,050Truist Financial Corp. 870,732 48,326Wells Fargo & Company 981,600 44,457Webster Financial Corp. 823,516 43,926Citizens Financial Group, Inc. 728,750 33,428UBS Group AG 1,343,666 20,563
4,138,860
Consumerdiscretionary8.77%
Amazon.com, Inc.1 380,560 1,309,187General Motors Company1 8,736,000 516,909Home Depot, Inc. 813,961 259,564Wyndham Hotels & Resorts, Inc. 3,132,634 226,458Royal Caribbean Cruises, Ltd.1 1,925,400 164,198HiltonWorldwide Holdings, Inc.1 1,177,320 142,008Burlington Stores, Inc.1 381,458 122,826Dollar Tree Stores, Inc.1 1,105,278 109,975MercadoLibre, Inc.1 70,000 109,045Kering SA 101,695 88,871Chipotle Mexican Grill, Inc.1 53,110 82,339Lowe’s Companies, Inc. 345,000 66,920Peloton Interactive, Inc., Class A1 465,000 57,669Hasbro, Inc. 558,000 52,742Thor Industries, Inc. 440,200 49,743Dollar General Corp. 223,710 48,409McDonald’s Corp. 198,000 45,736Aptiv PLC1 233,000 36,658YUM! Brands, Inc. 196,630 22,618Starbucks Corp. 199,000 22,250Marriott International, Inc., Class A1 161,200 22,007Booking Holdings, Inc.1 8,100 17,724Wynn Resorts, Ltd.1 105,122 12,857Airbnb, Inc., Class A1 39,731 6,084
3,592,797
Growth-Income Fund (continued)

American Funds Insurance Series 83
Common stocks (continued) SharesValue(000)
Materials4.88%
Linde PLC 1,010,978 $ 292,274Vale SA, ordinary nominative shares (ADR) 9,206,039 209,990Vale SA, ordinary nominative shares 3,404,848 77,526LyondellBasell Industries NV 2,453,100 252,350Celanese Corp. 1,250,900 189,636Air Products and Chemicals, Inc. 602,306 173,271Dow Inc. 2,550,000 161,364International Flavors & Fragrances, Inc. 1,075,001 160,605Freeport-McMoRan, Inc. 3,803,000 141,129Sherwin-Williams Company 475,300 129,496Rio Tinto PLC 1,020,655 83,992PPG Industries, Inc. 295,550 50,176Barrick Gold Corp. 2,373,000 49,074Allegheny Technologies, Inc.1 1,458,734 30,415
2,001,298
Consumer staples4.39%
Philip Morris International, Inc. 5,342,126 529,458Keurig Dr Pepper, Inc. 10,054,335 354,315British American Tobacco PLC 4,663,859 180,642Reckitt Benckiser Group PLC 1,275,000 112,824Anheuser-Busch InBev SA/NV 1,358,211 97,934Nestlé SA 731,589 91,104Mondelez International, Inc. 1,436,300 89,682Molson Coors Beverage Company, Class B, restricted voting shares1 1,620,313 86,995Clorox Co. 300,000 53,973Herbalife Nutrition, Ltd.1 849,000 44,768Church & Dwight Co., Inc. 424,500 36,176General Mills, Inc. 428,800 26,127Pernod Ricard SA 117,200 26,015Constellation Brands, Inc., Class A 100,700 23,553LambWeston Holdings, Inc. 291,727 23,531Kraft Heinz Company 567,200 23,130
1,800,227
Energy3.02%
Canadian Natural Resources, Ltd. (CAD denominated) 7,948,000 288,528EOG Resources, Inc. 3,255,400 271,631Chevron Corp. 2,127,065 222,789ConocoPhillips 2,699,104 164,375TC Energy Corp. (CAD denominated) 1,821,019 90,111Equitrans Midstream Corp. 9,950,307 84,677Baker Hughes Co., Class A 3,492,424 79,872Exxon Mobil Corp. 500,000 31,540Weatherford International1 128,424 2,337
1,235,860
Real estate2.56%
Equinix, Inc. REIT 524,200 420,723Crown Castle International Corp. REIT 1,561,966 304,740MGMGrowth Properties LLC REIT, Class A 3,996,000 146,333VICI Properties, Inc. REIT 2,887,318 89,565Digital Realty Trust, Inc. REIT 592,500 89,147
1,050,508
Utilities2.32%
Enel SpA 23,794,069 220,971AES Corp. 5,403,200 140,861Endesa, SA 5,162,847 125,253Sempra Energy 750,000 99,360Exelon Corp. 1,576,100 69,837CenterPoint Energy, Inc. 2,840,104 69,639
Growth-Income Fund (continued)

84 American Funds Insurance Series
Common stocks (continued) SharesValue(000)
Utilities(continued)
Entergy Corp. 634,900 $ 63,300CMS Energy Corp. 918,200 54,247Edison International 522,800 30,228PG&E Corp.1 2,840,000 28,883Xcel Energy, Inc. 423,300 27,887American Electric Power Company, Inc. 250,600 21,198
951,664
Total common stocks (cost: $22,103,914,000) 39,608,874
Convertible stocks 1.06%
Health care0.57%
Danaher Corp., Series A, cumulative convertible preferred shares, 4.75% 2022 78,600 141,370Danaher Corp., Series B, cumulative convertible preferred shares, 5.00% 20232 61,857 91,256
232,626
Informationtechnology0.38%
Broadcom, Inc., Series A, cumulative convertible preferred shares, 8.00% 2022 102,783 156,217
Consumerdiscretionary0.10%
Aptiv PLC, Series A, convertible preferred shares, 5.50% 2023 238,475 42,644
Industrials0.01%
Stanley Black & Decker, Inc., convertible preferred shares, 5.25% 2022 35,448 4,280
Total convertible stocks (cost: $314,563,000) 435,767
Bonds, notes & other debt instruments 0.04%Principal amount
(000)
Corporate bonds, notes & loans 0.04%
Energy0.02%
Weatherford International PLC 8.75% 20243 $ 1,982 2,077Weatherford International PLC 11.00% 20243 5,280 5,498
7,575
Industrials0.02%
Boeing Company 4.875% 2025 4,706 5,275
Consumerdiscretionary0.00%
General Motors Financial Co. 4.30% 2025 160 177General Motors Financial Co. 5.25% 2026 827 956
1,133
Total corporate bonds, notes & loans 13,983
Total bonds, notes & other debt instruments (cost: $12,691,000) 13,983
Short-term securities 2.57% Shares
Money market investments 2.40%
Capital Group Central Cash Fund 0.04%4,5 9,823,658 982,367
Growth-Income Fund (continued)

American Funds Insurance Series 85
Short-term securities (continued) SharesValue(000)
Money market investments purchased with collateral from securities on loan 0.17%
Goldman Sachs Financial Square Government Fund, Institutional Shares 0.02%4,6 38,305,963 $ 38,305Capital Group Central Cash Fund 0.04%4,5,6 309,664 30,967Invesco Short-Term Investments Trust – Government & Agency Portfolio,
Institutional Class 0.03%4,6 203,392 203
69,475
Total short-term securities (cost: $1,051,746,000) 1,051,842
Total investment securities 100.33% (cost: $23,482,914,000) 41,110,466
Other assets less liabilities (0.33)% (133,519)
Net assets 100.00% $40,976,947
Investments in affiliates5
Value ofaffiliates at1/1/2021
(000)Additions
(000)Reductions
(000)
Netrealized
loss(000)
Netunrealized
depreciation(000)
Value ofaffiliates at6/30/2021
(000)
Dividendincome
(000)
Short-term securities 2.47%Money market investments 2.40%
Capital Group Central Cash Fund 0.04%4 $1,005,764 $4,245,629 $4,268,866 $(52) $(108) $ 982,367 $486
Money market investments purchased with collateral fromsecurities on loan 0.07%Capital Group Central Cash Fund 0.04%4,6 — 30,9677 30,967 —8
Total short-term securities 1,013,334
Total 2.47% $(52) $(108) $1,013,334 $486
1Security did not produce income during the last 12 months.2All or a portion of this security was on loan. The total value of all such securities was $75,628,000, which represented .18% of the net assets of the fund. Refer toNote 5 for more information on securities lending.
3Acquired in a transaction exempt from registration under Rule 144A of the Securities Act of 1933. May be resold in the U.S. in transactions exempt fromregistration, normally to qualified institutional buyers. The total value of all such securities was $7,575,000, which represented .02% of the net assets of the fund.
4Rate represents the seven-day yield at 6/30/2021.5Part of the same “group of investment companies“ as the fund as defined under the Investment Company Act of 1940, as amended.6Security purchased with cash collateral from securities on loan. Refer to Note 5 for more information on securities lending.7Represents net activity. Refer to Note 5 for more information on securities lending.8Dividend income is included with securities lending income in the fund’s statement of operations and is not shown in this table.
Key to abbreviationsADR = American Depositary ReceiptsCAD = Canadian dollars
See notes to financial statements.
Growth-Income Fund (continued)

86 American Funds Insurance Series
Common stocks 94.32% SharesValue(000)
Financials17.54%
HDFC Bank, Ltd. 2,309,600 $ 46,543ING Groep NV 3,359,189 44,372AIA Group, Ltd. 2,338,600 29,066Zurich Insurance Group AG 54,100 21,704DNB ASA 825,000 17,975Sberbank of Russia PJSC (ADR) 999,000 16,589Moscow Exchange MICEX-RTS PJSC 5,665,000 13,223B3 SA-Brasil, Bolsa, Balcao 3,906,000 13,209Aegon NV 2,483,308 10,303Great-West Lifeco, Inc. (CAD denominated)1 248,102 7,370PICC Property and Casualty Co., Ltd., Class H 7,905,000 6,923Fairfax Financial Holdings, Ltd., subordinate voting shares 15,600 6,841Allfunds Group PLC2 99,470 1,731
235,849
Consumerdiscretionary13.51%
LVMHMoët Hennessy-Louis Vuitton SE 48,000 37,638Prosus NV 345,500 33,786Sony Group Corp. 224,700 21,874Naspers, Ltd., Class N 95,400 20,030Taylor Wimpey PLC 6,878,250 15,124Flutter Entertainment PLC (CDI)2 73,000 13,274Kering SA 14,379 12,566Galaxy Entertainment Group, Ltd.2 1,345,000 10,766Ferrari NV (EUR denominated) 50,000 10,316Alibaba Group Holding, Ltd.2 221,000 6,262
181,636
Health care9.84%
Daiichi Sankyo Company, Ltd. 1,359,000 29,292Aier Eye Hospital Group Co., Ltd., Class A 2,610,189 28,673Richter Gedeon Nyrt. 642,232 17,098Fresenius SE & Co. KGaA 283,701 14,800HOYA Corp. 85,000 11,270Novartis AG 113,564 10,349Chugai Pharmaceutical Co., Ltd. 228,900 9,070GlaxoSmithKline PLC 386,500 7,589Teva Pharmaceutical Industries, Ltd. (ADR)2 417,000 4,128NMC Health PLC2,3,4 304,610 4
132,273
Materials9.45%
Vale SA, ordinary nominative shares 1,712,500 38,993Vale SA, ordinary nominative shares (ADR) 424,300 9,678Rio Tinto PLC 455,900 37,517Linde PLC 53,000 15,322Air Liquide SA, non-registered shares 79,200 13,867Akzo Nobel NV 93,955 11,609
126,986
Communicationservices9.29%
SoftBank Corp. 4,691,700 61,383Yandex NV, Class A2 397,400 28,116Tencent Holdings, Ltd. 209,500 15,758Bilibili, Inc., Class Z (ADR)2 69,200 8,431SoftBank Group Corp. 106,600 7,461Rightmove PLC 423,500 3,804
124,953
International Growth and Income FundInvestment portfolio June 30, 2021 unaudited

American Funds Insurance Series 87
Common stocks (continued) SharesValue(000)
Industrials8.65%
Airbus SE, non-registered shares2 246,912 $ 31,749Ryanair Holdings PLC (ADR)2 179,000 19,370Singapore Technologies Engineering, Ltd. 5,270,000 15,167Shanghai International Airport Co., Ltd., Class A 2,012,496 14,991Komatsu, Ltd. 445,000 11,057LIXIL Corp. 385,000 9,956Aena SME, SA, non-registered shares 52,450 8,601Recruit Holdings Co., Ltd. 108,400 5,337
116,228
Informationtechnology8.58%
ASML Holding NV 47,800 32,840Avast PLC 3,804,000 25,774Taiwan Semiconductor Manufacturing Company, Ltd. 1,010,000 21,568Nice, Ltd. (ADR) 73,400 18,163SUMCO Corp. 692,000 16,974
115,319
Consumer staples7.27%
Imperial Brands PLC 1,848,572 39,815Treasury Wine Estates, Ltd. 2,607,742 22,842Philip Morris International, Inc. 140,000 13,875Pernod Ricard SA 39,400 8,746British American Tobacco PLC 216,802 8,397Kirin Holdings Company, Ltd. 209,500 4,085
97,760
Utilities4.30%
ENN Energy Holdings, Ltd. 1,150,000 21,891Enel SpA 1,522,000 14,134Iberdrola, SA, non-registered shares 632,578 7,711E.ON SE 636,000 7,356SSE PLC 325,350 6,753
57,845
Energy3.18%
Royal Dutch Shell PLC, Class A (GBP denominated) 792,000 15,851Canadian Natural Resources, Ltd. (CAD denominated) 272,500 9,892Canadian Natural Resources, Ltd. 92,000 3,338Cenovus Energy ,Inc. 935,000 8,946TotalEnergies SE 104,750 4,739
42,766
Real estate2.71%
China Resources Mixc Lifestyle Services, Ltd. 2,193,461 15,015Sun Hung Kai Properties, Ltd. 747,000 11,132Embassy Office Parks REIT 2,191,000 10,328
36,475
Total common stocks (cost: $890,370,000) 1,268,090
Preferred securities 0.97%
Energy0.97%
Petróleo Brasileiro SA (Petrobras), preferred nominative shares (ADR) 591,100 6,981Petróleo Brasileiro SA (Petrobras), preferred nominative shares 1,031,250 6,102
Total preferred securities (cost: $7,450,000) 13,083
International Growth and Income Fund (continued)
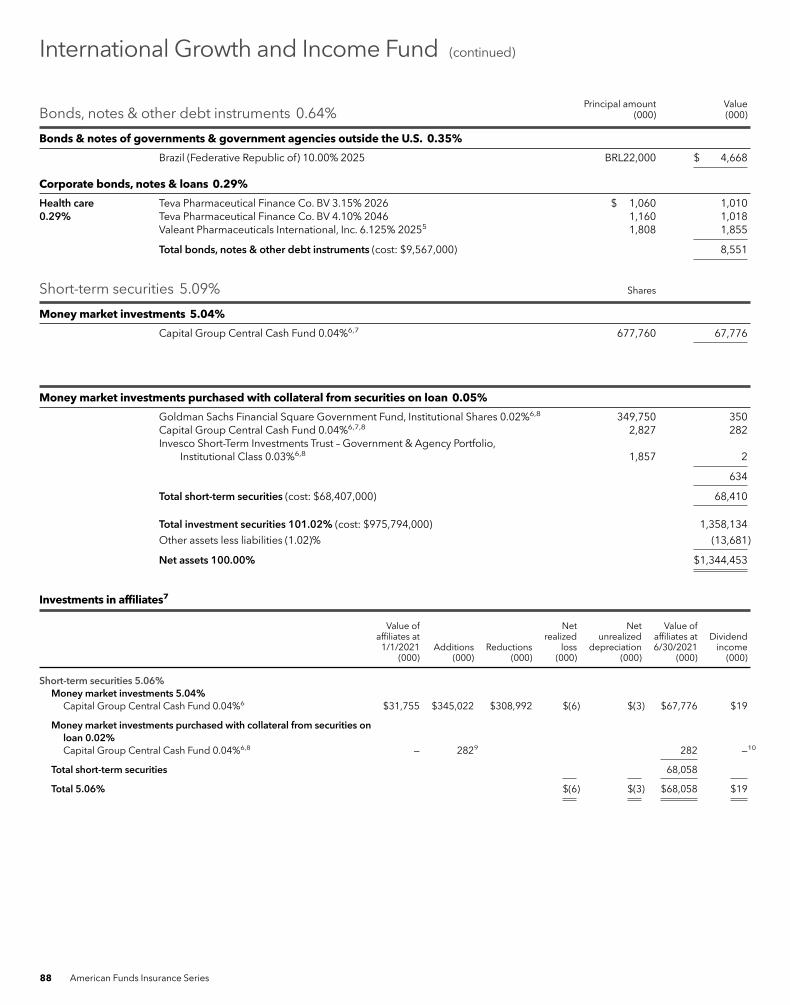
88 American Funds Insurance Series
Bonds, notes & other debt instruments 0.64%Principal amount
(000)Value(000)
Bonds & notes of governments & government agencies outside the U.S. 0.35%
Brazil (Federative Republic of) 10.00% 2025 BRL22,000 $ 4,668
Corporate bonds, notes & loans 0.29%
Health care0.29%
Teva Pharmaceutical Finance Co. BV 3.15% 2026 $ 1,060 1,010Teva Pharmaceutical Finance Co. BV 4.10% 2046 1,160 1,018Valeant Pharmaceuticals International, Inc. 6.125% 20255 1,808 1,855
Total bonds, notes & other debt instruments (cost: $9,567,000) 8,551
Short-term securities 5.09% Shares
Money market investments 5.04%
Capital Group Central Cash Fund 0.04%6,7 677,760 67,776
Money market investments purchased with collateral from securities on loan 0.05%
Goldman Sachs Financial Square Government Fund, Institutional Shares 0.02%6,8 349,750 350Capital Group Central Cash Fund 0.04%6,7,8 2,827 282Invesco Short-Term Investments Trust – Government & Agency Portfolio,
Institutional Class 0.03%6,8 1,857 2
634
Total short-term securities (cost: $68,407,000) 68,410
Total investment securities 101.02% (cost: $975,794,000) 1,358,134
Other assets less liabilities (1.02)% (13,681)
Net assets 100.00% $1,344,453
Investments in affiliates7
Value ofaffiliates at1/1/2021
(000)Additions
(000)Reductions
(000)
Netrealized
loss(000)
Netunrealized
depreciation(000)
Value ofaffiliates at6/30/2021
(000)
Dividendincome
(000)
Short-term securities 5.06%Money market investments 5.04%
Capital Group Central Cash Fund 0.04%6 $31,755 $345,022 $308,992 $(6) $(3) $67,776 $19
Money market investments purchased with collateral from securities onloan 0.02%Capital Group Central Cash Fund 0.04%6,8 — 2829 282 —10
Total short-term securities 68,058
Total 5.06% $(6) $(3) $68,058 $19
International Growth and Income Fund (continued)

American Funds Insurance Series 89
1All or a portion of this security was on loan. The total value of all such securities was $671,000, which represented .05% of the net assets of the fund. Refer toNote 5 for more information on securities lending.
2Security did not produce income during the last 12 months.3Valued under fair value procedures adopted by authority of the board of trustees. The total value of the security was $4,000, which represented less than .01%of the net assets of the fund.
4Value determined using significant unobservable inputs.5Acquired in a transaction exempt from registration under Rule 144A of the Securities Act of 1933. May be resold in the U.S. in transactions exempt fromregistration, normally to qualified institutional buyers. The total value of all such securities was $1,855,000, which represented .14% of the net assets of thefund.
6Rate represents the seven-day yield at 6/30/2021.7Part of the same “group of investment companies“ as the fund as defined under the Investment Company Act of 1940, as amended.8Security purchased with cash collateral from securities on loan. Refer to Note 5 for more information on securities lending.9Represents net activity. Refer to Note 5 for more information on securities lending.
10Dividend income is included with securities lending income in the fund’s statement of operations and is not shown in this table.
Key to abbreviationsADR = American Depositary ReceiptsBRL = Brazilian reaisCAD = Canadian dollarsCDI = CREST Depository InterestEUR = EurosGBP = British pounds
See notes to financial statements.
International Growth and Income Fund (continued)

90 American Funds Insurance Series
Common stocks 77.82% SharesValue(000)
Financials15.52%
JPMorgan Chase & Co. 83,343 $ 12,963Toronto-Dominion Bank (CAD denominated) 183,760 12,878Zurich Insurance Group AG 32,066 12,865Münchener Rückversicherungs-Gesellschaft AG 35,343 9,679PNC Financial Services Group, Inc. 50,003 9,539CME Group, Inc., Class A 36,313 7,723DNB ASA 254,365 5,542Power Corporation of Canada, subordinate voting shares 169,999 5,373DBS Group Holdings, Ltd. 239,306 5,305Principal Financial Group, Inc. 80,612 5,094Great-West Lifeco, Inc. (CAD denominated) 164,724 4,893American International Group, Inc. 97,550 4,643Ping An Insurance (Group) Company of China, Ltd., Class H 382,500 3,746Ping An Insurance (Group) Company of China, Ltd., Class A 60,300 600Intesa Sanpaolo SpA 1,467,194 4,053Hong Kong Exchanges and Clearing, Ltd. 67,600 4,029ING Groep NV 285,107 3,766Kaspi.kz JSC1 34,518 3,659Citigroup, Inc. 42,591 3,013KeyCorp 142,937 2,952Truist Financial Corp. 47,621 2,643Tryg A/S 106,254 2,608AIA Group, Ltd. 188,800 2,347Citizens Financial Group, Inc. 42,181 1,935Moscow Exchange MICEX-RTS PJSC 800,276 1,868East West Bancorp, Inc. 24,733 1,773PICC Property and Casualty Co., Ltd., Class H 2,012,000 1,762B3 SA-Brasil, Bolsa, Balcao 490,029 1,657National Bank of Canada 19,938 1,492U.S. Bancorp 25,853 1,473Travelers Companies, Inc. 9,654 1,445Swedbank AB, Class A 73,840 1,374China Merchants Bank Co., Ltd., Class H 160,500 1,370China Pacific Insurance (Group) Co., Ltd., Class H 420,950 1,326State Street Corp. 15,793 1,299Franklin Resources, Inc. 37,676 1,205BNP Paribas SA 15,079 945UBS Group AG 57,964 887Sberbank of Russia PJSC (ADR) 51,961 863Discover Financial Services 6,895 816Everest Re Group, Ltd. 3,090 779BlackRock, Inc. 827 724Webster Financial Corp. 13,504 720Euronext NV 6,323 688Banco Santander, SA 171,144 653Morgan Stanley 7,109 652Marsh & McLennan Companies, Inc. 4,495 632KBC Groep NV 8,123 619EFG International AG 57,297 470BOC Hong Kong (Holdings), Ltd. 127,000 431Wells Fargo & Company 8,520 386The Blackstone Group, Inc. 2,505 243South State Corp. 2,444 200Cullen/Frost Bankers, Inc. 1,550 174Skandinaviska Enskilda Banken AB, Class A 11,929 154IIFLWealth Management, Ltd. 8,122 127TISCO Financial Group PCL, foreign registered shares 31,200 86Vontobel Holding AG 376 29
161,170
Capital Income BuilderInvestment portfolio June 30, 2021 unaudited

American Funds Insurance Series 91
Common stocks (continued) SharesValue(000)
Informationtechnology9.58%
Broadcom, Inc. 73,782 $35,182Microsoft Corp. 75,404 20,427Taiwan Semiconductor Manufacturing Company, Ltd. 539,800 11,527GlobalWafers Co., Ltd. 168,000 5,541Intel Corp. 88,986 4,996NetApp, Inc. 46,632 3,815Vanguard International Semiconductor Corp. 857,700 3,632KLA Corp. 7,476 2,424Automatic Data Processing, Inc. 11,545 2,293Paychex, Inc. 20,222 2,170Texas Instruments, Inc. 9,708 1,867Apple, Inc. 8,270 1,133QUALCOMM, Inc. 7,229 1,033Tokyo Electron, Ltd. 2,100 909Tripod Technology Corp.2 171,000 829Western Union Company 32,607 749International Business Machines Corp. 2,145 314BE Semiconductor Industries NV 2,742 233SINBON Electronics Co., Ltd.2 20,000 197FDMGroup (Holdings) PLC 12,913 182
99,453
Consumer staples9.20%
Philip Morris International, Inc. 266,353 26,398British American Tobacco PLC 353,229 13,681Nestlé SA 53,596 6,674General Mills, Inc. 96,775 5,897Altria Group, Inc. 121,956 5,815PepsiCo, Inc. 37,238 5,518Unilever PLC (GBP denominated) 81,677 4,780Coca-Cola Company 78,070 4,224Carlsberg A/S, Class B 18,594 3,466Imperial Brands PLC 149,897 3,228Danone SA 43,107 3,035Keurig Dr Pepper, Inc. 60,055 2,116ITC, Ltd. 772,549 2,107Kraft Heinz Company 49,619 2,023Anheuser-Busch InBev SA/NV 23,574 1,700Kimberly-Clark Corp. 9,419 1,260Reckitt Benckiser Group PLC 10,484 928Vector Group, Ltd. 62,743 887Procter & Gamble Company 5,682 767Inner Mongolia Yili Industrial Group Co., Ltd., Class A 78,800 449Viscofan, SA, non-registered shares 3,213 224Scandinavian Tobacco Group A/S 10,343 211Hilton Food Group PLC 9,039 137
95,525
Health care8.31%
Amgen, Inc. 79,720 19,432Gilead Sciences, Inc. 250,519 17,251AbbVie, Inc. 87,233 9,826GlaxoSmithKline PLC 457,135 8,976Novartis AG 76,224 6,946Medtronic PLC 49,665 6,165AstraZeneca PLC 40,350 4,846Abbott Laboratories 29,261 3,392UnitedHealth Group, Inc. 6,641 2,659Merck & Co., Inc. 27,010 2,101Roche Holding AG, nonvoting non-registered shares 5,287 1,992
Capital Income Builder (continued)

92 American Funds Insurance Series
Common stocks (continued) SharesValue(000)
Health care(continued)
Eli Lilly and Company 5,987 $ 1,374Royalty Pharma PLC, Class A 31,087 1,274Organon & Co.2 1,852 56
86,290
Real estate7.41%
Crown Castle International Corp. REIT 140,260 27,365VICI Properties, Inc. REIT 312,915 9,707Digital Realty Trust, Inc. REIT 49,293 7,417Gaming and Leisure Properties, Inc. REIT 113,388 5,253Link Real Estate Investment Trust REIT 476,818 4,621Federal Realty Investment Trust REIT 23,928 2,804MGMGrowth Properties LLC REIT, Class A 68,972 2,526CK Asset Holdings, Ltd. 300,000 2,071TAG Immobilien AG 57,556 1,826Longfor Group Holdings, Ltd. 321,000 1,798Equinix, Inc. REIT 1,936 1,554Charter Hall Group REIT 129,795 1,511American Tower Corp. REIT 4,320 1,167Embassy Office Parks REIT 200,200 944CTP NV2 42,585 858Powergrid Infrastructure Investment Trust2 555,500 847Americold Realty Trust REIT 21,956 831Sun Hung Kai Properties, Ltd. 55,255 823Alexandria Real Estate Equities, Inc. REIT 4,454 810Mindspace Business Parks REIT 201,600 767Kimco Realty Corp. REIT 35,988 750China Resources Land, Ltd. 132,000 535PSP Swiss Property AG 1,512 192
76,977
Utilities6.97%
Enel SpA 1,036,440 9,625Iberdrola, SA, non-registered shares 736,018 8,972DTE Energy Company 57,440 7,444E.ON SE 608,464 7,037Power Grid Corporation of India, Ltd. 1,687,070 5,275Duke Energy Corp. 44,351 4,378Exelon Corp. 96,088 4,258Dominion Energy, Inc. 53,419 3,930Southern Co. 53,857 3,259Entergy Corp. 27,180 2,710China Gas Holdings, Ltd. 631,600 1,928SSE PLC 91,281 1,895Engie SA 135,934 1,862National Grid PLC 144,076 1,835AES Corp. 62,187 1,621Endesa, SA 61,633 1,495Public Service Enterprise Group, Inc. 18,838 1,125Sempra Energy 6,993 927Edison International 9,921 574Power Assets Holdings, Ltd. 89,000 546Centrica PLC2 609,025 434Keppel Infrastructure Trust 908,536 375Guangdong Investment, Ltd. 220,000 316Ratch Group PCL, foreign registered shares 205,400 293CMS Energy Corp. 2,685 159NextEra Energy, Inc. 1,381 101
72,374
Capital Income Builder (continued)

American Funds Insurance Series 93
Common stocks (continued) SharesValue(000)
Energy5.02%
TC Energy Corp. (CAD denominated) 150,611 $ 7,453TC Energy Corp. 45,730 2,264Chevron Corp. 91,856 9,621Canadian Natural Resources, Ltd. (CAD denominated) 199,048 7,226EOG Resources, Inc. 48,393 4,038Enbridge, Inc. (CAD denominated) 98,420 3,940Gazprom PJSC (ADR) 490,038 3,735ConocoPhillips 58,458 3,560TotalEnergies SE 65,989 2,986Royal Dutch Shell PLC, Class B 100,799 1,951Royal Dutch Shell PLC, Class B (ADR) 6,718 261BP PLC 355,878 1,551Equitrans Midstream Corp. 181,336 1,543Schlumberger, Ltd. 30,694 983Exxon Mobil Corp. 11,940 753Petronet LNG, Ltd. 96,578 293
52,158
Materials4.76%
Vale SA, ordinary nominative shares (ADR) 455,362 10,387Vale SA, ordinary nominative shares 214,692 4,888Rio Tinto PLC 99,773 8,211BHP Group PLC 225,415 6,642LyondellBasell Industries NV 45,568 4,688Fortescue Metals Group, Ltd. 141,754 2,481Air Products and Chemicals, Inc. 8,081 2,325Dow Inc. 34,546 2,186Evonik Industries AG 49,826 1,671Asahi Kasei Corp. 146,600 1,611BASF SE 18,155 1,430Linde PLC 4,289 1,240Celanese Corp. 5,378 815Nexa Resources SA 43,598 382WestRock Co. 6,230 331Amcor PLC (CDI) 17,918 203
49,491
Communicationservices4.61%
Comcast Corp., Class A 217,877 12,423SoftBank Corp. 690,000 9,028BCE, Inc. 124,515 6,140Verizon Communications, Inc. 70,618 3,957Koninklijke KPN NV 1,032,627 3,225HKT Trust and HKT, Ltd., units 1,927,240 2,626TELUS Corp. 103,494 2,321Indus Towers, Ltd. 450,711 1,447Nippon Telegraph and Telephone Corp. 45,100 1,175Vodafone Group PLC 659,561 1,107WPP PLC 80,334 1,083ITV PLC2 501,633 871Omnicom Group, Inc. 8,748 700ProSiebenSat.1 Media SE 33,506 666HKBN, Ltd. 526,000 637Zegona Communications PLC 128,515 264Sanoma Oyj 10,670 177
47,847
Industrials3.89%
Raytheon Technologies Corp. 136,972 11,685VINCI SA 27,538 2,938Lockheed Martin Corp. 7,666 2,900BOCAviation, Ltd. 340,200 2,870
Capital Income Builder (continued)

94 American Funds Insurance Series
Common stocks (continued) SharesValue(000)
Industrials(continued)
Singapore Technologies Engineering, Ltd. 961,100 $ 2,766RELX PLC 93,520 2,483Trinity Industries, Inc. 72,684 1,954ABB, Ltd. 54,575 1,852Waste Management, Inc. 11,665 1,634Union Pacific Corp. 5,919 1,302CCR SA, ordinary nominative shares 448,936 1,214Cía. de Distribución Integral Logista Holdings, SA, non-registered shares 47,238 971United Parcel Service, Inc., Class B 4,361 907Cummins, Inc. 3,685 898BAE Systems PLC 124,017 896Caterpillar, Inc. 2,653 577Deutsche Post AG 7,139 486ALD SA 27,810 417General Dynamics Corp. 2,115 398Melrose Industries PLC 111,714 240Honeywell International, Inc. 1,058 232L3Harris Technologies, Inc. 1,056 228Norfolk Southern Corp. 811 215Atlas Corp. 11,760 168Mitsubishi Corp. 4,400 120Stanley Black & Decker, Inc. 429 88
40,439
Consumerdiscretionary2.55%
Home Depot, Inc. 13,586 4,332McDonald’s Corp. 15,471 3,574Industria de Diseño Textil, SA 65,535 2,309Kering SA 2,610 2,281Starbucks Corp. 19,872 2,222Midea Group Co., Ltd., Class A 183,600 2,028Cie. Financière Richemont SA, Class A 15,382 1,861Hasbro, Inc. 17,588 1,662Taylor Wimpey PLC 655,324 1,441YUM! Brands, Inc. 8,899 1,024LVMHMoët Hennessy-Louis Vuitton SE 1,167 915Gree Electric Appliances, Inc. of Zhuhai, Class A 98,638 795VF Corp. 9,432 774Sands China, Ltd.2 148,400 625SAIC Motor Corp., Ltd., Class A2 129,318 440Inchcape PLC 12,146 129Thule Group AB 2,169 96
26,508
Total common stocks (cost: $605,347,000) 808,232
Preferred securities 0.20%
Informationtechnology0.20%
Samsung Electronics Co., Ltd., nonvoting preferred shares 30,801 2,016
Total preferred securities (cost: $1,193,000) 2,016
Rights & warrants 0.00%
Consumerdiscretionary0.00%
Cie. Financière Richemont SA, Class A, warrants, expire 20232 7,130 5
Total rights & warrants (cost: $0) 5
Capital Income Builder (continued)

American Funds Insurance Series 95
Convertible stocks 1.07% SharesValue(000)
Utilities0.40%
NextEra Energy, Inc., convertible preferred units, 4.872% 2022 29,485 $ 1,656American Electric Power Company, Inc., convertible preferred units, 6.125% 2023 15,148 776American Electric Power Company, Inc., convertible preferred shares, 6.125% 2022 4,100 202AES Corp., convertible preferred units, 6.875% 2024 8,659 931Dominion Energy, Inc., Series A, convertible preferred shares, 7.25% 2022 5,900 573
4,138
Informationtechnology0.31%
Broadcom, Inc., Series A, cumulative convertible preferred shares, 8.00% 2022 2,124 3,228
Health care0.25%
Danaher Corp., Series B, cumulative convertible preferred shares, 5.00% 20233 1,745 2,575
Industrials0.08%
Stanley Black & Decker, Inc., convertible preferred shares, 5.25% 20223 7,000 845
Consumerdiscretionary0.03%
Aptiv PLC, Series A, convertible preferred shares, 5.50% 2023 1,948 348
Total convertible stocks (cost: $8,553,000) 11,134
Investment funds 2.94%
Capital Group Central Corporate Bond Fund4 3,019,249 30,524
Total investment funds (cost: $30,464,000) 30,524
Convertible bonds & notes 0.05%Principal amount
(000)
Consumerdiscretionary0.05%
Royal Caribbean Cruises, Ltd., convertible notes, 4.25% 20231 $ 392 536
Total convertible bonds & notes (cost: $395,000) 536
Bonds, notes & other debt instruments 14.41%
U.S. Treasury bonds & notes 7.85%
U.S. Treasury6.31%
U.S. Treasury 0.125% 2022 15,750 15,756U.S. Treasury 0.125% 2022 5,850 5,852U.S. Treasury 0.125% 2022 2,600 2,600U.S. Treasury 0.125% 2022 1,625 1,624U.S. Treasury 0.125% 2023 2,200 2,198U.S. Treasury 0.125% 2023 2,000 1,997U.S. Treasury 0.125% 2023 1,125 1,123U.S. Treasury 0.125% 2023 1,025 1,024U.S. Treasury 0.375% 2025 907 897U.S. Treasury 0.75% 2026 7,803 7,764U.S. Treasury 0.75% 2026 3,850 3,828U.S. Treasury 0.75% 2026 1 1U.S. Treasury 1.875% 2026 6,300 6,608U.S. Treasury 2.00% 20265 2,800 2,955U.S. Treasury 0.50% 2027 2,900 2,813U.S. Treasury 1.25% 2028 1,350 1,355
Capital Income Builder (continued)

96 American Funds Insurance Series
Bonds, notes & other debt instruments (continued)Principal amount
(000)Value(000)
U.S. Treasury bonds & notes (continued)
U.S. Treasury(continued)
U.S. Treasury 1.625% 2031 $ 66 $ 67U.S. Treasury 1.125% 20405 2,400 2,070U.S. Treasury 1.875% 20515 5,328 5,074
65,606
U.S. Treasuryinflation-protectedsecurities1.54%
U.S. Treasury Inflation-Protected Security 0.125% 20236 620 648U.S. Treasury Inflation-Protected Security 0.375% 20236 1,147 1,220U.S. Treasury Inflation-Protected Security 0.625% 20236 1,461 1,545U.S. Treasury Inflation-Protected Security 0.125% 20246 684 736U.S. Treasury Inflation-Protected Security 0.125% 20246 190 205U.S. Treasury Inflation-Protected Security 0.50% 20246 554 598U.S. Treasury Inflation-Protected Security 0.625% 20246 670 722U.S. Treasury Inflation-Protected Security 0.125% 20256 1,137 1,228U.S. Treasury Inflation-Protected Security 0.125% 20266 2,896 3,154U.S. Treasury Inflation-Protected Security 0.125% 20306 1,920 2,109U.S. Treasury Inflation-Protected Security 0.125% 20316 1,641 1,807U.S. Treasury Inflation-Protected Security 0.125% 20515,6 1,820 1,995
15,967
Total U.S. Treasury bonds & notes 81,573
Mortgage-backed obligations 3.44%
Federal agencymortgage-backedobligations2.77%
Fannie Mae Pool #695412 5.00% 20337 —8 —8
Fannie Mae Pool #AD3566 5.00% 20357 2 2Fannie Mae Pool #AC0794 5.00% 20397 8 10Fannie Mae Pool #931768 5.00% 20397 2 2Fannie Mae Pool #AE0311 3.50% 20407 13 14Fannie Mae Pool #932606 5.00% 20407 4 5Fannie Mae Pool #AJ1873 4.00% 20417 7 8Fannie Mae Pool #AE1248 5.00% 20417 11 13Fannie Mae Pool #AE1274 5.00% 20417 8 9Fannie Mae Pool #AE1277 5.00% 20417 5 6Fannie Mae Pool #AE1283 5.00% 20417 3 3Fannie Mae Pool #AE1290 5.00% 20427 6 6Fannie Mae Pool #AT3954 3.50% 20437 4 4Fannie Mae Pool #AT0300 3.50% 20437 2 3Fannie Mae Pool #AY1829 3.50% 20447 4 4Fannie Mae Pool #AW8240 3.50% 20447 1 1Fannie Mae Pool #BJ5015 4.00% 20477 58 63Fannie Mae Pool #BH3122 4.00% 20477 1 1Fannie Mae Pool #BK6840 4.00% 20487 38 41Fannie Mae Pool #BK5232 4.00% 20487 30 32Fannie Mae Pool #BK9743 4.00% 20487 11 12Fannie Mae Pool #CA2804 4.50% 20487 426 459Fannie Mae Pool #BK9761 4.50% 20487 8 9Fannie Mae Pool #CA5540 3.00% 20507 4,629 4,915Fannie Mae Pool #BF0497 3.00% 20607 435 462Freddie Mac Pool #Q15874 4.00% 20437 2 2Freddie Mac Pool #G67711 4.00% 20487 359 393Freddie Mac Pool #Q56599 4.00% 20487 46 50Freddie Mac Pool #Q56175 4.00% 20487 34 37Freddie Mac Pool #Q55971 4.00% 20487 32 35Freddie Mac Pool #Q56576 4.00% 20487 25 27Freddie Mac Pool #Q55970 4.00% 20487 13 14Freddie Mac Pool #Q58411 4.50% 20487 93 103Freddie Mac Pool #Q58436 4.50% 20487 41 45Freddie Mac Pool #Q58378 4.50% 20487 33 36Freddie Mac Pool #Q57242 4.50% 20487 28 30Freddie Mac Pool #SD8158 3.50% 20517 25 26
Capital Income Builder (continued)

American Funds Insurance Series 97
Bonds, notes & other debt instruments (continued)Principal amount
(000)Value(000)
Mortgage-backed obligations (continued)
Federal agencymortgage-backedobligations(continued)
Freddie Mac Pool #SD8164 3.50% 20517 $ 1 $ 1Freddie Mac Seasoned Credit Risk Transfer Trust, Series 2017-2, Class MA,
3.00% 20567 337 353Freddie Mac Seasoned Credit Risk Transfer Trust, Series 2017-2, Class HA,
3.00% 20567,9 336 352Freddie Mac Seasoned Credit Risk Transfer Trust, Series 2017-1, Class HA,
3.00% 20567,9 162 170Freddie Mac Seasoned Credit Risk Transfer Trust, Series 2017-4, Class HT,
3.25% 20577,9 130 140Freddie Mac Seasoned Credit Risk Transfer Trust, Series 2017-4, Class MT,
3.50% 20577 107 116Freddie Mac Seasoned Credit Risk Transfer Trust, Series 2018-3, Class MA,
3.50% 20577 30 32Freddie Mac Seasoned Credit Risk Transfer Trust, Series 2019-1, Class MT,
3.50% 20587 1,286 1,403Freddie Mac Seasoned Credit Risk Transfer Trust, Series 2019-2, Class MA,
3.50% 20587 910 959Freddie Mac Seasoned Credit Risk Transfer Trust, Series 2019-1, Class MA,
3.50% 20587 616 648Freddie Mac Seasoned Credit Risk Transfer Trust, Series 2019-3, Class MA,
3.50% 20587 29 30Freddie Mac Seasoned Credit Risk Transfer Trust, Series 2019-3, Class MT,
3.50% 20587 13 14Freddie Mac Seasoned Loan Structured Transaction Trust, Series 2018-2, Class A1,
3.50% 20287 1,290 1,365Freddie Mac Seasoned Loan Structured Transaction Trust, Series 2019-2, Class A1C,
2.75% 20297 1,899 2,000Government National Mortgage Assn. 2.00% 20517,10 1,580 1,606Government National Mortgage Assn. 2.50% 20517,10 2,106 2,176Government National Mortgage Assn. 3.50% 20517,10 42 44Government National Mortgage Assn. Pool #MA5764 4.50% 20497 982 1,048Government National Mortgage Assn. Pool #MA5877 4.50% 20497 110 118Government National Mortgage Assn. Pool #694836 5.661% 20597 1 1Government National Mortgage Assn. Pool #765152 4.14% 20617 —8 —8
Government National Mortgage Assn. Pool #766525 4.70% 20627 —8 —8
Government National Mortgage Assn. Pool #777452 3.63% 20637 5 5Government National Mortgage Assn. Pool #767639 3.89% 20637 1 2Government National Mortgage Assn. Pool #725893 5.20% 20647 —8 —8
Government National Mortgage Assn. Pool #AA7554 6.64% 20647 1 1UniformMortgage-Backed Security 2.50% 20367,10 1,608 1,675UniformMortgage-Backed Security 3.00% 20517,10 1,595 1,660UniformMortgage-Backed Security 3.50% 20517,10 1,750 1,843UniformMortgage-Backed Security 4.00% 20517,10 3,425 3,650UniformMortgage-Backed Security 4.50% 20517,10 402 433
28,727
Collateralizedmortgage-backedobligations (privatelyoriginated)0.57%
Arroyo Mortgage Trust, Series 2021-1R, Class A1, 1.175% 20481,7,9 260 262Cascade Funding Mortgage Trust, Series 2020-HB4, Class A, 0.946% 20301,7,9 163 164Cascade Funding Mortgage Trust, Series 2021-HB6, Class A, 0.898% 20361,7,9 164 164Citigroup Mortgage Loan Trust, Inc., Series 2020-EXP1, Class A1A, 1.804% 20601,7,9 43 43Legacy Mortgage Asset Trust, Series 2019-GS5, Class A1, 3.20% 20591,7,9 189 190Legacy Mortgage Asset Trust, Series 2019-GS2, Class A1, 3.75% 20591,7,9 159 160Legacy Mortgage Asset Trust, Series 2021-GS2, Class A1, 1.75% 20611,7,9 99 99Mello Warehouse Securitization Trust, Series 2019-2, Class A,
(1-month USD-LIBOR + 0.75%) 0.842% 20521,7,9 1,000 1,002Mello Warehouse Securitization Trust, Series 2020-2, Class A,
(1-month USD-LIBOR + 0.80%) 0.892% 20531,7,9 175 175Mello Warehouse Securitization Trust, Series 2020-1, Class A,
(1-month USD-LIBOR + 0.90%) 0.992% 20531,7,9 279 279
Capital Income Builder (continued)

98 American Funds Insurance Series
Bonds, notes & other debt instruments (continued)Principal amount
(000)Value(000)
Mortgage-backed obligations (continued)
Collateralizedmortgage-backedobligations (privatelyoriginated)(continued)
MRA Issuance Trust, Series 2021-8, Class A1X,(1-month USD-LIBOR + 1.15%) 1.26% 20211,7,9 $ 406 $ 406
MRA Issuance Trust, Series 2020-10, Class A,(1-month USD-LIBOR + 1.70%) 1.786% 20221,7,9 1,586 1,587
Nationstar HECM Loan Trust, Series 2019-2A, Class A, 2.272% 20291,7,9 68 68Nationstar HECM Loan Trust, Series 2019-1A, Class A, 2.651% 20291,7,9 45 45NewRezWarehouse Securitization Trust, Series 2021-1, Class A,
(1-month USD-LIBOR + 0.75%) 0.842% 20551,7,9 281 282Towd Point Mortgage Trust, Series 2016-5, Class A1, 2.50% 20561,7,9 82 84Towd Point Mortgage Trust, Series 2017-6, Class A1, 2.75% 20571,7,9 76 78Towd Point Mortgage Trust, Series 2017-3, Class A1, 2.75% 20571,7,9 52 53Towd Point Mortgage Trust, Series 2018-2, Class A1, 3.25% 20581,7,9 89 92Towd Point Mortgage Trust, Series 2018-5, Class A1A, 3.25% 20581,7,9 49 50Towd Point Mortgage Trust, Series 2020-4, Class A1, 1.75% 20601,7 683 691
5,974
Commercialmortgage-backedsecurities0.10%
BX Trust, Series 2021-SOAR, Class A, (1-month USD-LIBOR + 0.67%) 0.77% 20381,7,9 174 174BX Trust, Series 2021-SOAR, Class D, (1-month USD-LIBOR + 1.40%) 1.50% 20381,7,9 100 100Extended Stay America Trust, Series 2021-ESH, Class A,
(1-month USD-LIBOR + 1.08%) 1.155% 20381,7,9 100 100GS Mortgage Securities Trust, Series 2018-HULA, Class A, 0.993% 20251,7,9 235 236Hawaii Hotel Trust, Series 2019-MAUI, Class A,
(1-month USD-LIBOR + 1.15%) 1.223% 20381,7,9 300 302Multi Family Connecticut Avenue Securities, Series 2019-1, Class M10,
(1-month USD-LIBOR + 3.25%) 3.342% 20491,7,9 150 153
1,065
Total mortgage-backed obligations 35,766
Corporate bonds, notes & loans 2.45%
Energy0.53%
Apache Corp. 4.25% 2030 385 407BP Capital Markets America, Inc. 3.633% 2030 360 404Cenovus Energy, Inc. 5.40% 2047 75 93Cheniere Energy, Inc. 3.70% 2029 252 275Enbridge Energy Partners LP 7.375% 2045 37 58Energy Transfer Operating LP 5.00% 2050 341 395Energy Transfer Partners LP 5.30% 2047 60 70Energy Transfer Partners LP 6.00% 2048 76 96Energy Transfer Partners LP 6.25% 2049 150 197EQT Corp. 5.00% 2029 35 39EQT Corp. 3.625% 20311 20 21Equinor ASA 2.375% 2030 365 377Exxon Mobil Corp. 2.995% 2039 200 206MPLX LP 5.50% 2049 625 811New Fortress Energy, Inc. 6.50% 20261 80 82NGL Energy Operating LLC 7.50% 20261 80 84ONEOK, Inc. 3.10% 2030 42 44ONEOK, Inc. 4.95% 2047 51 60ONEOK, Inc. 7.15% 2051 97 143Pemex Project Funding Master Trust, Series 13, 6.625% 2035 150 145Petrobras Global Finance Co. 5.60% 2031 150 168Petróleos Mexicanos 7.69% 2050 75 72Sabine Pass Liquefaction, LLC 4.50% 2030 215 248Shell International Finance BV 2.00% 2024 420 437TransCanada PipeLines, Ltd. 5.10% 2049 425 559
5,491
Capital Income Builder (continued)

American Funds Insurance Series 99
Bonds, notes & other debt instruments (continued)Principal amount
(000)Value(000)
Corporate bonds, notes & loans (continued)
Consumerdiscretionary0.42%
Bayerische MotorenWerke AG 4.15% 20301 $ 290 $ 338Carnival Corp. 11.50% 20231 425 479General Motors Company 5.95% 2049 90 123Marriott International, Inc. 2.85% 2031 50 51Royal Caribbean Cruises, Ltd. 10.875% 20231 600 684Royal Caribbean Cruises, Ltd. 11.50% 20251 1,145 1,321Toyota Motor Credit Corp. 2.15% 2022 505 517Toyota Motor Credit Corp. 2.60% 2022 856 867
4,380
Communicationservices0.40%
AT&T, Inc. 3.50% 2041 75 78CCO Holdings LLC and CCO Holdings Capital Corp. 4.25% 20311 360 367CenturyLink, Inc. 7.50% 2024 300 337SBA Tower Trust 1.631% 20261 253 254Sprint Corp. 11.50% 2021 1,425 1,480Sprint Corp. 6.875% 2028 325 417T-Mobile US, Inc. 3.875% 2030 625 701T-Mobile US, Inc. 3.50% 2031 275 285Verizon Communications, Inc. 1.45% 2026 125 126Walt Disney Company 4.625% 2040 120 153
4,198
Health care0.37%
AbbVie, Inc. 4.25% 2049 92 111AstraZeneca Finance LLC 1.75% 2028 65 65AstraZeneca Finance LLC 2.25% 2031 9 9AstraZeneca PLC 3.375% 2025 200 219AstraZeneca PLC 3.00% 2051 11 11Centene Corp. 4.625% 2029 530 584Centene Corp. 3.375% 2030 179 187Johnson & Johnson 1.30% 2030 100 97Merck & Co., Inc. 3.40% 2029 110 123Pfizer, Inc. 2.70% 2050 425 424Tenet Healthcare Corp. 7.50% 20251 325 352Teva Pharmaceutical Finance Co. BV 6.00% 2024 700 744Teva Pharmaceutical Finance Co. BV 3.15% 2026 650 619Teva Pharmaceutical Finance Co. BV 4.10% 2046 300 263
3,808
Utilities0.22%
AEP Transmission Co. LLC 3.80% 2049 45 52American Electric Power Company, Inc. 3.65% 2021 300 304Edison International 4.125% 2028 132 140Emera, Inc. 6.75% 2076 (3-month USD-LIBOR + 5.44% on 6/15/2026)11 120 141FirstEnergy Corp. 2.25% 2030 107 103FirstEnergy Corp. 2.65% 2030 493 492Pacific Gas and Electric Co. 2.95% 2026 97 99Pacific Gas and Electric Co. 3.75% 2028 105 110Pacific Gas and Electric Co. 4.65% 2028 284 313Pacific Gas and Electric Co. 2.50% 2031 375 352Southern California Edison Co., Series C, 3.60% 2045 206 206
2,312
Capital Income Builder (continued)

100 American Funds Insurance Series
Bonds, notes & other debt instruments (continued)Principal amount
(000)Value(000)
Corporate bonds, notes & loans (continued)
Informationtechnology0.14%
Broadcom, Inc. 5.00% 2030 $420 $ 496Broadcom, Inc. 3.75% 20511 91 95Lenovo Group, Ltd. 5.875% 2025 400 453Oracle Corp. 2.875% 2031 140 146Oracle Corp. 3.60% 2050 150 154ServiceNow, Inc. 1.40% 2030 130 122
1,466
Industrials0.14%
Boeing Company 2.70% 2022 300 306Boeing Company 2.75% 2026 91 95Boeing Company 5.15% 2030 284 337Boeing Company 5.805% 2050 95 128CSX Corp. 4.75% 2048 50 65General Electric Co. 3.625% 2030 215 240Masco Corp. 3.125% 2051 10 10Norfolk Southern Corp. 3.00% 2022 224 227
1,408
Consumer staples0.10%
7-Eleven, Inc. 0.80% 20241 50 507-Eleven, Inc. 0.95% 20261 60 597-Eleven, Inc. 1.30% 20281 45 437-Eleven, Inc. 1.80% 20311 325 311Altria Group, Inc. 3.70% 2051 25 24British American Tobacco PLC 4.54% 2047 73 78British American Tobacco PLC 4.758% 2049 130 141Constellation Brands, Inc. 3.15% 2029 190 204Kraft Heinz Company 3.00% 2026 93 99
1,009
Financials0.07%
Bank of America Corp. 1.922% 2031 (USD-SOFR + 1.37% on 10/24/2030)11 231 225JPMorgan Chase & Co. 1.953% 2032 (USD-SOFR + 1.065% on 2/4/2031)11 227 221Navient Corp. 5.00% 2027 150 156New York Life Global Funding 3.00% 20281 150 163
765
Materials0.04%
Dow Chemical Co. 3.60% 2050 75 81International Flavors & Fragrances, Inc. 1.832% 20271 100 100LYB International Finance III, LLC 4.20% 2050 75 87LYB International Finance III, LLC 3.625% 2051 102 108
376
Real estate0.02%
Equinix, Inc. 1.55% 2028 25 24Equinix, Inc. 3.20% 2029 144 155Equinix, Inc. 2.50% 2031 47 48
227
Total corporate bonds, notes & loans 25,440
Asset-backed obligations 0.56%
Aesop Funding LLC, Series 2020-2, Class A, 2.02% 20271,7 197 203Aesop Funding LLC, Series 2020-2A, Class B, 2.96% 20271,7 100 106CF Hippolyta LLC, Series 2020-1, Class A1, 1.69% 20601,7 372 379CF Hippolyta LLC, Series 2020-1, Class A2, 1.99% 20601,7 95 96CF Hippolyta LLC, Series 2020-1, Class B1, 2.28% 20601,7 95 97CF Hippolyta LLC, Series 2020-1, Class B2, 2.60% 20601,7 95 97
Capital Income Builder (continued)

American Funds Insurance Series 101
Bonds, notes & other debt instruments (continued)Principal amount
(000)Value(000)
Asset-backed obligations (continued)
CF Hippolyta LLC, Series 2021-1, Class A1, 1.53% 20611,7 $ 335 $ 338Drivetime Auto Owner Trust, Series 2020-1, Class A, 1.94% 20231,7 85 85FirstKey Homes Trust, Series 2020-SFR2, Class A, 1.266% 20371,7 175 174Freedom Financial, Series 2021-2, Class A, 0.68% 20281,7 106 106GCI Funding I LLC, Series 2020-1, Class A, 2.82% 20451,7 642 654GCI Funding I LLC, Series 2021-1, Class A, 2.38% 20461,7 100 101Global SC Finance V SRL, Series 2019-1A, Class B, 4.81% 20391,7 163 171Hertz Vehicle Financing LLC, Series 2021-1A, Class A, 1.21% 20251,7 247 248Hertz Vehicle Financing LLC, Series 2021-1A, Class B, 1.56% 20251,7 100 100Hertz Vehicle Financing LLC, Series 2021-2A, Class A, 1.68% 20271,7 268 269Hertz Vehicle Financing LLC, Series 2021-2A, Class B, 2.12% 20271,7 100 101Hertz Vehicle Financing LLC, Series 2021-2A, Class C, 2.52% 20271,7 100 101Navient Student Loan Trust, Series 2021-A, Class A, 0.84% 20691,7 85 84Navient Student Loan Trust, Series 2021-C, Class A, 1.06% 20691,7 221 222Nelnet Student Loan Trust, Series 2021-A, Class APT1, 1.36% 20621,7 324 324Nelnet Student Loan Trust, Series 2021-BA, Class AFX, 1.42% 20621,7 631 633Ondeck Asset Securitization Trust LLC, Series 2021-1A, Class A, 1.59% 20271,7 100 101Oportun Funding LLC, Series 2021-B, Class A, 1.47% 20311,7 100 100OSW Structured Asset Trust, Series 2020-RPL1, Class A1, 3.072% 20591,7,9 211 213SMB Private Education Loan Trust, Series 2021-A, Class APT2, 1.07% 20531,7 112 110Toyota Auto Loan Extended Note Trust, Series 2021-1, Class A, 1.07% 20341,7,9 335 336Westlake Automobile Receivables Trust, Series 2019-3A, Class A2, 2.15% 20231,7 229 230
5,779
Bonds & notes of governments & government agencies outside the U.S. 0.08%
Peru (Republic of) 2.783% 2031 190 194Portuguese Republic 5.125% 2024 18 21Qatar (State of) 4.50% 2028 200 236Saudi Arabia (Kingdom of) 3.625% 2028 200 221United Mexican States 3.25% 2030 200 207
879
Municipals 0.03%
Illinois0.03%
G.O. Bonds, Pension Funding, Series 2003, 5.10% 2033 225 265
Total bonds, notes & other debt instruments (cost: $146,606,000) 149,702
Short-term securities 4.73% Shares
Money market investments 4.67%
Capital Group Central Cash Fund 0.04%4,12 485,540 48,554
Money market investments purchased with collateral from securities on loan 0.06%
Goldman Sachs Financial Square Government Fund, Institutional Shares 0.02%12,13 323,395 323Capital Group Central Cash Fund 0.04%4,12,13 2,615 261Invesco Short-Term Investments Trust – Government & Agency Portfolio,
Institutional Class 0.03%12,13 1,717 2
586
Total short-term securities (cost: $49,145,000) 49,140
Total investment securities 101.22% (cost: $841,703,000) 1,051,289
Other assets less liabilities (1.22)% (12,692)
Net assets 100.00% $1,038,597
Capital Income Builder (continued)

102 American Funds Insurance Series
Futures contracts
Contracts TypeNumber ofcontracts Expiration
Notionalamount14
(000)
Value at6/30/202115
(000)
Unrealizedappreciation
(depreciation)at 6/30/2021
(000)
90 Day Euro Dollar Futures Long 19 December 2022 $ 4,750 $ 4,725 $ 12 Year U.S. Treasury Note Futures Short 1 October 2021 (200) (220) —8
5 Year U.S. Treasury Note Futures Long 78 October 2021 7,800 9,628 (18)10 Year U.S. Treasury Note Futures Long 33 September 2021 3,300 4,372 1310 Year Ultra U.S. Treasury Note Futures Short 34 September 2021 (3,400) (5,005) (30)20 Year U.S. Treasury Bond Futures Long 4 September 2021 400 643 230 Year Ultra U.S. Treasury Bond Futures Long 67 September 2021 6,700 12,910 506
$474
Forward currency contracts
Contract amount
CounterpartySettlement
date
Unrealizeddepreciationat 6/30/2021
(000)Purchases
(000)Sales(000)
MXN2,000 USD101 HSBC Bank 7/16/2021 $(1)
Swap contracts
Interest rate swaps
Receive PayExpiration
dateNotional
(000)
Value at6/30/2021
(000)
Upfrontpremium
paid(000)
Unrealizedappreciationat 6/30/2021
(000)
3-month USD-LIBOR 0.337% 5/18/2025 $18,500 $297 $— $ 2973-month USD-LIBOR 0.5935% 5/18/2030 7,200 465 — 4653-month USD-LIBOR 0.807% 5/18/2050 1,800 405 — 405
$— $1,167
Credit default swaps
Centrally cleared credit default swaps on credit indices — sell protection
Receive/Payment frequency Pay
Expirationdate
Notional(000)
Value at6/30/2021
(000)
Upfrontpremium
paid(000)
Unrealizedappreciationat 6/30/2021
(000)
5.00%/Quarterly CDX.NA.HY.36 6/20/2026 $2,975 $304 $265 $39
Capital Income Builder (continued)

American Funds Insurance Series 103
Investments in affiliates4
Value ofaffiliates at1/1/2021
(000)Additions
(000)Reductions
(000)
Netrealized
gain (loss)(000)
Netunrealized
appreciation(depreciation)
(000)
Value ofaffiliates at6/30/2021
(000)
Dividendincome
(000)
Investment funds 2.94%Capital Group Central Corporate Bond Fund $ — $ 30,464 $ — $ — $60 $30,524 $ 5
Short-term securities 4.70%Money market investments 4.67%
Capital Group Central Cash Fund 0.04%12 56,762 148,067 156,269 (1) (5) 48,554 24
Money market investments purchased with collateral from securitieson loan 0.03%Capital Group Central Cash Fund 0.04%12,13 — 26116 261 —17
Total short-term securities 48,815
Total 7.64% $(1) $55 $79,339 $29
1Acquired in a transaction exempt from registration under Rule 144A of the Securities Act of 1933. May be resold in the U.S. in transactions exempt fromregistration, normally to qualified institutional buyers. The total value of all such securities was $21,816,000, which represented 2.10% of the net assets of thefund.
2Security did not produce income during the last 12 months.3All or a portion of this security was on loan. The total value of all such securities was $638,000, which represented .06% of the net assets of the fund. Refer toNote 5 for more information on securities lending.
4Part of the same “group of investment companies“ as the fund as defined under the Investment Company Act of 1940, as amended.5All or a portion of this security was pledged as collateral. The total value of pledged collateral was $1,642,000, which represented .16% of the net assets of thefund.
6Index-linked bond whose principal amount moves with a government price index.7Principal payments may be made periodically. Therefore, the effective maturity date may be earlier than the stated maturity date.8Amount less than one thousand.9Coupon rate may change periodically. Reference rate and spread are as of the most recent information available. Some coupon rates are determined by theissuer or agent based on current market conditions; therefore, the reference rate and spread are not available.
10Purchased on a TBA basis.11Step bond; coupon rate may change at a later date.12Rate represents the seven-day yield at 6/30/2021.13Security purchased with cash collateral from securities on loan. Refer to Note 5 for more information on securities lending.14Notional amount is calculated based on the number of contracts and notional contract size.15Value is calculated based on the notional amount and current market price.16Represents net activity. Refer to Note 5 for more information on securities lending.17Dividend income is included with securities lending income in the fund’s statement of operations and is not shown in this table.
Key to abbreviations and symbolADR = American Depositary ReceiptsCAD = Canadian dollarsCDI = CREST Depository InterestG.O. = General ObligationLIBOR = London Interbank Offered RateMXN =Mexican pesosSOFR = Secured Overnight Financing RateTBA = To-be-announcedUSD/$ = U.S. dollars
See notes to financial statements.
Capital Income Builder (continued)

104 American Funds Insurance Series
Common stocks 69.73% SharesValue(000)
Informationtechnology15.66%
Microsoft Corp. 4,691,061 $1,270,808Broadcom, Inc. 1,545,598 737,003Taiwan Semiconductor Manufacturing Company, Ltd. (ADR) 5,461,700 656,278ASML Holding NV (New York registered) (ADR) 770,900 532,568MKS Instruments, Inc. 1,700,000 302,515VeriSign, Inc.1 1,100,000 250,459Flex, Ltd.1 13,000,000 232,310Dell Technologies, Inc., Class C1 2,000,000 199,340Mastercard, Inc., Class A 538,000 196,418Visa, Inc., Class A 620,200 145,015PayPal Holdings, Inc.1 386,300 112,599DocuSign, Inc.1 242,000 67,656RingCentral, Inc., Class A1 221,100 64,247Shopify, Inc., Class A, subordinate voting shares1 41,500 60,631Intel Corp. 1,075,000 60,350Concentrix Corp.1 367,827 59,147NVIDIA Corp. 68,566 54,860Okta, Inc., Class A1 174,680 42,741Apple, Inc. 150,000 20,544
5,065,489
Financials11.77%
Chubb, Ltd. 2,200,000 349,668First Republic Bank 1,580,000 295,729Capital One Financial Corp. 1,750,000 270,707Synchrony Financial 4,750,000 230,470The Blackstone Group, Inc. 2,295,950 223,029Bank of America Corp. 5,250,000 216,457CME Group, Inc., Class A 977,200 207,831JPMorgan Chase & Co. 1,335,000 207,646Apollo Global Management, Inc., Class A 2,769,732 172,277Sberbank of Russia PJSC (ADR) 9,788,000 162,530Nasdaq, Inc. 844,100 148,393Toronto-Dominion Bank (CAD denominated) 1,996,383 139,905Arch Capital Group, Ltd.1 3,234,000 125,932Intercontinental Exchange, Inc. 1,055,000 125,228MSCI, Inc. 225,200 120,050KKR & Co., Inc. 1,968,000 116,584Western Alliance Bancorporation 1,182,849 109,827Citigroup, Inc. 1,500,000 106,125PNC Financial Services Group, Inc. 500,000 95,380Ares Management Corp., Class A 1,015,403 64,569Brookfield Asset Management, Inc., Class A 1,260,000 64,235RenaissanceRe Holdings, Ltd. 357,000 53,129BlackRock, Inc. 56,000 48,998S&P Global, Inc. 102,000 41,866Bright Health Group, Inc.1,2 1,974,816 33,888SLM Corp. 1,579,600 33,077Berkshire Hathaway, Inc., Class A1 61 25,535Progressive Corp. 105,000 10,312The Bank of N.T. Butterfield & Son, Ltd. 156,723 5,556Jonah Energy Parent LLC1,3,4 32,117 482
3,805,415
Health care8.81%
Johnson & Johnson 3,150,000 518,931UnitedHealth Group, Inc. 1,235,800 494,864Humana Inc. 865,000 382,953Cigna Corp. 1,100,000 260,777Abbott Laboratories 2,000,000 231,860CVS Health Corp. 1,478,000 123,324Vertex Pharmaceuticals, Inc.1 567,500 114,425
Asset Allocation FundInvestment portfolio June 30, 2021 unaudited

American Funds Insurance Series 105
Common stocks (continued) SharesValue(000)
Health care(continued)
Gilead Sciences, Inc. 1,600,000 $ 110,176Regeneron Pharmaceuticals, Inc.1 150,000 83,781Daiichi Sankyo Company, Ltd. 3,873,900 83,497Eli Lilly and Company 335,969 77,112Cortexyme, Inc.1,2 1,218,038 64,556IDEXX Laboratories, Inc.1 94,102 59,430Thermo Fisher Scientific, Inc. 116,000 58,519AbCellera Biologics, Inc.1 1,720,641 37,854AbCellera Biologics, Inc.1,2 625,100 13,752Centene Corp.1 562,770 41,043Allakos, Inc.1 293,700 25,073Ultragenyx Pharmaceutical, Inc.1 217,400 20,729Rotech Healthcare, Inc.1,3,4,5 184,138 19,795Viatris, Inc. 1,121,937 16,032NuCana PLC (ADR)1,6 2,977,153 8,247Pfizer, Inc. 102,973 4,032
2,850,762
Consumerdiscretionary8.23%
Amazon.com, Inc.1 129,174 444,379Home Depot, Inc. 1,246,000 397,337Aramark 8,500,000 316,625General Motors Company1 3,750,000 221,887LVMHMoët Hennessy-Louis Vuitton SE 256,896 201,442Kontoor Brands, Inc.6 3,000,000 169,230HiltonWorldwide Holdings, Inc.1 1,256,949 151,613NVR, Inc.1 25,000 124,333Darden Restaurants, Inc. 769,109 112,282Dollar General Corp. 487,187 105,422Royal Caribbean Cruises, Ltd.1 1,014,324 86,502Caesars Entertainment, Inc.1 828,892 85,998VF Corp. 750,000 61,530Booking Holdings, Inc.1 25,500 55,796Chipotle Mexican Grill, Inc.1 27,500 42,634Restaurant Brands International, Inc. 595,000 38,342Xpeng, Inc., Class A (ADR)1 703,800 31,263Dr. Martens PLC1 2,375,000 14,620
2,661,235
Communicationservices6.15%
Charter Communications, Inc., Class A1 785,000 566,338Alphabet, Inc., Class C1 157,000 393,492Facebook, Inc., Class A1 1,129,100 392,599Comcast Corp., Class A 6,262,910 357,111Netflix, Inc.1 226,700 119,745Tencent Holdings, Ltd. 965,000 72,584New York Times Co., Class A 1,450,000 63,148Activision Blizzard, Inc. 265,000 25,292
1,990,309
Consumer staples6.02%
Philip Morris International, Inc. 9,880,421 979,249Nestlé SA 2,500,000 311,321Altria Group, Inc. 4,422,060 210,844British American Tobacco PLC (ADR) 3,919,700 154,084British American Tobacco PLC 1,060,000 41,056Archer Daniels Midland Company 2,000,000 121,200Mondelez International, Inc. 1,200,000 74,928Avenue Supermarts, Ltd.1 970,539 43,664CostcoWholesale Corp. 26,000 10,287
1,946,633
Asset Allocation Fund (continued)

106 American Funds Insurance Series
Common stocks (continued) SharesValue(000)
Materials4.59%
LyondellBasell Industries NV 3,417,103 $ 351,517Dow Inc. 4,800,000 303,744Vale SA, ordinary nominative shares 9,325,400 212,333Franco-Nevada Corp. 889,870 129,137Rio Tinto PLC 1,250,000 102,866Royal Gold, Inc. 845,000 96,414Nucor Corp. 1,000,000 95,930First QuantumMinerals, Ltd. 2,775,000 63,957Allegheny Technologies, Inc.1 2,589,437 53,990Newmont Corp. 700,000 44,366Wheaton Precious Metals Corp. 480,000 21,154Sherwin-Williams Company 37,000 10,081
1,485,489
Industrials3.49%
Northrop Grumman Corp. 768,400 279,260CSX Corp. 6,705,369 215,108Lockheed Martin Corp. 486,000 183,878L3Harris Technologies, Inc. 803,000 173,568TuSimple Holdings, Inc., Class A1,2 1,500,000 106,860Boeing Company1 183,000 43,840Waste Management, Inc. 249,000 34,887Honeywell International, Inc. 152,000 33,341Cintas Corp. 41,000 15,662New AMI I, LLC1,3,4 1,588,250 13,818Chart Industries, Inc.1 68,000 9,950Copart, Inc.1 75,000 9,887Axon Enterprise, Inc.1 50,600 8,946
1,129,005
Energy2.45%
Chevron Corp. 2,000,000 209,480Canadian Natural Resources, Ltd. (CAD denominated) 4,315,000 156,643Pioneer Natural Resources Company 927,000 150,656EOG Resources, Inc. 1,352,400 112,844Suncor Energy, Inc. 4,000,000 95,805ConocoPhillips 362,500 22,076Chesapeake Energy Corp. 330,437 17,157Chesapeake Energy Corp.3,7 1,970 98Scorpio Tankers, Inc. 345,000 7,607Euronav NV 750,000 6,990Oasis Petroleum, Inc. 48,721 4,899Extraction Oil & Gas, Inc.1 42,743 2,347Extraction Oil & Gas, Inc.1,3,5,7 22,469 1,184Weatherford International1 144,755 2,635Diamond Offshore Drilling, Inc.1 247,104 1,569Diamond Offshore Drilling, Inc.1,3,4,7 86,354 461McDermott International, Ltd.1 40,219 20
792,471
Real estate1.87%
VICI Properties, Inc. REIT 5,165,000 160,218Crown Castle International Corp. REIT 526,000 102,623MGMGrowth Properties LLC REIT, Class A 2,660,000 97,409American Tower Corp. REIT 328,100 88,633Alexandria Real Estate Equities, Inc. REIT 399,000 72,594PotlatchDeltic Corp. REIT 1,000,000 53,150STORE Capital Corp. REIT 534,137 18,433Equinix, Inc. REIT 13,000 10,434
603,494
Asset Allocation Fund (continued)

American Funds Insurance Series 107
Common stocks (continued) SharesValue(000)
Utilities0.69%
Enel SpA 24,000,000 $ 222,883
Total common stocks (cost: $12,611,364,000) 22,553,185
Preferred securities 0.00%
Industrials0.00%
ACR III LSC Holdings LLC, Series B, preferred shares1,3,4,7 450 317
Total preferred securities (cost: $466,000) 317
Rights & warrants 0.00%
Energy0.00%
Chesapeake Energy Corp., Class B, warrants, expire 20261 16,601 395Sable Permian Resources, LLC, Class A, warrants, expire 20241,3,4 4,392 —8
Total rights & warrants (cost: $723,000) 395
Convertible stocks 0.49%
Informationtechnology0.28%
Broadcom, Inc., Series A, cumulative convertible preferred shares, 8.00% 2022 60,000 91,192
Financials0.15%
2020 Cash Mandatory Exchangeable Trust, convertible preferred shares, 0% 20237 37,778 47,698
Health care0.06%
Danaher Corp., Series B, cumulative convertible preferred shares, 5.00% 20232 13,300 19,621
Total convertible stocks (cost: $109,241,000) 158,511
Investment funds 5.20%
Capital Group Central Corporate Bond Fund6 166,290,561 1,681,198
Total investment funds (cost: $1,677,900,000) 1,681,198
Bonds, notes & other debt instruments 21.02%Principal amount
(000)
U.S. Treasury bonds & notes 7.15%
U.S. Treasury5.54%
U.S. Treasury 1.50% 2021 $ 3,777 3,786U.S. Treasury 1.625% 2021 98 99U.S. Treasury 1.75% 2021 425 428U.S. Treasury 2.75% 2021 19,232 19,339U.S. Treasury 0.125% 2022 83,545 83,573U.S. Treasury 0.125% 2022 10,000 10,003U.S. Treasury 1.375% 2022 5,000 5,039U.S. Treasury 1.375% 2022 280 285U.S. Treasury 1.50% 2022 9,407 9,564U.S. Treasury 1.625% 2022 94 96U.S. Treasury 1.875% 2022 80,000 80,963U.S. Treasury 2.125% 2022 37,000 38,083U.S. Treasury 0.125% 2023 44,825 44,776U.S. Treasury 0.25% 2023 30,000 30,007U.S. Treasury 2.25% 2023 5,000 5,236U.S. Treasury 2.375% 2023 5,000 5,173U.S. Treasury 2.75% 2023 15,000 15,693U.S. Treasury 0.25% 2024 15,000 14,940U.S. Treasury 1.50% 2024 22,500 23,218
Asset Allocation Fund (continued)

108 American Funds Insurance Series
Bonds, notes & other debt instruments (continued)Principal amount
(000)Value(000)
U.S. Treasury bonds & notes (continued)
U.S. Treasury(continued)
U.S. Treasury 1.50% 2024 $ 907 $ 936U.S. Treasury 2.125% 2024 5,000 5,235U.S. Treasury 2.25% 2024 5,000 5,242U.S. Treasury 2.375% 2024 70,000 74,114U.S. Treasury 2.50% 2024 225,000 237,378U.S. Treasury 2.50% 2024 700 742U.S. Treasury 0.25% 2025 43,812 43,080U.S. Treasury 2.50% 2025 3,500 3,738U.S. Treasury 2.75% 2025 3,229 3,493U.S. Treasury 3.00% 2025 10,000 10,957U.S. Treasury 0.375% 2026 75,000 73,506U.S. Treasury 0.50% 2026 109,869 108,216U.S. Treasury 0.75% 2026 155,473 154,692U.S. Treasury 1.50% 2026 500 515U.S. Treasury 1.625% 2026 60,000 62,137U.S. Treasury 1.625% 2026 27,000 27,963U.S. Treasury 1.625% 2026 7,000 7,257U.S. Treasury 1.625% 2026 1,500 1,555U.S. Treasury 0.50% 2027 36,300 35,114U.S. Treasury 0.50% 2027 20,000 19,362U.S. Treasury 0.625% 2027 7,109 6,873U.S. Treasury 1.125% 2027 762 768U.S. Treasury 2.25% 2027 78,250 83,638U.S. Treasury 2.375% 2027 880 947U.S. Treasury 2.875% 2028 5,217 5,796U.S. Treasury 0.625% 2030 20,225 18,902U.S. Treasury 0.875% 2030 6,640 6,314U.S. Treasury 1.50% 2030 36,651 37,011U.S. Treasury 1.625% 2031 43,766 44,447U.S. Treasury 1.125% 2040 62,775 54,148U.S. Treasury 1.375% 2040 52,695 47,285U.S. Treasury 2.50% 2046 3,755 4,062U.S. Treasury 3.00% 2047 9,355 11,103U.S. Treasury 3.00% 2048 336 400U.S. Treasury 2.25% 2049 15,000 15,510U.S. Treasury 2.375% 20499 75,000 79,708U.S. Treasury 1.375% 20509 12,500 10,514U.S. Treasury 2.00% 2050 13,825 13,555U.S. Treasury 1.875% 20519 90,207 85,914
1,792,428
U.S. Treasuryinflation-protectedsecurities1.61%
U.S. Treasury Inflation-Protected Security 0.125% 202410 88,451 95,404U.S. Treasury Inflation-Protected Security 0.625% 202410 89,695 96,628U.S. Treasury Inflation-Protected Security 0.125% 202510 24,052 26,195U.S. Treasury Inflation-Protected Security 0.125% 202510 23,773 25,678U.S. Treasury Inflation-Protected Security 0.125% 202610 23,975 26,106U.S. Treasury Inflation-Protected Security 0.75% 202810 18,613 21,362U.S. Treasury Inflation-Protected Security 0.875% 202910 20,983 24,287U.S. Treasury Inflation-Protected Security 0.125% 203010 24,083 26,456U.S. Treasury Inflation-Protected Security 0.125% 203110 24,255 26,707U.S. Treasury Inflation-Protected Security 1.00% 204910 105,122 140,951U.S. Treasury Inflation-Protected Security 0.25% 205010 4,332 4,890U.S. Treasury Inflation-Protected Security 0.125% 205110 6,153 6,745
521,409
Total U.S. Treasury bonds & notes 2,313,837
Asset Allocation Fund (continued)

American Funds Insurance Series 109
Bonds, notes & other debt instruments (continued)Principal amount
(000)Value(000)
Corporate bonds, notes & loans 7.00%
Financials1.15%
ACE INA Holdings, Inc. 2.875% 2022 $ 3,880 $ 3,996ACE INA Holdings, Inc. 3.35% 2026 880 967ACE INA Holdings, Inc. 4.35% 2045 400 506Advisor Group Holdings, LLC 6.25% 20287 3,130 3,309AGMerger Sub II, Inc. 10.75% 20277 2,920 3,252Ally Financial, Inc. 8.00% 2031 3,000 4,225American International Group, Inc. 2.50% 2025 15,800 16,686American International Group, Inc. 4.20% 2028 565 651Bangkok Bank PCL 3.733% 2034
(5-year UST Yield Curve Rate T Note Constant Maturity + 1.90% on 9/25/2029)11 2,428 2,524Bank of America Corp. 3.55% 2024 (3-month USD-LIBOR + 0.78% on 3/5/2023)11 6,000 6,305Bank of America Corp. 1.197% 2026 (USD-SOFR + 1.01% on 10/24/2025)11 2,500 2,479Bank of America Corp. 3.419% 2028 (3-month USD-LIBOR + 1.04% on 12/20/2027)11 2,345 2,556Bank of America Corp. 1.898% 2031 (USD-SOFR + 1.53% on 7/23/2030)11 16,000 15,569Bank of America Corp. 1.922% 2031 (USD-SOFR + 1.37% on 10/24/2030)11 3,700 3,610Bank of Nova Scotia 1.625% 2023 5,000 5,112BB&T Corp. 2.625% 2022 2,500 2,528Berkshire Hathaway Finance Corp. 4.20% 2048 6,570 8,132Berkshire Hathaway Finance Corp. 4.25% 2049 550 685Berkshire Hathaway, Inc. 2.75% 2023 1,615 1,676Berkshire Hathaway, Inc. 3.125% 2026 500 547BNP Paribas 3.375% 20257 3,225 3,462Citigroup, Inc. 2.976% 2030 (USD-SOFR + 1.422% on 11/5/2029)11 3,254 3,451CME Group, Inc. 3.75% 2028 3,425 3,908Commonwealth Bank of Australia 3.35% 2024 1,225 1,322Commonwealth Bank of Australia 3.35% 20247 1,000 1,079Commonwealth Bank of Australia 2.688% 20317 7,575 7,581Compass Diversified Holdings 5.25% 20297 640 666Crédit Agricole SA 4.375% 20257 850 936Credit Suisse Group AG 3.80% 2023 1,625 1,723Credit Suisse Group AG 3.869% 2029
(3-month USD-LIBOR + 1.41% on 1/12/2028)7,11 800 882Danske Bank AS 2.70% 20227 1,000 1,016FS Energy and Power Fund 7.50% 20237 2,995 3,102Goldman Sachs Group, Inc. 1.093% 2026 (USD-SOFR + 0.789% on 12/9/2025)11 3,425 3,373Goldman Sachs Group, Inc. 3.814% 2029
(3-month USD-LIBOR + 1.158% on 4/23/2028)11 390 437Goldman Sachs Group, Inc. 2.615% 2032 (USD-SOFR + 1.281% on 4/22/2031)11 4,036 4,126Goldman Sachs Group, Inc. 3.21% 2042 (USD-SOFR + 1.513% on 4/22/2041)11 2,000 2,095Groupe BPCE SA 2.75% 20237 600 622Groupe BPCE SA 5.70% 20237 2,250 2,492Groupe BPCE SA 5.15% 20247 3,710 4,135Groupe BPCE SA 1.00% 20267 6,100 6,020Groupe BPCE SA 2.277% 2032 (USD-SOFR + 1.312% on 1/20/2031)7,11 2,250 2,210HSBC Holdings PLC 3.262% 2023 (3-month USD-LIBOR + 1.055% on 3/13/2022)11 1,500 1,530HSBC Holdings PLC 4.25% 2024 3,000 3,251HSBC Holdings PLC 2.633% 2025 (3-month USD-LIBOR + 1.14% on 11/7/2024)11 625 656HSBC Holdings PLC 2.099% 2026 (USD-SOFR + 1.929% on 6/4/2025)11 6,000 6,170HSBC Holdings PLC 4.583% 2029 (3-month USD-LIBOR + 1.535% on 6/19/2028)11 3,750 4,337HSBC Holdings PLC 3.973% 2030 (3-month USD-LIBOR + 1.61% on 5/22/2029)11 1,500 1,680Icahn Enterprises Finance Corp. 5.25% 2027 1,185 1,225Icahn Enterprises Finance Corp. 4.375% 20297 2,200 2,196Intercontinental Exchange, Inc. 2.65% 2040 7,425 7,142Intesa Sanpaolo SpA 3.375% 20237 750 781Intesa Sanpaolo SpA 3.25% 20247 750 798Intesa Sanpaolo SpA 5.017% 20247 1,730 1,883Intesa Sanpaolo SpA 3.875% 20277 300 326JPMorgan Chase & Co. 3.559% 2024 (3-month USD-LIBOR + 0.73% on 4/23/2023)11 4,725 4,983JPMorgan Chase & Co. 2.58% 2032 (USD-SOFR + 1.25% on 4/22/2031)11 3,101 3,185JPMorgan Chase & Co. 3.157% 2042 (USD-SOFR + 1.46% on 4/22/2041)11 10,325 10,759JPMorgan Chase & Co. 3.328% 2052 (USD-SOFR + 1.58% on 4/22/2051)11 10,325 11,041
Asset Allocation Fund (continued)

110 American Funds Insurance Series
Bonds, notes & other debt instruments (continued)Principal amount
(000)Value(000)
Corporate bonds, notes & loans (continued)
Financials(continued)
Kasikornbank PC HK 3.343% 2031(5-year UST Yield Curve Rate T Note Constant Maturity + 1.70% on 10/2/2026)11 $ 1,222 $ 1,253
Ladder Capital Corp. 5.25% 20227 475 479Ladder Capital Corp. 4.25% 20277 3,757 3,764Lloyds Banking Group PLC 2.907% 2023
(3-month USD-LIBOR + 0.81% on 11/7/2022)11 750 774Lloyds Banking Group PLC 4.05% 2023 2,000 2,145Lloyds Banking Group PLC 1.627% 2027
(1-year UST Yield Curve Rate T Note Constant Maturity + 0.85% on 5/11/2026)11 800 801Lloyds Banking Group PLC 4.375% 2028 2,150 2,472LPL Financial Holdings, Inc. 4.625% 20277 2,200 2,286LPL Financial Holdings, Inc. 4.375% 20317 1,380 1,399Marsh & McLennan Companies, Inc. 3.875% 2024 820 890Marsh & McLennan Companies, Inc. 4.375% 2029 1,705 2,000Marsh & McLennan Companies, Inc. 4.90% 2049 1,539 2,105Metropolitan Life Global Funding I 1.95% 20217 1,250 1,255MGIC Investment Corp. 5.25% 2028 1,175 1,247Mitsubishi UFJ Financial Group, Inc. 2.801% 2024 1,610 1,706Morgan Stanley 3.737% 2024 (3-month USD-LIBOR + 0.847% on 4/24/2023)11 300 317Morgan Stanley 0.985% 2026 (USD-SOFR + 0.72% on 12/10/2025)11 3,766 3,709Morgan Stanley 3.125% 2026 325 352Morgan Stanley 1.593% 2027 (USD-SOFR + 0.879% on 5/4/2026)11 3,290 3,315Morgan Stanley 2.699% 2031 (USD-SOFR + 1.143% on 1/22/2030)11 2,000 2,095Morgan Stanley 3.217% 2042 (USD-SOFR + 1.485% on 4/22/2041)11 856 908MSCI, Inc. 3.625% 20317 2,225 2,285Navient Corp. 6.50% 2022 2,550 2,662Navient Corp. 5.50% 2023 10,165 10,734Navient Corp. 7.25% 2023 725 802Navient Corp. 5.875% 2024 1,005 1,087Navient Corp. 6.125% 2024 8,030 8,691New York Life Global Funding 1.70% 20217 750 752New York Life Global Funding 2.35% 20267 590 619Owl Rock Capital Corp. 4.625% 20247 2,305 2,451Owl Rock Capital Corp. 3.75% 2025 2,874 3,042Owl Rock Capital Corp. 4.00% 2025 102 109Owl Rock Capital Corp. 3.375% 2026 1,290 1,346PNC Bank 2.55% 2021 4,000 4,034PNC Financial Services Group, Inc. 2.854% 202211 1,445 1,495PNC Financial Services Group, Inc. 3.90% 2024 2,000 2,173Power Financial Corp., Ltd. 5.25% 2028 383 430Power Financial Corp., Ltd. 6.15% 2028 350 415Power Financial Corp., Ltd. 4.50% 2029 554 595Power Financial Corp., Ltd. 3.95% 2030 1,213 1,253Prudential Financial, Inc. 4.35% 2050 7,000 8,798Quicken Loans, LLC 3.625% 20297 1,505 1,489Rabobank Nederland 2.75% 2022 2,250 2,281Rabobank Nederland 4.375% 2025 4,500 5,028Royal Bank of Canada 1.15% 2025 4,711 4,739Skandinaviska Enskilda Banken AB 1.875% 2021 1,675 1,681Skandinaviska Enskilda Banken AB 2.80% 2022 700 712Springleaf Finance Corp. 6.125% 2024 4,550 4,903Starwood Property Trust, Inc. 5.00% 2021 6,625 6,666Starwood Property Trust, Inc. 5.50% 20237 1,160 1,217Swiss Re Finance (Luxembourg) SA 5.00% 2049
(5-year UST Yield Curve Rate T Note Constant Maturity + 3.582% on 4/2/2029)7,11 2,800 3,194Toronto-Dominion Bank 2.65% 2024 625 662Toronto-Dominion Bank 0.75% 2025 5,375 5,328Travelers Companies, Inc. 4.00% 2047 860 1,048U.S. Bancorp 2.625% 2022 1,805 1,826U.S. Bancorp 2.375% 2026 4,000 4,236UBS Group AG 4.125% 20257 2,750 3,070
Asset Allocation Fund (continued)

American Funds Insurance Series 111
Bonds, notes & other debt instruments (continued)Principal amount
(000)Value(000)
Corporate bonds, notes & loans (continued)
Financials(continued)
UniCredit SpA 3.75% 20227 $ 5,725 $ 5,864UniCredit SpA 6.572% 20227 475 490UniCredit SpA 4.625% 20277 625 702Wells Fargo & Company 2.164% 2026
(3-month USD-LIBOR + 0.75% on 2/11/2025)11 8,000 8,308Wells Fargo & Company 2.879% 2030
(3-month USD-LIBOR + 1.17% on 10/30/2029)11 729 773Westpac Banking Corp. 2.75% 2023 1,750 1,816Westpac Banking Corp. 2.894% 2030
(5-year UST Yield Curve Rate T Note Constant Maturity + 1.35% on 2/4/2025)11 8,500 8,827Westpac Banking Corp. 2.668% 2035
(5-year UST Yield Curve Rate T Note Constant Maturity + 1.75% on 11/15/2030)11 3,325 3,275Westpac Banking Corp. 2.963% 2040 1,500 1,477
370,553
Energy1.03%
Antero Midstream Partners LP 5.375% 20297 1,295 1,352Antero Resources Corp. 7.625% 20297 430 478Apache Corp. 4.875% 2027 2,150 2,331Apache Corp. 4.375% 2028 2,580 2,750Ascent Resources - Utica LLC 5.875% 20297 1,040 1,041BP Capital Markets America, Inc. 2.772% 2050 7,025 6,520Canadian Natural Resources, Ltd. 2.95% 2023 1,935 2,005Canadian Natural Resources, Ltd. 2.05% 2025 961 988Canadian Natural Resources, Ltd. 2.95% 2030 7,142 7,412Canadian Natural Resources, Ltd. 4.95% 2047 1,559 1,942Cenovus Energy, Inc. 3.80% 2023 3,970 4,191Cenovus Energy, Inc. 4.25% 2027 5,690 6,364Cheniere Energy Partners LP 5.625% 2026 2,475 2,574Cheniere Energy Partners LP 4.50% 2029 1,085 1,168Cheniere Energy Partners LP 4.00% 20317 4,485 4,692Cheniere Energy, Inc. 4.625% 20287 5,645 5,963Chesapeake Energy Corp. 4.875% 202212 7,225 208Chesapeake Energy Corp. 5.50% 20267 685 725Chesapeake Energy Corp. 5.875% 20297 590 639Chevron Corp. 1.995% 2027 2,631 2,717Chevron USA, Inc. 1.018% 2027 2,850 2,777CNX Resources Corp. 7.25% 20277 1,725 1,851CNX Resources Corp. 6.00% 20297 425 460Comstock Resources, Inc. 5.875% 20307 450 460ConocoPhillips 4.30% 20287 5,355 6,221Constellation Oil Services Holding SA 10.00% 2024 (100% PIK)7,12,13 1,084 309Continental Resources, Inc. 5.75% 20317 1,430 1,714Diamond Foreign Asset Co. / Diamond Finance LLC 9.00% 20273,4,7,13,14 204 204Diamond Foreign Asset Co. / Diamond Finance LLC 9.00% 20273,4,13,14 185 185Diamondback Energy, Inc. 4.40% 2051 5,023 5,671DTMidstream, Inc. 4.375% 20317 1,680 1,719Enbridge Energy Partners LP 5.875% 2025 3,200 3,779Enbridge Energy Partners LP, Series B, 7.50% 2038 2,000 2,971Enbridge, Inc. 4.00% 2023 1,678 1,792Enbridge, Inc. 2.50% 2025 1,700 1,783Enbridge, Inc. 3.70% 2027 162 179Energy Transfer Operating LP 5.00% 2050 17,377 20,123Energy Transfer Partners LP 4.50% 2024 1,210 1,318Energy Transfer Partners LP 4.75% 2026 2,494 2,810Energy Transfer Partners LP 5.25% 2029 757 895Energy Transfer Partners LP 6.00% 2048 774 980Energy Transfer Partners LP 6.25% 2049 757 995Enterprise Products Operating LLC 4.90% 2046 500 620EQMMidstream Partners LP 4.125% 2026 686 704
Asset Allocation Fund (continued)

112 American Funds Insurance Series
Bonds, notes & other debt instruments (continued)Principal amount
(000)Value(000)
Corporate bonds, notes & loans (continued)
Energy(continued)
EQMMidstream Partners LP 6.50% 20277 $ 2,690 $ 3,007EQMMidstream Partners LP 5.50% 2028 2,588 2,802EQMMidstream Partners LP 4.75% 20317 1,635 1,687EQT Corp. 7.625% 2025 (7.375% on 2/1/2025)11 1,295 1,512EQT Corp. 3.90% 2027 450 483EQT Corp. 5.00% 2029 340 380EQT Corp. 8.50% 2030 (8.25% on 8/1/2021)11 1,110 1,448EQT Corp. 3.625% 20317 400 418Equinor ASA 3.00% 2027 4,000 4,350Equinor ASA 3.625% 2028 3,685 4,145Exxon Mobil Corp. 2.019% 2024 643 669Exxon Mobil Corp. 2.44% 2029 1,963 2,058Genesis Energy LP 5.625% 2024 575 579Genesis Energy LP 6.50% 2025 3,572 3,615Genesis Energy LP 8.00% 2027 595 626Halliburton Company 3.80% 2025 16 18Harvest Midstream I LP 7.50% 20287 850 925Hess Midstream Partners LP 5.125% 20287 2,155 2,263Hilcorp Energy I LP 5.75% 20257 2,575 2,623Hilcorp Energy I LP 6.00% 20317 460 488Indigo Natural Resources LLC 5.375% 20297 1,355 1,418Kinder Morgan, Inc. 3.60% 2051 5,000 5,105Marathon Oil Corp. 4.40% 2027 1,005 1,139MPLX LP 4.125% 2027 500 559MPLX LP 2.65% 2030 4,273 4,317MPLX LP 4.50% 2038 750 862MPLX LP 4.70% 2048 2,500 2,912MPLX LP 5.50% 2049 4,491 5,826NGL Energy Operating LLC 7.50% 20267 5,990 6,297NGL Energy Partners LP 6.125% 2025 4,907 4,463Oasis Midstream Partners LP / OMP Finance Corp. 8.00% 20297 4,265 4,546Oasis Petroleum, Inc. 6.375% 20267 765 799ONEOK, Inc. 5.85% 2026 7,997 9,463ONEOK, Inc. 5.20% 2048 2,500 3,069Peabody Energy Corp. 8.50% 2024 (29.41% PIK)7,13 986 746Petrobras Global Finance Co. 6.75% 2050 2,240 2,622Petróleos Mexicanos 6.875% 20257 3,755 4,161Petróleos Mexicanos 5.35% 2028 1,870 1,841Phillips 66 2.15% 2030 1,181 1,163Phillips 66 Partners LP 3.55% 2026 160 174Phillips 66 Partners LP 4.68% 2045 400 459Phillips 66 Partners LP 4.90% 2046 275 329Pioneer Natural Resources Company 1.125% 2026 1,053 1,043Pioneer Natural Resources Company 2.15% 2031 2,862 2,808Plains All American Pipeline LP 3.80% 2030 113 121Range Resources Corp. 4.875% 2025 565 585Range Resources Corp. 8.25% 20297 520 587Rattler Midstream Partners LP 5.625% 20257 355 374Rockies Express Pipeline LLC 4.95% 20297 2,689 2,777SA Global Sukuk, Ltd. 1.602% 20267 10,915 10,919SA Global Sukuk, Ltd. 2.694% 20317 4,825 4,891Sabine Pass Liquefaction, LLC 5.875% 2026 610 722Sabine Pass Liquefaction, LLC 4.20% 2028 870 983Sabine Pass Liquefaction, LLC 4.50% 2030 7,339 8,478Schlumberger BV 3.75% 20247 495 533Schlumberger BV 4.00% 20257 70 78Southwestern Energy Co. 6.45% 202511 1,760 1,952Southwestern Energy Co. 7.50% 2026 1,685 1,786Southwestern Energy Co. 7.75% 2027 450 489Southwestern Energy Co. 8.375% 2028 395 447Statoil ASA 2.75% 2021 1,925 1,942
Asset Allocation Fund (continued)

American Funds Insurance Series 113
Bonds, notes & other debt instruments (continued)Principal amount
(000)Value(000)
Corporate bonds, notes & loans (continued)
Energy(continued)
Statoil ASA 3.25% 2024 $2,850 $ 3,088Statoil ASA 4.25% 2041 2,000 2,447Suncor Energy, Inc. 3.10% 2025 3,687 3,943Suncor Energy, Inc. 3.75% 2051 184 199Sunoco Logistics Operating Partners LP 5.40% 2047 650 772Sunoco LP 4.50% 20297 1,050 1,072Tallgrass Energy Partners LP 7.50% 20257 550 604Targa Resources Partners LP 5.875% 2026 1,350 1,422Targa Resources Partners LP 5.50% 2030 2,260 2,488Targa Resources Partners LP 4.875% 20317 1,065 1,154Targa Resources Partners LP 4.00% 20327 1,750 1,802Teekay Corp. 9.25% 20227 4,825 4,991Teekay Offshore Partners LP 8.50% 20237 3,550 3,265Total SE 2.986% 2041 9,544 9,737TransCanada PipeLines, Ltd. 4.25% 2028 1,090 1,253TransCanada PipeLines, Ltd. 4.10% 2030 4,298 4,943TransCanada PipeLines, Ltd. 4.75% 2038 3,000 3,611TransCanada PipeLines, Ltd. 4.875% 2048 700 887Valero Energy Corp. 4.00% 2029 4,000 4,471Weatherford International PLC 8.75% 20247 3,571 3,740Weatherford International PLC 11.00% 20247 9,918 10,327Western Gas Partners LP 4.50% 2028 4,468 4,787Western MidstreamOperating LP 5.30% 203011 1,300 1,460Williams Companies, Inc. 3.50% 2030 6,730 7,356Williams Partners LP 4.30% 2024 85 92
334,372
Health care0.78%
Abbott Laboratories 3.75% 2026 1,811 2,046AbbVie, Inc. 2.60% 2024 3,000 3,165AbbVie, Inc. 3.80% 2025 206 226AbbVie, Inc. 2.95% 2026 1,445 1,554AmerisourceBergen Corp. 0.737% 2023 2,918 2,924Amgen, Inc. 2.20% 2027 2,429 2,524Anthem, Inc. 2.375% 2025 818 857AstraZeneca Finance LLC 1.20% 2026 3,786 3,778AstraZeneca Finance LLC 1.75% 2028 1,871 1,872AstraZeneca Finance LLC 2.25% 2031 146 148AstraZeneca PLC 3.375% 2025 8,140 8,914AstraZeneca PLC 3.00% 2051 573 594Bausch Health Companies, Inc. 5.00% 20287 1,735 1,649Bausch Health Companies, Inc. 5.25% 20317 1,610 1,507Bayer US Finance II LLC 3.875% 20237 1,685 1,805Becton, Dickinson and Company 2.894% 2022 508 519Becton, Dickinson and Company 3.363% 2024 435 466Becton, Dickinson and Company 3.70% 2027 7,000 7,782Boston Scientific Corp. 3.45% 2024 715 764Boston Scientific Corp. 1.90% 2025 5,856 6,046Boston Scientific Corp. 3.85% 2025 1,780 1,968Boston Scientific Corp. 3.75% 2026 645 716Boston Scientific Corp. 4.00% 2029 1,550 1,765Centene Corp. 4.25% 2027 565 596Centene Corp. 2.45% 2028 2,325 2,359Centene Corp. 4.625% 2029 4,785 5,268Centene Corp. 3.00% 2030 5,865 6,032Cigna Corp. 3.75% 2023 353 376Cigna Corp. 4.80% 2038 3,880 4,838CVS Health Corp. 4.30% 2028 588 676DaVita, Inc. 4.625% 20307 1,025 1,055Eli Lilly and Company 3.375% 2029 3,330 3,744
Asset Allocation Fund (continued)

114 American Funds Insurance Series
Bonds, notes & other debt instruments (continued)Principal amount
(000)Value(000)
Corporate bonds, notes & loans (continued)
Health care(continued)
Encompass Health Corp. 4.50% 2028 $ 1,449 $ 1,505Endo DAC / Endo Finance LLC / Endo Finco 9.50% 20277 5,517 5,634Endo International PLC 5.75% 20227 7,340 6,780Endo Luxembourg Finance Co. I SARL / Endo U.S., Inc. 6.125% 20297 1,560 1,531GlaxoSmithKline PLC 3.625% 2025 3,585 3,961HCA, Inc. 5.375% 2025 515 582HCA, Inc. 3.50% 2030 2,650 2,825HealthSouth Corp. 5.75% 2025 2,685 2,768Jazz Securities DAC 4.375% 20297 975 1,012Mallinckrodt PLC 10.00% 20257 2,500 2,797Medtronic, Inc. 3.50% 2025 467 513Molina Healthcare, Inc. 5.375% 2022 6,985 7,330Molina Healthcare, Inc. 3.875% 20307 2,899 3,023Novant Health, Inc. 3.168% 2051 3,750 3,945Novartis Capital Corp. 1.75% 2025 1,250 1,289Novartis Capital Corp. 2.00% 2027 2,386 2,482Owens & Minor, Inc. 4.375% 2024 5,615 5,874Owens & Minor, Inc. 4.50% 20297 3,685 3,791Par Pharmaceutical, Inc. 7.50% 20277 8,028 8,218Pfizer, Inc. 2.95% 2024 825 878Pfizer, Inc. 3.45% 2029 8,000 9,008Rotech Healthcare, Inc., Term Loan,
(3-month USD-LIBOR + 11.00%) 13.00% 2023 (100% PIK)3,4,13,14,15 4,356 4,356Shire PLC 2.875% 2023 3,413 3,573Summa Health 3.511% 2051 1,655 1,752Tenet Healthcare Corp. 4.625% 2024 1,953 1,986Tenet Healthcare Corp. 4.875% 20267 16,225 16,849Tenet Healthcare Corp. 4.25% 20297 2,060 2,088Teva Pharmaceutical Finance Co. BV 2.80% 2023 3,914 3,905Teva Pharmaceutical Finance Co. BV 6.00% 2024 12,016 12,772Teva Pharmaceutical Finance Co. BV 7.125% 2025 1,935 2,136Teva Pharmaceutical Finance Co. BV 3.15% 2026 17,790 16,945Teva Pharmaceutical Finance Co. BV 4.10% 2046 4,420 3,879UnitedHealth Group, Inc. 1.15% 2026 2,610 2,612UnitedHealth Group, Inc. 2.30% 2031 2,286 2,343UnitedHealth Group, Inc. 3.05% 2041 3,875 4,063UnitedHealth Group, Inc. 3.25% 2051 2,504 2,676Valeant Pharmaceuticals International, Inc. 6.125% 20257 10,225 10,493Zimmer Holdings, Inc. 3.15% 2022 4,070 4,135
250,842
Industrials0.59%
Allison Transmission Holdings, Inc. 3.75% 20317 4,465 4,394Associated Materials, LLC 9.00% 20257 3,749 3,983Avis Budget Car Rental, LLC 5.75% 20277 2,025 2,115Avis Budget Group, Inc. 5.25% 20257 1,927 1,955Avis Budget Group, Inc. 5.375% 20297 1,750 1,825Avolon Holdings Funding, Ltd. 3.625% 20227 1,254 1,283Avolon Holdings Funding, Ltd. 3.95% 20247 1,587 1,693Avolon Holdings Funding, Ltd. 4.25% 20267 1,126 1,221Avolon Holdings Funding, Ltd. 4.375% 20267 1,975 2,149Boeing Company 4.875% 2025 1,555 1,743Boeing Company 2.75% 2026 13,000 13,589Boeing Company 3.10% 2026 251 266Boeing Company 3.25% 2028 7,700 8,172Boeing Company 5.15% 2030 1,100 1,304Boeing Company 3.625% 2031 3,450 3,714Boeing Company 3.60% 2034 6,250 6,601Boeing Company 3.50% 2039 250 251Boeing Company 3.75% 2050 1,300 1,343
Asset Allocation Fund (continued)

American Funds Insurance Series 115
Bonds, notes & other debt instruments (continued)Principal amount
(000)Value(000)
Corporate bonds, notes & loans (continued)
Industrials(continued)
Boeing Company 5.805% 2050 $1,100 $1,484Bombardier, Inc. 7.50% 20247 1,950 2,040Bombardier, Inc. 7.125% 20267 1,500 1,572Bombardier, Inc. 7.875% 20277 2,720 2,825Burlington Northern Santa Fe LLC 4.40% 2042 5,000 6,199BWX Technologies, Inc. 4.125% 20297 1,025 1,046Canadian National Railway Company 3.20% 2046 930 965Clarivate Science Holdings Corp. 3.875% 20287 590 596Clarivate Science Holdings Corp. 4.875% 20297 520 534CoreLogic, Inc. 4.50% 20287 4,125 4,094CSX Corp. 3.80% 2028 3,135 3,537CSX Corp. 4.25% 2029 1,062 1,235CSX Corp. 4.30% 2048 1,125 1,370CSX Corp. 2.50% 2051 4,125 3,756Dun & Bradstreet Corp. 6.875% 20267 1,067 1,135General Dynamics Corp. 3.375% 2023 1,000 1,055General Dynamics Corp. 3.50% 2025 329 361General Dynamics Corp. 2.25% 2031 1,287 1,322General Electric Capital Corp. 4.418% 2035 1,200 1,440General Electric Co. 3.45% 2027 1,800 1,980Honeywell International, Inc. 2.30% 2024 2,640 2,773Honeywell International, Inc. 1.35% 2025 5,947 6,060Honeywell International, Inc. 2.70% 2029 1,470 1,580Howmet Aerospace, Inc. 6.875% 2025 1,885 2,197Icahn Enterprises Finance Corp. 4.75% 2024 3,590 3,756L3Harris Technologies, Inc. 1.80% 2031 2,625 2,552LSC Communications, Inc. 8.75% 20233,4,7,12 4,063 216Masco Corp. 1.50% 2028 774 756Masco Corp. 2.00% 2031 497 486Masco Corp. 3.125% 2051 230 229MasTec, Inc. 4.50% 20287 1,425 1,503Meritor, Inc. 4.50% 20287 1,025 1,041Mueller Water Products, Inc. 4.00% 20297 430 442Nielsen Finance LLC and Nielsen Finance Co. 5.00% 20257 2,175 2,244Norfolk Southern Corp. 3.05% 2050 2,746 2,750Northrop Grumman Corp. 2.93% 2025 1,820 1,941Northrop Grumman Corp. 3.25% 2028 3,495 3,821Otis Worldwide Corp. 2.293% 2027 2,135 2,214Raytheon Technologies Corp. 2.80% 2022 1,500 1,524Rolls-Royce PLC 5.75% 20277 765 844Siemens AG 1.20% 20267 3,887 3,892Siemens AG 1.70% 20287 3,700 3,725SkyMiles IP, Ltd. 4.75% 20287 3,975 4,422The Brink’s Co. 4.625% 20277 2,385 2,490TransDigm, Inc. 6.25% 20267 4,976 5,256TransDigm, Inc. 5.50% 2027 1,100 1,148Triumph Group, Inc. 6.25% 20247 970 988Triumph Group, Inc. 8.875% 20247 1,045 1,164Triumph Group, Inc. 7.75% 20257 875 901Union Pacific Corp. 3.15% 2024 1,287 1,374Union Pacific Corp. 3.75% 2025 4,255 4,720Union Pacific Corp. 2.15% 2027 2,318 2,410Union Pacific Corp. 2.40% 2030 2,414 2,497Union Pacific Corp. 2.891% 20367 6,375 6,633Union Pacific Corp. 3.75% 2070 546 603Union Pacific Corp. 3.799% 20717 545 607United Airlines Holdings, Inc. 6.50% 20277 2,200 2,425United Rentals, Inc. 3.875% 2031 1,050 1,070United Technologies Corp. 3.65% 2023 52 55United Technologies Corp. 3.95% 2025 3,155 3,510United Technologies Corp. 4.125% 2028 1,075 1,238
Asset Allocation Fund (continued)

116 American Funds Insurance Series
Bonds, notes & other debt instruments (continued)Principal amount
(000)Value(000)
Corporate bonds, notes & loans (continued)
Industrials(continued)
Vertical U.S. Newco, Inc. 5.25% 20277 $2,000 $ 2,110Vinci SA 3.75% 20297 1,167 1,319WESCO Distribution, Inc. 7.125% 20257 1,210 1,309WESCO Distribution, Inc. 7.25% 20287 1,320 1,472
192,414
Communicationservices0.59%
Alphabet, Inc. 1.998% 2026 3,000 3,140Alphabet, Inc. 1.90% 2040 1,375 1,253Alphabet, Inc. 2.25% 2060 1,265 1,120AT&T, Inc. 2.25% 2032 1,000 983AT&T, Inc. 2.55% 20337 348 345CCO Holdings LLC and CCO Holdings Capital Corp. 4.908% 2025 500 567CCO Holdings LLC and CCO Holdings Capital Corp. 4.50% 20307 3,500 3,649CCO Holdings LLC and CCO Holdings Capital Corp. 4.75% 20307 2,500 2,647CCO Holdings LLC and CCO Holdings Capital Corp. 2.80% 2031 8,021 8,209CCO Holdings LLC and CCO Holdings Capital Corp. 4.25% 20317 2,975 3,035CCO Holdings LLC and CCO Holdings Capital Corp. 2.30% 2032 2,500 2,407CCO Holdings LLC and CCO Holdings Capital Corp. 4.50% 2032 2,710 2,818CCO Holdings LLC and CCO Holdings Capital Corp. 4.50% 20337 1,625 1,665CenturyLink, Inc. 6.75% 2023 2,500 2,776CenturyLink, Inc. 7.50% 2024 1,500 1,686CenturyLink, Inc. 5.125% 20267 800 833Comcast Corp. 2.35% 2027 4,000 4,199Comcast Corp. 3.20% 2036 375 403Comcast Corp. 3.90% 2038 250 288Comcast Corp. 4.60% 2038 2,000 2,483Comcast Corp. 2.80% 2051 791 762Deutsche Telekom International Finance BV 9.25% 2032 3,570 5,794Discovery Communications, Inc. 3.625% 2030 1,407 1,536Embarq Corp. 7.995% 2036 5,000 5,675Fox Corp. 4.03% 2024 1,120 1,214Frontier Communications Corp. 5.875% 20277 2,225 2,386Frontier Communications Corp. 5.00% 20287 5,550 5,745Frontier Communications Corp. 6.75% 20297 3,550 3,782iHeartCommunications, Inc. 5.25% 20277 3,093 3,240Intelsat Jackson Holding Co. 8.00% 20247 7,275 7,525Intelsat Jackson Holding Co. 8.50% 20247,12 7,650 4,541Intelsat Jackson Holding Co., Term Loan,
(3-month USD-LIBOR + 5.50%) 6.50% 202114,15 2,072 2,098Intelsat Jackson Holding Co., Term Loan, 6.625% 202415 1,400 1,429Liberty Global PLC 5.50% 20287 2,075 2,181Ligado Networks LLC 15.50% 2023 (100% PIK)7,13 2,397 2,367Live Nation Entertainment, Inc. 3.75% 20287 1,350 1,358MDC Partners, Inc. 7.50% 20247,11 3,225 3,269News Corp. 3.875% 20297 875 885Nexstar Broadcasting, Inc. 4.75% 20287 3,175 3,266SBA Tower Trust 1.631% 20267 8,707 8,718Scripps Escrow II, Inc. 3.875% 20297 1,100 1,093Sinclair Television Group, Inc. 4.125% 20307 1,175 1,156Sirius XM Radio, Inc. 4.625% 20247 3,345 3,441Sirius XM Radio, Inc. 4.00% 20287 2,150 2,217Sprint Corp. 7.625% 2026 4,125 5,043Sprint Corp. 6.875% 2028 7,550 9,692TEGNA, Inc. 4.75% 20267 2,350 2,506TEGNA, Inc. 5.00% 2029 1,000 1,049Tencent Holdings, Ltd. 3.68% 20417 1,320 1,418Tencent Holdings, Ltd. 3.84% 20517 1,780 1,922T-Mobile US, Inc. 1.50% 2026 500 505T-Mobile US, Inc. 2.05% 2028 325 331
Asset Allocation Fund (continued)

American Funds Insurance Series 117
Bonds, notes & other debt instruments (continued)Principal amount
(000)Value(000)
Corporate bonds, notes & loans (continued)
Communicationservices(continued)
T-Mobile US, Inc. 3.375% 20297 $ 2,200 $ 2,276T-Mobile US, Inc. 2.875% 2031 1,050 1,043Trilogy International South Pacific LLC / TISP Finance, Inc. 8.875% 20237 13,201 13,191Univision Communications, Inc. 6.625% 20277 4,800 5,207Univision Communications, Inc. 4.50% 20297 3,475 3,509Verizon Communications, Inc. 2.10% 2028 1,835 1,875Verizon Communications, Inc. 2.875% 2050 2,500 2,381Virgin Media O2 4.25% 20317 2,075 2,041Virgin Media Secured Finance PLC 4.50% 20307 3,115 3,142Vodafone Group PLC 4.375% 2028 350 407Vodafone Group PLC 5.25% 2048 500 660Vodafone Group PLC 4.25% 2050 4,350 5,090Ziggo Bond Co. BV 5.125% 20307 1,775 1,820Ziggo Bond Finance BV 5.50% 20277 4,277 4,455Ziggo Bond Finance BV 4.875% 20307 725 744
190,491
Utilities0.57%
AEP Transmission Co. LLC 3.75% 2047 2,390 2,724Ameren Corp. 2.50% 2024 969 1,020Ameren Corp. 4.50% 2049 425 548American Electric Power Company, Inc. 2.95% 2022 3,020 3,108Calpine Corp. 3.75% 20317 1,300 1,240CenterPoint Energy, Inc. 2.50% 2022 900 920CenterPoint Energy, Inc. 3.85% 2024 1,638 1,763CenterPoint Energy, Inc. 3.70% 2049 2,775 2,967Comisión Federal de Electricidad 4.75% 20277 645 722Commonwealth Edison Co. 4.35% 2045 1,085 1,354Commonwealth Edison Co. 4.00% 2048 2,600 3,132Consolidated Edison Company of New York, Inc. 4.50% 2058 5,380 6,529Consumers Energy Co. 4.05% 2048 3,017 3,674Dominion Resources, Inc. 2.00% 2021 665 665Dominion Resources, Inc. 2.75% 2022 800 809Dominion Resources, Inc. 2.85% 2026 750 799Dominion Resources, Inc., junior subordinated, 3.071% 202411 1,775 1,883DTE Energy Company 3.95% 2049 1,800 2,183Duke Energy Carolinas, LLC 3.95% 2028 1,250 1,435Duke Energy Florida, LLC 3.20% 2027 1,445 1,580Duke Energy Indiana, Inc. 3.25% 2049 1,225 1,300Duke Energy Progress, Inc. 3.70% 2046 750 851Edison International 3.55% 2024 2,200 2,341EDP Finance BV 3.625% 20247 4,100 4,410Electricité de France SA 4.75% 20357 1,250 1,528Electricité de France SA 4.875% 20387 2,750 3,387Electricité de France SA 5.60% 2040 525 703Emera US Finance LP 3.55% 2026 320 350Enersis Américas SA 4.00% 2026 245 267Entergy Corp. 2.80% 2030 3,325 3,467Entergy Louisiana, LLC 4.20% 2048 4,200 5,120Entergy Texas, Inc. 1.75% 2031 3,650 3,504Eversource Energy 3.80% 2023 2,730 2,932Exelon Corp., junior subordinated, 3.497% 202211 1,075 1,102FirstEnergy Corp. 3.40% 2050 5,275 5,184FirstEnergy Transmission LLC 2.866% 20287 675 700MidAmerican Energy Holdings Co. 3.10% 2027 2,000 2,189Northern States Power Co. 4.125% 2044 6,000 7,357NRG Energy, Inc. 3.625% 20317 2,250 2,214Oncor Electric Delivery Company LLC 2.75% 2024 1,047 1,111Pacific Gas and Electric Co. 1.75% 2022 1,575 1,574Pacific Gas and Electric Co. 2.10% 2027 125 122
Asset Allocation Fund (continued)

118 American Funds Insurance Series
Bonds, notes & other debt instruments (continued)Principal amount
(000)Value(000)
Corporate bonds, notes & loans (continued)
Utilities(continued)
Pacific Gas and Electric Co. 2.50% 2031 $14,750 $ 13,846Pacific Gas and Electric Co. 3.30% 2040 100 91Pacific Gas and Electric Co. 4.20% 2041 9,100 8,987Pacific Gas and Electric Co. 3.50% 2050 2,500 2,231PacifiCorp, First Mortgage Bonds, 3.60% 2024 4,695 5,037PacifiCorp, First Mortgage Bonds, 4.125% 2049 4,000 4,792PG&E Corp. 5.00% 2028 4,750 4,809PG&E Corp. 5.25% 2030 2,575 2,607Public Service Company of Colorado 2.25% 2022 2,000 2,027Public Service Company of Colorado 1.875% 2031 2,775 2,763Public Service Electric and Gas Co. 3.60% 2047 548 625Public Service Electric and Gas Co. 3.15% 2050 2,451 2,627Public Service Enterprise Group, Inc. 2.65% 2022 1,900 1,956Puget Energy, Inc. 6.00% 2021 1,823 1,840Southern California Edison Co. 2.85% 2029 4,450 4,626Southern California Edison Co. 6.00% 2034 2,500 3,245Southern California Edison Co. 5.35% 2035 3,000 3,804Southern California Edison Co. 5.75% 2035 675 886Southern California Edison Co. 4.875% 2049 3,745 4,446Southern California Gas Company 2.55% 2030 2,725 2,819Talen Energy Corp. 10.50% 20267 885 641Talen Energy Corp. 7.25% 20277 4,655 4,350Talen Energy Supply, LLC 7.625% 20287 1,575 1,476Union Electric Co. 2.625% 2051 5,625 5,396Virginia Electric and Power Co. 3.80% 2028 2,000 2,260Virginia Electric and Power Co. 4.60% 2048 2,650 3,428Xcel Energy, Inc. 2.60% 2029 1,950 2,029
184,412
Consumerdiscretionary0.56%
Allied Universal Holdco LLC 4.625% 20287 1,660 1,665Amazon.com, Inc. 2.70% 2060 2,765 2,656American Honda Finance Corp. 3.50% 2028 750 842Atlas LuxCo 4 SARL 4.625% 20287 1,065 1,070Bayerische MotorenWerke AG 2.25% 20237 300 311Bayerische MotorenWerke AG 3.45% 20237 1,870 1,965Bayerische MotorenWerke AG 0.80% 20247 1,532 1,540Caesars Entertainment, Inc. 6.25% 20257 3,315 3,518Carnival Corp. 11.50% 20237 5,575 6,281Carvana Co. 5.625% 20257 600 625Carvana Co. 5.50% 20277 2,496 2,584Carvana Co. 5.875% 20287 924 974Ford Motor Credit Company LLC 3.664% 2024 455 478Ford Motor Credit Company LLC 3.81% 2024 1,070 1,121Ford Motor Credit Company LLC 5.584% 2024 423 464Ford Motor Credit Company LLC 3.375% 2025 5,750 5,970Ford Motor Credit Company LLC 5.125% 2025 12,355 13,621Ford Motor Credit Company LLC 4.542% 2026 2,455 2,677Ford Motor Credit Company LLC 3.815% 2027 250 261General Motors Financial Co. 3.45% 2022 2,000 2,028General Motors Financial Co. 5.20% 2023 6,354 6,844General Motors Financial Co. 1.05% 2024 1,050 1,056General Motors Financial Co. 3.50% 2024 4,145 4,451General Motors Financial Co. 4.30% 2025 400 442General Motors Financial Co. 4.35% 2027 500 563Hanesbrands, Inc. 4.625% 20247 860 913Hanesbrands, Inc. 5.375% 20257 706 750Hanesbrands, Inc. 4.875% 20267 2,700 2,919Hilton Grand Vacations Borrower LLC 5.00% 20297 1,580 1,618HiltonWorldwide Holdings, Inc. 4.00% 20317 1,885 1,904
Asset Allocation Fund (continued)

American Funds Insurance Series 119
Bonds, notes & other debt instruments (continued)Principal amount
(000)Value(000)
Corporate bonds, notes & loans (continued)
Consumerdiscretionary(continued)
Home Depot, Inc. 3.90% 2028 $ 825 $ 962Home Depot, Inc. 2.95% 2029 9,301 10,167Home Depot, Inc. 1.375% 2031 2,556 2,450Home Depot, Inc. 4.25% 2046 3,500 4,359Home Depot, Inc. 4.50% 2048 428 559Home Depot, Inc. 2.375% 2051 1,000 927Hyundai Capital America 3.25% 20227 480 495Hyundai Capital America 2.375% 20277 2,579 2,641International Game Technology PLC 6.50% 20257 4,555 5,113International Game Technology PLC 5.25% 20297 4,365 4,688Lithia Motors, Inc. 3.875% 20297 675 701Lithia Motors, Inc. 4.375% 20317 1,025 1,099Lowe’s Companies, Inc. 1.70% 2030 966 927Melco International Development, Ltd. 5.75% 20287 1,485 1,570MGMGrowth Properties LLC 5.625% 2024 775 840MGMGrowth Properties LLC 4.625% 20257 1,050 1,124MGMGrowth Properties LLC 3.875% 20297 2,225 2,265Mohegan Gaming & Entertainment 8.00% 20267 3,400 3,557Neiman Marcus Group LLC 7.125% 20267 1,345 1,437Nissan Motor Co., Ltd. 3.522% 20257 3,000 3,206Nissan Motor Co., Ltd. 4.345% 20277 3,000 3,300Panther BF Aggregator 2 LP 6.25% 20267 500 533Royal Caribbean Cruises, Ltd. 11.50% 20257 1,925 2,221Royal Caribbean Cruises, Ltd. 4.25% 20267 2,120 2,120Sally Holdings LLC and Sally Capital, Inc. 5.625% 2025 5,255 5,432Sally Holdings LLC and Sally Capital, Inc. 8.75% 20257 2,347 2,573Scientific Games Corp. 8.625% 20257 1,260 1,381Scientific Games Corp. 8.25% 20267 6,905 7,414Scientific Games Corp. 7.00% 20287 950 1,040Scientific Games Corp. 7.25% 20297 1,615 1,826Tempur Sealy International, Inc. 4.00% 20297 1,070 1,087Toyota Motor Credit Corp. 0.80% 2026 2,265 2,240Toyota Motor Credit Corp. 3.05% 2028 2,430 2,670VICI Properties LP 4.625% 20297 995 1,059VICI Properties LP / VICI Note Co., Inc. 3.50% 20257 2,100 2,148VICI Properties LP / VICI Note Co., Inc. 3.75% 20277 450 459VICI Properties LP / VICI Note Co., Inc. 4.125% 20307 3,100 3,192Volkswagen Group of America Finance, LLC 4.25% 20237 3,770 4,076Volkswagen Group of America Finance, LLC 4.625% 20257 3,845 4,386Volkswagen Group of America Finance, LLC 3.20% 20267 3,201 3,465Wyndham Destinations, Inc. 4.625% 20307 1,300 1,345WyndhamWorldwide Corp. 4.375% 20287 1,855 1,932Wynn Las Vegas, LLC andWynn Capital Corp. 4.25% 20237 3,468 3,602
180,699
Materials0.53%
Alcoa Netherlands Holding BV 4.125% 20297 950 992Anglo American Capital PLC 2.25% 20287 484 490Anglo American Capital PLC 2.625% 20307 11,275 11,334Anglo American Capital PLC 3.95% 20507 2,281 2,482Arconic Rolled Products Corp. 6.125% 20287 750 807Chevron Phillips Chemical Co. LLC 3.30% 20237 595 625Cleveland-Cliffs, Inc. 6.75% 20267 2,035 2,198Cleveland-Cliffs, Inc. 5.875% 2027 10,500 11,051Cleveland-Cliffs, Inc. 4.625% 20297 1,825 1,923Cleveland-Cliffs, Inc. 4.875% 20317 2,051 2,156CVR Partners LP 9.25% 20237 346 348CVR Partners LP 6.125% 20287 745 764Dow Chemical Co. 3.625% 2026 1,884 2,086Dow Chemical Co. 3.60% 2050 12,662 13,706
Asset Allocation Fund (continued)

120 American Funds Insurance Series
Bonds, notes & other debt instruments (continued)Principal amount
(000)Value(000)
Corporate bonds, notes & loans (continued)
Materials(continued)
First QuantumMinerals, Ltd. 7.25% 20237 $ 1,200 $ 1,225First QuantumMinerals, Ltd. 6.50% 20247 4,704 4,812First QuantumMinerals, Ltd. 7.50% 20257 11,350 11,805First QuantumMinerals, Ltd. 6.875% 20267 3,625 3,797First QuantumMinerals, Ltd. 6.875% 20277 3,240 3,535Freeport-McMoRan, Inc. 4.25% 2030 2,550 2,735Freeport-McMoRan, Inc. 5.45% 2043 1,300 1,591FXI Holdings, Inc. 7.875% 20247 2,226 2,305FXI Holdings, Inc. 12.25% 20267 4,392 5,071Glencore Funding LLC 4.125% 20247 945 1,019Hexion, Inc. 7.875% 20277 2,045 2,209International Flavors & Fragrances, Inc. 1.832% 20277 5,400 5,390International Flavors & Fragrances, Inc. 3.468% 20507 2,285 2,379International Paper Co. 7.30% 2039 2,005 3,111Joseph T. Ryerson & Son, Inc. 8.50% 20287 1,148 1,278LSB Industries, Inc. 9.625% 20237 5,170 5,322LYB International Finance III, LLC 2.25% 2030 2,275 2,275LYB International Finance III, LLC 3.375% 2040 10,848 11,261LYB International Finance III, LLC 3.625% 2051 9,787 10,358LYB International Finance III, LLC 3.80% 2060 1,186 1,257Methanex Corp. 5.125% 2027 4,750 5,137Mosaic Co. 3.25% 2022 1,125 1,165Mosaic Co. 4.05% 2027 1,050 1,178Praxair, Inc. 1.10% 2030 2,938 2,765SCIH Salt Holdings, Inc. 4.875% 20287 1,185 1,188SCIH Salt Holdings, Inc. 6.625% 20297 1,230 1,235Sherwin-Williams Company 2.75% 2022 29 30Sherwin-Williams Company 3.125% 2024 275 294Sherwin-Williams Company 3.80% 2049 5,208 6,025Tronox, Ltd. 4.625% 20297 2,175 2,199Vale Overseas, Ltd. 3.75% 2030 2,229 2,376Venator Materials Corp. 5.75% 20257 5,845 5,764Venator Materials Corp. 9.50% 20257 1,495 1,686Warrior Met Coal, Inc. 8.00% 20247 5,095 5,178Westlake Chemical Corp. 4.375% 2047 500 589
170,506
Informationtechnology0.41%
Adobe, Inc. 1.90% 2025 366 381Almonde, Inc., Term Loan, (3-month USD-LIBOR + 7.25%) 8.25% 202514,15 4,150 4,203Apple, Inc. 3.00% 2024 625 663Apple, Inc. 0.70% 2026 2,500 2,472Apple, Inc. 3.35% 2027 40 44Apple, Inc. 1.20% 2028 5,000 4,932Apple, Inc. 1.65% 2031 2,500 2,463Avaya, Inc. 6.125% 20287 1,600 1,715Booz Allen Hamilton, Inc. 4.00% 20297 710 727Broadcom, Inc. 1.95% 20287 1,407 1,408Broadcom, Inc. 2.45% 20317 2,452 2,411Broadcom, Inc. 2.60% 20337 2,524 2,471Broadcom, Inc. 3.469% 20347 11,463 12,137Broadcom, Inc. 3.50% 20417 3,948 4,044Broadcom, Inc. 3.75% 20517 3,366 3,519CommScope Finance LLC 6.00% 20267 2,425 2,563Diebold Nixdorf AG, Term Loan B, (3-month USD-LIBOR + 2.75%) 2.897% 202314,15 1,334 1,316Diebold Nixdorf, Inc. 9.375% 20257 5,675 6,310Diebold, Inc. 8.50% 2024 1,400 1,435Fidelity National Information Services, Inc. 3.10% 2041 302 310Fiserv, Inc. 2.75% 2024 1,600 1,689Fiserv, Inc. 3.20% 2026 7,455 8,075
Asset Allocation Fund (continued)

American Funds Insurance Series 121
Bonds, notes & other debt instruments (continued)Principal amount
(000)Value(000)
Corporate bonds, notes & loans (continued)
Informationtechnology(continued)
Fiserv, Inc. 3.50% 2029 $ 1,280 $ 1,410Fiserv, Inc. 2.65% 2030 7,673 7,953Fiserv, Inc. 4.40% 2049 800 967Gartner, Inc. 4.50% 20287 650 687Intuit, Inc. 0.95% 2025 1,530 1,535Intuit, Inc. 1.35% 2027 1,395 1,394Intuit, Inc. 1.65% 2030 1,845 1,815McAfee, LLC, Term Loan, (3-month USD-LIBOR + 3.75%) 3.897% 202414,15 2,587 2,591Microsoft Corp. 2.525% 2050 4,744 4,672Microsoft Corp. 2.921% 2052 4,814 5,118Oracle Corp. 3.65% 2041 2,250 2,390Oracle Corp. 3.95% 2051 1,826 1,995PayPal Holdings, Inc. 2.65% 2026 2,364 2,541PayPal Holdings, Inc. 2.30% 2030 2,200 2,279Sabre GLBL, Inc. 7.375% 20257 728 793Sabre Holdings Corp. 9.25% 20257 1,197 1,426salesforce.com, inc. 1.50% 2028 3,200 3,196salesforce.com, inc. 1.95% 2031 1,625 1,629salesforce.com, inc. 2.70% 2041 1,875 1,890Square, Inc. 3.50% 20317 1,875 1,894Synaptics, Inc. 4.00% 20297 675 679Unisys Corp. 6.875% 20277 725 793VeriSign, Inc. 2.70% 2031 625 636Veritas Holdings, Ltd. 7.50% 20257 3,860 4,030ViaSat, Inc. 5.625% 20277 555 581Visa, Inc. 2.80% 2022 2,000 2,067Visa, Inc. 3.15% 2025 5,500 6,020Xerox Corp. 5.00% 20257 2,925 3,091Xerox Corp. 5.50% 20287 1,875 1,951
133,311
Real estate0.41%
Alexandria Real Estate Equities, Inc. 3.80% 2026 315 351Alexandria Real Estate Equities, Inc. 3.95% 2028 1,220 1,379Alexandria Real Estate Equities, Inc. 2.75% 2029 1,940 2,027Alexandria Real Estate Equities, Inc. 3.375% 2031 1,320 1,452Alexandria Real Estate Equities, Inc. 1.875% 2033 4,095 3,878Alexandria Real Estate Equities, Inc. 4.85% 2049 410 530American Campus Communities, Inc. 3.75% 2023 3,055 3,203American Campus Communities, Inc. 4.125% 2024 2,075 2,260American Campus Communities, Inc. 3.625% 2027 9,545 10,397American Campus Communities, Inc. 3.875% 2031 331 368American Tower Corp. 1.60% 2026 2,347 2,373American Tower Corp. 3.55% 2027 1,425 1,568American Tower Corp. 1.50% 2028 10,000 9,736American Tower Corp. 3.60% 2028 1,000 1,101Brandywine Operating Partnership LP 3.95% 2023 1,070 1,116Brookfield Property REIT, Inc. 5.75% 20267 6,050 6,368Diversified Healthcare Trust 4.375% 2031 3,250 3,118Equinix, Inc. 1.45% 2026 6,787 6,825Equinix, Inc. 2.90% 2026 1,144 1,226Equinix, Inc. 1.80% 2027 1,295 1,312Equinix, Inc. 1.55% 2028 3,175 3,122Equinix, Inc. 2.00% 2028 2,234 2,246Equinix, Inc. 3.20% 2029 1,552 1,667Equinix, Inc. 2.50% 2031 1,710 1,741Equinix, Inc. 3.00% 2050 912 877Equinix, Inc. 3.40% 2052 2,731 2,814Essex Portfolio LP 3.875% 2024 1,000 1,077Essex Portfolio LP 3.50% 2025 6,825 7,393
Asset Allocation Fund (continued)

122 American Funds Insurance Series
Bonds, notes & other debt instruments (continued)Principal amount
(000)Value(000)
Corporate bonds, notes & loans (continued)
Real estate(continued)
Gaming and Leisure Properties, Inc. 3.35% 2024 $1,263 $ 1,341Hospitality Properties Trust 4.50% 2023 1,945 1,998Hospitality Properties Trust 4.50% 2025 150 150Hospitality Properties Trust 4.95% 2027 500 499Hospitality Properties Trust 3.95% 2028 1,950 1,844Host Hotels & Resorts LP 4.50% 2026 355 390Howard Hughes Corp. 5.375% 20287 2,450 2,606Howard Hughes Corp. 4.125% 20297 1,860 1,866Howard Hughes Corp. 4.375% 20317 2,015 2,012Iron Mountain, Inc. 5.25% 20307 4,785 5,072Iron Mountain, Inc. 4.50% 20317 2,650 2,686Kennedy-Wilson Holdings, Inc. 4.75% 2029 2,255 2,326Kennedy-Wilson Holdings, Inc. 5.00% 2031 2,530 2,606Ladder Capital Corp. 5.25% 20257 440 448Park Intermediate Holdings LLC 4.875% 20297 1,180 1,222Public Storage 2.37% 2022 565 578Public Storage 0.875% 2026 592 587Public Storage 1.85% 2028 2,490 2,511Public Storage 2.30% 2031 2,493 2,545QTS Realty Trust, Inc. 3.875% 20287 2,025 2,168Realogy Corp. 5.75% 20297 2,760 2,889RHP Hotel Properties LP / RHP Finance Corp. 4.50% 20297 875 878Scentre Group 3.25% 20257 1,000 1,074Scentre Group 3.50% 20257 3,075 3,307Scentre Group 3.75% 20277 2,430 2,683UDR, Inc. 2.95% 2026 760 813Westfield Corp., Ltd. 3.15% 20227 4,290 4,355
132,979
Consumer staples0.38%
7-Eleven, Inc. 0.80% 20247 1,700 1,6967-Eleven, Inc. 0.95% 20267 825 8117-Eleven, Inc. 1.30% 20287 6,515 6,298Albertsons Companies, Inc. 3.50% 20297 1,385 1,371Altria Group, Inc. 4.40% 2026 231 261Altria Group, Inc. 5.80% 2039 4,820 5,963Altria Group, Inc. 3.40% 2041 2,500 2,388Altria Group, Inc. 4.50% 2043 3,000 3,232Altria Group, Inc. 5.95% 2049 490 628Altria Group, Inc. 3.70% 2051 2,500 2,376Anheuser-Busch InBev NV 4.00% 2028 4,345 4,950Anheuser-Busch InBev NV 5.45% 2039 5,000 6,608B&G Foods, Inc. 5.25% 2025 2,175 2,237British American Tobacco International Finance PLC 3.95% 20257 4,250 4,645British American Tobacco PLC 3.222% 2024 2,826 3,003British American Tobacco PLC 3.215% 2026 3,323 3,529British American Tobacco PLC 4.39% 2037 3,109 3,357British American Tobacco PLC 4.54% 2047 940 1,001Central Garden & Pet Co. 4.125% 20317 1,395 1,415Coca-Cola Company 1.00% 2028 940 912Conagra Brands, Inc. 1.375% 2027 4,615 4,506Constellation Brands, Inc. 2.65% 2022 2,856 2,937Constellation Brands, Inc. 2.70% 2022 195 199Constellation Brands, Inc. 3.20% 2023 1,029 1,073Constellation Brands, Inc. 3.60% 2028 625 693Imperial Tobacco Finance PLC 3.50% 20237 4,000 4,138Keurig Dr Pepper, Inc. 4.985% 2038 3,351 4,280Kimberly-Clark Corp. 3.10% 2030 329 364Kraft Heinz Company 3.875% 2027 2,475 2,721Kraft Heinz Company 4.375% 2046 1,140 1,294
Asset Allocation Fund (continued)

American Funds Insurance Series 123
Bonds, notes & other debt instruments (continued)Principal amount
(000)Value(000)
Corporate bonds, notes & loans (continued)
Consumer staples(continued)
Kraft Heinz Company 4.875% 2049 $ 3,760 $ 4,574Kraft Heinz Company 5.50% 2050 1,215 1,580Kronos Acquisition Holdings, Inc. 5.00% 20267 1,695 1,723Nestlé Holdings, Inc. 1.00% 20277 16,400 16,022Philip Morris International, Inc. 2.375% 2022 1,960 2,005Philip Morris International, Inc. 2.625% 2022 1,670 1,692Philip Morris International, Inc. 2.875% 2024 788 838Philip Morris International, Inc. 3.25% 2024 2,000 2,164Philip Morris International, Inc. 0.875% 2026 2,990 2,954Philip Morris International, Inc. 3.375% 2029 788 873Philip Morris International, Inc. 1.75% 2030 2,956 2,859Post Holdings, Inc. 4.625% 20307 2,886 2,938Prestige Brands International, Inc. 3.75% 20317 1,115 1,077Reckitt Benckiser Group PLC 2.375% 20227 1,125 1,147Reynolds American, Inc. 5.85% 2045 2,030 2,489Simmons Foods, Inc. 4.625% 20297 560 566
124,387
Total corporate bonds, notes & loans 2,264,966
Mortgage-backed obligations 5.53%
Federal agencymortgage-backedobligations5.13%
Fannie Mae Pool #AD7072 4.00% 202516 4 4Fannie Mae Pool #AE3069 4.00% 202516 2 2Fannie Mae Pool #AE2321 4.00% 202516 1 1Fannie Mae Pool #AH6431 4.00% 202616 399 425Fannie Mae Pool #890329 4.00% 202616 57 61Fannie Mae Pool #AH5618 4.00% 202616 3 4Fannie Mae Pool #AH0829 4.00% 202616 3 4Fannie Mae Pool #MA1109 4.00% 202716 4 4Fannie Mae Pool #MA3653 3.00% 202916 40 42Fannie Mae Pool #AL8347 4.00% 202916 420 446Fannie Mae Pool #254767 5.50% 203316 289 334Fannie Mae Pool #555956 5.50% 203316 187 216Fannie Mae Pool #BN1085 4.00% 203416 575 612Fannie Mae Pool #BN3172 4.00% 203416 178 189Fannie Mae Pool #AS8554 3.00% 203616 9,100 9,579Fannie Mae Pool #929185 5.50% 203616 460 533Fannie Mae Pool #893641 6.00% 203616 948 1,125Fannie Mae Pool #893688 6.00% 203616 243 288Fannie Mae Pool #907239 6.00% 203616 58 69Fannie Mae Pool #AD0249 5.50% 203716 156 180Fannie Mae Pool #190379 5.50% 203716 82 96Fannie Mae Pool #924952 6.00% 203716 1,143 1,355Fannie Mae Pool #888292 6.00% 203716 830 986Fannie Mae Pool #928031 6.00% 203716 98 116Fannie Mae Pool #888637 6.00% 203716 14 17Fannie Mae Pool #AD0119 6.00% 203816 1,350 1,602Fannie Mae Pool #AD0095 6.00% 203816 1,017 1,205Fannie Mae Pool #995674 6.00% 203816 486 576Fannie Mae Pool #AE0021 6.00% 203816 393 466Fannie Mae Pool #AL7164 6.00% 203816 254 295Fannie Mae Pool #AB0538 6.00% 203816 151 175Fannie Mae Pool #889983 6.00% 203816 26 31Fannie Mae Pool #995391 6.00% 203816 26 30Fannie Mae Pool #995224 6.00% 203816 12 14Fannie Mae Pool #AD0833 6.00% 203916 1 1Fannie Mae Pool #AL0013 6.00% 204016 259 306Fannie Mae Pool #AL0309 6.00% 204016 85 101Fannie Mae Pool #MA4333 2.00% 204116 9,698 9,867Fannie Mae Pool #MA4387 2.00% 204116 8,842 9,034
Asset Allocation Fund (continued)

124 American Funds Insurance Series
Bonds, notes & other debt instruments (continued)Principal amount
(000)Value(000)
Mortgage-backed obligations (continued)
Federal agencymortgage-backedobligations(continued)
Fannie Mae Pool #MA4364 2.00% 204116 $ 2,802 $ 2,845Fannie Mae Pool #AB4536 6.00% 204116 552 652Fannie Mae Pool #AL7228 6.00% 204116 353 411Fannie Mae Pool #AP2131 3.50% 204216 4,521 4,873Fannie Mae Pool #AU8813 4.00% 204316 2,701 3,013Fannie Mae Pool #AU9348 4.00% 204316 1,561 1,741Fannie Mae Pool #AU9350 4.00% 204316 1,314 1,452Fannie Mae Pool #AL8773 3.50% 204516 7,747 8,346Fannie Mae Pool #AL8354 3.50% 204516 1,951 2,116Fannie Mae Pool #BC4764 3.00% 204616 16,398 17,265Fannie Mae Pool #AL8522 3.50% 204616 3,919 4,251Fannie Mae Pool #BD9699 3.50% 204616 1,707 1,841Fannie Mae Pool #BD9307 4.00% 204616 1,715 1,866Fannie Mae Pool #BC7611 4.00% 204616 401 438Fannie Mae Pool #CA0770 3.50% 204716 2,617 2,775Fannie Mae Pool #BE1290 3.50% 204716 2,569 2,740Fannie Mae Pool #MA3211 4.00% 204716 4,946 5,303Fannie Mae Pool #257036 7.00% 204716 8 10Fannie Mae Pool #256975 7.00% 204716 2 2Fannie Mae Pool #FM3278 3.50% 204816 28,331 29,872Fannie Mae Pool #BK7655 3.891% 204814,16 570 596Fannie Mae Pool #CA2377 4.00% 204816 11,397 12,162Fannie Mae Pool #BK6971 4.00% 204816 160 171Fannie Mae Pool #MA3277 4.00% 204816 20 21Fannie Mae Pool #BK5255 4.00% 204816 19 21Fannie Mae Pool #CA2493 4.50% 204816 1,296 1,399Fannie Mae Pool #CA4756 3.00% 204916 8,470 8,964Fannie Mae Pool #BK8767 4.00% 204916 133 144Fannie Mae Pool #MA4381 3.50% 205116 668 709Fannie Mae, Series 2001-T10, Class A1, 7.00% 204116 112 129Fannie Mae, Series 2002-W3, Class A5, 7.50% 204116 30 37Fannie Mae, Series 2012-M14, Class A2, Multi Family, 2.301% 202214,16 1,046 1,067Fannie Mae, Series 2012-M9, Class A2, Multi Family, 2.482% 202216 1,109 1,121Fannie Mae, Series 2012-M5, Class A2, Multi Family, 2.715% 202216 763 767Fannie Mae, Series 2014-M1, Class A2, Multi Family, 3.185% 202314,16 4,816 5,045Fannie Mae, Series 2013-M14, Class A2, Multi Family, 3.329% 202314,16 5,071 5,352Fannie Mae, Series 2014-M2, Class A2, Multi Family, 3.513% 202314,16 4,330 4,604Fannie Mae, Series 2014-M9, Class A2, Multi Family, 3.103% 202414,16 5,518 5,876Fannie Mae, Series 2014-M3, Class A2, Multi Family, 3.501% 202414,16 3,972 4,223Fannie Mae, Series 2017-M3, Class A2, Multi Family, 2.559% 202614,16 9,665 10,330Fannie Mae, Series 2017-M7, Class A2, Multi Family, 2.961% 202714,16 2,891 3,142Fannie Mae, Series 2006-43, Class JO, principal only, 0% 203616 62 57Freddie Mac Pool #ZK7598 3.00% 202716 8,407 8,893Freddie Mac Pool #ZK7580 3.00% 202716 3,772 3,992Freddie Mac Pool #C91912 3.00% 203716 15,917 16,761Freddie Mac Pool #G03978 5.00% 203816 587 673Freddie Mac Pool #G04553 6.50% 203816 76 87Freddie Mac Pool #G08347 4.50% 203916 97 109Freddie Mac Pool #C03518 5.00% 204016 938 1,066Freddie Mac Pool #RB5118 2.00% 204116 30,065 30,717Freddie Mac Pool #Q05807 4.00% 204216 2,437 2,669Freddie Mac Pool #Q23185 4.00% 204316 1,711 1,909Freddie Mac Pool #Q23190 4.00% 204316 1,162 1,280Freddie Mac Pool #760014 2.977% 204514,16 309 323Freddie Mac Pool #Q37988 4.00% 204516 8,593 9,434Freddie Mac Pool #G60344 4.00% 204516 7,261 8,002Freddie Mac Pool #Z40130 3.00% 204616 5,757 6,189Freddie Mac Pool #Q41909 4.50% 204616 625 681Freddie Mac Pool #Q41090 4.50% 204616 392 428Freddie Mac Pool #760015 2.679% 204714,16 729 760Freddie Mac Pool #Q46021 3.50% 204716 1,679 1,798
Asset Allocation Fund (continued)

American Funds Insurance Series 125
Bonds, notes & other debt instruments (continued)Principal amount
(000)Value(000)
Mortgage-backed obligations (continued)
Federal agencymortgage-backedobligations(continued)
Freddie Mac Pool #SI2002 4.00% 204816 $ 4,244 $ 4,543Freddie Mac Pool #SD7507 3.00% 204916 28,669 30,468Freddie Mac Pool #SD7528 2.00% 205016 21,370 21,679Freddie Mac Pool #RA2020 3.00% 205016 11,406 12,048Freddie Mac Pool #SD8164 3.50% 205116 6,835 7,241Freddie Mac Pool #SD8158 3.50% 205116 81 85Freddie Mac, Series T041, Class 3A, 5.051% 203214,16 223 249Freddie Mac, Series K723, Class A2, Multi Family, 2.454% 202316 3,025 3,129Freddie Mac, Series K725, Class A2, Multi Family, 3.002% 202416 5,555 5,876Freddie Mac, Series K044, Class A2, Multi Family, 2.811% 202516 4,265 4,554Freddie Mac, Series K047, Class A2, Multi Family, 3.329% 202516 4,000 4,357Freddie Mac, Series K733, Class A2, Multi Family, 3.75% 202514,16 9,778 10,769Freddie Mac, Series K055, Class A2, Multi Family, 2.673% 202616 10,050 10,779Freddie Mac, Series K734, Class A2, Multi Family, 3.208% 202616 7,370 8,055Freddie Mac, Series K066, Class A2, Multi Family, 3.117% 202716 4,755 5,252Freddie Mac, Series K067, Class A2, Multi Family, 3.194% 202716 5,770 6,407Freddie Mac, Series K063, Class A2, Multi Family, 3.43% 202716 4,375 4,885Freddie Mac, Series K076, Class A2, Multi Family, 3.90% 202816 3,237 3,755Freddie Mac Seasoned Credit Risk Transfer Trust, Series 2017-2, Class MA,
3.00% 205616 7,331 7,666Freddie Mac Seasoned Credit Risk Transfer Trust, Series 2017-2, Class HA,
3.00% 205614,16 7,326 7,664Freddie Mac Seasoned Credit Risk Transfer Trust, Series 2017-1, Class HA,
3.00% 205614,16 3,730 3,901Freddie Mac Seasoned Credit Risk Transfer Trust, Series 2017-3, Class HA,
3.25% 205614,16 1,622 1,710Freddie Mac Seasoned Credit Risk Transfer Trust, Series 2017-4, Class HT,
3.25% 205714,16 1,225 1,320Freddie Mac Seasoned Credit Risk Transfer Trust, Series 2018-3, Class MA,
3.50% 205716 2,805 2,948Freddie Mac Seasoned Credit Risk Transfer Trust, Series 2018-2, Class MT,
3.50% 205716 2,553 2,786Freddie Mac Seasoned Credit Risk Transfer Trust, Series 2017-4, Class MT,
3.50% 205716 1,003 1,094Freddie Mac Seasoned Credit Risk Transfer Trust, Series 2019-2, Class MA,
3.50% 205816 13,732 14,473Freddie Mac Seasoned Credit Risk Transfer Trust, Series 2019-4, Class MA,
3.00% 205916 7,694 8,084Freddie Mac Seasoned Loan Structured Transaction Trust, Series 2018-2, Class A1,
3.50% 202816 3,013 3,187Freddie Mac Seasoned Loan Structured Transaction Trust, Series 2019-3, Class A1C,
2.75% 202916 3,969 4,173Freddie Mac Seasoned Loan Structured Transaction Trust, Series 2019-1, Class A1,
3.50% 202916 6,190 6,601Freddie Mac Seasoned Loan Structured Transaction Trust, Series 2019-1, Class A2,
3.50% 202916 2,455 2,712Freddie Mac Structured Agency Credit Risk Debt Notes, Series 2015-DNA1, Class M3,
3.392% 202714,16 777 788Government National Mortgage Assn. 2.00% 205116,17 89,533 91,027Government National Mortgage Assn. 2.50% 205116,17 21,529 22,241Government National Mortgage Assn. 3.00% 205116,17 28,369 29,591Government National Mortgage Assn. 3.00% 205116,17 7,413 7,735Government National Mortgage Assn. 3.50% 205116,17 26,752 28,085Government National Mortgage Assn. 4.00% 205116,17 13,107 13,841Government National Mortgage Assn. 4.50% 205116,17 10,000 10,658Government National Mortgage Assn. Pool #BD7245 4.00% 204816 1,025 1,106Government National Mortgage Assn. Pool #MA5876 4.00% 204916 11,073 11,741Government National Mortgage Assn. Pool #MA5986 4.00% 204916 1,442 1,530Government National Mortgage Assn. Pool #MA5764 4.50% 204916 18,936 20,210Government National Mortgage Assn. Pool #MA6092 4.50% 204916 4,689 5,001Government National Mortgage Assn. Pool #MA5877 4.50% 204916 2,770 2,962
Asset Allocation Fund (continued)

126 American Funds Insurance Series
Bonds, notes & other debt instruments (continued)Principal amount
(000)Value(000)
Mortgage-backed obligations (continued)
Federal agencymortgage-backedobligations(continued)
Government National Mortgage Assn. Pool #MA7419 3.00% 205116 $ 38,218 $ 40,144UniformMortgage-Backed Security 1.50% 203616,17 19,795 19,972UniformMortgage-Backed Security 2.00% 203616,17 52,169 53,812UniformMortgage-Backed Security 2.50% 203616,17 638 665UniformMortgage-Backed Security 3.00% 203616,17 8,784 9,230UniformMortgage-Backed Security 2.00% 205116,17 88,984 89,495UniformMortgage-Backed Security 2.50% 205116,17 213,092 219,526UniformMortgage-Backed Security 2.50% 205116,17 5,863 6,053UniformMortgage-Backed Security 3.00% 205116,17 94,201 98,048UniformMortgage-Backed Security 3.00% 205116,17 44,573 46,435UniformMortgage-Backed Security 3.50% 205116,17 141,729 149,283UniformMortgage-Backed Security 3.50% 205116,17 8,114 8,542UniformMortgage-Backed Security 4.00% 205116,17 112,136 119,512UniformMortgage-Backed Security 4.50% 205116,17 41,792 44,966
1,658,560
Commercialmortgage-backedsecurities0.22%
Bank Commercial Mortgage Trust, Series 2020-BN26, Class A4, 2.403% 206316 2,909 3,013Barclays Commercial Mortgage Securities LLC, Series 2017-DELC, Class A,
0.923% 20367,14,16 2,000 2,004Benchmark Mortgage Trust, Series 2018-B2, Class A4, 3.615% 205116 1,000 1,105Benchmark Mortgage Trust, Series 2020-B17, Class A5, 2.289% 205316 2,960 3,039BX Trust, Series 2021-SOAR, Class A, (1-month USD-LIBOR + 0.67%) 0.77% 20387,14,16 7,538 7,552BX Trust, Series 2021-SOAR, Class B, (1-month USD-LIBOR + 0.87%) 0.97% 20387,14,16 1,361 1,365BX Trust, Series 2021-SOAR, Class C, (1-month USD-LIBOR + 1.10%) 1.20% 20387,14,16 1,229 1,233Citigroup Commercial Mortgage Trust, Series 2015-GC29, Class AAB, 2.984% 204816 904 936Commercial Mortgage Trust, Series 2015-PC1, Class A5, 3.902% 205016 4,735 5,205CSAIL Commercial Mortgage Trust, Series 2015-C4, Class ASB, 3.617% 204816 1,201 1,270Extended Stay America Trust, Series 2021-ESH, Class A,
(1-month USD-LIBOR + 1.08%) 1.155% 20387,14,16 1,574 1,579Extended Stay America Trust, Series 2021-ESH, Class B,
(1-month USD-LIBOR + 1.38%) 1.455% 20387,14,16 1,437 1,443Extended Stay America Trust, Series 2021-ESH, Class C,
(1-month USD-LIBOR + 1.70%) 1.775% 20387,14,16 1,501 1,509Grace Mortgage Trust, Series 2020-GRCE, Class A, 2.347% 20407,16 5,201 5,320GS Mortgage Securities Trust, Series 2020-GC47, Class A5, 2.377% 205316 5,602 5,794JPMorgan Chase Commercial Mortgage Securities Trust, Series 2021-410T, Class A,
2.287% 20427,16 1,431 1,470ManhattanWest Mortgage Trust, Series 2020-1MW, Class A, 2.13% 20397,16 13,772 14,110MHC Commercial Mortgage Trust, CMO, Series 2021-MHC, Class A,
(1-month USD-LIBOR + 0.801%) 0.951% 20267,14,16 3,950 3,960Morgan Stanley Bank of America Merrill Lynch Trust, Series 2015-C27, Class ASB,
3.557% 204716 879 927Morgan Stanley Bank of America Merrill Lynch Trust, Series 2015-C22, Class ASB,
3.04% 204816 927 967SLG Office Trust, Series 2021-OVA, Class A, 2.585% 20417,16 7,020 7,333
71,134
Collateralizedmortgage-backedobligations (privatelyoriginated)0.18%
Arroyo Mortgage Trust, Series 2021-1R, Class A1, 1.175% 20487,14,16 2,024 2,039Arroyo Mortgage Trust, Series 2018-1, Class A1, 3.763% 20487,14,16 1,219 1,220Bellemeade Re, Ltd., Series 2019-3A, Class M1B,
(1-month USD-LIBOR + 1.60%) 1.692% 20297,14,16 3,810 3,823Cascade Funding Mortgage Trust, Series 2018-RM2, Class A, 4.00% 20687,14,16 1,874 1,958Credit Suisse Mortgage Trust, Series 2020-NET, Class A, 2.257% 20377,16 4,191 4,332Credit Suisse Mortgage Trust, Series 2017-RPL3, Class A1, 2.00% 20607,14,16 2,946 2,991CS First Boston Mortgage Securities Corp., Series 2004-5, Class IVA1, 6.00% 203416 183 193Finance of America Structured Securities Trust, Series 2019-JR2, Class A1,
2.00% 20697,16 9,761 10,612
Asset Allocation Fund (continued)

American Funds Insurance Series 127
Bonds, notes & other debt instruments (continued)Principal amount
(000)Value(000)
Mortgage-backed obligations (continued)
Collateralizedmortgage-backedobligations (privatelyoriginated)(continued)
Finance of America Structured Securities Trust, Series 2019-JR1, Class A,2.00% 20697,16 $ 3,466 $ 3,791
JPMorgan Mortgage Trust, Series 2019-INV3, Class A13, 3.50% 20507,14,16 733 749JPMorgan Mortgage Trust, Series 2019-INV3, Class A3, 3.50% 20507,14,16 700 714Legacy Mortgage Asset Trust, Series 2019-GS5, Class A1, 3.20% 20597,14,16 4,805 4,828Legacy Mortgage Asset Trust, Series 2019-GS7, Class A1, 3.25% 20597,14,16 1,322 1,331Legacy Mortgage Asset Trust, Series 2019-GS2, Class A1, 3.75% 20597,14,16 656 658MASTR Alternative Loan Trust, Series 2004-2, Class 2A1, 6.00% 203416 417 432Mello Warehouse Securitization Trust, Series 2019-2, Class A,
(1-month USD-LIBOR + 0.75%) 0.842% 20527,14,16 3,001 3,006Mortgage Repurchase Agreement Financing Trust, Series 2020-5,
(1-month USD-LIBOR + 1.00%) 1.077% 20237,14,16 2,862 2,867MRA Issuance Trust, Series 2020-10, Class A,
(1-month USD-LIBOR + 1.70%) 1.786% 20227,14,16 7,829 7,834Onslow Bay Financial LLC, Series 2020-INV1, Class A5, 3.50% 20497,14,16 1,485 1,508RMF Proprietary Issuance Trust, Series 2019-1, Class A, 2.75% 20637,14,16 754 752Sequoia Mortgage Trust, Series 2018-CH1, Class A1, 4.00% 20487,14,16 1,015 1,031Station Place Securitization Trust, Series 2021-WL2, Class A,
(1-month USD-LIBOR + 0.70%) 0.792% 20547,14,16 1,300 1,301TIF Funding II LLC, Series 2021-1A, Class A, 1.65% 20467,16 845 834
58,804
Total mortgage-backed obligations 1,788,498
Asset-backed obligations 0.96%
Aesop Funding LLC, Series 2017-2A, Class A, 2.97% 20247,16 1,920 1,994Aesop Funding LLC, Series 2018-1A, Class A, 3.70% 20247,16 1,114 1,184Aesop Funding LLC, Series 2018-2A, Class A, 4.00% 20257,16 3,100 3,352Aesop Funding LLC, Series 2021-1A, Class A, 1.38% 20277,16 13,378 13,390Aesop Funding LLC, Series 2020-2, Class A, 2.02% 20277,16 539 556Aesop Funding LLC, Series 2020-2A, Class B, 2.96% 20277,16 138 146Allegro CLO, Ltd., Series 2016-1A, Class AR2,
(3-month USD-LIBOR + 0.95%) 1.12% 20307,14,16 2,875 2,875Allegro CLO, Ltd., Series 2017-1A, Class AR,
(3-month USD-LIBOR + 0.95%) 1.134% 20307,14,16 1,639 1,639ARES CLO, Ltd., Series 2017-42A, Class AR,
(3-month USD-LIBOR + 0.92%) 1.114% 20287,14,16 3,510 3,510Ballyrock, Ltd., Series 2019-2A, Class A1AR,
(3-month USD-LIBOR + 1.00%) 1.155% 20307,14,16 3,660 3,660Bankers Healthcare Group Securitization Trust, Series 2021-A, Class A, 1.42% 20337,16 981 982CarMaxAuto Owner Trust, Series 2020-1, Class A2, 1.87% 202316 409 410Cent CLO LP, Series 2014-21A, Class AR,
(3-month USD-LIBOR + 0.97%) 1.151% 20307,14,16 5,185 5,185CF Hippolyta LLC, Series 2020-1, Class A1, 1.69% 20607,16 5,454 5,548CF Hippolyta LLC, Series 2020-1, Class A2, 1.99% 20607,16 1,858 1,889CF Hippolyta LLC, Series 2020-1, Class B1, 2.28% 20607,16 945 962CF Hippolyta LLC, Series 2020-1, Class B2, 2.60% 20607,16 177 179CF Hippolyta LLC, Series 2021-1, Class A1, 1.53% 20617,16 6,402 6,452CF Hippolyta LLC, Series 2021-1, Class B1, 1.98% 20617,16 822 830CLI Funding V LLC, Series 2020-2A, Class A, 2.03% 20457,16 1,778 1,790CLI Funding V LLC, Series 2020-3A, Class A, 2.07% 20457,16 1,435 1,450CLI Funding V LLC, Series 2020-1A, Class A, 2.08% 20457,16 6,427 6,491CLI Funding V LLC, Series 2020-3A, Class B, 3.30% 20457,16 914 933CLI Funding V LLC, Series 2021-1A, Class A, 1.64% 20467,16 1,912 1,900Cloud Pass-Through Trust, Series 2019-1A, Class CLOU, 3.554% 20227,14,16 395 397Credit Acceptance Auto Loan Trust, Series 2020-1A, Class A, 2.01% 20297,16 2,964 3,016Drive Auto Receivables Trust, Series 2019-3, Class B, 2.65% 202416 307 308Drive Auto Receivables Trust, Series 2019-3, Class C, 2.90% 202516 820 836Drive Auto Receivables Trust, Series 2020-1, Class C, 2.36% 202616 2,262 2,304Drivetime Auto Owner Trust, Series 2019-3, Class B, 2.60% 20237,16 94 94
Asset Allocation Fund (continued)

128 American Funds Insurance Series
Bonds, notes & other debt instruments (continued)Principal amount
(000)Value(000)
Asset-backed obligations (continued)
Drivetime Auto Owner Trust, Series 2019-3, Class C, 2.74% 20257,16 $ 110 $ 111Dryden Senior Loan Fund, Series 2017-47A, Class A1R, CLO,
(3-month USD-LIBOR + 0.98%) 1.17% 20287,14,16 5,478 5,478EDvestinU Private Education Loan LLC, Series 2021-A, Class A, 1.80% 20457,16 485 487FirstKey Homes Trust, Series 2020-SFR2, Class A, 1.266% 20377,16 13,444 13,437Ford Credit Auto Owner Trust, Series 2017-1, Class A, 2.62% 20287,16 4,330 4,395Ford Credit Auto Owner Trust, Series 2018-2, Class A, 3.47% 20307,16 4,825 5,124Ford Credit Auto Owner Trust, Series 2018-1, Class A, 3.52% 20307,16 6,000 6,448Ford Credit Auto Owner Trust, Series 2020-1, Class A, 2.04% 20317,16 8,861 9,207Ford Credit Auto Owner Trust, Series 2018-1, Class A, 3.19% 20317,16 9,605 10,372GCI Funding I LLC, Series 2020-1, Class A, 2.82% 20457,16 868 884GCI Funding I LLC, Series 2020-1, Class B, 3.81% 20457,16 349 349Global SC Finance V SRL, Series 2019-1A, Class B, 4.81% 20397,16 2,987 3,144Global SC Finance V SRL, Series 2020-1A, Class A, 2.17% 20407,16 12,617 12,789Global SC Finance VII SRL, Series 2020-2A, Class A, 2.26% 20407,16 15,817 15,988Global SC Finance VII SRL, Series 2020-2A, Class B, 3.32% 20407,16 654 666Global SC Finance VII SRL, Series 2021-1A, Class A, 1.86% 20417,16 4,811 4,796Hertz Vehicle Financing LLC, Series 2021-1A, Class A, 1.21% 20257,16 8,452 8,485Hertz Vehicle Financing LLC, Series 2021-1A, Class B, 1.56% 20257,16 634 637Hertz Vehicle Financing LLC, Series 2021-1A, Class C, 2.05% 20257,16 405 407Hertz Vehicle Financing LLC, Series 2021-2A, Class A, 1.68% 20277,16 9,163 9,194Hertz Vehicle Financing LLC, Series 2021-2A, Class B, 2.12% 20277,16 685 689Hertz Vehicle Financing LLC, Series 2021-2A, Class C, 2.52% 20277,16 429 432Hertz Vehicle Financing LLC, Rental Car Asset-Backed Notes, Series 2017-2A, Class A,
3.29% 20237,16 241 242Hertz Vehicle Financing LLC, Rental Car Asset-Backed Notes, Series 2018-1A, Class A,
3.29% 20247,16 311 313Hertz Vehicle Financing LLC, Rental Car Asset-Backed Notes, Series 2018-3A, Class A,
4.03% 20247,16 118 118Hertz Vehicle Financing LLC, Rental Car Asset-Backed Notes, Series 2019-3A, Class A,
2.67% 20257,16 292 294Honda Auto Receivables Owner Trust, Series 2019-2, Class A3, 2.52% 202316 1,957 1,982Longfellow Place CLO, Ltd., Series 2013-1A, Class AR3,
(3-month USD-LIBOR + 1.00%) 1.184% 20297,14,16 4,048 4,048Madison Park Funding, Ltd., CLO, Series 2015-17A, Class AR2,
(3-month USD-LIBOR + 1.00%) 1.186% 20307,14,16 5,545 5,545Marathon CLO, Ltd., Series 2017-9A, Class A1AR,
(3-month USD-LIBOR + 1.15%) 1.334% 20297,14,16 4,230 4,230Mercury Financial, Series 2021-1A, Class A, 1.54% 20267,16 4,700 4,717Navient Student Loan Trust, Series 2021-C, Class A, 1.06% 20697,16 7,858 7,882Nelnet Student Loan Trust, Series 2021-A, Class APT1, 1.36% 20627,16 9,048 9,060Nelnet Student Loan Trust, Series 2021-BA, Class AFX, 1.42% 20627,16 14,949 15,002Newark BSL CLO 2, Ltd., Series 2017-1A, Class A1R,
(3-month USD-LIBOR + 0.97%) 1.146% 20307,14,16 1,765 1,765Palmer Square Loan Funding, CLO, Series 2020-4, Class A1,
(3-month USD-LIBOR + 1.00%) 1.147% 20287,14,16 2,682 2,685Palmer Square Loan Funding, CLO, Series 2021-1, Class A1,
(3-month USD-LIBOR + 0.90%) 1.055% 20297,14,16 769 769Race Point CLO, Ltd., Series 2015-9A, Class A1A2,
(3-month USD-LIBOR + 0.94%) 1.181% 20307,14,16 4,634 4,634Santander Drive Auto Receivables Trust, Series 2020-1, Class A3, 2.03% 202416 436 438Santander Drive Auto Receivables Trust, Series 2020-1, Class B, 3.03% 202416 345 352Santander Drive Auto Receivables Trust, Series 2020-1, Class C, 4.11% 202516 1,000 1,050SMB Private Education Loan Trust, Series 2021-A, Class A2A2,
(1-month USD-LIBOR + 0.73%) 0.823% 20537,14,16 7,547 7,617Sound Point CLO, Ltd., Series 2017-2A, Class AR,
(3-month USD-LIBOR + 0.98%) 1.156% 20307,14,16 3,233 3,233Sound Point CLO, Ltd., Series 2017-3A, Class A1R,
(3-month USD-LIBOR + 0.98%) 1.182% 20307,14,16 5,530 5,533Sound Point CLO, Ltd., Series 2015-1RA, Class AR,
(3-month USD-LIBOR + 1.08%) 1.264% 20307,14,16 2,985 2,985
Asset Allocation Fund (continued)

American Funds Insurance Series 129
Bonds, notes & other debt instruments (continued)Principal amount
(000)Value(000)
Asset-backed obligations (continued)
TALAdvantage V LLC, Series 2020-1A, Class A, 2.05% 20457,16 $ 2,195 $ 2,217TALAdvantage V LLC, Series 2020-1A, Class B, 3.29% 20457,16 246 251Textainer Marine Containers, Ltd., Series 2020-2A, Class A, 2.10% 20457,16 950 959Textainer Marine Containers, Ltd., Series 2021-1A, Class A, 1.68% 20467,16 1,054 1,045Textainer Marine Containers, Ltd., Series 2021-2A, Class A, 2.23% 20467,16 5,066 5,144Toyota Auto Loan Extended Note Trust, Series 2019-1, Class A, 2.56% 20317,16 3,250 3,429Toyota Auto Loan Extended Note Trust, Series 2020-1, Class A, 1.35% 20337,16 889 905Toyota Auto Loan Extended Note Trust, Series 2021-1, Class A, 1.07% 20347,14,16 7,257 7,269Triton Container Finance LLC, Series 2020-1A, Class A, 2.11% 20457,16 11,976 12,071Triton Container Finance LLC, Series 2021-1A, Class A, 1.86% 20467,16 3,221 3,210Westlake Automobile Receivables Trust, Series 2019-2A, Class B, 2.62% 20247,16 716 719Westlake Automobile Receivables Trust, Series 2019-2A, Class C, 2.84% 20247,16 1,390 1,410
310,904
Bonds & notes of governments & government agencies outside the U.S. 0.18%
Asian Development Bank 1.00% 2026 5,130 5,148CPPIB Capital, Inc. 2.25% 20227 4,286 4,336CPPIB Capital, Inc. 2.75% 20277 6,600 7,188KfW 2.125% 2022 375 380Manitoba (Province of) 3.05% 2024 2,600 2,780Morocco (Kingdom of) 3.00% 20327 3,000 2,905Morocco (Kingdom of) 4.00% 20507 3,000 2,790Peru (Republic of) 1.862% 2032 2,525 2,349Peru (Republic of) 2.78% 2060 3,775 3,377Qatar (State of) 3.375% 20247 2,315 2,486Qatar (State of) 4.00% 20297 745 859Qatar (State of) 4.817% 20497 750 968Quebec (Province of) 2.375% 2022 5,057 5,120Quebec (Province of) 2.75% 2027 9,000 9,768Saudi Arabia (Kingdom of) 3.25% 20307 1,750 1,888Saudi Arabia (Kingdom of) 5.25% 20507 1,000 1,312United Mexican States 2.659% 2031 2,703 2,647United Mexican States 3.771% 2061 1,528 1,425
57,726
Federal agency bonds & notes 0.11%
Fannie Mae 1.875% 2026 13,000 13,634Fannie Mae 0.875% 20309 23,958 22,723
36,357
Municipals 0.09%
Connecticut0.00%
Housing Fin. Auth., Housing Mortgage Fin. Program Bonds, Series 2014-C-1,4.00% 2044 25 26
Housing Fin. Auth., Housing Mortgage Fin. Program Bonds, Series 2014-A-1,4.00% 2044 20 21
47
Florida0.03%
Board of Administration Fin. Corp., Rev. Bonds, Series 2020-A, 1.705% 2027 5,335 5,425Board of Administration Fin. Corp., Rev. Bonds, Series 2020-A, 2.154% 2030 5,365 5,474
10,899
Illinois0.02%
G.O. Bonds, Pension Funding, Series 2003, Assured Guaranty Municipal insured,5.10% 2033 4,125 4,894
Asset Allocation Fund (continued)

130 American Funds Insurance Series
Bonds, notes & other debt instruments (continued)Principal amount
(000)Value(000)
Municipals (continued)
Maryland0.00%
Community Dev. Administration, Dept. of Housing and Community Dev.,Residential Rev. Ref. Bonds, Series 2014-E, 2.857% 2040 $ 30 $ 30
Minnesota0.00%
Housing Fin. Agcy., Residential Housing Fin. Bonds, Series 2014-A, 4.00% 2038 55 58
Nebraska0.00%
Investment Fin. Auth., Single Family Housing Rev. Bonds, Series 2013-A, 3.00% 2043 15 15
New York0.02%
Dormitory Auth., Taxable State Personal Income Tax Rev. Bonds (General Purpose),Series 2021-C, 1.187% 2026 2,865 2,870
Dormitory Auth., Taxable State Personal Income Tax Rev. Bonds (General Purpose),Series 2021-C, 1.748% 2028 4,745 4,773
7,643
Ohio0.02%
Cleveland-Cuyahoga Port Auth., Federal Lease Rev. Bonds(VA Cleveland Health Care Center Project), Series 2021, 4.425% 2031 5,200 5,458
South Carolina0.00%
Housing Fin. Auth., Mortgage Rev. Ref. Bonds, Series 2014, AMT, 4.00% 2041 20 21
South Dakota0.00%
Housing Dev. Auth., Homeownership Mortgage Bonds, Series 2014-F, 4.00% 2034 5 5
Tennessee0.00%
Housing Dev. Agcy., Residential Fin. Program Bonds, Series 2013-2-A,AMT, 4.00% 2043 10 10
Total municipals 29,080
Total bonds, notes & other debt instruments (cost: $6,574,324,000) 6,801,368
Short-term securities 7.54% Shares
Money market investments 7.47%
Capital Group Central Cash Fund 0.04%6,18 24,159,533 2,415,954
Asset Allocation Fund (continued)

American Funds Insurance Series 131
Short-term securities (continued) SharesValue(000)
Money market investments purchased with collateral from securities on loan 0.07%
Goldman Sachs Financial Square Government Fund, Institutional Shares 0.02%18,19 12,924,647 $ 12,924Capital Group Central Cash Fund 0.04%6,18,19 104,483 10,448Invesco Short-Term Investments Trust – Government & Agency Portfolio,
Institutional Class 0.03%18,19 68,626 69
23,441
Total short-term securities (cost: $2,439,255,000) 2,439,395
Total investment securities 103.98% (cost: $23,413,273,000) 33,634,369
Other assets less liabilities (3.98)% (1,288,428)
Net assets 100.00% $32,345,941
Futures contracts
Contracts TypeNumber ofcontracts Expiration
Notionalamount20
(000)
Value at6/30/202121
(000)
Unrealized(depreciation)appreciationat 6/30/2021
(000)
2 Year U.S. Treasury Note Futures Long 1,129 October 2021 $ 225,800 $ 248,741 $ (435)5 Year U.S. Treasury Note Futures Short 4,213 October 2021 (421,300) (520,009) 90110 Year U.S. Treasury Note Futures Short 990 September 2021 (99,000) (131,175) (415)10 Year Ultra U.S. Treasury Note Futures Short 1,742 September 2021 (174,200) (256,428) (3,097)20 Year U.S. Treasury Bond Futures Short 235 September 2021 (23,500) (37,776) (300)30 Year Ultra U.S. Treasury Bond Futures Short 207 September 2021 (20,700) (39,886) (517)
$(3,863)
Swap contracts
Interest rate swaps
Receive PayExpiration
dateNotional
(000)
Value at6/30/2021
(000)
Upfrontpremium
paid(000)
Unrealizedappreciationat 6/30/2021
(000)
U.S. EFFR 0.0795% 7/13/2025 $39,521 $862 $— $862
Credit default swaps
Centrally cleared credit default swaps on credit indices — buy protection
ReceivePay/Payment frequency
Expirationdate
Notional(000)
Value at6/30/2021
(000)
Upfrontpremiumreceived
(000)
Unrealizeddepreciationat 6/30/2021
(000)
CDX.NA.IG.36 1.00%/Quarterly 6/20/2026 $102,000 $(2,590) $(2,208) $(382)
Investments in affiliates6
Value ofaffiliates at1/1/2021
(000)Additions
(000)Reductions
(000)
Netrealized
gain (loss)(000)
Netunrealized
(depreciation)appreciation
(000)
Value ofaffiliates at6/30/2021
(000)
Dividendincome
(000)
Common stocks 0.55%Health care 0.03%
NuCana PLC (ADR)1 $ 13,367 $ — $ — $ — $ (5,120) $ 8,247 $ —
Asset Allocation Fund (continued)

132 American Funds Insurance Series
Investments in affiliates6 (continued)
Value ofaffiliates at1/1/2021
(000)Additions
(000)Reductions
(000)
Netrealized
gain (loss)(000)
Netunrealized
(depreciation)appreciation
(000)
Value ofaffiliates at6/30/2021
(000)
Dividendincome
(000)
Consumer discretionary 0.52%Kontoor Brands, Inc. $ 150,072 $ — $ 36,658 $14,043 $41,773 $ 169,230 $2,800
Total common stocks 177,477
Investment funds 5.20%Capital Group Central Corporate Bond Fund — 1,677,901 — — 3,297 1,681,198 259
Short-term securities 7.50%Money market investments 7.47%
Capital Group Central Cash Fund 0.04%18 2,273,691 2,311,312 2,168,827 (9) (213) 2,415,954 992
Money market investments purchased with collateral fromsecurities on loan 0.03%Capital Group Central Cash Fund 0.04%18,19 — 10,44822 10,448 —23
Total short-term securities 2,426,402
Total 13.25% $14,034 $39,737 $4,285,077 $4,051
1Security did not produce income during the last 12 months.2All or a portion of this security was on loan. The total value of all such securities was $25,453,000, which represented .08% of the net assets of the fund. Refer toNote 5 for more information on securities lending.
3Valued under fair value procedures adopted by authority of the board of trustees. The total value of all such securities was $41,116,000, which represented.13% of the net assets of the fund.
4Value determined using significant unobservable inputs.5Acquired through a private placement transaction exempt from registration under the Securities Act of 1933. May be subject to legal or contractual restrictionson resale. Further details on these holdings appear below.
6Affiliate of the fund or part of the same “group of investment companies“ as the fund, as defined under the Investment Company Act of 1940, as amended.7Acquired in a transaction exempt from registration under Rule 144A of the Securities Act of 1933. May be resold in the U.S. in transactions exempt fromregistration, normally to qualified institutional buyers. The total value of all such securities was $1,281,012,000, which represented 3.96% of the net assets ofthe fund.
8Amount less than one thousand.9All or a portion of this security was pledged as collateral. The total value of pledged collateral was $14,221,000, which represented .04% of the net assets ofthe fund.
10Index-linked bond whose principal amount moves with a government price index.11Step bond; coupon rate may change at a later date.12Scheduled interest and/or principal payment was not received.13Payment in kind; the issuer has the option of paying additional securities in lieu of cash. Most recent payment was 100% cash unless otherwise noted.14Coupon rate may change periodically. Reference rate and spread are as of the most recent information available. Some coupon rates are determined by theissuer or agent based on current market conditions; therefore, the reference rate and spread are not available.
15Loan participations and assignments; may be subject to legal or contractual restrictions on resale. The total value of all such loans was $15,993,000, whichrepresented .05% of the net assets of the fund.
16Principal payments may be made periodically. Therefore, the effective maturity date may be earlier than the stated maturity date.17Purchased on a TBA basis.18Rate represents the seven-day yield at 6/30/2021.19Security purchased with cash collateral from securities on loan. Refer to Note 5 for more information on securities lending.20Notional amount is calculated based on the number of contracts and notional contract size.21Value is calculated based on the notional amount and current market price.22Represents net activity. Refer to Note 5 for more information on securities lending.23Dividend income is included with securities lending income in the fund’s statement of operations and is not shown in this table.
Private placement securitiesAcquisition
dateCost(000)
Value(000)
Percentof netassets
Rotech Healthcare, Inc. 9/26/2013 $6,949 $19,795 .06%
Extraction Oil & Gas, Inc. 1/20/2021 555 1,184 .00
Total private placement securities $7,504 $20,979 .06%
Asset Allocation Fund (continued)

American Funds Insurance Series 133
Key to abbreviations and symbolADR = American Depositary ReceiptsAgcy. = AgencyAMT = Alternative Minimum TaxAuth. = AuthorityCAD = Canadian dollarsCLO = Collateralized Loan ObligationsCMO = Collateralized Mortgage ObligationsDAC = Designated Activity CompanyDept. = DepartmentDev. = DevelopmentEFFR = Effective Federal Funds RateFin. = FinanceG.O. = General ObligationLIBOR = London Interbank Offered RateRef. = RefundingRev. = RevenueSOFR = Secured Overnight Financing RateTBA = To-be-announcedUSD/$ = U.S. dollars
See notes to financial statements.
Asset Allocation Fund (continued)
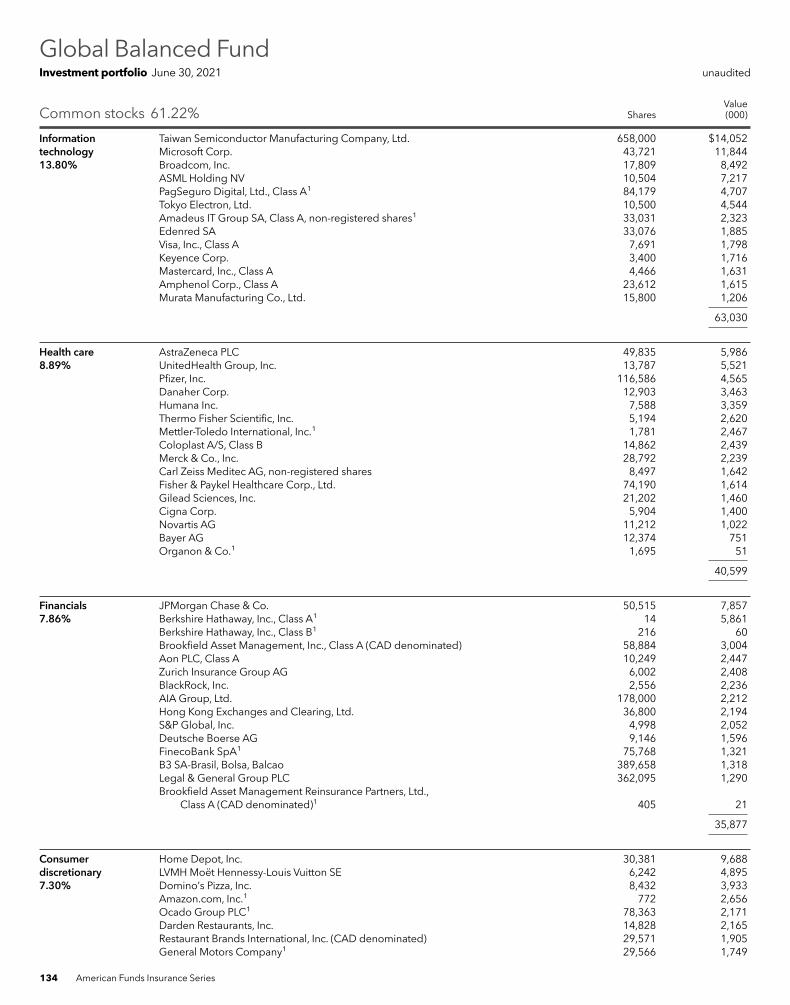
134 American Funds Insurance Series
Common stocks 61.22% SharesValue(000)
Informationtechnology13.80%
Taiwan Semiconductor Manufacturing Company, Ltd. 658,000 $14,052Microsoft Corp. 43,721 11,844Broadcom, Inc. 17,809 8,492ASML Holding NV 10,504 7,217PagSeguro Digital, Ltd., Class A1 84,179 4,707Tokyo Electron, Ltd. 10,500 4,544Amadeus IT Group SA, Class A, non-registered shares1 33,031 2,323Edenred SA 33,076 1,885Visa, Inc., Class A 7,691 1,798Keyence Corp. 3,400 1,716Mastercard, Inc., Class A 4,466 1,631Amphenol Corp., Class A 23,612 1,615Murata Manufacturing Co., Ltd. 15,800 1,206
63,030
Health care8.89%
AstraZeneca PLC 49,835 5,986UnitedHealth Group, Inc. 13,787 5,521Pfizer, Inc. 116,586 4,565Danaher Corp. 12,903 3,463Humana Inc. 7,588 3,359Thermo Fisher Scientific, Inc. 5,194 2,620Mettler-Toledo International, Inc.1 1,781 2,467Coloplast A/S, Class B 14,862 2,439Merck & Co., Inc. 28,792 2,239Carl Zeiss Meditec AG, non-registered shares 8,497 1,642Fisher & Paykel Healthcare Corp., Ltd. 74,190 1,614Gilead Sciences, Inc. 21,202 1,460Cigna Corp. 5,904 1,400Novartis AG 11,212 1,022Bayer AG 12,374 751Organon & Co.1 1,695 51
40,599
Financials7.86%
JPMorgan Chase & Co. 50,515 7,857Berkshire Hathaway, Inc., Class A1 14 5,861Berkshire Hathaway, Inc., Class B1 216 60Brookfield Asset Management, Inc., Class A (CAD denominated) 58,884 3,004Aon PLC, Class A 10,249 2,447Zurich Insurance Group AG 6,002 2,408BlackRock, Inc. 2,556 2,236AIA Group, Ltd. 178,000 2,212Hong Kong Exchanges and Clearing, Ltd. 36,800 2,194S&P Global, Inc. 4,998 2,052Deutsche Boerse AG 9,146 1,596FinecoBank SpA1 75,768 1,321B3 SA-Brasil, Bolsa, Balcao 389,658 1,318Legal & General Group PLC 362,095 1,290Brookfield Asset Management Reinsurance Partners, Ltd.,
Class A (CAD denominated)1 405 21
35,877
Consumerdiscretionary7.30%
Home Depot, Inc. 30,381 9,688LVMHMoët Hennessy-Louis Vuitton SE 6,242 4,895Domino’s Pizza, Inc. 8,432 3,933Amazon.com, Inc.1 772 2,656Ocado Group PLC1 78,363 2,171Darden Restaurants, Inc. 14,828 2,165Restaurant Brands International, Inc. (CAD denominated) 29,571 1,905General Motors Company1 29,566 1,749
Global Balanced FundInvestment portfolio June 30, 2021 unaudited

American Funds Insurance Series 135
Common stocks (continued) SharesValue(000)
Consumerdiscretionary(continued)
Booking Holdings, Inc.1 704 $ 1,540Industria de Diseño Textil, SA 32,265 1,137Stellantis NV 48,207 946Wynn Resorts, Ltd.1 4,407 539
33,324
Consumer staples6.71%
Nestlé SA 72,154 8,985Philip Morris International, Inc. 60,296 5,976Altria Group, Inc. 71,119 3,391KweichowMoutai Co., Ltd., Class A 10,500 3,342British American Tobacco PLC 76,169 2,950British American Tobacco PLC (ADR) 3,765 148Keurig Dr Pepper, Inc. 84,587 2,981Coca-Cola Europacific Partners PLC 17,523 1,039Budweiser Brewing Co. APAC, Ltd. 308,000 972Procter & Gamble Company 6,527 881
30,665
Industrials5.20%
SITC International Holdings Co., Ltd. 937,000 3,916Airbus SE, non-registered shares1 22,178 2,852Spirax-Sarco Engineering PLC 10,948 2,062Lockheed Martin Corp. 5,420 2,051SMC Corp. 3,100 1,832Nidec Corp. 15,200 1,761Watsco, Inc. 5,594 1,603MTU Aero Engines AG 6,193 1,534CSX Corp. 41,109 1,319BAE Systems PLC 170,770 1,233United Parcel Service, Inc., Class B 5,422 1,127Honeywell International, Inc. 4,767 1,046Union Pacific Corp. 4,256 936Boeing Company1 2,057 493
23,765
Materials2.99%
Croda International PLC 26,816 2,733Vale SA, ordinary nominative shares 118,297 2,694Givaudan SA 560 2,604Akzo Nobel NV 12,477 1,542LyondellBasell Industries NV 14,783 1,521Koninklijke DSM NV 7,351 1,372Rio Tinto PLC 14,634 1,204
13,670
Communicationservices2.76%
Alphabet, Inc., Class C1 1,456 3,649SoftBank Corp. 253,100 3,312Verizon Communications, Inc. 49,974 2,800Nintendo Co., Ltd. 3,800 2,210América Móvil, SAB de CV, Series L (ADR) 41,843 628
12,599
Global Balanced Fund (continued)

136 American Funds Insurance Series
Common stocks (continued) SharesValue(000)
Real estate2.51%
Crown Castle International Corp. REIT 15,806 $ 3,084Equinix, Inc. REIT 2,956 2,373American Tower Corp. REIT 6,662 1,800Longfor Group Holdings, Ltd. 318,500 1,784Gaming and Leisure Properties, Inc. REIT 36,680 1,699Shimao Group Holdings, Ltd. 290,000 711
11,451
Energy2.29%
TC Energy Corp. (CAD denominated) 57,287 2,835BP PLC 545,052 2,375Baker Hughes Co., Class A 73,987 1,692Chevron Corp. 13,291 1,392Pioneer Natural Resources Company 7,328 1,191Petróleo Brasileiro SA (Petrobras), ordinary nominative shares (ADR) 78,873 964
10,449
Utilities0.91%
Enel SpA 362,163 3,363Brookfield Infrastructure Partners LP 14,608 811
4,174
Total common stocks (cost: $174,263,000) 279,603
Preferred securities 0.37%
Informationtechnology0.37%
Samsung Electronics Co., Ltd., nonvoting preferred shares 25,715 1,683
Total preferred securities (cost: $1,314,000) 1,683
Convertible stocks 0.36%
Utilities0.36%
AES Corp., convertible preferred units, 6.875% 2024 15,300 1,646
Total convertible stocks (cost: $1,530,000) 1,646
Bonds, notes & other debt instruments 30.10%Principal amount
(000)
Bonds & notes of governments & government agencies outside the U.S. 14.04%
Abu Dhabi (Emirate of) 2.50% 20222 $ 200 206Abu Dhabi (Emirate of) 0.75% 20232 275 277Agricultural Development Bank of China 3.75% 2029 CNY550 86Agricultural Development Bank of China 2.96% 2030 4,350 645Australia (Commonwealth of), Series 152, 2.75% 2028 A$885 738Australia (Commonwealth of), Series 163, 1.00% 2031 660 470Australia (Commonwealth of), Series 162, 1.75% 2051 400 265Brazil (Federative Republic of) 0% 2021 BRL3,000 603Brazil (Federative Republic of) 6.00% 20243 3,000 651Canada 2.25% 2025 C$1,400 1,193Canada 0.25% 2026 570 445Canada 2.25% 2029 1,265 1,098China (People’s Republic of), Series 1916, 3.12% 2026 CNY8,650 1,349China (People’s Republic of), Series INBK, 2.85% 2027 7,000 1,072China (People’s Republic of), Series IMBK, 3.28% 2027 400 63China (People’s Republic of), Series 1906, 3.29% 2029 5,500 863China (People’s Republic of), Series 1910, 3.86% 2049 4,610 736China (People’s Republic of), Series INBK, 3.39% 2050 300 44China (People’s Republic of), Series INBK, 3.81% 2050 7,480 1,188China Development Bank Corp., Series 2008, 2.89% 2025 3,240 496
Global Balanced Fund (continued)

American Funds Insurance Series 137
Bonds, notes & other debt instruments (continued)Principal amount
(000)Value(000)
Bonds & notes of governments & government agencies outside the U.S. (continued)
China Development Bank Corp., Series 2004, 3.43% 2027 CNY1,060 $ 165China Development Bank Corp., Series 1805, 4.04% 2028 8,230 1,319China Development Bank Corp., Series 1805, 4.88% 2028 2,040 343China Development Bank Corp., Series 1905, 3.48% 2029 11,080 1,713Colombia (Republic of) 5.75% 2027 COP1,978,800 505Czech Republic 0% 2024 CZK1,000 44Czech Republic 1.25% 2025 13,000 599French Republic O.A.T. 0% 2030 € 1,320 1,561French Republic O.A.T. 3.25% 2045 160 296Germany (Federal Republic of) 0% 2025 822 1,001Germany (Federal Republic of) 0.25% 2029 600 748Germany (Federal Republic of) 0% 2030 642 782Germany (Federal Republic of) 0% 2036 1,300 1,529Germany (Federal Republic of) 0% 2050 655 714Greece (Hellenic Republic of) 3.375% 2025 300 401Greece (Hellenic Republic of) 3.75% 2028 280 406Greece (Hellenic Republic of) 3.875% 2029 270 400India (Republic of) 5.15% 2025 INR28,000 370Indonesia (Republic of), Series 78, 8.25% 2029 IDR4,301,000 331Indonesia (Republic of), Series 82, 7.00% 2030 1,000,000 71Indonesia (Republic of), Series 87, 6.50% 2031 2,010,000 138Indonesia (Republic of), Series 74, 7.50% 2032 597,000 44Indonesia (Republic of), Series 65, 6.625% 2033 1,493,000 103Israel (State of) 2.875% 2024 € 200 257Israel (State of) 1.50% 2027 100 128Italy (Republic of) 0.10% 20233 788 958Italy (Republic of) 0.95% 2027 246 303Italy (Republic of) 0.25% 2028 820 963Italy (Republic of) 1.35% 2030 660 829Japan, Series 134, 0.10% 2022 ¥ 16,000 144Japan, Series 17, 0.10% 20233 10,480 95Japan, Series 19, 0.10% 20243 30,420 278Japan, Series 18, 0.10% 20243 20,840 190Japan, Series 145, 0.10% 2025 98,050 891Japan, Series 21, 0.10% 20263 40,583 373Japan, Series 346, 0.10% 2027 173,250 1,577Japan, Series 22, 0.10% 20273 25,438 234Japan, Series 23, 0.10% 20283 66,456 614Japan, Series 24, 0.10% 20293 213,816 1,980Japan, Series 360, 0.10% 2030 368,900 3,343Japan, Series 152, 1.20% 2035 303,400 3,094Japan, Series 42, 1.70% 2044 94,100 1,061Japan, Series 37, 0.60% 2050 26,950 238Japan, Series 70, 0.70% 2051 13,050 118Malaysia (Federation of), Series 0119, 3.906% 2026 MYR1,380 351Malaysia (Federation of), Series 0417, 3.899% 2027 1,300 330Malaysia (Federation of), Series 0318, 4.642% 2033 400 105Malaysia (Federation of), Series 0418, 4.893% 2038 2,800 732Malaysia (Federation of), Series 0519, 3.757% 2040 1,650 374Malaysia (Federation of), Series 0216, 4.736% 2046 409 104Morocco (Kingdom of) 3.50% 2024 € 100 130Morocco (Kingdom of) 1.375% 2026 130 157Morocco (Kingdom of) 1.50% 2031 125 139Morocco (Kingdom of) 1.50% 2031 100 112National Highways Authority of India 7.17% 2021 INR30,000 410Netherlands (Kingdom of the) 5.50% 2028 € 100 165Norway (Kingdom of) 1.75% 2025 NKr4,500 537Nova Scotia (Province of) 3.15% 2051 C$170 151Peru (Republic of) 2.392% 2026 $ 90 93Philippines (Republic of) 0.001% 2024 ¥ 100,000 894Philippines (Republic of) 0.25% 2025 € 100 119
Global Balanced Fund (continued)

138 American Funds Insurance Series
Bonds, notes & other debt instruments (continued)Principal amount
(000)Value(000)
Bonds & notes of governments & government agencies outside the U.S. (continued)
Philippines (Republic of) 1.648% 2031 $ 200 $ 193Poland (Republic of), Series 1029, 2.75% 2029 PLN410 118Qatar (State of) 3.40% 20252 $ 200 218Romania 3.624% 2030 € 692 950Romania 3.624% 2030 225 309Romania 2.00% 2032 100 120Romania 2.00% 2033 540 637Romania 3.50% 2034 65 88Romania 3.875% 2035 170 237Romania 3.375% 2038 80 104Romania 4.625% 2049 39 59Romania 3.375% 2050 73 93Russian Federation 7.00% 2023 RUB16,600 228Russian Federation 2.875% 2025 € 200 260Russian Federation 2.875% 2025 100 130Russian Federation 4.25% 2027 $ 200 224Russian Federation 6.90% 2029 RUB25,250 344Russian Federation 7.65% 2030 38,320 546Russian Federation 5.90% 2031 5,620 71Russian Federation 8.50% 2031 5,530 83Russian Federation 7.70% 2033 23,030 330Russian Federation 7.25% 2034 8,140 113Saudi Arabia (Kingdom of) 2.894% 20222 $ 200 204Serbia (Republic of) 3.125% 2027 € 640 846Serbia (Republic of) 3.125% 2027 125 165South Korea (Republic of), Series 2209, 2.00% 2022 KRW560,000 503Spain (Kingdom of) 1.25% 2030 € 480 616Sri Lanka (Democratic Socialist Republic of) 6.25% 2021 $ 250 246Tunisia (Republic of) 6.75% 2023 € 150 173Ukraine 6.75% 2026 150 194Ukraine 6.876% 20292 $ 250 260United Kingdom 1.75% 2022 £ 280 395United Kingdom 2.75% 2024 50 75United Kingdom 0.375% 2030 730 976United Kingdom 4.75% 2030 460 870United Kingdom 4.25% 2032 280 525United Kingdom 4.50% 2034 225 447United Kingdom 0.625% 2035 675 879United Kingdom 3.25% 2044 250 484United Kingdom 0.625% 2050 95 112United Kingdom 1.25% 2051 114 158United Mexican States, Series M, 7.50% 2027 MXN20,240 1,059United Mexican States, Series M20, 8.50% 2029 11,500 635United Mexican States, Series M, 8.00% 2047 4,000 212
64,131
U.S. Treasury bonds & notes 10.53%
U.S. Treasury10.46%
U.S. Treasury 0.125% 2022 $ 7,085 7,082U.S. Treasury 1.875% 2022 700 707U.S. Treasury 0.125% 2023 790 790U.S. Treasury 0.375% 2025 10,167 9,984U.S. Treasury 0.75% 2026 2,075 2,066U.S. Treasury 0.875% 2026 454 454U.S. Treasury 2.25% 2027 300 321U.S. Treasury 2.875% 2028 1,275 1,416U.S. Treasury 2.875% 2028 700 779U.S. Treasury 0.625% 2030 2,640 2,467U.S. Treasury 0.625% 2030 650 606U.S. Treasury 0.875% 20304 12,375 11,766U.S. Treasury 1.625% 2031 375 381
Global Balanced Fund (continued)

American Funds Insurance Series 139
Bonds, notes & other debt instruments (continued)Principal amount
(000)Value(000)
U.S. Treasury bonds & notes (continued)
U.S. Treasury(continued)
U.S. Treasury 1.875% 2041 $ 1,345 $ 1,316U.S. Treasury 2.25% 2041 525 546U.S. Treasury 2.875% 2046 400 463U.S. Treasury 1.25% 2050 140 114U.S. Treasury 1.375% 20504 6,514 5,479U.S. Treasury 2.375% 2051 990 1,056
47,793
U.S. Treasuryinflation-protectedsecurities0.07%
U.S. Treasury Inflation-Protected Security 1.00% 20493 223 299
Total U.S. Treasury bonds & notes 48,092
Corporate bonds, notes & loans 4.67%
Financials1.42%
ACE INA Holdings, Inc. 2.875% 2022 10 10ACE INA Holdings, Inc. 3.35% 2026 10 11ACE INA Holdings, Inc. 4.35% 2045 20 25Allianz SE 4.75% perpetual bonds
(3-month EUR-EURIBOR + 3.60% on 10/24/2023)5 € 100 131Bank of America Corp. 0.976% 2025 (USD-SOFR + 0.69% on 4/22/2024)5 $ 200 201Bank of America Corp. 1.319% 2026 (USD-SOFR + 1.15% on 6/19/2025)5 500 501Bank of America Corp. 1.734% 2027 (USD-SOFR + 0.96% on 7/22/2026)5 160 161Bank of America Corp. 3.419% 2028 (3-month USD-LIBOR + 1.04% on 12/20/2027)5 236 257Bank of America Corp. 2.496% 2031 (3-month USD-LIBOR + 0.99% on 2/13/2030)5 20 21Citigroup, Inc. 0.981% 2025 (USD-SOFR + 0.669% on 5/1/2024)5 103 103Citigroup, Inc. 3.106% 2026 (USD-SOFR + 2.842% on 3/8/2026)5 175 187Citigroup, Inc. 1.462% 2027 (USD-SOFR + 0.67% on 6/9/2026)5 310 309Commonwealth Bank of Australia 2.688% 20312 225 225Goldman Sachs Group, Inc. 2.905% 2023
(3-month USD-LIBOR + 0.99% on 7/24/2022)5 130 133Goldman Sachs Group, Inc. 3.50% 2025 207 225Goldman Sachs Group, Inc. 2.615% 2032 (USD-SOFR + 1.281% on 4/22/2031)5 130 133Goldman Sachs Group, Inc. 1.00% 20332 € 210 250Goldman Sachs Group, Inc. 4.017% 2038
(3-month USD-LIBOR + 1.373% on 10/31/2037)5 $ 78 92Groupe BPCE SA 0.64% 2022 ¥100,000 902Groupe BPCE SA 5.70% 20232 $ 200 222Groupe BPCE SA 1.00% 2025 € 100 123HSBC Holdings PLC 4.292% 2026 (3-month USD-LIBOR + 1.348% on 9/12/2025)5 $ 200 223JPMorgan Chase & Co. 3.25% 2022 28 29JPMorgan Chase & Co. 1.578% 2027 (USD-SOFR + 0.885% on 4/22/2026)5 186 187JPMorgan Chase & Co. 4.493% 2031 (USD-SOFR + 3.79% on 3/24/2030)5 160 190Morgan Stanley 0.985% 2026 (USD-SOFR + 0.72% on 12/10/2025)5 200 197Morgan Stanley 3.125% 2026 110 119Morgan Stanley 1.593% 2027 (USD-SOFR + 0.879% on 5/4/2026)5 126 127Morgan Stanley 2.699% 2031 (USD-SOFR + 1.143% on 1/22/2030)5 72 75New York Life Insurance Company 3.75% 20502 23 26PNC Financial Services Group, Inc. 2.854% 20225 100 104Rabobank Nederland 3.875% 2023 € 100 128Royal Bank of Canada 1.20% 2026 $ 175 175Skandinaviska Enskilda Banken AB 2.80% 2022 250 254Wells Fargo & Company 2.393% 2028 (USD-SOFR + 2.10% on 6/2/2027)5 400 415
6,471
Utilities0.87%
Berkshire Hathaway Energy Company 3.70% 2030 25 28Berkshire Hathaway Energy Company 1.65% 2031 175 168CMS Energy Corp. 3.00% 2026 150 161Duke Energy Carolinas, LLC 3.05% 2023 280 292
Global Balanced Fund (continued)

140 American Funds Insurance Series
Bonds, notes & other debt instruments (continued)Principal amount
(000)Value(000)
Corporate bonds, notes & loans (continued)
Utilities(continued)
Duke Energy Progress, LLC 3.70% 2028 $ 75 $ 85Edison International 4.125% 2028 160 170Enel Finance International SA 2.75% 20232 200 208Enel Finance International SA 3.50% 20282 200 219Enersis Américas SA 4.00% 2026 35 38Exelon Corp. 3.40% 2026 150 163Exelon Corp., junior subordinated, 3.497% 20225 25 26FirstEnergy Corp. 3.50% 20282 35 38Interstate Power and Light Co. 2.30% 2030 50 51NextEra Energy Capital Holdings, Inc. 2.75% 2029 234 248NextEra Energy Capital Holdings, Inc. 2.25% 2030 478 482Niagara Mohawk Power Corp. 3.508% 20242 85 92Pacific Gas and Electric Co. 2.95% 2026 25 26Pacific Gas and Electric Co. 2.10% 2027 100 97Pacific Gas and Electric Co. 3.00% 2028 140 141Pacific Gas and Electric Co. 4.65% 2028 114 126Pacific Gas and Electric Co. 4.55% 2030 31 33Pacific Gas and Electric Co. 2.50% 2031 600 563Pacific Gas and Electric Co. 3.25% 2031 50 49Pacific Gas and Electric Co. 3.50% 2050 137 122State Grid Overseas Investment, Ltd. 1.25% 2022 € 100 120Xcel Energy, Inc. 3.35% 2026 $ 216 235
3,981
Communicationservices0.51%
AT&T, Inc. 2.75% 2031 375 390AT&T, Inc. 2.55% 20332 64 64Deutsche Telekom International Finance BV 9.25% 2032 45 73France Télécom 9.00% 20315 65 102KT Corp. 0.22% 2022 ¥100,000 899T-Mobile US, Inc. 2.05% 2028 $ 200 204Verizon Communications, Inc. 0.375% 2029 € 140 165Verizon Communications, Inc. 2.55% 2031 $ 325 332Verizon Communications, Inc. 0.75% 2032 € 100 117
2,346
Energy0.50%
Canadian Natural Resources, Ltd. 2.95% 2030 $ 161 167Enbridge, Inc. 4.25% 2026 70 79Enbridge, Inc. 3.70% 2027 45 50Enbridge, Inc. 3.40% 2051 39 39Energy Transfer Operating LP 5.00% 2050 315 365Halliburton Company 3.80% 2025 3 3MPLX LP 2.65% 2030 75 76MPLX LP 5.50% 2049 215 279ONEOK, Inc. 4.45% 2049 255 282Petróleos Mexicanos 7.19% 2024 MXN3,363 160Petróleos Mexicanos 7.47% 2026 5,330 240Qatar Petroleum 3.125% 20412 $ 270 269SA Global Sukuk, Ltd. 2.694% 20312 200 203Statoil ASA 3.70% 2024 50 54
2,266
Consumerdiscretionary0.35%
Amazon.com, Inc. 2.80% 2024 45 48Amazon.com, Inc. 1.20% 2027 50 50Amazon.com, Inc. 2.50% 2050 305 289Bayerische MotorenWerke AG 3.90% 20252 70 77Bayerische MotorenWerke AG 4.15% 20302 70 82DaimlerChrysler North America Holding Corp. 2.00% 20212 200 200
Global Balanced Fund (continued)

American Funds Insurance Series 141
Bonds, notes & other debt instruments (continued)Principal amount
(000)Value(000)
Corporate bonds, notes & loans (continued)
Consumerdiscretionary(continued)
General Motors Financial Co. 2.40% 2028 $150 $ 152Hyundai Capital America 3.25% 20222 65 67Hyundai Capital America 1.50% 20262 250 248Hyundai Capital America 2.375% 20272 109 112Hyundai Capital Services, Inc. 3.75% 20232 250 263Toyota Motor Credit Corp. 3.375% 2030 33 37
1,625
Health care0.29%
Aetna, Inc. 2.80% 2023 10 11Amgen, Inc. 1.90% 2025 40 42Amgen, Inc. 2.20% 2027 30 31AstraZeneca Finance LLC 2.25% 2031 9 9AstraZeneca PLC 3.50% 2023 150 159AstraZeneca PLC 3.00% 2051 36 37Becton, Dickinson and Company 2.894% 2022 47 48Becton, Dickinson and Company 3.734% 2024 35 38Becton, Dickinson and Company 3.70% 2027 43 48Becton, Dickinson and Company 2.823% 2030 28 29Cigna Corp. 4.125% 2025 80 90EMD Finance LLC 3.25% 20252 250 269Medtronic, Inc. 3.50% 2025 31 34Stryker Corp. 0.75% 2029 €210 255Takeda Pharmaceutical Company, Ltd. 2.25% 2026 100 131Thermo Fisher Scientific, Inc. 4.133% 2025 $ 84 93
1,324
Consumer staples0.29%
Altria Group, Inc. 1.00% 2023 €110 132Altria Group, Inc. 2.20% 2027 270 346Anheuser-Busch InBev NV 4.00% 2028 $100 114Anheuser-Busch InBev NV 4.75% 2029 220 262British American Tobacco PLC 3.215% 2026 62 66British American Tobacco PLC 3.557% 2027 105 113British American Tobacco PLC 3.462% 2029 75 79Keurig Dr Pepper, Inc. 4.597% 2028 175 206
1,318
Real estate0.19%
American Campus Communities, Inc. 3.75% 2023 100 105American Campus Communities, Inc. 4.125% 2024 90 98American Tower Corp. 0.875% 2029 €250 299Equinix, Inc. 2.15% 2030 $197 196Essex Portfolio LP 3.50% 2025 120 130Essex Portfolio LP 3.375% 2026 40 43
871
Informationtechnology0.13%
Broadcom, Inc. 3.15% 2025 17 18Broadcom, Inc. 4.15% 2030 70 79Broadcom, Inc. 3.419% 20332 53 56Microsoft Corp. 2.40% 2026 187 199Oracle Corp. 2.65% 2026 216 228
580
Global Balanced Fund (continued)

142 American Funds Insurance Series
Bonds, notes & other debt instruments (continued)Principal amount
(000)Value(000)
Corporate bonds, notes & loans (continued)
Industrials0.10%
Carrier Global Corp. 2.242% 2025 $ 36 $ 38Carrier Global Corp. 2.493% 2027 30 31CSX Corp. 3.80% 2050 6 7CSX Corp. 2.50% 2051 75 68Lima Metro Line 2 Finance, Ltd. 5.875% 20342 103 120United Technologies Corp. 4.125% 2028 170 196
460
Materials0.02%
Vale Overseas, Ltd. 3.75% 2030 94 100
Total corporate bonds, notes & loans 21,342
Mortgage-backed obligations 0.80%
Othermortgage-backedsecurities0.80%
Korea Housing Finance Corp. 2.00% 20212,6 250 251Nordea Kredit 0.50% 20406 DKr1,768 270Nykredit Realkredit AS, Series 01E, 1.50% 20376 652 108Nykredit Realkredit AS, Series 01E, 0.50% 20406 7,868 1,207Nykredit Realkredit AS, Series 01E, 1.50% 20406 1,653 272Nykredit Realkredit AS, Series 01E, 0.50% 20436 8,574 1,304Nykredit Realkredit AS, Series 01E, 0.50% 20506 1,441 213
3,625
Federal agencymortgage-backedobligations0.00%
Government National Mortgage Assn. Pool #MA5986 4.00% 20496 $ 12 13
Total mortgage-backed obligations 3,638
Municipals 0.04%
Ohio0.02%
Turnpike and Infrastructure Commission, Turnpike Rev. Ref. Bonds(Infrastructure Projects), Series 2020-A, 3.216% 2048 100 103
Texas0.02%
Grand Parkway Transportation Corp., Grand Parkway System Toll Rev. Ref. Bonds,Series 2020-B, 3.236% 2052 80 82
Total municipals 185
Asset-backed obligations 0.02%
OSW Structured Asset Trust, Series 2020-RPL1, Class A1, 3.072% 20592,6,7 87 87
Total bonds, notes & other debt instruments (cost: $136,749,000) 137,475
Short-term securities 7.76% Shares
Money market investments 6.48%
Capital Group Central Cash Fund 0.04%8,9 295,778 29,578
Weightedaverage yieldat acquisition
Principal amount(000)
U.S. Treasury bills 1.10%
U.S. Treasury 4/21/2022 0.047% $ 5,000 4,997
Global Balanced Fund (continued)

American Funds Insurance Series 143
Short-term securities (continued)
Weightedaverage yieldat acquisition
Principal amount(000)
Value(000)
Bills & notes of governments & government agencies outside the U.S. 0.18%
Egyptian Treasury 7/20/2021 11.721% EGP1,700 $ 108Egyptian Treasury 10/19/2021 11.994 1,700 104Egyptian Treasury 10/26/2021 12.115 8,600 526Egyptian Treasury 1/4/2022 12.011 1,700 101
839
Total short-term securities (cost: $35,417,000) 35,414
Total investment securities 99.81% (cost: $349,273,000) 455,821
Other assets less liabilities 0.19% 863
Net assets 100.00% $456,684
Futures contracts
Contracts TypeNumber ofcontracts Expiration
Notionalamount10
(000)
Value at6/30/202111
(000)
Unrealizedappreciation
(depreciation)at 6/30/2021
(000)
90 Day Euro Dollar Futures Short 77 September 2022 $(19,250) $(19,180) $ 790 Day Euro Dollar Futures Long 77 September 2023 19,250 19,057 (12)5 Year U.S. Treasury Note Futures Long 27 October 2021 2,700 3,333 —12
10 Year Italy Government Bond Futures Short 3 September 2021 € (300) (539) 310 Year Euro-Bund Futures Short 8 September 2021 (800) (1,637) (7)10 Year Ultra U.S. Treasury Note Futures Short 10 September 2021 $ (1,000) (1,472) (21)20 Year U.S. Treasury Bond Futures Long 2 September 2021 200 322 2
$(28)
Forward currency contracts
Contract amount
CounterpartySettlement
date
Unrealized(depreciation)appreciationat 6/30/2021
(000)Purchases
(000)Sales(000)
USD494 EUR420 Citibank 7/1/2021 $ (4)EUR420 USD505 Goldman Sachs 7/1/2021 (6)USD112 TRY950 Bank of America 7/6/2021 3TRY950 USD108 Bank of America 7/6/2021 —12
USD563 CZK11,700 HSBC Bank 7/12/2021 19USD411 NZD570 HSBC Bank 7/12/2021 12USD449 EUR370 Goldman Sachs 7/12/2021 10USD272 AUD350 HSBC Bank 7/12/2021 9USD603 MXN11,865 HSBC Bank 7/12/2021 9USD574 ILS1,860 HSBC Bank 7/12/2021 3GBP200 EUR232 Citibank 7/12/2021 2USD338 JPY37,360 Bank of New York Mellon 7/12/2021 2
USD1,009 EUR850 Goldman Sachs 7/12/2021 1USD334 JPY36,960 HSBC Bank 7/12/2021 1CAD10 USD8 Morgan Stanley 7/12/2021 —12
USD56 CNH360 Standard Chartered Bank 7/12/2021 —12
EUR1,538 DKK11,440 Goldman Sachs 7/12/2021 —12
CZK11,700 EUR461 HSBC Bank 7/12/2021 (2)CNH1,660 USD259 Citibank 7/12/2021 (3)
JPY101,100 USD920 Bank of America 7/12/2021 (10)
Global Balanced Fund (continued)

144 American Funds Insurance Series
Forward currency contracts (continued)
Contract amount
CounterpartySettlement
date
Unrealized(depreciation)appreciationat 6/30/2021
(000)Purchases
(000)Sales(000)
JPY129,600 USD1,187 Goldman Sachs 7/12/2021 $ (20)EUR3,076 USD3,755 Citibank 7/12/2021 (107)
USD11 RUB800 Citibank 7/14/2021 —12
USD823 KRW933,600 Citibank 7/15/2021 (3)EUR449 NOK4,630 Morgan Stanley 7/15/2021 (5)
KRW933,600 USD838 Standard Chartered Bank 7/15/2021 (11)USD424 EUR350 Goldman Sachs 7/16/2021 9USD630 JPY69,100 Goldman Sachs 7/16/2021 8USD560 JPY61,590 Bank of America 7/16/2021 5USD179 EUR150 Bank of New York Mellon 7/16/2021 2USD285 EUR240 Goldman Sachs 7/16/2021 —12
AUD340 USD263 Citibank 7/16/2021 (8)USD1,392 CAD1,690 Morgan Stanley 7/19/2021 29USD1,014 GBP720 UBS AG 7/19/2021 18USD465 CAD570 UBS AG 7/19/2021 5USD231 COP855,000 Standard Chartered Bank 7/19/2021 3
SEK1,830 USD220 Standard Chartered Bank 7/19/2021 (6)CAD680 USD558 HSBC Bank 7/19/2021 (10)
KRW1,421,430 USD1,255 Standard Chartered Bank 7/20/2021 3USD654 BRL3,300 Citibank 7/20/2021 (8)EUR545 CZK13,940 Standard Chartered Bank 7/21/2021 (2)USD191 COP713,000 Bank of America 7/22/2021 2USD225 AUD300 Citibank 7/22/2021 —12
USD256 MXN5,320 Bank of America 7/22/2021 (10)USD387 MYR1,606 Standard Chartered Bank 7/23/2021 —12
USD65 MYR272 Standard Chartered Bank 7/23/2021 —12
USD465 MYR1,941 Standard Chartered Bank 7/23/2021 (2)USD560 BRL2,788 Standard Chartered Bank 7/27/2021 1
USD1,100 GBP790 HSBC Bank 7/28/2021 7USD1,020 EUR840 Standard Chartered Bank 9/20/2021 22USD421 INR31,100 Bank of New York Mellon 9/23/2021 8
$ (24)
Swap contracts
Interest rate swaps
Receive PayExpiration
dateNotional
(000)
Value at6/30/2021
(000)
Upfrontpremium
paid(000)
Unrealizedappreciation
(depreciation)at 6/30/2021
(000)
3-month AUD-BBSW 0.29% 3/4/2024 A$1,590 $ 4 $— $ 40.3653% 3-month USD-LIBOR 3/5/2024 $1,230 (4) — (4)(0.4545)% 6-month EURIBOR 4/1/2024 €3,500 (5) — (5)6.14% 28-day MXN-TIIE 6/8/2026 MXN2,600 (3) — (3)6.115% 28-day MXN-TIIE 6/8/2026 2,600 (3) — (3)6.12% 28-day MXN-TIIE 6/8/2026 4,000 (4) — (4)6.13% 28-day MXN-TIIE 6/8/2026 9,200 (9) — (9)6.16% 28-day MXN-TIIE 6/9/2026 5,200 (5) — (5)6.15% 28-day MXN-TIIE 6/9/2026 5,300 (5) — (5)6.195% 28-day MXN-TIIE 6/10/2026 2,700 (2) — (2)6.23% 28-day MXN-TIIE 6/10/2026 2,700 (2) — (2)6.36% 28-day MXN-TIIE 6/12/2026 2,300 (1) — (1)6.633% 28-day MXN-TIIE 6/25/2026 8,900 1 — 1
Global Balanced Fund (continued)

American Funds Insurance Series 145
Swap contracts (continued)
Interest rate swaps (continued)
Receive PayExpiration
dateNotional
(000)
Value at6/30/2021
(000)
Upfrontpremium
paid(000)
Unrealizedappreciation
(depreciation)at 6/30/2021
(000)
6.6175% 28-day MXN-TIIE 6/25/2026 MXN8,600 $ 1 $— $ 16.64% 28-day MXN-TIIE 6/25/2026 3,200 —12 — —12
6.585% 28-day MXN-TIIE 6/25/2026 2,600 —12 — —12
6.59% 28-day MXN-TIIE 6/25/2026 2,000 —12 — —12
6.58% 28-day MXN-TIIE 6/25/2026 11,300 —12 — —12
1.72375% 6-month AUD-BBSW 3/4/2031 A$600 7 — 73-month USD-LIBOR 1.4822% 3/5/2031 $ 450 (4) — (4)6-month EURIBOR 0.5092% 4/1/2051 € 370 (4) — (4)
$— $(38)
Credit default swaps
Centrally cleared credit default swaps on credit indices — buy protection
ReceivePay/Payment frequency
Expirationdate
Notional(000)
Value at6/30/2021
(000)
Upfrontpremiumreceived
(000)
Unrealizeddepreciationat 6/30/2021
(000)
ITRXEUR.IG.35 1.00%/Quarterly 6/20/2026 $1,210 $(39) $(34) $(5)
Investments in affiliates9
Value ofaffiliate at1/1/2021
(000)Additions
(000)Reductions
(000)
Netrealized
loss(000)
Netunrealized
depreciation(000)
Value ofaffiliate at6/30/2021
(000)
Dividendincome
(000)
Short-term securities 6.48%Money market investments 6.48%
Capital Group Central Cash Fund 0.04%8 $24,329 $99,850 $94,598 $—12 $(3) $29,578 $12
1Security did not produce income during the last 12 months.2Acquired in a transaction exempt from registration under Rule 144A of the Securities Act of 1933. May be resold in the U.S. in transactions exempt fromregistration, normally to qualified institutional buyers. The total value of all such securities was $4,813,000, which represented 1.05% of the net assets of thefund.
3Index-linked bond whose principal amount moves with a government price index.4All or a portion of this security was pledged as collateral. The total value of pledged collateral was $261,000, which represented .06% of the net assets of thefund.
5Step bond; coupon rate may change at a later date.6Principal payments may be made periodically. Therefore, the effective maturity date may be earlier than the stated maturity date.7Coupon rate may change periodically. Reference rate and spread are as of the most recent information available. Some coupon rates are determined by theissuer or agent based on current market conditions; therefore, the reference rate and spread are not available.
8Rate represents the seven-day yield at 6/30/2021.9Part of the same “group of investment companies“ as the fund as defined under the Investment Company Act of 1940, as amended.
10Notional amount is calculated based on the number of contracts and notional contract size.11Value is calculated based on the notional amount and current market price.12Amount less than one thousand.
Global Balanced Fund (continued)

146 American Funds Insurance Series
Key to abbreviations and symbolsADR = American Depositary Receipts JPY/¥ = Japanese yenAUD/A$ = Australian dollars KRW = South Korean wonBBSW = Bank Bill Swap Rate LIBOR = London Interbank Offered RateBRL = Brazilian reais MXN =Mexican pesosCAD = Canadian dollars MYR = Malaysian ringgitsCNH/CNY = Chinese yuan renminbi NOK = Norwegian kronerCOP = Colombian pesos NZD = New Zealand dollarsCZK = Czech korunas Ref. = RefundingDKK/DKr = Danish kroner Rev. = RevenueEGP = Egyptian pounds RUB = Russian rublesEUR/€ = Euros SEK = Swedish kronorEURIBOR = Euro Interbank Offered Rate SOFR = Secured Overnight Financing RateGBP/£ = British pounds TIIE = Equilibrium Interbank Interest RateILS = Israeli shekels TRY = Turkish liraINR = Indian rupees USD/$ = U.S. dollars
See notes to financial statements.
Global Balanced Fund (continued)

American Funds Insurance Series 147
Bonds, notes & other debt instruments 97.05%Principal amount
(000)Value(000)
U.S. Treasury bonds & notes 49.60%
U.S. Treasury43.43%
U.S. Treasury 0.125% 2023 $ 39,035 $ 38,953U.S. Treasury 2.625% 2023 70,000 73,961U.S. Treasury 2.75% 2023 73,600 77,001U.S. Treasury 0.25% 2024 250,000 249,007U.S. Treasury 0.25% 2024 224,500 223,123U.S. Treasury 0.375% 2024 712,000 711,116U.S. Treasury 2.125% 2024 72,100 75,839U.S. Treasury 2.125% 20241 72,100 75,732U.S. Treasury 0.375% 2025 200,000 196,213U.S. Treasury 2.875% 20251 96,200 104,594U.S. Treasury 2.875% 2025 72,100 78,201U.S. Treasury 0.375% 2026 100,000 98,008U.S. Treasury 0.75% 2026 657,335 654,033U.S. Treasury 0.75% 2026 489,405 486,656U.S. Treasury 1.375% 20261 75,000 76,785U.S. Treasury 1.625% 2026 50,000 51,809U.S. Treasury 0.50% 2027 165,625 160,644U.S. Treasury 0.50% 2027 160,000 154,294U.S. Treasury 2.25% 20271 120,200 128,577U.S. Treasury 2.25% 20271 72,100 77,064U.S. Treasury 6.125% 2027 24,000 31,448U.S. Treasury 1.25% 2028 79,480 79,683U.S. Treasury 2.875% 2028 72,100 80,183U.S. Treasury 1.625% 2031 492,869 500,539U.S. Treasury 1.125% 2040 88,288 76,155U.S. Treasury 1.375% 2040 40,000 35,893U.S. Treasury 1.875% 2041 75,500 73,850U.S. Treasury 2.25% 2041 47,425 49,323U.S. Treasury 3.00% 20491 150,000 179,231U.S. Treasury 1.25% 2050 44,000 35,852U.S. Treasury 1.375% 2050 73,237 61,598U.S. Treasury 1.875% 20511 640,504 610,023U.S. Treasury 2.375% 2051 65,775 70,192
5,675,580
U.S. Treasuryinflation-protectedsecurities6.17%
U.S. Treasury Inflation-Protected Security 0.125% 20232 159,150 166,309U.S. Treasury Inflation-Protected Security 0.625% 20232 54,472 57,627U.S. Treasury Inflation-Protected Security 0.125% 20242 37,000 39,908U.S. Treasury Inflation-Protected Security 0.125% 20242 17,911 19,265U.S. Treasury Inflation-Protected Security 0.50% 20242 13,112 14,139U.S. Treasury Inflation-Protected Security 0.625% 20242 16,760 18,055U.S. Treasury Inflation-Protected Security 0.125% 20262 115,135 125,370U.S. Treasury Inflation-Protected Security 0.375% 20271,2 81,856 91,397U.S. Treasury Inflation-Protected Security 0.50% 20281,2 81,177 91,043U.S. Treasury Inflation-Protected Security 0.125% 20312 94,971 104,570U.S. Treasury Inflation-Protected Security 0.125% 20512 71,014 77,845
805,528
Total U.S. Treasury bonds & notes 6,481,108
Corporate bonds, notes & loans 30.36%
Financials6.00%
ACE INA Holdings, Inc. 2.875% 2022 3,625 3,733ACE INA Holdings, Inc. 3.35% 2026 2,025 2,225ACE INA Holdings, Inc. 4.35% 2045 2,220 2,810AerCap Holdings NV 6.50% 2025 1,798 2,110Ally Financial, Inc. 5.125% 2024 1,500 1,691Ally Financial, Inc. 8.00% 2031 8,479 11,940Ally Financial, Inc. 8.00% 2031 7,070 10,169
TheBondFundof America (formerly Bond Fund)
Investment portfolio June 30, 2021 unaudited

148 American Funds Insurance Series
Bonds, notes & other debt instruments (continued)Principal amount
(000)Value(000)
Corporate bonds, notes & loans (continued)
Financials(continued)
American International Group, Inc. 4.20% 2028 $ 9,875 $11,374Arthur J. Gallagher & Co. 2.50% 2031 1,354 1,369Arthur J. Gallagher & Co. 3.50% 2051 1,073 1,126Banco Do Brasil, SA 4.75% 20243 1,400 1,496Bank of America Corp. 1.658% 2027 (USD-SOFR + 0.91% on 3/11/2026)4 981 989Bank of America Corp. 1.734% 2027 (USD-SOFR + 0.96% on 7/22/2026)4 3,194 3,220Bank of America Corp. 3.419% 2028 (3-month USD-LIBOR + 1.04% on 12/20/2027)4 10,129 11,039Bank of America Corp. 2.087% 2029 (USD-SOFR + 1.06% on 6/14/2028)4 682 688Bank of America Corp. 1.922% 2031 (USD-SOFR + 1.37% on 10/24/2030)4 21,177 20,659Bank of America Corp. 2.687% 2032 (USD-SOFR + 1.32% on 4/22/2031)4 10,318 10,622Bank of China, Ltd. (Hong Kong Branch) 3.875% 2025 236 258Bank of China, Ltd. (Hong Kong Branch) 4.00% 2028 200 223Bank of Nova Scotia 1.35% 2026 3,345 3,347Berkshire Hathaway Finance Corp. 4.20% 2048 8,720 10,794BNP Paribas 3.80% 20243 18,775 20,150BNP Paribas 2.819% 2025 (3-month USD-LIBOR + 1.111% on 11/19/2024)3,4 2,875 3,026BNP Paribas 3.375% 20253 6,425 6,897BNP Paribas 2.219% 2026 (USD-SOFR + 2.074% on 6/9/2025)3,4 12,000 12,376BNP Paribas 1.323% 2027 (USD-SOFR + 1.004% on 1/13/2026)3,4 8,425 8,329BNP Paribas 2.871% 2032 (USD-SOFR + 1.387% on 4/19/2032)3,4 3,475 3,571CIT Group, Inc. 3.929% 2024 (USD-SOFR + 3.827% on 6/19/2023)4 5,410 5,717CIT Group, Inc. 4.75% 2024 2,066 2,245Citigroup, Inc. 4.60% 2026 1,800 2,050Citigroup, Inc. 1.462% 2027 (USD-SOFR + 0.67% on 6/9/2026)4 8,740 8,713Crédit Agricole SA 1.907% 2026 (USD-SOFR + 1.676% on 6/16/2025)3,4 4,450 4,539Crédit Agricole SA 1.247% 2027 (USD-SOFR + 0.892% on 1/26/2026)3,4 3,400 3,349Credit Suisse Group AG 2.997% 2023
(3-month USD-LIBOR + 1.20% on 12/14/2022)3,4 12,000 12,396Credit Suisse Group AG 3.80% 2023 12,925 13,703Credit Suisse Group AG 4.207% 2024 (3-month USD-LIBOR + 1.24% on 6/12/2023)3,4 500 533Credit Suisse Group AG 2.593% 2025 (USD-SOFR + 1.56% on 9/11/2024)3,4 850 885Credit Suisse Group AG 2.193% 2026 (USD-SOFR + 2.044% on 6/5/2025)3,4 5,750 5,891Credit Suisse Group AG 1.305% 2027 (USD-SOFR + 0.98% on 2/2/2026)3,4 10,950 10,736Credit Suisse Group AG 4.194% 2031 (USD-SOFR + 3.73% on 4/1/2030)3,4 3,096 3,482Credit Suisse Group AG 3.091% 2032 (USD-SOFR + 1.73% on 5/14/2031)3,4 6,123 6,322Deutsche Bank AG 4.25% 2021 525 531Deutsche Bank AG 3.30% 2022 2,695 2,793Deutsche Bank AG 5.00% 2022 2,675 2,748Deutsche Bank AG 3.95% 2023 6,350 6,670Deutsche Bank AG 0.898% 2024 2,500 2,490Deutsche Bank AG 2.222% 2024 (USD-SOFR + 2.159% on 9/18/2023)4 10,475 10,762Deutsche Bank AG 3.70% 2024 4,950 5,308Deutsche Bank AG 3.70% 2024 2,750 2,955Deutsche Bank AG 3.961% 2025 (USD-SOFR + 2.581% on 11/26/2024)4 8,586 9,288Deutsche Bank AG 2.129% 2026 (USD-SOFR + 1.87% on 11/24/2025)4 42,264 42,915Deutsche Bank AG 4.10% 2026 7,305 8,016Deutsche Bank AG 4.10% 2026 857 941Deutsche Bank AG 3.547% 2031 (USD-SOFR + 3.043% on 9/18/2030)4 2,900 3,090Deutsche Bank AG 3.035% 2032 (USD-SOFR + 1.718% on 5/28/2031)4 2,100 2,140Deutsche Bank AG 3.729% 2032 (USD-SOFR + 2.757% on 1/14/2031)4 4,000 4,075DNB Bank ASA 1.535% 2027
(5-year UST Yield Curve Rate T Note Constant Maturity + 0.72% on 5/25/2026)3,4 1,200 1,203GE Capital Funding, LLC 4.05% 2027 5,078 5,751GE Capital Funding, LLC 4.40% 2030 10,000 11,662Goldman Sachs Group, Inc. 5.75% 2022 4,800 4,949Goldman Sachs Group, Inc. 1.431% 2027 (USD-SOFR + 0.795% on 3/9/2026)4 3,030 3,023Goldman Sachs Group, Inc. 1.542% 2027 (USD-SOFR + 0.818% on 9/10/2026)4 13,275 13,254Goldman Sachs Group, Inc. 3.814% 2029
(3-month USD-LIBOR + 1.158% on 4/23/2028)4 9,600 10,748
TheBondFundof America (formerly Bond Fund) (continued)

American Funds Insurance Series 149
Bonds, notes & other debt instruments (continued)Principal amount
(000)Value(000)
Corporate bonds, notes & loans (continued)
Financials(continued)
Goldman Sachs Group, Inc. 2.615% 2032 (USD-SOFR + 1.281% on 4/22/2031)4 $ 7,605 $ 7,774Goldman Sachs Group, Inc., Series O, 5.30% junior subordinated perpetual bonds
(3-month USD-LIBOR + 3.834% on 11/10/2026)4 1,750 1,966Groupe BPCE SA 2.75% 20233 6,875 7,128Groupe BPCE SA 5.70% 20233 28,166 31,198Groupe BPCE SA 5.15% 20243 5,481 6,109Groupe BPCE SA 1.652% 2026 (USD-SOFR + 1.52% on 10/6/2025)3,4 6,350 6,382HSBC Holdings PLC 4.583% 2029 (3-month USD-LIBOR + 1.535% on 6/19/2028)4 12,000 13,878HSBC Holdings PLC 2.804% 2032 (USD-SOFR + 1.187% on 5/24/2031)4 6,490 6,665Huarong Finance II Co., Ltd. 5.00% 2025 280 202Huarong Finance II Co., Ltd. 5.50% 2025 200 149Huarong Finance II Co., Ltd. 4.875% 2026 882 622Intesa Sanpaolo SpA 3.375% 20233 10,035 10,452Intesa Sanpaolo SpA 3.25% 20243 770 820Intesa Sanpaolo SpA 5.017% 20243 68,143 74,180Intesa Sanpaolo SpA 5.71% 20263 15,400 17,430Intesa Sanpaolo SpA 3.875% 20273 6,250 6,800Intesa Sanpaolo SpA 3.875% 20283 1,986 2,150JPMorgan Chase & Co. 0.969% 2025 (USD-SOFR + 0.58% on 6/23/2024)4 5,870 5,880JPMorgan Chase & Co. 1.578% 2027 (USD-SOFR + 0.885% on 4/22/2026)4 3,088 3,105JPMorgan Chase & Co. 2.069% 2029 (USD-SOFR + 1.015% on 6/1/2028)4 2,453 2,475JPMorgan Chase & Co. 3.509% 2029 (3-month USD-LIBOR + 0.945% on 1/23/2028)4 9,600 10,589JPMorgan Chase & Co. 4.203% 2029 (3-month USD-LIBOR + 1.26% on 7/23/2028)4 11,980 13,778JPMorgan Chase & Co. 2.522% 2031 (USD-SOFR + 2.04% on 4/22/2030)4 1,766 1,819JPMorgan Chase & Co. 2.58% 2032 (USD-SOFR + 1.25% on 4/22/2031)4 4,802 4,932Lloyds Banking Group PLC 2.438% 2026
(1-year UST Yield Curve Rate T Note Constant Maturity + 1.00% on 2/5/2025)4 2,675 2,791Lloyds Banking Group PLC 4.375% 2028 8,825 10,146MetLife Capital Trust IV, junior subordinated, 7.875% 2067
(3-month USD-LIBOR + 3.96% on 12/1/2037)3,4 1,405 1,960MetLife, Inc. 3.60% 2025 3,490 3,862Morgan Stanley 2.72% 2025 (USD-SOFR + 1.152% on 7/22/2024)4 2,300 2,420OneMain Holdings, Inc. 7.125% 2026 250 292PNC Financial Services Group, Inc. 2.854% 20224 5,850 6,054PNC Funding Corp. 3.30% 2022 8,700 8,861Rede D’Or Finance SARL 4.50% 20303 3,000 3,084Santander Holdings USA, Inc. 3.50% 2024 8,325 8,910Synchrony Financial 2.85% 2022 5,400 5,529Synchrony Financial 4.375% 2024 3,640 3,964Travelers Companies, Inc. 2.55% 2050 768 743UniCredit SpA 3.75% 20223 2,545 2,607UniCredit SpA 6.572% 20223 11,295 11,645UniCredit SpA 4.625% 20273 1,395 1,567UniCredit SpA 5.861% 2032 (5-year USD-ICE Swap + 3.703% on 6/19/2027)3,4 16,130 17,831UniCredit SpA 7.296% 2034 (5-year USD-ICE Swap + 4.914% on 4/2/2029)3,4 10,221 12,302UniCredit SpA 5.459% 2035 (5-year USD-ICE Swap + 4.75% on 6/30/2030)3,4 606 661Wells Fargo & Company 2.10% 2021 16,800 16,822Wells Fargo & Company 0.805% 2025 (USD-SOFR + 0.51% on 5/19/2024)4 1,818 1,815Wells Fargo & Company 2.406% 2025
(3-month USD-LIBOR + 0.825% on 10/30/2024)4 20,480 21,437
783,890
Energy4.86%
Antero Resources Corp. 5.375% 20303 280 286Apache Corp. 4.625% 2025 645 698Apache Corp. 4.875% 2027 5,475 5,937Apache Corp. 4.25% 2030 2,465 2,604Apache Corp. 4.75% 2043 12,100 12,607Apache Corp. 4.25% 2044 2,100 2,060
TheBondFundof America (formerly Bond Fund) (continued)

150 American Funds Insurance Series
Bonds, notes & other debt instruments (continued)Principal amount
(000)Value(000)
Corporate bonds, notes & loans (continued)
Energy(continued)
Apache Corp. 5.35% 2049 $ 800 $ 843BP Capital Markets PLC 3.00% 2050 8,284 8,025Canadian Natural Resources, Ltd. 2.05% 2025 754 775Canadian Natural Resources, Ltd. 3.85% 2027 1,151 1,268Canadian Natural Resources, Ltd. 2.95% 2030 1,113 1,155Cenovus Energy, Inc. 3.80% 2023 1,120 1,182Cenovus Energy, Inc. 5.375% 2025 5,000 5,724Cenovus Energy, Inc. 4.25% 2027 13,897 15,542Cenovus Energy, Inc. 5.25% 2037 770 923Cenovus Energy, Inc. 5.40% 2047 15,180 18,825Cheniere Energy, Inc. 7.00% 2024 410 470Cheniere Energy, Inc. 5.125% 2027 16,000 18,622Cheniere Energy, Inc. 3.70% 2029 7,369 8,056Chevron Corp. 2.355% 2022 4,800 4,916Columbia Pipeline Partners LP 5.80% 2045 1,410 1,909ConocoPhillips 4.30% 20283 3,973 4,616DCP MidstreamOperating LP 4.95% 2022 500 511Devon Energy Corp. 4.50% 20303 5,197 5,718Diamondback Energy, Inc. 4.40% 2051 2,600 2,935DTMidstream, Inc. 4.125% 20293 555 564Enbridge Energy Partners LP 5.875% 2025 7,700 9,093Enbridge Energy Partners LP 7.375% 2045 18,154 28,592Enbridge, Inc. 4.00% 2023 1,500 1,602Enbridge, Inc. 3.40% 2051 1,085 1,092Energy Transfer Operating LP 5.875% 2024 294 326Energy Transfer Operating LP 2.90% 2025 4,402 4,635Energy Transfer Operating LP 3.75% 2030 7,707 8,379Energy Transfer Operating LP 5.00% 2050 19,288 22,336Energy Transfer Partners LP 4.20% 2023 2,860 3,061Energy Transfer Partners LP 4.50% 2024 4,915 5,354Energy Transfer Partners LP 4.75% 2026 1,506 1,697Energy Transfer Partners LP 4.20% 2027 45 50Energy Transfer Partners LP 4.95% 2028 4,559 5,278Energy Transfer Partners LP 5.25% 2029 1,275 1,507Energy Transfer Partners LP 6.125% 2045 11,780 15,040Energy Transfer Partners LP 5.30% 2047 10,459 12,256Energy Transfer Partners LP 6.00% 2048 1,868 2,365Energy Transfer Partners LP 6.25% 2049 1,775 2,333Energy Transfer Partners LP 6.25% junior subordinated perpetual bonds
(3-month USD-LIBOR + 4.028% on 2/15/2023)4 7,850 6,947Energy Transfer Partners LP 6.625% junior subordinated perpetual bonds
(3-month USD-LIBOR + 4.155% on 2/15/2028)4 500 491Enterprise Products Operating LLC 3.20% 2052 3,031 3,014EQT Corp. 3.00% 2022 6,700 6,851EQT Corp. 8.50% 2030 (8.25% on 8/1/2021)4 7,500 9,782Equinor ASA 3.625% 2028 4,928 5,544Equinor ASA 3.125% 2030 20,000 21,796Equinor ASA 3.25% 2049 5,687 6,059Exxon Mobil Corp. 3.043% 2026 4,625 5,023Kinder Morgan Energy Partners LP 6.50% 2037 900 1,237Kinder Morgan Energy Partners LP 5.50% 2044 700 880Kinder Morgan, Inc. 5.30% 2034 760 940MPLX LP 1.75% 2026 5,557 5,620MPLX LP 4.00% 2028 4,665 5,217MPLX LP 2.65% 2030 2,404 2,429MPLX LP 5.50% 2049 6,660 8,640Occidental Petroleum Corp. 2.90% 2024 4,336 4,439Odebrecht Drilling Norbe 7.35% 2026 (86.39% PIK)3,5 38 20Odebrecht Drilling Norbe 0% perpetual bonds3 1,150 16
TheBondFundof America (formerly Bond Fund) (continued)

American Funds Insurance Series 151
Bonds, notes & other debt instruments (continued)Principal amount
(000)Value(000)
Corporate bonds, notes & loans (continued)
Energy(continued)
Oleoducto Central SA 4.00% 20273 $ 1,715 $ 1,772Oleoducto Central SA 4.00% 2027 350 362ONEOK, Inc. 2.20% 2025 193 199ONEOK, Inc. 5.85% 2026 896 1,060ONEOK, Inc. 4.55% 2028 1,610 1,838ONEOK, Inc. 3.10% 2030 540 565ONEOK, Inc. 6.35% 2031 2,794 3,617ONEOK, Inc. 5.20% 2048 9,563 11,738ONEOK, Inc. 4.45% 2049 440 487ONEOK, Inc. 4.50% 2050 1,266 1,413ONEOK, Inc. 7.15% 2051 3,275 4,826Petrobras Global Finance Co. 5.093% 2030 5,000 5,464Petrobras Global Finance Co. 6.90% 2049 4,000 4,774Petróleos Mexicanos 6.875% 20253 3,663 4,059Petróleos Mexicanos 6.875% 2025 1,337 1,482Petróleos Mexicanos 6.875% 2026 43,810 47,935Petróleos Mexicanos 6.50% 2027 29,533 31,209Pioneer Natural Resources Company 1.90% 2030 3,175 3,062Plains All American Pipeline LP 3.80% 2030 590 632Qatar Petroleum 1.375% 20263 12,400 12,388Qatar Petroleum 2.25% 20313 12,740 12,605Qatar Petroleum 3.125% 20413 7,310 7,283Qatar Petroleum 3.30% 20513 2,185 2,185SA Global Sukuk, Ltd. 0.946% 20243 9,410 9,408SA Global Sukuk, Ltd. 1.602% 20263 13,725 13,730SA Global Sukuk, Ltd. 2.694% 20313 4,680 4,744Sabine Pass Liquefaction, LLC 6.25% 2022 2,300 2,359Sabine Pass Liquefaction, LLC 5.625% 20234 1,000 1,075Sabine Pass Liquefaction, LLC 5.75% 2024 8,000 8,982Sabine Pass Liquefaction, LLC 5.625% 2025 10,000 11,438Sabine Pass Liquefaction, LLC 5.875% 2026 15,700 18,595Saudi Arabian Oil Co. 2.875% 20243 4,885 5,148Shell International Finance BV 3.875% 2028 9,410 10,809Southwestern Energy Co. 6.45% 20254 920 1,020Suncor Energy, Inc. 3.75% 2051 715 775Sunoco Logistics Operating Partners LP 5.40% 2047 6,190 7,351Targa Resources Partners LP 5.375% 2027 175 183Total Capital Canada, Ltd. 2.75% 2023 2,140 2,239Total Capital International 3.455% 2029 885 986TransCanada PipeLines, Ltd. 4.25% 2028 11,275 12,965TransCanada PipeLines, Ltd. 4.10% 2030 4,776 5,493Western MidstreamOperating LP 4.35% 20254 2,782 2,943Western MidstreamOperating LP 5.30% 20304 2,202 2,473Western MidstreamOperating LP 6.50% 20504 3,079 3,574Williams Partners LP 4.50% 2023 500 542Williams Partners LP 4.30% 2024 595 647Williams Partners LP 5.10% 2045 225 281
635,427
Utilities4.19%
Abu Dhabi National Energy Company PJSC (TAQA) 4.375% 20253 10,500 11,801AEP Texas, Inc. 3.45% 2051 1,475 1,530Ameren Corp. 4.50% 2049 2,875 3,708Berkshire Hathaway Energy Company 4.50% 2045 5,895 7,274CenterPoint Energy, Inc. 2.65% 2031 1,675 1,708Comisión Federal de Electricidad 3.348% 20313 6,000 5,969Comisión Federal de Electricidad 4.677% 20513 6,050 5,866Connecticut Light and Power Co. 2.05% 2031 1,775 1,791Consolidated Edison Company of New York, Inc. 2.40% 2031 5,922 6,040
TheBondFundof America (formerly Bond Fund) (continued)

152 American Funds Insurance Series
Bonds, notes & other debt instruments (continued)Principal amount
(000)Value(000)
Corporate bonds, notes & loans (continued)
Utilities(continued)
Consolidated Edison Company of New York, Inc. 3.60% 2061 $ 250 $ 259Consumers Energy Co. 4.05% 2048 8,270 10,072Consumers Energy Co. 3.75% 2050 5,625 6,648Duke Energy Corp. 3.75% 2024 3,826 4,121Duke Energy Florida, LLC 3.40% 2046 6,445 7,026Duke Energy Progress, LLC 3.70% 2028 3,750 4,225Edison International 3.125% 2022 2,900 2,988Edison International 3.55% 2024 6,850 7,289Edison International 4.95% 2025 175 194Edison International 5.75% 2027 3,181 3,624Edison International 4.125% 2028 3,644 3,881Emera US Finance LP 0.833% 20243 600 597Emera US Finance LP 2.639% 20313 4,400 4,436Emera, Inc. 6.75% 2076 (3-month USD-LIBOR + 5.44% on 6/15/2026)4 1,950 2,287Enel Società per Azioni 8.75% 2073
(USD Semi Annual 30/360 (vs. 3-month USD-LIBOR) + 5.88% on 9/24/2023)3,4 1,000 1,164ENN Clean Energy International Investment, Ltd. 3.375% 20263 1,310 1,337Entergy Louisiana, LLC 4.20% 2048 6,325 7,711Eversource Energy 2.75% 2022 527 535Eversource Energy 3.80% 2023 5,000 5,369Exelon Corp. 3.40% 2026 1,570 1,711FirstEnergy Corp. 3.35% 20224 8,750 8,897FirstEnergy Corp. 1.60% 2026 20,066 19,636FirstEnergy Corp. 4.40% 20274 12,178 13,257FirstEnergy Corp. 3.50% 20283 2,400 2,570FirstEnergy Corp. 4.10% 20283 425 479FirstEnergy Corp. 2.25% 2030 13,707 13,159FirstEnergy Corp. 2.65% 2030 12,524 12,493FirstEnergy Corp., Series B, 4.75% 20234 2,525 2,666FirstEnergy Transmission LLC 2.866% 20283 4,000 4,149Georgia Power Co. 3.70% 2050 275 299IPALCO Enterprises, Inc. 3.70% 2024 200 215Jersey Central Power & Light Co. 2.75% 20323 525 534Mississippi Power Co. 4.25% 2042 5,020 5,943Monongahela Power Co. 3.55% 20273 1,700 1,876NextEra Energy Capital Holdings, Inc. 1.90% 2028 3,575 3,619Niagara Mohawk Power Corp. 4.278% 20343 1,000 1,175Pacific Gas and Electric Co. 1.75% 2022 13,000 12,995Pacific Gas and Electric Co. 1.367% 2023 11,550 11,551Pacific Gas and Electric Co. 3.25% 2023 5,615 5,805Pacific Gas and Electric Co. 3.40% 2024 2,000 2,100Pacific Gas and Electric Co. 2.95% 2026 10,850 11,113Pacific Gas and Electric Co. 3.15% 2026 27,543 28,428Pacific Gas and Electric Co. 3.30% 2027 12,289 12,645Pacific Gas and Electric Co. 3.30% 2027 5,850 6,062Pacific Gas and Electric Co. 3.75% 2028 13,075 13,715Pacific Gas and Electric Co. 4.65% 2028 7,900 8,705Pacific Gas and Electric Co. 4.55% 2030 35,299 37,788Pacific Gas and Electric Co. 2.50% 2031 19,695 18,487Pacific Gas and Electric Co. 3.25% 2031 1,300 1,280Pacific Gas and Electric Co. 3.30% 2040 8,898 8,055Pacific Gas and Electric Co. 3.75% 2042 9,466 8,653Pacific Gas and Electric Co. 4.75% 2044 336 341Pacific Gas and Electric Co. 3.95% 2047 780 727Pacific Gas and Electric Co. 3.50% 2050 6,836 6,102Progress Energy, Inc. 7.75% 2031 1,820 2,600Public Service Electric and Gas Co. 3.20% 2029 6,000 6,595Puget Energy, Inc. 6.00% 2021 3,135 3,165Puget Energy, Inc. 5.625% 2022 8,004 8,327
TheBondFundof America (formerly Bond Fund) (continued)

American Funds Insurance Series 153
Bonds, notes & other debt instruments (continued)Principal amount
(000)Value(000)
Corporate bonds, notes & loans (continued)
Utilities(continued)
Puget Energy, Inc. 3.65% 2025 $ 300 $ 323San Diego Gas & Electric Co. 3.32% 2050 1,350 1,433Southern California Edison Co. 2.85% 2029 8,200 8,524Southern California Edison Co. 4.20% 2029 11,000 12,423Southern California Edison Co. 2.50% 2031 5,149 5,166Southern California Edison Co. 5.35% 2035 6,450 8,179Southern California Edison Co. 5.75% 2035 4,549 5,973Southern California Edison Co. 5.625% 2036 7,051 8,973Southern California Edison Co. 5.55% 2037 3,844 4,789Southern California Edison Co. 5.95% 2038 5,654 7,346Southern California Edison Co. 4.50% 2040 4,341 4,993Southern California Edison Co. 5.50% 2040 606 760Southern California Edison Co. 4.00% 2047 9,402 9,908Southern California Edison Co. 4.125% 2048 9,008 9,629Southern California Edison Co. 4.875% 2049 2,775 3,294Southern California Edison Co. 3.65% 2050 5,600 5,611Southern California Edison Co. 3.65% 2051 2,732 2,747Southern California Edison Co., Series C, 3.60% 2045 2,717 2,714Southwestern Electric Power Co. 1.65% 2026 3,550 3,596Union Electric Co. 2.15% 2032 3,175 3,187Wisconsin Power and Light Co. 3.65% 2050 1,075 1,202Xcel Energy, Inc. 3.30% 2025 5,650 6,092Xcel Energy, Inc. 2.60% 2029 2,925 3,043
547,272
Consumerdiscretionary3.92%
Allied Universal Holdco LLC 4.625% 20283 335 336Amazon.com, Inc. 1.65% 2028 6,855 6,918Amazon.com, Inc. 2.10% 2031 7,155 7,280Amazon.com, Inc. 2.875% 2041 1,480 1,529Amazon.com, Inc. 3.10% 2051 9,380 9,866Amazon.com, Inc. 3.25% 2061 4,100 4,328Atlas LuxCo 4 SARL 4.625% 20283 255 256Carnival Corp. 11.50% 20233 9,140 10,298DaimlerChrysler North America Holding Corp. 1.75% 20233 8,000 8,167DaimlerChrysler North America Holding Corp. 3.35% 20233 2,000 2,092Ford Motor Credit Company LLC 5.125% 2025 3,870 4,267Ford Motor Credit Company LLC 3.815% 2027 3,790 3,952Ford Motor Credit Company LLC 4.125% 2027 39,080 41,509Ford Motor Credit Company LLC 4.271% 2027 18,542 19,892Ford Motor Credit Company LLC 5.113% 2029 4,205 4,713General Motors Company 5.40% 2023 421 464General Motors Company 4.35% 2025 11,358 12,560General Motors Company 6.125% 2025 28,743 34,046General Motors Company 6.80% 2027 1,030 1,298General Motors Company 5.40% 2048 7,200 9,188General Motors Financial Co. 3.15% 2022 25 26General Motors Financial Co. 3.45% 2022 200 203General Motors Financial Co. 3.55% 2022 3,703 3,823General Motors Financial Co. 3.25% 2023 964 1,001General Motors Financial Co. 3.70% 2023 2,076 2,180General Motors Financial Co. 5.20% 2023 4,371 4,708General Motors Financial Co. 1.05% 2024 4,200 4,225General Motors Financial Co. 3.50% 2024 9,945 10,679General Motors Financial Co. 3.95% 2024 6,269 6,748General Motors Financial Co. 5.10% 2024 1,081 1,190General Motors Financial Co. 2.75% 2025 3,819 4,023General Motors Financial Co. 2.90% 2025 1,032 1,093General Motors Financial Co. 4.00% 2025 587 640
TheBondFundof America (formerly Bond Fund) (continued)

154 American Funds Insurance Series
Bonds, notes & other debt instruments (continued)Principal amount
(000)Value(000)
Corporate bonds, notes & loans (continued)
Consumerdiscretionary(continued)
General Motors Financial Co. 1.25% 2026 $ 5,450 $ 5,416General Motors Financial Co. 1.50% 2026 2,950 2,934General Motors Financial Co. 5.25% 2026 995 1,150General Motors Financial Co. 2.70% 2027 6,079 6,324General Motors Financial Co. 2.40% 2028 9,700 9,854General Motors Financial Co. 3.60% 2030 465 504General Motors Financial Co. 2.35% 2031 6,075 6,000General Motors Financial Co. 2.70% 2031 6,075 6,110Home Depot, Inc. 2.95% 2029 6,081 6,647Home Depot, Inc. 4.50% 2048 1,915 2,503Hyundai Capital America 3.75% 20213 8,500 8,505Hyundai Capital America 2.85% 20223 4,118 4,236Hyundai Capital America 3.00% 20223 4,500 4,605Hyundai Capital America 3.25% 20223 1,521 1,568Hyundai Capital America 3.95% 20223 8,000 8,160Hyundai Capital America 1.25% 20233 3,150 3,181Hyundai Capital America 2.375% 20233 9,977 10,245Hyundai Capital America 0.875% 20243 2,780 2,768Hyundai Capital America 3.40% 20243 8,180 8,728Hyundai Capital America 1.80% 20253 12,714 12,916Hyundai Capital America 2.65% 20253 13,054 13,677Hyundai Capital America 1.30% 20263 6,000 5,937Hyundai Capital America 1.50% 20263 2,675 2,657Hyundai Capital America 2.375% 20273 6,264 6,414Hyundai Capital America 3.00% 20273 10,408 11,037Hyundai Capital America 1.80% 20283 6,000 5,956Hyundai Capital America 2.00% 20283 5,900 5,859Hyundai Capital Services, Inc. 1.25% 20263 3,695 3,641Limited Brands, Inc. 6.875% 2035 740 938Marriott International, Inc. 5.75% 2025 3,125 3,609Marriott International, Inc. 3.125% 2026 410 436McDonald’s Corp. 2.125% 2030 2,482 2,511McDonald’s Corp. 4.45% 2047 3,535 4,348McDonald’s Corp. 3.625% 2049 2,938 3,262MGM Resorts International 7.75% 2022 2,000 2,093NIKE, Inc. 3.25% 2040 6,171 6,785NIKE, Inc. 3.875% 2045 1,560 1,877Nissan Motor Co., Ltd. 2.60% 20223 1,415 1,445Nissan Motor Co., Ltd. 3.043% 20233 240 250Nissan Motor Co., Ltd. 3.522% 20253 800 855Nissan Motor Co., Ltd. 2.00% 20263 12,000 12,086Nissan Motor Co., Ltd. 4.345% 20273 1,790 1,969Nissan Motor Co., Ltd. 2.75% 20283 11,200 11,313Nissan Motor Co., Ltd. 4.81% 20303 17,533 19,813Starbucks Corp. 3.75% 2047 3,785 4,185Starbucks Corp. 3.35% 2050 7,680 8,051Toyota Motor Credit Corp. 3.375% 2030 6,664 7,478Volkswagen Group of America Finance, LLC 4.00% 20213 4,510 4,573Volkswagen Group of America Finance, LLC 4.25% 20233 15,000 16,219Volkswagen Group of America Finance, LLC 2.85% 20243 2,996 3,167Volkswagen Group of America Finance, LLC 1.25% 20253 1,150 1,144Volkswagen Group of America Finance, LLC 3.35% 20253 2,636 2,846Wynn Resorts, Ltd. 5.125% 20293 410 434
512,717
TheBondFundof America (formerly Bond Fund) (continued)

American Funds Insurance Series 155
Bonds, notes & other debt instruments (continued)Principal amount
(000)Value(000)
Corporate bonds, notes & loans (continued)
Health care3.54%
Abbott Laboratories 3.40% 2023 $ 910 $ 971Abbott Laboratories 3.75% 2026 2,244 2,535Abbott Laboratories 4.75% 2036 4,565 5,887AbbVie, Inc. 3.20% 2022 9,600 9,919AbbVie, Inc. 3.20% 2029 23,754 25,818Amgen, Inc. 2.45% 2030 10,000 10,319Anthem, Inc. 2.375% 2025 1,534 1,607AstraZeneca Finance LLC 1.75% 2028 1,429 1,430AstraZeneca Finance LLC 2.25% 2031 572 581AstraZeneca PLC 4.00% 2029 5,920 6,809AstraZeneca PLC 3.00% 2051 1,437 1,489Bausch Health Companies, Inc. 4.875% 20283 830 851Bayer US Finance II LLC 3.875% 20233 8,783 9,410Bayer US Finance II LLC 4.25% 20253 17,570 19,596Becton, Dickinson and Company 3.734% 2024 903 984Becton, Dickinson and Company 4.669% 2047 3,395 4,237Boston Scientific Corp. 3.375% 2022 350 359Boston Scientific Corp. 3.85% 2025 255 282Centene Corp. 4.25% 2027 14,860 15,677Centene Corp. 2.45% 2028 11,155 11,320Centene Corp. 4.625% 2029 14,945 16,455Centene Corp. 3.375% 2030 15,718 16,452Centene Corp. 2.50% 2031 8,550 8,443Cigna Corp. 4.375% 2028 7,090 8,252EMD Finance LLC 2.95% 20223 2,100 2,131GlaxoSmithKline PLC 3.375% 2023 16,800 17,756Kaiser Foundation Hospitals 2.81% 2041 910 930Laboratory Corporation of America Holdings 1.55% 2026 1,210 1,216Laboratory Corporation of America Holdings 2.70% 2031 805 821Laboratory Corporation of America Holdings 4.70% 2045 4,160 5,002Novartis Capital Corp. 1.75% 2025 2,361 2,434Novartis Capital Corp. 2.20% 2030 5,446 5,629Shire PLC 3.20% 2026 15,100 16,407Teva Pharmaceutical Finance Co. BV 2.20% 2021 4,911 4,910Teva Pharmaceutical Finance Co. BV 2.80% 2023 16,420 16,383Teva Pharmaceutical Finance Co. BV 7.125% 2025 45,000 49,672Teva Pharmaceutical Finance Co. BV 3.15% 2026 68,853 65,583Teva Pharmaceutical Finance Co. BV 6.75% 2028 26,824 29,446Teva Pharmaceutical Finance Co. BV 4.10% 2046 46,666 40,949UnitedHealth Group, Inc. 3.35% 2022 4,385 4,525UnitedHealth Group, Inc. 3.75% 2025 5,410 6,007UnitedHealth Group, Inc. 2.30% 2031 1,626 1,666UnitedHealth Group, Inc. 3.05% 2041 1,300 1,363UnitedHealth Group, Inc. 3.25% 2051 1,887 2,017Zimmer Holdings, Inc. 3.15% 2022 7,845 7,971
462,501
Industrials2.42%
AerCap Ireland Capital, Ltd. / AerCap Global Aviation Trust 1.75% 2026 2,841 2,809Air Lease Corp. 2.875% 2026 11,453 12,043Avolon Holdings Funding, Ltd. 3.625% 20223 2,810 2,875Avolon Holdings Funding, Ltd. 3.95% 20243 12,514 13,353Avolon Holdings Funding, Ltd. 2.125% 20263 8,333 8,306Avolon Holdings Funding, Ltd. 4.25% 20263 3,302 3,581Avolon Holdings Funding, Ltd. 3.25% 20273 8,000 8,259BNSF Funding Trust I, junior subordinated, 6.613% 2055
(3-month USD-LIBOR + 2.35% on 1/15/2026)4 1,680 1,928Boeing Company 4.508% 2023 11,358 12,112Boeing Company 1.95% 2024 5,646 5,785
TheBondFundof America (formerly Bond Fund) (continued)

156 American Funds Insurance Series
Bonds, notes & other debt instruments (continued)Principal amount
(000)Value(000)
Corporate bonds, notes & loans (continued)
Industrials(continued)
Boeing Company 2.80% 2024 $ 500 $ 522Boeing Company 4.875% 2025 31,752 35,594Boeing Company 2.196% 2026 16,571 16,732Boeing Company 2.75% 2026 16,488 17,234Boeing Company 3.10% 2026 649 687Boeing Company 2.70% 2027 6,473 6,697Boeing Company 5.04% 2027 15,716 18,143Boeing Company 3.25% 2028 11,379 12,076Boeing Company 3.25% 2028 1,925 2,023Boeing Company 5.15% 2030 29,737 35,241Boeing Company 3.625% 2031 842 907Boeing Company 3.90% 2049 1,411 1,491Boeing Company 5.805% 2050 2,782 3,752Bohai Financial Investment Holding Co., Ltd. 5.25% 20223 2,485 2,601Carrier Global Corp. 3.377% 2040 15,000 15,759General Dynamics Corp. 2.25% 2031 709 728General Electric Capital Corp. 3.373% 2025 4,615 5,038General Electric Capital Corp. 4.418% 2035 3,700 4,441General Electric Co. 3.45% 2027 1,523 1,675General Electric Co. 3.625% 2030 675 753Mexico City Airport Trust 5.50% 2046 1,959 1,984Mexico City Airport Trust 5.50% 2047 5,909 5,998Mexico City Airport Trust 5.50% 20473 1,132 1,149Northrop Grumman Corp. 3.25% 2028 10,845 11,857Triton Container International, Ltd. 1.15% 20243 1,609 1,606Triton Container International, Ltd. 3.15% 20313 2,482 2,499Union Pacific Corp. 2.15% 2027 2,213 2,301Union Pacific Corp. 2.40% 2030 4,454 4,608Union Pacific Corp. 2.375% 2031 5,155 5,271Union Pacific Corp. 3.25% 2050 7,000 7,398United Rentals, Inc. 5.50% 2027 5,000 5,306United Technologies Corp. 3.125% 2027 4,551 4,954United Technologies Corp. 4.125% 2028 4,974 5,727Vinci SA 3.75% 20293 2,000 2,260
316,063
Communicationservices2.11%
AT&T, Inc. 0.90% 2024 13,000 13,030AT&T, Inc. 1.70% 2026 19,000 19,204AT&T, Inc. 2.55% 20333 4,953 4,912AT&T, Inc. 3.50% 20533 10,240 10,303CCO Holdings LLC and CCO Holdings Capital Corp. 5.125% 20273 4,800 5,041CCO Holdings LLC and CCO Holdings Capital Corp. 2.80% 2031 5,642 5,774CCO Holdings LLC and CCO Holdings Capital Corp. 5.75% 2048 5,000 6,375CenturyLink, Inc. 4.00% 20273 16,374 16,722Comcast Corp. 3.15% 2028 7,200 7,911Comcast Corp. 2.65% 2030 7,500 7,902Comcast Corp. 4.00% 2048 5,000 5,873Embarq Corp. 7.995% 2036 2,500 2,837SBA Tower Trust 1.631% 20263 6,741 6,750Sirius XM Radio, Inc. 4.00% 20283 675 696SoftBank Group Corp. 3.36% 20233 725 729Tencent Holdings, Ltd. 3.595% 2028 14,000 15,349Tencent Holdings, Ltd. 3.975% 2029 12,298 13,733Tencent Holdings, Ltd. 2.39% 2030 11,702 11,672Tencent Holdings, Ltd. 2.39% 20303 10,000 9,975T-Mobile US, Inc. 3.50% 2025 3,275 3,559T-Mobile US, Inc. 2.625% 2026 2,875 2,947T-Mobile US, Inc. 3.75% 2027 5,000 5,537
TheBondFundof America (formerly Bond Fund) (continued)

American Funds Insurance Series 157
Bonds, notes & other debt instruments (continued)Principal amount
(000)Value(000)
Corporate bonds, notes & loans (continued)
Communicationservices(continued)
T-Mobile US, Inc. 3.875% 2030 $ 4,500 $ 5,046T-Mobile US, Inc. 2.875% 2031 4,075 4,050T-Mobile US, Inc. 3.50% 2031 9,000 9,322T-Mobile US, Inc. 3.00% 2041 2,100 2,079T-Mobile US, Inc. 4.50% 2050 11,575 13,797Verizon Communications, Inc. 1.45% 2026 4,675 4,717Verizon Communications, Inc. 2.10% 2028 8,975 9,169Verizon Communications, Inc. 4.329% 2028 1,539 1,792Verizon Communications, Inc. 1.75% 2031 3,300 3,165Verizon Communications, Inc. 2.55% 2031 7,375 7,544Verizon Communications, Inc. 3.40% 2041 2,050 2,171Verizon Communications, Inc. 2.875% 2050 3,000 2,857Verizon Communications, Inc. 3.55% 2051 1,975 2,113Vodafone Group PLC 4.375% 2028 10,000 11,642Vodafone Group PLC 4.25% 2050 3,050 3,569Walt Disney Company 2.65% 2031 15,000 15,759
275,623
Consumer staples1.62%
7-Eleven, Inc. 1.80% 20313 5,013 4,799Altria Group, Inc. 4.40% 2026 4,585 5,190Altria Group, Inc. 4.50% 2043 1,585 1,707Altria Group, Inc. 5.95% 2049 9,039 11,587Anheuser-Busch InBev NV 4.75% 2029 7,500 8,942Anheuser-Busch InBev NV 5.55% 2049 5,000 6,883Anheuser-Busch InBev NV 4.50% 2050 1,355 1,652British American Tobacco International Finance PLC 3.95% 20253 16,879 18,447British American Tobacco International Finance PLC 1.668% 2026 4,070 4,071British American Tobacco PLC 3.557% 2027 10,991 11,776British American Tobacco PLC 2.259% 2028 4,348 4,320British American Tobacco PLC 4.39% 2037 1,500 1,620British American Tobacco PLC 4.54% 2047 12,786 13,622British American Tobacco PLC 4.758% 2049 23,659 25,693Conagra Brands, Inc. 5.30% 2038 436 555Conagra Brands, Inc. 5.40% 2048 57 77Constellation Brands, Inc. 3.50% 2027 7,500 8,266Constellation Brands, Inc. 2.875% 2030 620 651Imperial Tobacco Finance PLC 3.50% 20233 2,335 2,415JBS Investments GMBH II 7.00% 20263 3,868 4,111JBS Investments GMBH II 7.00% 2026 1,665 1,770JBS Luxembourg SARL 3.625% 20323 1,230 1,231Keurig Dr Pepper, Inc. 4.057% 2023 3,112 3,319Keurig Dr Pepper, Inc. 4.597% 2028 10,752 12,637Molson Coors Brewing Co. 2.10% 2021 2,415 2,417Molson Coors Brewing Co. 4.20% 2046 4,165 4,651Philip Morris International, Inc. 4.25% 2044 9,550 11,153PT Indofood CBP Sukses Makmur Tbk 3.398% 2031 3,110 3,158PT Indofood CBP Sukses Makmur Tbk 4.745% 2051 685 705Reynolds American, Inc. 4.45% 2025 14,570 16,147Reynolds American, Inc. 5.85% 2045 1,970 2,416Wal-Mart Stores, Inc. 2.85% 2024 6,765 7,222Wal-Mart Stores, Inc. 3.05% 2026 7,720 8,457
211,667
Informationtechnology1.16%
Apple, Inc. 1.55% 2021 11,630 11,631Broadcom Corp. / Broadcom Cayman Finance Ltd. 3.875% 2027 7,027 7,769Broadcom Corp. / Broadcom Cayman Finance Ltd. 3.50% 2028 4,803 5,272Broadcom, Inc. 3.15% 2025 1,164 1,248
TheBondFundof America (formerly Bond Fund) (continued)

158 American Funds Insurance Series
Bonds, notes & other debt instruments (continued)Principal amount
(000)Value(000)
Corporate bonds, notes & loans (continued)
Informationtechnology(continued)
Broadcom, Inc. 2.45% 20313 $ 7,000 $ 6,884Broadcom, Inc. 4.30% 2032 6,000 6,840Broadcom, Inc. 3.469% 20343 44,436 47,048Fidelity National Information Services, Inc. 2.25% 2031 495 495Microsoft Corp. 2.525% 2050 10,000 9,848Oracle Corp. 1.65% 2026 8,417 8,536Oracle Corp. 2.30% 2028 6,875 7,058Oracle Corp. 2.875% 2031 7,393 7,695Oracle Corp. 3.95% 2051 4,869 5,321PayPal Holdings, Inc. 1.65% 2025 6,989 7,178PayPal Holdings, Inc. 2.30% 2030 330 342salesforce.com, inc. 1.95% 2031 3,775 3,784salesforce.com, inc. 2.70% 2041 875 882salesforce.com, inc. 2.90% 2051 8,295 8,418salesforce.com, inc. 3.05% 2061 265 270Square, Inc. 2.75% 20263 1,975 2,012Square, Inc. 3.50% 20313 825 833VeriSign, Inc. 2.70% 2031 2,109 2,145
151,509
Real estate0.42%
Alexandria Real Estate Equities, Inc. 3.95% 2028 1,425 1,611Alexandria Real Estate Equities, Inc. 4.50% 2029 150 176American Campus Communities, Inc. 3.75% 2023 2,900 3,040American Campus Communities, Inc. 3.875% 2031 620 689American Tower Corp. 2.70% 2031 1,100 1,136Corporacion Inmobiliaria Vesta, SAB de CV 3.625% 20313 395 402Corporate Office Properties LP 2.75% 2031 1,547 1,561Crown Castle International Corp. 2.50% 2031 4,614 4,653Equinix, Inc. 2.90% 2026 3,287 3,522Equinix, Inc. 3.20% 2029 3,846 4,130Equinix, Inc. 2.50% 2031 7,760 7,899Equinix, Inc. 3.40% 2052 1,201 1,238Essex Portfolio LP 3.25% 2023 335 350Essex Portfolio LP 3.875% 2024 1,000 1,077Essex Portfolio LP 2.55% 2031 4,338 4,403Hospitality Properties Trust 5.00% 2022 1,270 1,286Hospitality Properties Trust 4.50% 2025 855 852Hospitality Properties Trust 3.95% 2028 1,710 1,617Iron Mountain, Inc. 4.875% 20273 1,605 1,666Iron Mountain, Inc. 5.25% 20283 3,500 3,670Kimco Realty Corp. 3.40% 2022 1,045 1,081Omega Healthcare Investors, Inc. 4.375% 2023 186 198Piedmont Operating Partnership LP 4.45% 2024 1,000 1,079Scentre Group 3.50% 20253 4,565 4,909Sun Communities Operating LP 2.70% 2031 3,244 3,251
55,496
Materials0.12%
Air Products and Chemicals, Inc. 2.70% 2040 2,911 2,959Huntsman International LLC 2.95% 2031 911 925International Flavors & Fragrances, Inc. 2.30% 20303 4,175 4,157LYB International Finance III, LLC 2.25% 2030 3,802 3,802LYB International Finance III, LLC 3.625% 2051 2,617 2,769LYB International Finance III, LLC 3.80% 2060 1,112 1,179
15,791
Total corporate bonds, notes & loans 3,967,956
TheBondFundof America (formerly Bond Fund) (continued)

American Funds Insurance Series 159
Bonds, notes & other debt instruments (continued)Principal amount
(000)Value(000)
Mortgage-backed obligations 11.11%
Federal agencymortgage-backedobligations9.88%
Fannie Mae Pool #976945 5.50% 20236 $ 34 $ 34Fannie Mae Pool #AB1068 4.50% 20256 101 106Fannie Mae Pool #AJ9156 3.00% 20266 275 290Fannie Mae Pool #AJ6967 3.00% 20266 134 141Fannie Mae Pool #AJ5522 3.00% 20266 3 4Fannie Mae Pool #256133 4.50% 20266 109 117Fannie Mae Pool #AK5394 3.00% 20276 640 678Fannie Mae Pool #AL5603 3.00% 20276 565 594Fannie Mae Pool #AX3597 3.00% 20276 253 266Fannie Mae Pool #AB4281 3.00% 20276 113 119Fannie Mae Pool #AB4486 3.00% 20276 56 59Fannie Mae Pool #AB5236 3.00% 20276 23 24Fannie Mae Pool #AO0800 3.00% 20276 19 20Fannie Mae Pool #AK0971 3.00% 20276 9 10Fannie Mae Pool #AL3802 3.00% 20286 787 832Fannie Mae Pool #AR3058 3.00% 20286 100 105Fannie Mae Pool #AL8241 3.00% 20296 762 805Fannie Mae Pool #BM4299 3.00% 20306 2,175 2,286Fannie Mae Pool #AL9573 3.00% 20316 90 95Fannie Mae Pool #AS8018 3.00% 20316 70 74Fannie Mae Pool #BM4741 3.00% 20326 54 58Fannie Mae Pool #924866 1.64% 20376,7 712 720Fannie Mae Pool #945680 6.00% 20376 621 735Fannie Mae Pool #913966 6.00% 20376 68 79Fannie Mae Pool #889982 5.50% 20386 1,311 1,527Fannie Mae Pool #988588 5.50% 20386 258 300Fannie Mae Pool #AB1297 5.00% 20406 294 337Fannie Mae Pool #AH8144 5.00% 20416 1,403 1,586Fannie Mae Pool #AI1862 5.00% 20416 1,349 1,545Fannie Mae Pool #AH9479 5.00% 20416 1,267 1,426Fannie Mae Pool #AI3510 5.00% 20416 842 964Fannie Mae Pool #AJ0704 5.00% 20416 734 840Fannie Mae Pool #AJ5391 5.00% 20416 428 488Fannie Mae Pool #BM6240 2.201% 20446,7 2,584 2,732Fannie Mae Pool #AZ3904 4.00% 20456 76 83Fannie Mae Pool #AL8522 3.50% 20466 1,251 1,357Fannie Mae Pool #BD1968 4.00% 20466 1,968 2,144Fannie Mae Pool #BE0592 4.00% 20466 528 565Fannie Mae Pool #BD5477 4.00% 20466 258 278Fannie Mae Pool #CA0770 3.50% 20476 8,073 8,561Fannie Mae Pool #CA0706 4.00% 20476 178 191Fannie Mae Pool #MA3058 4.00% 20476 74 79Fannie Mae Pool #BM4413 4.50% 20476 5,365 5,828Fannie Mae Pool #BF0293 3.00% 20486 10,714 11,386Fannie Mae Pool #FM4891 3.50% 20486 32,271 34,647Fannie Mae Pool #BF0318 3.50% 20486 9,697 10,449Fannie Mae Pool #CA1189 3.50% 20486 2,247 2,378Fannie Mae Pool #MA3384 4.00% 20486 199 212Fannie Mae Pool #BJ9169 4.00% 20486 120 129Fannie Mae Pool #BJ5749 4.00% 20486 26 29Fannie Mae Pool #BM4676 4.00% 20486 20 22Fannie Mae Pool #CA2493 4.50% 20486 1,214 1,311Fannie Mae Pool #CA3807 3.00% 20496 1,920 2,040Fannie Mae Pool #CA3806 3.00% 20496 1,107 1,179Fannie Mae Pool #FM0007 3.50% 20496 25,833 27,816Fannie Mae Pool #FM1954 3.50% 20496 11,252 12,010Fannie Mae Pool #FM1589 3.50% 20496 7,178 7,692Fannie Mae Pool #FM1262 4.00% 20496 39,638 42,753Fannie Mae Pool #FM5507 3.00% 20506 22,580 24,179
TheBondFundof America (formerly Bond Fund) (continued)

160 American Funds Insurance Series
Bonds, notes & other debt instruments (continued)Principal amount
(000)Value(000)
Mortgage-backed obligations (continued)
Federal agencymortgage-backedobligations(continued)
Fannie Mae Pool #BF0145 3.50% 20576 $16,197 $17,624Fannie Mae Pool #BF0264 3.50% 20586 12,658 13,709Fannie Mae Pool #BF0332 3.00% 20596 27,684 29,980Fannie Mae Pool #BF0497 3.00% 20606 22,798 24,218Fannie Mae, Series 2001-4, Class GA, 9.00% 20256,7 —8 —8
Fannie Mae, Series 2001-50, Class BA, 7.00% 20416 9 11Fannie Mae, Series 2002-W3, Class A5, 7.50% 20416 22 27Fannie Mae, Series 2002-W1, Class 2A, 5.333% 20426,7 28 31Freddie Mac Pool #ZK4277 3.00% 20276 465 492Freddie Mac Pool #ZK3836 3.00% 20276 158 166Freddie Mac Pool #ZK3970 3.00% 20276 144 152Freddie Mac Pool #ZS6521 3.00% 20276 99 105Freddie Mac Pool #ZK3893 3.00% 20276 49 52Freddie Mac Pool #ZK4162 3.00% 20276 37 39Freddie Mac Pool #ZS8452 3.00% 20276 11 12Freddie Mac Pool #ZS8463 3.00% 20276 5 5Freddie Mac Pool #ZK4039 3.00% 20276 5 5Freddie Mac Pool #ZS8507 3.00% 20286 186 197Freddie Mac Pool #ZK7590 3.00% 20296 3,935 4,159Freddie Mac Pool #ZK7593 3.00% 20296 199 210Freddie Mac Pool #ZT1931 3.00% 20336 248 263Freddie Mac Pool #A15120 5.50% 20336 61 69Freddie Mac Pool #QN1073 3.00% 20346 90 95Freddie Mac Pool #G05196 5.50% 20386 72 84Freddie Mac Pool #G05267 5.50% 20386 53 62Freddie Mac Pool #G06020 5.50% 20396 102 119Freddie Mac Pool #A93948 4.50% 20406 209 230Freddie Mac Pool #G05860 5.50% 20406 375 437Freddie Mac Pool #G06868 4.50% 20416 251 280Freddie Mac Pool #G06841 5.50% 20416 599 697Freddie Mac Pool #841039 2.213% 20436,7 2,399 2,546Freddie Mac Pool #Z40130 3.00% 20466 26,864 28,881Freddie Mac Pool #G61733 3.00% 20476 6,699 7,122Freddie Mac Pool #G08789 4.00% 20476 1,136 1,219Freddie Mac Pool #G67709 3.50% 20486 19,473 21,104Freddie Mac Pool #G61628 3.50% 20486 497 532Freddie Mac Pool #SI2002 4.00% 20486 2,284 2,445Freddie Mac Pool #Q58494 4.00% 20486 1,475 1,576Freddie Mac Pool #QA4673 3.00% 20496 38,670 41,170Freddie Mac Pool #SD7507 3.00% 20496 24,576 26,118Freddie Mac Pool #SD7508 3.50% 20496 16,385 17,753Freddie Mac Pool #RA1369 3.50% 20496 3,530 3,775Freddie Mac Pool #ZN4842 3.50% 20496 1,232 1,317Freddie Mac, Series 3061, Class PN, 5.50% 20356 80 93Freddie Mac, Series 3318, Class JT, 5.50% 20376 200 231Freddie Mac, Series K020, Class A2, Multi Family, 2.373% 20226 4,283 4,346Freddie Mac, Series K718, Class A2, Multi Family, 2.791% 20226 8,608 8,688Freddie Mac, Series 3156, Class PO, principal only, 0% 20366 168 156Freddie Mac, Series 3146, Class PO, principal only, 0% 20366 162 148Freddie Mac Seasoned Credit Risk Transfer Trust, Series 2018-3, Class MA,
3.50% 20576 12,865 13,523Freddie Mac Seasoned Credit Risk Transfer Trust, Series 2019-2, Class MA,
3.50% 20586 2,790 2,940Government National Mortgage Assn. 2.00% 20516,9 92,000 93,535Government National Mortgage Assn. 2.50% 20516,9 55,519 57,356Government National Mortgage Assn. Pool #MA5817 4.00% 20496 25,415 26,946Government National Mortgage Assn. Pool #MA5876 4.00% 20496 3,659 3,880Government National Mortgage Assn. Pool #MA6221 4.50% 20496 11,765 12,559Government National Mortgage Assn. Pool #MA5764 4.50% 20496 1,273 1,359
TheBondFundof America (formerly Bond Fund) (continued)

American Funds Insurance Series 161
Bonds, notes & other debt instruments (continued)Principal amount
(000)Value(000)
Mortgage-backed obligations (continued)
Federal agencymortgage-backedobligations(continued)
Government National Mortgage Assn. Pool #MA6042 5.00% 20496 $ 81 $ 88Government National Mortgage Assn. Pool #MA5878 5.00% 20496 —8 —8
Uniform Mortgage-Backed Security 1.50% 20366,9 39,725 40,080UniformMortgage-Backed Security 2.00% 20366,9 27,575 28,444UniformMortgage-Backed Security 2.00% 20366,9 21,500 22,146UniformMortgage-Backed Security 2.50% 20366,9 62,700 65,317UniformMortgage-Backed Security 2.00% 20516,9 44,576 44,832UniformMortgage-Backed Security 2.50% 20516,9 162,393 167,297UniformMortgage-Backed Security 2.50% 20516,9 5,140 5,306UniformMortgage-Backed Security 3.00% 20516,9 130,899 136,245UniformMortgage-Backed Security 3.50% 20516,9 56,700 59,722UniformMortgage-Backed Security 4.00% 20516,9 12,225 13,029UniformMortgage-Backed Security 4.50% 20516,9 15,000 16,139
1,290,807
Collateralizedmortgage-backedobligations (privatelyoriginated)0.80%
Arroyo Mortgage Trust, Series 2021-1R, Class A1, 1.175% 20483,6,7 5,263 5,303Arroyo Mortgage Trust, Series 2020-1, Class A1A, 1.662% 20553,6 295 297Bellemeade Re, Ltd., Series 2019-3A, Class M1B,
(1-month USD-LIBOR + 1.60%) 1.692% 20293,6,7 3,175 3,186BRAVO Residential Funding Trust, Series 2020-RPL2, Class A1, 2.00% 20593,6,7 1,251 1,275BRAVO Residential Funding Trust, Series 2020-RPL1, Class A1, 2.50% 20593,6,7 984 1,007Cascade Funding Mortgage Trust, Series 2020-HB4, Class A, 0.946% 20303,6,7 978 980Cascade Funding Mortgage Trust, Series 2021-HB6, Class A, 0.898% 20363,6,7 2,670 2,673Citigroup Mortgage Loan Trust, Inc., Series 2020-EXP1, Class A1A, 1.804% 20603,6,7 842 850Credit Suisse Mortgage Trust, Series 2020-NET, Class A, 2.257% 20373,6 1,612 1,666Credit Suisse Mortgage Trust, Series 2017-RPL3, Class A1, 2.00% 20603,6,7 2,281 2,316Finance of America Structured Securities Trust, Series 2019-JR2, Class A1,
2.00% 20693,6 4,067 4,422Finance of America Structured Securities Trust, Series 2019-JR1, Class A,
2.00% 20693,6 3,466 3,791Flagstar Mortgage Trust, Series 2021-5INV, Class A2, 2.50% 20513,6,7 2,480 2,525Hundred AcreWood Trust, Series 2021-INV1, Class A3, 2.50% 20513,6,7 1,046 1,066JPMDB Commercial Mortgage Securities Trust, Series 2017-C7, Class A5,
3.409% 20506 240 265JPMorgan Mortgage Trust, Series 2020-INV1, Class A3, 3.50% 20503,6,7 2,842 2,910Legacy Mortgage Asset Trust, Series 2019-GS2, Class A1, 3.75% 20593,6,7 1,313 1,316Legacy Mortgage Asset Trust, Series 2021-GS2, Class A1, 1.75% 20613,6,7 1,086 1,089MFRA Trust, Series 2021-RPL1, Class A1, 1.131% 20603,6,7 4,916 4,905Mortgage Repurchase Agreement Financing Trust, Series 2020-5,
(1-month USD-LIBOR + 1.00%) 1.077% 20233,6,7 11,402 11,420MRA Issuance Trust, Series 2020-10, Class A2,
(1-month USD-LIBOR + 1.70%) 1.70% 20223,6,7,10 25,588 25,588Onslow Bay Financial LLC, Series 2020-INV1, Class A5, 3.50% 20493,6,7 1,297 1,317TIF Funding II LLC, Series 2020-1A, Class A, 2.09% 20453,6 4,992 5,034TIF Funding II LLC, Series 2021-1A, Class A, 1.65% 20463,6 4,089 4,037TIF Funding II LLC, Series 2021-1A, Class B, 2.54% 20463,6 148 147Towd Point Mortgage Trust, Series 2020-4, Class A1, 1.75% 20603,6 15,516 15,705
105,090
Commercialmortgage-backedsecurities0.43%
Bank Commercial Mortgage Trust, Series 2019-BN17, Class A4, 3.714% 20526 100 113Bank Commercial Mortgage Trust, Series 2019-BN16, Class A4, 4.005% 20526 770 884Bank Commercial Mortgage Trust, Series 2019-BN19, Class A3, 3.183% 20616 1,018 1,114Bank Commercial Mortgage Trust, Series 2018-BN10, Class A4, 3.428% 20616 130 142Bank Commercial Mortgage Trust, Series 2018-BN10, Class A5, 3.688% 20616 205 230Bank Commercial Mortgage Trust, Series 2018-BN12, Class A4, 4.255% 20616,7 2,444 2,826Bank Commercial Mortgage Trust, Series 2020-BN26, Class A4, 2.403% 20636 295 305Benchmark Mortgage Trust, Series 2018-B8, Class A5, 4.232% 20526 2,541 2,955
TheBondFundof America (formerly Bond Fund) (continued)

162 American Funds Insurance Series
Bonds, notes & other debt instruments (continued)Principal amount
(000)Value(000)
Mortgage-backed obligations (continued)
Commercialmortgage-backedsecurities(continued)
Benchmark Mortgage Trust, Series 2018-B7, Class A4, 4.51% 20536,7 $ 781 $ 920BX Trust, Series 2021-SOAR, Class A, (1-month USD-LIBOR + 0.67%) 0.77% 20383,6,7 3,769 3,776BX Trust, Series 2021-SOAR, Class B, (1-month USD-LIBOR + 0.87%) 0.97% 20383,6,7 436 437BX Trust, Series 2021-SOAR, Class C, (1-month USD-LIBOR + 1.10%) 1.20% 20383,6,7 295 296BX Trust, Series 2021-SOAR, Class D, (1-month USD-LIBOR + 1.40%) 1.50% 20383,6,7 746 748Citigroup Commercial Mortgage Trust, Series 2016-C1, Class AS, 3.514% 20496 250 269Citigroup Commercial Mortgage Trust, Series 2016-GC36, Class A5, 3.616% 20496 610 669Commercial Mortgage Trust, Series 2012-CR3, Class B, 3.922% 20453,6 430 430Commercial Mortgage Trust, Series 2013-LC13, Class B, 5.009% 20463,6,7 312 333Commercial Mortgage Trust, Series 2014-LC15, Class AM, 4.198% 20476 350 377CSAIL Commercial Mortgage Trust, Series 2015-C4, Class C, 4.714% 20486,7 204 219CSAIL Commercial Mortgage Trust, Series 2015-C1, Class B, 4.044% 20506,7 300 314Deutsche Bank Commercial Mortgage Trust, Series 2016-C1, Class AM, 3.539% 20496 200 216Extended Stay America Trust, Series 2021-ESH, Class A,
(1-month USD-LIBOR + 1.08%) 1.155% 20383,6,7 2,880 2,889Extended Stay America Trust, Series 2021-ESH, Class B,
(1-month USD-LIBOR + 1.38%) 1.455% 20383,6,7 657 660Extended Stay America Trust, Series 2021-ESH, Class C,
(1-month USD-LIBOR + 1.70%) 1.775% 20383,6,7 686 690Extended Stay America Trust, Series 2021-ESH, Class D,
(1-month USD-LIBOR + 2.25%) 2.325% 20383,6,7 686 691Grace Mortgage Trust, Series 2020-GRCE, Class A, 2.347% 20403,6 2,601 2,660GS Mortgage Securities Trust, Series 2011-GC5, Class B, 5.428% 20443,6,7 530 529GS Mortgage Securities Trust, Series 2017-GS7, Class A4, 3.43% 20506 400 441GS Mortgage Securities Trust, Series 2019-GC38, Class A4, 3.968% 20526 100 114GS Mortgage Securities Trust, Series 2020-GC47, Class A5, 2.377% 20536 1,536 1,589JPMBB Commercial Mortgage Securities Trust, Series 2014-C18, Class A5,
4.079% 20476 3,280 3,531JPMDB Commercial Mortgage Securities Trust, Series 2017-C5, Class A5,
3.694% 20506 640 708JPMorgan Chase Commercial Mortgage Securities Trust, Series 2018-BCON, Class A,
3.735% 20313,6 785 815JPMorgan Chase Commercial Mortgage Securities Trust, Series 2016-JP4, Class A4,
3.648% 20496,7 2,040 2,257L.A. Arena Funding, LLC, Series 1, Class A, 7.656% 20263,6 153 153Morgan Stanley Bank of America Merrill Lynch Trust, Series 2014-C17, Class A5,
3.741% 20476 2,038 2,191Morgan Stanley Bank of America Merrill Lynch Trust, Series 2015-C22, Class A-4,
3.306% 20486 410 440Morgan Stanley Bank of America Merrill Lynch Trust, Series 2016-C32, Class A-4,
3.72% 20496 245 273Morgan Stanley Capital I Trust, Series 2015-UBS8, Class AS, 4.114% 20486 730 799Morgan Stanley Capital I Trust, Series 2016-UBS9, Class C, 4.761% 20496,7 208 221SLG Office Trust, Series 2021-OVA, Class A, 2.585% 20413,6 8,217 8,584Wells Fargo Commercial Mortgage Trust, Series 2015-SG1, Class A-4, 3.789% 20486 2,437 2,637Wells Fargo Commercial Mortgage Trust, Series 2015-C28, Class C, 4.23% 20486,7 220 233Wells Fargo Commercial Mortgage Trust, Series 2016-BNK1, Class B, 2.967% 20496 350 356Wells Fargo Commercial Mortgage Trust, Series 2016-C34, Class AS, 3.484% 20496 130 140Wells Fargo Commercial Mortgage Trust, Series 2016-C37, Class A5, 3.794% 20496 2,550 2,848Wells Fargo Commercial Mortgage Trust, Series 2019-C54, Class A4, 3.146% 20526 1,019 1,111Wells Fargo Commercial Mortgage Trust, Series 2016-NXS5, Class AS, 3.988% 20596 250 274Wells Fargo Commercial Mortgage Trust, Series 2017-RC1, Class A4, 3.631% 20606 205 227
55,634
Total mortgage-backed obligations 1,451,531
TheBondFundof America (formerly Bond Fund) (continued)

American Funds Insurance Series 163
Bonds, notes & other debt instruments (continued)Principal amount
(000)Value(000)
Asset-backed obligations 3.35%
Aesop Funding LLC, Series 2019-2A, Class A, 3.35% 20253,6 $ 2,210 $ 2,373Aesop Funding LLC, Series 2018-2A, Class A, 4.00% 20253,6 2,755 2,979Aesop Funding LLC, Series 2020-1A, Class A, 2.33% 20263,6 7,689 8,028Aesop Funding LLC, Series 2021-1A, Class A, 1.38% 20273,6 3,445 3,448Aesop Funding LLC, Series 2021-1A, Class B, 1.63% 20273,6 531 532Aesop Funding LLC, Series 2020-2, Class A, 2.02% 20273,6 2,427 2,505Aesop Funding LLC, Series 2021-1A, Class C, 2.13% 20273,6 193 193Aesop Funding LLC, Series 2020-2A, Class B, 2.96% 20273,6 623 661Aesop Funding LLC, Series 2020-2A, Class C, 4.25% 20273,6 1,279 1,397American Credit Acceptance Receivables Trust, Series 2020-3, Class C, 1.85% 20263,6 2,602 2,649American Credit Acceptance Receivables Trust, Series 2020-3, Class D, 2.40% 20263,6 2,500 2,578American Credit Acceptance Receivables Trust, Series 2021-1, Class C, 0.83% 20273,6 1,465 1,467American Credit Acceptance Receivables Trust, Series 2021-1, Class D, 1.14% 20273,6 806 805AmeriCredit Automobile Receivables Trust, Series 2017-1, Class C, 2.71% 20226 236 236AmeriCredit Automobile Receivables Trust, Series 2021-2, Class B, 0.69% 20276 997 1,001AmeriCredit Automobile Receivables Trust, Series 2021-2, Class C, 1.01% 20276 1,109 1,117AmeriCredit Automobile Receivables Trust, Series 2021-2, Class D, 1.29% 20276 2,613 2,643Ballyrock, Ltd., Series 2019-2A, Class A1AR,
(3-month USD-LIBOR + 1.00%) 1.155% 20303,6,7 575 575Blackbird Capital Aircraft, Series 2021-1A, Class A, 2.443% 20463,6 4,639 4,678Blackbird Capital Aircraft, Series 2021-1A, Class B, 3.446% 20463,6 529 534CarMaxAuto Owner Trust, Series 2019-2, Class C, 3.16% 20256 400 417CarMaxAuto Owner Trust, Series 2021-1, Class C, 0.94% 20266 210 209CarMaxAuto Owner Trust, Series 2021-1, Class D, 1.28% 20276 206 205CF Hippolyta LLC, Series 2020-1, Class A1, 1.69% 20603,6 10,894 11,080CF Hippolyta LLC, Series 2020-1, Class A2, 1.99% 20603,6 2,076 2,110CF Hippolyta LLC, Series 2020-1, Class B1, 2.28% 20603,6 3,567 3,631CF Hippolyta LLC, Series 2020-1, Class B2, 2.60% 20603,6 386 392CF Hippolyta LLC, Series 2021-1, Class A1, 1.53% 20613,6 6,360 6,409CF Hippolyta LLC, Series 2021-1, Class B1, 1.98% 20613,6 2,014 2,034CLI Funding V LLC, Series 2020-2A, Class A, 2.03% 20453,6 2,825 2,845CLI Funding V LLC, Series 2020-3A, Class A, 2.07% 20453,6 5,890 5,950CLI Funding V LLC, Series 2021-1A, Class A, 1.64% 20463,6 4,615 4,586CLI Funding V LLC, Series 2021-1A, Class B, 2.38% 20463,6 518 514CPS Auto Receivables Trust, Series 2019-B, Class C, 3.35% 20243,6 726 731CPS Auto Receivables Trust, Series 2019-C, Class C, 2.84% 20253,6 743 752CPS Auto Receivables Trust, Series 2019-C, Class D, 3.17% 20253,6 1,125 1,158CPS Auto Receivables Trust, Series 2019-B, Class D, 3.69% 20253,6 3,045 3,112CPS Auto Receivables Trust, Series 2021-A, Class C, 0.83% 20263,6 694 694CPS Auto Receivables Trust, Series 2021-A, Class D, 1.16% 20263,6 590 587Credit Acceptance Auto Loan Trust, Series 2020-1A, Class A, 2.01% 20293,6 7,411 7,542Credit Acceptance Auto Loan Trust, Series 2021-3A, Class A, 1.00% 20303,6 1,900 1,905Drive Auto Receivables Trust, Series 2021-1, Class B, 0.65% 20256 2,524 2,530Drive Auto Receivables Trust, Series 2019-3, Class C, 2.90% 20256 4,910 5,003Drive Auto Receivables Trust, Series 2019-2, Class C, 3.42% 20256 4,610 4,676Drive Auto Receivables Trust, Series 2019-3, Class D, 3.18% 20266 4,020 4,183Drive Auto Receivables Trust, Series 2021-1, Class C, 1.02% 20276 5,369 5,396Drive Auto Receivables Trust, Series 2021-1, Class D, 1.45% 20296 4,053 4,081Drivetime Auto Owner Trust, Series 2019-3, Class C, 2.74% 20253,6 880 892Drivetime Auto Owner Trust, Series 2019-3, Class D, 2.96% 20253,6 1,915 1,981Drivetime Auto Owner Trust, Series 2019-2A, Class C, 3.18% 20253,6 2,565 2,599Drivetime Auto Owner Trust, Series 2019-2A, Class D, 3.48% 20253,6 4,250 4,387Drivetime Auto Owner Trust, Series 2021-1A, Class C, 0.84% 20263,6 825 825Drivetime Auto Owner Trust, Series 2021-1A, Class D, 1.16% 20263,6 449 448Drivetime Auto Owner Trust, Series 2020-3A, Class C, 1.47% 20263,6 817 825Drivetime Auto Owner Trust, Series 2021-2A, Class B, 0.81% 20273,6 1,179 1,183Drivetime Auto Owner Trust, Series 2021-2A, Class C, 1.10% 20273,6 1,231 1,236Drivetime Auto Owner Trust, Series 2021-2A, Class D, 1.50% 20273,6 832 837
TheBondFundof America (formerly Bond Fund) (continued)

164 American Funds Insurance Series
Bonds, notes & other debt instruments (continued)Principal amount
(000)Value(000)
Asset-backed obligations (continued)
Dryden Senior Loan Fund, Series 2014-33A, Class AR3, CLO,(3-month USD-LIBOR + 1.00%) 1.184% 20293,6,7 $ 400 $ 400
EDvestinU Private Education Loan LLC, Series 2021-A, Class A, 1.80% 20453,6 592 594Exeter Automobile Receivables Trust, Series 2019-3A, Class C, 2.79% 20243,6 5,000 5,064Exeter Automobile Receivables Trust, Series 2019-2A, Class C, 3.30% 20243,6 2,145 2,168Exeter Automobile Receivables Trust, Series 2019-1A, Class C, 3.82% 20243,6 2,040 2,055Exeter Automobile Receivables Trust, Series 2021-2, Class B, 0.57% 20256 1,663 1,665Exeter Automobile Receivables Trust, Series 2020-3A, Class C, 1.32% 20256 780 788Exeter Automobile Receivables Trust, Series 2020-1A, Class D, 2.73% 20253,6 900 926Exeter Automobile Receivables Trust, Series 2019-3A, Class D, 3.11% 20253,6 5,000 5,161Exeter Automobile Receivables Trust, Series 2019-2A, Class D, 3.71% 20253,6 6,000 6,213Exeter Automobile Receivables Trust, Series 2021-2, Class C, 0.98% 20266 1,807 1,812Exeter Automobile Receivables Trust, Series 2020-3A, Class D, 1.73% 20266 1,012 1,030Exeter Automobile Receivables Trust, Series 2021-2, Class D, 1.40% 20276 2,612 2,612FirstKey Homes Trust, Series 2020-SFR2, Class A, 1.266% 20373,6 18,121 18,111Ford Credit Auto Owner Trust, Series 2018-2, Class A, 3.47% 20303,6 17,675 18,771Ford Credit Auto Owner Trust, Series 2020-1, Class A, 2.04% 20313,6 1,127 1,171Ford Credit Auto Owner Trust, Series 2018-1, Class A, 3.19% 20313,6 30,070 32,472Ford Credit Floorplan Master Owner Trust, Series 2019-3, Class A1, 2.23% 20246 2,625 2,687Freedom Financial, Series 2021-2, Class A, 0.68% 20283,6 1,880 1,881GCI Funding I LLC, Series 2020-1, Class A, 2.82% 20453,6 2,622 2,671GCI Funding I LLC, Series 2021-1, Class A, 2.38% 20463,6 1,672 1,682GCI Funding I LLC, Series 2021-1, Class B, 3.04% 20463,6 186 188Global SC Finance VII SRL, Series 2020-2A, Class A, 2.26% 20403,6 3,535 3,574Global SC Finance VII SRL, Series 2021-1A, Class A, 1.86% 20413,6 11,721 11,686GM Financial Automobile Leasing Trust, Series 2020-2, Class C, 2.56% 20246 301 311GM Financial Automobile Leasing Trust, Series 2020-2, Class D, 3.21% 20246 425 443Hertz Vehicle Financing LLC, Series 2021-1A, Class A, 1.21% 20253,6 18,033 18,104Hertz Vehicle Financing LLC, Series 2021-1A, Class B, 1.56% 20253,6 1,171 1,176Hertz Vehicle Financing LLC, Series 2021-1A, Class C, 2.05% 20253,6 810 814Hertz Vehicle Financing LLC, Series 2021-2A, Class A, 1.68% 20273,6 19,539 19,606Hertz Vehicle Financing LLC, Series 2021-2A, Class B, 2.12% 20273,6 1,264 1,271Hertz Vehicle Financing LLC, Series 2021-2A, Class C, 2.52% 20273,6 859 865Hertz Vehicle Financing LLC, Rental Car Asset-Backed Notes, Series 2016-2A, Class B,
3.94% 20223,6 10 10Hertz Vehicle Financing LLC, Rental Car Asset-Backed Notes, Series 2016-4A, Class A,
2.65% 20223,6 281 282Hertz Vehicle Financing LLC, Rental Car Asset-Backed Notes, Series 2019-3A, Class A,
2.67% 20253,6 758 762Hertz Vehicle Financing LLC, Rental Car Asset-Backed Notes, Series 2019-2A, Class A,
3.42% 20253,6 430 430Madison Park Funding, Ltd., CLO, Series 2015-17A, Class AR2,
(3-month USD-LIBOR + 1.00%) 1.186% 20303,6,7 900 900Marathon CLO, Ltd., Series 2017-9A, Class A1AR,
(3-month USD-LIBOR + 1.15%) 1.334% 20293,6,7 1,050 1,050Navient Student Loan Trust, Series 2021-C, Class A, 1.06% 20693,6 6,263 6,282Nelnet Student Loan Trust, Series 2021-A, Class APT1, 1.36% 20623,6 8,260 8,271Nelnet Student Loan Trust, Series 2021-BA, Class AFX, 1.42% 20623,6 18,392 18,457Newark BSL CLO 2, Ltd., Series 2017-1A, Class A1R,
(3-month USD-LIBOR + 0.97%) 1.146% 20303,6,7 275 275Palmer Square Loan Funding, CLO, Series 2019-2, Class A1,
(3-month USD-LIBOR + 0.97%) 1.158% 20273,6,7 1,106 1,107Palmer Square Loan Funding, CLO, Series 2019-1A, Class A1,
(3-month USD-LIBOR + 1.05%) 1.238% 20273,6,7 1,933 1,934Palmer Square Loan Funding, CLO, Series 2020-4, Class A1,
(3-month USD-LIBOR + 1.00%) 1.147% 20283,6,7 2,209 2,211Palmer Square Loan Funding, CLO, Series 2021-1, Class A1,
(3-month USD-LIBOR + 0.90%) 1.055% 20293,6,7 450 450PFS Financing Corp., Series 2021-B, Class A, 0.775% 20263,6 7,884 7,851
TheBondFundof America (formerly Bond Fund) (continued)

American Funds Insurance Series 165
Bonds, notes & other debt instruments (continued)Principal amount
(000)Value(000)
Asset-backed obligations (continued)
Prestige Auto Receivables Trust, Series 2019-1A, Class C, 2.70% 20243,6 $ 2,190 $ 2,228Prestige Auto Receivables Trust, Series 2019-1A, Class D, 3.01% 20253,6 1,355 1,390Santander Drive Auto Receivables Trust, Series 2021-2, Class B, 0.59% 20256 1,510 1,513Santander Drive Auto Receivables Trust, Series 2019-2, Class D, 3.22% 20256 3,110 3,214Santander Drive Auto Receivables Trust, Series 2021-2, Class C, 0.90% 20266 2,812 2,819Santander Drive Auto Receivables Trust, Series 2020-3, Class C, 1.12% 20266 3,344 3,375Santander Drive Auto Receivables Trust, Series 2020-3, Class D, 1.64% 20266 2,211 2,241Santander Drive Auto Receivables Trust, Series 2021-2, Class D, 1.35% 20276 1,802 1,806Slam, Ltd., Series 2021-1, Class A, 2.434% 20463,6 2,914 2,921Slam, Ltd., Series 2021-1, Class B, 3.422% 20463,6 537 545Sound Point CLO, Ltd., Series 2015-1RA, Class AR,
(3-month USD-LIBOR + 1.08%) 1.264% 20303,6,7 475 475TALAdvantage V LLC, Series 2020-1A, Class A, 2.05% 20453,6 3,584 3,619Textainer Marine Containers, Ltd., Series 2020-2A, Class A, 2.10% 20453,6 2,638 2,662Textainer Marine Containers, Ltd., Series 2020-1A, Class A, 2.73% 20453,6 5,297 5,393Textainer Marine Containers, Ltd., Series 2021-1A, Class A, 1.68% 20463,6 7,061 7,003Textainer Marine Containers, Ltd., Series 2021-2A, Class A, 2.23% 20463,6 5,960 6,052Textainer Marine Containers, Ltd., Series 2021-1A, Class B, 2.52% 20463,6 424 422Toyota Auto Loan Extended Note Trust, Series 2019-1, Class A, 2.56% 20313,6 6,000 6,330Triton Container Finance LLC, Series 2020-1A, Class A, 2.11% 20453,6 12,060 12,156Triton Container Finance LLC, Series 2021-1A, Class A, 1.86% 20463,6 4,831 4,814Triton Container Finance LLC, Series 2021-1A, Class B, 2.58% 20463,6 398 396Westlake Automobile Receivables Trust, Series 2020-3A, Class C, 1.24% 20253,6 1,557 1,572Westlake Automobile Receivables Trust, Series 2021-2, Class B, 0.62% 20263,6 1,690 1,691Westlake Automobile Receivables Trust, Series 2021-2, Class C, 0.89% 20263,6 2,181 2,183Westlake Automobile Receivables Trust, Series 2021-2, Class D, 1.23% 20263,6 1,446 1,447Westlake Automobile Receivables Trust, Series 2020-3A, Class D, 1.65% 20263,6 3,023 3,063
437,918
Municipals 1.71%
California0.06%
G.O. Bonds, Series 2009, 7.50% 2034 2,100 3,312High-Speed Passenger Train G.O. Rev. Ref. Bonds, Series 2017-A, 2.367% 2022 3,775 3,838
7,150
Illinois1.57%
City of Chicago, Board of Education, Unlimited Tax G.O. Bonds (Dedicated Rev.),Series 2010-C, 6.319% 2029 65 80
City of Chicago, Board of Education, Unlimited Tax G.O. Bonds (Dedicated Rev.),Series 2009-E, 6.138% 2039 30,835 37,690
City of Chicago, Board of Education, Unlimited Tax G.O. Bonds (Dedicated Rev.),Series 2010-D, 6.519% 2040 8,945 11,436
City of Chicago, Board of Education, Unlimited Tax G.O. Bonds(Qualified School Construction Bonds), Series 2009-G, 1.75% 2025 2,500 2,418
G.O. Bonds, Series 2013-B, 4.11% 2022 750 764G.O. Bonds, Series 2013-B, 4.31% 2023 2,125 2,220G.O. Bonds, Pension Funding, Series 2003, 4.95% 2023 16,192 17,308G.O. Bonds, Pension Funding, Series 2003, 5.10% 2033 107,000 125,902G.O. Bonds, Taxable Build America Bonds, Series 2010-5, 6.20% 2021 1,946 1,946G.O. Bonds, Taxable Build America Bonds, Series 2010-2, 5.85% 2022 2,370 2,438G.O. Bonds, Taxable Build America Bonds, Series 2010-2, 5.95% 2023 3,210 3,435
205,637
New York0.05%
Dormitory Auth., Taxable State Personal Income Tax Rev. Bonds (General Purpose),Series 2021-C, 2.202% 2034 6,390 6,459
TheBondFundof America (formerly Bond Fund) (continued)

166 American Funds Insurance Series
Bonds, notes & other debt instruments (continued)Principal amount
(000)Value(000)
Municipals (continued)
Texas0.03%
Grand Parkway Transportation Corp., Grand Parkway System Toll Rev. Ref. Bonds,Series 2020-B, 3.236% 2052 $ 4,075 $ 4,170
Total municipals 223,416
Bonds & notes of governments & government agencies outside the U.S. 0.82%
Colombia (Republic of) 5.75% 2027 COP24,813,800 6,335Dominican Republic 5.95% 20273 $ 8,100 9,129Panama Bonos Del Tesoro 3.362% 2031 15,625 15,685Paraguay (Republic of) 5.00% 2026 1,250 1,427Peru (Republic of) 5.94% 2029 PEN6,005 1,709Peru (Republic of) 2.783% 2031 $ 3,790 3,871Peru (Republic of) 6.15% 2032 PEN5,695 1,553Philippines (Republic of) 3.20% 2046 $ 4,900 4,924Portuguese Republic 5.125% 2024 24,775 28,148PT Indonesia Asahan Aluminium Tbk 5.23% 20213 1,862 1,895PT Indonesia Asahan Aluminium Tbk 5.71% 20233 1,020 1,128PT Indonesia Asahan Aluminium Tbk 4.75% 20253 1,270 1,403PT Indonesia Asahan Aluminium Tbk 5.45% 20303 340 396PT Indonesia Asahan Aluminium Tbk 5.80% 20503 1,150 1,362Qatar (State of) 4.50% 20283 5,100 6,028Qatar (State of) 5.103% 20483 3,400 4,522Saudi Arabia (Kingdom of) 3.628% 20273 5,000 5,516Saudi Arabia (Kingdom of) 3.625% 20283 11,435 12,658
107,689
Federal agency bonds & notes 0.10%
Fannie Mae 2.125% 20261 11,910 12,620
Total bonds, notes & other debt instruments (cost: $12,255,833,000) 12,682,238
Short-term securities 8.82% Shares
Money market investments 8.82%
Capital Group Central Cash Fund 0.04%11,12 11,531,431 1,153,143
Total short-term securities (cost: $1,153,188,000) 1,153,143
Total investment securities 105.87% (cost: $13,409,021,000) 13,835,381
Other assets less liabilities (5.87)% (767,671)
Net assets 100.00% $13,067,710
Futures contracts
Contracts TypeNumber ofcontracts Expiration
Notionalamount13
(000)
Value at6/30/202114
(000)
Unrealizedappreciation
(depreciation)at 6/30/2021
(000)
90 Day Euro Dollar Futures Long 2,010 December 2022 $ 502,500 $ 499,887 $ 272 Year U.S. Treasury Note Futures Long 1,886 October 2021 377,200 415,524 (442)5 Year U.S. Treasury Note Futures Long 6,253 October 2021 625,300 771,806 (1,738)10 Year U.S. Treasury Note Futures Short 3,423 September 2021 (342,300) (453,548) (1,223)10 Year Ultra U.S. Treasury Note Futures Short 8,245 September 2021 (824,500) (1,213,690) (17,860)
TheBondFundof America (formerly Bond Fund) (continued)

American Funds Insurance Series 167
Futures contracts (continued)
Contracts TypeNumber ofcontracts Expiration
Notionalamount13
(000)
Value at6/30/202114
(000)
Unrealizedappreciation
(depreciation)at 6/30/2021
(000)
20 Year U.S. Treasury Bond Futures Long 1,761 September 2021 $ 176,100 $ 283,081 $ 6,40130 Year Ultra U.S. Treasury Bond Futures Long 1,486 September 2021 148,600 286,334 8,734
$ (6,101)
Forward currency contracts
Contract amount
CounterpartySettlement
date
Unrealizedappreciation
(depreciation)at 6/30/2021
(000)Purchases
(000)Sales(000)
USD1,704 PEN6,550 Morgan Stanley 7/6/2021 $ 2PEN6,550 USD1,707 Morgan Stanley 7/6/2021 (5)USD6,649 COP24,638,500 Goldman Sachs 7/19/2021 90USD1,711 PEN6,550 Morgan Stanley 8/6/2021 5USD1,704 PEN6,550 Morgan Stanley 9/3/2021 (3)
$89
Swap contracts
Interest rate swaps
Receive PayExpiration
dateNotional
(000)
Value at6/30/2021
(000)
Upfrontpremium
paid(000)
Unrealizeddepreciationat 6/30/2021
(000)
3-month USD-LIBOR 1.972% 4/26/2051 $23,200 $(1,234) $ 421 $ (1,655)3-month USD-LIBOR 1.9855% 4/26/2051 34,500 (1,949) 516 (2,465)3-month USD-LIBOR 1.953% 4/27/2051 23,100 (1,122) 523 (1,645)3-month USD-LIBOR 1.9895% 4/27/2051 35,700 (2,051) 501 (2,552)3-month USD-LIBOR 1.9778% 4/28/2051 13,500 (737) 227 (964)3-month USD-LIBOR 2.0295% 5/5/2051 30,800 (2,070) — (2,070)3-month USD-LIBOR 1.759% 6/24/2051 27,250 (39) — (39)
$2,188 $(11,390)
Credit default swaps
Centrally cleared credit default swaps on credit indices — sell protection
Receive/Payment frequency Pay
Expirationdate
Notional(000)
Value at6/30/2021
(000)
Upfrontpremium
paid(000)
Unrealizedappreciationat 6/30/2021
(000)
1.00%/Quarterly CDX.NA.IG.36 6/20/2026 $79,545 $2,020 $1,932 $88
TheBondFundof America (formerly Bond Fund) (continued)

168 American Funds Insurance Series
Investments in affiliates12
Value ofaffiliate at1/1/2021
(000)Additions
(000)Reductions
(000)
Netrealized
loss(000)
Netunrealized
depreciation(000)
Value ofaffiliate at6/30/2021
(000)
Dividendincome
(000)
Short-term securities 8.82%Money market investments 8.82%
Capital Group Central Cash Fund 0.04%11 $2,690,045 $3,231,675 $4,768,460 $(54) $(63) $1,153,143 $990
1All or a portion of this security was pledged as collateral. The total value of pledged collateral was $38,469,000, which represented .29% of the net assets ofthe fund.
2Index-linked bond whose principal amount moves with a government price index.3Acquired in a transaction exempt from registration under Rule 144A of the Securities Act of 1933. May be resold in the U.S. in transactions exempt fromregistration, normally to qualified institutional buyers. The total value of all such securities was $1,451,982,000, which represented 11.11% of the net assets ofthe fund.
4Step bond; coupon rate may change at a later date.5Payment in kind; the issuer has the option of paying additional securities in lieu of cash. Most recent payment was 100% cash unless otherwise noted.6Principal payments may be made periodically. Therefore, the effective maturity date may be earlier than the stated maturity date.7Coupon rate may change periodically. Reference rate and spread are as of the most recent information available. Some coupon rates are determined by theissuer or agent based on current market conditions; therefore, the reference rate and spread are not available.
8Amount less than one thousand.9Purchased on a TBA basis.
10Valued under fair value procedures adopted by authority of the board of trustees. The total value of the security was $25,588,000, which represented .20% ofthe net assets of the fund.
11Rate represents the seven-day yield at 6/30/2021.12Part of the same “group of investment companies“ as the fund as defined under the Investment Company Act of 1940, as amended.13Notional amount is calculated based on the number of contracts and notional contract size.14Value is calculated based on the notional amount and current market price.
Key to abbreviations and symbolAuth. = AuthorityCLO = Collateralized Loan ObligationsCOP = Colombian pesosG.O. = General ObligationICE = Intercontinental Exchange, Inc.LIBOR = London Interbank Offered RatePEN = Peruvian nuevos solesRef. = RefundingSOFR = Secured Overnight Financing RateTBA = To-be-announcedUSD/$ = U.S. dollars
See notes to financial statements.
TheBondFundof America (formerly Bond Fund) (continued)

American Funds Insurance Series 169
Bonds, notes & other debt instruments 93.11%Principal amount
(000)Value(000)
Euros17.03%
Allianz SE 4.75% perpetual bonds(3-month EUR-EURIBOR + 3.60% on 10/24/2023)1 € 4,200 $ 5,496
Altria Group, Inc. 1.00% 2023 1,020 1,229Altria Group, Inc. 1.70% 2025 1,600 1,997Altria Group, Inc. 2.20% 2027 2,900 3,717American Honda Finance Corp. 1.60% 2022 620 747American Honda Finance Corp. 1.95% 2024 560 709American Tower Corp. 0.45% 2027 2,525 2,998American Tower Corp. 0.875% 2029 1,470 1,759AT&T, Inc. 1.60% 2028 2,350 2,990Bank of America Corp. 3.648% 2029
(3-month EUR-EURIBOR + 3.67% on 3/31/2028)1,2 5,000 7,169Barclays Bank PLC 6.625% 2022 1,070 1,333CaixaBank, SA 2.25% 2030
(5-year EUR Annual (vs. 6-month EUR-EURIBOR) + 1.68% on 4/17/2025)1 2,400 2,984Comcast Corp. 0.25% 2027 1,250 1,490Cote d’Ivoire (Republic of) 5.25% 2030 900 1,118Cote d’Ivoire (Republic of) 5.875% 2031 840 1,073Deutsche Telekom International Finance BV 7.50% 2033 200 411Dow Chemical Co. 0.50% 2027 1,110 1,327Egypt (Arab Republic of) 5.625% 2030 745 890European Financial Stability Facility 0.40% 2025 6,000 7,329European Union 0% 2031 1,905 2,255European Union 0% 2035 220 249European Union 0.20% 2036 390 451French Republic O.A.T. 0% 2030 27,070 32,005Germany (Federal Republic of) 0% 2030 14,570 17,788Germany (Federal Republic of) 0% 2030 5,950 7,250Germany (Federal Republic of) 0% 2036 5,150 6,058Germany (Federal Republic of) 0% 2050 9,240 10,076Goldman Sachs Group, Inc. 3.375% 20252 5,000 6,650Goldman Sachs Group, Inc. 1.00% 20332 2,705 3,216Greece (Hellenic Republic of) 3.375% 2025 21,435 28,649Greece (Hellenic Republic of) 0.75% 2031 1,660 1,955Greece (Hellenic Republic of) 1.875% 2052 1,690 2,108Groupe BPCE SA 4.625% 2023 1,200 1,560Groupe BPCE SA 1.00% 2025 2,900 3,557Honeywell International, Inc. 0.75% 2032 370 446Intesa Sanpaolo SpA 6.625% 2023 510 685Ireland (Republic of) 0.20% 2030 900 1,081Israel (State of) 2.875% 2024 1,180 1,514Israel (State of) 1.50% 2027 775 994Israel (State of) 1.50% 2029 725 943Italy (Republic of) 1.85% 2025 21,390 27,267Italy (Republic of) 0.95% 2027 1,745 2,149Italy (Republic of) 0.25% 2028 15,970 18,755Italy (Republic of) 2.80% 2028 5,828 8,076Italy (Republic of) 1.35% 2030 1,657 2,081Italy (Republic of) 1.65% 2030 7,400 9,500JPMorgan Chase & Co. 0.389% 2028
(3-month EUR-EURIBOR + 0.65% on 2/24/2027)1,2 3,208 3,819Latvia (Republic of) 0% 2031 1,280 1,499Lloyds Banking Group PLC 1.75% 2028 (5-year EUR-EURIBOR + 1.30% on 9/7/2023)1 2,400 2,948Morocco (Kingdom of) 3.50% 2024 1,400 1,819Morocco (Kingdom of) 1.375% 2026 1,130 1,361Morocco (Kingdom of) 2.00% 2030 1,285 1,512Morocco (Kingdom of) 1.50% 2031 4,100 4,574Petroleos Mexicanos 5.50% 2025 2,520 3,279Philippines (Republic of) 0.25% 2025 1,470 1,751Philippines (Republic of) 0.70% 2029 940 1,111Portuguese Republic 0.475% 2030 1,610 1,947Quebec (Province of) 0.25% 2031 920 1,090
CapitalWorld Bond FundInvestment portfolio June 30, 2021 unaudited

170 American Funds Insurance Series
Bonds, notes & other debt instruments (continued)Principal amount
(000)Value(000)
Euros(continued)
Romania 3.624% 2030 €7,175 $ 9,855Romania 2.00% 2032 1,605 1,928Romania 2.00% 2033 6,910 8,146Romania 3.375% 2038 4,170 5,432Russian Federation 2.875% 2025 4,500 5,840Serbia (Republic of) 3.125% 2027 11,497 15,193Serbia (Republic of) 1.50% 2029 4,943 5,918Spain (Kingdom of) 0.80% 2027 2,280 2,844Spain (Kingdom of) 1.45% 2029 1,890 2,467Spain (Kingdom of) 1.25% 2030 4,740 6,087Spain (Kingdom of) 0.50% 2031 765 909Spain (Kingdom of) 2.70% 2048 850 1,323State Grid Europe Development PLC 1.50% 2022 194 232State Grid Overseas Investment, Ltd. 1.25% 2022 765 917State Grid Overseas Investment, Ltd. 1.375% 2025 441 546State Grid Overseas Investment, Ltd. 2.125% 2030 200 260Stryker Corp. 0.25% 2024 480 575Stryker Corp. 0.75% 2029 980 1,190Stryker Corp. 1.00% 2031 450 551Takeda Pharmaceutical Company, Ltd. 2.25% 2026 2,275 2,984Tunisia (Republic of) 6.75% 2023 5,209 5,993Turkey (Republic of) 4.375% 2027 950 1,119Ukraine 6.75% 2026 4,344 5,632Ukraine 4.375% 2030 2,705 3,003Verizon Communications, Inc. 0.375% 2029 3,470 4,082
363,820
Japanese yen10.19%
Export-Import Bank of India 0.59% 2022 ¥ 400,000 3,593Goldman Sachs Group, Inc. 2.80% 20222 100,000 914Groupe BPCE SA 0.64% 2022 400,000 3,610Indonesia (Republic of) 0.54% 2022 100,000 903Intesa Sanpaolo SpA 1.36% 2022 600,000 5,429Japan, Series 19, 0.10% 20243 1,844,567 16,863Japan, Series 18, 0.10% 20243 1,024,182 9,354Japan, Series 20, 0.10% 20253 680,720 6,235Japan, Series 21, 0.10% 20263 989,215 9,098Japan, Series 346, 0.10% 2027 2,525,700 22,984Japan, Series 23, 0.10% 20283 1,993,182 18,413Japan, Series 356, 0.10% 2029 3,529,000 32,083Japan, Series 24, 0.10% 20293 1,608,477 14,895Japan, Series 116, 2.20% 2030 576,100 6,178Japan, Series 145, 1.70% 2033 1,851,000 19,739Japan, Series 152, 1.20% 2035 1,442,500 14,712Japan, Series 21, 2.30% 2035 720,000 8,378Japan, Series 173, 0.40% 2040 492,000 4,410Japan, Series 37, 0.60% 2050 694,500 6,129Japan, Series 70, 0.70% 2051 335,500 3,028KT Corp. 0.38% 2021 200,000 1,800Philippines (Republic of) 0.001% 2024 900,000 8,048United Mexican States 0.62% 2022 100,000 903
217,699
Chinese yuanrenminbi9.06%
Agricultural Development Bank of China 3.75% 2029 CNY9,850 1,548Agricultural Development Bank of China 2.96% 2030 90,980 13,498China (People’s Republic of), Series 1916, 3.12% 2026 85,830 13,383China (People’s Republic of), Series INBK, 2.85% 2027 79,290 12,141China (People’s Republic of), Series IMBK, 3.28% 2027 1,650 259China (People’s Republic of), Series 1906, 3.29% 2029 73,800 11,573China (People’s Republic of), Series INBK, 3.27% 2030 58,490 9,174China (People’s Republic of), Series 1910, 3.86% 2049 205,560 32,810
CapitalWorld Bond Fund (continued)

American Funds Insurance Series 171
Bonds, notes & other debt instruments (continued)Principal amount
(000)Value(000)
Chinese yuanrenminbi(continued)
China (People’s Republic of), Series INBK, 3.39% 2050 CNY17,330 $ 2,543China Development Bank Corp., Series 1814, 4.15% 2025 20,900 3,349China Development Bank Corp., Series 1909, 3.50% 2026 10,400 1,624China Development Bank Corp., Series 1904, 3.68% 2026 11,700 1,841China Development Bank Corp., Series 2009, 3.39% 2027 11,130 1,723China Development Bank Corp., Series 2004, 3.43% 2027 192,390 29,880China Development Bank Corp., Series 1805, 4.04% 2028 131,350 21,044China Development Bank Corp., Series 1805, 4.88% 2028 33,380 5,605China Development Bank Corp., Series 1905, 3.48% 2029 128,200 19,817China Development Bank Corp., Series 2005, 3.07% 2030 78,250 11,707
193,519
British pounds3.36%
American Honda Finance Corp. 0.75% 2026 £ 1,420 1,939France Télécom 5.375% 2050 300 676Lloyds Banking Group PLC 7.625% 2025 655 1,125United Kingdom 2.75% 2024 1,210 1,810United Kingdom 4.25% 2027 2,800 4,801United Kingdom 0.375% 2030 4,970 6,643United Kingdom 4.75% 2030 14,360 27,157United Kingdom 0.625% 2035 9,062 11,808United Kingdom 0.875% 2046 6,030 7,675United Kingdom 0.625% 2050 2,805 3,299United Kingdom 1.25% 2051 3,560 4,930
71,863
Danish kroner2.49%
Nordea Kredit 0.50% 20404 DKr19,129 2,924Nykredit Realkredit AS, Series 01E, 0.50% 20404 144,109 22,106Nykredit Realkredit AS, Series 01E, 0.50% 20434 184,657 28,091
53,121
Brazilian reais2.43%
Brazil (Federative Republic of) 0% 2021 BRL147,000 29,191Brazil (Federative Republic of) 6.00% 20223 57,071 11,998Brazil (Federative Republic of) 6.00% 20243 49,223 10,680
51,869
Canadian dollars2.10%
Canada 1.00% 2022 C$1,050 854Canada 2.25% 2025 15,900 13,544Canada 0.25% 2026 5,800 4,524Canada 2.25% 2029 26,105 22,667Canada 2.75% 2048 3,500 3,388
44,977
Mexican pesos1.96%
Petróleos Mexicanos 7.19% 2024 MXN83,847 3,986Petróleos Mexicanos 7.47% 2026 95,267 4,293United Mexican States, Series M, 7.50% 2027 412,420 21,583United Mexican States, Series M20, 8.50% 2029 140,400 7,757United Mexican States, Series M30, 8.50% 2038 21,100 1,171United Mexican States, Series M, 8.00% 2047 56,500 2,992
41,782
Russian rubles1.67%
Russian Federation 7.00% 2023 RUB430,300 5,919Russian Federation 7.15% 2025 436,320 6,033Russian Federation 6.90% 2029 403,750 5,501Russian Federation 7.65% 2030 712,330 10,141Russian Federation 5.90% 2031 79,600 1,000
CapitalWorld Bond Fund (continued)

172 American Funds Insurance Series
Bonds, notes & other debt instruments (continued)Principal amount
(000)Value(000)
Russian rubles(continued)
Russian Federation 8.50% 2031 RUB82,440 $ 1,244Russian Federation 7.70% 2033 295,840 4,244Russian Federation 7.25% 2034 121,920 1,691
35,773
Australian dollars1.23%
Australia (Commonwealth of), Series 163, 1.00% 2031 A$32,670 23,263Australia (Commonwealth of), Series 162, 1.75% 2051 4,620 3,067
26,330
Malaysianringgits1.09%
Malaysia (Federation of), Series 0310, 4.498% 2030 MYR8,420 2,217Malaysia (Federation of), Series 0418, 4.893% 2038 45,447 11,887Malaysia (Federation of), Series 0519, 3.757% 2040 40,283 9,134
23,238
Indonesian rupiah0.70%
Indonesia (Republic of), Series 84, 7.25% 2026 IDR22,733,000 1,679Indonesia (Republic of), Series 56, 8.375% 2026 6,725,000 522Indonesia (Republic of), Series 59, 7.00% 2027 11,000,000 805Indonesia (Republic of), Series 78, 8.25% 2029 53,220,000 4,098Indonesia (Republic of), Series 82, 7.00% 2030 39,572,000 2,827Indonesia (Republic of), Series 87, 6.50% 2031 17,649,000 1,210Indonesia (Republic of), Series 74, 7.50% 2032 7,073,000 516Indonesia (Republic of), Series 65, 6.625% 2033 17,683,000 1,217Indonesia (Republic of), Series 68, 8.375% 2034 27,353,000 2,092
14,966
Colombian pesos0.52%
Colombia (Republic of) 5.75% 2027 COP14,059,000 3,589Colombia (Republic of) 7.25% 2050 31,167,000 7,607
11,196
South Korean won0.43%
South Korea (Republic of), Series 2503, 1.50% 2025 KRW5,183,670 4,582South Korea (Republic of), Series 2712, 2.375% 2027 5,158,930 4,701
9,283
Indian rupees0.38%
India (Republic of) 5.15% 2025 INR331,570 4,382National Highways Authority of India 7.17% 2021 220,000 3,005National Highways Authority of India 7.27% 2022 50,000 691
8,078
Czech korunas0.37%
Czech Republic 0% 2024 CZK72,100 3,197Czech Republic 1.25% 2025 102,510 4,723
7,920
Ukrainian hryvnia0.35%
Ukraine 16.06% 2022 UAH86,536 3,358Ukraine 17.00% 2022 60,180 2,331Ukraine 17.25% 2022 47,384 1,819
7,508
Norwegian kroner0.32%
Norway (Kingdom of) 1.75% 2025 NKr56,450 6,735
CapitalWorld Bond Fund (continued)

American Funds Insurance Series 173
Bonds, notes & other debt instruments (continued)Principal amount
(000)Value(000)
Ghanaian cedi0.13%
Ghana (Republic of) 18.85% 2023 GHS15,260 $2,723
South African rand0.11%
South Africa (Republic of) 8.00% 2030 ZAR7,920 527South Africa (Republic of), Series R-2048, 8.75% 2048 30,850 1,831
2,358
Peruviannuevos soles0.08%
Peru (Republic of) 6.15% 2032 PEN5,980 1,631
Polish zloty0.07%
Poland (Republic of), Series 1029, 2.75% 2029 PLN4,900 1,407
Romanian leu0.06%
Romania 4.75% 2025 RON5,000 1,295
U.S. dollars36.98%
7-Eleven, Inc. 0.95% 20262 $ 520 5117-Eleven, Inc. 1.80% 20312 2,015 1,929Abbott Laboratories 3.40% 2023 137 146AbbVie, Inc. 2.90% 2022 1,170 1,209AbbVie, Inc. 3.20% 2022 200 207Abu Dhabi (Emirate of) 2.50% 20252 2,195 2,335ACE INA Holdings, Inc. 2.875% 2022 195 201ACE INA Holdings, Inc. 3.35% 2026 195 214ACE INA Holdings, Inc. 4.35% 2045 425 538Advisor Group Holdings, LLC 6.25% 20282 425 449Aetna, Inc. 2.80% 2023 340 354Affinity Gaming 6.875% 20272 390 415AGMerger Sub II, Inc. 10.75% 20272 311 346Albertsons Companies, Inc. 3.50% 20292 125 124Alcoa Netherlands Holding BV 5.50% 20272 200 217Alcoa Netherlands Holding BV 4.125% 20292 75 78Alexandria Real Estate Equities, Inc. 1.875% 2033 2,047 1,939Alliant Holdings Intermediate, LLC 6.75% 20272 410 431Allied Universal Holdco LLC 9.75% 20272 325 358Allied Universal Holdco LLC 6.00% 20292 500 508Allison Transmission Holdings, Inc. 3.75% 20312 100 98Allstate Corp. 0.75% 2025 1,563 1,548Almonde, Inc., Term Loan, (3-month USD-LIBOR + 7.25%) 8.25% 20255,6 650 658Altice France SA 5.125% 20292 200 201Altice NV 7.50% 20262 50 52Altria Group, Inc. 5.95% 2049 131 168Amazon.com, Inc. 1.50% 2030 2,040 1,996Amazon.com, Inc. 2.50% 2050 2,500 2,368American Airlines, Inc. 5.50% 20262 200 212American Airlines, Inc. 5.75% 20292 200 217American Campus Communities, Inc. 3.75% 2023 1,810 1,898American Campus Communities, Inc. 4.125% 2024 1,195 1,301American Campus Communities, Inc. 3.875% 2031 514 571American Electric Power Company, Inc. 1.00% 2025 250 248Amgen, Inc. 1.90% 2025 580 601Amgen, Inc. 2.20% 2027 445 462Amipeace, Ltd. 2.50% 2024 4,100 4,298Anglo American Capital PLC 2.25% 20282 454 460Anglo American Capital PLC 3.95% 20502 521 567Angola (Republic of) 9.50% 2025 2,400 2,634
CapitalWorld Bond Fund (continued)

174 American Funds Insurance Series
Bonds, notes & other debt instruments (continued)Principal amount
(000)Value(000)
U.S. dollars(continued)
Anheuser-Busch InBev NV 4.75% 2029 $2,535 $3,022Anheuser-Busch InBev NV 4.50% 2050 2,250 2,743Antero Resources Corp. 5.375% 20302 80 82Apache Corp. 4.625% 2025 100 108Apache Corp. 4.375% 2028 171 182Apache Corp. 5.10% 2040 100 105Apollo Commercial Real Estate Finance, Inc. 4.625% 20292 325 321Apple, Inc. 3.35% 2027 1,075 1,195Apple, Inc. 2.40% 2050 1,100 1,034Ardagh Group SA 6.50% 20272,7 210 221Ardagh Metal Packaging Finance USA LLC 4.00% 20292 200 199Ardagh Packaging Finance 5.25% 20272 200 204Aretec Escrow Issuer, Inc. 7.50% 20292 495 511Argentine Republic 0.125% 2030 (0.50% on 7/9/2021)1 1,921 693Argentine Republic 0.125% 2035 (1.125% on 7/9/2021)1 3,025 965Arthur J. Gallagher & Co. 2.50% 2031 208 210Arthur J. Gallagher & Co. 3.50% 2051 34 36Ascent Resources - Utica LLC 8.25% 20282 230 253Ascent Resources - Utica LLC 5.875% 20292 100 100Associated Materials, LLC 9.00% 20252 400 425AssuredPartners, Inc. 7.00% 20252 200 205AssuredPartners, Inc. 5.625% 20292 230 230AstraZeneca Finance LLC 1.75% 2028 685 685AstraZeneca Finance LLC 2.25% 2031 100 102AstraZeneca PLC 3.50% 2023 2,700 2,869AstraZeneca PLC 3.00% 2051 657 681Atkore, Inc. 4.25% 20312 135 137ATS Automation Tooling Systems, Inc. 4.125% 20282 230 236Avantor Funding, Inc. 4.625% 20282 200 211Avis Budget Car Rental, LLC 5.75% 20272 185 193Avis Budget Group, Inc. 5.25% 20252 75 76Avis Budget Group, Inc. 4.75% 20282 100 103Avis Budget Group, Inc. 5.375% 20292 95 99Axalta Coating Systems LLC 4.75% 20272 200 210Axiata SPV2 Bhd. 2.163% 2030 651 643Azul Investments LLP 7.25% 20262 300 295B&G Foods, Inc. 5.25% 2025 100 103B&G Foods, Inc. 5.25% 2027 210 219Baidu, Inc. 3.425% 2030 675 732Banff Merger Sub, Inc. 9.75% 20262 210 221Bank of America Corp. 2.456% 2025 (3-month USD-LIBOR + 0.87% on 10/22/2024)1 847 887Bank of America Corp. 1.197% 2026 (USD-SOFR + 1.01% on 10/24/2025)1 7,710 7,645Bank of America Corp. 1.658% 2027 (USD-SOFR + 0.91% on 3/11/2026)1 4,600 4,639Bank of America Corp. 1.734% 2027 (USD-SOFR + 0.96% on 7/22/2026)1 3,745 3,776Bausch Health Companies, Inc. 9.25% 20262 795 866Bausch Health Companies, Inc. 5.75% 20272 200 213Bausch Health Companies, Inc. 4.875% 20282 245 251Bausch Health Companies, Inc. 5.00% 20282 215 204Bausch Health Companies, Inc. 5.25% 20312 235 220Bayer AG 3.375% 20242 840 903Bayer US Finance II LLC 4.25% 20252 203 226Bayerische MotorenWerke AG 2.95% 20222 3,675 3,755Bayerische MotorenWerke AG 3.90% 20252 900 993Bayerische MotorenWerke AG 4.15% 20302 900 1,051Beasley Mezzanine Holdings, LLC 8.625% 20262 125 127Belarus (Republic of) 7.625% 2027 2,100 2,055Berkshire Hathaway Energy Company 2.85% 2051 300 291Black Knight, Inc. 3.625% 20282 335 334Blue Racer Midstream LLC and Blue Racer Finance Corp. 7.625% 20252 120 130BMC Software, Inc. 7.125% 20252 70 75BMC Software, Inc. 9.125% 20262 150 159BNP Paribas 2.871% 2032 (USD-SOFR + 1.387% on 4/19/2032)1,2 1,275 1,310
CapitalWorld Bond Fund (continued)

American Funds Insurance Series 175
Bonds, notes & other debt instruments (continued)Principal amount
(000)Value(000)
U.S. dollars(continued)
Boeing Company 5.15% 2030 $4,000 $4,740Bombardier, Inc. 6.125% 20232 65 69Bombardier, Inc. 7.50% 20252 125 129Bombardier, Inc. 7.125% 20262 175 183Bombardier, Inc. 7.875% 20272 325 338Bombardier, Inc. 7.45% 20342 125 134Booz Allen Hamilton, Inc. 4.00% 20292 15 15Boyd Gaming Corp. 4.75% 2027 220 228Boyd Gaming Corp. 4.75% 20312 90 93Boyne USA, Inc. 4.75% 20292 45 47BP Capital Markets America, Inc. 2.939% 2051 2,280 2,188Brandywine Operating Partnership LP 3.95% 2023 190 198Braskem SA 4.50% 20302 745 778Brightstar Escrow Corp. 9.75% 20252 180 194Bristow Group, Inc. 6.875% 20282 175 179British American Tobacco PLC 2.789% 2024 1,150 1,209British American Tobacco PLC 3.215% 2026 955 1,014British American Tobacco PLC 3.557% 2027 1,545 1,655British American Tobacco PLC 3.462% 2029 1,150 1,216British American Tobacco PLC 4.758% 2049 894 971Broadcom, Inc. 3.15% 2025 212 227Broadcom, Inc. 4.15% 2030 1,450 1,628Broadcom, Inc. 3.419% 20332 698 734Broadcom, Inc. 3.469% 20342 48 51Broadcom, Inc. 3.75% 20512 926 968BroadStreet Partners, Inc. 5.875% 20292 250 256Brookfield Property REIT, Inc. 5.75% 20262 820 863Brookfield Residential Properties, Inc. 5.00% 20292 100 101Burger King Corp. 3.875% 20282 150 152BWX Technologies, Inc. 4.125% 20292 265 270Cablevision Systems Corp. 6.75% 2021 950 971Caesars Entertainment, Inc. 6.25% 20252 50 53California Resources Corp. 7.125% 20262 100 105Canadian Natural Resources, Ltd. 2.95% 2030 2,343 2,431Carnival Corp. 11.50% 20232 2,630 2,963Carrier Global Corp. 2.242% 2025 530 551Carrols Restaurant Group, Inc. 5.875% 20292 130 129Carvana Co. 5.50% 20272 70 72Catalent, Inc. 3.125% 20292 75 73CCO Holdings LLC and CCO Holdings Capital Corp. 5.75% 20262 159 165CCO Holdings LLC and CCO Holdings Capital Corp. 3.75% 2028 2,650 2,925CCO Holdings LLC and CCO Holdings Capital Corp. 4.50% 20302 975 1,016CCO Holdings LLC and CCO Holdings Capital Corp. 4.75% 20302 165 175CCO Holdings LLC and CCO Holdings Capital Corp. 4.25% 20312 305 311CCO Holdings LLC and CCO Holdings Capital Corp. 4.50% 2032 100 104CCO Holdings LLC and CCO Holdings Capital Corp. 4.50% 20332 282 289CEC Entertainment, Inc. 6.75% 20262 200 206Centene Corp. 4.25% 2027 200 211Centene Corp. 2.45% 2028 105 107Centene Corp. 4.625% 2029 405 446Centene Corp. 2.50% 2031 155 153Central Garden & Pet Co. 4.125% 2030 99 101Central Garden & Pet Co. 4.125% 20312 120 122Charles River Laboratories International, Inc. 4.25% 20282 150 155Charles River Laboratories International, Inc. 3.75% 20292 30 30Cheniere Energy Partners LP 5.625% 2026 100 104Cheniere Energy Partners LP 4.50% 2029 210 226Cheniere Energy Partners LP 4.00% 20312 100 105Cheniere Energy, Inc. 4.625% 20282 405 428Chesapeake Energy Corp. 4.875% 20228 915 26Chesapeake Energy Corp. 5.50% 20262 100 106Chesapeake Energy Corp. 5.875% 20292 85 92
CapitalWorld Bond Fund (continued)

176 American Funds Insurance Series
Bonds, notes & other debt instruments (continued)Principal amount
(000)Value(000)
U.S. dollars(continued)
China Construction Bank Corp. (Hong Kong Branch) 1.00% 2023 $6,000 $6,016Cigna Corp. 4.125% 2025 830 931Cigna Corp. 2.40% 2030 380 388Cigna Corp. 2.375% 2031 2,977 3,022Cinemark USA, Inc. 5.875% 20262 75 79Cinemark USA, Inc. 5.25% 20282 100 103Cirsa Gaming Corp. SA 7.875% 20232 400 409Citigroup, Inc. 2.35% 2021 1,500 1,503Citigroup, Inc. 0.981% 2025 (USD-SOFR + 0.669% on 5/1/2024)1 808 810Citigroup, Inc. 3.106% 2026 (USD-SOFR + 2.842% on 3/8/2026)1 4,500 4,818Clarivate Science Holdings Corp. 3.875% 20282 110 111Clarivate Science Holdings Corp. 4.875% 20292 140 144Cleveland-Cliffs, Inc. 9.875% 20252 281 330Cleveland-Cliffs, Inc. 6.75% 20262 315 340Cleveland-Cliffs, Inc. 5.875% 2027 100 105Cleveland-Cliffs, Inc. 4.625% 20292 125 132Cleveland-Cliffs, Inc. 4.875% 20312 200 210CMS Energy Corp. 3.875% 2024 100 107CMS Energy Corp. 3.00% 2026 1,200 1,285CNX Resources Corp. 7.25% 20272 210 225CNX Resources Corp. 6.00% 20292 225 244Cogent Communications Group, Inc. 3.50% 20262 375 384Colombia (Republic of) 3.875% 2027 350 372Comcast Corp. 3.95% 2025 2,610 2,926Commonwealth Bank of Australia 2.688% 20312 4,650 4,653Community Health Systems, Inc. 5.625% 20272 90 96Community Health Systems, Inc. 6.00% 20292 230 246Compass Diversified Holdings 5.25% 20292 365 380Comstock Resources, Inc. 6.75% 20292 140 149Comstock Resources, Inc. 5.875% 20302 175 179Constellation Oil Services Holding SA 10.00% 2024 (100% PIK)2,7,8 2,741 781Constellium SE 3.75% 20292 125 124Consumers Energy Co. 3.375% 2023 345 364Convey Park Energy LLC 7.50% 20252 125 130CoreCivic, Inc. 8.25% 2026 289 300CoreLogic, Inc. 4.50% 20282 584 580CoreLogic, Inc., Term Loan, (3-month USD-LIBOR + 6.50%) 7.00% 20295,6 150 151Corporate Office Properties LP 2.75% 2031 1,212 1,223Costa Rica (Republic of) 6.125% 20312 640 680CQP Holdco LP / BIP-V Chinook Holdco LLC 5.50% 20312 650 678Crédit Agricole SA 4.375% 20252 1,100 1,212Crédit Agricole SA 1.907% 2026 (USD-SOFR + 1.676% on 6/16/2025)1,2 2,675 2,729Credit Suisse Group AG 2.95% 2025 875 937Credit Suisse Group AG 3.091% 2032 (USD-SOFR + 1.73% on 5/14/2031)1,2 1,000 1,032Crestwood Midstream Partners LP 6.00% 20292 150 157Crown Castle International Corp. 2.50% 2031 679 685CSX Corp. 3.80% 2050 75 86CSX Corp. 2.50% 2051 1,075 979CVR Partners LP 9.25% 20232 34 34CVR Partners LP 6.125% 20282 120 123CVS Health Corp. 3.50% 2022 430 442CVS Health Corp. 3.70% 2023 97 102DaimlerChrysler North America Holding Corp. 2.00% 20212 2,100 2,100Dana, Inc. 5.625% 2028 410 445Dana, Inc. 4.25% 2030 80 82Danske Bank AS 2.70% 20222 1,400 1,422Danske Bank AS 3.875% 20232 1,675 1,784Darling Ingredients, Inc. 5.25% 20272 210 221DaVita, Inc. 4.625% 20302 200 206DCP Midstream LP 7.375% junior subordinated perpetual bonds
(3-month USD-LIBOR + 5.148% on 12/15/2022)1 50 49Dell International LLC / EMC Corp. 8.10% 2036 110 168
CapitalWorld Bond Fund (continued)

American Funds Insurance Series 177
Bonds, notes & other debt instruments (continued)Principal amount
(000)Value(000)
U.S. dollars(continued)
Dell International LLC / EMC Corp. 8.35% 2046 $ 81 $ 133Dell, Inc. 6.50% 2038 53 68Dell, Inc. 5.40% 2040 25 30Deluxe Corp. 8.00% 20292 150 163Deutsche Bank AG 2.129% 2026 (USD-SOFR + 1.87% on 11/24/2025)1 850 863Deutsche Bank AG 3.547% 2031 (USD-SOFR + 3.043% on 9/18/2030)1 1,500 1,598Deutsche Telekom International Finance BV 1.95% 20212 575 576Deutsche Telekom International Finance BV 2.82% 20222 1,675 1,693Deutsche Telekom International Finance BV 9.25% 2032 930 1,509Diamond Foreign Asset Co. / Diamond Finance LLC 9.00% 20272,6,7,9,10 30 30Diamond Foreign Asset Co. / Diamond Finance LLC 9.00% 20276,7,9,10 27 27Diamond Sports Group LLC 6.625% 20272 385 190Diebold Nixdorf AG, Term Loan B, (3-month USD-LIBOR + 2.75%) 2.897% 20235,6 108 106Diebold Nixdorf, Inc. 9.375% 20252 630 701Diebold, Inc. 8.50% 2024 150 154Discovery Communications, Inc. 3.625% 2030 468 511Diversified Healthcare Trust 4.375% 2031 300 288Dominican Republic 5.50% 20252 1,375 1,513Dominican Republic 8.625% 20272 225 276Dominican Republic 6.40% 20492 1,613 1,738DPL, Inc. 4.125% 2025 270 290DTMidstream, Inc. 4.125% 20292 185 188Duke Energy Corp. 3.75% 2024 550 592Duke Energy Progress, LLC 3.70% 2028 1,225 1,380Dun & Bradstreet Corp. 6.875% 20262 123 131Edison International 5.75% 2027 370 421Edison International 4.125% 2028 2,390 2,546Egypt (Arab Republic of) 7.50% 20272 2,200 2,478Elastic NV 4.125% 20292 75 75Electricité de France SA 4.875% 20382 795 979Element Solutions, Inc. 3.875% 20282 150 153Embarq Corp. 7.995% 2036 266 302EMD Finance LLC 2.95% 20222 225 228EMD Finance LLC 3.25% 20252 2,924 3,142Empire Communities Corp. 7.00% 20252 100 105Empresas Publicas de Medellin ESP 4.25% 20292 1,030 1,022Enbridge, Inc. 4.00% 2023 600 641Enbridge, Inc. 2.50% 2025 900 944Enbridge, Inc. 4.25% 2026 655 739Enbridge, Inc. 3.70% 2027 754 832Enbridge, Inc. 3.40% 2051 464 467Encompass Health Corp. 4.50% 2028 100 104Encompass Health Corp. 4.75% 2030 145 154Endo DAC / Endo Finance LLC / Endo Finco 9.50% 20272 551 563Endo DAC / Endo Finance LLC / Endo Finco 6.00% 20282 292 197Endo Luxembourg Finance Co. I SARL / Endo U.S., Inc. 6.125% 20292 225 221Enel Finance International SA 2.75% 20232 5,000 5,187Enel Finance International SA 3.625% 20272 2,375 2,612Enel Finance International SA 3.50% 20282 1,800 1,974Energean Israel Finance, Ltd. 4.50% 20242 80 82Energizer Holdings, Inc. 4.375% 20292 210 211Energy Transfer Operating LP 5.00% 2050 5,567 6,447Energy Transfer Partners LP 4.20% 2027 110 122Energy Transfer Partners LP 6.00% 2048 70 89Energy Transfer Partners LP 6.25% 2049 910 1,196EnLink Midstream Partners, LLC 5.625% 20282 135 143ENN Energy Holdings, Ltd. 2.625% 20302 2,982 2,981Entergy Corp. 0.90% 2025 750 741Entergy Texas, Inc. 1.75% 2031 525 504EQMMidstream Partners LP 6.50% 20272 340 380EQMMidstream Partners LP 4.50% 20292 75 76EQMMidstream Partners LP 4.75% 20312 70 72
CapitalWorld Bond Fund (continued)

178 American Funds Insurance Series
Bonds, notes & other debt instruments (continued)Principal amount
(000)Value(000)
U.S. dollars(continued)
EQT Corp. 8.50% 2030 (8.25% on 8/1/2021)1 $ 50 $ 65Equinix, Inc. 1.80% 2027 1,145 1,160Equinix, Inc. 2.15% 2030 9,390 9,339Essex Portfolio LP 3.50% 2025 2,835 3,071Essex Portfolio LP 3.375% 2026 885 960European Investment Bank 2.25% 2022 700 710Everi Holdings Inc. 5.00% 20292 55 56Exelon Corp., junior subordinated, 3.497% 20221 525 538Export-Import Bank of India 3.25% 2030 3,489 3,552Fannie Mae, Series 2012-M17, Class A2, Multi Family, 2.184% 20224 1,024 1,042Fannie Mae Pool #MA2754 3.00% 20264 120 126Fannie Mae Pool #AB4281 3.00% 20274 19 20Fannie Mae Pool #AP7888 3.50% 20424 457 497Fannie Mae Pool #AQ0770 3.50% 20424 164 178Fannie Mae Pool #AO4151 3.50% 20424 157 170Fertitta Entertainment, Inc. 6.75% 20242 150 152Fidelity National Information Services, Inc. 2.25% 2031 47 47First QuantumMinerals, Ltd. 7.25% 20232 265 270First QuantumMinerals, Ltd. 7.50% 20252 495 515First QuantumMinerals, Ltd. 6.875% 20262 325 340First QuantumMinerals, Ltd. 6.875% 20272 440 480FirstEnergy Corp. 4.40% 20271 1,800 1,960FirstEnergy Corp. 3.40% 2050 240 236FirstEnergy Transmission LLC 2.866% 20282 2,325 2,411FMG Resources 4.375% 20312 325 348Ford Motor Credit Company LLC 3.81% 2024 530 555Ford Motor Credit Company LLC 5.125% 2025 1,035 1,141Ford Motor Credit Company LLC 2.90% 2028 200 199Ford Motor Credit Company LLC 4.00% 2030 125 131Fortress Transportation and Infrastructure Investors LLC 5.50% 20282 90 94France Télécom 9.00% 20311 2,434 3,832Freddie Mac Pool #ZS8588 3.00% 20304 75 80FreedomMortgage Corp. 7.625% 20262 225 235Freeport-McMoRan, Inc. 3.875% 2023 75 78Freeport-McMoRan, Inc. 4.25% 2030 275 295Freeport-McMoRan, Inc. 5.45% 2043 100 122Fresnillo PLC 4.25% 20502 973 991Front Range BidCo, Inc. 6.125% 20282 200 205Frontier Communications Corp. 5.875% 20272 125 134Frontier Communications Corp. 5.00% 20282 125 129Frontier Communications Corp. 6.75% 20292 125 133Frontier Communications Holdings, LLC 5.875% 2029 400 408FS Energy and Power Fund 7.50% 20232 575 596FXI Holdings, Inc. 7.875% 20242 150 155FXI Holdings, Inc. 12.25% 20262 652 753Gartner, Inc. 4.50% 20282 150 159General Motors Company 6.125% 2025 117 139General Motors Financial Co. 5.20% 2023 1,190 1,282General Motors Financial Co. 1.05% 2024 725 729General Motors Financial Co. 2.40% 2028 2,250 2,286Genesis Energy LP 8.00% 2027 360 379Georgia (Republic of) 2.75% 20262 400 408Glencore Funding LLC 1.625% 20262 2,838 2,850Global Infrastructure Solutions, Inc. 5.625% 20292 250 260Global Payments, Inc. 1.20% 2026 817 810Global Payments, Inc. 2.90% 2030 683 712Goldman Sachs Group, Inc. 2.905% 2023
(3-month USD-LIBOR + 0.99% on 7/24/2022)1 1,200 1,230Goldman Sachs Group, Inc. 1.542% 2027 (USD-SOFR + 0.818% on 9/10/2026)1 1,080 1,078Goldman Sachs Group, Inc. 2.615% 2032 (USD-SOFR + 1.281% on 4/22/2031)1 2,510 2,566Goodyear Tire & Rubber Co. 5.00% 20292 210 220GPCMerger Sub, Inc. 7.125% 20282 210 227
CapitalWorld Bond Fund (continued)

American Funds Insurance Series 179
Bonds, notes & other debt instruments (continued)Principal amount
(000)Value(000)
U.S. dollars(continued)
Grab Holding, Inc., Term Loan B, (3-month USD-LIBOR + 4.50%) 5.50% 20265,6 $ 75 $ 76Gray Television, Inc. 7.00% 20272 210 228Groupe BPCE SA 5.15% 20242 1,800 2,006Grupo Energia Bogota SA ESP 4.875% 20302 660 720Guara Norte SARL 5.198% 20342 197 205Hanesbrands, Inc. 4.625% 20242 85 90Hanesbrands, Inc. 5.375% 20252 86 91Hanesbrands, Inc. 4.875% 20262 245 265Harsco Corp. 5.75% 20272 360 378Harvest Midstream I LP 7.50% 20282 140 152HAT Holdings I LLC / HAT Holdings II LLC 3.375% 20262 150 151HCA, Inc. 5.375% 2025 55 62HCA, Inc. 5.875% 2026 125 145HCA, Inc. 5.625% 2028 315 374HCA, Inc. 5.25% 2049 170 217Hexion, Inc. 7.875% 20272 370 400Hightower Holding, LLC 6.75% 20292 85 87Hilcorp Energy I LP 5.75% 20292 80 84Hilcorp Energy I LP 6.00% 20312 45 48Hilton Grand Vacations Borrower LLC 5.00% 20292 450 461HiltonWorldwide Holdings, Inc. 4.00% 20312 130 131Howard Hughes Corp. 5.375% 20282 435 463Howard Hughes Corp. 4.125% 20292 205 206Howard Hughes Corp. 4.375% 20312 130 130Howmet Aerospace, Inc. 6.875% 2025 190 221HSBC Holdings PLC 3.033% 2023 (3-month USD-LIBOR + 0.923% on 11/12/2022)1 430 446HSBC Holdings PLC 2.633% 2025 (3-month USD-LIBOR + 1.14% on 11/7/2024)1 305 320HSBC Holdings PLC 4.292% 2026 (3-month USD-LIBOR + 1.348% on 9/12/2025)1 4,172 4,646HSBC Holdings PLC 2.357% 2031 (USD-SOFR + 1.947% on 8/18/2030)1 1,032 1,034Huarong Finance 2017 Co., Ltd., (3-month USD-LIBOR + 1.15%) 1.32% 20226 200 154Huarong Finance 2017 Co., Ltd., (3-month USD-LIBOR + 0.185%) 2.031% 20226 507 416Huarong Finance 2017 Co., Ltd., (3-month USD-LIBOR + 1.325%) 1.525% 20236 408 304Huarong Finance 2017 Co., Ltd. 4.75% 2027 400 281Huarong Finance 2019 Co., Ltd., (3-month USD-LIBOR + 1.125%) 1.275% 20236 976 730Huarong Finance 2019 Co., Ltd. 3.75% 2024 200 148Huarong Finance II Co., Ltd. 5.00% 2025 607 439Huarong Finance II Co., Ltd. 5.50% 2025 880 653Huarong Finance II Co., Ltd. 4.875% 2026 600 423HUB International, Ltd. 7.00% 20262 275 286Hyundai Capital America 3.25% 20222 250 258Hyundai Capital America 0.875% 20242 1,200 1,195Hyundai Capital America 1.50% 20262 925 919Hyundai Capital America 2.375% 20272 1,284 1,315Hyundai Capital America 2.00% 20282 600 596Hyundai Capital Services, Inc. 3.75% 20232 2,450 2,572Imperial Tobacco Finance PLC 3.50% 20232 2,000 2,069Independence Energy Finance LLC 7.25% 20262 150 158Ingles Markets, Inc. 4.00% 20312 325 325International Game Technology PLC 6.50% 20252 500 561International Game Technology PLC 4.125% 20262 250 261International Game Technology PLC 5.25% 20292 200 215Intesa Sanpaolo SpA 5.017% 20242 3,270 3,560Inversiones Latin America Power 5.125% 20332 200 198Investment Energy Resources, Ltd. 6.25% 20292 200 217Iqvia, Inc. 5.00% 20272 200 210Iraq (Republic of) 6.752% 20232 545 559Iron Mountain, Inc. 5.25% 20302 290 307Iron Mountain, Inc. 4.50% 20312 100 101Israel (State of) 2.50% 2030 3,850 4,040Israel (State of) 2.75% 2030 1,135 1,213Israel (State of) 3.375% 2050 1,470 1,574Israel (State of) 3.875% 2050 795 922
CapitalWorld Bond Fund (continued)

180 American Funds Insurance Series
Bonds, notes & other debt instruments (continued)Principal amount
(000)Value(000)
U.S. dollars(continued)
J2 Global, Inc. 4.625% 20302 $ 220 $ 228Jazz Securities DAC 4.375% 20292 200 208JBS Luxembourg SARL 3.625% 20322 200 200JPMorgan Chase & Co. 1.045% 2026 (USD-SOFR + 0.80% on 11/19/2025)1 6,710 6,628JPMorgan Chase & Co. 1.578% 2027 (USD-SOFR + 0.885% on 4/22/2026)1 1,722 1,732Kantar Group LLC, Term Loan B, (3-month USD-LIBOR + 4.50%) 5.25% 20265,6 65 65KB Home 6.875% 2027 370 442Kennedy-Wilson Holdings, Inc. 4.75% 2029 325 335Kennedy-Wilson Holdings, Inc. 5.00% 2031 125 129Kenya (Republic of) 6.875% 2024 1,300 1,433Keurig Dr Pepper, Inc. 4.597% 2028 2,740 3,220Keurig Dr Pepper, Inc. 3.20% 2030 146 158Keurig Dr Pepper, Inc. 5.085% 2048 1,075 1,422Kimberly-Clark Corp. 1.05% 2027 770 754Kimberly-Clark Corp. 3.10% 2030 110 122Kraft Heinz Company 3.875% 2027 300 330Kraft Heinz Company 5.00% 2042 250 306Kraft Heinz Company 4.375% 2046 740 840Kronos Acquisition Holdings, Inc. 5.00% 20262 95 97Kronos Acquisition Holdings, Inc. 7.00% 20272 225 226Kuwait (State of) 2.75% 20222 3,550 3,615Lamar Media Corp. 3.75% 2028 210 214Lamar Media Corp. 3.625% 20312 75 73LD Holdings Group LLC 6.125% 20282 125 125Level 3 Financing, Inc. 3.75% 20292 125 122Levi Strauss & Co. 3.50% 20312 125 125LGI Homes, Inc. 4.00% 20292 105 106Liberty Global PLC 5.50% 20282 250 263Ligado Networks LLC 15.50% 2023 (100% PIK)2,7 243 240Lima Metro Line 2 Finance, Ltd. 5.875% 20342 1,027 1,200Lima Metro Line 2 Finance, Ltd. 5.875% 2034 703 822Lima Metro Line 2 Finance, Ltd. 4.35% 20362 630 654Limited Brands, Inc. 6.625% 20302 40 46Limited Brands, Inc. 6.875% 2035 25 32Lithia Motors, Inc. 3.875% 20292 90 93Lloyds Banking Group PLC 1.326% 2023
(1-year UST Yield Curve Rate T Note Constant Maturity on 6/15/2022)1 1,825 1,840Lloyds Banking Group PLC 1.627% 2027
(1-year UST Yield Curve Rate T Note Constant Maturity + 0.85% on 5/11/2026)1 7,000 7,008LPL Financial Holdings, Inc. 4.625% 20272 395 410LPL Financial Holdings, Inc. 4.375% 20312 110 112LSB Industries, Inc. 9.625% 20232 760 782LSC Communications, Inc. 8.75% 20232,8,9,10 431 23LSF9 Atlantis Holdings LLC / Victra Finance Corp. 7.75% 20262 155 161Magic MergerCo, Inc. 5.25% 20282 150 154Magic MergerCo, Inc. 7.875% 20292 150 155Mallinckrodt PLC 10.00% 20252 1,190 1,331Marriott Ownership Resorts, Inc. 4.50% 20292 20 20Masco Corp. 1.50% 2028 791 773MasTec, Inc. 4.50% 20282 100 105MDC Partners, Inc. 7.50% 20241,2 470 476Medical Properties Trust, Inc. 3.50% 2031 155 157Medtronic, Inc. 3.50% 2025 1,091 1,198Meituan Dianping 2.125% 2025 1,730 1,718Melco International Development, Ltd. 5.375% 20292 200 212Mercer International, Inc. 5.125% 20292 130 134Meredith Corp. 6.875% 2026 161 168Methanex Corp. 5.125% 2027 240 260Methanex Corp. 5.65% 2044 240 249Mexico City Airport Trust 5.50% 2047 432 439MGMGrowth Properties LLC 3.875% 20292 100 102MGM Resorts International 7.75% 2022 200 209
CapitalWorld Bond Fund (continued)

American Funds Insurance Series 181
Bonds, notes & other debt instruments (continued)Principal amount
(000)Value(000)
U.S. dollars(continued)
MH Sub I, LLC, Term Loan, (3-month USD-LIBOR + 6.25%) 6.345% 20295,6 $ 25 $ 26MicroStrategy, Inc. 6.125% 20282 50 50MidCap Financial Issuer Trust 6.50% 20282 200 210MidCap Financial Issuer Trust 5.625% 20302 125 126Mohegan Gaming & Entertainment 8.00% 20262 380 398Molina Healthcare, Inc. 5.375% 2022 1,200 1,259Molina Healthcare, Inc. 3.875% 20302 75 78Morgan Stanley 1.593% 2027 (USD-SOFR + 0.879% on 5/4/2026)1 2,164 2,180Morgan Stanley 1.928% 2032 (USD-SOFR + 1.02% on 4/28/2031)1 1,396 1,358MPLX LP 2.65% 2030 837 846MPLX LP 5.50% 2049 1,900 2,465MSCI, Inc. 5.375% 20272 125 134MSCI, Inc. 3.625% 20312 150 154MSCI, Inc. 3.875% 20312 410 426Mueller Water Products, Inc. 4.00% 20292 130 134National Financial Partners Corp. 6.875% 20282 210 222Nationstar Mortgage Holdings, Inc. 5.125% 20302 135 135Navient Corp. 5.50% 2023 440 465Navient Corp. 5.875% 2024 730 789Navient Corp. 6.125% 2024 100 108Navient Corp. 4.875% 2028 80 81NCL Corp., Ltd. 3.625% 20242 345 334NCL Corp., Ltd. 5.875% 20262 115 121NCR Corp. 5.125% 20292 250 258Neiman Marcus Group LLC 7.125% 20262 325 347Neon Holdings, Inc. 10.125% 20262 70 77NESCO Holdings II, Inc. 5.50% 20292 75 78Nestlé Holdings, Inc. 0.625% 20262 4,538 4,458Netflix, Inc. 4.875% 2028 150 175Netflix, Inc. 4.875% 20302 225 268New Fortress Energy, Inc. 6.50% 20262 570 583New York Life Global Funding 1.20% 20302 2,725 2,557Newcrest Finance Pty, Ltd. 3.25% 20302 909 978Newell Rubbermaid, Inc. 4.70% 2026 100 112Newell Rubbermaid, Inc. 5.875% 20361 100 124News Corp. 3.875% 20292 125 126Nexstar Broadcasting, Inc. 4.75% 20282 215 221Nexstar Escrow Corp. 5.625% 20272 100 106NextEra Energy Capital Holdings, Inc. 0.65% 2023 4,225 4,243NFP Corp. 4.875% 20282 250 254NGL Energy Operating LLC 7.50% 20262 490 515NGL Energy Partners LP 7.50% 2023 350 345Niagara Mohawk Power Corp. 3.508% 20242 180 194Nielsen Finance LLC and Nielsen Finance Co. 5.00% 20252 125 129Nielsen Finance LLC and Nielsen Finance Co. 5.625% 20282 210 222NIKE, Inc. 3.375% 2050 602 679Northern Oil and Gas, Inc. 8.125% 20282 300 324NorthRiver Midstream Finance LP 5.625% 20262 220 229Nouryon Holding BV 8.00% 20262 210 223Nova Chemicals Corp. 5.00% 20252 115 123Nova Chemicals Corp. 5.25% 20272 120 129Nova Chemicals Corp. 4.25% 20292 95 96Novelis Corp. 4.75% 20302 200 210Oasis Midstream Partners LP / OMP Finance Corp. 8.00% 20292 185 197Oasis Petroleum, Inc. 6.375% 20262 35 37Occidental Petroleum Corp. 2.70% 2023 230 236Occidental Petroleum Corp. 5.875% 2025 240 267Occidental Petroleum Corp. 6.375% 2028 234 274Occidental Petroleum Corp. 6.125% 2031 50 59State of Ohio, Turnpike and Infrastructure Commission, Turnpike Rev. Ref. Bonds
(Infrastructure Projects), Series 2020-A, 3.216% 2048 1,410 1,450Oleoducto Central SA 4.00% 20272 2,535 2,619
CapitalWorld Bond Fund (continued)

182 American Funds Insurance Series
Bonds, notes & other debt instruments (continued)Principal amount
(000)Value(000)
U.S. dollars(continued)
Oleoducto Central SA 4.00% 2027 $ 630 $ 651ONEOK, Inc. 6.35% 2031 31 40ONEOK, Inc. 4.95% 2047 111 131ONEOK, Inc. 5.20% 2048 1,378 1,691ONEOK, Inc. 4.45% 2049 3,510 3,887ONEOK, Inc. 7.15% 2051 355 523Oracle Corp. 2.65% 2026 2,327 2,457Oracle Corp. 3.25% 2027 1,880 2,048Oracle Corp. 3.60% 2050 980 1,008Oracle Corp. 3.95% 2051 122 133Organon Finance 1 LLC 5.125% 20312 105 108OSW Structured Asset Trust, Series 2020-RPL1, Class A1, 3.072% 20592,4,6 582 587Oversea-Chinese Banking Corp., Ltd. 1.832% 2030
(5-year UST Yield Curve Rate T Note Constant Maturity + 1.58% on 9/10/2025)1,2 1,416 1,420Owens & Minor, Inc. 4.375% 2024 425 445Owens & Minor, Inc. 4.50% 20292 135 139Pacific Gas and Electric Co. 2.95% 2026 590 604Pacific Gas and Electric Co. 2.10% 2027 9,935 9,659Pacific Gas and Electric Co. 3.30% 2027 659 683Pacific Gas and Electric Co. 4.65% 2028 542 597Pacific Gas and Electric Co. 4.55% 2030 783 838Pacific Gas and Electric Co. 3.25% 2031 975 960Pacific Gas and Electric Co. 3.30% 2040 6,850 6,201Pacific Gas and Electric Co. 3.50% 2050 931 831Pakistan (Islamic Republic of) 5.50% 20212 3,535 3,563Pakistan (Islamic Republic of) 5.625% 2022 2,170 2,235Panama (Republic of) 3.75% 20262 1,440 1,556Panther BF Aggregator 2 LP 6.25% 20262 49 52Panther BF Aggregator 2 LP 8.50% 20272 200 218Paraguay (Republic of) 4.625% 2023 947 999Paraguay (Republic of) 5.00% 2026 235 268Paraguay (Republic of) 4.70% 20272 350 398Paraguay (Republic of) 5.60% 20482 2,340 2,758Paraguay (Republic of) 5.40% 20502 1,510 1,768Park Intermediate Holdings LLC 4.875% 20292 135 140Party City Holdings, Inc. 8.75% 20262 175 187PayPal Holdings, Inc. 2.30% 2030 541 560Peabody Energy Corp. 8.50% 2024 (29.41% PIK)2,7 45 34Peninsula Pacific Entertainment LLC 8.50% 20272 125 134Peru (Republic of) 2.392% 2026 500 517Petróleos Mexicanos 6.875% 20252 1,340 1,485Petróleos Mexicanos 6.875% 2026 4,260 4,661Petróleos Mexicanos 7.69% 2050 250 241Petróleos Mexicanos 6.95% 2060 201 178PETRONAS Capital, Ltd. 3.50% 20302 605 664PG&E Corp. 5.00% 2028 220 223PG&E Corp. 5.25% 2030 125 127Philip Morris International, Inc. 2.10% 2030 634 632Plains All American Pipeline LP 3.80% 2030 352 377Post Holdings, Inc. 4.625% 20302 579 589Power Financial Corp., Ltd. 3.35% 2031 1,870 1,836PowerTeam Services, LLC 9.033% 20252 200 220Precision Drilling Corp. 7.125% 20262 125 129Precision Drilling Corp. 6.875% 20292 150 155Prestige Brands International, Inc. 3.75% 20312 90 87Procter & Gamble Company 3.00% 2030 338 373Progress Energy, Inc. 7.75% 2031 150 214PT Bank Negara Indonesia (Persero) Tbk 3.75% 2026 600 612PT Indofood CBP Sukses Makmur Tbk 3.398% 2031 1,795 1,823PT Indonesia Asahan Aluminium Tbk 5.23% 20212 555 565PT Indonesia Asahan Aluminium Tbk 5.71% 2023 960 1,062PT Indonesia Asahan Aluminium Tbk 5.45% 20302 500 582
CapitalWorld Bond Fund (continued)

American Funds Insurance Series 183
Bonds, notes & other debt instruments (continued)Principal amount
(000)Value(000)
U.S. dollars(continued)
PTT Exploration and Production PCL 2.587% 20272 $ 200 $ 208Public Service Electric and Gas Co. 2.05% 2050 415 359Puget Energy, Inc. 6.00% 2021 1,023 1,033Puget Energy, Inc. 5.625% 2022 480 499Qatar (State of) 3.40% 20252 4,805 5,238Qatar (State of) 5.103% 20482 530 705Qatar Petroleum 1.375% 20262 1,325 1,324Qatar Petroleum 3.125% 20412 3,255 3,243Qatar Petroleum 3.30% 20512 1,045 1,045Rabobank Nederland 4.625% 2023 2,180 2,384Radiology Partners, Inc. 9.25% 20282 220 244Range Resources Corp. 8.25% 20292 55 62Raptor Acquisition Corp. 4.875% 20262 375 381Raptor Acquisition Corp. / Raptor Co-Issuer LLC, Term Loan B,
(3-month USD-LIBOR + 4.00%) 4.75% 20265,6 90 90Rattler Midstream Partners LP 5.625% 20252 135 142Rayonier A.M. Products, Inc. 7.625% 20262 40 42Real Hero Merger Sub 2, Inc. 6.25% 20292 25 26Realogy Corp. 5.75% 20292 235 246Renewable Energy Group, Inc. 5.875% 20282 80 84Reynolds American, Inc. 4.45% 2025 2,115 2,344RHP Hotel Properties LP / RHP Finance Corp. 4.50% 20292 60 60Rocket Software, Inc. 6.50% 20292 100 99Royal Bank of Canada 0.875% 2026 4,660 4,599Royal Bank of Canada 1.20% 2026 2,200 2,200Royal Caribbean Cruises, Ltd. 11.50% 20252 95 110RP Escrow Issuer, LLC 5.25% 20252 75 79Russian Federation 4.25% 2027 1,400 1,565SA Global Sukuk, Ltd. 0.946% 20242 1,530 1,530SA Global Sukuk, Ltd. 1.602% 20262 835 835SA Global Sukuk, Ltd. 2.694% 20312 1,725 1,749Sabine Pass Liquefaction, LLC 4.50% 2030 88 102Santander Holdings USA, Inc. 3.244% 2026 3,750 4,012Saudi Arabia (Kingdom of) 2.894% 20222 1,900 1,936Saudi Arabia (Kingdom of) 2.90% 2025 2,000 2,144Saudi Arabia (Kingdom of) 3.628% 20272 1,900 2,096Saudi Arabia (Kingdom of) 3.625% 20282 3,840 4,251Saudi Arabian Oil Co. 1.625% 20252 430 435Scentre Group 3.50% 20252 210 226Scentre Group 3.75% 20272 110 121Scientific Games Corp. 5.00% 20252 539 558Scientific Games Corp. 8.25% 20262 420 451SCIH Salt Holdings, Inc. 4.875% 20282 335 336SCIH Salt Holdings, Inc. 6.625% 20292 65 65Scotts Miracle-Gro Co. 4.50% 2029 200 208Sensata Technologies Holding BV 4.00% 20292 550 559Service Properties Trust 5.50% 2027 85 91ServiceNow, Inc. 1.40% 2030 1,830 1,719Simmons Foods, Inc. 4.625% 20292 225 227Sinclair Television Group, Inc. 5.125% 20272 155 156Sinclair Television Group, Inc. 4.125% 20302 230 226Sirius XM Radio, Inc. 5.00% 20272 125 131Sirius XM Radio, Inc. 4.00% 20282 225 232Six Flags Entertainment Corp. 4.875% 20242 230 233Sizzling Platter LLC 8.50% 20252 200 207SK hynix, Inc. 1.50% 20262 1,343 1,326Skandinaviska Enskilda Banken AB 2.80% 2022 2,100 2,137SkyMiles IP, Ltd. 4.75% 20282 210 234SM Energy Co. 6.50% 2028 50 51Solera Holdings, Inc., Term Loan B, (3-month USD-LIBOR + 4.00%) 4.50% 20285,6 250 251Southern California Edison Co. 2.85% 2029 200 208Southwestern Energy Co. 6.45% 20251 200 222
CapitalWorld Bond Fund (continued)

184 American Funds Insurance Series
Bonds, notes & other debt instruments (continued)Principal amount
(000)Value(000)
U.S. dollars(continued)
Southwestern Energy Co. 7.50% 2026 $ 75 $ 80Southwestern Energy Co. 7.75% 2027 25 27Southwestern Energy Co. 8.375% 2028 60 68Springleaf Finance Corp. 6.125% 2024 650 700Sprint Corp. 7.625% 2026 180 220Sprint Corp. 6.875% 2028 980 1,258Square, Inc. 2.75% 20262 350 357Square, Inc. 3.50% 20312 125 126Sri Lanka (Democratic Socialist Republic of) 6.25% 2021 5,574 5,490Sri Lanka (Democratic Socialist Republic of) 5.75% 2022 6,554 6,034Sri Lanka (Democratic Socialist Republic of) 5.75% 2023 2,890 2,164SRS Distribution, Inc. 6.125% 20292 60 62State Grid Overseas Investment, Ltd. 3.50% 20272 5,600 6,177Stericycle, Inc. 3.875% 20292 225 225Studio City Finance, Ltd. 5.00% 20292 200 202Suburban Propane Partners LP / Suburban Energy Finance Corp. 5.00% 20312 125 128Summer (BC) BidCo B LLC 5.50% 20262 200 204Summit Materials, Inc. 6.50% 20272 210 223Sunoco Logistics Operating Partners LP 4.00% 2027 1,490 1,640Sunoco LP 5.50% 2026 210 217Sunoco LP 4.50% 20292 345 352Superior Plus LP and Superior General Partner, Inc. 4.50% 20292 50 52Surgery Center Holdings 10.00% 20272 210 231Swiss Re Finance (Luxembourg) SA 5.00% 2049
(5-year UST Yield Curve Rate T Note Constant Maturity + 3.582% on 4/2/2029)1,2 800 912Syneos Health, Inc. 3.625% 20292 45 45Talen Energy Corp. 10.50% 20262 255 185Talen Energy Corp. 7.25% 20272 510 477Talen Energy Supply, LLC 7.625% 20282 70 66Targa Resources Partners LP 5.875% 2026 125 132Targa Resources Partners LP 5.50% 2030 230 253Targa Resources Partners LP 4.875% 20312 90 98Teekay Offshore Partners LP 8.50% 20232 550 506Telesat Canada / Telesat LLC 5.625% 20262 45 45Tencent Holdings, Ltd. 3.24% 20502 7,950 7,804Tencent Music Entertainment Group 2.00% 2030 610 589Tenet Healthcare Corp. 4.875% 20262 465 483Teva Pharmaceutical Finance Co. BV 2.20% 2021 71 71Teva Pharmaceutical Finance Co. BV 2.80% 2023 4,361 4,351Teva Pharmaceutical Finance Co. BV 6.00% 2024 4,600 4,889Teva Pharmaceutical Finance Co. BV 7.125% 2025 3,910 4,316Teva Pharmaceutical Finance Co. BV 3.15% 2026 2,900 2,762State of Texas, Grand Parkway Transportation Corp., Grand Parkway System Toll Rev.
Ref. Bonds, Series 2020-B, 3.236% 2052 1,780 1,821The Home Co., Inc. 7.25% 20252 290 308Thermo Fisher Scientific, Inc. 4.133% 2025 1,170 1,298T-Mobile US, Inc. 2.625% 2026 150 154T-Mobile US, Inc. 2.625% 2029 75 74Total Capital International 3.127% 2050 804 817Total Play Telecomunicaciones, SA de CV 7.50% 20252 230 244Toyota Motor Credit Corp. 3.375% 2030 453 508TransCanada PipeLines, Ltd. 4.10% 2030 1,342 1,543TransDigm, Inc. 6.25% 20262 204 215TransDigm, Inc. 5.50% 2027 65 68TransDigm, Inc. 4.625% 20292 115 115Transocean Guardian, Ltd. 5.875% 20242 40 39Transocean Poseidon, Ltd. 6.875% 20272 130 131Transocean, Inc. 6.125% 20252 87 88Transocean, Inc. 7.25% 20252 150 131Transocean, Inc. 8.00% 20272 150 126Trilogy International South Pacific LLC / TISP Finance, Inc. 8.875% 20232 1,635 1,633TritonWater Holdings, Inc. 6.25% 20292 145 146
CapitalWorld Bond Fund (continued)

American Funds Insurance Series 185
Bonds, notes & other debt instruments (continued)Principal amount
(000)Value(000)
U.S. dollars(continued)
Trivium Packaging BV 8.50% 20272 $ 200 $ 218Truck Hero, Inc., Term Loan B, (3-month USD-LIBOR + 3.75%) 4.50% 20285,6 25 25Turkey (Republic of) 6.25% 2022 1,880 1,960Turkey (Republic of) 5.75% 2024 2,500 2,599Turkey (Republic of) 6.35% 2024 2,220 2,334U.S. Treasury 0.125% 2022 12,340 12,337U.S. Treasury 0.125% 202311 24,000 23,980U.S. Treasury 2.625% 2023 6,900 7,180U.S. Treasury 1.875% 2024 4,515 4,710U.S. Treasury 2.75% 2025 10,140 10,968U.S. Treasury 2.875% 2025 5,400 5,893U.S. Treasury 0.50% 2026 7,453 7,341U.S. Treasury 1.625% 2031 4,600 4,672U.S. Treasury 1.125% 2040 9,170 7,910U.S. Treasury 1.875% 204111 23,490 22,977U.S. Treasury 2.25% 2041 5,810 6,042U.S. Treasury 2.75% 2047 1,625 1,846U.S. Treasury 3.00% 2048 5,045 6,013U.S. Treasury 1.25% 205011 2,100 1,711U.S. Treasury 1.625% 205011 2,580 2,312U.S. Treasury 2.375% 205111 12,310 13,137U.S. Treasury Inflation-Protected Security 0.125% 20513 3,835 4,204Uber Technologies, Inc. 8.00% 20262 300 324UBS Group AG 1.008% 2024
(5-year UST Yield Curve Rate T Note Constant Maturity + 0.83% on 7/30/2023)1,2 1,950 1,965UKG, Inc., Term Loan B, (3-month USD-LIBOR + 3.25%) 4.00% 20265,6 318 318Ukraine 7.75% 2022 3,010 3,168UniCredit SpA 3.75% 20222 1,750 1,792UniformMortgage-Backed Security 1.50% 20364,12 4,897 4,941Unisys Corp. 6.875% 20272 50 55United Airlines Holdings, Inc. 6.50% 20272 290 320United Airlines, Inc., Pass Through Trust Certificates, Series 2020-1, Class B,
4.875% 2027 89 95United Airlines, Inc. 4.375% 20262 55 57United Airlines, Inc. 4.625% 20292 145 150United Mexican States 3.25% 2030 2,685 2,779United Rentals, Inc. 5.25% 2030 150 165United Technologies Corp. 4.125% 2028 1,900 2,188UnitedWholesale Mortgage, LLC 5.50% 20292 75 75Univision Communications, Inc. 6.625% 20272 220 239Univision Communications, Inc. 4.50% 20292 350 353UPC Broadband Finco BV 4.875% 20312 200 201Vale Overseas, Ltd. 3.75% 2030 1,873 1,997Valeant Pharmaceuticals International, Inc. 6.125% 20252 388 398Valvoline, Inc. 3.625% 20312 210 211Venator Materials Corp. 5.75% 20252 590 582Venator Materials Corp. 9.50% 20252 420 474Veritas Holdings, Ltd. 10.50% 20242 200 206Verizon Communications, Inc. 3.15% 2030 575 621Verizon Communications, Inc. 2.55% 2031 2,100 2,148Verizon Communications, Inc. 3.40% 2041 3,460 3,665Vertical Holdco GMBH 7.625% 20282 200 217Vertical U.S. Newco, Inc. 5.25% 20272 225 237VICI Properties LP 4.25% 20262 175 182VICI Properties LP 4.625% 20292 45 48VICI Properties LP / VICI Note Co., Inc. 3.50% 20252 40 41VICI Properties LP / VICI Note Co., Inc. 4.125% 20302 250 257Virgin Media O2 4.25% 20312 275 271Virtusa Corp., Term Loan B, (3-month USD-LIBOR + 4.25%) 5.00% 20285,6 25 25Vistra Operations Co. LLC 4.375% 20292 175 176Volkswagen Group of America Finance, LLC 4.00% 20212 1,900 1,927Volkswagen Group of America Finance, LLC 4.625% 20252 1,280 1,460
CapitalWorld Bond Fund (continued)

186 American Funds Insurance Series
Bonds, notes & other debt instruments (continued)Principal amount
(000)Value(000)
U.S. dollars(continued)
Walt Disney Company 2.65% 2031 $ 4,405 $ 4,628Warner Music Group 3.875% 20302 210 213WASHMultifamily Acquisition, Inc. 5.75% 20262 200 209WEA Finance LLC 3.75% 20242 535 573Weatherford International PLC 8.75% 20242 150 157Weatherford International PLC 11.00% 20242 100 104WESCO Distribution, Inc. 7.125% 20252 195 211WESCO Distribution, Inc. 7.25% 20282 215 240Western Global Airlines LLC 10.375% 20252 80 92Western MidstreamOperating LP 4.35% 20251 155 164Western MidstreamOperating LP 4.75% 2028 70 76Westfield Corp., Ltd. 3.15% 20222 245 249Westpac Banking Corp. 2.894% 2030
(5-year UST Yield Curve Rate T Note Constant Maturity + 1.35% on 2/4/2025)1 2,900 3,011Williams Companies, Inc. 3.50% 2030 1,024 1,119WyndhamWorldwide Corp. 4.375% 20282 230 239Wynn Las Vegas, LLC andWynn Capital Corp. 4.25% 20232 228 237Wynn Resorts, Ltd. 7.75% 20252 180 194Xcel Energy, Inc. 3.35% 2026 2,581 2,812Xenia Hotels & Resorts, Inc. 4.875% 20292 65 67Xerox Corp. 5.50% 20282 329 342Ziggo Bond Co. BV 5.125% 20302 200 205Ziggo Bond Finance BV 5.50% 20272 364 379Ziggo Bond Finance BV 4.875% 20302 300 308Zimmer Holdings, Inc. 3.15% 2022 790 803
790,226
Total bonds, notes & other debt instruments (cost: $1,924,315,000) 1,989,317
Preferred securities 0.00% Shares
U.S. dollars0.00%
ACR III LSC Holdings LLC, Series B, preferred shares2,9,10,13 48 34
Total preferred securities (cost: $49,000) 34
Common stocks 0.13%
U.S. dollars0.13%
New AMI I, LLC9,10,13 174,911 1,522Weatherford International13 29,931 545Chesapeake Energy Corp. 6,478 336Diamond Offshore Drilling, Inc.13 36,338 231Diamond Offshore Drilling, Inc.2,9,10,13 12,700 67McDermott International, Ltd.13 4,287 2
Total common stocks (cost: $2,685,000) 2,703
Rights & warrants 0.00%
U.S. dollars0.00%
Chesapeake Energy Corp., Class B, warrants, expire 202613 1,707 41Sable Permian Resources, LLC, Class A, warrants, expire 20249,10,13 531 —
Total rights & warrants (cost: $8,000) 41
Short-term securities 7.16%
Money market investments 5.80%
Capital Group Central Cash Fund 0.04%14,15 1,238,717 123,872
CapitalWorld Bond Fund (continued)

American Funds Insurance Series 187
Short-term securities (continued)
Weightedaverage yieldat acquisition
Principal amount(000)
Value(000)
Bills & notes of governments & government agencies outside the U.S. 1.36%
Egyptian Treasury 7/6/2021 11.715% EGP66,000 $ 4,196Egyptian Treasury 7/20/2021 11.721 22,800 1,442Egyptian Treasury 10/19/2021 11.994 23,500 1,440Egyptian Treasury 10/26/2021 12.115 105,000 6,418Egyptian Treasury 1/4/2022 12.011 44,025 2,626Egyptian Treasury 1/18/2022 11.246 82,900 4,921Egyptian Treasury 4/26/2022 11.450 140,975 8,102
29,145
Total short-term securities (cost: $153,124,000) 153,017
Total investment securities 100.40% (cost: $2,080,181,000) 2,145,112
Other assets less liabilities (0.40)% (8,478)
Net assets 100.00% $2,136,634
Futures contracts
Contracts TypeNumber ofcontracts Expiration
Notionalamount16
(000)
Value at6/30/202117
(000)
Unrealizedappreciation
(depreciation)at 6/30/2021
(000)
90 Day Euro Dollar Futures Short 768 September 2022 $ (192,000) $(191,299) $ 6590 Day Euro Dollar Futures Long 950 September 2023 237,500 235,125 (152)5 Year U.S. Treasury Note Futures Long 975 October 2021 97,500 120,344 (276)10 Year Euro-Bund Futures Long 62 September 2021 € 6,200 12,690 2410 Year Italy Government Bond Futures Long 9 September 2021 900 1,616 1110 Year Japanese Government Bond Futures Long 35 September 2021 ¥3,500,000 47,789 10110 Year UK Gilt Futures Long 187 September 2021 £ 18,700 33,136 18710 Year U.S. Treasury Note Futures Short 166 September 2021 $ (16,600) (21,995) (79)10 Year Ultra U.S. Treasury Note Futures Short 272 September 2021 (27,200) (40,039) (474)20 Year U.S. Treasury Bond Futures Long 188 September 2021 18,800 30,221 13130 Year Euro-Buxl Futures Long 41 September 2021 € 4,100 9,881 16630 Year Ultra U.S. Treasury Bond Futures Long 6 September 2021 $ 600 1,156 45
$(251)
Forward currency contracts
Contract amount
CounterpartySettlement
date
Unrealized(depreciation)appreciationat 6/30/2021
(000)Purchases
(000)Sales(000)
USD4,824 EUR4,100 Citibank 7/1/2021 $ (37)EUR4,100 USD4,951 Bank of America 7/1/2021 (89)USD5,177 EUR4,270 Goldman Sachs 7/6/2021 113USD1,904 TRY16,140 Bank of America 7/6/2021 56TRY16,140 USD1,843 Bank of America 7/6/2021 5EUR33,170 USD40,498 Standard Chartered Bank 7/6/2021 (1,162)USD3,693 MXN73,300 JPMorgan Chase 7/8/2021 19USD2,157 MYR8,920 HSBC Bank 7/8/2021 10USD4,768 MXN95,510 Standard Chartered Bank 7/8/2021 (18)
MXN72,960 USD3,681 Standard Chartered Bank 7/8/2021 (24)USD10,616 MYR44,260 Standard Chartered Bank 7/8/2021 (36)USD2,453 COP8,957,810 Barclays Bank PLC 7/9/2021 67
CapitalWorld Bond Fund (continued)

188 American Funds Insurance Series
Forward currency contracts (continued)
Contract amount
CounterpartySettlement
date
Unrealized(depreciation)appreciationat 6/30/2021
(000)Purchases
(000)Sales(000)
USD1,938 COP7,181,390 Standard Chartered Bank 7/9/2021 $ 26USD11,727 AUD15,110 HSBC Bank 7/12/2021 395USD1,477 AUD1,950 Goldman Sachs 7/12/2021 15EUR17,714 DKK131,740 Goldman Sachs 7/12/2021 (2)USD2,970 RUB216,960 Citibank 7/14/2021 10USD6,862 RUB502,316 Citibank 7/14/2021 9USD1,796 IDR26,000,000 Standard Chartered Bank 7/15/2021 13USD5,297 IDR77,079,860 Standard Chartered Bank 7/15/2021 11USD632 IDR9,153,342 Standard Chartered Bank 7/15/2021 4USD484 IDR7,000,000 Standard Chartered Bank 7/15/2021 4USD527 IDR7,643,040 Standard Chartered Bank 7/15/2021 3
USD9,752 KRW11,065,130 Citibank 7/15/2021 (40)EUR5,292 NOK54,550 Morgan Stanley 7/15/2021 (59)
IDR94,643,890 USD6,623 Standard Chartered Bank 7/15/2021 (132)KRW35,349,440 USD31,728 Standard Chartered Bank 7/15/2021 (446)
USD22,201 CNH142,270 Citibank 7/16/2021 231USD6,546 CZK136,930 Standard Chartered Bank 7/16/2021 179USD6,037 EUR4,980 Goldman Sachs 7/16/2021 130
USD10,021 JPY1,107,002 Bank of New York Mellon 7/16/2021 55USD5,542 GBP3,970 UBS AG 7/16/2021 51USD4,960 JPY545,940 Bank of America 7/16/2021 45USD2,546 EUR2,130 Bank of New York Mellon 7/16/2021 20USD4,279 JPY473,370 HSBC Bank 7/16/2021 18USD9,150 EUR7,700 Bank of America 7/16/2021 17
USD17,645 EUR14,870 Goldman Sachs 7/16/2021 7EUR10,125 DKK75,300 Bank of America 7/16/2021 —18
EUR7,068 CZK180,720 Citibank 7/16/2021 (19)CHF800 USD892 Bank of America 7/16/2021 (27)
PLN4,700 USD1,270 UBS AG 7/16/2021 (37)CZK180,720 EUR7,129 Standard Chartered Bank 7/16/2021 (53)JPY664,340 USD6,044 Bank of America 7/16/2021 (63)SEK23,400 USD2,814 HSBC Bank 7/16/2021 (80)
JPY7,849,310 USD71,520 Goldman Sachs 7/16/2021 (856)EUR39,030 USD47,250 Citibank 7/16/2021 (954)USD16,631 CAD20,190 Morgan Stanley 7/19/2021 344USD3,621 NZD5,070 Standard Chartered Bank 7/19/2021 77CAD3,930 USD3,225 JPMorgan Chase 7/19/2021 (55)CAD5,719 USD4,694 HSBC Bank 7/19/2021 (81)USD7,591 BRL38,280 Citibank 7/20/2021 (88)USD5,770 DKK35,940 Standard Chartered Bank 7/21/2021 37USD2,373 MXN48,750 Goldman Sachs 7/21/2021 (66)GBP8,540 USD11,905 Bank of America 7/21/2021 (91)
MXN134,990 USD6,679 JPMorgan Chase 7/22/2021 74USD1,339 CLP975,459 Citibank 7/22/2021 11
CLP975,459 USD1,327 HSBC Bank 7/22/2021 —18
USD1,556 NZD2,240 Standard Chartered Bank 7/22/2021 (10)USD3,010 MXN62,580 Bank of America 7/22/2021 (121)EUR6,840 USD8,263 Bank of America 7/22/2021 (149)USD5,704 MXN118,590 Goldman Sachs 7/22/2021 (229)CAD550 USD447 Morgan Stanley 7/28/2021 (3)
USD12,263 EUR10,100 Standard Chartered Bank 9/20/2021 266USD318 INR23,460 Bank of New York Mellon 9/23/2021 5
BRL63,000 USD12,410 Citibank 10/1/2021 106USD16,506 BRL90,140 HSBC Bank 10/1/2021 (1,401)
CapitalWorld Bond Fund (continued)

American Funds Insurance Series 189
Forward currency contracts (continued)
Contract amount
CounterpartySettlement
date
Unrealized(depreciation)appreciationat 6/30/2021
(000)Purchases
(000)Sales(000)
USD22,038 BRL120,700 Standard Chartered Bank 10/1/2021 $(1,941)USD11,661 BRL61,700 Citibank 6/15/2022 (65)
$(6,001)
Swap contracts
Interest rate swaps
Receive PayExpiration
dateNotional
(000)
Value at6/30/2021
(000)
Upfrontpremium
paid(000)
Unrealizedappreciation
(depreciation)at 6/30/2021
(000)
3-month AUD-BBSW 0.29% 3/4/2024 A$17,650 $ 43 $— $ 430.3653% 3-month USD-LIBOR 3/5/2024 $13,710 (44) — (44)(0.4545)% 6-month EURIBOR 4/1/2024 €45,160 (61) — (61)3-month SEK-STIBOR 0.175% 2/9/2026 SKr56,800 51 — 513-month SEK-STIBOR 0.179% 2/9/2026 28,400 25 — 253-month SEK-STIBOR 0.185% 2/11/2026 28,500 24 — 243-month SEK-STIBOR 0.189% 2/11/2026 28,500 23 — 236.21% 28-day MXN-TIIE 5/21/2026 MXN72,300 (57) — (57)6.255% 28-day MXN-TIIE 5/22/2026 47,800 (33) — (33)6.21% 28-day MXN-TIIE 5/22/2026 47,800 (38) — (38)6.19% 28-day MXN-TIIE 5/22/2026 48,400 (40) — (40)6.15% 28-day MXN-TIIE 5/25/2026 47,800 (44) — (44)6.14% 28-day MXN-TIIE 6/8/2026 29,400 (28) — (28)6.115% 28-day MXN-TIIE 6/8/2026 29,400 (30) — (30)6.12% 28-day MXN-TIIE 6/8/2026 44,400 (45) — (45)6.13% 28-day MXN-TIIE 6/8/2026 103,200 (101) — (101)6.16% 28-day MXN-TIIE 6/9/2026 58,800 (54) — (54)6.15% 28-day MXN-TIIE 6/9/2026 58,800 (55) — (55)6.23% 28-day MXN-TIIE 6/10/2026 30,100 (23) — (23)6.195% 28-day MXN-TIIE 6/10/2026 30,100 (25) — (25)6.36% 28-day MXN-TIIE 6/12/2026 26,040 (13) — (13)6.5375% 28-day MXN-TIIE 6/17/2026 14,000 (1) — (1)6.55% 28-day MXN-TIIE 6/17/2026 43,000 (3) — (3)6.50% 28-day MXN-TIIE 6/17/2026 13,900 (3) — (3)6.47% 28-day MXN-TIIE 6/17/2026 14,200 (4) — (4)6.55% 28-day MXN-TIIE 6/18/2026 14,100 (1) — (1)6.50% 28-day MXN-TIIE 6/18/2026 27,800 (5) — (5)6.633% 28-day MXN-TIIE 6/25/2026 172,500 16 — 166.6175% 28-day MXN-TIIE 6/25/2026 165,900 10 — 106.64% 28-day MXN-TIIE 6/25/2026 62,600 7 — 76.59% 28-day MXN-TIIE 6/25/2026 38,700 —18 — —18
6.585% 28-day MXN-TIIE 6/25/2026 50,900 (1) — (1)6.58% 28-day MXN-TIIE 6/25/2026 41,600 (1) — (1)1.72375% 6-month AUD-BBSW 3/4/2031 A$6,880 77 — 773-month USD-LIBOR 1.4822% 3/5/2031 $ 5,120 (40) — (40)6-month EURIBOR 0.5092% 4/1/2051 € 4,790 (54) — (54)
$— $(528)
CapitalWorld Bond Fund (continued)

190 American Funds Insurance Series
Credit default swaps
Centrally cleared credit default swaps on credit indices — buy protection
ReceivePay/Payment frequency
Expirationdate
Notional(000)
Value at6/30/2021
(000)
Upfrontpremiumreceived
(000)
Unrealizeddepreciationat 6/30/2021
(000)
CDX.NA.HY.36 5.00%/Quarterly 6/20/2026 $14,522 $(1,482) $(1,277) $(205)
Investments in affiliates15
Value ofaffiliate at1/1/2021
(000)Additions
(000)Reductions
(000)
Netrealized
loss(000)
Netunrealized
depreciation(000)
Value ofaffiliate at6/30/2021
(000)
Dividendincome
(000)
Short-term securities 5.80%Money market investments 5.80%
Capital Group Central Cash Fund 0.04%14 $147,017 $514,058 $537,189 $(3) $(11) $123,872 $81
1Step bond; coupon rate may change at a later date.2Acquired in a transaction exempt from registration under Rule 144A of the Securities Act of 1933. May be resold in the U.S. in transactions exempt fromregistration, normally to qualified institutional buyers. The total value of all such securities was $263,126,000, which represented 12.31% of the net assets of thefund.
3Index-linked bond whose principal amount moves with a government price index.4Principal payments may be made periodically. Therefore, the effective maturity date may be earlier than the stated maturity date.5Loan participations and assignments; may be subject to legal or contractual restrictions on resale. The total value of all such loans was $1,791,000, whichrepresented .08% of the net assets of the fund.
6Coupon rate may change periodically. Reference rate and spread are as of the most recent information available. Some coupon rates are determined by theissuer or agent based on current market conditions; therefore, the reference rate and spread are not available.
7Payment in kind; the issuer has the option of paying additional securities in lieu of cash. Most recent payment was 100% cash unless otherwise noted.8Scheduled interest and/or principal payment was not received.9Valued under fair value procedures adopted by authority of the board of trustees. The total value of all such securities was $1,703,000, which represented .08%of the net assets of the fund.
10Value determined using significant unobservable inputs.11All or a portion of this security was pledged as collateral. The total value of pledged collateral was $13,581,000, which represented .64% of the net assets ofthe fund.
12Purchased on a TBA basis.13Security did not produce income during the last 12 months.14Rate represents the seven-day yield at 6/30/2021.15Part of the same “group of investment companies“ as the fund as defined under the Investment Company Act of 1940, as amended.16Notional amount is calculated based on the number of contracts and notional contract size.17Value is calculated based on the notional amount and current market price.18Amount less than one thousand.
Key to abbreviations and symbolsAUD/A$ = Australian dollars GBP/£ = British pounds Ref. = RefundingBBSW = Bank Bill Swap Rate GHS = Ghanaian cedi Rev. = RevenueBRL = Brazilian reais IDR = Indonesian rupiah RON = Romanian leuCAD/C$ = Canadian dollars INR = Indian rupees RUB = Russian rublesCHF = Swiss francs JPY/¥ = Japanese yen SEK/SKr = Swedish kronorCLP = Chilean pesos KRW = South Korean won SOFR = Secured Overnight Financing RateCNH/CNY = Chinese yuan renminbi LIBOR = London Interbank Offered Rate STIBOR = Stockholm Interbank Offered RateCOP = Colombian pesos MXN =Mexican pesos TBA = To-be-announcedCZK = Czech korunas MYR = Malaysian ringgits TIIE = Equilibrium Interbank Interest RateDAC = Designated Activity Company NOK/NKr = Norwegian kroner TRY = Turkish liraDKK/DKr = Danish kroner NZD/NZ$ = New Zealand dollars UAH = Ukrainian hryvniaEGP = Egyptian pounds PEN = Peruvian nuevos soles USD/$ = U.S. dollarsEUR/€ = Euros PLN = Polish zloty ZAR = South African randEURIBOR = Euro Interbank Offered Rate
See notes to financial statements.
CapitalWorld Bond Fund (continued)

American Funds Insurance Series 191
Bonds, notes & other debt instruments 86.87%Principal amount
(000)Value(000)
Corporate bonds, notes & loans 86.76%
Energy13.38%
Aethon United BR LP / Aethon United Finance Corp. 8.25% 20261 $ 425 $ 461Antero Midstream Partners LP 5.375% 20291 470 491Antero Resources Corp. 7.625% 20291 200 222Antero Resources Corp. 5.375% 20301 720 736Apache Corp. 4.625% 2025 1,520 1,646Apache Corp. 4.875% 2027 1,365 1,480Apache Corp. 4.375% 2028 794 846Apache Corp. 6.00% 2037 165 190Apache Corp. 5.10% 2040 795 834Apache Corp. 4.75% 2043 265 276Ascent Resources - Utica LLC 7.00% 20261 1,540 1,616Ascent Resources - Utica LLC 9.00% 20271 120 166Ascent Resources - Utica LLC 8.25% 20281 271 299Ascent Resources - Utica LLC 5.875% 20291 1,105 1,106Ascent Resources - Utica LLC, Term Loan,
(3-month USD-LIBOR + 9.00%) 10.00% 20251,2,3 228 253Blue Racer Midstream LLC and Blue Racer Finance Corp. 7.625% 20251 676 733Bristow Group, Inc. 6.875% 20281 375 383California Resources Corp. 7.125% 20261 290 306Carrizo Oil & Gas, Inc. 6.25% 2023 750 751Cenovus Energy, Inc. 5.375% 2025 445 509Cenovus Energy, Inc. 5.40% 2047 400 496Centennial Resource Production, LLC 6.875% 20271 465 476Cheniere Energy Partners LP 5.625% 2026 1,151 1,197Cheniere Energy Partners LP 4.50% 2029 938 1,010Cheniere Energy Partners LP 4.00% 20311 2,323 2,430Cheniere Energy, Inc. 7.00% 2024 319 366Cheniere Energy, Inc. 5.875% 2025 495 568Cheniere Energy, Inc. 4.625% 20281 5,396 5,700Chesapeake Energy Corp. 4.875% 20224 4,300 124Chesapeake Energy Corp. 5.50% 20261 1,185 1,253Chesapeake Energy Corp. 5.875% 20291 1,020 1,105CNX Resources Corp. 7.25% 20271 738 792CNX Resources Corp. 6.00% 20291 1,345 1,456Comstock Resources, Inc. 6.75% 20291 845 901Comstock Resources, Inc. 5.875% 20301 1,120 1,144Constellation Oil Services Holding SA 10.00% 2024 (100% PIK)1,4,5 7,784 2,219Continental Resources, Inc. 5.75% 20311 715 857Convey Park Energy LLC 7.50% 20251 417 434CQP Holdco LP / BIP-V Chinook Holdco LLC 5.50% 20311 3,560 3,714Crestwood Midstream Partners LP 6.00% 20291 575 603DCP Midstream LP 7.375% junior subordinated perpetual bonds
(3-month USD-LIBOR + 5.148% on 12/15/2022)6 270 265Devon Energy Corp. 5.875% 20281 202 225Devon Energy Corp. 4.50% 20301 493 542Diamond Foreign Asset Co. / Diamond Finance LLC 9.00% 20271,3,5,7,8 68 68Diamond Foreign Asset Co. / Diamond Finance LLC 9.00% 20273,5,7,8 62 62DTMidstream, Inc. 4.125% 20291 1,750 1,779DTMidstream, Inc. 4.375% 20311 960 982Encino Acquisition Partners Holdings, LLC 8.50% 20281 50 51Endeavor Energy Resources LP 6.625% 20251 850 912Energean Israel Finance, Ltd. 4.50% 20241 445 456Energy Transfer Operating LP 5.00% 2050 2,501 2,896Energy Transfer Partners LP 6.50% junior subordinated perpetual bonds
(5-year UST Yield Curve Rate T Note Constant Maturity + 5.694% on 11/15/2026)6 400 409EnLink Midstream Partners, LLC 5.625% 20281 660 699EQMMidstream Partners LP 4.75% 2023 400 418EQMMidstream Partners LP 4.125% 2026 127 130EQMMidstream Partners LP 6.50% 20271 2,365 2,644
American High-IncomeTrust(formerly High-Income Bond Fund)Investment portfolio June 30, 2021 unaudited

192 American Funds Insurance Series
Bonds, notes & other debt instruments (continued)Principal amount
(000)Value(000)
Corporate bonds, notes & loans (continued)
Energy(continued)
EQMMidstream Partners LP 5.50% 2028 $1,231 $1,333EQMMidstream Partners LP 4.50% 20291 835 851EQMMidstream Partners LP 4.75% 20311 1,105 1,140EQMMidstream Partners LP 6.50% 2048 100 107EQT Corp. 7.625% 2025 (7.375% on 2/1/2025)6 630 736EQT Corp. 3.90% 2027 125 134EQT Corp. 5.00% 2029 480 536EQT Corp. 8.50% 2030 (8.25% on 8/1/2021)6 400 522EQT Corp. 3.625% 20311 370 387Genesis Energy LP 5.625% 2024 150 151Genesis Energy LP 6.50% 2025 2,235 2,262Genesis Energy LP 8.00% 2027 2,313 2,433Guara Norte SARL 5.198% 20341 592 618Harvest Midstream I LP 7.50% 20281 1,867 2,031Hess Midstream Partners LP 5.125% 20281 687 722Hilcorp Energy I LP 5.75% 20251 775 789Hilcorp Energy I LP 5.75% 20291 615 642Hilcorp Energy I LP 6.00% 20311 600 637Independence Energy Finance LLC 7.25% 20261 500 527Indigo Natural Resources LLC 5.375% 20291 470 492Lealand Finance Company BV, Term Loan,
(3-month USD-LIBOR + 3.00%) 3.093% 20242,3 12 8Lealand Finance Company BV, Term Loan,
(3-month USD-LIBOR + 4.00%) 4.09% 2025 (73.30% PIK)2,3,5 149 68Murphy Oil Corp. 6.875% 2024 750 769Murphy Oil Corp. 6.375% 2028 370 391Murphy Oil USA, Inc. 3.75% 20311 200 198Nabors Industries, Inc. 5.75% 2025 355 327New Fortress Energy, Inc. 6.75% 20251 1,040 1,066New Fortress Energy, Inc. 6.50% 20261 2,385 2,440NGL Energy Operating LLC 7.50% 20261 7,705 8,100NGL Energy Partners LP 7.50% 2023 414 408NGL Energy Partners LP 6.125% 2025 2,696 2,452Northern Oil and Gas, Inc. 8.125% 20281 1,435 1,548NorthRiver Midstream Finance LP 5.625% 20261 625 650NuStar Logistics LP 6.00% 2026 286 311Oasis Midstream Partners LP / OMP Finance Corp. 8.00% 20291 1,845 1,967Oasis Petroleum, Inc. 6.375% 20261 887 926Occidental Petroleum Corp. 2.90% 2024 2,498 2,557Occidental Petroleum Corp. 5.875% 2025 710 791Occidental Petroleum Corp. 8.00% 2025 1,400 1,678Occidental Petroleum Corp. 3.40% 2026 600 615Occidental Petroleum Corp. 3.50% 2029 210 211Occidental Petroleum Corp. 6.625% 2030 810 973Occidental Petroleum Corp. 8.875% 2030 300 402Occidental Petroleum Corp. 6.125% 2031 480 565Occidental Petroleum Corp. 4.20% 2048 165 154PDC Energy, Inc. 5.75% 2026 1,100 1,151Peabody Energy Corp. 8.50% 2024 (29.41% PIK)1,5 635 481Petrobras Global Finance Co. 5.60% 2031 250 280Petrobras Global Finance Co. 6.90% 2049 375 448Petrobras Global Finance Co. 6.75% 2050 850 995Petrobras Global Finance Co. 5.50% 2051 200 200Petróleos Mexicanos 6.875% 20251 350 388Petróleos Mexicanos 5.35% 2028 449 442Petróleos Mexicanos 7.69% 2050 651 627Petrorio Luxembourg SARL 6.125% 20261 320 328PowerTeam Services, LLC 9.033% 20251 1,060 1,167Precision Drilling Corp. 7.125% 20261 175 181
American High-IncomeTrust (continued)(formerly High-Income Bond Fund)

American Funds Insurance Series 193
Bonds, notes & other debt instruments (continued)Principal amount
(000)Value(000)
Corporate bonds, notes & loans (continued)
Energy(continued)
Precision Drilling Corp. 6.875% 20291 $ 800 $ 825Range Resources Corp. 4.875% 2025 642 665Range Resources Corp. 8.25% 20291 850 959Rattler Midstream Partners LP 5.625% 20251 955 1,005Renewable Energy Group, Inc. 5.875% 20281 520 547Rockies Express Pipeline LLC 4.95% 20291 1,000 1,033Sabine Pass Liquefaction, LLC 4.50% 2030 856 989Sanchez Energy Corp. 7.25% 20231,4 739 18SM Energy Co. 6.50% 2028 220 226Southwestern Energy Co. 6.45% 20256 715 793Southwestern Energy Co. 7.50% 2026 1,649 1,748Southwestern Energy Co. 7.75% 2027 897 974Southwestern Energy Co. 8.375% 2028 865 979Suburban Propane Partners LP / Suburban Energy Finance Corp. 5.00% 20311 735 753Sunoco LP 5.50% 2026 513 530Sunoco LP 6.00% 2027 647 679Sunoco LP 4.50% 20291 1,930 1,970Superior Plus LP and Superior General Partner, Inc. 4.50% 20291 690 712Tallgrass Energy Partners LP 5.50% 20241 522 530Tallgrass Energy Partners LP 7.50% 20251 420 461Tapstone Energy, Term Loan, (3-month USD-LIBOR + 4.00%) 4.741% 20242,3,7,8 11 6Targa Resources Partners LP 5.875% 2026 321 338Targa Resources Partners LP 6.50% 2027 133 145Targa Resources Partners LP 6.875% 2029 115 130Targa Resources Partners LP 5.50% 2030 1,302 1,434Targa Resources Partners LP 4.875% 20311 2,000 2,168Targa Resources Partners LP 4.00% 20321 550 566Teekay Corp. 9.25% 20221 2,908 3,008Teekay Offshore Partners LP 8.50% 20231 2,009 1,848Transocean Guardian, Ltd. 5.875% 20241 410 399Transocean Poseidon, Ltd. 6.875% 20271 385 387Transocean, Inc. 6.125% 20251 421 426Transocean, Inc. 7.25% 20251 500 437Transocean, Inc. 8.00% 20271 550 464USA Compression Partners LP 6.875% 2026 264 277USA Compression Partners LP 6.875% 2027 247 264Weatherford International PLC 8.75% 20241 1,971 2,065Weatherford International PLC 11.00% 20241 3,686 3,838Western Gas Partners LP 4.50% 2028 1,374 1,472Western Gas Partners LP 5.45% 2044 55 60Western MidstreamOperating LP 4.35% 20256 369 390Western MidstreamOperating LP 4.75% 2028 160 173Western MidstreamOperating LP 5.30% 20306 400 449Western MidstreamOperating LP 6.50% 20506 500 580
143,720
Communicationservices12.69%
Altice France SA 5.125% 20291 2,897 2,915Beasley Mezzanine Holdings, LLC 8.625% 20261 475 481Brightstar Escrow Corp. 9.75% 20251 575 621CCO Holdings LLC and CCO Holdings Capital Corp. 4.00% 20231 1,155 1,167CCO Holdings LLC and CCO Holdings Capital Corp. 5.50% 20261 263 273CCO Holdings LLC and CCO Holdings Capital Corp. 5.75% 20261 1,088 1,127CCO Holdings LLC and CCO Holdings Capital Corp. 5.00% 20281 96 101CCO Holdings LLC and CCO Holdings Capital Corp. 4.50% 20301 3,454 3,601CCO Holdings LLC and CCO Holdings Capital Corp. 4.75% 20301 3,137 3,321CCO Holdings LLC and CCO Holdings Capital Corp. 2.80% 2031 140 143CCO Holdings LLC and CCO Holdings Capital Corp. 4.25% 20311 4,285 4,371CCO Holdings LLC and CCO Holdings Capital Corp. 4.50% 2032 1,024 1,065
American High-IncomeTrust (continued)(formerly High-Income Bond Fund)

194 American Funds Insurance Series
Bonds, notes & other debt instruments (continued)Principal amount
(000)Value(000)
Corporate bonds, notes & loans (continued)
Communicationservices(continued)
CCO Holdings LLC and CCO Holdings Capital Corp. 4.50% 20331 $ 725 $ 743CenturyLink, Inc. 6.75% 2023 1,480 1,643CenturyLink, Inc. 7.50% 2024 583 655CenturyLink, Inc. 5.125% 20261 1,600 1,666CenturyLink, Inc. 4.00% 20271 750 766Cinemark USA, Inc. 5.875% 20261 330 346Cinemark USA, Inc. 5.25% 20281 400 410Clear Channel Worldwide Holdings, Inc. 7.75% 20281 700 734Clear Channel Worldwide Holdings, Inc. 7.50% 20291 300 311Cogent Communications Group, Inc. 3.50% 20261 750 768Consolidated Communications, Inc. 5.00% 20281 225 229Diamond Sports Group LLC 5.375% 20261 743 482Diamond Sports Group LLC 6.625% 20271 1,056 520DISH DBS Corp. 5.125% 20291 900 890Embarq Corp. 7.995% 2036 2,215 2,514Epicor Software Corp., Term Loan C, (3-month USD-LIBOR + 3.25%) 4.00% 20272,3 74 74Epicor Software Corp., Term Loan, (3-month USD-LIBOR + 7.75%) 8.75% 20282,3 525 545Front Range BidCo, Inc. 6.125% 20281 1,089 1,114Frontier Communications Corp. 5.875% 20271 1,550 1,662Frontier Communications Corp. 5.00% 20281 5,680 5,879Frontier Communications Corp. 6.75% 20291 2,110 2,248Frontier Communications Holdings, LLC 5.875% 2029 1,000 1,020Gray Television, Inc. 7.00% 20271 828 898iHeartCommunications, Inc. 5.25% 20271 1,445 1,513Inmarsat PLC 6.75% 20261 1,475 1,562Intelsat Jackson Holding Co. 8.00% 20241 1,675 1,733Intelsat Jackson Holding Co. 8.50% 20241,4 3,175 1,885Intelsat Jackson Holding Co., Term Loan,
(3-month USD-LIBOR + 5.50%) 6.50% 20212,3 1,212 1,228Intelsat Jackson Holding Co., Term Loan, 6.625% 20242 3,900 3,980Kantar Group LLC, Term Loan B, (3-month USD-LIBOR + 4.50%) 5.25% 20262,3 390 391Lamar Media Corp. 3.75% 2028 61 62Lamar Media Corp. 4.875% 2029 300 317Lamar Media Corp. 4.00% 2030 260 264Lamar Media Corp. 3.625% 20311 125 122Level 3 Financing, Inc. 3.75% 20291 1,150 1,120Liberty Global PLC 5.50% 20281 656 689Ligado Networks LLC 15.50% 2023 (100% PIK)1,5 1,530 1,511Ligado Networks LLC 17.50% 2024 (100% PIK)1,5 246 190Live Nation Entertainment, Inc. 3.75% 20281 425 427Match Group, Inc. 4.625% 20281 520 542MDC Partners, Inc. 7.50% 20241,6 5,170 5,241Meredith Corp. 6.875% 2026 1,349 1,405Netflix, Inc. 4.875% 2028 635 739Netflix, Inc. 4.875% 20301 924 1,102News Corp. 3.875% 20291 1,050 1,062Nexstar Broadcasting, Inc. 4.75% 20281 2,400 2,469Nexstar Escrow Corp. 5.625% 20271 789 837Qwest Capital Funding, Inc. 6.875% 2028 860 951Scripps Escrow II, Inc. 3.875% 20291 575 571Sinclair Television Group, Inc. 5.125% 20271 195 196Sinclair Television Group, Inc. 4.125% 20301 1,550 1,525Sirius XM Radio, Inc. 4.625% 20241 74 76Sirius XM Radio, Inc. 4.00% 20281 2,325 2,398Sirius XM Radio, Inc. 4.125% 20301 345 349Sprint Corp. 11.50% 2021 538 559Sprint Corp. 7.625% 2026 2,000 2,445Sprint Corp. 6.875% 2028 7,981 10,246Sprint Corp. 8.75% 2032 5,591 8,505
American High-IncomeTrust (continued)(formerly High-Income Bond Fund)

American Funds Insurance Series 195
Bonds, notes & other debt instruments (continued)Principal amount
(000)Value(000)
Corporate bonds, notes & loans (continued)
Communicationservices(continued)
TEGNA, Inc. 4.75% 20261 $ 850 $ 906TEGNA, Inc. 4.625% 2028 150 156TEGNA, Inc. 5.00% 2029 836 877T-Mobile US, Inc. 2.625% 2026 1,650 1,691T-Mobile US, Inc. 2.625% 2029 460 455T-Mobile US, Inc. 3.375% 20291 1,750 1,810T-Mobile US, Inc. 2.875% 2031 800 795Total Play Telecomunicaciones, SA de CV 7.50% 20251 475 504Trilogy International South Pacific LLC / TISP Finance, Inc. 8.875% 20231 4,641 4,637Univision Communications, Inc. 5.125% 20251 3,195 3,269Univision Communications, Inc. 6.625% 20271 3,050 3,309Univision Communications, Inc. 4.50% 20291 5,500 5,554UPC Broadband Finco BV 4.875% 20311 650 652Virgin Media O2 4.25% 20311 1,925 1,894Virgin Media Secured Finance PLC 4.50% 20301 990 999Vmed O2 UK Financing I PLC 4.75% 20311 300 305Warner Music Group 3.875% 20301 850 861Ziggo Bond Co. BV 5.125% 20301 419 430Ziggo Bond Finance BV 5.50% 20271 1,324 1,379Ziggo Bond Finance BV 4.875% 20301 2,200 2,258
136,256
Consumerdiscretionary12.18%
Adient US LLC 9.00% 20251 500 552Affinity Gaming 6.875% 20271 885 942Allied Universal Holdco LLC 6.625% 20261 858 911Allied Universal Holdco LLC 9.75% 20271 976 1,076Allied Universal Holdco LLC 4.625% 20281 490 492Allied Universal Holdco LLC 6.00% 20291 1,745 1,771Atlas LuxCo 4 SARL 4.625% 20281 280 281Boyd Gaming Corp. 8.625% 20251 120 132Boyd Gaming Corp. 4.75% 2027 621 644Boyd Gaming Corp. 4.75% 20311 895 930Boyne USA, Inc. 4.75% 20291 235 243Brookfield Residential Properties, Inc. 5.00% 20291 260 263Burger King Corp. 3.875% 20281 500 507Caesars Entertainment, Inc. 6.25% 20251 1,085 1,151Caesars Resort Collection, LLC 5.75% 20251 345 364Carnival Corp. 11.50% 20231 1,132 1,275Carnival Corp. 7.625% 20261 975 1,060Carnival Corp. 10.50% 20261 1,130 1,317Carrols Restaurant Group, Inc. 5.875% 20291 730 722Carvana Co. 5.625% 20251 135 141Carvana Co. 5.50% 20271 1,551 1,606Carvana Co. 5.875% 20281 1,219 1,284CEC Entertainment, Inc. 6.75% 20261 1,100 1,130Cirsa Gaming Corp. SA 7.875% 20231 2,552 2,608Colt Merger Sub, Inc. 8.125% 20271 80 89Dana, Inc. 5.625% 2028 675 732Dana, Inc. 4.25% 2030 455 469Empire Communities Corp. 7.00% 20251 525 553Everi Holdings Inc. 5.00% 20291 835 856Fertitta Entertainment, Inc. 6.75% 20241 2,171 2,196Ford Motor Co. 8.50% 2023 1,787 1,996Ford Motor Co. 9.00% 2025 684 844Ford Motor Co. 9.625% 2030 250 359Ford Motor Co. 7.45% 2031 275 362Ford Motor Credit Company LLC 3.664% 2024 500 526Ford Motor Credit Company LLC 3.81% 2024 887 929
American High-IncomeTrust (continued)(formerly High-Income Bond Fund)

196 American Funds Insurance Series
Bonds, notes & other debt instruments (continued)Principal amount
(000)Value(000)
Corporate bonds, notes & loans (continued)
Consumerdiscretionary(continued)
Ford Motor Credit Company LLC 5.584% 2024 $ 350 $ 384Ford Motor Credit Company LLC 3.375% 2025 1,875 1,947Ford Motor Credit Company LLC 5.125% 2025 6,285 6,929Ford Motor Credit Company LLC 4.542% 2026 1,210 1,319Ford Motor Credit Company LLC 3.815% 2027 1,395 1,455Ford Motor Credit Company LLC 4.125% 2027 835 887Ford Motor Credit Company LLC 4.271% 2027 525 563Ford Motor Credit Company LLC 2.90% 2028 350 349Ford Motor Credit Company LLC 5.113% 2029 200 224Ford Motor Credit Company LLC 4.00% 2030 1,820 1,909Full House Resorts, Inc. 8.25% 20281 1,320 1,444Goodyear Tire & Rubber Co. 5.00% 20291 685 718Grupo Axo, SAPI de CV, 5.75% 20261 200 200Hanesbrands, Inc. 4.625% 20241 1,945 2,064Hanesbrands, Inc. 5.375% 20251 432 459Hanesbrands, Inc. 4.875% 20261 2,024 2,188Hilton Grand Vacations Borrower LLC 5.00% 20291 2,360 2,416HiltonWorldwide Holdings, Inc. 4.875% 2030 508 543HiltonWorldwide Holdings, Inc. 4.00% 20311 1,120 1,131International Game Technology PLC 6.50% 20251 1,383 1,552International Game Technology PLC 4.125% 20261 785 818International Game Technology PLC 5.25% 20291 3,380 3,630KB Home 6.875% 2027 330 394Landry’s Finance Acquisition Co., Term Loan,
(3-month USD-LIBOR + 12.00%) 13.00% 20232,3 18 19Lennar Corp. 4.50% 2024 40 44Levi Strauss & Co. 5.00% 2025 90 92Levi Strauss & Co. 3.50% 20311 430 429LGI Homes, Inc. 4.00% 20291 600 604Limited Brands, Inc. 6.625% 20301 175 203Limited Brands, Inc. 6.875% 2035 526 667Limited Brands, Inc. 6.75% 2036 545 684Lithia Motors, Inc. 3.875% 20291 1,045 1,084Lithia Motors, Inc. 4.375% 20311 475 509LSF9 Atlantis Holdings LLC / Victra Finance Corp. 7.75% 20261 405 421M.D.C. Holdings, Inc. 6.00% 2043 823 1,062Magic MergerCo, Inc. 5.25% 20281 475 488Magic MergerCo, Inc. 7.875% 20291 475 490Marriott Ownership Resorts, Inc. 4.50% 20291 490 497McGraw-Hill Global Education Holdings, LLC, Term Loan B,
(3-month USD-LIBOR + 4.75%) 5.75% 20242,3 1,067 1,071Melco International Development, Ltd. 5.75% 20281 1,670 1,766Melco International Development, Ltd. 5.375% 20291 375 397Merlin Entertainment 5.75% 20261 792 831MGMGrowth Properties LLC 5.625% 2024 557 604MGMGrowth Properties LLC 4.625% 20251 900 963MGMGrowth Properties LLC 3.875% 20291 1,665 1,695MGM Resorts International 6.00% 2023 541 580MGM Resorts International 5.50% 2027 401 441Midwest Gaming Borrower, LLC 4.875% 20291 895 897Mohegan Gaming & Entertainment 8.00% 20261 2,710 2,835NCL Corp., Ltd. 3.625% 20241 650 629NCL Corp., Ltd. 12.25% 20241 175 212NCL Corp., Ltd. 5.875% 20261 475 499Neiman Marcus Group LLC 7.125% 20261 2,910 3,110Newell Rubbermaid, Inc. 4.875% 2025 445 494Newell Rubbermaid, Inc. 5.875% 20366 30 37Norwegian Cruise Line Holdings, Ltd. 10.25% 20261 275 320Panther BF Aggregator 2 LP 6.25% 20261 140 149
American High-IncomeTrust (continued)(formerly High-Income Bond Fund)

American Funds Insurance Series 197
Bonds, notes & other debt instruments (continued)Principal amount
(000)Value(000)
Corporate bonds, notes & loans (continued)
Consumerdiscretionary(continued)
Panther BF Aggregator 2 LP 8.50% 20271 $ 990 $ 1,081Party City Holdings, Inc. 6.625% 20261 500 431Party City Holdings, Inc. 8.75% 20261 2,950 3,153Peninsula Pacific Entertainment LLC 8.50% 20271 500 538Playa Resorts Holding BV, Term Loan B,
(3-month USD-LIBOR + 2.75%) 2.869% 20242,3 846 815Raptor Acquisition Corp. 4.875% 20261 950 964Raptor Acquisition Corp. / Raptor Co-Issuer LLC, Term Loan B,
(3-month USD-LIBOR + 4.00%) 4.75% 20262,3 425 426Real Hero Merger Sub 2, Inc. 6.25% 20291 430 447Royal Caribbean Cruises, Ltd. 10.875% 20231 325 371Royal Caribbean Cruises, Ltd. 11.50% 20251 1,900 2,192Royal Caribbean Cruises, Ltd. 4.25% 20261 1,560 1,560Sally Holdings LLC and Sally Capital, Inc. 5.625% 2025 1,225 1,266Sally Holdings LLC and Sally Capital, Inc. 8.75% 20251 1,959 2,148Scientific Games Corp. 5.00% 20251 91 94Scientific Games Corp. 8.625% 20251 2,170 2,379Scientific Games Corp. 8.25% 20261 2,534 2,721Scientific Games Corp. 7.00% 20281 85 93Scientific Games Corp. 7.25% 20291 230 260Six Flags Entertainment Corp. 4.875% 20241 537 543Sizzling Platter LLC 8.50% 20251 450 466Staples, Inc. 7.50% 20261 421 437Studio City Finance, Ltd. 5.00% 20291 650 657Tempur Sealy International, Inc. 4.00% 20291 485 493The Home Co., Inc. 7.25% 20251 725 771Truck Hero, Inc., Term Loan B, (3-month USD-LIBOR + 3.75%) 4.50% 20282,3 1,172 1,174Universal Entertainment Corp. 8.50% 20241 1,375 1,452Vail Resorts, Inc. 6.25% 20251 315 338VICI Properties LP 4.25% 20261 962 1,002VICI Properties LP 4.625% 20291 1,385 1,474VICI Properties LP / VICI Note Co., Inc. 3.50% 20251 851 871VICI Properties LP / VICI Note Co., Inc. 3.75% 20271 379 387VICI Properties LP / VICI Note Co., Inc. 4.125% 20301 2,774 2,856WASHMultifamily Acquisition, Inc. 5.75% 20261 405 423Wheel Pros, Inc. 6.50% 20291 750 760Wheel Pros, Inc., Term Loan, (3-month USD-LIBOR + 4.50%) 5.25% 20282,3 750 753Wyndham Destinations, Inc. 6.625% 20261 525 596Wyndham Destinations, Inc. 4.625% 20301 400 414WyndhamWorldwide Corp. 4.375% 20281 1,055 1,099Wynn Las Vegas, LLC andWynn Capital Corp. 4.25% 20231 1,171 1,216Wynn Las Vegas, LLC andWynn Capital Corp. 5.50% 20251 200 216Wynn Las Vegas, LLC andWynn Capital Corp. 5.25% 20271 100 108Wynn Macau, Ltd. 5.125% 20291 200 207Wynn Resorts, Ltd. 7.75% 20251 494 533Wynn Resorts, Ltd. 5.125% 20291 962 1,017
130,861
Health care10.38%
Auris Luxembourg III SARL, Term Loan,(3-month USD-LIBOR + 3.75%) 3.854% 20262,3 841 834
Avantor Funding, Inc. 4.625% 20281 1,510 1,596Bausch Health Companies, Inc. 9.25% 20261 2,644 2,879Bausch Health Companies, Inc. 5.75% 20271 700 745Bausch Health Companies, Inc. 4.875% 20281 1,745 1,788Bausch Health Companies, Inc. 5.00% 20281 1,137 1,080Bausch Health Companies, Inc. 7.00% 20281 553 571Bausch Health Companies, Inc. 5.00% 20291 125 117Bausch Health Companies, Inc. 6.25% 20291 815 807
American High-IncomeTrust (continued)(formerly High-Income Bond Fund)

198 American Funds Insurance Series
Bonds, notes & other debt instruments (continued)Principal amount
(000)Value(000)
Corporate bonds, notes & loans (continued)
Health care(continued)
Bausch Health Companies, Inc. 5.25% 20301 $ 852 $ 793Bausch Health Companies, Inc. 5.25% 20311 3,055 2,860Catalent Pharma Solutions, Inc. 5.00% 20271 53 55Catalent, Inc. 3.125% 20291 445 432Centene Corp. 5.375% 20261 330 345Centene Corp. 5.375% 20261 50 52Centene Corp. 4.25% 2027 584 616Centene Corp. 2.45% 2028 4,140 4,201Centene Corp. 4.625% 2029 4,305 4,740Centene Corp. 3.00% 2030 2,530 2,602Centene Corp. 3.375% 2030 842 881Centene Corp. 2.50% 2031 1,485 1,466Charles River Laboratories International, Inc. 4.25% 20281 241 250Charles River Laboratories International, Inc. 3.75% 20291 780 792Community Health Systems, Inc. 5.625% 20271 730 780Community Health Systems, Inc. 6.00% 20291 653 700DaVita, Inc. 4.625% 20301 1,100 1,132Encompass Health Corp. 4.50% 2028 496 515Encompass Health Corp. 4.75% 2030 450 479Endo DAC / Endo Finance LLC / Endo Finco 9.50% 20271 1,911 1,952Endo DAC / Endo Finance LLC / Endo Finco 6.00% 20281 1,458 985Endo International PLC 5.75% 20221 2,937 2,713Endo International PLC 5.875% 20241 1,300 1,282Endo Luxembourg Finance Co. I SARL / Endo U.S., Inc. 6.125% 20291 1,490 1,462HCA, Inc. 5.875% 2023 70 76HCA, Inc. 5.375% 2025 175 198HCA, Inc. 5.875% 2026 321 372HCA, Inc. 4.50% 2027 173 196HCA, Inc. 5.625% 2028 2,065 2,450HCA, Inc. 5.875% 2029 750 908HCA, Inc. 3.50% 2030 1,250 1,332HCA, Inc. 5.50% 2047 128 167HCA, Inc. 5.25% 2049 475 607HCA, Inc. 7.50% 2095 250 352IMS Health Holdings, Inc. 5.00% 20261 823 854Jaguar Holding Co. II 4.625% 20251 350 368Jaguar Holding Co. II 5.00% 20281 375 407Jazz Securities DAC 4.375% 20291 660 685Mallinckrodt International Finance SA 5.50% 20251,4 1,118 782Mallinckrodt PLC 5.75% 20221,4 420 295Mallinckrodt PLC 10.00% 20251 2,319 2,594Molina Healthcare, Inc. 5.375% 2022 1,714 1,799Molina Healthcare, Inc. 4.375% 20281 920 961Molina Healthcare, Inc. 3.875% 20301 1,999 2,084Organon Finance 1 LLC 4.125% 20281 475 485Organon Finance 1 LLC 5.125% 20311 790 815Owens & Minor, Inc. 4.375% 2024 1,935 2,024Owens & Minor, Inc. 4.50% 20291 1,980 2,037Par Pharmaceutical, Inc. 7.50% 20271 4,215 4,315Radiology Partners, Inc. 9.25% 20281 1,693 1,877Rotech Healthcare, Inc., Term Loan,
(3-month USD-LIBOR + 11.00%) 13.00% 2023 (100% PIK)2,3,5,7,8 4,111 4,111RP Escrow Issuer, LLC 5.25% 20251 735 770Select Medical Holdings Corp. 6.25% 20261 554 591Surgery Center Holdings 10.00% 20271 416 458Syneos Health, Inc. 3.625% 20291 630 624Team Health Holdings, Inc. 6.375% 20251 899 857Team Health Holdings, Inc., Term Loan B, 3.75% 20242,3 314 305Tenet Healthcare Corp. 4.625% 2024 559 569
American High-IncomeTrust (continued)(formerly High-Income Bond Fund)

American Funds Insurance Series 199
Bonds, notes & other debt instruments (continued)Principal amount
(000)Value(000)
Corporate bonds, notes & loans (continued)
Health care(continued)
Tenet Healthcare Corp. 4.875% 20261 $6,080 $ 6,314Tenet Healthcare Corp. 5.125% 20271 710 746Tenet Healthcare Corp. 6.25% 20271 500 523Tenet Healthcare Corp. 4.625% 20281 550 567Tenet Healthcare Corp. 6.125% 20281 500 534Tenet Healthcare Corp. 4.25% 20291 990 1,004Tenet Healthcare Corp. 6.875% 2031 100 114Teva Pharmaceutical Finance Co. BV 2.80% 2023 1,908 1,904Teva Pharmaceutical Finance Co. BV 6.00% 2024 4,779 5,080Teva Pharmaceutical Finance Co. BV 7.125% 2025 2,709 2,990Teva Pharmaceutical Finance Co. BV 3.15% 2026 2,134 2,033Teva Pharmaceutical Finance Co. BV 6.75% 2028 2,038 2,237Teva Pharmaceutical Finance Co. BV 4.10% 2046 762 669U.S. Renal Care, Inc. 10.625% 20271 359 378Valeant Pharmaceuticals International, Inc. 6.125% 20251 5,285 5,424Valeant Pharmaceuticals International, Inc. 9.00% 20251 581 624Valeant Pharmaceuticals International, Inc. 8.50% 20271 502 547
111,515
Materials9.92%
Alcoa Netherlands Holding BV 5.50% 20271 510 554Alcoa Netherlands Holding BV 4.125% 20291 430 449ArcelorMittal 4.25% 2029 200 222ArcelorMittal 7.25% 20396 570 806ArcelorMittal 7.00% 20416 985 1,370Arconic Corp. 6.00% 20251 810 864Arconic Rolled Products Corp. 6.125% 20281 200 215Ardagh Group SA 6.50% 20271,5 622 654Ardagh Metal Packaging Finance USA LLC 4.00% 20291 650 646Ardagh Packaging Finance 5.25% 20251 495 521Ardagh Packaging Finance 6.00% 20251 533 551Ardagh Packaging Finance 5.25% 20271 225 230Axalta Coating Systems LLC 4.75% 20271 460 483BWAY Parent Co., Inc. 5.50% 20241 1,619 1,637Cascades, Inc. 5.125% 20261 495 529Cascades, Inc. 5.375% 20281 340 358Cleveland-Cliffs, Inc. 9.875% 20251 204 239Cleveland-Cliffs, Inc. 6.75% 20261 1,167 1,260Cleveland-Cliffs, Inc. 5.875% 2027 4,675 4,920Cleveland-Cliffs, Inc. 7.00% 2027 297 314Cleveland-Cliffs, Inc. 4.625% 20291 2,300 2,423Cleveland-Cliffs, Inc. 4.875% 20311 2,475 2,602Consolidated Energy Finance SA 6.50% 20261 1,250 1,287Constellium SE 3.75% 20291 350 347CVR Partners LP 9.25% 20231 346 348CVR Partners LP 6.125% 20281 2,775 2,848Element Solutions, Inc. 3.875% 20281 620 633First QuantumMinerals, Ltd. 7.25% 20231 2,073 2,116First QuantumMinerals, Ltd. 7.50% 20251 4,243 4,413First QuantumMinerals, Ltd. 6.875% 20261 3,076 3,222First QuantumMinerals, Ltd. 6.875% 20271 5,440 5,935FMG Resources 4.375% 20311 1,115 1,194Freeport-McMoRan, Inc. 4.55% 2024 150 163Freeport-McMoRan, Inc. 4.25% 2030 932 1,000Freeport-McMoRan, Inc. 5.40% 2034 562 680Freeport-McMoRan, Inc. 5.45% 2043 1,851 2,265FXI Holdings, Inc. 7.875% 20241 2,905 3,009FXI Holdings, Inc. 12.25% 20261 5,515 6,367GPCMerger Sub, Inc. 7.125% 20281 434 469
American High-IncomeTrust (continued)(formerly High-Income Bond Fund)

200 American Funds Insurance Series
Bonds, notes & other debt instruments (continued)Principal amount
(000)Value(000)
Corporate bonds, notes & loans (continued)
Materials(continued)
Hexion, Inc. 7.875% 20271 $2,411 $ 2,604INEOS Group Holdings SA 5.625% 20241 772 777Joseph T. Ryerson & Son, Inc. 8.50% 20281 1,260 1,403LSB Industries, Inc. 9.625% 20231 4,313 4,440Mercer International, Inc. 5.125% 20291 400 412Methanex Corp. 5.125% 2027 4,500 4,866Methanex Corp. 5.25% 2029 1,300 1,402Methanex Corp. 5.65% 2044 825 855Neon Holdings, Inc. 10.125% 20261 970 1,061Nouryon Holding BV 8.00% 20261 931 988Nova Chemicals Corp. 4.875% 20241 495 523Nova Chemicals Corp. 5.00% 20251 295 316Nova Chemicals Corp. 5.25% 20271 1,036 1,118Nova Chemicals Corp. 4.25% 20291 1,530 1,547Novelis Corp. 5.875% 20261 950 989Novelis Corp. 4.75% 20301 990 1,041OCI NV 5.25% 20241 250 258Olin Corp. 9.50% 20251 490 611Olin Corp. 5.625% 2029 300 330Olin Corp. 5.00% 2030 280 299Owens-Illinois, Inc. 5.875% 20231 420 453Owens-Illinois, Inc. 6.375% 20251 265 295Plastipak Holdings, Inc. 6.25% 20251 200 205Rayonier A.M. Products, Inc. 7.625% 20261 300 313SCIH Salt Holdings, Inc. 4.875% 20281 2,825 2,832SCIH Salt Holdings, Inc. 6.625% 20291 1,245 1,250Scotts Miracle-Gro Co. 4.50% 2029 639 665Sealed Air Corp. 4.875% 20221 410 428Sealed Air Corp. 5.25% 20231 267 283Sealed Air Corp. 4.00% 20271 316 337Silgan Holdings, Inc. 4.125% 2028 377 392Summit Materials, Inc. 6.50% 20271 360 382Summit Materials, Inc. 5.25% 20291 955 1,016Trivium Packaging BV 5.50% 20261 530 558Trivium Packaging BV 8.50% 20271 403 439Tronox, Ltd. 4.625% 20291 2,570 2,599Valvoline, Inc. 4.25% 20301 353 365Valvoline, Inc. 3.625% 20311 620 622Venator Materials Corp. 5.75% 20251 4,876 4,809Venator Materials Corp. 9.50% 20251 1,805 2,035W. R. Grace & Co. 4.875% 20271 790 839Warrior Met Coal, Inc. 8.00% 20241 1,400 1,423
106,523
Industrials8.68%
ADT Corp. 3.50% 2022 1,221 1,245Allison Transmission Holdings, Inc. 3.75% 20311 2,270 2,234American Airlines, Inc. 5.50% 20261 2,160 2,290American Airlines, Inc. 5.75% 20291 750 812Associated Materials, LLC 9.00% 20251 2,156 2,291Atkore, Inc. 4.25% 20311 385 390ATS Automation Tooling Systems, Inc. 4.125% 20281 275 282Avis Budget Car Rental, LLC 5.75% 20271 1,290 1,347Avis Budget Group, Inc. 5.25% 20251 509 516Avis Budget Group, Inc. 4.75% 20281 550 564Avis Budget Group, Inc. 5.375% 20291 1,550 1,616Avolon Holdings Funding, Ltd. 5.25% 20241 660 726Azul Investments LLP 7.25% 20261 670 658Boeing Company 3.625% 2031 1,050 1,130
American High-IncomeTrust (continued)(formerly High-Income Bond Fund)

American Funds Insurance Series 201
Bonds, notes & other debt instruments (continued)Principal amount
(000)Value(000)
Corporate bonds, notes & loans (continued)
Industrials(continued)
Boeing Company 3.50% 2039 $ 70 $ 70Boeing Company 3.75% 2050 400 413Boeing Company 5.93% 2060 700 968Bohai Financial Investment Holding Co., Ltd. 5.25% 20221 1,050 1,099Bohai Financial Investment Holding Co., Ltd. 4.50% 20231 132 139Bohai Financial Investment Holding Co., Ltd. 5.125% 20231 660 714Bohai Financial Investment Holding Co., Ltd. 5.50% 20241 600 660Bombardier, Inc. 6.125% 20231 645 681Bombardier, Inc. 7.50% 20241 600 628Bombardier, Inc. 7.50% 20251 1,601 1,650Bombardier, Inc. 7.125% 20261 1,910 2,002Bombardier, Inc. 7.875% 20271 2,803 2,912Bombardier, Inc. 7.45% 20341 700 753Booz Allen Hamilton, Inc. 3.875% 20281 1,390 1,421BWX Technologies, Inc. 4.125% 20281 615 628BWX Technologies, Inc. 4.125% 20291 1,220 1,244Clarivate Science Holdings Corp. 3.875% 20281 1,515 1,531Clarivate Science Holdings Corp. 4.875% 20291 1,365 1,403Clean Harbors, Inc. 4.875% 20271 766 805CoreCivic, Inc. 8.25% 2026 2,190 2,275CoreLogic, Inc. 4.50% 20281 4,289 4,257CoreLogic, Inc., Term Loan, (3-month USD-LIBOR + 6.50%) 7.00% 20292,3 750 757Covanta Holding Corp. 5.875% 2025 358 371Covanta Holding Corp. 5.00% 2030 850 895Deluxe Corp. 8.00% 20291 300 326Dun & Bradstreet Corp. 6.875% 20261 1,003 1,067Dun & Bradstreet Corp. 10.25% 20271 1,148 1,272Fortress Transportation and Infrastructure Investors LLC 9.75% 20271 445 515Fortress Transportation and Infrastructure Investors LLC 5.50% 20281 510 532Global Infrastructure Solutions, Inc. 5.625% 20291 500 520Harsco Corp. 5.75% 20271 650 683Herc Holdings, Inc. 5.50% 20271 200 211Howmet Aerospace, Inc. 6.875% 2025 987 1,150Icahn Enterprises Finance Corp. 4.75% 2024 1,080 1,130JELD-WEN Holding, Inc. 4.875% 20271 1,033 1,076Kratos Defense & Security Solutions, Inc. 6.50% 20251 1,710 1,797LABL Escrow Issuer, LLC 6.75% 20261 850 908LABL Escrow Issuer, LLC 10.50% 20271 690 762LSC Communications, Inc. 8.75% 20231,4,7,8 8,933 474LSC Communications, Inc., Term Loan B, (USD Prime Rate + 4.50%) 7.75% 20222,3,4,7,8 301 16MasTec, Inc. 4.50% 20281 1,250 1,319Meritor, Inc. 4.50% 20281 825 838MH Sub I, LLC, Term Loan, (3-month USD-LIBOR + 6.25%) 6.345% 20292,3 150 153Mueller Water Products, Inc. 4.00% 20291 625 643NESCO Holdings II, Inc. 5.50% 20291 255 266Nielsen Finance LLC and Nielsen Finance Co. 5.00% 20251 750 774Nielsen Finance LLC and Nielsen Finance Co. 5.625% 20281 250 264Nielsen Finance LLC and Nielsen Finance Co. 5.875% 20301 1,400 1,527Park River Holdings, Inc. 5.625% 20291 775 755Pitney Bowes, Inc. 6.875% 20271 750 795Prime Security Services Borrower, LLC 3.375% 20271 475 461Prime Security Services Borrower, LLC 6.25% 20281 627 668R.R. Donnelley & Sons Co. 6.125% 20261 375 396R.R. Donnelley & Sons Co., Term Loan B,
(3-month USD-LIBOR + 5.00%) 5.104% 20242,3 368 369Rexnord Corp. 4.875% 20251 848 868Rolls-Royce PLC 5.75% 20271 615 678Sensata Technologies Holding BV 4.00% 20291 410 417Sensata Technologies, Inc. 3.75% 20311 500 495
American High-IncomeTrust (continued)(formerly High-Income Bond Fund)
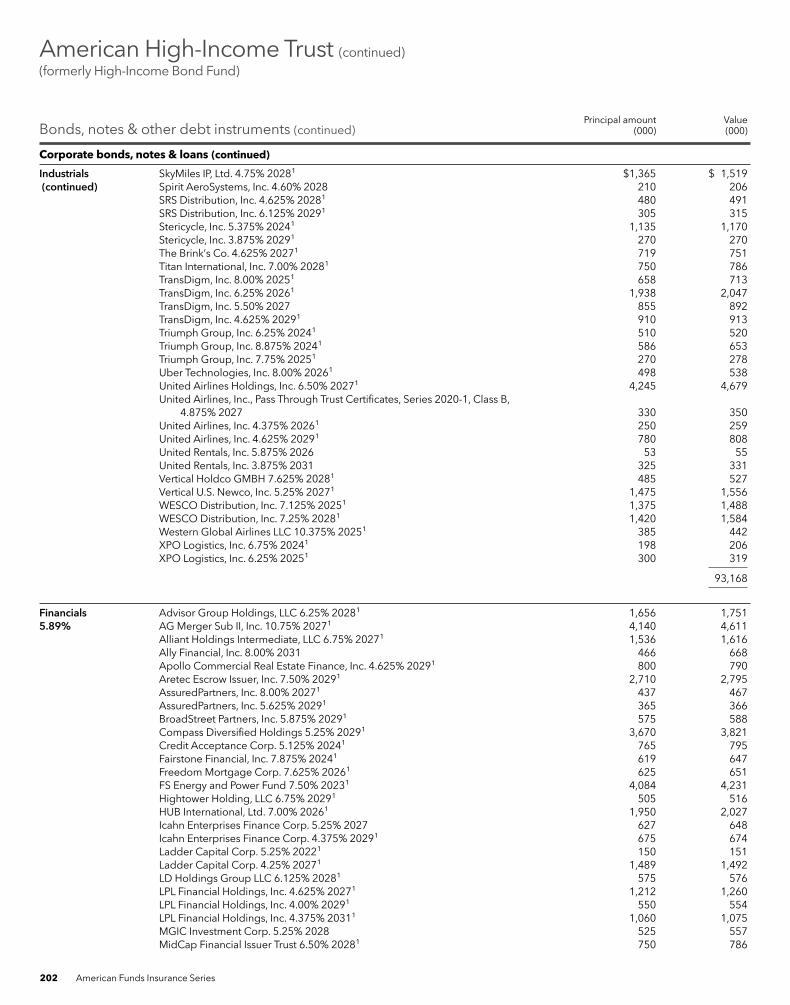
202 American Funds Insurance Series
Bonds, notes & other debt instruments (continued)Principal amount
(000)Value(000)
Corporate bonds, notes & loans (continued)
Industrials(continued)
SkyMiles IP, Ltd. 4.75% 20281 $1,365 $ 1,519Spirit AeroSystems, Inc. 4.60% 2028 210 206SRS Distribution, Inc. 4.625% 20281 480 491SRS Distribution, Inc. 6.125% 20291 305 315Stericycle, Inc. 5.375% 20241 1,135 1,170Stericycle, Inc. 3.875% 20291 270 270The Brink’s Co. 4.625% 20271 719 751Titan International, Inc. 7.00% 20281 750 786TransDigm, Inc. 8.00% 20251 658 713TransDigm, Inc. 6.25% 20261 1,938 2,047TransDigm, Inc. 5.50% 2027 855 892TransDigm, Inc. 4.625% 20291 910 913Triumph Group, Inc. 6.25% 20241 510 520Triumph Group, Inc. 8.875% 20241 586 653Triumph Group, Inc. 7.75% 20251 270 278Uber Technologies, Inc. 8.00% 20261 498 538United Airlines Holdings, Inc. 6.50% 20271 4,245 4,679United Airlines, Inc., Pass Through Trust Certificates, Series 2020-1, Class B,
4.875% 2027 330 350United Airlines, Inc. 4.375% 20261 250 259United Airlines, Inc. 4.625% 20291 780 808United Rentals, Inc. 5.875% 2026 53 55United Rentals, Inc. 3.875% 2031 325 331Vertical Holdco GMBH 7.625% 20281 485 527Vertical U.S. Newco, Inc. 5.25% 20271 1,475 1,556WESCO Distribution, Inc. 7.125% 20251 1,375 1,488WESCO Distribution, Inc. 7.25% 20281 1,420 1,584Western Global Airlines LLC 10.375% 20251 385 442XPO Logistics, Inc. 6.75% 20241 198 206XPO Logistics, Inc. 6.25% 20251 300 319
93,168
Financials5.89%
Advisor Group Holdings, LLC 6.25% 20281 1,656 1,751AGMerger Sub II, Inc. 10.75% 20271 4,140 4,611Alliant Holdings Intermediate, LLC 6.75% 20271 1,536 1,616Ally Financial, Inc. 8.00% 2031 466 668Apollo Commercial Real Estate Finance, Inc. 4.625% 20291 800 790Aretec Escrow Issuer, Inc. 7.50% 20291 2,710 2,795AssuredPartners, Inc. 8.00% 20271 437 467AssuredPartners, Inc. 5.625% 20291 365 366BroadStreet Partners, Inc. 5.875% 20291 575 588Compass Diversified Holdings 5.25% 20291 3,670 3,821Credit Acceptance Corp. 5.125% 20241 765 795Fairstone Financial, Inc. 7.875% 20241 619 647FreedomMortgage Corp. 7.625% 20261 625 651FS Energy and Power Fund 7.50% 20231 4,084 4,231Hightower Holding, LLC 6.75% 20291 505 516HUB International, Ltd. 7.00% 20261 1,950 2,027Icahn Enterprises Finance Corp. 5.25% 2027 627 648Icahn Enterprises Finance Corp. 4.375% 20291 675 674Ladder Capital Corp. 5.25% 20221 150 151Ladder Capital Corp. 4.25% 20271 1,489 1,492LD Holdings Group LLC 6.125% 20281 575 576LPL Financial Holdings, Inc. 4.625% 20271 1,212 1,260LPL Financial Holdings, Inc. 4.00% 20291 550 554LPL Financial Holdings, Inc. 4.375% 20311 1,060 1,075MGIC Investment Corp. 5.25% 2028 525 557MidCap Financial Issuer Trust 6.50% 20281 750 786
American High-IncomeTrust (continued)(formerly High-Income Bond Fund)

American Funds Insurance Series 203
Bonds, notes & other debt instruments (continued)Principal amount
(000)Value(000)
Corporate bonds, notes & loans (continued)
Financials(continued)
MidCap Financial Issuer Trust 5.625% 20301 $ 565 $ 568MSCI, Inc. 5.375% 20271 320 342MSCI, Inc. 4.00% 20291 900 952MSCI, Inc. 3.625% 20301 66 68MSCI, Inc. 3.625% 20311 1,875 1,926MSCI, Inc. 3.875% 20311 2,150 2,234National Financial Partners Corp. 6.875% 20281 1,094 1,155Nationstar Mortgage Holdings, Inc. 5.50% 20281 425 429Navient Corp. 6.50% 2022 1,633 1,705Navient Corp. 5.50% 2023 3,086 3,259Navient Corp. 5.875% 2024 1,720 1,860Navient Corp. 6.125% 2024 1,267 1,371Navient Corp. 5.00% 2027 2,883 2,989Navient Corp. 4.875% 2028 320 322Navient Corp. 5.625% 2033 1,678 1,624NFP Corp. 4.875% 20281 500 509OneMain Holdings, Inc. 7.125% 2026 935 1,090Owl Rock Capital Corp. 4.625% 20241 750 798Owl Rock Capital Corp. 3.75% 2025 900 953Owl Rock Capital Corp. 3.375% 2026 390 407Quicken Loans, LLC 3.625% 20291 455 450Springleaf Finance Corp. 6.125% 2024 1,167 1,257Springleaf Finance Corp. 6.625% 2028 190 219Springleaf Finance Corp. 5.375% 2029 183 199Starwood Property Trust, Inc. 5.00% 2021 871 876Starwood Property Trust, Inc. 5.50% 20231 465 488Summer (BC) BidCo B LLC 5.50% 20261 365 372Travelport Finance Luxembourg SARL, Term Loan,
(3-month USD-LIBOR + 8.00%) 9.00% 2025 (72.22% PIK)2,3,5 481 506UnitedWholesale Mortgage, LLC 5.50% 20291 255 255
63,296
Informationtechnology4.22%
Almonde, Inc., Term Loan, (3-month USD-LIBOR + 7.25%) 8.25% 20252,3 3,574 3,620Applied Systems, Inc., Term Loan, (3-month USD-LIBOR + 5.50%) 6.25% 20252,3 822 836Avaya, Inc. 6.125% 20281 490 525Banff Merger Sub, Inc. 9.75% 20261 1,833 1,932Black Knight, Inc. 3.625% 20281 1,315 1,310BMC Software, Inc. 7.125% 20251 225 241BMC Software, Inc. 9.125% 20261 240 254Booz Allen Hamilton, Inc. 4.00% 20291 455 466Broadcom, Inc. 3.469% 20341 179 190CommScope Finance LLC 6.00% 20261 833 880Dell International LLC / EMC Corp. 8.10% 2036 450 687Dell International LLC / EMC Corp. 8.35% 2046 291 477Dell, Inc. 6.50% 2038 222 284Dell, Inc. 5.40% 2040 850 1,006Diebold Nixdorf AG, Term Loan B, (3-month USD-LIBOR + 2.75%) 2.897% 20232,3 643 634Diebold Nixdorf, Inc. 9.375% 20251 4,700 5,226Diebold, Inc. 8.50% 2024 1,534 1,572Elastic NV 4.125% 20291 900 900Gartner, Inc. 4.50% 20281 2,025 2,141Gartner, Inc. 3.75% 20301 200 205Imola Merger Corp. 4.75% 20291 300 309MicroStrategy, Inc. 6.125% 20281 675 676MoneyGram International, Inc., Term Loan B,
(3-month USD-LIBOR + 6.00%) 7.00% 20232,3 1,210 1,223NCR Corp. 5.125% 20291 2,675 2,762Oracle Corp. 3.95% 2051 458 501
American High-IncomeTrust (continued)(formerly High-Income Bond Fund)

204 American Funds Insurance Series
Bonds, notes & other debt instruments (continued)Principal amount
(000)Value(000)
Corporate bonds, notes & loans (continued)
Informationtechnology(continued)
Rocket Software, Inc. 6.50% 20291 $1,715 $ 1,704Sabre GLBL, Inc. 7.375% 20251 48 52Sabre Holdings Corp. 9.25% 20251 548 653Solera Holdings, Inc., Term Loan B, (3-month USD-LIBOR + 4.00%) 4.50% 20282,3 1,325 1,330Square, Inc. 2.75% 20261 2,350 2,394Square, Inc. 3.50% 20311 1,270 1,283Synaptics, Inc. 4.00% 20291 325 327Ultimate Software Group, Inc., Term Loan,
(3-month USD-LIBOR + 6.75%) 7.50% 20272,3 1,325 1,352Unisys Corp. 6.875% 20271 1,695 1,855VeriSign, Inc. 5.25% 2025 132 150Veritas Holdings, Ltd. 7.50% 20251 2,140 2,234ViaSat, Inc. 5.625% 20271 175 183Virtusa Corp., Term Loan B, (3-month USD-LIBOR + 4.25%) 5.00% 20282,3 50 50Xerox Corp. 5.00% 20251 595 629Xerox Corp. 5.50% 20281 2,135 2,221
45,274
Real estate3.32%
Brookfield Property REIT, Inc. 5.75% 20261 3,714 3,909Diversified Healthcare Trust 4.75% 2024 275 283Diversified Healthcare Trust 9.75% 2025 650 721Diversified Healthcare Trust 4.75% 2028 335 331Diversified Healthcare Trust 4.375% 2031 1,975 1,895HAT Holdings I LLC / HAT Holdings II LLC 3.375% 20261 500 504Hospitality Properties Trust 7.50% 2025 238 270Howard Hughes Corp. 5.375% 20281 1,957 2,082Howard Hughes Corp. 4.125% 20291 3,143 3,153Howard Hughes Corp. 4.375% 20311 2,018 2,015Iron Mountain, Inc. 4.875% 20271 2,066 2,145Iron Mountain, Inc. 5.00% 20281 617 642Iron Mountain, Inc. 5.25% 20281 1,214 1,273Iron Mountain, Inc. 5.25% 20301 2,610 2,766Iron Mountain, Inc. 4.50% 20311 1,300 1,318Kennedy-Wilson Holdings, Inc. 4.75% 2029 2,005 2,068Kennedy-Wilson Holdings, Inc. 5.00% 2031 1,895 1,952Ladder Capital Corp. 5.25% 20251 1,040 1,060Medical Properties Trust, Inc. 5.00% 2027 1,333 1,415Medical Properties Trust, Inc. 3.50% 2031 239 242Park Intermediate Holdings LLC 4.875% 20291 1,540 1,595QTS Realty Trust, Inc. 3.875% 20281 625 669Realogy Corp. 9.375% 20271 740 823Realogy Corp. 5.75% 20291 840 879Realogy Group LLC 7.625% 20251 260 282RHP Hotel Properties LP / RHP Finance Corp. 4.50% 20291 685 687Service Properties Trust 5.50% 2027 130 139WeWork Companies, Inc. 7.875% 20251 140 146Xenia Hotels & Resorts, Inc. 4.875% 20291 360 372
35,636
Consumer staples3.31%
Albertsons Companies, Inc. 3.50% 20231 550 566Albertsons Companies, Inc. 3.50% 20291 1,580 1,564Albertsons Companies, Inc. 4.875% 20301 335 358B&G Foods, Inc. 5.25% 2025 612 629B&G Foods, Inc. 5.25% 2027 1,428 1,489Central Garden & Pet Co. 4.125% 2030 420 430Central Garden & Pet Co. 4.125% 20311 755 766Coty, Inc. 5.00% 20261 700 712
American High-IncomeTrust (continued)(formerly High-Income Bond Fund)

American Funds Insurance Series 205
Bonds, notes & other debt instruments (continued)Principal amount
(000)Value(000)
Corporate bonds, notes & loans (continued)
Consumer staples(continued)
Coty, Inc. 6.50% 20261 $ 520 $ 528Darling Ingredients, Inc. 5.25% 20271 459 483Edgewell Personal Care Co. 5.50% 20281 275 292Energizer Holdings, Inc. 4.375% 20291 545 546Ingles Markets, Inc. 4.00% 20311 355 355JBS Luxembourg SARL 3.625% 20321 600 600Kraft Heinz Company 3.875% 2027 725 797Kraft Heinz Company 4.25% 2031 713 811Kraft Heinz Company 5.00% 2042 500 612Kraft Heinz Company 5.20% 2045 330 411Kraft Heinz Company 4.375% 2046 2,116 2,402Kraft Heinz Company 4.875% 2049 2,115 2,573Kraft Heinz Company 5.50% 2050 770 1,002Kronos Acquisition Holdings, Inc. 5.00% 20261 840 854Kronos Acquisition Holdings, Inc. 7.00% 20271 3,350 3,362LambWeston Holdings, Inc. 4.625% 20241 561 582Nestle Skin Health SA, Term Loan B3, (3-month USD-LIBOR + 3.75%) 4.50% 20262,3 1,801 1,809Post Holdings, Inc. 5.625% 20281 569 605Post Holdings, Inc. 5.50% 20291 166 178Post Holdings, Inc. 4.625% 20301 4,205 4,281Post Holdings, Inc. 4.50% 20311 750 750Prestige Brands International, Inc. 5.125% 20281 103 109Prestige Brands International, Inc. 3.75% 20311 1,525 1,473Simmons Foods, Inc. 4.625% 20291 993 1,003Spectrum Brands, Inc. 5.75% 2025 178 183TritonWater Holdings, Inc. 6.25% 20291 630 632United Natural Foods, Inc. 6.75% 20281 1,700 1,833
35,580
Utilities2.79%
AmeriGas Partners LP 5.75% 2027 297 332Calpine Corp. 4.50% 20281 500 511Calpine Corp. 5.125% 20281 518 528Calpine Corp. 3.75% 20311 400 381Calpine Corp. 5.00% 20311 1,000 997DPL, Inc. 4.125% 2025 765 821DPL, Inc. 4.35% 2029 575 625Emera, Inc. 6.75% 2076 (3-month USD-LIBOR + 5.44% on 6/15/2026)6 1,155 1,355FirstEnergy Corp. 2.25% 2030 1,170 1,123FirstEnergy Corp. 2.65% 2030 624 622FirstEnergy Corp. 7.375% 2031 734 1,006FirstEnergy Corp. 5.35% 20476 550 661FirstEnergy Corp. 3.40% 2050 1,710 1,681FirstEnergy Transmission LLC 2.866% 20281 325 337Inversiones Latin America Power 5.125% 20331 310 308NextEra Energy Partners LP 4.25% 20241 122 129NextEra Energy Partners LP 3.875% 20261 92 98NGL Energy Partners LP 7.50% 2026 1,150 1,052NRG Energy, Inc. 7.25% 2026 328 341NRG Energy, Inc. 3.375% 20291 355 349NRG Energy, Inc. 3.625% 20311 1,030 1,013Pacific Gas and Electric Co. 3.00% 2028 550 553Pacific Gas and Electric Co. 4.55% 2030 473 506Pacific Gas and Electric Co. 3.25% 2031 200 197Pacific Gas and Electric Co. 3.95% 2047 500 466Pacific Gas and Electric Co. 4.95% 2050 600 618PG&E Corp. 5.00% 2028 2,880 2,916PG&E Corp. 5.25% 2030 2,345 2,374PG&E Corp., Term Loan, (3-month USD-LIBOR + 3.00%) 3.50% 20252,3 252 249
American High-IncomeTrust (continued)(formerly High-Income Bond Fund)

206 American Funds Insurance Series
Bonds, notes & other debt instruments (continued)Principal amount
(000)Value(000)
Corporate bonds, notes & loans (continued)
Utilities(continued)
Talen Energy Corp. 10.50% 20261 $3,768 $ 2,729Talen Energy Corp. 7.25% 20271 2,973 2,778Talen Energy Corp. 6.625% 20281 130 119Talen Energy Supply, LLC 7.625% 20281 1,699 1,592Vistra Operations Co. LLC 3.55% 20241 231 244Vistra Operations Co. LLC 4.375% 20291 400 403
30,014
Total corporate bonds, notes & loans 931,843
U.S. Treasury bonds & notes 0.11%
U.S. Treasuryinflation-protectedsecurities0.11%
U.S. Treasury Inflation-Protected Security 0.125% 20519,10 1,025 1,124
Municipals 0.00%
Puerto Rico0.00%
Aqueduct and Sewer Auth., Rev. Bonds, Series 2012-B, 5.35% 2027 5 5
Total bonds, notes & other debt instruments (cost: $906,669,000) 932,972
Convertible bonds & notes 0.35%
Communicationservices0.14%
Cinemark USA, Inc., convertible notes, 4.50% 20251 190 337DISH DBS Corp., convertible notes, 3.375% 2026 635 650Live Nation Entertainment, Inc., convertible notes, 2.00% 2025 430 482
1,469
Industrials0.08%
American Airlines Group, Inc., convertible notes, 6.50% 2025 183 288Southwest Airlines Co., convertible notes, 1.25% 2025 403 612
900
Informationtechnology0.07%
Sabre GLBL, Inc., convertible notes, 4.00% 2025 390 712
Consumerdiscretionary0.05%
NCL Corp., Ltd., convertible notes, 5.375% 20251 155 283Royal Caribbean Cruises, Ltd., convertible notes, 4.25% 20231 200 273
556
Energy0.01%
Mesquite Energy, Inc., convertible notes, 15.19% 2023 (100% PIK)1,5,7,8 70 70
Total convertible bonds & notes (cost: $2,724,000) 3,707
Convertible stocks 0.08% Shares
Financials0.05%
2020 Cash Mandatory Exchangeable Trust, convertible preferred shares, 0% 20231 411 519
Utilities0.03%
PG&E Corp., convertible preferred units, 5.50% 2023 3,350 340
Total convertible stocks (cost: $717,000) 859
American High-IncomeTrust (continued)(formerly High-Income Bond Fund)

American Funds Insurance Series 207
Common stocks 5.62% SharesValue(000)
Health care2.02%
Rotech Healthcare, Inc.7,8,11,12 201,793 $21,693
Energy1.99%
Chesapeake Energy Corp. 157,546 8,180Chesapeake Energy Corp.1,7 844 42Oasis Petroleum, Inc. 42,568 4,280Denbury, Inc.11 32,880 2,525Extraction Oil & Gas, Inc.11 29,821 1,637Extraction Oil & Gas, Inc.1,7,11,12 8,511 449Weatherford International11 99,159 1,805Ascent Resources - Utica LLC, Class A7,8,11,12 6,297,894 1,260Diamond Offshore Drilling, Inc.11 82,188 522Diamond Offshore Drilling, Inc.1,7,8,11 28,784 153California Resources Corp.11 17,202 518McDermott International, Ltd.11 107,875 53Mesquite Energy, Inc.7,8,11 3,558 21Tapstone Energy, LLC1,7,8,11 14,603 —13
21,445
Industrials0.77%
New AMI I, LLC7,8,11 949,277 8,259
Consumerdiscretionary0.51%
MYT Holding Co., Class B7,11 608,846 3,379NMG Parent LLC7,11 14,350 1,937NMG Parent LLC1,7,11 1,615 194
5,510
Materials0.14%
Hexion Holdings Corp., Class B11 81,939 1,475
Financials0.09%
Jonah Energy Parent LLC7,8,11 38,716 581Navient Corp. 20,000 386
967
Communicationservices0.06%
iHeartMedia, Inc., Class A11 22,639 610
Informationtechnology0.04%
MoneyGram International, Inc.11 41,400 417
Total common stocks (cost: $34,018,000) 60,376
Preferred securities 0.27%
Consumerdiscretionary0.20%
MYT Holding LLC, Series A, preferred shares 2,095,904 2,143
Industrials0.07%
ACR III LSC Holdings LLC, Series B, preferred shares1,7,8,11 1,022 719
Total preferred securities (cost: $2,933,000) 2,862
American High-IncomeTrust (continued)(formerly High-Income Bond Fund)

208 American Funds Insurance Series
Rights & warrants 0.13% SharesValue(000)
Energy0.07%
Chesapeake Energy Corp., Class B, warrants, expire 202611 14,962 $ 357Chesapeake Energy Corp., Class A, warrants, expire 202611 12,565 338Chesapeake Energy Corp., Class C, warrants, expire 202611 4,376 91Sable Permian Resources, LLC, Class A, warrants, expire 20247,8,11 2,894 —13
786
Consumerdiscretionary0.06%
NMG Parent LLC, warrants, expire 20277,11 27,111 620
Total rights & warrants (cost: $2,471,000) 1,406
Short-term securities 5.83%
Money market investments 5.83%
Capital Group Central Cash Fund 0.04%14,15 626,652 62,665
Total short-term securities (cost: $62,664,000) 62,665
Total investment securities 99.15% (cost: $1,012,196,000) 1,064,847
Other assets less liabilities 0.85% 9,158
Net assets 100.00% $1,074,005
Futures contracts
Contracts TypeNumber ofcontracts Expiration
Notionalamount16
(000)
Value at6/30/202117
(000)
Unrealizeddepreciationat 6/30/2021
(000)
2 Year U.S. Treasury Note Futures Long 248 October 2021 $ 49,600 $ 54,639 $ (93)10 Year Ultra U.S. Treasury Note Futures Short 24 September 2021 (2,400) (3,533) (57)10 Year U.S. Treasury Note Futures Short 284 September 2021 (28,400) (37,630) (84)
$(234)
Swap contracts
Credit default swaps
Centrally cleared credit default swaps on credit indices — buy protection
ReceivePay/Payment frequency
Expirationdate
Notional(000)
Value at6/30/2021
(000)
Upfrontpremiumreceived
(000)
Unrealizeddepreciationat 6/30/2021
(000)
CDX.NA.HY.36 5.00%/Quarterly 6/20/2026 $50,074 $(5,109) $(4,890) $(219)
Investments in affiliates15
Value ofaffiliate at1/1/2021
(000)Additions
(000)Reductions
(000)
Netrealized
gain(000)
Netunrealized
depreciation(000)
Value ofaffiliate at6/30/2021
(000)
Dividendincome
(000)
Short-term securities 5.83%Money market investments 5.83%
Capital Group Central Cash Fund 0.04%14 $33,493 $302,652 $273,478 $1 $(3) $62,665 $12
American High-IncomeTrust (continued)(formerly High-Income Bond Fund)

American Funds Insurance Series 209
1Acquired in a transaction exempt from registration under Rule 144A of the Securities Act of 1933. May be resold in the U.S. in transactions exempt fromregistration, normally to qualified institutional buyers. The total value of all such securities was $651,007,000, which represented 60.61% of the net assets of thefund.
2Loan participations and assignments; may be subject to legal or contractual restrictions on resale. The total value of all such loans was $28,965,000, whichrepresented 2.70% of the net assets of the fund.
3Coupon rate may change periodically. Reference rate and spread are as of the most recent information available. Some coupon rates are determined by theissuer or agent based on current market conditions; therefore, the reference rate and spread are not available.
4Scheduled interest and/or principal payment was not received.5Payment in kind; the issuer has the option of paying additional securities in lieu of cash. Most recent payment was 100% cash unless otherwise noted.6Step bond; coupon rate may change at a later date.7Valued under fair value procedures adopted by authority of the board of trustees. The total value of all such securities was $44,114,000, which represented4.11% of the net assets of the fund.
8Value determined using significant unobservable inputs.9All or a portion of this security was pledged as collateral. The total value of pledged collateral was $412,000, which represented .04% of the net assets of thefund.
10Index-linked bond whose principal amount moves with a government price index.11Security did not produce income during the last 12 months.12Acquired through a private placement transaction exempt from registration under the Securities Act of 1933. May be subject to legal or contractual restrictionson resale. Further details on these holdings appear on the following page.
13Amount less than one thousand.14Rate represents the seven-day yield at 6/30/2021.15Part of the same “group of investment companies“ as the fund as defined under the Investment Company Act of 1940, as amended.16Notional amount is calculated based on the number of contracts and notional contract size.17Value is calculated based on the notional amount and current market price.
Private placement securitiesAcquisition
dateCost(000)
Value(000)
Percentof netassets
Rotech Healthcare, Inc. 9/26/2013 $4,331 $21,693 2.02%
Ascent Resources - Utica LLC, Class A 11/15/2016 302 1,260 .12
Extraction Oil & Gas, Inc. 1/20/2021 215 449 .04
Total private placement securities $4,848 $23,402 2.18%
Key to abbreviations and symbolAuth. = AuthorityCMT = Constant Maturity TreasuryDAC = Designated Activity CompanyLIBOR = London Interbank Offered RateRev. = RevenueUSD/$ = U.S. dollars
See notes to financial statements.
American High-IncomeTrust (continued)(formerly High-Income Bond Fund)

210 American Funds Insurance Series
Bonds, notes & other debt instruments 79.12%Principal amount
(000)Value(000)
Mortgage-backed obligations 57.66%
Federal agencymortgage-backedobligations50.51%
Fannie Mae Pool #AS7638 2.50% 20311 $ 853 $ 893Fannie Mae Pool #695412 5.00% 20331 —2 —2
Fannie Mae Pool #AD3566 5.00% 20351 2 2Fannie Mae Pool #256583 5.00% 20361,3 34 36Fannie Mae Pool #889101 1.631% 20381,4 32 33Fannie Mae Pool #964279 2.485% 20381,4 31 32Fannie Mae Pool #964708 2.765% 20381,4 4 4Fannie Mae Pool #AC0794 5.00% 20391 8 10Fannie Mae Pool #931768 5.00% 20391 2 2Fannie Mae Pool #AL9335 2.289% 20401,4 1,184 1,256Fannie Mae Pool #932606 5.00% 20401 4 5Fannie Mae Pool #MA4333 2.00% 20411 24 24Fannie Mae Pool #MA4387 2.00% 20411 22 22Fannie Mae Pool #MA4364 2.00% 20411 7 7Fannie Mae Pool #AL9327 2.164% 20411,4 1,109 1,175Fannie Mae Pool #AL9326 2.199% 20411,4 1,453 1,539Fannie Mae Pool #AJ1873 4.00% 20411 7 8Fannie Mae Pool #AE1248 5.00% 20411 11 13Fannie Mae Pool #AE1274 5.00% 20411 8 9Fannie Mae Pool #AE1277 5.00% 20411 5 6Fannie Mae Pool #AE1283 5.00% 20411 3 3Fannie Mae Pool #AE1290 5.00% 20421 6 6Fannie Mae Pool #AT3954 3.50% 20431 4 4Fannie Mae Pool #AT0300 3.50% 20431 2 2Fannie Mae Pool #AY1829 3.50% 20441 4 4Fannie Mae Pool #AW8240 3.50% 20441 1 1Fannie Mae Pool #BJ5015 4.00% 20471 58 63Fannie Mae Pool #BH3122 4.00% 20471 1 1Fannie Mae Pool #BM4488 3.381% 20481,4 622 650Fannie Mae Pool #BK6840 4.00% 20481 38 41Fannie Mae Pool #BK5232 4.00% 20481 30 32Fannie Mae Pool #BK9743 4.00% 20481 11 12Fannie Mae Pool #BK9761 4.50% 20481 8 9Fannie Mae Pool #BJ8402 3.544% 20491,4 128 133Fannie Mae Pool #CA5496 3.00% 20501 2,962 3,157Fannie Mae Pool #CB0041 3.00% 20511 242 260Fannie Mae Pool #BF0379 3.50% 20591 211 229Fannie Mae Pool #BF0497 3.00% 20601 71 75Fannie Mae Pool #BF0481 3.50% 20601 241 262Freddie Mac Pool #A18781 5.00% 20341,3 819 935Freddie Mac Pool #C91883 4.00% 20361,3 2,923 3,186Freddie Mac Pool #840222 2.386% 20401,4 328 348Freddie Mac Pool #RB5118 2.00% 20411 72 74Freddie Mac Pool #Q15874 4.00% 20431 2 2Freddie Mac Pool #760014 2.977% 20451,4 580 606Freddie Mac Pool #760012 3.109% 20451,4 52 54Freddie Mac Pool #760013 3.182% 20451,4 34 36Freddie Mac Pool #760015 2.679% 20471,4 104 109Freddie Mac Pool #Q52069 3.50% 20471 44 47Freddie Mac Pool #Q47615 3.50% 20471 27 29Freddie Mac Pool #Q56599 4.00% 20481 46 50Freddie Mac Pool #Q56175 4.00% 20481 34 37Freddie Mac Pool #Q55971 4.00% 20481 32 35Freddie Mac Pool #Q55970 4.00% 20481 13 14Freddie Mac Pool #Q58411 4.50% 20481 93 103Freddie Mac Pool #Q58436 4.50% 20481 41 45Freddie Mac Pool #Q58378 4.50% 20481 33 36Freddie Mac Pool #Q57242 4.50% 20481 28 30Freddie Mac Pool #RA1339 3.00% 20491 2,327 2,449Freddie Mac Pool #QA2748 3.50% 20491 28 30Freddie Mac Pool #SD8158 3.50% 20511 84 88
American FundsMortgage FundInvestment portfolio June 30, 2021 unaudited

American Funds Insurance Series 211
Bonds, notes & other debt instruments (continued)Principal amount
(000)Value(000)
Mortgage-backed obligations (continued)
Federal agencymortgage-backedobligations(continued)
Freddie Mac Pool #SD8164 3.50% 20511 $ 62 $ 66Freddie Mac Seasoned Credit Risk Transfer Trust, Series 2017-2, Class MA,
3.00% 20561 1,087 1,137Freddie Mac Seasoned Credit Risk Transfer Trust, Series 2017-2, Class HA,
3.00% 20561,4 1,086 1,136Freddie Mac Seasoned Credit Risk Transfer Trust, Series 2017-1, Class HA,
3.00% 20561,4 865 905Freddie Mac Seasoned Credit Risk Transfer Trust, Series 2017-3, Class HT,
3.25% 20561 124 134Freddie Mac Seasoned Credit Risk Transfer Trust, Series 2018-1, Class HT,
3.00% 20571 660 705Freddie Mac Seasoned Credit Risk Transfer Trust, Series 2017-4, Class HT,
3.25% 20571,4 4,003 4,312Freddie Mac Seasoned Credit Risk Transfer Trust, Series 2018-3, Class MA,
3.50% 20571 2,240 2,354Freddie Mac Seasoned Credit Risk Transfer Trust, Series 2017-4, Class MT,
3.50% 20571 1,784 1,947Freddie Mac Seasoned Credit Risk Transfer Trust, Series 2018-2, Class MT,
3.50% 20571 982 1,071Freddie Mac Seasoned Credit Risk Transfer Trust, Series 2019-2, Class MT,
3.50% 20581 39 43Freddie Mac Seasoned Credit Risk Transfer Trust, Series 2019-3, Class MT,
3.50% 20581 24 26Freddie Mac Seasoned Loan Structured Transaction Trust, Series 2018-2, Class A1,
3.50% 20281 5,165 5,463Freddie Mac Seasoned Loan Structured Transaction Trust, Series 2018-1, Class A1,
3.50% 20281 1,432 1,500Government National Mortgage Assn. 2.00% 20511,5 12,480 12,688Government National Mortgage Assn. 2.50% 20511,5 7,496 7,744Government National Mortgage Assn. 3.00% 20511,5 3,032 3,163Government National Mortgage Assn. 3.00% 20511,5 800 835Government National Mortgage Assn. 3.50% 20511,5 37 39Government National Mortgage Assn. Pool #AH5894 3.75% 20341 925 1,000Government National Mortgage Assn. Pool #AD0028 3.75% 20381 576 615Government National Mortgage Assn. Pool #AH5897 3.75% 20391 578 617Government National Mortgage Assn. Pool #004410 4.00% 20391 58 60Government National Mortgage Assn. Pool #783690 6.00% 20391 116 133Government National Mortgage Assn. Pool #004823 4.00% 20401 88 90Government National Mortgage Assn. Pool #005142 4.50% 20411 28 30Government National Mortgage Assn. Pool #005104 5.00% 20411 177 193Government National Mortgage Assn. Pool #005165 6.50% 20411 143 161Government National Mortgage Assn. Pool #AA5326 3.50% 20421 238 245Government National Mortgage Assn. Pool #MA0366 3.50% 20421 207 212Government National Mortgage Assn. Pool #AA5526 3.50% 20421 140 147Government National Mortgage Assn. Pool #AF0140 3.50% 20431 234 246Government National Mortgage Assn. Pool #AD4360 3.50% 20431 94 99Government National Mortgage Assn. Pool #AH5882 3.75% 20441 525 574Government National Mortgage Assn. Pool #AH5884 4.25% 20441 1,352 1,516Government National Mortgage Assn. Pool #MA3727 4.00% 20461 340 354Government National Mortgage Assn. Pool #MA5877 4.50% 20491 521 557Government National Mortgage Assn. Pool #MA6092 4.50% 20491 230 246Government National Mortgage Assn. Pool #MA7419 3.00% 20511 3,118 3,275Government National Mortgage Assn. Pool #AO0409 4.589% 20651 185 200Government National Mortgage Assn. Pool #AO0461 4.604% 20651 101 109Government National Mortgage Assn. Pool #AN1825 4.614% 20651 330 355Government National Mortgage Assn. Pool #AO0385 4.512% 20661 732 796Government National Mortgage Assn. Pool #725897 5.20% 20661 2 2UniformMortgage-Backed Security 1.50% 20361,5 500 506UniformMortgage-Backed Security 2.00% 20361,5 38,830 39,996UniformMortgage-Backed Security 2.50% 20361,5 300 313UniformMortgage-Backed Security 2.00% 20511,5 23,844 23,981
American FundsMortgage Fund (continued)

212 American Funds Insurance Series
Bonds, notes & other debt instruments (continued)Principal amount
(000)Value(000)
Mortgage-backed obligations (continued)
Federal agencymortgage-backedobligations(continued)
UniformMortgage-Backed Security 2.50% 20511,5 $ 3,341 $ 3,442UniformMortgage-Backed Security 2.50% 20511,5 131 135UniformMortgage-Backed Security 3.00% 20511,5 6,339 6,598UniformMortgage-Backed Security 3.00% 20511,5 2,704 2,817UniformMortgage-Backed Security 3.50% 20511,5 10,938 11,514UniformMortgage-Backed Security 4.00% 20511,5 77 82UniformMortgage-Backed Security 4.50% 20511,5 2,938 3,164
168,011
Collateralizedmortgage-backedobligations (privatelyoriginated)6.60%
Arroyo Mortgage Trust, Series 2021-1R, Class A1, 1.175% 20481,4,6 868 874Arroyo Mortgage Trust, Series 2018-1, Class A1, 3.763% 20481,4,6 348 349Cascade Funding Mortgage Trust, Series 2020-HB4, Class A, 0.946% 20301,4,6 611 612Cascade Funding Mortgage Trust, Series 2021-HB6, Class A, 0.898% 20361,4,6 1,531 1,533Credit Suisse Mortgage Trust, Series 2017-RPL3, Class A1, 2.00% 20601,4,6 684 695JPMorgan Mortgage Trust, Series 2019-INV3, Class A3, 3.50% 20501,4,6 349 357Mello Warehouse Securitization Trust, Series 2019-2, Class A,
(1-month USD-LIBOR + 0.75%) 0.842% 20521,4,6 750 751Mello Warehouse Securitization Trust, Series 2020-2, Class A,
(1-month USD-LIBOR + 0.80%) 0.892% 20531,4,6 583 584Mello Warehouse Securitization Trust, Series 2020-1, Class A,
(1-month USD-LIBOR + 0.90%) 0.992% 20531,4,6 809 810Mello Warehouse Securitization Trust, Series 2021-2, Class A,
(1-month USD-LIBOR + 0.75%) 0.842% 20551,4,6 1,210 1,211Mortgage Repurchase Agreement Financing Trust, Series 2020-5,
(1-month USD-LIBOR + 1.00%) 1.077% 20231,4,6 750 751MRA Issuance Trust, Series 2021-8, Class A1X,
(1-month USD-LIBOR + 1.15%) 1.26% 20211,4,6 1,625 1,627MRA Issuance Trust, Series 2020-10, Class A,
(1-month USD-LIBOR + 1.70%) 1.786% 20221,4,6 3,375 3,377Nationstar HECM Loan Trust, Series 2019-2A, Class A, 2.272% 20291,4,6 220 220Nationstar HECM Loan Trust, Series 2019-1A, Class A, 2.651% 20291,4,6 266 267NewRezWarehouse Securitization Trust, Series 2021-1, Class A,
(1-month USD-LIBOR + 0.75%) 0.842% 20551,4,6 1,021 1,024Onslow Bay Financial LLC, Series 2020-INV1, Class A5, 3.50% 20491,4,6 192 195Provident Funding MortgageWarehouse Securitization Trust, Series 2021-1, Class A,
(1-month USD-LIBOR + 0.70%) 0.792% 20551,4,6 768 766RMF Proprietary Issuance Trust, Series 2019-1, Class A, 2.75% 20631,4,6 619 618Station Place Securitization Trust, Series 2021-WL1, Class A,
(1-month USD-LIBOR + 0.65%) 0.742% 20541,4,6 3,950 3,956Station Place Securitization Trust, Series 2021-WL2, Class A,
(1-month USD-LIBOR + 0.70%) 0.792% 20541,4,6 375 375Towd Point Mortgage Trust, Series 2016-5, Class A1, 2.50% 20561,4,6 337 343Towd Point Mortgage Trust, Series 2017-5, Class A1, 0.692% 20571,4,6 24 24Towd Point Mortgage Trust, Series 2020-4, Class A1, 1.75% 20601,6 626 634
21,953
Commercialmortgage-backedsecurities0.55%
BX Trust, Series 2021-SOAR, Class A, (1-month USD-LIBOR + 0.67%) 0.77% 20381,4,6 1,174 1,176Extended Stay America Trust, Series 2021-ESH, Class A,
(1-month USD-LIBOR + 1.08%) 1.155% 20381,4,6 370 371MHC Commercial Mortgage Trust, CMO, Series 2021-MHC, Class A,
(1-month USD-LIBOR + 0.801%) 0.951% 20261,4,6 273 274
1,821
Total mortgage-backed obligations 191,785
American FundsMortgage Fund (continued)

American Funds Insurance Series 213
Bonds, notes & other debt instruments (continued)Principal amount
(000)Value(000)
U.S. Treasury bonds & notes 17.63%
U.S. Treasury13.04%
U.S. Treasury 0.125% 2023 $ 650 $ 649U.S. Treasury 0.125% 2023 175 175U.S. Treasury 0.375% 2025 490 481U.S. Treasury 0.375% 2025 200 196U.S. Treasury 0.50% 2026 1,750 1,724U.S. Treasury 0.75% 2026 8,122 8,087U.S. Treasury 0.75% 2026 250 248U.S. Treasury 0.75% 2028 555 540U.S. Treasury 1.125% 2028 2,000 1,994U.S. Treasury 1.25% 2028 6,475 6,501U.S. Treasury 0.625% 2030 1,000 932U.S. Treasury 0.875% 2030 350 333U.S. Treasury 1.125% 2031 2,525 2,451U.S. Treasury 1.375% 2040 380 341U.S. Treasury 1.875% 2041 1,750 1,712U.S. Treasury 1.25% 2050 6,630 5,402U.S. Treasury 1.375% 2050 6,000 5,046U.S. Treasury 1.625% 20503 6,565 5,882U.S. Treasury 2.375% 2051 640 683
43,377
U.S. Treasuryinflation-protectedsecurities4.59%
U.S. Treasury Inflation-Protected Security 0.125% 20237 1,537 1,606U.S. Treasury Inflation-Protected Security 0.375% 20237 1,855 1,974U.S. Treasury Inflation-Protected Security 0.625% 20237 265 280U.S. Treasury Inflation-Protected Security 0.125% 20247 1,129 1,214U.S. Treasury Inflation-Protected Security 0.125% 20247 304 328U.S. Treasury Inflation-Protected Security 0.50% 20247 861 928U.S. Treasury Inflation-Protected Security 0.625% 20247 1,076 1,159U.S. Treasury Inflation-Protected Security 0.125% 20317 3,846 4,235U.S. Treasury Inflation-Protected Security 2.125% 20417 134 202U.S. Treasury Inflation-Protected Security 0.75% 20423,7 1,327 1,609U.S. Treasury Inflation-Protected Security 1.00% 20497 1,300 1,743
15,278
Total U.S. Treasury bonds & notes 58,655
Asset-backed obligations 3.40%
Allegro CLO, Ltd., Series 2016-1A, Class AR2,(3-month USD-LIBOR + 0.95%) 1.12% 20301,4,6 250 250
ARES CLO, Ltd., Series 2017-42A, Class AR,(3-month USD-LIBOR + 0.92%) 1.114% 20281,4,6 250 250
Ballyrock, Ltd., Series 2019-2A, Class A1AR,(3-month USD-LIBOR + 1.00%) 1.155% 20301,4,6 250 250
Bankers Healthcare Group Securitization Trust, Series 2021-A, Class A, 1.42% 20331,6 100 100Carvana Auto Receivables Trust, Series 2021-P1, Class A3, 0.54% 20251 195 195Cent CLO LP, Series 2014-21A, Class AR,
(3-month USD-LIBOR + 0.97%) 1.151% 20301,4,6 250 250CF Hippolyta LLC, Series 2020-1, Class A1, 1.69% 20601,6 539 548CF Hippolyta LLC, Series 2020-1, Class A2, 1.99% 20601,6 104 106CF Hippolyta LLC, Series 2021-1, Class A1, 1.53% 20611,6 842 849Credit Acceptance Auto Loan Trust, Series 2021-3A, Class A, 1.00% 20301,6 275 276Dryden Senior Loan Fund, Series 2014-33A, Class AR3, CLO,
(3-month USD-LIBOR + 1.00%) 1.184% 20291,4,6 250 250Exeter Automobile Receivables Trust, Series 2019-3A, Class C, 2.79% 20241,6 1,000 1,013FirstKey Homes Trust, Series 2020-SFR2, Class A, 1.266% 20371,6 194 193Hertz Vehicle Financing LLC, Series 2021-1A, Class A, 1.21% 20251,6 536 538Hertz Vehicle Financing LLC, Series 2021-2A, Class A, 1.68% 20271,6 285 286Longfellow Place CLO, Ltd., Series 2013-1A, Class AR3,
(3-month USD-LIBOR + 1.00%) 1.184% 20291,4,6 250 250
American FundsMortgage Fund (continued)

214 American Funds Insurance Series
Bonds, notes & other debt instruments (continued)Principal amount
(000)Value(000)
Asset-backed obligations (continued)
Navient Student Loan Trust, Series 2021-A, Class A, 0.84% 20691,6 $ 213 $ 213Navient Student Loan Trust, Series 2021-B, Class A, 0.94% 20691,6 224 224Navient Student Loan Trust, Series 2021-C, Class A, 1.06% 20691,6 457 458Nelnet Student Loan Trust, Series 2021-A, Class APT1, 1.36% 20621,6 547 548Nelnet Student Loan Trust, Series 2021-BA, Class AFX, 1.42% 20621,6 1,550 1,556Newark BSL CLO 2, Ltd., Series 2017-1A, Class A1R,
(3-month USD-LIBOR + 0.97%) 1.146% 20301,4,6 250 250Ondeck Asset Securitization Trust LLC, Series 2021-1A, Class A, 1.59% 20271,6 594 598OSW Structured Asset Trust, Series 2020-RPL1, Class A1, 3.072% 20591,4,6 119 121Palmer Square Loan Funding, CLO, Series 2019-2, Class A1,
(3-month USD-LIBOR + 0.97%) 1.158% 20271,4,6 371 371Palmer Square Loan Funding, CLO, Series 2021-1, Class A1,
(3-month USD-LIBOR + 0.90%) 1.055% 20291,4,6 250 250Race Point CLO, Ltd., Series 2015-9A, Class A1A2,
(3-month USD-LIBOR + 0.94%) 1.181% 20301,4,6 250 250SMB Private Education Loan Trust, Series 2021-A, Class APT2, 1.07% 20531,6 111 109Sound Point CLO, Ltd., Series 2017-2A, Class AR,
(3-month USD-LIBOR + 0.98%) 1.156% 20301,4,6 250 250Sound Point CLO, Ltd., Series 2017-3A, Class A1R,
(3-month USD-LIBOR + 0.98%) 1.182% 20301,4,6 250 250Sound Point CLO, Ltd., Series 2015-1RA, Class AR,
(3-month USD-LIBOR + 1.08%) 1.264% 20301,4,6 250 250
11,302
Bonds & notes of governments & government agencies outside the U.S. 0.26%
Asian Development Bank 1.00% 2026 592 594Canada 0.75% 2026 275 273
867
Federal agency bonds & notes 0.09%
Fannie Mae 0.875% 2030 300 285
Corporate bonds, notes & loans 0.08%
Communicationservices0.08%
SBA Tower Trust 1.631% 20266 253 253
Total bonds, notes & other debt instruments (cost: $262,798,000) 263,147
Short-term securities 53.64%
Weightedaverage yieldat acquisition
Federal agency bills & notes 27.04%
Fannie Mae 8/18/2021 0.005% 7,236 7,235Federal Farm Credit Banks 8/11/2021 0.040 3,000 3,000Federal Farm Credit Banks 10/25/2021 0.030 3,600 3,599Federal Farm Credit Banks 10/27/2021 0.030 4,900 4,899Federal Home Loan Bank 7/7/2021 0.020 6,000 6,000Federal Home Loan Bank 7/9/2021 0.018 4,000 4,000Federal Home Loan Bank 7/28/2021 0.015 4,000 4,000Federal Home Loan Bank 7/30/2021 0.009 6,000 6,000Federal Home Loan Bank 8/11/2021 0.014 15,300 15,299Federal Home Loan Bank 8/13/2021 0.017 12,000 11,999Federal Home Loan Bank 8/18/2021 0.009 8,000 7,999Federal Home Loan Bank 8/27/2021 0.019 5,000 4,999Federal Home Loan Bank 9/2/2021 0.014 5,000 4,999Tennessee Valley Authority 7/21/2021 0.009 5,900 5,900
89,928
American FundsMortgage Fund (continued)

American Funds Insurance Series 215
Short-term securities (continued)
Weightedaverage yieldat acquisition
Principal amount(000)
Value(000)
Commercial paper 25.10%
Amazon.com, Inc. 7/12/20216 0.030% $9,000 $ 9,000Apple Inc. 7/13/20216 0.020 7,000 7,000Apple Inc. 7/14/20216 0.020 2,500 2,500BofA Securities, Inc. 9/17/20216 0.120 4,800 4,799CAFCO, LLC 7/15/20216 0.130 9,000 9,000Canadian Imperial Bank of Commerce 7/1/20216 0.050 6,900 6,900Chariot Funding, LLC 8/13/20216 0.090 9,500 9,499Chevron Corp. 7/13/20216 0.040 7,500 7,500Chevron Corp. 8/23/20216 0.040 2,000 2,000Exxon Asset Management Co. 7/26/2021 0.040 8,600 8,599ExxonMobil Corp. 7/22/2021 0.060 600 600Paccar Financial Corp. 7/6/2021 0.050 1,000 1,000Paccar Financial Corp. 8/26/2021 0.090 5,600 5,599Procter & Gamble Co. 7/12/20216 0.060 9,500 9,500
83,496
U.S. Treasury bills 1.50%
U.S. Treasury 9/28/2021 0.020 5,000 4,999
Total short-term securities (cost: $178,429,000) 178,423
Total investment securities 132.76% (cost: $441,227,000) 441,570
Other assets less liabilities (32.76)% (108,969)
Net assets 100.00% $ 332,601
Futures contracts
Contracts TypeNumber ofcontracts Expiration
Notionalamount8
(000)
Value at6/30/20219
(000)
Unrealized(depreciation)appreciationat 6/30/2021
(000)
5 Year U.S. Treasury Note Futures Long 25 October 2021 $ 2,500 $ 3,086 $ (10)10 Year U.S. Treasury Note Futures Long 73 September 2021 7,300 9,672 2810 Year Ultra U.S. Treasury Note Futures Short 95 September 2021 (9,500) (13,984) (222)20 Year U.S. Treasury Bond Futures Long 4 September 2021 400 643 1730 Year Ultra U.S. Treasury Bond Futures Short 5 September 2021 (500) (964) (38)
$(225)
Swap contracts
Interest rate swaps
Receive PayExpiration
dateNotional
(000)
Value at6/30/2021
(000)
Upfrontpremium
paid(000)
Unrealizedappreciationat 6/30/2021
(000)
3-month USD-LIBOR 0.243% 5/2/2024 $33,400 $ 267 $22 $ 2453-month USD-LIBOR 0.32% 9/23/2025 3,600 75 — 753-month USD-LIBOR 0.81% 7/28/2045 5,700 1,092 16 1,0763-month USD-LIBOR 0.811% 7/27/2050 3,000 676 — 676
$38 $2,072
American FundsMortgage Fund (continued)

216 American Funds Insurance Series
1Principal payments may be made periodically. Therefore, the effective maturity date may be earlier than the stated maturity date.2Amount less than one thousand.3All or a portion of this security was pledged as collateral. The total value of pledged collateral was $1,455,000, which represented .44% of the net assets of thefund.
4Coupon rate may change periodically. Reference rate and spread are as of the most recent information available. Some coupon rates are determined by theissuer or agent based on current market conditions; therefore, the reference rate and spread are not available. For short-term securities, the date of the nextscheduled coupon rate change is considered to be the maturity date.
5Purchased on a TBA basis.6Acquired in a transaction exempt from registration under Rule 144A or Section 4(2) of the Securities Act of 1933. May be resold in the U.S. in transactionsexempt from registration, normally to qualified institutional buyers. The total value of all such securities was $102,832,000, which represented 30.92% of the netassets of the fund.
7Index-linked bond whose principal amount moves with a government price index.8Notional amount is calculated based on the number of contracts and notional contract size.9Value is calculated based on the notional amount and current market price.
Key to abbreviations and symbolCLO = Collateralized Loan ObligationsCMO = Collateralized Mortgage ObligationsLIBOR = London Interbank Offered RateTBA = To-be-announcedUSD/$ = U.S. dollars
See notes to financial statements.
American FundsMortgage Fund (continued)

American Funds Insurance Series 217
Short-term securities 97.65%
Weightedaverage yieldat acquisition
Principal amount(000)
Value(000)
Commercial paper 73.38%
Alberta (Province of) 8/25/20211 0.080% $ 4,000 $ 3,999Amazon.com, Inc. 7/12/20211 0.030 10,000 10,000Australia & New Zealand Banking Group, Ltd. 8/11/20211 0.090 10,000 9,999Bank of Montreal 9/8/2021 0.070 10,000 9,998BNG Bank NV 7/16/20211 0.044 3,500 3,500BNG Bank NV 8/10/20211 0.060 6,690 6,689British Columbia (Province of) 8/16/2021 0.040 9,600 9,599CAFCO, LLC 7/15/20211 0.060 7,500 7,500Caisse d’Amortissement de la Dette Sociale 8/23/2021 0.140 7,000 6,999Chariot Funding, LLC 7/12/20211 0.139 10,000 10,000Chevron Corp. 7/26/20211 0.040 10,000 9,999DBS Bank Ltd. 7/6/20211 0.120 6,300 6,300Denmark (Kingdom of) 7/13/2021 0.030 5,100 5,100Denmark (Kingdom of) 7/16/2021 0.060 5,000 5,000DNB Bank ASA 7/7/20211 0.125 8,000 8,000Export Development Canada 8/3/2021 0.070 9,200 9,199FMSWertmanagement 8/16/20211 0.065 8,000 7,999Hydro-Québec 9/27/20211 0.070 5,500 5,499L’Oréal USA, Inc. 7/12/20211 0.027 10,000 10,000LVMHMoët Hennessy Louis Vuitton Inc. 7/8/20211 0.129 10,000 10,000Nestlé Finance International Ltd. 8/9/20211 0.059 5,000 5,000Novartis Finance Corp. 8/2/20211 0.050 5,000 5,000Novartis Finance Corp. 8/9/20211 0.060 4,500 4,500NRW.Bank 7/21/20211 0.058 10,000 9,999Roche Holdings, Inc. 7/16/20211 0.035 10,000 10,000Starbird Funding Corp. 7/1/20211 0.070 2,000 2,000SumitomoMitsui Banking Corp. 7/19/20211 0.040 9,400 9,400Thunder Bay Funding, LLC 7/8/20211 0.060 10,000 10,000Total Capital Canada Ltd. 8/30/20211 0.080 8,350 8,349Toyota Industries Commercial Finance, Inc. 8/27/20211 0.069 10,000 9,999Toyota Motor Credit Corp. 7/28/2021 0.050 6,500 6,500Unilever Capital Corp. 9/14/20211 0.029 10,000 9,998Victory Receivables Corp. 8/27/20211 0.080 3,300 3,299
249,423
U.S. Treasury bills 15.21%
U.S. Treasury 7/6/2021 0.007 9,800 9,800U.S. Treasury 7/22/2021 0.012 6,900 6,900U.S. Treasury 8/5/2021 0.016 10,000 10,000U.S. Treasury 8/12/2021 0.012 10,000 9,999U.S. Treasury 8/19/2021 0.013 15,000 14,999
51,698
Federal agency bills & notes 9.06%
Fannie Mae 9/1/2021 0.015 5,000 4,999Federal Farm Credit Banks 9/21/2021 0.020 5,100 5,099Federal Home Loan Bank 7/7/2021 0.005 5,000 5,000Federal Home Loan Bank 7/30/2021 0.010 9,400 9,400
Ultra-Short Bond FundInvestment portfolio June 30, 2021 unaudited

218 American Funds Insurance Series
Short-term securities (continued)
Weightedaverage yieldat acquisition
Principal amount(000)
Value(000)
Federal agency bills & notes (continued)
Federal Home Loan Bank 8/11/2021 0.013% $5,000 $ 5,000Federal Home Loan Bank 8/18/2021 0.009 500 500Federal Home Loan Bank 9/1/2021 0.050 800 800
30,798
Total short-term securities (cost: $331,925,000) 331,919
Total investment securities 97.65% (cost: $331,925,000) 331,919
Other assets less liabilities 2.35% 7,978
Net assets 100.00% $339,897
1Acquired in a transaction exempt from registration under Rule 144A or Section 4(2) of the Securities Act of 1933. May be resold in the U.S. in transactionsexempt from registration, normally to qualified institutional buyers. The total value of all such securities was $197,028,000, which represented 57.97% of the netassets of the fund.
See notes to financial statements.
Ultra-Short Bond Fund (continued)

American Funds Insurance Series 219
Bonds, notes & other debt instruments 81.88%Principal amount
(000)Value(000)
U.S. Treasury bonds & notes 51.67%
U.S. Treasury29.50%
U.S. Treasury 2.00% 2021 $ 2,000 $ 2,013U.S. Treasury 1.375% 2022 1,100 1,108U.S. Treasury 1.75% 2022 3,000 3,046U.S. Treasury 2.125% 2023 —1 —1
U.S. Treasury 2.875% 2023 5,000 5,306U.S. Treasury 0.375% 2024 5,000 4,994U.S. Treasury 0.25% 2025 39,515 38,769U.S. Treasury 0.25% 2025 4,000 3,916U.S. Treasury 0.375% 2025 78,000 76,523U.S. Treasury 0.375% 2025 10,000 9,820U.S. Treasury 0.75% 2026 34,375 34,202U.S. Treasury 0.75% 2026 3,943 3,925U.S. Treasury 0.75% 2026 1,250 1,243U.S. Treasury 0.875% 2026 24,450 24,441U.S. Treasury 1.625% 2026 10,000 10,356U.S. Treasury 0.50% 2027 5,314 5,124U.S. Treasury 1.125% 2028 450 449U.S. Treasury 1.25% 2028 22,514 22,604U.S. Treasury 1.25% 2028 3,600 3,606U.S. Treasury 0.625% 2030 1,175 1,095U.S. Treasury 0.875% 2030 36,395 34,606U.S. Treasury 1.125% 2031 57,000 55,332U.S. Treasury 1.625% 2031 10,000 10,156U.S. Treasury 1.125% 2040 9,875 8,487U.S. Treasury 1.125% 2040 7,000 6,038U.S. Treasury 1.875% 2041 7,625 7,458U.S. Treasury 2.50% 2046 5,400 5,841U.S. Treasury 2.50% 2046 3,900 4,219U.S. Treasury 2.875% 2046 2,700 3,128U.S. Treasury 2.25% 2049 2,450 2,533U.S. Treasury 2.375% 2049 13,000 13,816U.S. Treasury 2.875% 2049 26,000 30,389U.S. Treasury 3.00% 20492 4,800 5,735U.S. Treasury 1.25% 2050 35,400 28,845U.S. Treasury 1.375% 2050 56,500 47,521U.S. Treasury 1.625% 20502 72,330 64,811U.S. Treasury 1.875% 2051 21,902 20,860U.S. Treasury 2.375% 2051 4,948 5,281
607,596
U.S. Treasuryinflation-protectedsecurities22.17%
U.S. Treasury Inflation-Protected Security 0.125% 20223 6,252 6,394U.S. Treasury Inflation-Protected Security 0.125% 20233 14,738 15,401U.S. Treasury Inflation-Protected Security 0.375% 20233 18,814 20,017U.S. Treasury Inflation-Protected Security 0.625% 20233 101,393 107,265U.S. Treasury Inflation-Protected Security 0.125% 20243 31,477 33,951U.S. Treasury Inflation-Protected Security 0.125% 20243 6,946 7,471U.S. Treasury Inflation-Protected Security 0.50% 20243 5,130 5,532U.S. Treasury Inflation-Protected Security 0.625% 20243 6,525 7,029U.S. Treasury Inflation-Protected Security 0.125% 20263 89,913 97,906U.S. Treasury Inflation-Protected Security 0.125% 20303 20,722 22,873U.S. Treasury Inflation-Protected Security 0.125% 20303 6,380 7,009U.S. Treasury Inflation-Protected Security 0.125% 20313 76,816 84,580U.S. Treasury Inflation-Protected Security 2.125% 20413 378 568U.S. Treasury Inflation-Protected Security 0.75% 20422,3 9,677 11,729U.S. Treasury Inflation-Protected Security 0.625% 20433 7,083 8,437
U.S.Government Securities Fund(formerly U.S.Government/AAA-Rated Securities Fund)Investment portfolio June 30, 2021 unaudited

220 American Funds Insurance Series
Bonds, notes & other debt instruments (continued)Principal amount
(000)Value(000)
U.S. Treasury bonds & notes (continued)
U.S. Treasuryinflation-protectedsecurities(continued)
U.S. Treasury Inflation-Protected Security 1.00% 20493 $ 4,987 $ 6,686U.S. Treasury Inflation-Protected Security 0.25% 20503 328 370U.S. Treasury Inflation-Protected Security 0.125% 20513 12,161 13,331
456,549
Total U.S. Treasury bonds & notes 1,064,145
Mortgage-backed obligations 17.31%
Federal agencymortgage-backedobligations17.31%
Fannie Mae Pool #257104 6.50% 20284 66 74Fannie Mae Pool #695412 5.00% 20334 1 1Fannie Mae Pool #AD3566 5.00% 20354 8 9Fannie Mae Pool #MA2746 4.00% 20364 2,006 2,186Fannie Mae Pool #MA2588 4.00% 20364 1,042 1,131Fannie Mae Pool #256860 6.50% 20374 17 20Fannie Mae Pool #888698 7.00% 20374 40 47Fannie Mae Pool #256828 7.00% 20374 3 3Fannie Mae Pool #970343 6.00% 20384 15 16Fannie Mae Pool #AC0794 5.00% 20394 34 39Fannie Mae Pool #931768 5.00% 20394 6 7Fannie Mae Pool #932606 5.00% 20404 17 19Fannie Mae Pool #AJ1873 4.00% 20414 28 31Fannie Mae Pool #AI1862 5.00% 20414 527 603Fannie Mae Pool #AI3510 5.00% 20414 329 376Fannie Mae Pool #AJ0704 5.00% 20414 287 328Fannie Mae Pool #AJ5391 5.00% 20414 167 191Fannie Mae Pool #AE1248 5.00% 20414 45 51Fannie Mae Pool #AE1277 5.00% 20414 20 23Fannie Mae Pool #AE1283 5.00% 20414 11 12Fannie Mae Pool #AE1290 5.00% 20424 22 25Fannie Mae Pool #AT7161 3.50% 20434 64 69Fannie Mae Pool #AT3954 3.50% 20434 15 16Fannie Mae Pool #AT0300 3.50% 20434 9 10Fannie Mae Pool #BM6240 2.201% 20444,5 674 713Fannie Mae Pool #AY1829 3.50% 20444 15 16Fannie Mae Pool #AW8240 3.50% 20444 4 4Fannie Mae Pool #BE5017 3.50% 20454 80 86Fannie Mae Pool #BE8740 3.50% 20474 72 78Fannie Mae Pool #BE8742 3.50% 20474 24 26Fannie Mae Pool #BH2848 3.50% 20474 9 10Fannie Mae Pool #BH2847 3.50% 20474 9 10Fannie Mae Pool #BH2846 3.50% 20474 10 10Fannie Mae Pool #BJ5015 4.00% 20474 232 252Fannie Mae Pool #BH3122 4.00% 20474 5 6Fannie Mae Pool #BM3788 3.50% 20484 4,641 5,028Fannie Mae Pool #BJ4901 3.50% 20484 51 55Fannie Mae Pool #BK6840 4.00% 20484 151 164Fannie Mae Pool #BK5232 4.00% 20484 119 129Fannie Mae Pool #BK9743 4.00% 20484 45 49Fannie Mae Pool #CA1909 4.50% 20484 37 40Fannie Mae Pool #BK9761 4.50% 20484 31 34Fannie Mae Pool #CA4151 3.50% 20494 755 824Fannie Mae Pool #FM1062 3.50% 20494 655 713Fannie Mae Pool #FM1443 3.50% 20494 491 527Fannie Mae Pool #BJ8411 3.50% 20494 157 170Fannie Mae Pool #FM2179 3.00% 20504 6,197 6,595Fannie Mae Pool #FM3834 4.50% 20504 1,713 1,839Fannie Mae, Series 2001-4, Class GA, 9.00% 20254,5 —1 —1
Fannie Mae, Series 2001-4, Class NA, 9.005% 20254,5 —1 —1
Fannie Mae, Series 2012-M2, Class A2, Multi Family, 2.717% 20224 358 361
U.S.Government Securities Fund (continued)(formerly U.S.Government/AAA-Rated Securities Fund)

American Funds Insurance Series 221
Bonds, notes & other debt instruments (continued)Principal amount
(000)Value(000)
Mortgage-backed obligations (continued)
Federal agencymortgage-backedobligations(continued)
Fannie Mae, Series 2012-M3, Class 1A2, Multi Family, 3.044% 20224 $ 367 $ 371Fannie Mae, Series 2014-M1, Class A2, Multi Family, 3.185% 20234,5 541 567Fannie Mae, Series 2014-M3, Class A2, Multi Family, 3.501% 20244,5 1,092 1,161Freddie Mac Pool #1H1354 2.446% 20364,5 102 110Freddie Mac Pool #C03518 5.00% 20404 457 519Freddie Mac Pool #G06459 5.00% 20414 1,000 1,146Freddie Mac Pool #841039 2.213% 20434,5 652 692Freddie Mac Pool #Q19133 3.50% 20434 41 45Freddie Mac Pool #Q17696 3.50% 20434 40 43Freddie Mac Pool #Q23190 4.00% 20434 222 245Freddie Mac Pool #Q15874 4.00% 20434 7 7Freddie Mac Pool #Q28558 3.50% 20444 262 282Freddie Mac Pool #760014 2.977% 20454,5 464 485Freddie Mac Pool #Q52069 3.50% 20474 119 129Freddie Mac Pool #Q47615 3.50% 20474 73 79Freddie Mac Pool #Q54701 3.50% 20484 79 85Freddie Mac Pool #Q54709 3.50% 20484 76 82Freddie Mac Pool #Q54782 3.50% 20484 66 72Freddie Mac Pool #Q54700 3.50% 20484 66 71Freddie Mac Pool #Q54781 3.50% 20484 58 63Freddie Mac Pool #Q56590 3.50% 20484 37 40Freddie Mac Pool #Q56589 3.50% 20484 33 36Freddie Mac Pool #Q54699 3.50% 20484 32 35Freddie Mac Pool #Q54698 3.50% 20484 25 27Freddie Mac Pool #Q54831 3.50% 20484 23 25Freddie Mac Pool #G67711 4.00% 20484 2,154 2,359Freddie Mac Pool #Q56599 4.00% 20484 183 200Freddie Mac Pool #Q56175 4.00% 20484 135 147Freddie Mac Pool #Q55971 4.00% 20484 127 139Freddie Mac Pool #Q58411 4.50% 20484 373 412Freddie Mac Pool #Q58436 4.50% 20484 164 182Freddie Mac Pool #Q58378 4.50% 20484 131 142Freddie Mac Pool #Q57242 4.50% 20484 111 121Freddie Mac Pool #ZT0522 4.50% 20484 40 43Freddie Mac Pool #ZS4774 4.50% 20484 37 41Freddie Mac Pool #RA1463 3.50% 20494 528 576Freddie Mac Pool #QA0284 3.50% 20494 305 330Freddie Mac Pool #RA1580 3.50% 20494 271 296Freddie Mac Pool #QA2748 3.50% 20494 75 82Freddie Mac Pool #RA2236 4.50% 20494 531 573Freddie Mac Pool #SD8158 3.50% 20514 519 548Freddie Mac Pool #SD8164 3.50% 20514 388 411Freddie Mac, Series 1567, Class A, (1-month USD-LIBOR + 0.40%) 0.501% 20234,5 5 5Freddie Mac, Series K031, Class A1, Multi Family, 2.778% 20224 144 146Freddie Mac, Series KS01, Class A2, Multi Family, 2.522% 20234 715 730Freddie Mac, Series K029, Class A2, Multi Family, 3.32% 20234 200 209Freddie Mac, Series K035, Class A2, Multi Family, 3.458% 20234,5 2,565 2,715Freddie Mac, Series K034, Class A2, Multi Family, 3.531% 20234 2,745 2,905Freddie Mac, Series K040, Class A2, Multi Family, 3.241% 20244 1,363 1,467Freddie Mac, Series K038, Class A2, Multi Family, 3.389% 20244 4,698 5,028Freddie Mac, Series K063, Class A2, Multi Family, 3.43% 20274 736 822Freddie Mac Seasoned Credit Risk Transfer Trust, Series 2017-2, Class MA,
3.00% 20564 7,234 7,564Freddie Mac Seasoned Credit Risk Transfer Trust, Series 2017-1, Class HA,
3.00% 20564,5 6,650 6,954Freddie Mac Seasoned Credit Risk Transfer Trust, Series 2017-2, Class HA,
3.00% 20564,5 6,544 6,846Freddie Mac Seasoned Credit Risk Transfer Trust, Series 2017-3, Class MT,
3.00% 20564 2,050 2,175
U.S.Government Securities Fund (continued)(formerly U.S.Government/AAA-Rated Securities Fund)
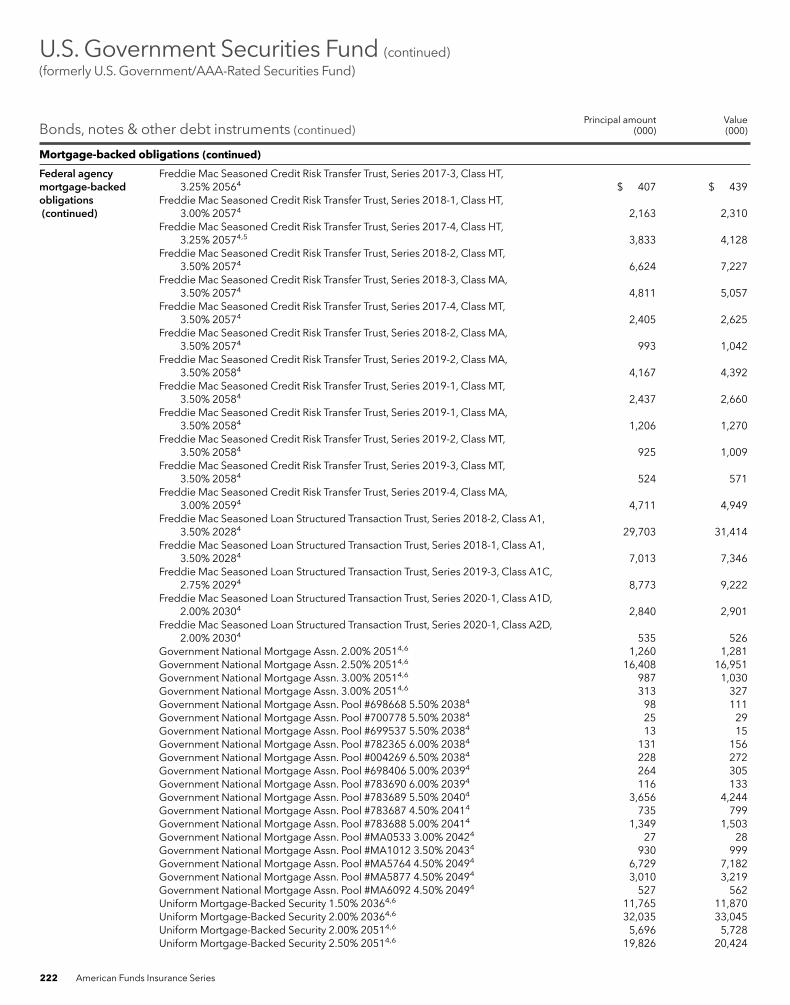
222 American Funds Insurance Series
Bonds, notes & other debt instruments (continued)Principal amount
(000)Value(000)
Mortgage-backed obligations (continued)
Federal agencymortgage-backedobligations(continued)
Freddie Mac Seasoned Credit Risk Transfer Trust, Series 2017-3, Class HT,3.25% 20564 $ 407 $ 439
Freddie Mac Seasoned Credit Risk Transfer Trust, Series 2018-1, Class HT,3.00% 20574 2,163 2,310
Freddie Mac Seasoned Credit Risk Transfer Trust, Series 2017-4, Class HT,3.25% 20574,5 3,833 4,128
Freddie Mac Seasoned Credit Risk Transfer Trust, Series 2018-2, Class MT,3.50% 20574 6,624 7,227
Freddie Mac Seasoned Credit Risk Transfer Trust, Series 2018-3, Class MA,3.50% 20574 4,811 5,057
Freddie Mac Seasoned Credit Risk Transfer Trust, Series 2017-4, Class MT,3.50% 20574 2,405 2,625
Freddie Mac Seasoned Credit Risk Transfer Trust, Series 2018-2, Class MA,3.50% 20574 993 1,042
Freddie Mac Seasoned Credit Risk Transfer Trust, Series 2019-2, Class MA,3.50% 20584 4,167 4,392
Freddie Mac Seasoned Credit Risk Transfer Trust, Series 2019-1, Class MT,3.50% 20584 2,437 2,660
Freddie Mac Seasoned Credit Risk Transfer Trust, Series 2019-1, Class MA,3.50% 20584 1,206 1,270
Freddie Mac Seasoned Credit Risk Transfer Trust, Series 2019-2, Class MT,3.50% 20584 925 1,009
Freddie Mac Seasoned Credit Risk Transfer Trust, Series 2019-3, Class MT,3.50% 20584 524 571
Freddie Mac Seasoned Credit Risk Transfer Trust, Series 2019-4, Class MA,3.00% 20594 4,711 4,949
Freddie Mac Seasoned Loan Structured Transaction Trust, Series 2018-2, Class A1,3.50% 20284 29,703 31,414
Freddie Mac Seasoned Loan Structured Transaction Trust, Series 2018-1, Class A1,3.50% 20284 7,013 7,346
Freddie Mac Seasoned Loan Structured Transaction Trust, Series 2019-3, Class A1C,2.75% 20294 8,773 9,222
Freddie Mac Seasoned Loan Structured Transaction Trust, Series 2020-1, Class A1D,2.00% 20304 2,840 2,901
Freddie Mac Seasoned Loan Structured Transaction Trust, Series 2020-1, Class A2D,2.00% 20304 535 526
Government National Mortgage Assn. 2.00% 20514,6 1,260 1,281Government National Mortgage Assn. 2.50% 20514,6 16,408 16,951Government National Mortgage Assn. 3.00% 20514,6 987 1,030Government National Mortgage Assn. 3.00% 20514,6 313 327Government National Mortgage Assn. Pool #698668 5.50% 20384 98 111Government National Mortgage Assn. Pool #700778 5.50% 20384 25 29Government National Mortgage Assn. Pool #699537 5.50% 20384 13 15Government National Mortgage Assn. Pool #782365 6.00% 20384 131 156Government National Mortgage Assn. Pool #004269 6.50% 20384 228 272Government National Mortgage Assn. Pool #698406 5.00% 20394 264 305Government National Mortgage Assn. Pool #783690 6.00% 20394 116 133Government National Mortgage Assn. Pool #783689 5.50% 20404 3,656 4,244Government National Mortgage Assn. Pool #783687 4.50% 20414 735 799Government National Mortgage Assn. Pool #783688 5.00% 20414 1,349 1,503Government National Mortgage Assn. Pool #MA0533 3.00% 20424 27 28Government National Mortgage Assn. Pool #MA1012 3.50% 20434 930 999Government National Mortgage Assn. Pool #MA5764 4.50% 20494 6,729 7,182Government National Mortgage Assn. Pool #MA5877 4.50% 20494 3,010 3,219Government National Mortgage Assn. Pool #MA6092 4.50% 20494 527 562UniformMortgage-Backed Security 1.50% 20364,6 11,765 11,870UniformMortgage-Backed Security 2.00% 20364,6 32,035 33,045UniformMortgage-Backed Security 2.00% 20514,6 5,696 5,728UniformMortgage-Backed Security 2.50% 20514,6 19,826 20,424
U.S.Government Securities Fund (continued)(formerly U.S.Government/AAA-Rated Securities Fund)

American Funds Insurance Series 223
Bonds, notes & other debt instruments (continued)Principal amount
(000)Value(000)
Mortgage-backed obligations (continued)
Federal agencymortgage-backedobligations(continued)
UniformMortgage-Backed Security 2.50% 20514,6 $ 548 $ 566UniformMortgage-Backed Security 3.00% 20514,6 710 739UniformMortgage-Backed Security 3.00% 20514,6 392 409UniformMortgage-Backed Security 3.50% 20514,6 75,456 79,431UniformMortgage-Backed Security 4.50% 20514,6 2,290 2,466
356,523
Federal agency bonds & notes 12.90%
Export-Import Bank of the United States-Guaranteed,Ethiopian Leasing 2012 LLC 2.646% 2026 439 460
Fannie Mae 1.25% 2021 2,900 2,904Fannie Mae 2.875% 2023 36,000 38,050Fannie Mae 0.625% 2025 10,000 9,990Fannie Mae 0.75% 2027 2,900 2,829Fannie Mae 0.875% 2030 8,600 8,157Fannie Mae 7.125% 2030 2,000 2,925Federal Farm Credit Banks 0.375% 2022 1,500 1,504Federal Home Loan Bank 3.375% 2023 16,715 17,837Federal Home Loan Bank 3.25% 2028 6,500 7,382Federal Home Loan Bank 5.50% 2036 300 442Private Export Funding Corp. 3.266% 20217 34,000 34,379Private Export Funding Corp. 3.55% 2024 3,190 3,436Private Export Funding Corp. 1.40% 2028 3,000 3,002Tennessee Valley Authority 0.75% 2025 1,800 1,802Tennessee Valley Authority 2.875% 2027 5,000 5,482Tennessee Valley Authority 4.65% 2035 1,780 2,346Tennessee Valley Authority 5.88% 2036 875 1,298Tennessee Valley Authority, Series A, 4.625% 2060 250 370TVA Southaven 3.846% 2033 1,057 1,173U.S. Agency for International Development, Iraq (State of) 2.149% 2022 3,370 3,408U.S. Agency for International Development, Jordan (Kingdom of) 2.578% 2022 41,500 42,542U.S. Agency for International Development, Jordan (Kingdom of) 3.00% 2025 14,779 15,928U.S. Agency for International Development, Morocco (Kingdom of) 7.55% 2026 2,489 2,861U.S. Agency for International Development, Tunisia (Kingdom of) 1.416% 2021 1,500 1,506U.S. Agency for International Development, Ukraine 1.471% 2021 2,210 2,223U.S. Department of Housing and Urban Development, Series 2015-A-7, 2.35% 2021 3,750 3,757U.S. Department of Housing and Urban Development, Series 2015-A-8, 2.45% 2022 6,000 6,149U.S. Department of Housing and Urban Development, Series 2015-A-9, 2.80% 2023 1,500 1,577U.S. Department of Housing and Urban Development, Series 2015-A-10, 2.85% 2024 2,250 2,412U.S. Department of Housing and Urban Development, Series 2015-A-11, 2.95% 2025 2,640 2,829U.S. Department of Housing and Urban Development, Series 2015-A-12, 3.10% 2026 2,625 2,819U.S. Department of Housing and Urban Development, Series 2015-A-13, 3.15% 2027 11,482 12,332U.S. Department of Housing and Urban Development, Series 2015-A-14, 3.25% 2028 3,856 4,149U.S. Department of Housing and Urban Development, Series 2015-A-15, 3.35% 2029 2,650 2,858U.S. Department of Housing and Urban Development, Series 2015-A-16, 3.50% 2030 2,482 2,655U.S. Department of Housing and Urban Development, Series 2015-A-17, 3.55% 2031 2,475 2,651U.S. Department of Housing and Urban Development, Series 2015-A-18, 3.60% 2032 2,377 2,549U.S. Department of Housing and Urban Development, Series 2015-A-19, 3.65% 2033 2,059 2,211U.S. Department of Housing and Urban Development, Series 2015-A-20, 3.70% 2034 651 700U.S. Government-Guaranteed Certificates of Participation,
Overseas Private Investment Corp. 3.82% 2032 813 932U.S. Government-Guaranteed Certificates of Participation,
Overseas Private Investment Corp. 3.938% 2032 665 762
265,578
Total bonds, notes & other debt instruments (cost: $1,676,931,000) 1,686,246
U.S.Government Securities Fund (continued)(formerly U.S.Government/AAA-Rated Securities Fund)

224 American Funds Insurance Series
Short-term securities 24.38%
Weightedaverage yieldat acquisition
Principal amount(000)
Value(000)
Commercial paper 16.62%
Amazon.com, Inc. 7/12/20217 0.030% $41,000 $ 41,000Amazon.com, Inc. 7/21/20217 0.050 7,620 7,620Apple Inc. 7/8/20217 0.040 14,300 14,300Apple Inc. 9/2/20217 0.050 22,000 21,999CAFCO, LLC 7/15/20217 0.130 15,000 14,999Canadian Imperial Bank of Commerce 7/1/20217 0.050 10,900 10,900Chariot Funding, LLC 7/2/20217 0.080 25,000 25,000Chariot Funding, LLC 8/13/20217 0.090 15,000 14,999Chariot Funding, LLC 8/16/20217 0.070 10,000 9,999Chevron Corp. 7/6/20217 0.040 15,000 15,000Chevron Corp. 7/16/20217 0.020 19,700 19,699CRC Funding, LLC 7/7/20217 0.140 10,000 10,000CRC Funding, LLC 7/16/20217 0.090 20,700 20,699CRC Funding, LLC 8/5/20217 0.120 15,000 14,999ExxonMobil Corp. 7/22/2021 0.060 16,900 16,899ExxonMobil Corp. 7/27/2021 0.030 15,200 15,199Paccar Financial Corp. 7/7/2021 0.040 19,000 19,000Paccar Financial Corp. 7/20/2021 0.050 20,000 19,999Procter & Gamble Co. 7/15/20217 0.060 30,000 29,999
342,309
Federal agency bills & notes 7.76%
Federal Farm Credit Bank 7/29/2021 0.045 8,400 8,400Federal Farm Credit Bank 8/25/2021 0.088 10,000 9,999Federal Farm Credit Bank 9/8/2021 0.070 10,000 9,998Federal Farm Credit Bank 11/24/2021 0.030 26,200 26,193Federal Home Loan Bank 8/4/2021 0.015 14,800 14,799Federal Home Loan Bank 8/11/2021 0.013 20,000 19,998Federal Home Loan Bank 9/1/2021 0.020 31,200 31,197Federal Home Loan Bank 9/22/2021 0.043 39,100 39,094
159,678
Total short-term securities (cost: $501,997,000) 501,987
Total investment securities 106.26% (cost: $2,178,928,000) 2,188,233
Other assets less liabilities (6.26)% (129,000)
Net assets 100.00% $2,059,233
U.S.Government Securities Fund (continued)(formerly U.S.Government/AAA-Rated Securities Fund)

American Funds Insurance Series 225
Futures contracts
Contracts TypeNumber ofcontracts Expiration
Notionalamount8
(000)
Value at6/30/20219
(000)
Unrealized(depreciation)appreciationat 6/30/2021
(000)
90 Day Euro Dollar Futures Short 252 September 2021 $ (63,000) $ (62,912) $ (26)90 Day Euro Dollar Futures Long 252 June 2022 63,000 62,830 (26)90 Day Euro Dollar Futures Long 1,130 December 2022 282,500 281,031 6290 Day Euro Dollar Futures Long 1,642 June 2023 410,500 407,298 (876)90 Day Euro Dollar Futures Long 595 September 2023 148,750 147,262 (263)90 Day Euro Dollar Futures Short 2,237 December 2024 (559,250) (550,610) (139)2 Year U.S. Treasury Note Futures Short 447 October 2021 (89,400) (98,483) 1845 Year U.S. Treasury Note Futures Short 287 October 2021 (28,700) (35,424) (30)10 Year U.S. Treasury Note Futures Short 201 September 2021 (20,100) (26,633) (60)10 Year Ultra U.S. Treasury Note Futures Short 1,304 September 2021 (130,400) (191,953) (2,843)20 Year U.S. Treasury Bond Futures Long 598 September 2021 59,800 96,129 2,48530 Year Ultra U.S. Treasury Bond Futures Long 4 September 2021 400 771 11
$(1,521)
Swap contracts
Interest rate swaps
Receive PayExpiration
dateNotional
(000)
Value at6/30/2021
(000)
Upfrontpremium
paid (received)(000)
Unrealized(depreciation)appreciationat 6/30/2021
(000)
2.5775% U.S. EFFR 7/16/2022 $181,639 $ 4,573 $ 4,586 $ (13)1.2525% U.S. EFFR 2/14/2023 156,941 2,805 3,206 (401)0.241% U.S. EFFR 3/1/2024 119,400 (368) (132) (236)U.S. EFFR 0.11% 5/18/2024 97,600 647 554 93U.S. EFFR 0.1275% 6/25/2025 20,100 387 376 11U.S. EFFR 0.126% 6/25/2025 20,100 388 377 11U.S. EFFR 0.106% 6/30/2025 22,492 451 445 63-month USD-LIBOR 1.867% 7/11/2025 49,400 (1,289) (1,285) (4)2.91% 3-month USD-LIBOR 2/1/2028 16,000 1,135 980 1552.908% 3-month USD-LIBOR 2/1/2028 16,000 1,134 979 1552.925% 3-month USD-LIBOR 2/1/2028 12,800 917 793 1242.92% 3-month USD-LIBOR 2/2/2028 12,200 871 753 118U.S. EFFR 0.5385% 3/26/2030 49,000 2,474 3,354 (880)0.913% 3-month USD-LIBOR 6/9/2030 31,000 (1,168) (1,736) 568U.S. EFFR 0.666% 11/19/2030 15,500 715 1,035 (320)3-month USD-LIBOR 2.986% 2/1/2038 7,800 (632) (330) (302)3-month USD-LIBOR 2.9625% 2/1/2038 9,800 (774) (396) (378)3-month USD-LIBOR 2.963% 2/1/2038 9,800 (774) (396) (378)0.833% 3-month USD-LIBOR 4/3/2040 15,800 (2,294) (3,008) 7143-month USD-LIBOR 0.81% 7/28/2045 87,600 16,778 21,538 (4,760)2.037% 3-month USD-LIBOR 2/15/2047 60,000 3,747 — 3,7473-month USD-LIBOR 0.811% 7/27/2050 52,500 11,825 15,036 (3,211)
$46,729 $(5,181)
U.S.Government Securities Fund (continued)(formerly U.S.Government/AAA-Rated Securities Fund)

226 American Funds Insurance Series
1Amount less than one thousand.2All or a portion of this security was pledged as collateral. The total value of pledged collateral was $10,170,000, which represented .49% of the net assets of thefund.
3Index-linked bond whose principal amount moves with a government price index.4Principal payments may be made periodically. Therefore, the effective maturity date may be earlier than the stated maturity date.5Coupon rate may change periodically. Reference rate and spread are as of the most recent information available. Some coupon rates are determined by theissuer or agent based on current market conditions; therefore, the reference rate and spread are not available. For short-term securities, the date of the nextscheduled coupon rate change is considered to be the maturity date.
6Purchased on a TBA basis.7Acquired in a transaction exempt from registration under Rule 144A or Section 4(2) of the Securities Act of 1933. May be resold in the U.S. in transactionsexempt from registration, normally to qualified institutional buyers. The total value of all such securities was $305,591,000, which represented 14.84% of the netassets of the fund.
8Notional amount is calculated based on the number of contracts and notional contract size.9Value is calculated based on the notional amount and current market price.
Key to abbreviations and symbolEFFR = Effective Federal Funds RateLIBOR = London Interbank Offered RateTBA = To-be-announcedUSD/$ = U.S. dollars
See notes to financial statements.
U.S.Government Securities Fund (continued)(formerly U.S.Government/AAA-Rated Securities Fund)

American Funds Insurance Series 227
Growth funds 84.84% SharesValue(000)
American Funds Insurance Series – Growth Fund, Class 1 4,290,664 $507,543
Total growth funds (cost: $382,191,000) 507,543
Fixed income funds 9.95%
American Funds Insurance Series – The Bond Fund of America, Class 1 5,264,731 59,544
Total fixed income funds (cost: $62,096,000) 59,544
Short-term securities 4.73%
State Street Institutional U.S. Government Money Market Fund, Premier Class 0.03%1 28,275,940 28,276
Total short-term securities (cost: $28,276,000) 28,276
Options purchased 0.37%
Options purchased* 2,241
Total options purchased (cost: $2,912,000) 2,241
Total investment securities 99.89% (cost: $475,475,000) 597,604
Other assets less liabilities 0.11% 676
Net assets 100.00% $598,280
*Options purchased
Put
DescriptionNumber ofcontracts
Notionalamount
(000)Exercise
priceExpiration
date
Value at6/30/2021
(000)
S&P 500 Index 1,192 $5,123 $2,950.00 12/17/2021 $2,241
Futures contracts
Contracts TypeNumber ofcontracts Expiration
Notionalamount2
(000)
Value at6/30/20213
(000)
Unrealized(depreciation)appreciationat 6/30/2021
(000)
5 Year U.S. Treasury Note Futures Long 285 September 2021 $28,500 $35,178 $(135)S&P 500 E-mini Index Contracts Long 105 September 2021 5 22,515 378
$ 243
Managed Risk Growth FundInvestment portfolio June 30, 2021 unaudited

228 American Funds Insurance Series
Investments in affiliates4
Value ofaffiliates at1/1/2021
(000)Additions
(000)Reductions
(000)
Netrealized
gain (loss)(000)
Netunrealized
depreciation(000)
Value ofaffiliates at6/30/2021
(000)
Dividendincome
(000)
Capital gaindistributions
received(000)
Growth funds 84.84%American Funds Insurance Series –
Growth Fund, Class 1 $452,559 $118,871 $57,898 $24,473 $(30,462) $507,543 $616 $63,763
Fixed income funds 9.95%American Funds Insurance Series –
The Bond Fund of America, Class 15 84,922 26,193 48,237 (72) (3,262) 59,544 134 2,341
Total 94.79% $24,401 $(33,724) $567,087 $750 $66,104
1Rate represents the seven-day yield at 6/30/2021.2Notional amount is calculated based on the number of contracts and notional contract size.3Value is calculated based on the notional amount and current market price.4Part of the same “group of investment companies“ as the fund as defined under the Investment Company Act of 1940, as amended.5This fund changed its name during the reporting period.
See notes to financial statements.
Managed Risk Growth Fund (continued)

American Funds Insurance Series 229
Growth funds 84.83% SharesValue(000)
American Funds Insurance Series – International Fund, Class 1 5,834,650 $144,349
Total growth funds (cost: $105,897,000) 144,349
Fixed income funds 9.95%
American Funds Insurance Series – The Bond Fund of America, Class 1 1,497,332 16,935
Total fixed income funds (cost: $17,676,000) 16,935
Short-term securities 4.72%
State Street Institutional U.S. Government Money Market Fund, Premier Class 0.03%1 8,033,938 8,034
Total short-term securities (cost: $8,034,000) 8,034
Options purchased 0.35%
Options purchased* 600
Total options purchased (cost: $672,000) 600
Total investment securities 99.85% (cost: $132,279,000) 169,918
Other assets less liabilities 0.15% 249
Net assets 100.00% $170,167
*Options purchased
Put
DescriptionNumber ofcontracts
Notionalamount
(000)Exercise
priceExpiration
date
Value at6/30/2021
(000)
MSCI EAFE Index 540 $1,245 $1,750.00 12/17/2021 $578MSCI EAFE Index 14 32 1,675.00 3/18/2022 22
$600
Futures contracts
Contracts TypeNumber ofcontracts Expiration
Notionalamount2
(000)
Value at6/30/20213
(000)
Unrealizeddepreciationat 6/30/2021
(000)
5 Year U.S. Treasury Note Futures Long 71 September 2021 $7,100 $8,764 $ (33)MSCI EAFE Index Contracts Long 64 September 2021 3 7,373 (124)
$(157)
Managed Risk International FundInvestment portfolio June 30, 2021 unaudited

230 American Funds Insurance Series
Investments in affiliates4
Value ofaffiliates at1/1/2021
(000)Additions
(000)Reductions
(000)
Netrealized
gain (loss)(000)
Netunrealized
appreciation(depreciation)
(000)
Value ofaffiliates at6/30/2021
(000)
Dividendincome
(000)
Capital gaindistributions
received(000)
Growth funds 84.83%American Funds Insurance Series –
International Fund, Class 1 $135,744 $14,503 $12,531 $1,813 $4,820 $144,349 $ 83 $ —
Fixed income funds 9.95%American Funds Insurance Series –
The Bond Fund of America, Class 15 25,472 6,486 14,028 (62) (933) 16,935 40 694
Total 94.78% $1,751 $3,887 $161,284 $123 $694
1Rate represents the seven-day yield at 6/30/2021.2Notional amount is calculated based on the number of contracts and notional contract size.3Value is calculated based on the notional amount and current market price.4Part of the same “group of investment companies“ as the fund as defined under the Investment Company Act of 1940, as amended.5This fund changed its name during the reporting period.
See notes to financial statements.
Managed Risk International Fund (continued)

American Funds Insurance Series 231
Growth-and-income funds 84.66% SharesValue(000)
American Funds Insurance Series – Washington Mutual Investors Fund, Class 1 18,694,096 $307,705
Total growth-and-income funds (cost: $219,604,000) 307,705
Fixed income funds 9.97%
American Funds Insurance Series – U.S. Government Securities Fund, Class 1 3,090,558 36,221
Total fixed income funds (cost: $39,885,000) 36,221
Short-term securities 4.74%
State Street Institutional U.S. Government Money Market Fund, Premier Class 0.03%1 17,247,685 17,248
Total short-term securities (cost: $17,248,000) 17,248
Options purchased 0.46%
Options purchased* 1,660
Total options purchased (cost: $2,116,000) 1,660
Total investment securities 99.83% (cost: $278,853,000) 362,834
Other assets less liabilities 0.17% 613
Net assets 100.00% $363,447
*Options purchased
Put
DescriptionNumber ofcontracts
Notionalamount
(000)Exercise
priceExpiration
date
Value at6/30/2021
(000)
S&P 500 Index 794 $3,412 $2,950.00 12/17/2021 $1,493S&P 500 Index 22 95 2,725.00 3/18/2022 55S&P 500 Index 2 8 2,775.00 3/18/2022 6S&P 500 Index 22 95 2,800.00 3/18/2022 62S&P 500 Index 15 64 2,825.00 3/18/2022 44
$1,660
Futures contracts
Contracts TypeNumber ofcontracts Expiration
Notionalamount2
(000)
Value at6/30/20213
(000)
Unrealized(depreciation)appreciationat 6/30/2021
(000)
5 Year U.S. Treasury Note Futures Long 178 September 2021 $17,800 $21,971 $ (83)S&P 500 E-mini Index Contracts Long 80 September 2021 4 17,154 285
$202
Managed RiskWashingtonMutual Investors Fund(formerly Managed Risk Blue Chip Income andGrowth Fund)Investment portfolio June 30, 2021 unaudited

232 American Funds Insurance Series
Investments in affiliates4
Value ofaffiliates at1/1/2021
(000)Additions
(000)Reductions
(000)
Netrealized
gain (loss)(000)
Netunrealized
appreciation(depreciation)
(000)
Value ofaffiliates at6/30/2021
(000)
Dividendincome
(000)
Capital gaindistributions
received(000)
Growth-and-income funds 84.66%American Funds Insurance Series –
Washington Mutual Investors Fund, Class 15 $285,450 $24,564 $42,358 $14,014 $26,035 $307,705 $1,177 $ —
Fixed income funds 9.97%American Funds Insurance Series –
U.S. Government Securities Fund, Class 15 53,565 13,765 27,014 (1,150) (2,945) 36,221 91 3,183
Total 94.63% $12,864 $23,090 $343,926 $1,268 $3,183
1Rate represents the seven-day yield at 6/30/2021.2Notional amount is calculated based on the number of contracts and notional contract size.3Value is calculated based on the notional amount and current market price.4Part of the same “group of investment companies“ as the fund as defined under the Investment Company Act of 1940, as amended.5This fund changed its name during the reporting period.
See notes to financial statements.
Managed RiskWashingtonMutual Investors Fund (continued)(formerly Managed Risk Blue Chip Income andGrowth Fund)

American Funds Insurance Series 233
Growth-and-income funds 79.74% SharesValue(000)
American Funds Insurance Series – Growth-Income Fund, Class 1 33,105,086 $2,067,082
Total growth-and-income funds (cost: $1,530,997,000) 2,067,082
Fixed income funds 14.97%
American Funds Insurance Series – The Bond Fund of America, Class 1 34,295,727 387,885
Total fixed income funds (cost: $398,497,000) 387,885
Short-term securities 4.82%
State Street Institutional U.S. Government Money Market Fund, Premier Class 0.03%1 124,923,405 124,923
Total short-term securities (cost: $124,923,000) 124,923
Options purchased 0.36%
Options purchased* 9,444
Total options purchased (cost: $41,025,000) 9,444
Total investment securities 99.89% (cost: $2,095,442,000) 2,589,334
Other assets less liabilities 0.11% 2,824
Net assets 100.00% $2,592,158
*Options purchased
Put
DescriptionNumber ofcontracts
Notionalamount
(000)Exercise
priceExpiration
date
Value at6/30/2021
(000)
S&P 500 Index 280 $ 1,203 $2,325.00 9/17/2021 $ 48S&P 500 Index 100 430 2,350.00 9/17/2021 18S&P 500 Index 295 1,268 2,375.00 9/17/2021 57S&P 500 Index 655 2,815 2,400.00 9/17/2021 133S&P 500 Index 7,550 32,446 2,425.00 9/17/2021 1,699S&P 500 Index 110 473 2,450.00 9/17/2021 25S&P 500 Index 820 3,524 2,650.00 12/17/2021 984S&P 500 Index 120 516 2,700.00 12/17/2021 150S&P 500 Index 85 365 2,725.00 12/17/2021 113S&P 500 Index 105 451 2,750.00 12/17/2021 145S&P 500 Index 2,895 12,441 2,775.00 12/17/2021 4,169S&P 500 Index 170 731 2,800.00 12/17/2021 254S&P 500 Index 330 1,418 2,825.00 12/17/2021 513S&P 500 Index 403 1,732 2,800.00 3/18/2022 1,136
$9,444
Managed Risk Growth-Income FundInvestment portfolio June 30, 2021 unaudited

234 American Funds Insurance Series
Futures contracts
Contracts TypeNumber ofcontracts Expiration
Notionalamount2
(000)
Value at6/30/20213
(000)
Unrealized(depreciation)appreciationat 6/30/2021
(000)
5 Year U.S. Treasury Note Futures Long 1,300 September 2021 $130,000 $160,459 $ (608)S&P 500 E-mini Index Contracts Long 456 September 2021 23 97,780 1,597
$ 989
Investments in affiliates4
Value ofaffiliates at1/1/2021
(000)Additions
(000)Reductions
(000)
Netrealized
gain(000)
Netunrealized
appreciation(depreciation)
(000)
Value ofaffiliates at6/30/2021
(000)
Dividendincome
(000)
Capital gaindistributions
received(000)
Growth-and-income funds 79.74%American Funds Insurance Series –
Growth-Income Fund, Class 1 $1,938,260 $65,909 $177,886 $40,017 $200,782 $2,067,082 $8,250 $19,790
Fixed income funds 14.97%American Funds Insurance Series –
The Bond Fund of America, Class 15 363,712 92,182 49,454 4,838 (23,393) 387,885 890 15,522
Total 94.71% $44,855 $177,389 $2,454,967 $9,140 $35,312
1Rate represents the seven-day yield at 6/30/2021.2Notional amount is calculated based on the number of contracts and notional contract size.3Value is calculated based on the notional amount and current market price.4Part of the same “group of investment companies“ as the fund as defined under the Investment Company Act of 1940, as amended.5This fund changed its name during the reporting period.
See notes to financial statements.
Managed Risk Growth-Income Fund (continued)

American Funds Insurance Series 235
Asset allocation funds 95.01% SharesValue(000)
American Funds Insurance Series – Asset Allocation Fund, Class 1 96,404,516 $2,715,715
Total asset allocation funds (cost: $2,189,236,000) 2,715,715
Short-term securities 4.93%
State Street Institutional U.S. Government Money Market Fund, Premier Class 0.03%1 140,777,606 140,778
Total short-term securities (cost: $140,778,000) 140,778
Options purchased 0.09%
Options purchased* 2,562
Total options purchased (cost: $3,303,000) 2,562
Total investment securities 100.03% (cost: $2,333,317,000) 2,859,055
Other assets less liabilities (0.03)% (813)
Net assets 100.00% $2,858,242
*Options purchased
Put
DescriptionNumber ofcontracts
Notionalamount
(000)Exercise
priceExpiration
date
Value at6/30/2021
(000)
S&P 500 Index 1,302 $5,596 $2,950.00 12/17/2021 $2,448S&P 500 Index 15 64 2,725.00 3/18/2022 38S&P 500 Index 12 52 2,775.00 3/18/2022 32S&P 500 Index 15 64 2,825.00 3/18/2022 44
$2,562
Futures contracts
Contracts TypeNumber ofcontracts Expiration
Notionalamount2
(000)
Value at6/30/20213
(000)
Unrealized(depreciation)appreciationat 6/30/2021
(000)
5 Year U.S. Treasury Note Futures Long 1,220 September 2021 $122,000 $150,584 $(540)S&P 500 E-mini Index Contracts Long 135 September 2021 7 28,948 419
$(121)
Managed Risk Asset Allocation FundInvestment portfolio June 30, 2021 unaudited

236 American Funds Insurance Series
Investments in affiliates4
Value ofaffiliate at1/1/2021
(000)Additions
(000)Reductions
(000)
Netrealized
gain(000)
Netunrealized
appreciation(000)
Value ofaffiliate at6/30/2021
(000)
Dividendincome
(000)
Capital gaindistributions
received(000)
Asset allocation funds 95.01%American Funds Insurance Series –
Asset Allocation Fund, Class 1 $2,646,718 $98,352 $193,490 $41,561 $122,574 $2,715,715 $8,944 $88,212
1Rate represents the seven-day yield at 6/30/2021.2Notional amount is calculated based on the number of contracts and notional contract size.3Value is calculated based on the notional amount and current market price.4Part of the same “group of investment companies“ as the fund as defined under the Investment Company Act of 1940, as amended.
See notes to financial statements.
Managed Risk Asset Allocation Fund (continued)

American Funds Insurance Series 237
GlobalGrowthFund
GlobalSmall
CapitalizationFund
GrowthFund
InternationalFund
NewWorldFund
Assets:Investment securities, at value:
Unaffiliated issuers $8,895,619 $4,960,276 $41,262,079 $ 9,748,298 $4,396,448Affiliated issuers 504,642 333,622 1,103,552 252,974 236,727
Cash 123 13,908 354 3,019 1,206Cash collateral received for securities on loan 4,460 8,327 3,969 1,828 318Cash collateral pledged for futures contracts — — — — 112Cash collateral pledged for swap contracts — — — — —Cash denominated in currencies other than U.S. dollars 4,563 98 687 14,683 3,956Unrealized appreciation on open forward currency contracts — — — — 69Receivables for:
Sales of investments 344 17,309 187,913 97,609 14,974Sales of fund’s shares 3,189 1,712 28,220 2,884 1,976Dividends and interest 8,664 2,798 19,743 24,651 7,441Variation margin on futures contracts — — — — 42Variation margin on swap contracts — — — — —Securities lending income 2 3 3 —1 3Other 386 82 — 28 1,925
9,421,992 5,338,135 42,606,520 10,145,974 4,665,197
Liabilities:Collateral for securities on loan 44,595 83,273 39,687 18,284 3,178Unrealized depreciation on open forward currency contracts — — — — —Payables for:
Purchases of investments 4,361 14,122 76,572 46,401 13,501Repurchases of fund’s shares 16,253 4,604 57,063 4,566 4,299Investment advisory services 3,777 3,098 10,486 4,224 1,869Insurance administrative fees 388 195 1,694 281 550Services provided by related parties 1,285 754 5,921 1,282 531Trustees’ deferred compensation 92 61 528 195 44Variation margin on futures contracts — — — — 40Variation margin on swap contracts — — — — —Non-U.S. taxes 7,095 11,498 839 25,097 14,346Other 172 118 117 282 163
78,018 117,723 192,907 100,612 38,521
Net assets at June 30, 2021 $9,343,974 $5,220,412 $42,413,613 $10,045,362 $4,626,676
Net assets consist of:Capital paid in on shares of beneficial interest $4,074,402 $2,319,016 $16,552,880 $ 5,997,616 $2,586,482Total distributable earnings (accumulated loss) 5,269,572 2,901,396 25,860,733 4,047,746 2,040,194
Net assets at June 30, 2021 $9,343,974 $5,220,412 $42,413,613 $10,045,362 $4,626,676
Investment securities on loan, at value $ 43,575 $ 83,042 $ 38,885 $ 18,837 $ 11,836Investment securities, at cost
Unaffiliated issuers 4,176,011 2,750,849 18,333,078 6,587,890 2,580,869Affiliated issuers 504,674 262,226 1,103,548 252,950 236,741
Cash denominated in currencies other than U.S. dollars, at cost 4,565 98 692 14,689 3,956
See end of statements of assets and liabilities for footnotes.
See notes to financial statements.
Financial statementsunaudited
Statements of assets and liabilities at June 30, 2021 (dollars in thousands)

238 American Funds Insurance Series
WashingtonMutualInvestorsFund2
CapitalWorld Growthand Income
Fund3
Growth-IncomeFund
InternationalGrowth
and IncomeFund
CapitalIncomeBuilder
Assets:Investment securities, at value:
Unaffiliated issuers $ 9,884,190 $2,277,366 $40,097,132 $1,290,076 $ 971,950Affiliated issuers 336,297 93,430 1,013,334 68,058 79,339
Cash 750 190 524 92 332Cash collateral received for securities on loan 7,518 1,294 7,720 71 65Cash collateral pledged for futures contracts — — — — —Cash collateral pledged for swap contracts — — — — —Cash denominated in currencies other than U.S. dollars — 877 2,690 9,817 452Unrealized appreciation on open forward currency contracts — — — — —Receivables for:
Sales of investments 26,632 9,441 25,093 5,331 17,665Sales of fund’s shares 2,888 1,208 16,210 743 861Dividends and interest 5,025 4,783 49,728 4,112 3,403Variation margin on futures contracts — — — — 91Variation margin on swap contracts — — — — 1Securities lending income 1 —1 1 —1 —1
Other — 354 236 141 6
10,263,301 2,388,943 41,212,668 1,378,441 1,074,165
Liabilities:Collateral for securities on loan 75,183 12,943 77,195 705 651Unrealized depreciation on open forward currency contracts — — — — 1Payables for:
Purchases of investments 31,318 14,185 102,847 31,734 33,840Repurchases of fund’s shares 5,411 1,459 38,586 352 92Investment advisory services 1,923 683 8,494 737 194Insurance administrative fees 619 122 1,015 76 323Services provided by related parties 1,118 381 4,430 107 133Trustees’ deferred compensation 109 27 591 15 8Variation margin on futures contracts — — — — 16Variation margin on swap contracts — — — — 41Non-U.S. taxes 31 918 2,451 214 255Other 5 48 112 48 14
115,717 30,766 235,721 33,988 35,568
Net assets at June 30, 2021 $10,147,584 $2,358,177 $40,976,947 $1,344,453 $1,038,597
Net assets consist of:Capital paid in on shares of beneficial interest $ 5,974,377 $1,399,293 $21,221,552 $ 937,123 $ 849,707Total distributable earnings (accumulated loss) 4,173,207 958,884 19,755,395 407,330 188,890
Net assets at June 30, 2021 $10,147,584 $2,358,177 $40,976,947 $1,344,453 $1,038,597
Investment securities on loan, at value $ 73,663 $ 12,432 $ 75,628 $ 671 $ 638Investment securities, at cost
Unaffiliated issuers 7,972,415 1,730,831 22,469,677 907,740 762,420Affiliated issuers 336,286 93,438 1,013,237 68,054 79,283
Cash denominated in currencies other than U.S. dollars, at cost — 877 2,720 9,817 452
See end of statements of assets and liabilities for footnotes.
See notes to financial statements.
Financial statements (continued)unaudited
Statements of assets and liabilities at June 30, 2021 (continued) (dollars in thousands)

American Funds Insurance Series 239
AssetAllocation
Fund
GlobalBalancedFund
The BondFund
of America4
CapitalWorld Bond
Fund
AmericanHigh-Income
Trust5
Assets:Investment securities, at value:
Unaffiliated issuers $29,349,292 $426,243 $12,682,238 $2,021,240 $1,002,182Affiliated issuers 4,285,077 29,578 1,153,143 123,872 62,665
Cash 38,682 87 10,546 617 2,882Cash collateral received for securities on loan 2,605 — — — —Cash collateral pledged for futures contracts — — — — 427Cash collateral pledged for swap contracts — — — — 2,307Cash denominated in currencies other than U.S. dollars 4,561 141 1 15 —1
Unrealized appreciation on open forward currency contracts — 193 97 2,433 —Receivables for:
Sales of investments 1,943,892 482 5,403,388 18,879 5,527Sales of fund’s shares 9,329 663 4,649 1,002 260Dividends and interest 66,417 1,334 59,408 15,768 13,744Variation margin on futures contracts 26 8 3,313 398 6Variation margin on swap contracts — 13 9 228 —Securities lending income 2 — — — —Other 47 26 58 — 2
35,699,930 458,768 19,316,850 2,184,452 1,090,002
Liabilities:Collateral for securities on loan 26,046 — — — —Unrealized depreciation on open forward currency contracts — 217 8 8,434 —Payables for:
Purchases of investments 3,293,480 1,332 6,232,252 36,872 14,908Repurchases of fund’s shares 16,294 46 6,769 792 492Investment advisory services 6,899 247 1,701 763 232Insurance administrative fees 3,507 76 494 38 54Services provided by related parties 3,093 79 1,250 285 185Trustees’ deferred compensation 338 4 140 29 37Variation margin on futures contracts 1,726 15 4,787 233 78Variation margin on swap contracts 24 6 1,718 94 10Non-U.S. taxes 2,534 52 13 137 —Other 48 10 8 141 1
3,353,989 2,084 6,249,140 47,818 15,997
Net assets at June 30, 2021 $32,345,941 $456,684 $13,067,710 $2,136,634 $1,074,005
Net assets consist of:Capital paid in on shares of beneficial interest $20,925,529 $330,831 $12,593,395 $2,046,885 $1,267,142Total distributable earnings (accumulated loss) 11,420,412 125,853 474,315 89,749 (193,137)
Net assets at June 30, 2021 $32,345,941 $456,684 $13,067,710 $2,136,634 $1,074,005
Investment securities on loan, at value $ 25,453 $ — $ — $ — $ —Investment securities, at cost
Unaffiliated issuers 19,214,052 319,695 12,255,833 1,956,299 949,532Affiliated issuers 4,199,221 29,578 1,153,188 123,882 62,664
Cash denominated in currencies other than U.S. dollars, at cost 4,566 144 1 62 —1
See end of statements of assets and liabilities for footnotes.
See notes to financial statements.
Financial statements (continued)unaudited
Statements of assets and liabilities at June 30, 2021 (continued) (dollars in thousands)

240 American Funds Insurance Series
AmericanFunds
MortgageFund
Ultra-ShortBond Fund
U.S.GovernmentSecuritiesFund6
ManagedRisk
GrowthFund
ManagedRisk
InternationalFund
Assets:Investment securities, at value:
Unaffiliated issuers $441,570 $331,919 $2,188,233 $ 30,517 $ 8,634Affiliated issuers — — — 567,087 161,284
Cash 9,152 9,063 56,176 — —Cash collateral received for securities on loan — — — — —Cash collateral pledged for futures contracts — — — 1,197 456Cash collateral pledged for swap contracts — — — — —Cash denominated in currencies other than U.S. dollars — — — — —Unrealized appreciation on open forward currency contracts — — — — —Receivables for:
Sales of investments 149,961 — 260,522 862 201Sales of fund’s shares 446 323 2,741 2 —Dividends and interest 448 —1 4,476 1 —1
Variation margin on futures contracts 21 — 487 52 5Variation margin on swap contracts —1 — 858 — —Securities lending income — — — — —Other — — — — —
601,598 341,305 2,513,493 599,718 170,580
Liabilities:Collateral for securities on loan — — — — —Unrealized depreciation on open forward currency contracts — — — — —Payables for:
Purchases of investments 268,623 — 448,216 — —Repurchases of fund’s shares 129 1,209 2,749 909 212Investment advisory services 58 90 332 48 14Insurance administrative fees 26 25 153 361 104Services provided by related parties 28 71 395 116 34Trustees’ deferred compensation 4 13 50 4 1Variation margin on futures contracts 52 — 884 — 48Variation margin on swap contracts 77 — 1,480 — —Non-U.S. taxes — — — — —Other —1 —1 1 — —
268,997 1,408 454,260 1,438 413
Net assets at June 30, 2021 $332,601 $339,897 $2,059,233 $598,280 $170,167
Net assets consist of:Capital paid in on shares of beneficial interest $328,732 $340,832 $2,031,152 $403,947 $152,582Total distributable earnings (accumulated loss) 3,869 (935) 28,081 194,333 17,585
Net assets at June 30, 2021 $332,601 $339,897 $2,059,233 $598,280 $170,167
Investment securities on loan, at value $ — $ — $ — $ — $ —Investment securities, at cost
Unaffiliated issuers 441,227 331,925 2,178,928 31,188 8,706Affiliated issuers — — — 444,287 123,573
Cash denominated in currencies other than U.S. dollars, at cost — — — — —
See end of statements of assets and liabilities for footnotes.
See notes to financial statements.
Financial statements (continued)unaudited
Statements of assets and liabilities at June 30, 2021 (continued) (dollars in thousands)

American Funds Insurance Series 241
Managed RiskWashington
MutualInvestorsFund7
ManagedRisk
Growth-IncomeFund
ManagedRiskAsset
AllocationFund
Assets:Investment securities, at value:
Unaffiliated issuers $ 18,908 $ 134,367 $ 143,340Affiliated issuers 343,926 2,454,967 2,715,715
Cash — — —Cash collateral received for securities on loan — — —Cash collateral pledged for futures contracts 906 5,208 1,756Cash collateral pledged for swap contracts — — —Cash denominated in currencies other than U.S. dollars — — —Unrealized appreciation on open forward currency contracts — — —Receivables for:
Sales of investments 3 14,049 1,491Sales of fund’s shares 17 — 640Dividends and interest —1 3 4Variation margin on futures contracts 38 232 121Variation margin on swap contracts — — —Securities lending income — — —Other — — —
363,798 2,608,826 2,863,067
Liabilities:Collateral for securities on loan — — —Unrealized depreciation on open forward currency contracts — — —Payables for:
Purchases of investments 14 — —Repurchases of fund’s shares 5 14,788 2,209Investment advisory services 30 212 233Insurance administrative fees 226 1,586 1,773Services provided by related parties 73 67 578Trustees’ deferred compensation 3 15 32Variation margin on futures contracts — — —Variation margin on swap contracts — — —Non-U.S. taxes — — —Other — — —
351 16,668 4,825
Net assets at June 30, 2021 $363,447 $2,592,158 $2,858,242
Net assets consist of:Capital paid in on shares of beneficial interest $338,335 $2,057,069 $2,274,025Total distributable earnings (accumulated loss) 25,112 535,089 584,217
Net assets at June 30, 2021 $363,447 $2,592,158 $2,858,242
Investment securities on loan, at value $ — $ — $ —Investment securities, at cost
Unaffiliated issuers 19,364 165,948 144,081Affiliated issuers 259,489 1,929,494 2,189,236
Cash denominated in currencies other than U.S. dollars, at cost — — —
See end of statements of assets and liabilities for footnotes.
See notes to financial statements.
Financial statements (continued)unaudited
Statements of assets and liabilities at June 30, 2021 (continued) (dollars in thousands)

242 American Funds Insurance Series
GlobalGrowthFund
GlobalSmall
CapitalizationFund
GrowthFund
InternationalFund
NewWorldFund
Shares of beneficial interest issued and outstanding(no stated par value) — unlimited shares authorized
Class 1: Net assets $4,079,893 $2,164,517 $17,534,944 $5,059,677 $2,541,836Shares outstanding 93,450 61,129 148,235 204,492 75,559Net asset value per share $43.66 $35.41 $118.29 $24.74 $33.64
Class 1A: Net assets $13,709 $1,833 $79,269 $10,496 $8,906Shares outstanding 315 52 675 426 266Net asset value per share $43.46 $35.20 $117.45 $24.63 $33.44
Class 2: Net assets $4,602,553 $2,720,445 $21,673,055 $4,492,188 $1,162,944Shares outstanding 106,726 79,611 185,235 182,486 34,991Net asset value per share $43.12 $34.17 $117.00 $24.62 $33.24
Class 3: Net assets $297,978 $23,859Shares outstanding Not applicable Not applicable 2,499 963 Not applicableNet asset value per share $119.24 $24.79
Class 4: Net assets $647,819 $333,617 $2,828,367 $459,142 $912,990Shares outstanding 15,142 9,742 24,660 18,904 27,690Net asset value per share $42.78 $34.25 $114.69 $24.29 $32.97
WashingtonMutualInvestorsFund2
CapitalWorld Growthand Income
Fund3
Growth-IncomeFund
InternationalGrowth
and IncomeFund
CapitalIncomeBuilder
Shares of beneficial interest issued and outstanding(no stated par value) — unlimited shares authorized
Class 1: Net assets $5,803,337 $784,485 $24,114,355 $995,323 $498,822Shares outstanding 352,479 43,794 386,212 49,010 42,222Net asset value per share $16.46 $17.91 $62.44 $20.31 $11.81
Class 1A: Net assets $111,040 $3,386 $19,837 $4,233 $7,269Shares outstanding 6,789 190 319 209 616Net asset value per share $16.36 $17.84 $62.12 $20.25 $11.80
Class 2: Net assets $3,282,627 $1,367,883 $14,983,396 $222,223 $10,977Shares outstanding 202,351 76,601 243,418 10,989 930Net asset value per share $16.22 $17.86 $61.55 $20.22 $11.81
Class 3: Net assets $164,918Shares outstanding Not applicable Not applicable 2,638 Not applicable Not applicableNet asset value per share $62.52
Class 4: Net assets $950,580 $202,423 $1,694,441 $122,674 $521,529Shares outstanding 59,029 11,549 27,900 6,114 44,235Net asset value per share $16.10 $17.53 $60.73 $20.06 $11.79
See end of statements of assets and liabilities for footnotes.
See notes to financial statements.
Financial statements (continued)unaudited
Statements of assets and liabilities at June 30, 2021 (continued) (dollars and shares in thousands, except per-share amounts)

American Funds Insurance Series 243
AssetAllocation
Fund
GlobalBalancedFund
The BondFund
of America4
CapitalWorld Bond
Fund
AmericanHigh-Income
Trust5
Shares of beneficial interest issued and outstanding(no stated par value) — unlimited shares authorized
Class 1: Net assets $20,941,388 $116,462 $8,408,164 $1,015,735 $275,738Shares outstanding 743,361 7,780 743,713 83,563 26,590Net asset value per share $28.17 $14.97 $11.31 $12.16 $10.37
Class 1A: Net assets $16,825 $3,495 $11,027 $693 $1,163Shares outstanding 599 234 981 57 113Net asset value per share $28.06 $14.92 $11.25 $12.12 $10.34
Class 2: Net assets $5,495,854 $211,748 $3,829,022 $1,060,430 $690,291Shares outstanding 197,529 14,191 343,764 88,027 67,965Net asset value per share $27.82 $14.92 $11.14 $12.05 $10.16
Class 3: Net assets $35,564 $10,455Shares outstanding 1,262 Not applicable Not applicable Not applicable 1,004Net asset value per share $28.19 $10.41
Class 4: Net assets $5,856,310 $124,979 $819,497 $59,776 $96,358Shares outstanding 211,902 8,473 73,884 5,019 8,654Net asset value per share $27.64 $14.75 $11.09 $11.91 $11.13
Class P1: Net assetsShares outstanding Not applicable Not applicable Not applicable Not applicable Not applicableNet asset value per share
Class P2: Net assetsShares outstanding Not applicable Not applicable Not applicable Not applicable Not applicableNet asset value per share
AmericanFunds
MortgageFund
Ultra-ShortBond Fund
U.S.GovernmentSecuritiesFund6
ManagedRisk
GrowthFund
ManagedRisk
InternationalFund
Shares of beneficial interest issued and outstanding(no stated par value) — unlimited shares authorized
Class 1: Net assets $231,174 $36,883 $374,034Shares outstanding 21,682 3,267 31,922 Not applicable Not applicableNet asset value per share $10.66 $11.29 $11.72
Class 1A: Net assets $1,457 $10 $4,436Shares outstanding 137 1 380 Not applicable Not applicableNet asset value per share $10.63 $11.29 $11.67
Class 2: Net assets $58,759 $256,254 $1,433,933Shares outstanding 5,527 23,377 123,992 Not applicable Not applicableNet asset value per share $10.63 $10.96 $11.56
Class 3: Net assets $4,312 $9,420Shares outstanding Not applicable 389 803 Not applicable Not applicableNet asset value per share $11.09 $11.74
Class 4: Net assets $41,211 $42,438 $237,410Shares outstanding 3,922 3,843 20,566 Not applicable Not applicableNet asset value per share $10.51 $11.04 $11.54
Class P1: Net assets $10,579 $1,651Shares outstanding Not applicable Not applicable Not applicable 597 146Net asset value per share $17.72 $11.28
Class P2: Net assets $587,701 $168,516Shares outstanding Not applicable Not applicable Not applicable 33,400 15,018Net asset value per share $17.60 $11.22
See end of statements of assets and liabilities for footnotes.
See notes to financial statements.
Financial statements (continued)unaudited
Statements of assets and liabilities at June 30, 2021 (continued) (dollars and shares in thousands, except per-share amounts)

244 American Funds Insurance Series
Managed RiskWashington
MutualInvestorsFund7
ManagedRisk
Growth-IncomeFund
ManagedRiskAsset
AllocationFund
Shares of beneficial interest issued and outstanding(no stated par value) — unlimited shares authorized
Class P1: Net assets $1,972 $2,259,186 $6,272Shares outstanding 163 151,614 423Net asset value per share $12.11 $14.90 $14.83
Class P2: Net assets $361,475 $332,972 $2,851,970Shares outstanding 30,027 22,485 197,696Net asset value per share $12.04 $14.81 $14.43
1Amount less than one thousand.2Formerly Blue Chip Income and Growth Fund.3Formerly Global Growth and Income Fund.4Formerly Bond Fund.5Formerly High-Income Bond Fund.6Formerly U.S. Government/AAA-Rated Securities Fund.7Formerly Managed Risk Blue Chip Income and Growth Fund.
See notes to financial statements.
Financial statements (continued)unaudited
Statements of assets and liabilities at June 30, 2021 (continued) (dollars and shares in thousands, except per-share amounts)

American Funds Insurance Series 245
GlobalGrowthFund
GlobalSmall
CapitalizationFund
GrowthFund
InternationalFund
NewWorldFund
Investment income:Income (net of non-U.S. taxes1):
Dividends:Unaffiliated issuers $ 46,323 $ 15,804 $ 147,085 $ 89,313 $ 27,447Affiliated issuers 103 68 479 191 115
46,426 15,872 147,564 89,504 27,562Interest from unaffiliated issuers 78 9 778 16 3,147Securities lending income (net of fees) 227 556 447 406 161
46,731 16,437 148,789 89,926 30,870
Fees and expenses1:Investment advisory services 21,602 18,620 61,671 25,506 14,847Distribution services 6,318 3,717 29,410 6,093 2,460Insurance administrative services 747 377 3,268 552 1,082Transfer agent services 1 —2 3 1 —2Administrative services 1,297 816 5,997 1,563 657Accounting and administrative services — — — — —Reports to shareholders 168 111 776 212 83Registration statement and prospectus 68 98 413 74 33Trustees’ compensation 24 15 108 28 12Auditing and legal 11 21 19 21 23Custodian 574 386 350 997 590Other 3 40 16 4 31
Total fees and expenses before waivers/reimbursements 30,813 24,201 102,031 35,051 19,818Less waivers/reimbursements of fees and expenses:
Investment advisory services waivers 28 — — — 3,938Miscellaneous fee reimbursements — — — — —
Total waivers/reimbursements of fees and expenses 28 — — — 3,938
Total fees and expenses after waivers/reimbursements 30,785 24,201 102,031 35,051 15,880
Net investment income (loss) 15,946 (7,764) 46,758 54,875 14,990
Net realized gain (loss) and unrealized appreciation(depreciation):
Net realized gain (loss) on:Investments in:
Unaffiliated issuers 563,132 639,973 2,916,751 1,014,070 239,418Affiliated issuers (1) (362) (13) (14) (5)
Futures contracts — — — — (101)Forward currency contracts — — — (86) (8)Swap contracts — — — — —Currency transactions (213) (220) 159 208 (130)
Capital gain distributions received from affiliated issuers — — — — —
562,918 639,391 2,916,897 1,014,178 239,174
Net unrealized appreciation (depreciation) on:Investments in:
Unaffiliated issuers 383,762 (109,339) 1,965,008 (577,554) 174,007Affiliated issuers (48) 38,290 (103) (40) (22)
Futures contracts — — — — —Forward currency contracts — — — 86 123Swap contracts — — — — —Currency translations (198) 152 (146) (137) 112
383,516 (70,897) 1,964,759 (577,645) 174,220
Net realized gain (loss) and unrealized appreciation(depreciation) 946,434 568,494 4,881,656 436,533 413,394
Net increase (decrease) in net assets resulting from operations $962,380 $ 560,730 $4,928,414 $ 491,408 $428,384
See end of statements of operations for footnotes.
See notes to financial statements.
Financial statements (continued)unaudited
Statements of operations for the six months ended June 30, 2021 (dollars in thousands)

246 American Funds Insurance Series
WashingtonMutualInvestorsFund3
CapitalWorld Growthand Income
Fund4
Growth-IncomeFund
InternationalGrowth
and IncomeFund
CapitalIncomeBuilder
Investment income:Income (net of non-U.S. taxes1):
Dividends:Unaffiliated issuers $ 102,509 $ 23,856 $ 314,140 $ 21,845 $ 18,312Affiliated issuers 70 26 486 19 29
102,579 23,882 314,626 21,864 18,341Interest from unaffiliated issuers 112 1,089 1,295 364 1,837Securities lending income (net of fees) 47 143 667 53 22
102,738 25,114 316,588 22,281 20,200
Fees and expenses1:Investment advisory services 19,522 6,514 49,891 4,396 2,654Distribution services 5,120 1,921 20,124 420 627Insurance administrative services 1,158 233 1,940 149 624Transfer agent services 1 —2 3 —2 —2Administrative services 1,520 334 5,989 218 169Accounting and administrative services — — — — —Reports to shareholders 152 22 774 18 17Registration statement and prospectus 57 19 357 16 52Trustees’ compensation 27 6 108 4 3Auditing and legal 4 4 20 14 6Custodian 101 148 370 164 53Other 4 1 16 1 4
Total fees and expenses before waivers/reimbursements 27,666 9,202 79,592 5,400 4,209Less waivers/reimbursements of fees and expenses:
Investment advisory services waivers 2,805 889 — — 1,444Miscellaneous fee reimbursements — — — — —
Total waivers/reimbursements of fees and expenses 2,805 889 — — 1,444
Total fees and expenses after waivers/reimbursements 24,861 8,313 79,592 5,400 2,765
Net investment income (loss) 77,877 16,801 236,996 16,881 17,435
Net realized gain (loss) and unrealized appreciation(depreciation):
Net realized gain (loss) on:Investments in:
Unaffiliated issuers 2,259,134 397,491 1,974,111 89,542 35,636Affiliated issuers (8) 4 (52) (6) (1)
Futures contracts — — — — (1,194)Forward currency contracts — — — — (17)Swap contracts — — — — 610Currency transactions 15 313 (582) (701) 10
Capital gain distributions received from affiliated issuers — — — — —
2,259,141 397,808 1,973,477 88,835 35,044
Net unrealized appreciation (depreciation) on:Investments in:
Unaffiliated issuers (922,293) (201,956) 3,136,371 (4,122) 54,047Affiliated issuers (23) (16) (108) (3) 55
Futures contracts — — — — 524Forward currency contracts — — — — 21Swap contracts — — — — 485Currency translations (5) (77) (470) (44) (62)
(922,321) (202,049) 3,135,793 (4,169) 55,070
Net realized gain (loss) and unrealized appreciation(depreciation) 1,336,820 195,759 5,109,270 84,666 90,114
Net increase (decrease) in net assets resulting from operations $1,414,697 $ 212,560 $5,346,266 $101,547 $107,549
See end of statements of operations for footnotes.
See notes to financial statements.
Financial statements (continued)unaudited
Statements of operations for the six months ended June 30, 2021 (continued) (dollars in thousands)

American Funds Insurance Series 247
AssetAllocation
Fund
GlobalBalancedFund
The BondFund
of America5
CapitalWorld Bond
Fund
AmericanHigh-Income
Trust6
Investment income:Income (net of non-U.S. taxes1):
Dividends:Unaffiliated issuers $ 195,198 $ 3,376 $ — $ 6 $ 586Affiliated issuers 4,051 12 990 81 12
199,249 3,388 990 87 598Interest from unaffiliated issuers 102,778 1,182 115,888 27,841 24,819Securities lending income (net of fees) 968 2 — — —
302,995 4,572 116,878 27,928 25,417
Fees and expenses1:Investment advisory services 40,179 1,471 20,947 6,034 2,170Distribution services 13,505 403 5,683 1,385 949Insurance administrative services 6,814 145 960 76 101Transfer agent services 2 —2 1 —2 —2Administrative services 4,612 67 1,749 341 134Accounting and administrative services — — — — —Reports to shareholders 540 4 187 42 11Registration statement and prospectus 183 9 103 26 9Trustees’ compensation 84 1 32 6 2Auditing and legal 14 2 6 3 2Custodian 236 45 63 295 10Other 16 1 5 8 7
Total fees and expenses before waivers/reimbursements 66,185 2,148 29,736 8,216 3,395Less waivers/reimbursements of fees and expenses:
Investment advisory services waivers — — 3,839 1,137 294Miscellaneous fee reimbursements — — — — —
Total waivers/reimbursements of fees and expenses — — 3,839 1,137 294
Total fees and expenses after waivers/reimbursements 66,185 2,148 25,897 7,079 3,101
Net investment income (loss) 236,810 2,424 90,981 20,849 22,316
Net realized gain (loss) and unrealized appreciation(depreciation):
Net realized gain (loss) on:Investments in:
Unaffiliated issuers 1,222,318 18,038 15,401 33,755 (730)Affiliated issuers 14,034 —2 (54) (3) 1
Futures contracts (916) 160 20,928 (2,448) 628Forward currency contracts — (485) 5,716 (12,193) —Swap contracts (230) 2 (14,951) (1,062) (2,192)Currency transactions 531 24 (49) 288 —2
Capital gain distributions received from affiliated issuers — — — — —
1,235,737 17,739 26,991 18,337 (2,293)
Net unrealized appreciation (depreciation) on:Investments in:
Unaffiliated issuers 1,482,425 5,822 (202,388) (106,768) 36,385Affiliated issuers 39,737 (3) (63) (11) (3)
Futures contracts (3,091) (31) (12,908) (404) (215)Forward currency contracts — (22) 2,696 (6,357) —Swap contracts (316) (64) 13,759 (2) 502Currency translations (307) (37) (106) (521) (2)
1,518,448 5,665 (199,010) (114,063) 36,667
Net realized gain (loss) and unrealized appreciation(depreciation) 2,754,185 23,404 (172,019) (95,726) 34,374
Net increase (decrease) in net assets resulting from operations $2,990,995 $25,828 $ (81,038) $ (74,877) $56,690
See end of statements of operations for footnotes.
See notes to financial statements.
Financial statements (continued)unaudited
Statements of operations for the six months ended June 30, 2021 (continued) (dollars in thousands)

248 American Funds Insurance Series
AmericanFunds
MortgageFund
Ultra-ShortBond Fund
U.S.GovernmentSecuritiesFund7
ManagedRisk
GrowthFund
ManagedRisk
InternationalFund
Investment income:Income (net of non-U.S. taxes1):
Dividends:Unaffiliated issuers $ — $ — $ — $ — $ —Affiliated issuers — — — 750 123
— — — 750 123Interest from unaffiliated issuers 1,346 176 16,265 4 1Securities lending income (net of fees) — — — — —
1,346 176 16,265 754 124
Fees and expenses1:Investment advisory services 686 576 3,708 430 125Distribution services 122 398 2,110 704 207Insurance administrative services 51 50 318 718 209Transfer agent services —2 —2 —2 —2 —2Administrative services 49 54 313 — —Accounting and administrative services — — — 42 36Reports to shareholders 3 5 28 5 2Registration statement and prospectus 63 5 17 4 2Trustees’ compensation 1 1 6 1 —2Auditing and legal —2 —2 1 —2 —2Custodian 10 —2 17 3 3Other —2 —2 1 1 1
Total fees and expenses before waivers/reimbursements 985 1,089 6,519 1,908 585Less waivers/reimbursements of fees and expenses:
Investment advisory services waivers 311 — 552 144 42Miscellaneous fee reimbursements — — — — 17
Total waivers/reimbursements of fees and expenses 311 — 552 144 59
Total fees and expenses after waivers/reimbursements 674 1,089 5,967 1,764 526
Net investment income (loss) 672 (913) 10,298 (1,010) (402)
Net realized gain (loss) and unrealized appreciation(depreciation):
Net realized gain (loss) on:Investments in:
Unaffiliated issuers (188) —2 (25,715) — —Affiliated issuers — — — 24,401 1,751
Futures contracts 984 — 5,073 (13,268) (1,192)Forward currency contracts — — — — —Swap contracts 292 — 48,313 — —Currency transactions — — — 6 2
Capital gain distributions received from affiliated issuers — — — 66,104 694
1,088 —2 27,671 77,243 1,255
Net unrealized appreciation (depreciation) on:Investments in:
Unaffiliated issuers (4,358) (12) (35,475) (671) (72)Affiliated issuers — — — (33,724) 3,887
Futures contracts (258) — (1,481) 174 (178)Forward currency contracts — — — — —Swap contracts 858 — (32,661) — —Currency translations — — — — —
(3,758) (12) (69,617) (34,221) 3,637
Net realized gain (loss) and unrealized appreciation(depreciation) (2,670) (12) (41,946) 43,022 4,892
Net increase (decrease) in net assets resulting from operations $(1,998) $ (925) $(31,648) $ 42,012 $ 4,490
See end of statements of operations for footnotes.
See notes to financial statements.
Financial statements (continued)unaudited
Statements of operations for the six months ended June 30, 2021 (continued) (dollars in thousands)

American Funds Insurance Series 249
Managed RiskWashington
MutualInvestorsFund8
ManagedRisk
Growth-IncomeFund
ManagedRiskAsset
AllocationFund
Investment income:Income (net of non-U.S. taxes1):
Dividends:Unaffiliated issuers $ — $ — $ —Affiliated issuers 1,268 9,140 8,944
1,268 9,140 8,944Interest from unaffiliated issuers 3 18 22Securities lending income (net of fees) — — —
1,271 9,158 8,966
Fees and expenses1:Investment advisory services 269 1,872 2,095Distribution services 447 405 3,492Insurance administrative services 449 3,128 3,499Transfer agent services —2 —2 —2Administrative services — — —Accounting and administrative services 39 70 75Reports to shareholders 4 20 35Registration statement and prospectus 3 23 15Trustees’ compensation 1 7 8Auditing and legal —2 1 1Custodian 3 4 4Other 1 2 2
Total fees and expenses before waivers/reimbursements 1,216 5,532 9,226Less waivers/reimbursements of fees and expenses:
Investment advisory services waivers 90 626 700Miscellaneous fee reimbursements 12 — —
Total waivers/reimbursements of fees and expenses 102 626 700
Total fees and expenses after waivers/reimbursements 1,114 4,906 8,526
Net investment income (loss) 157 4,252 440
Net realized gain (loss) and unrealized appreciation(depreciation):
Net realized gain (loss) on:Investments in:
Unaffiliated issuers — (43,319) —Affiliated issuers 12,864 44,855 41,561
Futures contracts (8,063) (3,864) (22,623)Forward currency contracts — — —Swap contracts — — —Currency transactions (1) 19 7
Capital gain distributions received from affiliated issuers 3,183 35,312 88,212
7,983 33,003 107,157
Net unrealized appreciation (depreciation) on:Investments in:
Unaffiliated issuers (456) 772 (741)Affiliated issuers 23,090 177,389 122,574
Futures contracts 164 (1,989) (479)Forward currency contracts — — —Swap contracts — — —Currency translations — — —
22,798 176,172 121,354
Net realized gain (loss) and unrealized appreciation(depreciation) 30,781 209,175 228,511
Net increase (decrease) in net assets resulting from operations $30,938 $213,427 $228,951
1Additional information related to non-U.S. taxes and class-specific fees and expenses is included in the notes to financial statements.2Amount less than one thousand.3Formerly Blue Chip Income and Growth Fund.4Formerly Global Growth and Income Fund.5Formerly Bond Fund.6Formerly High-Income Bond Fund.7Formerly U.S. Government/AAA-Rated Securities Fund.8Formerly Managed Risk Blue Chip Income and Growth Fund.
See notes to financial statements.
Financial statements (continued)unaudited
Statements of operations for the six months ended June 30, 2021 (continued) (dollars in thousands)

250 American Funds Insurance Series
Global Growth FundGlobal Small
Capitalization Fund Growth Fund
Six monthsended
June 30,Year ended
December 31,
Six monthsended
June 30,Year ended
December 31,
Six monthsended
June 30,Year ended
December 31,20211 2020 20211 2020 20211 2020
Operations:Net investment income (loss) $ 15,946 $ 29,220 $ (7,764) $ (9,129) $ 46,758 $ 91,314Net realized gain (loss) 562,918 459,151 639,391 113,700 2,916,897 5,289,028Net unrealized appreciation (depreciation) 383,516 1,447,946 (70,897) 1,179,633 1,964,759 8,444,178
Net increase (decrease) in net assets resulting fromoperations 962,380 1,936,317 560,730 1,284,204 4,928,414 13,824,520
Distributions paid to shareholders (469,139) (224,589) (123,155) (284,490) (5,345,539) (865,145)
Net capital share transactions 609,763 (271,205) (529,904) (307,246) 3,906,694 (2,504,990)
Total increase (decrease) in net assets 1,103,004 1,440,523 (92,329) 692,468 3,489,569 10,454,385
Net assets:Beginning of period 8,240,970 6,800,447 5,312,741 4,620,273 38,924,044 28,469,659
End of period $9,343,974 $8,240,970 $5,220,412 $5,312,741 $42,413,613 $38,924,044
International Fund NewWorld FundWashington MutualInvestors Fund2
Six monthsended
June 30,Year ended
December 31,
Six monthsended
June 30,Year ended
December 31,
Six monthsended
June 30,Year ended
December 31,20211 2020 20211 2020 20211 2020
Operations:Net investment income (loss) $ 54,875 $ 53,872 $ 14,990 $ 15,078 $ 77,877 $ 162,025Net realized gain (loss) 1,014,178 40,022 239,174 132,645 2,259,141 (75,133)Net unrealized appreciation (depreciation) (577,645) 1,257,012 174,220 658,628 (922,321) 717,522
Net increase (decrease) in net assets resulting fromoperations 491,408 1,350,906 428,384 806,351 1,414,697 804,414
Distributions paid to shareholders (3,972) (71,715) (154,345) (43,949) (38,243) (265,213)
Net capital share transactions (1,032,932) (763,764) 109,484 (279,660) (807,936) (242,496)
Total increase (decrease) in net assets (545,496) 515,427 383,523 482,742 568,518 296,705
Net assets:Beginning of period 10,590,858 10,075,431 4,243,153 3,760,411 9,579,066 9,282,361
End of period $10,045,362 $10,590,858 $4,626,676 $4,243,153 $10,147,584 $9,579,066
See end of statements of changes in net assets for footnotes.
See notes to financial statements.
Financial statements (continued)Statements of changes in net assets (dollars in thousands)

American Funds Insurance Series 251
CapitalWorld Growth
and Income Fund3 Growth-Income FundInternational Growthand Income Fund
Six monthsended
June 30,Year ended
December 31,
Six monthsended
June 30,Year ended
December 31,
Six monthsended
June 30,Year ended
December 31,20211 2020 20211 2020 20211 2020
Operations:Net investment income (loss) $ 16,801 $ 25,233 $ 236,996 $ 485,987 $ 16,881 $ 21,504Net realized gain (loss) 397,808 49,687 1,973,477 359,138 88,835 (43,217)Net unrealized appreciation (depreciation) (202,049) 113,216 3,135,793 3,849,348 (4,169) 123,625
Net increase (decrease) in net assets resulting fromoperations 212,560 188,136 5,346,266 4,694,473 101,547 101,912
Distributions paid to shareholders (56,012) (77,584) (564,869) (1,429,478) (5,031) (21,467)
Net capital share transactions 27,179 (74,585) (2,295,985) (799,726) (207,946) (124,648)
Total increase (decrease) in net assets 183,727 35,967 2,485,412 2,465,269 (111,430) (44,203)
Net assets:Beginning of period 2,174,450 2,138,483 38,491,535 36,026,266 1,455,883 1,500,086
End of period $2,358,177 $2,174,450 $40,976,947 $38,491,535 $1,344,453 $1,455,883
Capital Income Builder Asset Allocation Fund Global Balanced Fund
Six monthsended
June 30,Year ended
December 31,
Six monthsended
June 30,Year ended
December 31,
Six monthsended
June 30,Year ended
December 31,20211 2020 20211 2020 20211 2020
Operations:Net investment income (loss) $ 17,435 $ 27,894 $ 236,810 $ 449,205 $ 2,424 $ 4,425Net realized gain (loss) 35,044 (42,055) 1,235,737 808,394 17,739 18,255Net unrealized appreciation (depreciation) 55,070 60,666 1,518,448 2,005,628 5,665 18,683
Net increase (decrease) in net assets resulting fromoperations 107,549 46,505 2,990,995 3,263,227 25,828 41,363
Distributions paid to shareholders (10,788) (28,997) (1,148,347) (606,436) (2,625) (21,373)
Net capital share transactions (155,116) 80,728 845,642 (418,795) (21,651) (1,808)
Total increase (decrease) in net assets (58,355) 98,236 2,688,290 2,237,996 1,552 18,182
Net assets:Beginning of period 1,096,952 998,716 29,657,651 27,419,655 455,132 436,950
End of period $1,038,597 $1,096,952 $32,345,941 $29,657,651 $456,684 $455,132
See end of statements of changes in net assets for footnotes.
See notes to financial statements.
Financial statements (continued)Statements of changes in net assets (continued) (dollars in thousands)

252 American Funds Insurance Series
The Bond Fundof America4 Capital World Bond Fund
AmericanHigh-Income Trust5
Six monthsended
June 30,Year ended
December 31,
Six monthsended
June 30,Year ended
December 31,
Six monthsended
June 30,Year ended
December 31,20211 2020 20211 2020 20211 2020
Operations:Net investment income (loss) $ 90,981 $ 202,752 $ 20,849 $ 41,768 $ 22,316 $ 56,258Net realized gain (loss) 26,991 480,282 18,337 45,840 (2,293) (51,887)Net unrealized appreciation (depreciation) (199,010) 299,487 (114,063) 116,992 36,667 19,323
Net increase (decrease) in net assets resulting fromoperations (81,038) 982,521 (74,877) 204,600 56,690 23,694
Distributions paid to shareholders (511,969) (339,511) (64,603) (64,860) (6,562) (69,840)
Net capital share transactions 2,253,298 213,249 (62,631) 70,361 156,298 (352,568)
Total increase (decrease) in net assets 1,660,291 856,259 (202,111) 210,101 206,426 (398,714)
Net assets:Beginning of period 11,407,419 10,551,160 2,338,745 2,128,644 867,579 1,266,293
End of period $13,067,710 $11,407,419 $2,136,634 $2,338,745 $1,074,005 $ 867,579
American FundsMortgage Fund Ultra-Short Bond Fund
U.S. GovernmentSecurities Fund7
Six monthsended
June 30,Year ended
December 31,
Six monthsended
June 30,Year ended
December 31,
Six monthsended
June 30,Year ended
December 31,20211 2020 20211 2020 20211 2020
Operations:Net investment income (loss) $ 672 $ 2,446 $ (913) $ (171) $ 10,298 $ 20,216Net realized gain (loss) 1,088 12,009 —6 — 27,671 187,696Net unrealized appreciation (depreciation) (3,758) 5,064 (12) (1) (69,617) 61,889
Net increase (decrease) in net assets resulting fromoperations (1,998) 19,519 (925) (172) (31,648) 269,801
Distributions paid to shareholders (11,658) (4,820) — (737) (185,422) (77,781)
Net capital share transactions 26,638 10,410 (34,927) 92,028 122,646 (934,697)
Total increase (decrease) in net assets 12,982 25,109 (35,852) 91,119 (94,424) (742,677)
Net assets:Beginning of period 319,619 294,510 375,749 284,630 2,153,657 2,896,334
End of period $332,601 $319,619 $339,897 $375,749 $2,059,233 $2,153,657
See end of statements of changes in net assets for footnotes.
See notes to financial statements.
Financial statements (continued)Statements of changes in net assets (continued) (dollars in thousands)

American Funds Insurance Series 253
Managed RiskGrowth Fund
Managed RiskInternational Fund
Managed RiskWashington MutualInvestors Fund8
Six monthsended
June 30,Year ended
December 31,
Six monthsended
June 30,Year ended
December 31,
Six monthsended
June 30,Year ended
December 31,20211 2020 20211 2020 20211 2020
Operations:Net investment income (loss) $ (1,010) $ 962 $ (402) $ 662 $ 157 $ 4,092Net realized gain (loss) 77,243 27,752 1,255 (13,879) 7,983 (64,328)Net unrealized appreciation (depreciation) (34,221) 110,658 3,637 19,066 22,798 56,976
Net increase (decrease) in net assets resulting fromoperations 42,012 139,372 4,490 5,849 30,938 (3,260)
Distributions paid to shareholders (25,491) (25,274) (931) (3,247) (4,350) (16,900)
Net capital share transactions 17,313 10,698 (2,961) 1,198 (19,501) 11,085
Total increase (decrease) in net assets 33,834 124,796 598 3,800 7,087 (9,075)
Net assets:Beginning of period 564,446 439,650 169,569 165,769 356,360 365,435
End of period $598,280 $564,446 $170,167 $169,569 $363,447 $356,360
Managed RiskGrowth-Income Fund
Managed RiskAsset Allocation Fund
Six monthsended
June 30,Year ended
December 31,
Six monthsended
June 30,Year ended
December 31,20211 2020 20211 2020
Operations:Net investment income (loss) $ 4,252 $ 27,259 $ 440 $ 30,915Net realized gain (loss) 33,003 38,669 107,157 (41,687)Net unrealized appreciation (depreciation) 176,172 145,694 121,354 161,153
Net increase (decrease) in net assets resulting fromoperations 213,427 211,622 228,951 150,381
Distributions paid to shareholders (58,770) (160,767) (31,041) (146,678)
Net capital share transactions 2,885 114,037 (118,439) (57,436)
Total increase (decrease) in net assets 157,542 164,892 79,471 (53,733)
Net assets:Beginning of period 2,434,616 2,269,724 2,778,771 2,832,504
End of period $2,592,158 $2,434,616 $2,858,242 $2,778,771
1Unaudited2Formerly Blue Chip Income and Growth Fund.3Formerly Global Growth and Income Fund.4Formerly Bond Fund.5Formerly High-Income Bond Fund.6Amount less than one thousand.7Formerly U.S. Government/AAA-Rated Securities Fund.8Formerly Managed Risk Blue Chip Income and Growth Fund.
See notes to financial statements.
Financial statements (continued)Statements of changes in net assets (continued) (dollars in thousands)

254 American Funds Insurance Series
1. Organization
American Funds Insurance Series (the “series”) is registered under the Investment Company Act of 1940, as amended (the “1940 Act”),as an open-end, diversified management investment company with 34 different funds ("the funds"), including 23 funds in the seriescovered in this report. The other 11 funds in the series are covered in separate reports. Six funds in the series are covered in theAmerican Funds Insurance Series - Target Date Series report and five funds in the series are covered in the American Funds InsuranceSeries - Portfolio Series report. The assets of each fund are segregated, with each fund accounted for separately. Capital Research andManagement Company (“CRMC”) is the series’ investment adviser. Milliman Financial Risk Management LLC (“Milliman FRM”) is thesubadviser for the risk management strategy for eight of the funds (the “managed risk funds”), five of which are covered in this report.
The managed risk funds covered in this report are Managed Risk Growth Fund,Managed Risk International Fund,Managed RiskWashington Mutual Investors Fund,Managed Risk Growth-Income Fund andManaged Risk Asset Allocation Fund. The managed riskfunds invest in other funds within the series (the “underlying funds”) and employ Milliman FRM to implement the risk managementstrategy, which consists of using hedging instruments — primarily short positions on exchange-traded futures contracts — to attempt tostabilize the volatility of the funds around target volatility levels and reduce the downside exposure of the funds during periods ofsignificant market declines.
Shareholders approved a proposal to reorganize the series from aMassachusetts business trust to a Delaware statutory trust. The seriesreserved the right to delay implementing the reorganization and has elected to do so.
The investment objective(s) for each fund covered in this report are as follows:
Global Growth Fund — To provide long-term growth of capital.
Global Small Capitalization Fund — To provide long-term growth of capital.
Growth Fund — To provide growth of capital.
International Fund — To provide long-term growth of capital.
NewWorld Fund — To provide long-term capital appreciation.
WashingtonMutual Investors Fund (formerly Blue Chip Income and Growth Fund) — To produce income exceeding the average yield onU.S. stocks generally and to provide an opportunity for growth of principal consistent with sound common stock investing.
CapitalWorld Growth and Income Fund (formerly Global Growth and Income Fund) — To provide long-term growth of capital whileproviding current income.
Growth-Income Fund — To achieve long-term growth of capital and income.
International Growth and Income Fund — To provide long-term growth of capital while providing current income.
Capital Income Builder — The two primary objectives are (1) to provide a level of current income that exceeds the average yield on U.S.stocks generally and (2) to provide a growing stream of income over the years. The secondary objective is to provide growth of capital.
Asset Allocation Fund — To provide high total return (including income and capital gains) consistent with preservation of capital overthe long term.
Global Balanced Fund — Seeks the balanced accomplishment of three objectives: long-term growth of capital, conservation of principaland current income.
The Bond Fund of America (formerly Bond Fund) — To provide as high a level of current income as is consistent with the preservation ofcapital.
Capital World Bond Fund — To provide, over the long term, a high level of total return consistent with prudent investment management.
Notes to financial statements unaudited

American Funds Insurance Series 255
American High-Income Trust (formerly High-Income Bond Fund)— The primary objective is to provide a high level of current income. Thesecondary objective is capital appreciation.
American Funds Mortgage Fund — To provide current income and preservation of capital.
Ultra-Short Bond Fund — To provide current income, consistent with the maturity and quality standards applicable to the fund, andpreservation of capital and liquidity.
U.S. Government Securities Fund (formerly U.S. Government/AAA-Rated Securities Fund) — To provide a high level of current incomeconsistent with prudent investment risk and preservation of capital.
Managed Risk Growth Fund — To provide growth of capital while seeking to manage volatility and provide downside protection.
Managed Risk International Fund — To provide long-term growth of capital while seeking to manage volatility and provide downsideprotection.
Managed RiskWashingtonMutual Investors Fund (formerly Managed Risk Blue Chip Income and Growth Fund) — To produce incomeexceeding the average yield on U.S. stocks generally and to provide an opportunity for growth of principal consistent with soundcommon stock investing, in each case while seeking to manage volatility and provide downside protection.
Managed Risk Growth-Income Fund — To achieve long-term growth of capital and income while seeking to manage volatility andprovide downside protection.
Managed Risk Asset Allocation Fund — To provide high total return (including income and capital gains) consistent with preservation ofcapital over the long term while seeking to manage volatility and provide downside protection.
Each fund in the series, except the managed risk funds, offers either four or five share classes (Classes 1, 1A, 2, 3 or 4); the managed riskfunds offer two share classes (Classes P1 and P2). Holders of all share classes of each fund have equal pro rata rights to assets,dividends and liquidation proceeds of each fund held. Each share class of each fund has identical voting rights, except for the exclusiveright to vote on matters affecting only its class. Share classes have different fees and expenses (“class-specific fees and expenses”),primarily due to different arrangements for certain distribution expenses. Differences in class-specific fees and expenses will result indifferences in net investment income and, therefore, the payment of different per-share dividends by each class of each fund.
2. Significant accounting policies
Each fund is an investment company that applies the accounting and reporting guidance issued in Topic 946 by the U.S. FinancialAccounting Standards Board. Each fund’s financial statements have been prepared to comply with U.S. generally accepted accountingprinciples (“U.S. GAAP”). These principles require the series’ investment adviser to make estimates and assumptions that affect reportedamounts and disclosures. Actual results could differ from those estimates. Subsequent events, if any, have been evaluated through thedate of issuance in the preparation of the financial statements. The funds follow the significant accounting policies described in thissection, as well as the valuation policies described in the next section on valuation.
Cash — Cash may include amounts held in an interest bearing deposit facility.
Security transactions and related investment income — Security transactions are recorded by the funds as of the date the trades areexecuted with brokers. Realized gains and losses from security transactions are determined based on the specific identified cost of thesecurities. In the event a security is purchased with a delayed payment date, the funds will segregate liquid assets sufficient to meettheir payment obligations. Dividend income is recognized on the ex-dividend date and interest income is recognized on an accrualbasis. Market discounts, premiums and original issue discounts on fixed-income securities are amortized daily over the expected life ofthe security.
Fees and expenses — The fees and expenses of the underlying funds held by the managed risk funds are not included in the fees andexpenses reported for each of the managed risk funds; however, they are indirectly reflected in the valuation of each of the underlyingfunds. These fees are included in the net effective expense ratios that are provided as additional information in the financial highlightstables.

256 American Funds Insurance Series
Class allocations — Income, fees and expenses (other than class-specific fees and expenses), realized gains and losses and unrealizedappreciation and depreciation are allocated daily among the various share classes of each fund based on their relative net assets.Class-specific fees and expenses, such as distribution expenses, are accrued daily and charged directly to the respective share class ofeach fund.
Distributions paid to shareholders — Income dividends and capital gain distributions are recorded on each fund’s ex-dividend date.
Currency translation — Assets and liabilities, including investment securities, denominated in currencies other than U.S. dollars aretranslated into U.S. dollars at the exchange rates supplied by one or more pricing vendors on the valuation date. Purchases and sales ofinvestment securities and income and expenses are translated into U.S. dollars at the exchange rates on the dates of such transactions.The effects of changes in exchange rates on investment securities are included with the net realized gain or loss and net unrealizedappreciation or depreciation on investments in the funds’ statements of operations. The realized gain or loss and unrealizedappreciation or depreciation resulting from all other transactions denominated in currencies other than U.S. dollars are disclosedseparately.
3. Valuation
CRMC, the series’ investment adviser, values the funds’ investments at fair value as defined by U.S. GAAP. The net asset value per shareis calculated once daily as of the close of regular trading on the New York Stock Exchange, normally 4 p.m. New York time, each day theNew York Stock Exchange is open.
Methods and inputs — The series’ investment adviser uses the following methods and inputs to establish the fair value of each fund’sassets and liabilities. Use of particular methods and inputs may vary over time based on availability and relevance as market andeconomic conditions evolve.
Equity securities are generally valued at the official closing price of, or the last reported sale price on, the exchange or market on whichsuch securities are traded, as of the close of business on the day the securities are being valued or, lacking any sales, at the last availablebid price. Prices for each security are taken from the principal exchange or market on which the security trades. The value of anunderlying fund is based on its reported net asset value.
Fixed-income securities, including short-term securities, are generally valued at prices obtained from one or more pricing vendors.Vendors value such securities based on one or more of the inputs described in the following table. The table provides examples ofinputs that are commonly relevant for valuing particular classes of fixed-income securities in which the funds are authorized to invest.However, these classifications are not exclusive and any of the inputs may be used to value any other class of fixed-income security.
Fixed-income class Examples of standard inputs
All Benchmark yields, transactions, bids, offers, quotations from dealers andtrading systems, new issues, spreads and other relationships observed inthe markets among comparable securities; and proprietary pricingmodels such as yield measures calculated using factors such as cashflows, financial or collateral performance and other reference data(collectively referred to as “standard inputs”)
Corporate bonds, notes & loans; convertible securities Standard inputs and underlying equity of the issuer
Bonds & notes of governments & government agencies Standard inputs and interest rate volatilities
Mortgage-backed; asset-backed obligations Standard inputs and cash flows, prepayment information, default rates,delinquency and loss assumptions, collateral characteristics, creditenhancements and specific deal information
Municipal securities Standard inputs and, for certain distressed securities, cash flows orliquidation values using a net present value calculation based on inputsthat include, but are not limited to, financial statements and debtcontracts
When the series’ investment adviser deems it appropriate to do so (such as when vendor prices are unavailable or not deemed to berepresentative), fixed-income securities will be valued in good faith at the mean quoted bid and ask prices that are reasonably andtimely available (or bid prices, if ask prices are not available) or at prices for securities of comparable maturity, quality and type.

American Funds Insurance Series 257
Securities with both fixed-income and equity characteristics, or equity securities traded principally among fixed-income dealers, aregenerally valued in the manner described for either equity or fixed-income securities, depending on which method is deemedmostappropriate by the series’ investment adviser. The Capital Group Central Corporate Bond Fund (“CCBF”), a fund within the CapitalGroup Central Fund Series II, and Capital Group Central Cash Fund (“CCF”), a fund within the Capital Group Central Fund Series(collectively the “Central Funds“), are each valued based upon a floating net asset value, which fluctuates with changes in the value ofeach fund’s portfolio securities. The underlying securities are valued based on the policies and procedures in the Central Funds’statements of additional information. The State Street Institutional U.S. Government Money Market Fund held by the managed riskfunds is managed to maintain a $1.00 net asset value per share. The net asset value of each share class of each managed risk fund iscalculated based on the reported net asset values of the underlying funds in which each fund invests.
Exchange-traded options and futures are generally valued at the official closing price for options and official settlement price for futuresof the exchange or market on which such instruments are traded, as of the close of business on the day such instruments are beingvalued. Forward currency contracts are valued based on the spot and forward exchange rates obtained from one or more pricingvendors. Interest rate swaps and credit default swaps are generally valued by pricing vendors based onmarket inputs that include theindex and term of index, reset frequency, payer/receiver, currency and pay frequency.
Securities and other assets for which representative market quotations are not readily available or are considered unreliable by theseries’ investment adviser are fair valued as determined in good faith under fair value guidelines adopted by authority of the series’board of trustees as further described. The investment adviser follows fair valuation guidelines, consistent with U.S. Securities andExchange Commission rules and guidance, to consider relevant principles and factors when making fair value determinations. Theinvestment adviser considers relevant indications of value that are reasonably and timely available to it in determining the fair value tobe assigned to a particular security, such as the type and cost of the security; contractual or legal restrictions on resale of the security;relevant financial or business developments of the issuer; actively traded similar or related securities; conversion or exchange rights onthe security; related corporate actions; significant events occurring after the close of trading in the security; and changes in overallmarket conditions. In addition, the closing prices of equity securities and futures that trade in markets outside U.S. time zones may beadjusted to reflect significant events that occur after the close of local trading but before the net asset value of each share class of eachfund is determined. Fair valuations and valuations of investments and futures that are not actively trading involve judgment andmaydiffer materially from valuations that would have been used had greater market activity occurred.
Processes and structure — The series’ board of trustees has delegated authority to the series’ investment adviser to make fair valuedeterminations, subject to board oversight. The investment adviser has established a Joint Fair Valuation Committee (the “Fair ValuationCommittee”) to administer, implement and oversee the fair valuation process, and to make fair value decisions. The Fair ValuationCommittee regularly reviews its own fair value decisions, as well as decisions made under its standing instructions to the investmentadviser’s valuation teams. The Fair Valuation Committee reviews changes in fair value measurements from period to period andmay, asdeemed appropriate, update the fair valuation guidelines to better reflect the results of back testing and address new or evolvingissues. The Fair Valuation Committee reports any changes to the fair valuation guidelines to the board of trustees. The series’ board andaudit committee also regularly review reports that describe fair value determinations andmethods.
The series’ investment adviser has also established a Fixed-Income Pricing Review Group to administer and oversee the fixed-incomevaluation process, including the use of fixed-income pricing vendors. This group regularly reviews pricing vendor information andmarket data. Pricing decisions, processes and controls over security valuation are also subject to additional internal reviews facilitatedby the investment adviser’s global risk management group.
Classifications — The series’ investment adviser classifies the funds’ assets and liabilities into three levels based on the inputs used tovalue the assets or liabilities. Level 1 values are based on quoted prices in active markets for identical securities. Level 2 values arebased on significant observable market inputs, such as quoted prices for similar securities and quoted prices in inactive markets.Certain securities trading outside the U.S. may transfer between Level 1 and Level 2 due to valuation adjustments resulting fromsignificant market movements following the close of local trading. Level 3 values are based on significant unobservable inputs thatreflect the investment adviser’s determination of assumptions that market participants might reasonably use in valuing the securities.

258 American Funds Insurance Series
The valuation levels are not necessarily an indication of the risk or liquidity associated with the underlying investment. For example, U.S.government securities are reflected as Level 2 because the inputs used to determine fair value may not always be quoted prices in anactive market. The following tables present the funds’ valuation levels as of June 30, 2021 (dollars in thousands):
Global Growth FundInvestment securities
Level 1 Level 2 Level 3 Total
Assets:Common stocks:
Information technology $2,901,017 $ — $— $2,901,017Consumer discretionary 1,711,163 — — 1,711,163Health care 1,098,520 — — 1,098,520Communication services 892,157 13,180 — 905,337Financials 825,606 — — 825,606Consumer staples 514,524 — — 514,524Industrials 326,389 — — 326,389Materials 164,757 — — 164,757Energy 102,862 — — 102,862Real estate 34,101 — — 34,101Utilities 17,082 — — 17,082
Preferred securities 272,014 — — 272,014Short-term securities 526,889 — — 526,889
Total $9,387,081 $13,180 $— $9,400,261
Global Small Capitalization FundInvestment securities
Level 1 Level 2 Level 3 Total
Assets:Common stocks:
Information technology $1,192,508 $ — $ 1,418 $1,193,926Health care 1,007,569 — 3 1,007,572Consumer discretionary 892,834 35,119 — 927,953Industrials 796,800 — — 796,800Financials 320,854 48,010 39,715 408,579Consumer staples 135,810 — — 135,810Materials 128,417 — — 128,417Communication services 104,814 — — 104,814Utilities 78,142 — — 78,142Real estate 60,811 — — 60,811Energy 22,188 — 13,392 35,580
Preferred securities 22,095 — 76,268 98,363Rights & warrants — 28,173 — 28,173Short-term securities 288,958 — — 288,958
Total $5,051,800 $111,302 $130,796 $5,293,898
The following table reconciles the valuation of the fund’s Level 3 investment securities and related transactions for the six monthsended June 30, 2021 (dollars in thousands):
Beginningvalue at
1/1/2021
Transfersinto
Level 3* Purchases Sales
Netrealized
gainUnrealized
depreciation†
Transfersout of
Level 3*
Endingvalue at
6/30/2021
Investment securities $103,891 $— $67,801 $(28,877) $— $(12,019) $— $130,796
Net unrealized appreciation during the period on Level 3 investment securities held at June 30, 2021 $ 8,254
*Transfers into or out of Level 3 are based on the beginning market value of the quarter in which they occurred. These transfers are the result of changes in theavailability of pricing sources and/or in the observability of significant inputs used in valuing the securities.
†Net unrealized depreciation is included in the related amounts on investments in the fund’s statement of operations.

American Funds Insurance Series 259
Unobservable inputs — Valuation of the fund’s Level 3 securities is based on significant unobservable inputs that reflect the investmentadviser’s determination of assumptions that market participants might reasonably use in valuing the securities. The following tableprovides additional information used by the fund’s investment adviser to fair value the fund’s Level 3 securities (dollars in thousands):
Value at6/30/2021
Valuationtechniques
Unobservableinputs
Range(if applicable)
Weightedaverage*
Impact tovaluation froman increase ininput†
Common stocks $ 54,528
Liquidation value N/A N/A N/A N/A
Transaction price N/A N/A N/A N/A
Market comparablecompanies
Price/Cash flow multiple 11.3x 11.3x Increase
DLOM 25% 25% Decrease
$ per one billion Btu $2.25 $2.25 Increase
MMTPA 10 MMTPA 10 MMTPA Increase
Preferred securities 76,268
Transaction price N/A N/A N/A N/A
Market comparablecompanies
Price/Sales multiple 17.3x 17.3x Increase
EV/Sales multiple 21.1x 21.1x Increase
Discount to Price/Sales multiple 15% 15% Decrease
Revenue growth rate 86% 86% Increase
Total $130,796
*Weighted average is by relative fair value.†This column represents the directional change in fair value of the Level 3 securities that would result in an increase from the corresponding input. A decreaseto the unobservable input would have the opposite effect. Significant increases and decreases in these inputs in isolation could result in significantly higher orlower fair value measurements.
Key to abbreviationsBtu = British thermal unitDLOM = Discount for lack of marketabilityEV = Enterprise valueMMTPA =Million metric tonnes per annum
Growth FundInvestment securities
Level 1 Level 2 Level 3 Total
Assets:Common stocks:
Information technology $ 9,485,387 $— $ 6,765 $ 9,492,152Communication services 8,664,763 — — 8,664,763Consumer discretionary 7,424,184 — — 7,424,184Health care 5,303,247 — 44,823 5,348,070Industrials 3,638,141 — — 3,638,141Financials 2,695,927 — — 2,695,927Consumer staples 1,355,571 — — 1,355,571Materials 1,235,736 — — 1,235,736Energy 945,591 — — 945,591Utilities 249,490 — — 249,490Real estate 95,702 — — 95,702
Preferred securities 34,751 — 37,008 71,759Convertible bonds & notes — — 25,195 25,195Short-term securities 1,123,350 — — 1,123,350
Total $42,251,840 $— $113,791 $42,365,631

260 American Funds Insurance Series
International FundInvestment securities
Level 1 Level 2 Level 3 Total
Assets:Common stocks:
Financials $2,009,077 $ — $— $ 2,009,077Health care 1,259,197 — 6 1,259,203Industrials 1,251,508 — — 1,251,508Consumer discretionary 1,188,916 — — 1,188,916Information technology 1,052,541 — — 1,052,541Materials 778,053 — — 778,053Energy 736,123 — — 736,123Communication services 640,447 31,810 — 672,257Consumer staples 291,612 — — 291,612Utilities 273,033 — — 273,033Real estate 17,067 — — 17,067
Preferred securities 183,730 — — 183,730Rights & warrants — 26,057 — 26,057Short-term securities 262,095 — — 262,095
Total $9,943,399 $57,867 $6 $10,001,272
NewWorld FundInvestment securities
Level 1 Level 2 Level 3 Total
Assets:Common stocks:
Information technology $ 914,210 $ — $ 496 $ 914,706Health care 591,042 — 1 591,043Consumer discretionary 584,089 — — 584,089Financials 546,496 — — 546,496Communication services 436,323 8,552 — 444,875Materials 314,689 — — 314,689Industrials 274,374 — — 274,374Consumer staples 234,831 — — 234,831Energy 143,355 — — 143,355Real estate 89,849 — — 89,849Utilities 75,265 — — 75,265
Preferred securities 39,190 — 14,736 53,926Rights & warrants 97 8,721 — 8,818Bonds, notes & other debt instruments — 118,547 — 118,547Short-term securities 238,312 — — 238,312
Total $4,482,122 $135,820 $15,233 $4,633,175
Other investments*
Level 1 Level 2 Level 3 Total
Assets:Unrealized appreciation on futures contracts $ 147 $ — $— $ 147Unrealized appreciation on open forward currency contracts — 69 — 69
Liabilities:Unrealized depreciation on futures contracts (157) — — (157)
Total $ (10) $69 $— $ 59
*Futures contracts and forward currency contracts are not included in the fund’s investment portfolio.
WashingtonMutual Investors FundAt June 30, 2021, all of the fund’s investment securities were classified as Level 1.

American Funds Insurance Series 261
Capital World Growth and Income FundInvestment securities
Level 1 Level 2 Level 3 Total
Assets:Common stocks:
Information technology $ 437,858 $ — $— $ 437,858Financials 345,398 — — 345,398Consumer discretionary 286,441 — — 286,441Health care 263,125 — — 263,125Communication services 245,461 — — 245,461Industrials 196,049 — — 196,049Consumer staples 141,552 — — 141,552Materials 134,666 — — 134,666Energy 65,162 — — 65,162Utilities 64,095 — — 64,095Real estate 51,037 — — 51,037
Preferred securities 21,224 — — 21,224Rights & warrants 37 — — 37Convertible stocks 2,533 3,030 — 5,563Convertible bonds & notes — 4,635 — 4,635Bonds, notes & other debt instruments — 8,607 — 8,607Short-term securities 99,886 — — 99,886
Total $2,354,524 $16,272 $— $2,370,796
Growth-Income FundInvestment securities
Level 1 Level 2 Level 3 Total
Assets:Common stocks:
Information technology $ 9,112,848 $ — $— $ 9,112,848Communication services 6,876,506 — — 6,876,506Health care 4,632,505 — — 4,632,505Industrials 4,215,801 — — 4,215,801Financials 4,138,860 — — 4,138,860Consumer discretionary 3,592,797 — — 3,592,797Materials 2,001,298 — — 2,001,298Consumer staples 1,800,227 — — 1,800,227Energy 1,235,860 — — 1,235,860Real estate 1,050,508 — — 1,050,508Utilities 951,664 — — 951,664
Convertible stocks 435,767 — — 435,767Bonds, notes & other debt instruments — 13,983 — 13,983Short-term securities 1,051,842 — — 1,051,842
Total $41,096,483 $13,983 $— $41,110,466

262 American Funds Insurance Series
International Growth and Income FundInvestment securities
Level 1 Level 2 Level 3 Total
Assets:Common stocks:
Financials $ 235,849 $ — $— $ 235,849Consumer discretionary 181,636 — — 181,636Health care 132,269 — 4 132,273Materials 126,986 — — 126,986Communication services 124,953 — — 124,953Industrials 116,228 — — 116,228Information technology 115,319 — — 115,319Consumer staples 97,760 — — 97,760Utilities 57,845 — — 57,845Energy 42,766 — — 42,766Real estate 36,475 — — 36,475
Preferred securities 13,083 — — 13,083Bonds, notes & other debt instruments — 8,551 — 8,551Short-term securities 68,410 — — 68,410
Total $1,349,579 $8,551 $4 $1,358,134
Capital Income BuilderInvestment securities
Level 1 Level 2 Level 3 Total
Assets:Common stocks:
Financials $161,170 $ — $— $ 161,170Information technology 99,453 — — 99,453Consumer staples 95,525 — — 95,525Health care 86,290 — — 86,290Real estate 76,977 — — 76,977Utilities 72,374 — — 72,374Energy 52,158 — — 52,158Materials 49,491 — — 49,491Communication services 47,847 — — 47,847Industrials 40,439 — — 40,439Consumer discretionary 26,508 — — 26,508
Preferred securities 2,016 — — 2,016Rights & warrants 5 — — 5Convertible stocks 11,134 — — 11,134Investment funds 30,524 — — 30,524Convertible bonds & notes — 536 — 536Bonds, notes & other debt instruments:
U.S. Treasury bonds & notes — 81,573 — 81,573Mortgage-backed obligations — 35,766 — 35,766Corporate bonds, notes & loans — 25,440 — 25,440Asset-backed obligations — 5,779 — 5,779Bonds & notes of governments & government agencies
outside the U.S. — 879 — 879Municipals — 265 — 265
Short-term securities 49,140 — — 49,140
Total $901,051 $150,238 $— $1,051,289

American Funds Insurance Series 263
Other investments*
Level 1 Level 2 Level 3 Total
Assets:Unrealized appreciation on futures contracts $522 $ — $— $ 522Unrealized appreciation on interest rate swaps — 1,167 — 1,167Unrealized appreciation on credit default swaps — 39 — 39
Liabilities:Unrealized depreciation on futures contracts (48) — — (48)Unrealized depreciation on open forward currency contracts — (1) — (1)
Total $474 $1,205 $— $1,679
*Futures contracts, forward currency contracts, interest rate swaps and credit default swaps are not included in the fund’s investment portfolio.
Asset Allocation FundInvestment securities
Level 1 Level 2 Level 3 Total
Assets:Common stocks:
Information technology $ 5,065,489 $ — $ — $ 5,065,489Financials 3,804,933 — 482 3,805,415Health care 2,830,967 — 19,795 2,850,762Consumer discretionary 2,661,235 — — 2,661,235Communication services 1,990,309 — — 1,990,309Consumer staples 1,946,633 — — 1,946,633Materials 1,485,489 — — 1,485,489Industrials 1,115,187 — 13,818 1,129,005Energy 789,159 2,851 461 792,471Real estate 603,494 — — 603,494Utilities 222,883 — — 222,883
Preferred securities — — 317 317Rights & warrants 395 — — 395Convertible stocks 110,813 47,698 — 158,511Investment funds 1,681,198 — — 1,681,198Bonds, notes & other debt instruments:
U.S. Treasury bonds & notes — 2,313,837 — 2,313,837Corporate bonds, notes & loans — 2,260,005 4,961 2,264,966Mortgage-backed obligations — 1,788,498 — 1,788,498Asset-backed obligations — 310,904 — 310,904Bonds & notes of governments & government agencies
outside the U.S. — 57,726 — 57,726Federal agency bonds & notes — 36,357 — 36,357Municipals — 29,080 — 29,080
Short-term securities 2,439,395 — — 2,439,395
Total $26,747,579 $6,846,956 $39,834 $33,634,369
Other investments*
Level 1 Level 2 Level 3 Total
Assets:Unrealized appreciation on futures contracts $ 901 $ — $— $ 901Unrealized appreciation on interest rate swaps — 862 — 862
Liabilities:Unrealized depreciation on futures contracts (4,764) — — (4,764)Unrealized depreciation on credit default swaps — (382) — (382)
Total $(3,863) $ 480 $— $(3,383)
*Futures contracts, interest rate swaps and credit default swaps are not included in the fund’s investment portfolio.
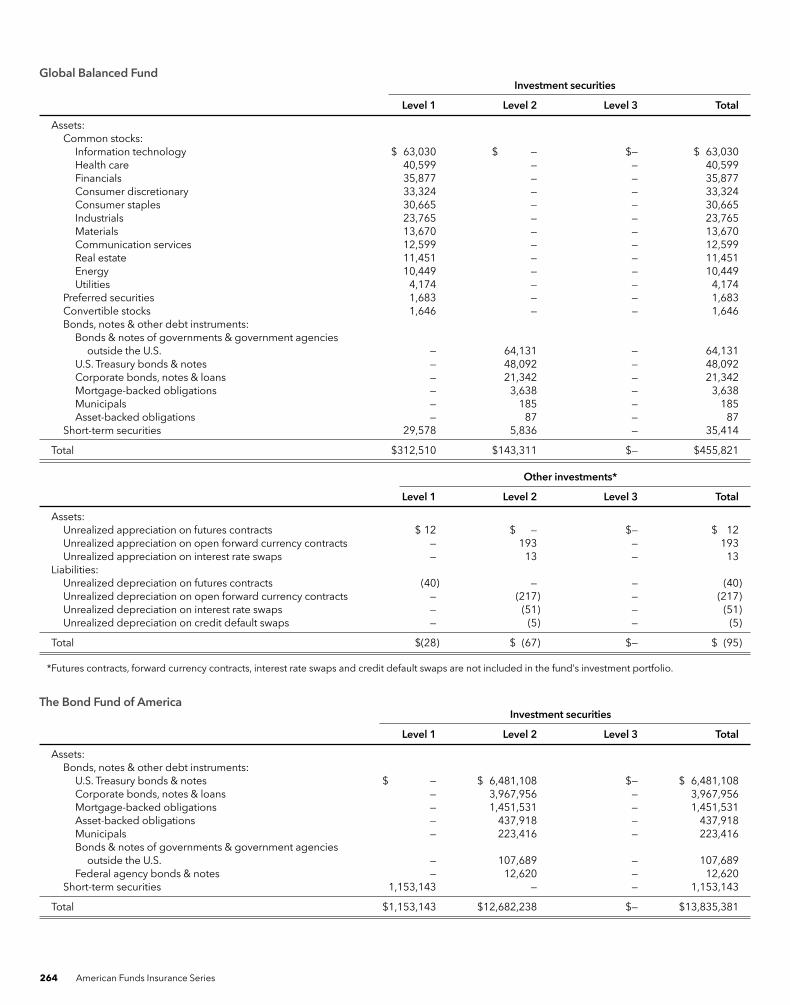
264 American Funds Insurance Series
Global Balanced FundInvestment securities
Level 1 Level 2 Level 3 Total
Assets:Common stocks:
Information technology $ 63,030 $ — $— $ 63,030Health care 40,599 — — 40,599Financials 35,877 — — 35,877Consumer discretionary 33,324 — — 33,324Consumer staples 30,665 — — 30,665Industrials 23,765 — — 23,765Materials 13,670 — — 13,670Communication services 12,599 — — 12,599Real estate 11,451 — — 11,451Energy 10,449 — — 10,449Utilities 4,174 — — 4,174
Preferred securities 1,683 — — 1,683Convertible stocks 1,646 — — 1,646Bonds, notes & other debt instruments:
Bonds & notes of governments & government agenciesoutside the U.S. — 64,131 — 64,131
U.S. Treasury bonds & notes — 48,092 — 48,092Corporate bonds, notes & loans — 21,342 — 21,342Mortgage-backed obligations — 3,638 — 3,638Municipals — 185 — 185Asset-backed obligations — 87 — 87
Short-term securities 29,578 5,836 — 35,414
Total $312,510 $143,311 $— $455,821
Other investments*
Level 1 Level 2 Level 3 Total
Assets:Unrealized appreciation on futures contracts $ 12 $ — $— $ 12Unrealized appreciation on open forward currency contracts — 193 — 193Unrealized appreciation on interest rate swaps — 13 — 13
Liabilities:Unrealized depreciation on futures contracts (40) — — (40)Unrealized depreciation on open forward currency contracts — (217) — (217)Unrealized depreciation on interest rate swaps — (51) — (51)Unrealized depreciation on credit default swaps — (5) — (5)
Total $(28) $ (67) $— $ (95)
*Futures contracts, forward currency contracts, interest rate swaps and credit default swaps are not included in the fund’s investment portfolio.
The Bond Fund of AmericaInvestment securities
Level 1 Level 2 Level 3 Total
Assets:Bonds, notes & other debt instruments:
U.S. Treasury bonds & notes $ — $ 6,481,108 $— $ 6,481,108Corporate bonds, notes & loans — 3,967,956 — 3,967,956Mortgage-backed obligations — 1,451,531 — 1,451,531Asset-backed obligations — 437,918 — 437,918Municipals — 223,416 — 223,416Bonds & notes of governments & government agencies
outside the U.S. — 107,689 — 107,689Federal agency bonds & notes — 12,620 — 12,620
Short-term securities 1,153,143 — — 1,153,143
Total $1,153,143 $12,682,238 $— $13,835,381

American Funds Insurance Series 265
Other investments*
Level 1 Level 2 Level 3 Total
Assets:Unrealized appreciation on futures contracts $ 15,162 $ — $— $ 15,162Unrealized appreciation on open forward currency contracts — 97 — 97Unrealized appreciation on credit default swaps — 88 — 88
Liabilities:Unrealized depreciation on futures contracts (21,263) — — (21,263)Unrealized depreciation on open forward currency contracts — (8) — (8)Unrealized depreciation on interest rate swaps — (11,390) — (11,390)
Total $ (6,101) $(11,213) $— $(17,314)
*Futures contracts, forward currency contracts, interest rate swaps and credit default swaps are not included in the fund’s investment portfolio.
Capital World Bond FundInvestment securities
Level 1 Level 2 Level 3 Total
Assets:Bonds, notes & other debt instruments:
Euros $ — $ 363,820 $ — $ 363,820Japanese yen — 217,699 — 217,699Chinese yuan renminbi — 193,519 — 193,519British pounds — 71,863 — 71,863Danish kroner — 53,121 — 53,121Brazilian reais — 51,869 — 51,869Canadian dollars — 44,977 — 44,977Mexican pesos — 41,782 — 41,782Russian rubles — 35,773 — 35,773Australian dollars — 26,330 — 26,330Malaysian ringgits — 23,238 — 23,238Indonesian rupiah — 14,966 — 14,966Colombian pesos — 11,196 — 11,196South Korean won — 9,283 — 9,283Indian rupees — 8,078 — 8,078Czech korunas — 7,920 — 7,920Ukrainian hryvnia — 7,508 — 7,508Norwegian kroner — 6,735 — 6,735Ghanaian cedi — 2,723 — 2,723South African rand — 2,358 — 2,358Peruvian nuevos soles — 1,631 — 1,631Polish zloty — 1,407 — 1,407Romanian leu — 1,295 — 1,295U.S. dollars — 790,146 80 790,226
Preferred securities — — 34 34Common stocks 883 231 1,589 2,703Rights & warrants 41 — — 41Short-term securities 123,872 29,145 — 153,017
Total $124,796 $2,018,613 $1,703 $2,145,112

266 American Funds Insurance Series
Other investments*
Level 1 Level 2 Level 3 Total
Assets:Unrealized appreciation on futures contracts $ 730 $ — $— $ 730Unrealized appreciation on open forward currency contracts — 2,433 — 2,433Unrealized appreciation on interest rate swaps — 276 — 276
Liabilities:Unrealized depreciation on futures contracts (981) — — (981)Unrealized depreciation on open forward currency contracts — (8,434) — (8,434)Unrealized depreciation on interest rate swaps — (804) — (804)Unrealized depreciation on credit default swaps — (205) — (205)
Total $(251) $(6,734) $— $(6,985)
*Futures contracts, forward currency contracts, interest rate swaps and credit default swaps are not included in the fund’s investment portfolio.
American High-Income TrustInvestment securities
Level 1 Level 2 Level 3 Total
Assets:Bonds, notes & other debt instruments:
Corporate bonds, notes & loans $ — $927,106 $ 4,737 $ 931,843Other — 1,129 — 1,129
Convertible bonds & notes — 3,637 70 3,707Convertible stocks 340 519 — 859Common stocks 21,886 6,523 31,967 60,376Preferred securities — 2,143 719 2,862Rights & warrants 786 620 —1 1,406Short-term securities 62,665 — — 62,665
Total $85,677 $941,677 $37,493 $1,064,847
Other investments2
Level 1 Level 2 Level 3 Total
Liabilities:Unrealized depreciation on futures contracts $(234) $ — $— $(234)Unrealized depreciation on credit default swaps — (219) — (219)
Total $(234) $(219) $— $(453)
1Amount less than one thousand.2Futures contracts and credit default swaps are not included in the investment portfolio.
The following table reconciles the valuation of the fund’s Level 3 investment securities and related transactions for the six monthsended June 30, 2021 (dollars in thousands):
Beginningvalue at
1/1/2021
Transfersinto
Level 33 Purchases Sales
Netrealized
loss4Unrealized
appreciation4
Transfersout of
Level 33
Endingvalue at
6/30/2021
Investment securities $28,783 $— $656 $(855) $(7,021) $16,275 $(345) $37,493
Net unrealized appreciation during the period on Level 3 investment securities held at June 30, 2021 $ 9,194
3Transfers into or out of Level 3 are based on the beginning market value of the quarter in which they occurred. These transfers are the result of changes in theavailability of pricing sources and/or in the observability of significant inputs used in valuing the securities.
4Net realized loss and unrealized appreciation are included in the related amounts on investments in the fund’s statement of operations.

American Funds Insurance Series 267
Unobservable inputs — Valuation of the fund’s Level 3 securities is based on significant unobservable inputs that reflect the investmentadviser’s determination of assumptions that market participants might reasonably use in valuing the securities. The following tableprovides additional information used by the fund’s investment adviser to fair value the fund’s Level 3 securities (dollars in thousands):
Value at6/30/2021
Valuationtechniques
Unobservableinputs
Range(if applicable)
Weightedaverage1
Impact tovaluation froman increase ininput2
Bonds, notes & otherdebt instruments
$ 4,737
Estimated recoveryvalue
Expected sale proceeds N/A N/A N/A
Exchange terms N/A N/A N/A
Vendor price N/A N/A N/A
Par value N/A N/A N/A
Yield analysis YTM risk premium 200 bps 200 bps Decrease
Convertible bonds ¬es
70 Transaction price N/A N/A N/A N/A
Common stocks 31,967
Estimated recoveryvalue
N/A N/A N/A N/A
Exchange terms N/A N/A N/A
Risk discount 90% 90% Decrease
Par value N/A N/A N/A
Adjustment based on marketdecline
20% 20% Decrease
Market comparablecompanies
EV/EBITDAmultiple 5.9x 5.9x Increase
EV/EBITDA less CapEx multiple 10.0 - 17.7x 15.6x Increase
Discount to EV/EBITDA lessCapEx multiple
21% 21% Decrease
DLOM 16 - 21% 19% Decrease
Recent marketinformation
Vendor price N/A N/A N/A
DLOM 16% 16% Decrease
Transaction price N/A N/A N/A N/A
Preferred securities 719Market comparablecompanies
EV/EBITDAmultiple 3.5x 3.5x Increase
DLOM 30% 30% Decrease
Rights & warrants —3Estimated recoveryvalue
N/A N/A N/A N/A
Total $37,493
1Weighted average is by relative fair value.2This column represents the directional change in fair value of the Level 3 securities that would result in an increase from the corresponding input. A decreaseto the unobservable input would have the opposite effect. Significant increases and decreases in these inputs in isolation could result in significantly higher orlower fair value measurements.
3Amount less than one thousand.
Key to abbreviationsCapEx = Capital expenditureDLOM = Discount for lack of marketabilityEBITDA = Earnings before income taxes, depreciation and amortizationEV = Enterprise valueYTM = Yield to maturity

268 American Funds Insurance Series
American Funds Mortgage FundInvestment securities
Level 1 Level 2 Level 3 Total
Assets:Bonds, notes & other debt instruments:
Mortgage-backed obligations $— $191,785 $— $191,785U.S. Treasury bonds & notes — 58,655 — 58,655Asset-backed obligations — 11,302 — 11,302Bonds & notes of governments & government agencies outside
the U.S. — 867 — 867Federal agency bonds & notes — 285 — 285Corporate bonds, notes & loans — 253 — 253
Short-term securities — 178,423 — 178,423
Total $— $441,570 $— $441,570
Other investments*
Level 1 Level 2 Level 3 Total
Assets:Unrealized appreciation on futures contracts $ 45 $ — $— $ 45Unrealized appreciation on interest rate swaps — 2,072 — 2,072
Liabilities:Unrealized depreciation on futures contracts (270) — — (270)
Total $(225) $2,072 $— $1,847
*Futures contracts and interest rate swaps are not included in the fund’s investment portfolio.
Ultra-Short Bond FundAt June 30, 2021, all of the fund’s investment securities were classified as Level 2.
U.S. Government Securities FundInvestment securities
Level 1 Level 2 Level 3 Total
Assets:Bonds, notes & other debt instruments:
U.S. Treasury bonds & notes $— $1,064,145 $— $1,064,145Mortgage-backed obligations — 356,523 — 356,523Federal agency bonds & notes — 265,578 — 265,578
Short-term securities — 501,987 — 501,987
Total $— $2,188,233 $— $2,188,233
Other investments*
Level 1 Level 2 Level 3 Total
Assets:Unrealized appreciation on futures contracts $ 2,742 $ — $— $ 2,742Unrealized appreciation on interest rate swaps — 5,702 — 5,702
Liabilities:Unrealized depreciation on futures contracts (4,263) — — (4,263)Unrealized depreciation on interest rate swaps — (10,883) — (10,883)
Total $(1,521) $ (5,181) $— $ (6,702)
*Futures contracts and interest rate swaps are not included in the fund’s investment portfolio.
Managed Risk Growth FundAt June 30, 2021, all of the fund’s investments were classified as Level 1.
Managed Risk International FundAt June 30, 2021, all of the fund’s investments were classified as Level 1.

American Funds Insurance Series 269
Managed RiskWashingtonMutual Investors FundAt June 30, 2021, all of the fund’s investments were classified as Level 1.
Managed Risk Growth-Income FundAt June 30, 2021, all of the fund’s investments were classified as Level 1.
Managed Risk Asset Allocation FundAt June 30, 2021, all of the fund’s investments were classified as Level 1.
4. Risk factors
Investing in the funds may involve certain risks including, but not limited to, those described below.
Market conditions — The prices of, and the income generated by, the common stocks, bonds and other securities held by a fundmaydecline — sometimes rapidly or unpredictably — due to various factors, including events or conditions affecting the general economy orparticular industries; overall market changes; local, regional or global political, social or economic instability; governmental,governmental agency or central bank responses to economic conditions; and currency exchange rate, interest rate and commodityprice fluctuations.
Economies and financial markets throughout the world are highly interconnected. Economic, financial or political events, trading andtariff arrangements, wars, terrorism, cybersecurity events, natural disasters, public health emergencies (such as the spread of infectiousdisease) and other circumstances in one country or region, including actions taken by governmental or quasi-governmental authoritiesin response to any of the foregoing, could have impacts on global economies or markets. As a result, whether or not a fund invests insecurities of issuers located in or with significant exposure to the countries affected, the value and liquidity of a fund’s investments maybe negatively affected by developments in other countries and regions.
Issuer risks — The prices of, and the income generated by, securities held by a fundmay decline in response to various factors directlyrelated to the issuers of such securities, including reduced demand for an issuer’s goods or services, poor management performance,major litigation, investigations or other controversies related to the issuer, changes in government regulations affecting the issuer or itscompetitive environment and strategic initiatives such as mergers, acquisitions or dispositions and the market response to any suchinitiatives.
Investing in income-oriented stocks — The value of a fund’s securities and income provided by a fundmay be reduced by changes inthe dividend policies of, and the capital resources available for dividend payments at, the companies in which the fund invests.
Investing in growth-oriented stocks — Growth-oriented common stocks and other equity-type securities (such as preferred stocks,convertible preferred stocks and convertible bonds) may involve larger price swings and greater potential for loss than other types ofinvestments. These risks may be even greater in the case of smaller capitalization stocks.
Investing in small companies — Investing in smaller companies may pose additional risks. For example, it is often more difficult to valueor dispose of small company stocks andmore difficult to obtain information about smaller companies than about larger companies.Furthermore, smaller companies often have limited product lines, operating histories, markets and/or financial resources, may bedependent on one or a few key persons for management, and can be more susceptible to losses. Moreover, the prices of their stocksmay be more volatile than stocks of larger, more established companies, particularly during times of market turmoil.

270 American Funds Insurance Series
Investing outside the U.S. — Securities of issuers domiciled outside the U.S., or with significant operations or revenues outside the U.S.,may lose value because of adverse political, social, economic or market developments (including social instability, regional conflicts,terrorism and war) in the countries or regions in which the issuers operate or generate revenue. These securities may also lose valuedue to changes in foreign currency exchange rates against the U.S. dollar and/or currencies of other countries. Issuers of thesesecurities may be more susceptible to actions of foreign governments, such as nationalization, currency blockage or the imposition ofprice controls or punitive taxes, each of which could adversely impact the value of these securities. Securities markets in certaincountries may be more volatile and/or less liquid than those in the U.S. Investments outside the U.S. may also be subject to differentaccounting and auditing practices and standards and different regulatory, legal and reporting requirements, and may be more difficultto value, than those in the U.S. In addition, the value of investments outside the U.S. may be reduced by foreign taxes, including foreignwithholding taxes on interest and dividends. Further, there may be increased risks of delayed settlement of securities purchased or soldby the fund. The risks of investing outside the U.S. may be heightened in connection with investments in emerging markets.
Investing in developing countries — Investing in countries with developing economies and/or markets may involve risks in addition toand greater than those generally associated with investing in developed countries. For instance, emerging market countries tend tohave less developed political, economic and legal systems and accounting and auditing practices and standards than those indeveloped countries. Accordingly, the governments of these countries may be less stable andmore likely to intervene in the marketeconomy, for example, by imposing capital controls, nationalizing a company or industry, placing restrictions on foreign ownership andon withdrawing sale proceeds of securities from the country, and/or imposing punitive taxes that could adversely affect the prices ofsecurities. Information regarding issuers in emerging markets may be limited, incomplete or inaccurate, and there may be fewer rightsand remedies available to the fund and its shareholders. In addition, the economies of these countries may be dependent on relativelyfew industries any may be more susceptible to changes in local and global trade conditions and downturns in the world economy.Securities markets in these countries can also be relatively small and have substantially lower trading volumes. As a result, securitiesissued in these countries may be more volatile and less liquid, and may be more difficult to value, than securities issued in countrieswith more developed economies and/or markets. Less certainty with respect to security valuations may lead to additional challengesand risks in calculating a fund’s net asset value. Additionally, emerging markets are more likely to experience problems with the clearingand settling of trades and the holding of securities by banks, agents and depositories that are less established than those in developedcountries.
Investing in emerging markets — Investing in emerging markets may involve risks in addition to and greater than those generallyassociated with investing in the securities markets of developed countries. For instance, emerging market countries tend to have lessdeveloped political, economic and legal systems and accounting and auditing practices and standards than those in developedcountries. Accordingly, the governments of these countries may be less stable andmore likely to intervene in the market economy, forexample, by imposing capital controls, nationalizing a company or industry, placing restrictions on foreign ownership and onwithdrawing sale proceeds of securities from the country, and/or imposing punitive taxes that could adversely affect the prices ofsecurities. Information regarding issuers in emerging markets may be limited, incomplete or inaccurate, and there may be fewer rightsand remedies available to a fund and its shareholders. In addition, the economies of these countries may be dependent on relativelyfew industries any may be more susceptible to changes in local and global trade conditions and downturns in the world economy.Securities markets in these countries can also be relatively small and have substantially lower trading volumes. As a result, securitiesissued in these countries may be more volatile and less liquid, and may be more difficult to value, than securities issued in countrieswith more developed economies and/or markets. Less certainty with respect to security valuations may lead to additional challengesand risks in calculating a fund’s net asset value. Additionally, emerging markets are more likely to experience problems with the clearingand settling of trades and the holding of securities by banks, agents and depositories that are less established than those in developedcountries.
Investing in debt instruments — The prices of, and the income generated by, bonds and other debt securities held by a fundmay beaffected by factors such as the interest rates, maturities and credit ratings of these securities.
Rising interest rates will generally cause the prices of bonds and other debt securities to fall. A general rise in interest rates may causeinvestors to sell debt securities on a large scale, which could also adversely affect the price and liquidity of debt securities and couldalso result in increased redemptions from a fund. Falling interest rates may cause an issuer to redeem, call or refinance a debt securitybefore its stated maturity, which may result in a fund failing to recoup the full amount of its initial investment and having to reinvest theproceeds in lower yielding securities. Longer maturity debt securities generally have greater sensitivity to changes in interest rates andmay be subject to greater price fluctuations than shorter maturity debt securities.

American Funds Insurance Series 271
Bonds and other debt securities are also subject to credit risk, which is the possibility that the credit strength of an issuer or guarantorwill weaken or be perceived to be weaker, and/or an issuer of a debt security will fail to make timely payments of principal or interestand the security will go into default. A downgrade or default affecting any of a fund’s securities could cause the value of a fund’s sharesto decrease. Lower quality debt securities generally have higher rates of interest and may be subject to greater price fluctuations thanhigher quality debt securities. Credit risk is gauged, in part, by the credit ratings of the debt securities in which a fund invests. However,ratings are only the opinions of the rating agencies issuing them and are not guarantees as to credit quality or an evaluation of marketrisk. The fund’s investment adviser relies on its own credit analysts to research issuers and issues in seeking to assess credit and defaultrisks.
Investing in lower rated debt instruments — Lower rated bonds and other lower rated debt securities generally have higher rates ofinterest and involve greater risk of default or price declines due to changes in the issuer’s creditworthiness than those of higher qualitydebt securities. The market prices of these securities may fluctuate more than the prices of higher quality debt securities and maydecline significantly in periods of general economic difficulty. These risks may be increased with respect to investments in junk bonds.
Investing in derivatives — The use of derivatives involves a variety of risks, which may be different from, or greater than, the risksassociated with investing in traditional securities, such as stocks and bonds. Changes in the value of a derivative may not correlateperfectly with, and may be more sensitive to market events than, the underlying asset, rate or index, and a derivative instrument mayexpose a fund to losses in excess of its initial investment. Derivatives may be difficult to value, difficult for a fund to buy or sell at anopportune time or price and difficult, or even impossible, to terminate or otherwise offset. A fund’s use of derivatives may result inlosses to the fund, and investing in derivatives may reduce a fund’s returns and increase a fund’s price volatility. A fund’s counterparty toa derivative transaction (including, if applicable, the fund’s clearing broker, the derivatives exchange or the clearinghouse) may beunable or unwilling to honor its financial obligations in respect of the transaction. In certain cases, the fundmay be hindered or delayedin exercising remedies against or closing out derivative instruments with a counterparty, which may result in additional losses.
Currency — The prices of, and the income generated by,many debt securities held by a fundmay also be affected by changes in relativecurrency values. If the U.S. dollar appreciates against foreign currencies, the value in U.S. dollars of a fund’s securities denominated insuch currencies would generally fall and vice versa. U.S. dollar-denominated securities of foreign issuers may also be affected bychanges in relative currency values.
Currency transactions — In addition to the risks generally associated with investing in derivative instruments, the use of forward currencycontracts involves the risk that currency movements will not be accurately predicted by the investment adviser, which could result inlosses to a fund.While entering into forward currency contracts could minimize the risk of loss due to a decline in the value of thehedged currency, it could also limit any potential gain that may result from an increase in the value of the currency. Additionally, theadviser may use forward currency contracts to increase exposure to a certain currency or to shift exposure to currency fluctuations fromone country to another. Forward currency contracts may expose a fund to potential gains and losses in excess of the initial amountinvested.
Investing in mortgage-related and other asset-backed securities —Mortgage-related securities, such as mortgage-backed securities,and other asset-backed securities, include debt obligations that represent interests in pools of mortgages or other income-bearingassets, such as consumer loans or receivables.While such securities are subject to the risks associated with investments in debtinstruments generally (for example, credit, extension and interest rate risks), they are also subject to other and different risks.Mortgage-backed and other asset-backed securities are subject to changes in the payment patterns of borrowers of the underlyingdebt, potentially increasing the volatility of the securities and a fund’s net asset value.When interest rates fall, borrowers are more likelyto refinance or prepay their debt before its stated maturity. This may result in a fund having to reinvest the proceeds in lower yieldingsecurities, effectively reducing a fund’s income. Conversely, if interest rates rise and borrowers repay their debt more slowly thanexpected, the time in which the mortgage-backed and other asset-backed securities are paid off could be extended, reducing a fund’scash available for reinvestment in higher yielding securities. Mortgage-backed securities are also subject to the risk that underlyingborrowers will be unable to meet their obligations and the value of property that secures the mortgages may decline in value and beinsufficient, upon foreclosure, to repay the associated loans. Investments in asset-backed securities are subject to similar risks.
Investing in future delivery contracts — A fundmay enter into contracts, such as to-be-announced contracts and mortgage dollar rolls,that involve a fund selling mortgage-related securities and simultaneously contracting to repurchase similar securities for delivery at afuture date at a predetermined price. This can increase a fund’s market exposure, and the market price of the securities that the fundcontracts to repurchase could drop below their purchase price.While a fund can preserve and generate capital through the use of suchcontracts by, for example, realizing the difference between the sale price and the future purchase price, the income generated by thefundmay be reduced by engaging in such transactions. In addition, these transactions increase the turnover rate of a fund.

272 American Funds Insurance Series
Investing in inflation-linked bonds — The values of inflation-linked bonds generally fluctuate in response to changes in real interest rates— i.e., rates of interest after factoring in inflation. A rise in real interest rates may cause the prices of inflation-linked securities to fall, whilea decline in real interest rates may cause the prices to increase. Inflation-linked bonds may experience greater losses than other debtsecurities with similar durations when real interest rates rise faster than nominal interest rates. There can be no assurance that the valueof an inflation-linked security will be directly correlated to changes in interest rates; for example, if interest rates rise for reasons otherthan inflation, the increase may not be reflected in the security’s inflation measure.
Investing in inflation-linked bonds may also reduce a fund’s distributable income during periods of deflation. If prices for goods andservices decline throughout the economy, the principal and income on inflation-linked securities may decline and result in losses to afund.
Investing in securities backed by the U.S. government — Securities backed by the U.S. Treasury or the full faith and credit of the U.S.government are guaranteed only as to the timely payment of interest and principal when held to maturity. Accordingly, the currentmarket values for these securities will fluctuate with changes in interest rates and the credit rating of the U.S. government. Securitiesissued by government-sponsored entities and federal agencies and instrumentalities that are not backed by the full faith and credit ofthe U.S. government are neither issued nor guaranteed by the U.S. government.
Investing in repurchase agreements — Upon entering into a repurchase agreement, a fund purchases a security from a bank orbroker-dealer, which simultaneously commits to repurchase the security within a specified time at the fund’s cost with interest. Thesecurity purchased by the fund constitutes collateral for the seller’s repurchase obligation. If the party agreeing to repurchase shoulddefault, the fundmay seek to sell the security it holds as collateral. The fundmay incur a loss if the value of the collateral securing therepurchase obligation falls below the repurchase price. The fundmay also incur disposition costs and encounter procedural delays inconnection with liquidating the collateral.
Interest rate risk — The values and liquidity of the securities held by a fundmay be affected by changing interest rates. For example, thevalues of these securities may decline when interest rates rise and increase when interest rates fall. Longer maturity debt securitiesgenerally have greater sensitivity to changes in interest rates andmay be subject to greater price fluctuations than shorter maturity debtsecurities. A fundmay invest in variable and floating rate securities.When a fund holds variable or floating rate securities, a decrease inmarket interest rates will adversely affect the income received from such securities and the net asset value of a fund’s shares. Althoughthe values of such securities are generally less sensitive to interest rate changes than those of other debt securities, the value of variableand floating rate securities may decline if their interest rates do not rise as quickly, or as much, as market interest rates. Conversely,floating rate securities will not generally increase in value if interest rates decline. During periods of extremely low short-term interestrates, a fund may not be able to maintain a positive yield and, given the current low interest rate environment, risks associated withrising rates are currently heightened.
Credit and liquidity support — Changes in the credit quality of banks and financial institutions providing credit and liquidity supportfeatures with respect to securities held by a fund could cause the values of these securities to decline.
Asset allocation — A fund’s percentage allocation to equity securities, debt securities and money market instruments could cause thefund to underperform relative to relevant benchmarks and other funds with similar investment objectives.
Nondiversification risk— As nondiversified funds, certain funds have the ability to invest a larger percentage of their assets in thesecurities of a smaller number of issuers than diversified funds. Although the funds do not intend to limit their investments to thesecurities of a small number of issuers, if they were to do so, poor performance by a single large holding could adversely impact thefunds’ investment results more than if the funds were invested in a larger number of issuers.
Liquidity risk — Certain fund holdings may be or may become difficult or impossible to sell, particularly during times of market turmoil.Liquidity may be impacted by the lack of an active market for a holding, legal or contractual restrictions on resale, or the reducednumber and capacity of market participants to make a market in such holding.Market prices for less liquid or illiquid holdings may bevolatile, and reduced liquidity may have an adverse impact on the market price of such holdings. Additionally, the sale of less liquid orilliquid holdings may involve substantial delays (including delays in settlement) and additional costs and the fundmay be unable to sellsuch holdings when necessary to meet its liquidity needs or may be forced to sell at a loss.

American Funds Insurance Series 273
Management — The investment adviser to the funds actively manages the funds’ investments. Consequently, the funds are subject tothe risk that the methods and analyses, including models, tools and data, employed by the investment adviser in this process may beflawed or incorrect and may not produce the desired results. This could cause the funds to lose value or their investment results to lagrelevant benchmarks or other funds with similar objectives.
Investing in the managed risk funds may involve additional risks including, but not limited to, those described below.
Fund structure — The managed risk funds invest in underlying funds and incur expenses related to those underlying funds. In addition,investors in the managed risk funds will incur fees to pay for certain expenses related to the operations of the managed risk funds. Aninvestor holding the underlying fund directly would incur lower overall expenses but would not receive the benefit of the managed riskstrategy. Additionally, in accordance with an exemption under the 1940 Act, the investment adviser considers only proprietary fundswhen selecting underlying investment options and allocations. This means that the fund’s investment adviser did not, nor does it expectto, consider any unaffiliated funds as underlying investment options for the fund. This strategy could raise certain conflicts of interestwhen choosing underlying investments for the fund, including the selection of funds that result in greater compensation to the adviseror funds with relatively lower historical investment results. The investment adviser has policies and procedures designed to mitigatematerial conflicts of interest that may arise in connection with its management of the fund.
Management — The managed risk funds are subject to the risk that the managed risk strategy or the methods employed by thesubadviser in implementing the managed risk strategy may not produce the desired results. This could cause the managed risk funds tolose value or their investment results to lag relevant benchmarks or other funds with similar objectives.
Underlying fund risks — Because the managed risk funds’ investments consist of investments in underlying funds, the managed riskfunds’ risks are directly related to the risks of the respective underlying fund in which each managed risk fund invests. For this reason, itis important to understand the risks associated with investing both in the managed risk fund and in each of the underlying funds.
Investing in options and futures contracts — In addition to the risks generally associated with investing in derivative instruments, optionsand futures contracts are subject to the creditworthiness of the clearing organizations, exchanges and, in the case of futures, futurescommission merchants with which a fund transacts. Additionally, although futures require only a small initial investment in the form of adeposit of initial margin, the amount of a potential loss on a futures contract could greatly exceed the initial amount invested.Whileboth options and futures contracts are generally liquid instruments, under certain market conditions, options and futures may bedeemed to be illiquid. For example, a fund may be temporarily prohibited from closing out its position in an options or futures contractif intraday price change limits or limits on trading volume imposed by the applicable exchange are triggered. If a fund is unable to closeout a position on an options or futures contract, the fund would remain subject to the risk of adverse price movements until the fund isable to close out the position in question. The ability of a fund to successfully utilize options and futures contracts may depend in partupon the ability of the fund’s investment adviser or subadviser to accurately forecast interest rates and other economic factors and toassess and predict the impact of such economic factors on the options and futures in which the fund invests. If the investment adviser orsubadviser incorrectly forecasts economic developments or incorrectly predicts the impact of such developments on the options andfutures in which it invests, a fund could be exposed to the risk of loss.Whereas the risk of loss on a put option purchased by the fund islimited to the initial cost of the option, the amount of a potential loss on a futures contract could greatly exceed the relatively small initialamount invested in entering the futures position.
Hedging — There may be imperfect or even negative correlation between the prices of the options and futures contracts in which a fundinvests and the prices of the underlying securities or indexes which the fund seeks to hedge. For example, options and futures contractsmay not provide an effective hedge because changes in options and futures contract prices may not track those of the underlyingsecurities or indexes they are intended to hedge. In addition, there are significant differences between the securities market, on the onehand, and the options and futures markets, on the other, that could result in an imperfect correlation between the markets, causing agiven hedge not to achieve its objectives. The degree of imperfection of correlation depends on circumstances such as variations inspeculative market demand for options and futures, including technical influences in options and futures trading, and differencesbetween the financial instruments being hedged and the instruments underlying the standard contracts available for trading. Adecision as to whether, when and how to hedge involves the exercise of skill and judgment, and even a well-conceived hedgemay beunsuccessful to some degree because of market behavior or unexpected interest rate trends. In addition, the fund’s investment inexchange-traded options and futures and their resulting costs could limit the fund’s gains in rising markets relative to those of theunderlying funds, or to those of unhedged funds in general.

274 American Funds Insurance Series
Short positions — Losses from short positions in futures contracts occur when the underlying index increases in value. As the underlyingindex increases in value, the holder of the short position in the corresponding futures contract is required to pay the difference in valueof the futures contract resulting from the increase in the index on a daily basis. Losses from a short position in an index futures contractcould potentially be very large if the value of the underlying index rises dramatically in a short period of time.
5. Certain investment techniques
Securities lending — Some of the funds have entered into securities lending transactions in which the funds earn income by lendinginvestment securities to brokers, dealers or other institutions. Each transaction involves three parties: the fund, acting as the lender ofthe securities, a borrower, and a lending agent that acts as an intermediary.
Securities lending transactions are entered into by the fund under the securities lending agreement with the lending agent. The lendingagent facilitates the exchange of securities between the lender and the borrower, generally provides protection from borrower default,marks to market the value of collateral daily, secures additional collateral from the borrower if it falls below preset terms, and mayreinvest the collateral on behalf of the fund according to agreed parameters. The lending agent has indemnified the fund against lossesresulting from borrower default. Although risk is mitigated by the collateral and indemnification, the fund could experience a delay inrecovering its securities and a potential loss of income or value if the borrower fails to return the securities, collateral investmentsdecline in value or the lending agent fails to perform.
The borrower is required to post highly liquid assets, such as cash or U.S. government securities, as collateral for the loan in an amountat least equal to the value of the securities loaned. Investments made with cash collateral are recognized as assets in the fund’sinvestment portfolio. The same amount is recorded as a liability in the fund’s statement of assets and liabilities.While securities are onloan, the fund will continue to receive the equivalent of the interest, dividends or other distributions paid by the issuer, as well as aportion of the interest on the investment of the collateral. Additionally, although the fund does not have the right to vote on securitieswhile they are on loan, the fund has a right to consent on corporate actions and a right to recall loaned securities to vote on proposalsaffecting them. The borrower is obligated to return the loaned security at the conclusion of the loan or, during the pendency of theloan, on demand from the fund.
The following table presents the value of the securities on loan, the type and value of collateral received and the value of theinvestment securities purchased, if any, from the cash collateral received by each fund (dollars in thousands):
Collateral received
Funds
Value ofsecuritieson loan Cash
U.S. governmentsecurities
Value ofinvestmentsecuritiespurchased
Global Growth Fund $43,575 $44,595 $ 37 $40,135Global Small Capitalization Fund 83,042 83,273 4,999 74,946Growth Fund 38,885 39,687 — 35,718International Fund 18,837 18,284 1,327 16,456NewWorld Fund 11,836 3,178 9,205 2,860Washington Mutual Investors Fund 73,663 75,183 — 67,665Capital World Growth and Income Fund 12,432 12,943 — 11,649Growth-Income Fund 75,628 77,195 — 69,475International Growth and Income Fund 671 705 — 634Capital Income Builder 638 651 — 586Asset Allocation Fund 25,453 26,046 — 23,441
Investment securities purchased from cash collateral are disclosed in the investment portfolio as short-term securities. Securitiesreceived as collateral, if any, are not recognized as fund assets. The contractual maturity of collateral received under the securitieslending agreement is classified as overnight and continuous.
Index-linked bonds — Some of the funds have invested in index-linked bonds, which are fixed-income securities whose principal valueis periodically adjusted to a government price index. Over the life of an index-linked bond, interest is paid on the adjusted principalvalue. Increases or decreases in the principal value of index-linked bonds are recorded as interest income in the fund’s statement ofoperations.

American Funds Insurance Series 275
Mortgage dollar rolls — Some of the funds have entered into mortgage dollar roll transactions in which the fund sells a mortgage-backed security to a counterparty and simultaneously enters into an agreement with the same counterparty to buy back a similarsecurity on a specific future date at a predetermined price. Mortgage dollar rolls are accounted for as purchase and sale transactions,which may increase the funds’ portfolio turnover rates.
Loan transactions — Some of the funds have entered into loan transactions in which the fund acquires a loan either through an agent, byassignment from another holder, or as a participation interest in another holder’s portion of a loan. The loan is often administered by afinancial institution that acts as agent for the holders of the loan, and the fundmay be required to receive approval from the agentand/or borrower prior to the sale of the investment. The loan’s interest rate andmaturity date may change based on the terms of theloan, including potential early payments of principal.
Short-term securities — The managed risk funds hold shares of State Street Institutional U.S. Government Money Market Fund, a cashmanagement vehicle offered andmanaged by State Street Bank and Trust Company.
Unfunded commitments — Asset Allocation Fund, Capital World Bond Fund and American High-Income Trust have participated intransactions that involve unfunded commitments, which may obligate each fund to purchase new or additional bonds and/or purchaseadditional shares of the applicable issuer if certain contingencies are met. As of June 30, 2021, the maximum exposure from theseunfunded commitments for Asset Allocation Fund, Capital World Bond Fund and American High-Income Trust was $187,000, $28,000and $62,000, respectively, which would represent 0.01%, less than 0.01% and less than 0.01%, respectively, of the net assets of eachfund should such commitments become due.
Options contracts — The managed risk funds have entered into options contracts, which give the holder of the option, in return for apremium payment, the right to buy from (in the case of a call) or sell to (in the case of a put) the writer of the option, the securityunderlying the option (or the cash value of the index underlying the option) at a specified price. As part of their managed risk strategy,the funds will at times purchase put options on equity indexes in standardized contracts traded on foreign or domestic securitiesexchanges, boards of trade, or similar entities. By purchasing a put option on an equity index, the funds obtain the right (but not theobligation) to sell the cash value of the index underlying the option at a specified exercise price, and in return for this right, the fundspay the current market price, or the option premium, for the option.
The funds may terminate their position in a put option by allowing the option to expire or by exercising the option. If the option isallowed to expire, the funds will lose the entire premium. If the option is exercised, the funds complete the sale of the underlyinginstrument (or delivers the cash value of the index underlying the option) at the exercise price. The funds may also terminate a putoption position by entering into opposing close-out transactions in advance of the option expiration date.
Premiums paid on options purchased, as well as the daily fluctuation in market value, are included in investment securities fromunaffiliated issuers in each fund’s statement of assets and liabilities. Realized gains or losses are recorded at the time the option contractis closed or expires. Net realized gains or losses and net unrealized appreciation or depreciation from options contracts are recorded ininvestments in unaffiliated issuers in each fund’s statement of operations.
Futures contracts — Some of the funds have entered into futures contracts, which provide for the future sale by one party and purchaseby another party of a specified amount of a specific financial instrument for a specified price, date, time and place designated at thetime the contract is made. Futures contracts are used to strategically manage the fund’s interest rate sensitivity by increasing ordecreasing the duration of the fund or a portion of the fund’s portfolio. For the managed risk funds, futures contracts are used tostrategically manage portfolio volatility and downside equity risk.
Upon entering into futures contracts, and to maintain the fund’s open positions in futures contracts, the fund is required to deposit witha futures broker, known as a futures commission merchant (“FCM“), in a segregated account in the name of the FCM an amount of cash,U.S. government securities or other liquid securities, known as initial margin. The margin required for a particular futures contract is setby the exchange on which the contract is traded to serve as collateral, and may be significantly modified from time to time by theexchange during the term of the contract.
On a daily basis, each fund pays or receives variation margin based on the increase or decrease in the value of the futures contracts andrecords variation margin on futures contracts in each fund’s statement of assets and liabilities. In addition, each fund segregates liquidassets equivalent to the fund’s outstanding obligations under the contract in excess of the initial margin and variation margin, if any.Futures contracts may involve a risk of loss in excess of the variation margin shown on each fund’s statement of assets and liabilities.

276 American Funds Insurance Series
Each fund records realized gains or losses at the time the futures contract is closed or expires. Net realized gains or losses and netunrealized appreciation or depreciation from futures contracts are recorded in each fund’s statement of operations.
Forward currency contracts — Some of the funds have entered into forward currency contracts, which represent agreements toexchange currencies on specific future dates at predetermined rates. The series’ investment adviser uses forward currency contracts tomanage the fund’s exposure to changes in exchange rates. Upon entering into these contracts, risks may arise from the potentialinability of counterparties to meet the terms of their contracts and from possible movements in exchange rates.
On a daily basis, the series’ investment adviser values forward currency contracts based on the applicable exchange rates and recordsunrealized appreciation or depreciation for open forward currency contracts in each fund’s statement of assets and liabilities. Realizedgains or losses are recorded at the time the forward contract is closed or offset by another contract with the same broker for the samesettlement date and currency. Closed forward currency contracts that have not reached their settlement date are included in therespective receivables or payables for closed forward currency contracts in each fund’s statement of assets and liabilities. Net realizedgains or losses from closed forward currency contracts and net unrealized appreciation or depreciation from open forward currencycontracts are recorded in each fund’s statement of operations.
Interest rate swaps — Some of the funds have entered into interest rate swaps, which are agreements to exchange one stream of futureinterest payments for another based on a specified notional amount. Typically, interest rate swaps exchange a fixed interest rate for apayment that floats relative to a benchmark or vice versa. The series’ investment adviser uses interest rate swaps to manage the interestrate sensitivity of the fund by increasing or decreasing the duration of the fund or a portion of the fund’s portfolio. Risks may arise as aresult of the series’ investment adviser incorrectly anticipating changes in interest rates, increased volatility, reduced liquidity and thepotential inability of counterparties to meet the terms of their agreements.
Upon entering into an interest rate swap contract, the fund is required to deposit cash, U.S. government securities or other liquidsecurities, which is known as initial margin. Generally, the initial margin required for a particular interest rate swap is set and held ascollateral by the clearinghouse on which the contract is cleared. The amount of initial margin required may be significantly modifiedfrom time to time by the clearinghouse during the term of the contract.
On a daily basis, the series’ investment adviser records daily interest accruals related to the exchange of future payments as a receivableand payable in each fund’s statement of assets and liabilities. Each fund also pays or receives a variation margin based on the increaseor decrease in the value of the interest rate swaps, including accrued interest, and records variation margin on interest rate swaps ineach fund’s statement of assets and liabilities. Each fund records realized gains and losses on both the net accrued interest and anygain or loss recognized at the time the interest rate swap is closed or expires. Net realized gains or losses, as well as any net unrealizedappreciation or depreciation, from interest rate swaps are recorded in each fund’s statement of operations.
Credit default swap indices — Some of the funds have entered into centrally cleared credit default swap agreements on credit indices(“CDSI”) that involve one party (the protection buyer) making a stream of payments to another party (the protection seller) in exchangefor the right to receive a specified return upon the occurrence of a credit event, such as a default or restructuring, with respect to any ofthe underlying issuers (reference obligations) in the referenced index. The series’ investment adviser uses credit default swaps toassume exposure to a diversified portfolio of credits or to hedge against existing credit risks.
CDSI are portfolios of credit instruments or exposures designed to be representative of some part of the credit market, such as thehigh-yield or investment-grade credit market. CDSI are generally traded using standardized terms, including a fixed spread andstandard maturity dates, and reference all the names in the index. If there is a credit event, it is settled based on that name’s weight inthe index. The composition of the underlying issuers or obligations within a particular index may change periodically, usually every sixmonths. A specified credit event may affect all or individual underlying reference obligations included in the index, and will be settledbased upon the relative weighting of the affected obligation(s) within the index. The value of each CDSI can be used as a measure ofthe current payment/performance risk of the CDSI and represents the likelihood of an expected liability or profit should the notionalamount of the CDSI be closed or sold as of the period end. An increasing value, as compared to the notional amount of the CDSI,represents a deterioration of the referenced indices’ credit soundness and a greater likelihood of risk of default or other credit eventoccurring as defined under the terms of the agreement.When a fund provides sell protection, its maximum exposure is the notionalamount of the credit default swap agreement.

American Funds Insurance Series 277
Upon entering into a centrally cleared CDSI contract, the fund is required to deposit with a derivatives clearing member (“DCM”) in asegregated account in the name of the DCM an amount of cash, U.S. government securities or other liquid securities, which is known asinitial margin. Generally, the initial margin required for a particular credit default swap is set and held as collateral by the clearinghouseon which the contract is cleared. The amount of initial margin required may be significantly modified from time to time by theclearinghouse during the term of the contract. Securities deposited as initial margin are designated on the investment portfolio.
On a daily basis, interest accruals related to the exchange of future payments are recorded as a receivable and payable in each fund’sstatement of assets and liabilities. Each fund also pays or receives a variation margin based on the increase or decrease in the value ofthe centrally cleared swaps, and records variation margin in each fund’s statement of assets and liabilities. Each fund records realizedgains and losses on both the net accrued interest and any gain or loss recognized at the time the swap is closed or expires. Net realizedgains or losses, as well as any net unrealized appreciation or depreciation, from credit default swaps are recorded in each fund’sstatement of operations.
The following table presents the average month-end notional amounts of options contracts purchased, futures contracts, forwardcurrency contracts, interest rate swaps and credit default swaps while held for each fund (dollars in thousands):
Optionscontracts
purchasedFutures
contracts
Forwardcurrencycontracts
Interestrate
swaps
Creditdefaultswaps
NewWorld Fund Not applicable $ 4,542 $ 3,375 Not applicable Not applicableCapital Income Builder Not applicable 44,913 592 $ 46,133 $ 3,332Asset Allocation Fund Not applicable 1,197,946 Not applicable 89,617 117,516Global Balanced Fund Not applicable 33,277 29,902 8,158 2,562The Bond Fund of America Not applicable 4,115,606 345,829 774,224 109,530Capital World Bond Fund Not applicable 568,310 564,904 97,051 57,819American High-Income Trust Not applicable 55,713 Not applicable Not applicable 39,045American Funds Mortgage Fund Not applicable 48,283 Not applicable 60,817 Not applicableU.S. Government Securities Fund Not applicable 1,611,010 Not applicable 1,356,334 Not applicableManaged Risk Growth Fund $ 5,123 103,958 Not applicable Not applicable Not applicableManaged Risk International Fund 1,277 238,049 Not applicable Not applicable Not applicableManaged Risk Washington Mutual Investors Fund 3,674 69,045 Not applicable Not applicable Not applicableManaged Risk Growth-Income Fund 53,872 312,170 Not applicable Not applicable Not applicableManaged Risk Asset Allocation Fund 5,776 340,005 Not applicable Not applicable Not applicable
The following tables identify the location and fair value amounts on the funds’ statements of assets and liabilities and/or the effect onthe funds’ statements of operations resulting from the funds’ use of options, futures contracts, forward currency contracts, interest rateswaps and/or credit default swaps as of, or for the six months ended June 30, 2021 (dollars in thousands):
International Fund
Net realized loss Net unrealized appreciation
Contracts Risk typeLocation on statement ofoperations Value
Location on statement ofoperations Value
Forward currency Currency Net realized loss on forwardcurrency contracts
$(86) Net unrealized appreciation onforward currency contracts
$86
See end of tables for footnotes.

278 American Funds Insurance Series
NewWorld Fund
Assets Liabilities
Contracts Risk typeLocation on statement ofassets and liabilities Value
Location on statement ofassets and liabilities Value
Futures Interest Unrealized appreciation1 $147 Unrealized depreciation1 $157
Forward currency Currency Unrealized appreciation on openforward currency contracts
69 Unrealized depreciation on openforward currency contracts
—
$216 $157
Net realized loss Net unrealized appreciation
Contracts Risk typeLocation on statement ofoperations Value
Location on statement ofoperations Value
Futures Interest Net realized loss on futurescontracts
$(101) Net unrealized appreciation onfutures contracts
$ —
Forward currency Currency Net realized loss on forwardcurrency contracts
(8) Net unrealized appreciation onforward currency contracts
123
$(109) $123
Capital Income Builder
Assets Liabilities
Contracts Risk typeLocation on statement ofassets and liabilities Value
Location on statement ofassets and liabilities Value
Futures Interest Unrealized appreciation1 $ 522 Unrealized depreciation1 $48
Forward currency Currency Unrealized appreciation on openforward currency contracts
— Unrealized depreciation on openforward currency contracts
1
Swap Interest Unrealized appreciation1 1,167 Unrealized depreciation1 —
Swap Credit Unrealized appreciation1 39 Unrealized depreciation1 —
$1,728 $49
Net realized (loss) gain Net unrealized appreciation (depreciation)
Contracts Risk typeLocation on statement ofoperations Value
Location on statement ofoperations Value
Futures Interest Net realized loss on futurescontracts
$(1,194) Net unrealized appreciation onfutures contracts
$ 524
Forward currency Currency Net realized loss on forwardcurrency contracts
(17) Net unrealized appreciation onforward currency contracts
21
Swap Interest Net realized gain on swapcontracts
371 Net unrealized appreciation onswap contracts
598
Swap Credit Net realized gain on swapcontracts
239 Net unrealized depreciation onswap contracts
(113)
$ (601) $1,030
See end of tables for footnotes.

American Funds Insurance Series 279
Asset Allocation Fund
Assets Liabilities
Contracts Risk typeLocation on statement ofassets and liabilities Value
Location on statement ofassets and liabilities Value
Futures Interest Unrealized appreciation1 $ 901 Unrealized depreciation1 $4,764
Swap Interest Unrealized appreciation1 862 Unrealized depreciation1 —
Swap Credit Unrealized appreciation1 — Unrealized depreciation1 382
$1,763 $5,146
Net realized (loss) gain Net unrealized (depreciation) appreciation
Contracts Risk typeLocation on statement ofoperations Value
Location on statement ofoperations Value
Futures Interest Net realized loss on futurescontracts
$ (916) Net unrealized depreciation onfutures contracts
$(3,091)
Swap Interest Net realized gain on swapcontracts
1,076 Net unrealized appreciation onswap contracts
66
Swap Credit Net realized loss on swapcontracts
(1,306) Net unrealized depreciation onswap contracts
(382)
$(1,146) $(3,407)
Global Balanced Fund
Assets Liabilities
Contracts Risk typeLocation on statement ofassets and liabilities Value
Location on statement ofassets and liabilities Value
Futures Interest Unrealized appreciation1 $ 12 Unrealized depreciation1 $ 40
Forward currency Currency Unrealized appreciation on openforward currency contracts
193 Unrealized depreciation on openforward currency contracts
217
Swap Interest Unrealized appreciation1 13 Unrealized depreciation1 51
Swap Credit Unrealized appreciation1 — Unrealized depreciation1 5
$218 $313
Net realized gain (loss) Net unrealized depreciation
Contracts Risk typeLocation on statement ofoperations Value
Location on statement ofoperations Value
Futures Interest Net realized gain on futurescontracts
$ 160 Net unrealized depreciation onfutures contracts
$ (31)
Forward currency Currency Net realized loss on forwardcurrency contracts
(485) Net unrealized depreciation onforward currency contracts
(22)
Swap Interest Net realized gain on swapcontracts
17 Net unrealized depreciation onswap contracts
(59)
Swap Credit Net realized loss on swapcontracts
(15) Net unrealized depreciation onswap contracts
(5)
$(323) $(117)
See end of tables for footnotes.

280 American Funds Insurance Series
The Bond Fund of America
Assets Liabilities
Contracts Risk typeLocation on statement ofassets and liabilities Value
Location on statement ofassets and liabilities Value
Futures Interest Unrealized appreciation1 $15,162 Unrealized depreciation1 $21,263
Forward currency Currency Unrealized appreciation on openforward currency contracts
97 Unrealized depreciation on openforward currency contracts
8
Swap Interest Unrealized appreciation1 — Unrealized depreciation1 11,390
Swap Credit Unrealized appreciation1 88 Unrealized depreciation1 —
$15,347 $32,661
Net realized gain (loss) Net unrealized (depreciation) appreciation
Contracts Risk typeLocation on statement ofoperations Value
Location on statement ofoperations Value
Futures Interest Net realized gain on futurescontracts
$ 20,928 Net unrealized depreciation onfutures contracts
$(12,908)
Forward currency Currency Net realized gain on forwardcurrency contracts
5,716 Net unrealized appreciation onforward currency contracts
2,696
Swap Interest Net realized loss on swapcontracts
(15,071) Net unrealized appreciation onswap contracts
13,671
Swap Credit Net realized gain on swapcontracts
120 Net unrealized appreciation onswap contracts
88
$ 11,693 $ 3,547
Capital World Bond Fund
Assets Liabilities
Contracts Risk typeLocation on statement ofassets and liabilities Value
Location on statement ofassets and liabilities Value
Futures Interest Unrealized appreciation1 $ 730 Unrealized depreciation1 $ 981
Forward currency Currency Unrealized appreciation on openforward currency contracts
2,433 Unrealized depreciation on openforward currency contracts
8,434
Swap Interest Unrealized appreciation1 276 Unrealized depreciation1 804
Swap Credit Unrealized appreciation1 — Unrealized depreciation1 205
$3,439 $10,424
Net realized loss Net unrealized (depreciation) appreciation
Contracts Risk typeLocation on statement ofoperations Value
Location on statement ofoperations Value
Futures Interest Net realized loss on futurescontracts
$ (2,448) Net unrealized depreciation onfutures contracts
$ (404)
Forward currency Currency Net realized loss on forwardcurrency contracts
(12,193) Net unrealized depreciation onforward currency contracts
(6,357)
Swap Interest Net realized loss on swapcontracts
(146) Net unrealized depreciation onswap contracts
(464)
Swap Credit Net realized loss on swapcontracts
(916) Net unrealized appreciation onswap contracts
462
$(15,703) $(6,763)
See end of tables for footnotes.

American Funds Insurance Series 281
American High-Income Trust
Assets Liabilities
Contracts Risk typeLocation on statement ofassets and liabilities Value
Location on statement ofassets and liabilities Value
Futures Interest Unrealized appreciation1 $— Unrealized depreciation1 $234
Swap Credit Unrealized appreciation1 — Unrealized depreciation1 219
$— $453
Net realized gain (loss) Net unrealized (depreciation) appreciation
Contracts Risk typeLocation on statement ofoperations Value
Location on statement ofoperations Value
Futures Interest Net realized gain on futurescontracts
$ 628 Net unrealized depreciation onfutures contracts
$(215)
Swap Credit Net realized loss on swapcontracts
(2,192) Net unrealized appreciation onswap contracts
502
$(1,564) $ 287
American Funds Mortgage Fund
Assets Liabilities
Contracts Risk typeLocation on statement ofassets and liabilities Value
Location on statement ofassets and liabilities Value
Futures Interest Unrealized appreciation1 $ 45 Unrealized depreciation1 $270
Swap Interest Unrealized appreciation1 2,072 Unrealized depreciation1 —
$2,117 $270
Net realized gain Net unrealized (depreciation) appreciation
Contracts Risk typeLocation on statement ofoperations Value
Location on statement ofoperations Value
Futures Interest Net realized gain on futurescontracts
$ 984 Net unrealized depreciation onfutures contracts
$(258)
Swap Interest Net realized gain on swapcontracts
292 Net unrealized appreciation onswap contracts
858
$1,276 $ 600
See end of tables for footnotes.

282 American Funds Insurance Series
U.S. Government Securities Fund
Assets Liabilities
Contracts Risk typeLocation on statement ofassets and liabilities Value
Location on statement ofassets and liabilities Value
Futures Interest Unrealized appreciation1 $2,742 Unrealized depreciation1 $ 4,263
Swap Interest Unrealized appreciation1 5,702 Unrealized depreciation1 10,883
$8,444 $15,146
Net realized gain Net unrealized depreciation
Contracts Risk typeLocation on statement ofoperations Value
Location on statement ofoperations Value
Futures Interest Net realized gain on futurescontracts
$ 5,073 Net unrealized depreciation onfutures contracts
$ (1,481)
Swap Interest Net realized gain on swapcontracts
48,313 Net unrealized depreciation onswap contracts
(32,661)
$53,386 $(34,142)
Managed Risk Growth Fund
Assets Liabilities
Contracts Risk typeLocation on statement ofassets and liabilities Value
Location on statement ofassets and liabilities Value
Options purchased Equity Investment securities fromunaffiliated issuers3
$2,241 Investment securities fromunaffiliated issuers
$ —
Futures Equity Unrealized appreciation1 378 Unrealized depreciation1 —
Futures Interest Unrealized appreciation1 — Unrealized depreciation1 (135)
$2,619 $(135)
Net realized gain (loss) Net unrealized (depreciation) appreciation
Contracts Risk typeLocation on statement ofoperations Value
Location on statement ofoperations Value
Options purchased Equity Net realized gain on investmentsin unaffiliated issuers
$ — Net unrealized depreciation oninvestments in unaffiliated issuers
$(671)
Futures Currency Net realized gain on futurescontracts
31 Net unrealized appreciation onfutures contracts
—
Futures Equity Net realized loss on futurescontracts
(12,919) Net unrealized appreciation onfutures contracts
378
Futures Interest Net realized loss on futurescontracts
(380) Net unrealized depreciation onfutures contracts
(204)
$(13,268) $(497)
See end of tables for footnotes.

American Funds Insurance Series 283
Managed Risk International Fund
Assets Liabilities
Contracts Risk typeLocation on statement ofassets and liabilities Value
Location on statement ofassets and liabilities Value
Options purchased Equity Investment securities fromunaffiliated issuers3
$600 Investment securities fromunaffiliated issuers
$ —
Futures Equity Unrealized appreciation1 — Unrealized depreciation1 (124)
Futures Interest Unrealized appreciation1 — Unrealized depreciation1 (33)
$600 $(157)
Net realized gain (loss) Net unrealized depreciation
Contracts Risk typeLocation on statement ofoperations Value
Location on statement ofoperations Value
Options purchased Equity Net realized gain on investmentsin unaffiliated issuers
$ — Net unrealized depreciation oninvestments in unaffiliated issuers
$ (72)
Futures Currency Net realized gain on futurescontracts
130 Net unrealized appreciation onfutures contracts
$ —
Futures Equity Net realized loss on futurescontracts
(1,221) Net unrealized depreciation onfutures contracts
(124)
Futures Interest Net realized loss on futurescontracts
(101) Net unrealized depreciation onfutures contracts
(54)
$(1,192) $(250)
Managed RiskWashingtonMutual Investors Fund
Assets Liabilities
Contracts Risk typeLocation on statement ofassets and liabilities Value
Location on statement ofassets and liabilities Value
Options purchased Equity Investment securities fromunaffiliated issuers3
$1,660 Investment securities fromunaffiliated issuers
$ —
Futures Equity Unrealized appreciation1 285 Unrealized depreciation1 —
Futures Interest Unrealized appreciation1 — Unrealized depreciation1 (83)
$1,945 $(83)
Net realized gain (loss) Net unrealized (depreciation) appreciation
Contracts Risk typeLocation on statement ofoperations Value
Location on statement ofoperations Value
Options purchased Equity Net realized gain on investmentsin unaffiliated issuers
$ — Net unrealized depreciation oninvestments in unaffiliated issuers
$(456)
Futures Currency Net realized gain on futurescontracts
6 Net unrealized appreciation onfutures contracts
—
Futures Equity Net realized loss on futurescontracts
(7,660) Net unrealized appreciation onfutures contracts
285
Futures Interest Net realized loss on futurescontracts
(409) Net unrealized depreciation onfutures contracts
(121)
$(8,063) $(292)
See end of tables for footnotes.

284 American Funds Insurance Series
Managed Risk Growth-Income Fund
Assets Liabilities
Contracts Risk typeLocation on statement ofassets and liabilities Value
Location on statement ofassets and liabilities Value
Options purchased Equity Investment securities fromunaffiliated issuers3
$ 9,444 Investment securities fromunaffiliated issuers
$ —
Futures Equity Unrealized appreciation1 1,597 Unrealized depreciation1 —
Futures Interest Unrealized appreciation1 — Unrealized depreciation1 (608)
$11,041 $(608)
Net realized (loss) gain Net unrealized appreciation (depreciation)
Contracts Risk typeLocation on statement ofoperations Value
Location on statement ofoperations Value
Options purchased Equity Net realized loss on investments inunaffiliated issuers
$(43,319) Net unrealized appreciation oninvestments in unaffiliated issuers
$ 772
Futures Currency Net realized gain on futurescontracts
132 Net unrealized appreciation onfutures contracts
—
Futures Equity Net realized loss on futurescontracts
(2,180) Net unrealized depreciation onfutures contracts
(1,040)
Futures Interest Net realized loss on futurescontracts
(1,816) Net unrealized depreciation onfutures contracts
(949)
$(47,183) $(1,217)
Managed Risk Asset Allocation Fund
Assets Liabilities
Contracts Risk typeLocation on statement ofassets and liabilities Value
Location on statement ofassets and liabilities Value
Options purchased Equity Investment securities fromunaffiliated issuers3
$2,562 Investment securities fromunaffiliated issuers
$ —
Futures Equity Unrealized appreciation1 419 Unrealized depreciation1 —
Futures Interest Unrealized appreciation1 — Unrealized depreciation1 (540)
$2,981 $(540)
Net realized gain (loss) Net unrealized (depreciation) appreciation
Contracts Risk typeLocation on statement ofoperations Value
Location on statement ofoperations Value
Options purchased Equity Net realized gain on investmentsin unaffiliated issuers
$ — Net unrealized depreciation oninvestments in unaffiliated issuers
$ (741)
Futures Currency Net realized gain on futurescontracts
191 Net unrealized appreciation onfutures contracts
—
Futures Equity Net realized loss on futurescontracts
(20,861) Net unrealized appreciation onfutures contracts
419
Futures Interest Net realized loss on futurescontracts
(1,953) Net unrealized depreciation onfutures contracts
(898)
$(22,623) $(1,220)
1Includes cumulative appreciation/depreciation on futures contracts, interest rate swaps and/or credit default swaps as reported in the applicable tablefollowing each fund’s investment portfolio. Only current day’s variation margin is reported within each fund’s statement of assets and liabilities.
2Amount less than one thousand.3Includes options purchased as reported in the fund’s investment portfolio.

American Funds Insurance Series 285
Collateral — Some funds participate in a collateral program that calls for the funds to either receive or pledge highly liquid assets, suchas cash or U.S. government securities, as collateral due to securities lending and/or their use of futures contracts, forward currencycontracts, interest rate swaps, credit default swaps and/or future delivery contracts. For securities lending, each participating fundreceives collateral in exchange for lending investment securities. The lending agent may reinvest collateral from securities lendingtransactions according to agreed parameters. For futures contracts, interest rate swaps and credit default swaps, the program calls foreach participating fund to pledge collateral for initial and variation margin by contract. For forward currency contracts, the program callsfor each participating fund to either receive or pledge collateral based on the net gain or loss on unsettled forward currency contractsby counterparty. For future delivery contracts, the program calls for each participating fund to either receive or pledge collateral basedon the net gain or loss on unsettled contracts by certain counterparties. The purpose of the collateral is to cover potential losses thatcould occur in the event that either party cannot meet its contractual obligation. Non-cash collateral pledged by each participatingfund, if any, is disclosed in each fund’s investment portfolio, and cash collateral pledged by each participating fund, if any, is held in asegregated account with the fund’s custodian, which is reflected as pledged cash collateral in each fund’s statement of assets andliabilities.
Rights of offset — Funds that hold forward currency contracts have enforceable master netting agreements with certain counterparties,where amounts payable by each party to the other in the same currency (with the same settlement date and with the same counter-party) are settled net of each party’s payment obligation. If an early termination date occurs under these agreements following an eventof default or termination event, all obligations of each party to its counterparty are settled net through a single payment in a singlecurrency (“close-out netting“). For financial reporting purposes, the funds do not offset financial assets and financial liabilities that aresubject to these master netting arrangements in the statements of assets and liabilities.
The following tables present each fund’s forward currency contracts by counterparty that are subject to master netting agreements butthat are not offset in the funds’ statements of assets and liabilities. The net amount column shows the impact of offsetting on the funds’statement of assets and liabilities as of June 30, 2021, if close-out netting was exercised (dollars in thousands):
NewWorld Fund
Counterparty
Gross amountsrecognized in the
statement of assetsand liabilities
Gross amounts not offset in thestatement of assets and liabilities andsubject to a master netting agreement
Netamount
Availableto offset
Non-cashcollateral*
Cashcollateral*
Assets:Citibank $69 $— $— $— $69
Capital Income Builder
Counterparty
Gross amountsrecognized in the
statement of assetsand liabilities
Gross amounts not offset in thestatement of assets and liabilities andsubject to a master netting agreement
Netamount
Availableto offset
Non-cashcollateral*
Cashcollateral*
Liabilities:HSBC Bank $1 $— $— $— $1
See end of tables for footnote.

286 American Funds Insurance Series
Global Balanced Fund
Counterparty
Gross amountrecognized in the
statement of assetsand liabilities
Gross amounts not offset in thestatement of assets and liabilities andsubject to a master netting agreement
Netamount
Availableto offset
Non-cashcollateral*
Cashcollateral*
Assets:Bank of America $ 10 $(10) $— $— $ —Bank of New York Mellon 12 — — — 12Citibank 2 (2) — — —Goldman Sachs 27 (26) — — 1HSBC Bank 61 (12) — — 49Morgan Stanley 29 (4) — — 25Standard Chartered Bank 29 (22) — — 7UBS AG 23 — — — 23
Total $193 $(76) $— $— $117
Liabilities:Bank of America $ 20 $(10) $— $— $ 10Citibank 133 (2) — — 131Goldman Sachs 26 (26) — — —HSBC Bank 12 (12) — — —Morgan Stanley 4 (4) — — —Standard Chartered Bank 22 (22) — — —
Total $217 $(76) $— $— $141
The Bond Fund of America
Counterparty
Gross amountsrecognized in the
statement of assetsand liabilities
Gross amounts not offset in thestatement of assets and liabilities andsubject to a master netting agreement
Netamount
Availableto offset
Non-cashcollateral*
Cashcollateral*
Assets:Goldman Sachs $90 $ — $— $— $90Morgan Stanley 7 (7) — — —
Total $97 $(7) $— $— $90
Liabilities:Morgan Stanley $ 8 $(7) $— $— $ 1
See end of tables for footnote.
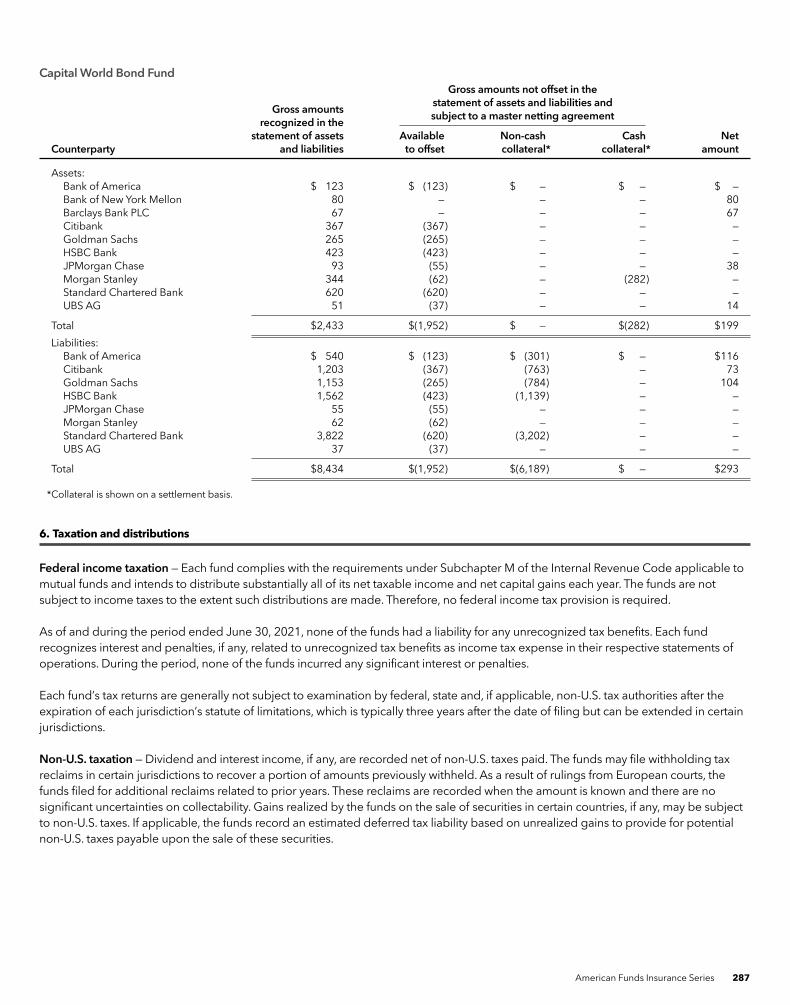
American Funds Insurance Series 287
Capital World Bond Fund
Counterparty
Gross amountsrecognized in the
statement of assetsand liabilities
Gross amounts not offset in thestatement of assets and liabilities andsubject to a master netting agreement
Netamount
Availableto offset
Non-cashcollateral*
Cashcollateral*
Assets:Bank of America $ 123 $ (123) $ — $ — $ —Bank of New York Mellon 80 — — — 80Barclays Bank PLC 67 — — — 67Citibank 367 (367) — — —Goldman Sachs 265 (265) — — —HSBC Bank 423 (423) — — —JPMorgan Chase 93 (55) — — 38Morgan Stanley 344 (62) — (282) —Standard Chartered Bank 620 (620) — — —UBS AG 51 (37) — — 14
Total $2,433 $(1,952) $ — $(282) $199
Liabilities:Bank of America $ 540 $ (123) $ (301) $ — $116Citibank 1,203 (367) (763) — 73Goldman Sachs 1,153 (265) (784) — 104HSBC Bank 1,562 (423) (1,139) — —JPMorgan Chase 55 (55) — — —Morgan Stanley 62 (62) — — —Standard Chartered Bank 3,822 (620) (3,202) — —UBS AG 37 (37) — — —
Total $8,434 $(1,952) $(6,189) $ — $293
*Collateral is shown on a settlement basis.
6. Taxation and distributions
Federal income taxation — Each fund complies with the requirements under Subchapter M of the Internal Revenue Code applicable tomutual funds and intends to distribute substantially all of its net taxable income and net capital gains each year. The funds are notsubject to income taxes to the extent such distributions are made. Therefore, no federal income tax provision is required.
As of and during the period ended June 30, 2021, none of the funds had a liability for any unrecognized tax benefits. Each fundrecognizes interest and penalties, if any, related to unrecognized tax benefits as income tax expense in their respective statements ofoperations. During the period, none of the funds incurred any significant interest or penalties.
Each fund’s tax returns are generally not subject to examination by federal, state and, if applicable, non-U.S. tax authorities after theexpiration of each jurisdiction’s statute of limitations, which is typically three years after the date of filing but can be extended in certainjurisdictions.
Non-U.S. taxation — Dividend and interest income, if any, are recorded net of non-U.S. taxes paid. The funds may file withholding taxreclaims in certain jurisdictions to recover a portion of amounts previously withheld. As a result of rulings from European courts, thefunds filed for additional reclaims related to prior years. These reclaims are recorded when the amount is known and there are nosignificant uncertainties on collectability. Gains realized by the funds on the sale of securities in certain countries, if any, may be subjectto non-U.S. taxes. If applicable, the funds record an estimated deferred tax liability based on unrealized gains to provide for potentialnon-U.S. taxes payable upon the sale of these securities.

288 American Funds Insurance Series
Distributions — Distributions determined on a tax basis may differ from net investment income and net realized gains for financialreporting purposes. These differences are due primarily to different treatment for items such as currency gains and losses; short-termcapital gains and losses; capital losses related to sales of certain securities within 30 days of purchase; unrealized appreciation ofcertain investments in securities outside the U.S.; deferred expenses; cost of investments sold; paydowns on fixed-income securities;net capital losses; net operating losses; non-U.S. taxes on capital gains; amortization of premiums and discounts and income on certaininvestments. The fiscal year in which amounts are distributed may differ from the year in which the net investment income and netrealized gains are recorded by the funds for financial reporting purposes.
Additional tax basis disclosures for each fund are as follows (dollars in thousands):
GlobalGrowthFund
GlobalSmall
CapitalizationFund
GrowthFund
InternationalFund
NewWorldFund
WashingtonMutualInvestorsFund
As of December 31, 2020:Undistributed ordinary income $ 23,610 $ — $ 276,979 $ 4,878 $ 10,741 $ 38,218Undistributed long-term capital gains 445,512 123,145 5,068,501 — 143,589 —Capital loss carryforward* — — — (136,440) — (63,496)
As of June 30, 2021:Gross unrealized appreciation on
investments 4,818,951 2,345,875 23,076,913 3,344,703 1,836,812 2,019,310Gross unrealized depreciation on
investments (122,078) (63,607) (179,233) (205,782) (38,585) (119,493)Net unrealized appreciation
(depreciation) on investments 4,696,873 2,282,268 22,897,680 3,138,921 1,798,227 1,899,817
Cost of investments 4,703,388 3,011,630 19,467,951 6,862,351 2,835,007 8,320,670
Capital WorldGrowth andIncome Fund
Growth-IncomeFund
InternationalGrowth
and IncomeFund
CapitalIncomeBuilder
AssetAllocation
Fund
GlobalBalancedFund
As of December 31, 2020:Undistributed ordinary income $ 4,517 $ 161,308 $ 5,778 $ 3,530 $ 248,732 $ 646Undistributed long-term capital gains 51,479 403,490 — — 899,471 1,975Capital loss carryforward* — — (76,870) (62,945) — —
As of June 30, 2021:Gross unrealized appreciation on
investments 569,198 17,764,038 405,480 213,505 10,140,213 110,587Gross unrealized depreciation on
investments (24,525) (218,650) (27,871) (4,531) (171,256) (4,872)Net unrealized appreciation
(depreciation) on investments 544,673 17,545,388 377,609 208,974 9,968,957 105,715
Cost of investments 1,826,123 23,565,078 980,525 843,729 23,664,238 350,045
See end of tables for footnote.

American Funds Insurance Series 289
The BondFund ofAmerica
CapitalWorldBondFund
AmericanHigh-Income
Trust
AmericanFunds
MortgageFund
Ultra-ShortBondFund
U.S.GovernmentSecurities
Fund
As of December 31, 2020:Undistributed ordinary income $ 293,413 $ 42,838 $ 6,554 $ 7,215 $ — $ 133,505Undistributed long-term capital gains 218,389 21,745 — 4,438 — 51,890Capital loss carryforward* — — (247,718) — (1) —
As of June 30, 2021:Gross unrealized appreciation on
investments 491,569 88,632 65,471 5,046 2 42,879Gross unrealized depreciation on
investments (89,604) (33,823) (29,508) (2,892) (8) (40,532)Net unrealized appreciation
(depreciation) on investments 401,965 54,809 35,963 2,154 (6) 2,347
Cost of investments 13,411,982 2,084,597 1,033,321 441,225 331,924 2,132,455
ManagedRisk
GrowthFund
ManagedRisk
InternationalFund
ManagedRisk
WashingtonMutualInvestorsFund
ManagedRisk
Growth-IncomeFund
ManagedRiskAsset
AllocationFund
As of December 31, 2020:Undistributed ordinary income $ 1,371 $ 929 $ 4,349 $ 25,029 $ 31,041Undistributed long-term capital gains 24,118 — — 33,730 —Capital loss carryforward* — (11,769) (22,483) — (31,551)
As of June 30, 2021:Gross unrealized appreciation on
investments 121,402 29,430 52,391 511,295 509,810Gross unrealized depreciation on
investments (3,358) (970) (4,203) (42,801) (1,281)Net unrealized appreciation
(depreciation) on investments 118,044 28,460 48,188 468,494 508,529
Cost of investments 479,803 141,301 314,848 2,121,829 2,350,405
*Each fund’s capital loss carryforward will be used to offset any capital gains realized by the fund in the current year or in subsequent years. Funds with a capitalloss carryforward will not make distributions from capital gains while a capital loss carryforward remains.
Distributions paid by each fund were characterized for tax purposes as follows (dollars in thousands):
Global Growth Fund
Six months ended June 30, 2021 Year ended December 31, 2020
Share classOrdinaryincome
Long-termcapital gains
Totaldistributions
paidOrdinaryincome
Long-termcapital gains
Totaldistributions
paid
Class 1 $11,038 $193,074 $204,112 $16,383 $ 73,033 $ 89,416Class 1A 33 645 678 29 205 234Class 2 10,860 221,402 232,262 13,463 109,286 122,749Class 4 1,339 30,748 32,087 653 11,537 12,190
Total $23,270 $445,869 $469,139 $30,528 $194,061 $224,589

290 American Funds Insurance Series
Global Small Capitalization Fund
Six months ended June 30, 2021 Year ended December 31, 2020
Share classOrdinaryincome
Long-termcapital gains
Totaldistributions
paidOrdinaryincome
Long-termcapital gains
Totaldistributions
paid
Class 1 $— $ 55,655 $ 55,655 $ 5,414 $120,074 $125,488Class 1A — 39 39 2 42 44Class 2 — 60,246 60,246 5,373 140,495 145,868Class 4 — 7,215 7,215 408 12,682 13,090
Total $— $123,155 $123,155 $11,197 $273,293 $284,490
Growth Fund
Six months ended June 30, 2021 Year ended December 31, 2020
Share classOrdinaryincome
Long-termcapital gains
Totaldistributions
paidOrdinaryincome
Long-termcapital gains
Totaldistributions
paid
Class 1 $117,454 $2,073,422 $2,190,876 $ 68,600 $285,315 $353,915Class 1A 490 9,031 9,521 141 547 688Class 2 139,683 2,610,409 2,750,092 53,722 404,657 458,379Class 3 1,909 35,107 37,016 860 5,433 6,293Class 4 17,483 340,551 358,034 3,629 42,241 45,870
Total $277,019 $5,068,520 $5,345,539 $126,952 $738,193 $865,145
International Fund
Six months ended June 30, 2021 Year ended December 31, 2020
Share classOrdinaryincome
Long-termcapital gains
Totaldistributions
paidOrdinaryincome
Long-termcapital gains
Totaldistributions
paid
Class 1 $3,155 $— $3,155 $44,223 $— $44,223Class 1A 2 — 2 56 — 56Class 2 808 — 808 25,688 — 25,688Class 3 7 — 7 157 — 157Class 4 — — — 1,591 — 1,591
Total $3,972 $— $3,972 $71,715 $— $71,715
NewWorld Fund
Six months ended June 30, 2021 Year ended December 31, 2020
Share classOrdinaryincome
Long-termcapital gains
Totaldistributions
paidOrdinaryincome
Long-termcapital gains
Totaldistributions
paid
Class 1 $ 6,440 $ 78,257 $ 84,697 $16,847 $ 8,752 $25,599Class 1A 16 273 289 48 26 74Class 2 2,577 36,498 39,075 6,570 4,233 10,803Class 4 1,718 28,566 30,284 4,454 3,019 7,473
Total $10,751 $143,594 $154,345 $27,919 $16,030 $43,949

American Funds Insurance Series 291
WashingtonMutual Investors Fund
Six months ended June 30, 2021 Year ended December 31, 2020
Share classOrdinaryincome
Long-termcapital gains
Totaldistributions
paidOrdinaryincome
Long-termcapital gains
Totaldistributions
paid
Class 1 $23,333 $— $23,333 $100,756 $ 61,517 $162,273Class 1A 387 — 387 350 134 484Class 2 11,499 — 11,499 48,936 34,662 83,598Class 4 3,024 — 3,024 10,866 7,992 18,858
Total $38,243 $— $38,243 $160,908 $104,305 $265,213
Capital World Growth and Income Fund
Six months ended June 30, 2021 Year ended December 31, 2020
Share classOrdinaryincome
Long-termcapital gains
Totaldistributions
paidOrdinaryincome
Long-termcapital gains
Totaldistributions
paid
Class 1 $1,716 $16,997 $18,713 $ 8,987 $15,679 $24,666Class 1A 6 67 73 28 53 81Class 2 2,484 29,988 32,472 15,537 32,112 47,649Class 4 318 4,436 4,754 1,576 3,612 5,188
Total $4,524 $51,488 $56,012 $26,128 $51,456 $77,584
Growth-Income Fund
Six months ended June 30, 2021 Year ended December 31, 2020
Share classOrdinaryincome
Long-termcapital gains
Totaldistributions
paidOrdinaryincome
Long-termcapital gains
Totaldistributions
paid
Class 1 $ 99,866 $239,575 $339,441 $381,174 $482,142 $ 863,316Class 1A 71 185 256 211 265 476Class 2 55,071 145,765 200,836 207,651 305,445 513,096Class 3 612 1,578 2,190 2,378 3,413 5,791Class 4 5,728 16,418 22,146 17,727 29,072 46,799
Total $161,348 $403,521 $564,869 $609,141 $820,337 $1,429,478
International Growth and Income Fund
Six months ended June 30, 2021 Year ended December 31, 2020
Share classOrdinaryincome
Long-termcapital gains
Totaldistributions
paidOrdinaryincome
Long-termcapital gains
Totaldistributions
paid
Class 1 $4,002 $— $4,002 $17,264 $— $17,264Class 1A 13 — 13 38 — 38Class 2 682 — 682 2,910 — 2,910Class 4 334 — 334 1,255 — 1,255
Total $5,031 $— $5,031 $21,467 $— $21,467
Capital Income Builder
Six months ended June 30, 2021 Year ended December 31, 2020
Share classOrdinaryincome
Long-termcapital gains
Totaldistributions
paidOrdinaryincome
Long-termcapital gains
Totaldistributions
paid
Class 1 $ 6,287 $— $ 6,287 $17,286 $— $17,286Class 1A 69 — 69 161 — 161Class 2 94 — 94 181 — 181Class 4 4,338 — 4,338 11,369 — 11,369
Total $10,788 $— $10,788 $28,997 $— $28,997

292 American Funds Insurance Series
Asset Allocation Fund
Six months ended June 30, 2021 Year ended December 31, 2020
Share classOrdinaryincome
Long-termcapital gains
Totaldistributions
paidOrdinaryincome
Long-termcapital gains
Totaldistributions
paid
Class 1 $164,249 $579,353 $ 743,602 $333,238 $ 79,610 $412,848Class 1A 124 457 581 213 51 264Class 2 41,744 154,751 196,495 80,906 22,747 103,653Class 3 267 976 1,243 520 141 661Class 4 42,398 164,028 206,426 67,789 21,221 89,010
Total $248,782 $899,565 $1,148,347 $482,666 $123,770 $606,436
Global Balanced Fund
Six months ended June 30, 2021 Year ended December 31, 2020
Share classOrdinaryincome
Long-termcapital gains
Totaldistributions
paidOrdinaryincome
Long-termcapital gains
Totaldistributions
paid
Class 1 $164 $ 502 $ 666 $1,746 $ 5,085 $ 6,831Class 1A 5 15 20 29 99 128Class 2 303 925 1,228 2,128 7,631 9,759Class 4 175 536 711 844 3,811 4,655
Total $647 $1,978 $2,625 $4,747 $16,626 $21,373
The Bond Fund of America
Six months ended June 30, 2021 Year ended December 31, 2020
Share classOrdinaryincome
Long-termcapital gains
Totaldistributions
paidOrdinaryincome
Long-termcapital gains
Totaldistributions
paid
Class 1 $181,262 $133,858 $315,120 $185,412 $25,238 $210,650Class 1A 258 193 451 224 31 255Class 2 92,606 69,578 162,184 96,166 14,478 110,644Class 4 19,437 14,777 34,214 15,659 2,303 17,962
Total $293,563 $218,406 $511,969 $297,461 $42,050 $339,511
Capital World Bond Fund
Six months ended June 30, 2021 Year ended December 31, 2020
Share classOrdinaryincome
Long-termcapital gains
Totaldistributions
paidOrdinaryincome
Long-termcapital gains
Totaldistributions
paid
Class 1 $20,468 $10,279 $30,747 $30,575 $4,335 $34,910Class 1A 13 7 20 16 3 19Class 2 21,199 10,855 32,054 24,602 3,871 28,473Class 4 1,170 612 1,782 1,252 206 1,458
Total $42,850 $21,753 $64,603 $56,445 $8,415 $64,860

American Funds Insurance Series 293
American High-Income Trust
Six months ended June 30, 2021 Year ended December 31, 2020
Share classOrdinaryincome
Long-termcapital gains
Totaldistributions
paidOrdinaryincome
Long-termcapital gains
Totaldistributions
paid
Class 1 $ 926 $— $ 926 $10,071 $— $10,071Class 1A 8 — 8 78 — 78Class 2 4,966 — 4,966 54,086 — 54,086Class 3 74 — 74 799 — 799Class 4 588 — 588 4,806 — 4,806
Total $6,562 $— $6,562 $69,840 $— $69,840
American Funds Mortgage Fund
Six months ended June 30, 2021 Year ended December 31, 2020
Share classOrdinaryincome
Long-termcapital gains
Totaldistributions
paidOrdinaryincome
Long-termcapital gains
Totaldistributions
paid
Class 1 $5,055 $3,087 $ 8,142 $3,288 $263 $3,551Class 1A 30 18 48 13 1 14Class 2 1,260 784 2,044 722 75 797Class 4 873 551 1,424 406 52 458
Total $7,218 $4,440 $11,658 $4,429 $391 $4,820
Ultra-Short Bond Fund
Six months ended June 30, 2021 Year ended December 31, 2020
Share classOrdinaryincome
Long-termcapital gains
Totaldistributions
paidOrdinaryincome
Long-termcapital gains
Totaldistributions
paid
Class 1 $— $— $— $104 $— $104Class 1A — — — —† — —†
Class 2 — — — 558 — 558Class 3 — — — 8 — 8Class 4 — — — 67 — 67
Total $— $— $— $737 $— $737
U.S. Government Securities Fund
Six months ended June 30, 2021 Year ended December 31, 2020
Share classOrdinaryincome
Long-termcapital gains
Totaldistributions
paidOrdinaryincome
Long-termcapital gains
Totaldistributions
paid
Class 1 $ 24,215 $ 9,355 $ 33,570 $12,901 $ 3,231 $16,132Class 1A 335 129 464 107 29 136Class 2 92,923 36,124 129,047 40,852 11,067 51,919Class 3 602 234 836 318 89 407Class 4 15,448 6,057 21,505 7,195 1,992 9,187
Total $133,523 $51,899 $185,422 $61,373 $16,408 $77,781
See end of tables for footnote.

294 American Funds Insurance Series
Managed Risk Growth Fund
Six months ended June 30, 2021 Year ended December 31, 2020
Share classOrdinaryincome
Long-termcapital gains
Totaldistributions
paidOrdinaryincome
Long-termcapital gains
Totaldistributions
paid
Class P1 $ 43 $ 409 $ 452 $ 64 $ 374 $ 438Class P2 1,329 23,710 25,039 3,441 21,395 24,836
Total $1,372 $24,119 $25,491 $3,505 $21,769 $25,274
Managed Risk International Fund
Six months ended June 30, 2021 Year ended December 31, 2020
Share classOrdinaryincome
Long-termcapital gains
Totaldistributions
paidOrdinaryincome
Long-termcapital gains
Totaldistributions
paid
Class P1 $ 14 $— $ 14 $ 21 $ 10 $ 31Class P2 917 — 917 1,913 1,303 3,216
Total $931 $— $931 $1,934 $1,313 $3,247
Managed RiskWashingtonMutual Investors Fund
Six months ended June 30, 2021 Year ended December 31, 2020
Share classOrdinaryincome
Long-termcapital gains
Totaldistributions
paidOrdinaryincome
Long-termcapital gains
Totaldistributions
paid
Class P1 $ 24 $— $ 24 $ 29 $ 37 $ 66Class P2 4,326 — 4,326 6,006 10,828 16,834
Total $4,350 $— $4,350 $6,035 $10,865 $16,900
Managed Risk Growth-Income Fund
Six months ended June 30, 2021 Year ended December 31, 2020
Share classOrdinaryincome
Long-termcapital gains
Totaldistributions
paidOrdinaryincome
Long-termcapital gains
Totaldistributions
paid
Class P1 $21,909 $29,380 $51,289 $37,519 $103,175 $140,694Class P2 3,122 4,359 7,481 4,874 15,199 20,073
Total $25,031 $33,739 $58,770 $42,393 $118,374 $160,767
Managed Risk Asset Allocation Fund
Six months ended June 30, 2021 Year ended December 31, 2020
Share classOrdinaryincome
Long-termcapital gains
Totaldistributions
paidOrdinaryincome
Long-termcapital gains
Totaldistributions
paid
Class P1 $ 80 $— $ 80 $ 58 $ 146 $ 204Class P2 30,961 — 30,961 40,641 105,833 146,474
Total $31,041 $— $31,041 $40,699 $105,979 $146,678
†Amount less than one thousand.
7. Fees and transactions
CRMC, the series’ investment adviser, is the parent company of American Funds Distributors®, Inc. (“AFD”), the distributor of the series’shares, and American Funds Service Company® (“AFS”), the series’ transfer agent. CRMC,AFD and AFS are considered related partiesto the series.

American Funds Insurance Series 295
Investment advisory services — The series has an investment advisory and service agreement with CRMC that provides for monthly feesaccrued daily. These fees are based on annual rates that generally decrease as net asset levels increase. CRMC receives investmentadvisory fees from the underlying funds held by the managed risk funds. These fees are included in the net effective expense ratios thatare provided as additional information in the financial highlights tables. Subadvisory fees for the managed risk funds are paid by CRMCto Milliman FRM. The managed risk funds are not responsible for paying any subadvisory fees.
Investment advisory services waivers — CRMC is waiving a portion of its investment advisory services fees for some of the funds. Duringthe six months ended June 30, 2021, CRMCwaived $28,000 in fees for Global Growth Fund in advance of the investment advisory andservice agreement that became effective May 1, 2021.
At the beginning of the year, CRMCwaived a portion of its investment advisory services fees at the rates of 0.18%, 0.26%, 0.10% and0.18% of the daily net assets of NewWorld Fund, Capital Income Builder, Capital World Bond Fund and American Funds MortgageFund, respectively. Effective May 1, 2021, CRMC revised the waiver rates to 0.25% and 0.21% of the daily net assets of Capital IncomeBuilder and American Funds Mortgage Fund, respectively. The waiver rates for NewWorld Fund and Capital World Bond Fund were notchanged.
Effective May 1, 2021, CRMC began to waive a portion of its investment advisory services fees at the rates of 0.16%, 0.23%, 0.19%,0.19% and 0.16% of the daily net assets of Washington Mutual Investors Fund, Capital World Growth and Income Fund, The Bond Fundof America, American High-Income Trust and U.S. Government Securities Fund, respectively. During the six months ended June 30,2021, CRMC also waived a portion of its investment advisory services fees at the rate of 0.05% of the daily net assets of each of themanaged risk funds.
The waiver rates for each fund, except Global Growth Fund, will be in effect through at least May 1, 2022, and may only be modified orterminated with the approval of the series’ board. For the six months ended June 30, 2021, total investment advisory services feeswaived by CRMCwere $16,839,000. CRMC does not intend to recoup these waivers. Investment advisory services fees in each fund’sstatement of operations are presented gross of the waivers from CRMC.
The range of rates, net asset levels and the current annualized rates of average daily net assets for each fund before and after anyinvestment advisory services waivers (if applicable), are as follows:
Fund
RatesNet asset level(in billions)
For thesix months
endedJune 30,
2021,before waiver
For thesix months
endedJune 30,
2021,after waiver
Beginningwith
Endingwith Up to
In excessof
Global Growth Fund .690% .445% $ .6 $ 8.0 .500% .499%Global Small Capitalization Fund .800 .635 .6 5.0 .684 .684Growth Fund .500 .280 .6 34.0 .309 .309International Fund .690 .430 .5 21.0 .489 .489NewWorld Fund .850 .580 .5 4.0 .679 .499Washington Mutual Investors Fund .500 .350 .6 10.5 .385 .330Capital World Growth and Income Fund .690 .480 .6 3.0 .586 .506Growth-Income Fund .500 .219 .6 34.0 .250 .250International Growth and Income Fund .690 .500 .5 1.5 .605 .605Capital Income Builder .500 .410 .6 1.0 .472 .215Asset Allocation Fund .500 .240 .6 21.0 .261 .261Global Balanced Fund .660 .510 .5 1.0 .660 .660The Bond Fund of America .480 .320 .6 13.0 .359 .293Capital World Bond Fund .570 .450 1.0 3.0 .531 .431American High-Income Trust .500 .420 .6 2.0 .487 .421American Funds Mortgage Fund .420 .290 .6 3.0 .420 .230Ultra-Short Bond Fund .320 .270 1.0 2.0 .320 .320U.S. Government Securities Fund .420 .290 .6 3.0 .355 .302Managed Risk Growth Fund .150 all .150 .100Managed Risk International Fund .150 all .150 .100Managed Risk Washington Mutual Investors Fund .150 all .150 .100Managed Risk Growth-Income Fund .150 all .150 .100Managed Risk Asset Allocation Fund .150 all .150 .100

296 American Funds Insurance Series
Class-specific fees and expenses —Expenses that are specific to individual share classes are accrued directly to the respective shareclass. The principal class-specific fees and expenses are further described below:
Distribution services — The series has plans of distribution for all share classes except Class 1. Under the plans, the board oftrustees approves certain categories of expenses that are used to finance activities primarily intended to sell fund shares. The plansprovide for payments to pay service fees to firms that have entered into agreements with the series. These payments, based on anannualized percentage of average daily net assets, range from 0.18% to 0.50% as noted in the table below. In some cases, theboard of trustees has limited the amounts that may be paid to less than the maximum allowed by the plans.
Share class Currently approved limits Plan limits
Class 1A 0.00% 0.25%Class 2 0.25 0.25Class 3 0.18 0.18Class 4 0.25 0.25Class P1 0.00 0.25Class P2 0.25 0.50
Insurance administrative services — The series has an insurance administrative services plan for Class 1A, 4, P1 and P2 shares.Under the plan, these share classes pay 0.25% of each insurance company’s respective average daily net assets in each share classto compensate the insurance companies for services provided to their separate accounts and contractholders for which the sharesof the fund are beneficially owned as underlying investments of such contractholders’ annuities. These services include, but are notlimited to,maintenance, shareholder communications and transactional services. The insurance companies are not related partiesto the series.
Transfer agent services — The series has a shareholder services agreement with AFS under which the funds compensate AFS forproviding transfer agent services to all of the funds’ share classes. These services include recordkeeping, shareholder communica-tions and transaction processing. In addition, the managed risk funds reimburse AFS for amounts paid to third parties forperforming transfer agent services on behalf of fund shareholders.
Administrative services — The series has an administrative services agreement with CRMC under which each fund compensatesCRMC for providing administrative services to all of the funds’ share classes except Class P1 and P2 shares. Administrative servicesare provided by CRMC and its affiliates to help assist third parties providing non-distribution services to fund shareholders. Theseservices include providing in-depth information on each fund andmarket developments that impact fund investments.Administrative services also include, but are not limited to, coordinating,monitoring and overseeing third parties that provideservices to fund shareholders. The agreement provides each fund, other than the managed risk funds, the ability to charge anadministrative services fee at the annual rate of 0.05% of average daily net assets attributable to each share class. Currently eachfund, other than the managed-risk funds, pays CRMC an administrative services fee at the annual rate of 0.03% of average daily netassets of each share class for CRMC’s provision of administrative services. For the managed risk funds, CRMC receives administra-tive services fees at an annual rate of 0.03% of average daily net assets from Class 1 shares of the underlying funds for administra-tive services provided to the series.
Accounting and administrative services — The managed risk funds have a subadministration agreement with Bank of New YorkMellon (“BNYMellon“) under which the fund compensates BNYMellon for providing accounting and administrative services toeach of the managed risk funds’ share classes. These services include, but are not limited to, fund accounting (including calculationof net asset value), financial reporting and tax services. BNYMellon is not a related party to the managed risk funds.

American Funds Insurance Series 297
Class-specific expenses under the agreements described above were as follows (dollars in thousands):
Global Growth Fund
Share classDistribution
services
Insuranceadministrative
servicesAdministrative
services
Class 1 Not applicable Not applicable $ 537Class 1A $ — $ 16 2Class 2 5,587 Not applicable 670Class 4 731 731 88
Total class-specificexpenses $6,318 $747 $1,297
Global Small Capitalization Fund
Share classDistribution
services
Insuranceadministrative
servicesAdministrative
services
Class 1 Not applicable Not applicable $370Class 1A $ — $ 2 —*Class 2 3,342 Not applicable 401Class 4 375 375 45
Total class-specificexpenses $3,717 $377 $816
Growth Fund
Share classDistribution
services
Insuranceadministrative
servicesAdministrative
services
Class 1 Not applicable Not applicable $2,444Class 1A $ — $ 93 11Class 2 25,979 Not applicable 3,118Class 3 256 Not applicable 43Class 4 3,175 3,175 381
Total class-specificexpenses $29,410 $3,268 $5,997
International Fund
Share classDistribution
services
Insuranceadministrative
servicesAdministrative
services
Class 1 Not applicable Not applicable $ 830Class 1A $ — $ 13 1Class 2 5,532 Not applicable 664Class 3 22 Not applicable 3Class 4 539 539 65
Total class-specificexpenses $6,093 $552 $1,563
NewWorld Fund
Share classDistribution
services
Insuranceadministrative
servicesAdministrative
services
Class 1 Not applicable Not applicable $359Class 1A $ — $ 23 3Class 2 1,401 Not applicable 168Class 4 1,059 1,059 127
Total class-specificexpenses $2,460 $1,082 $657
WashingtonMutual Investors Fund
Share classDistribution
services
Insuranceadministrative
servicesAdministrative
services
Class 1 Not applicable Not applicable $ 897Class 1A $ — $ 65 8Class 2 4,028 Not applicable 484Class 4 1,092 1,093 131
Total class-specificexpenses $5,120 $1,158 $1,520
Capital World Growth and Income Fund
Share classDistribution
services
Insuranceadministrative
servicesAdministrative
services
Class 1 Not applicable Not applicable $103Class 1A $ — $ 4 —*Class 2 1,692 Not applicable 203Class 4 229 229 28
Total class-specificexpenses $1,921 $233 $334
See end of tables for footnote.
Growth-Income Fund
Share classDistribution
services
Insuranceadministrative
servicesAdministrative
services
Class 1 Not applicable Not applicable $3,565Class 1A $ — $ 22 3Class 2 18,063 Not applicable 2,167Class 3 143 Not applicable 24Class 4 1,918 1,918 230
Total class-specificexpenses $20,124 $1,940 $5,989

298 American Funds Insurance Series
International Growth and Income Fund
Share classDistribution
services
Insuranceadministrative
servicesAdministrative
services
Class 1 Not applicable Not applicable $167Class 1A $ — $ 4 1Class 2 275 Not applicable 33Class 4 145 145 17
Total class-specificexpenses $420 $149 $218
Capital Income Builder
Share classDistribution
services
Insuranceadministrative
servicesAdministrative
services
Class 1 Not applicable Not applicable $ 93Class 1A $ — $ 8 1Class 2 11 Not applicable 1Class 4 616 616 74
Total class-specificexpenses $627 $624 $169
Asset Allocation Fund
Share classDistribution
services
Insuranceadministrative
servicesAdministrative
services
Class 1 Not applicable Not applicable $2,988Class 1A $ — $ 19 2Class 2 6,680 Not applicable 802Class 3 30 Not applicable 5Class 4 6,795 6,795 815
Total class-specificexpenses $13,505 $6,814 $4,612
Global Balanced Fund
Share classDistribution
services
Insuranceadministrative
servicesAdministrative
services
Class 1 Not applicable Not applicable $18Class 1A $ — $ 4 1Class 2 262 Not applicable 31Class 4 141 141 17
Total class-specificexpenses $403 $145 $67
The Bond Fund of America
Share classDistribution
services
Insuranceadministrative
servicesAdministrative
services
Class 1 Not applicable Not applicable $1,066Class 1A $ — $ 13 1Class 2 4,736 Not applicable 568Class 4 947 947 114
Total class-specificexpenses $5,683 $960 $1,749
Capital World Bond Fund
Share classDistribution
services
Insuranceadministrative
servicesAdministrative
services
Class 1 Not applicable Not applicable $175Class 1A $ — $ 1 —*Class 2 1,310 Not applicable 157Class 4 75 75 9
Total class-specificexpenses $1,385 $76 $341
American High-Income Trust
Share classDistribution
services
Insuranceadministrative
servicesAdministrative
services
Class 1 Not applicable Not applicable $ 19Class 1A $ — $ 1 —*Class 2 841 Not applicable 101Class 3 9 Not applicable 2Class 4 99 100 12
Total class-specificexpenses $949 $101 $134
See end of tables for footnote.
American Funds Mortgage Fund
Share classDistribution
services
Insuranceadministrative
servicesAdministrative
services
Class 1 Not applicable Not applicable $34Class 1A $ — $ 2 —*Class 2 73 Not applicable 9Class 4 49 49 6
Total class-specificexpenses $122 $51 $49

American Funds Insurance Series 299
Ultra-Short Bond Fund
Share classDistribution
services
Insuranceadministrative
servicesAdministrative
services
Class 1 Not applicable Not applicable $ 6Class 1A $ — $ — —*Class 2 344 Not applicable 41Class 3 4 Not applicable 1Class 4 50 50 6
Total class-specificexpenses $398 $50 $54
U.S. Government Securities Fund
Share classDistribution
services
Insuranceadministrative
servicesAdministrative
services
Class 1 Not applicable Not applicable $ 59Class 1A $ — $ 5 1Class 2 1,788 Not applicable 215Class 3 9 Not applicable 1Class 4 313 313 37
Total class-specificexpenses $2,110 $318 $313
Managed Risk Growth Fund
Share classDistribution
services
Insuranceadministrative
services
Class P1 Not applicable $ 14Class P2 $704 704
Total class-specificexpenses $704 $718
Managed Risk International Fund
Share classDistribution
services
Insuranceadministrative
services
Class P1 Not applicable $ 2Class P2 $207 207
Total class-specificexpenses $207 $209
Managed RiskWashingtonMutual Investors Fund
Share classDistribution
services
Insuranceadministrative
services
Class P1 Not applicable $ 2Class P2 $447 447
Total class-specificexpenses $447 $449
Managed Risk Growth-Income Fund
Share classDistribution
services
Insuranceadministrative
services
Class P1 Not applicable $2,723Class P2 $405 405
Total class-specificexpenses $405 $3,128
Managed Risk Asset Allocation Fund
Share classDistribution
services
Insuranceadministrative
services
Class P1 Not applicable $ 7Class P2 $3,492 3,492
Total class-specificexpenses $3,492 $3,499
*Amount less than one thousand.
Miscellaneous fee reimbursements — CRMC reimbursed a portion of miscellaneous fees and expenses for Managed RiskInternational Fund andManaged RiskWashington Mutual Investors Fund. These reimbursements may be adjusted or discontinuedby CRMC, subject to any restrictions in the series’ prospectus. For the six months ended June 30, 2021, total fees and expensesreimbursed by CRMCwere $29,000. CRMCmay recoup all or a portion of these reimbursements during the current fiscal year.Fees and expenses in the fund’s statement of operations are presented gross of any reimbursements from CRMC.

300 American Funds Insurance Series
Trustees’ deferred compensation — Trustees who are unaffiliated with CRMCmay elect to defer the cash payment of part or all of theircompensation. These deferred amounts, which remain as liabilities of the funds, are treated as if invested in one or more of theAmerican Funds. These amounts represent general, unsecured liabilities of the funds and vary according to the total returns of theselected funds. Trustees’ compensation, shown on the accompanying financial statements, reflects current fees (either paid in cash ordeferred) and a net decrease in the value of the deferred amounts as follows (dollars in thousands):
Fund Current feesIncrease in value ofdeferred amounts
Total trustees’compensation
Global Growth Fund $11 $13 $ 24Global Small Capitalization Fund 7 8 15Growth Fund 50 58 108International Fund 12 16 28NewWorld Fund 6 6 12Washington Mutual Investors Fund 12 15 27Capital World Growth and Income Fund 3 3 6Growth-Income Fund 49 59 108International Growth and Income Fund 2 2 4Capital Income Builder 1 2 3Asset Allocation Fund 38 46 84Global Balanced Fund —* 1 1The Bond Fund of America 15 17 32Capital World Bond Fund 3 3 6American High-Income Trust 1 1 2American Funds Mortgage Fund —* 1 1Ultra-Short Bond Fund —* 1 1U.S. Government Securities Fund 3 3 6Managed Risk Growth Fund —* 1 1Managed Risk International Fund —* —* —*Managed Risk Washington Mutual Investors Fund —* 1 1Managed Risk Growth-Income Fund 3 4 7Managed Risk Asset Allocation Fund 4 4 8
*Amount less than one thousand.
Affiliated officers and trustees — Officers and certain trustees of the series are or may be considered to be affiliated with CRMC,AFDand AFS. No affiliated officers or trustees received any compensation directly from any fund in the series.
Investments in CCBF and CCF — Some of the funds hold shares of CCBF, a corporate bond fund, and CCF, an institutional primemoneymarket fund ,which are both managed by CRMC. CCBF seeks to provide maximum total return consistent with capital preservation andprudent risk management by investing primarily in corporate debt instruments. CCBF is used as an investment vehicle for some of thefunds’ corporate bond investments. CCF invests in high-quality, short-termmoney market instruments. CCF is used as the primaryinvestment vehicle for some of the funds’ short-term investments. Both CCBF and CCF shares are only available for purchase by CRMC,its affiliates, and other funds managed by CRMC or its affiliates, and are not available to the public. CRMC does not receive aninvestment advisory services fee from either CCBF or CCF.
Security transactions with related funds — The funds may purchase from, or sell securities to, other CRMC-managed funds (or fundsmanaged by certain affiliates of CRMC) under procedures adopted by the fund’s board of trustees. The funds involved in suchtransactions are considered related by virtue of having a common investment adviser (or affiliated investment advisers), commontrustees and/or common officers.When such transactions occur, each transaction is executed at the current market price of the securityand no brokerage commissions or fees are paid in accordance with Rule 17a-7 of the 1940 Act.

American Funds Insurance Series 301
The following table presents purchase and sale transactions between each fund and related funds, and net realized gain or loss fromsuch sales, if any, as of June 30, 2021 (dollars in thousands):
Fund Purchases Sales
Netrealized
gain (loss)
Global Growth Fund $ 4,500 $ 79,532 $ 26,691Global Small Capitalization Fund 15,747 154,738 87,823Growth Fund 186,804 130,809 10,383International Fund 397,021 106,191 12,563NewWorld Fund 15,120 17,173 1,426Washington Mutual Investors Fund 567,542 853,438 154,001Capital World Growth and Income Fund 257,890 113,136 23,458Growth-Income Fund 131,465 568,702 102,620International Growth and Income Fund 5 4,740 (402)Capital Income Builder 10,152 40,799 2,286Asset Allocation Fund 184,774 1,877,844 129,099Global Balanced Fund — 377 273The Bond Fund of America 54,003 52,591 2,838Capital World Bond Fund 291 10,268 2,050American High-Income Trust 11,320 6,349 (1,054)
8. Committed line of credit
Global Small Capitalization Fund, NewWorld Fund and American High-Income Trust participate with other funds managed by CRMC ina $1.5 billion credit facility (the “line of credit”) to be utilized for temporary purposes to fund shareholder redemptions. Each fund hasagreed to pay commitment fees on its pro-rata portion of the line of credit, which are reflected in other expenses in each fund’sstatement of operations. None of the funds borrowed on this line of credit at any time during the six months ended June 30, 2021.
9. Indemnifications
The series’ organizational documents provide board members and officers with indemnification against certain liabilities or expenses inconnection with the performance of their duties to the series. In the normal course of business, the series may also enter into contractsthat provide general indemnifications. Each fund’s maximum exposure under these arrangements is unknown since it is dependent onfuture claims that may be made against the series. The risk of material loss from such claims is considered remote. Insurance policies arealso available to the series’ board members and officers.

302 American Funds Insurance Series
10. Capital share transactions
Capital share transactions in the funds were as follows (dollars and shares in thousands):
Global Growth Fund
Sales*Reinvestments of
distributions Repurchases*Net increase(decrease)
Share class Amount Shares Amount Shares Amount Shares Amount Shares
Six months ended June 30, 2021Class 1 $527,318 11,942 $204,112 4,778 $ (158,953) (3,671) $ 572,477 13,049Class 1A 1,735 40 678 16 (1,116) (26) 1,297 30Class 2 38,144 892 232,262 5,504 (317,411) (7,404) (47,005) (1,008)Class 4 81,971 1,925 32,087 766 (31,064) (731) 82,994 1,960
Total net increase (decrease) $649,168 14,799 $469,139 11,064 $ (508,544) (11,832) $ 609,763 14,031
Year ended December 31, 2020Class 1 $402,110 11,550 $ 89,416 2,661 $ (365,952) (11,056) $ 125,574 3,155Class 1A 4,330 121 234 7 (2,564) (87) 2,000 41Class 2 46,502 1,410 122,749 3,738 (613,644) (18,242) (444,393) (13,094)Class 4 96,748 2,812 12,190 377 (63,324) (1,924) 45,614 1,265
Total net increase (decrease) $549,690 15,893 $224,589 6,783 $(1,045,484) (31,309) $(271,205) (8,633)
Global Small Capitalization Fund
Sales*Reinvestments of
distributions Repurchases*Net (decrease)
increase
Share class Amount Shares Amount Shares Amount Shares Amount Shares
Six months ended June 30, 2021Class 1 $154,021 4,434 $ 55,510 1,581 $(634,189) (18,143) $(424,658) (12,128)Class 1A 514 15 39 1 (57) (2) 496 14Class 2 24,213 724 60,246 1,778 (233,030) (6,938) (148,571) (4,436)Class 4 51,537 1,534 7,215 212 (15,923) (473) 42,829 1,273
Total net increase (decrease) $230,285 6,707 $123,010 3,572 $(883,199) (25,556) $(529,904) (15,277)
Year ended December 31, 2020Class 1 $223,000 10,191 $125,091 5,146 $(466,963) (18,580) $(118,872) (3,243)Class 1A 627 24 43 2 (268) (10) 402 16Class 2 60,922 2,877 145,869 6,194 (409,129) (15,839) (202,338) (6,768)Class 4 35,430 1,424 13,089 554 (34,957) (1,396) 13,562 582
Total net increase (decrease) $319,979 14,516 $284,092 11,896 $(911,317) (35,825) $(307,246) (9,413)
See end of tables for footnotes.

American Funds Insurance Series 303
Growth Fund
Sales*Reinvestments of
distributions Repurchases*Net increase(decrease)
Share class Amount Shares Amount Shares Amount Shares Amount Shares
Six months ended June 30, 2021Class 1 $1,075,952 8,588 $2,187,676 19,153 $(1,206,674) (9,637) $ 2,056,954 18,104Class 1A 33,220 269 9,521 84 (23,499) (183) 19,242 170Class 2 228,281 1,840 2,750,091 24,339 (1,699,878) (13,743) 1,278,494 12,436Class 3 1,840 14 37,016 322 (17,494) (138) 21,362 198Class 4 293,870 2,411 358,034 3,232 (121,262) (1,000) 530,642 4,643
Total net increase (decrease) $1,633,163 13,122 $5,342,338 47,130 $(3,068,807) (24,701) $ 3,906,694 35,551
Year ended December 31, 2020Class 1 $2,322,779 26,334 $ 353,232 3,917 $(2,999,100) (33,591) $ (323,089) (3,340)Class 1A 33,301 338 688 8 (5,835) (64) 28,154 282Class 2 437,349 4,937 458,379 5,218 (3,162,923) (34,505) (2,267,195) (24,350)Class 3 1,333 17 6,293 70 (37,446) (395) (29,820) (308)Class 4 325,002 3,612 45,870 534 (283,912) (3,180) 86,960 966
Total net increase (decrease) $3,119,764 35,238 $ 864,462 9,747 $(6,489,216) (71,735) $(2,504,990) (26,750)
International Fund
Sales*Reinvestments of
distributions Repurchases*Net (decrease)
increase
Share class Amount Shares Amount Shares Amount Shares Amount Shares
Six months ended June 30, 2021Class 1 $209,107 8,690 $ 3,155 126 $(1,067,638) (43,431) $ (855,376) (34,615)Class 1A 2,046 85 2 —† (1,865) (77) 183 8Class 2 125,395 5,234 808 33 (318,439) (13,155) (192,236) (7,888)Class 3 34 2 6 —† (2,009) (82) (1,969) (80)Class 4 49,971 2,105 — — (33,505) (1,410) 16,466 695
Total net increase (decrease) $386,553 16,116 $ 3,971 159 $(1,423,456) (58,155) $(1,032,932) (41,880)
Year ended December 31, 2020Class 1 $535,603 30,721 $44,223 2,049 $ (963,355) (50,229) $ (383,529) (17,459)Class 1A 2,754 147 56 2 (1,389) (70) 1,421 79Class 2 271,356 15,425 25,688 1,204 (667,572) (33,696) (370,528) (17,067)Class 3 226 12 157 7 (3,148) (157) (2,765) (138)Class 4 52,233 2,881 1,591 76 (62,187) (3,226) (8,363) (269)
Total net increase (decrease) $862,172 49,186 $71,715 3,338 $(1,697,651) (87,378) $ (763,764) (34,854)
See end of tables for footnotes.

304 American Funds Insurance Series
NewWorld Fund
Sales*Reinvestments of
distributions Repurchases*Net increase(decrease)
Share class Amount Shares Amount Shares Amount Shares Amount Shares
Six months ended June 30, 2021Class 1 $ 93,960 2,855 $ 84,467 2,545 $ (96,626) (2,932) $ 81,801 2,468Class 1A 10,433 322 289 9 (20,757) (631) (10,035) (300)Class 2 39,057 1,202 39,075 1,191 (94,272) (2,885) (16,140) (492)Class 4 69,772 2,168 30,285 931 (46,199) (1,425) 53,858 1,674
Total net increase (decrease) $213,222 6,547 $154,116 4,676 $(257,854) (7,873) $ 109,484 3,350
Year ended December 31, 2020Class 1 $ 80,299 3,402 $ 25,570 1,027 $(337,036) (13,731) $(231,167) (9,302)Class 1A 12,129 461 73 3 (1,703) (71) 10,499 393Class 2 102,697 3,915 10,803 447 (184,643) (7,218) (71,143) (2,856)Class 4 89,140 3,662 7,473 310 (84,462) (3,316) 12,151 656
Total net increase (decrease) $284,265 11,440 $ 43,919 1,787 $(607,844) (24,336) $(279,660) (11,109)
WashingtonMutual Investors Fund
Sales*Reinvestments of
distributions Repurchases*Net (decrease)
increase
Share class Amount Shares Amount Shares Amount Shares Amount Shares
Six months ended June 30, 2021Class 1 $ 89,775 5,710 $ 23,179 1,400 $ (811,744) (50,687) $(698,790) (43,577)Class 1A 83,742 5,146 387 24 (1,731) (108) 82,398 5,062Class 2 31,907 2,066 11,499 705 (281,699) (18,151) (238,293) (15,380)Class 4 77,303 4,987 3,024 186 (33,578) (2,182) 46,749 2,991
Total net increase (decrease) $282,727 17,909 $ 38,089 2,315 $(1,128,752) (71,128) $(807,936) (50,904)
Year ended December 31, 2020Class 1 $474,186 41,847 $161,061 11,902 $ (825,919) (67,505) $(190,672) (13,756)Class 1A 15,517 1,215 484 35 (2,556) (194) 13,445 1,056Class 2 75,893 6,771 83,599 6,287 (337,510) (26,379) (178,018) (13,321)Class 4 148,645 12,358 18,858 1,428 (54,754) (4,444) 112,749 9,342
Total net increase (decrease) $714,241 62,191 $264,002 19,652 $(1,220,739) (98,522) $(242,496) (16,679)
Capital World Growth and Income Fund
Sales*Reinvestments of
distributions Repurchases*Net increase(decrease)
Share class Amount Shares Amount Shares Amount Shares Amount Shares
Six months ended June 30, 2021Class 1 $130,801 7,265 $18,118 1,012 $ (68,889) (3,919) $ 80,030 4,358Class 1A 1,081 62 73 4 (336) (19) 818 47Class 2 9,471 542 32,472 1,818 (119,563) (6,845) (77,620) (4,485)Class 4 26,704 1,554 4,755 271 (7,508) (438) 23,951 1,387
Total net increase (decrease) $168,057 9,423 $55,418 3,105 $(196,296) (11,221) $ 27,179 1,307
Year ended December 31, 2020Class 1 $274,643 21,210 $23,674 1,607 $(306,092) (22,650) $ (7,775) 167Class 1A 474 35 81 6 (266) (18) 289 23Class 2 48,178 3,670 47,647 3,258 (175,562) (11,876) (79,737) (4,948)Class 4 26,989 1,950 5,189 362 (19,540) (1,418) 12,638 894
Total net increase (decrease) $350,284 26,865 $76,591 5,233 $(501,460) (35,962) $(74,585) (3,864)
See end of tables for footnotes.

American Funds Insurance Series 305
Growth-Income Fund
Sales*Reinvestments of
distributions Repurchases*Net (decrease)
increase
Share class Amount Shares Amount Shares Amount Shares Amount Shares
Six months ended June 30, 2021Class 1 $ 433,686 7,284 $ 338,978 5,480 $(2,416,869) (40,085) $(1,644,205) (27,321)Class 1A 2,806 48 256 4 (1,220) (21) 1,842 31Class 2 75,035 1,294 200,835 3,293 (1,029,661) (17,541) (753,791) (12,954)Class 3 355 6 2,190 35 (10,322) (174) (7,777) (133)Class 4 148,625 2,562 22,147 368 (62,826) (1,091) 107,946 1,839
Total net increase (decrease) $ 660,507 11,194 $ 564,406 9,180 $(3,520,898) (58,912) $(2,295,985) (38,538)
Year ended December 31, 2020Class 1 $1,892,111 42,172 $ 862,018 17,198 $(2,883,447) (61,087) $ (129,318) (1,717)Class 1A 4,637 94 476 9 (1,475) (30) 3,638 73Class 2 252,743 5,452 513,097 10,416 (1,497,209) (30,770) (731,369) (14,902)Class 3 2,002 41 5,790 116 (23,231) (465) (15,439) (308)Class 4 174,576 3,682 46,799 965 (148,613) (3,153) 72,762 1,494
Total net increase (decrease) $2,326,069 51,441 $1,428,180 28,704 $(4,553,975) (95,505) $ (799,726) (15,360)
International Growth and Income Fund
Sales*Reinvestments of
distributions Repurchases*Net (decrease)
increase
Share class Amount Shares Amount Shares Amount Shares Amount Shares
Six months ended June 30, 2021Class 1 $ 29,279 1,443 $ 3,971 194 $(232,053) (11,524) $(198,803) (9,887)Class 1A 1,287 64 13 1 (232) (12) 1,068 53Class 2 3,953 200 683 33 (17,914) (910) (13,278) (677)Class 4 10,770 548 334 16 (8,037) (411) 3,067 153
Total net increase (decrease) $ 45,289 2,255 $ 5,001 244 $(258,236) (12,857) $(207,946) (10,358)
Year ended December 31, 2020Class 1 $ 78,373 5,478 $17,128 948 $(179,914) (10,267) $ (84,413) (3,841)Class 1A 977 66 38 2 (791) (49) 224 19Class 2 13,943 970 2,909 161 (63,267) (3,635) (46,415) (2,504)Class 4 17,701 1,130 1,255 70 (13,000) (825) 5,956 375
Total net increase (decrease) $110,994 7,644 $21,330 1,181 $(256,972) (14,776) $(124,648) (5,951)
See end of tables for footnotes.

306 American Funds Insurance Series
Capital Income Builder
Sales*Reinvestments of
distributions Repurchases*Net (decrease)
increase
Share class Amount Shares Amount Shares Amount Shares Amount Shares
Six months ended June 30, 2021Class 1 $ 49,189 4,272 $ 6,287 542 $(232,354) (19,691) $(176,878) (14,877)Class 1A 321 28 69 6 (151) (13) 239 21Class 2 2,740 238 94 8 (277) (25) 2,557 221Class 4 38,267 3,351 4,338 374 (23,639) (2,061) 18,966 1,664
Total net increase (decrease) $ 90,517 7,889 $10,788 930 $(256,421) (21,790) $(155,116) (12,971)
Year ended December 31, 2020Class 1 $237,195 24,206 $17,285 1,757 $(178,753) (18,572) $ 75,727 7,391Class 1A 809 80 161 16 (340) (34) 630 62Class 2 2,017 200 181 18 (286) (28) 1,912 190Class 4 49,099 4,860 11,369 1,158 (58,009) (5,855) 2,459 163
Total net increase (decrease) $289,120 29,346 $28,996 2,949 $(237,388) (24,489) $ 80,728 7,806
Asset Allocation Fund
Sales*Reinvestments of
distributions Repurchases*Net increase(decrease)
Share class Amount Shares Amount Shares Amount Shares Amount Shares
Six months ended June 30, 2021Class 1 $ 619,470 22,174 $ 743,601 26,463 $ (866,828) (31,216) $ 496,243 17,421Class 1A 1,793 65 581 21 (996) (37) 1,378 49Class 2 58,876 2,153 196,496 7,078 (322,437) (11,724) (67,065) (2,493)Class 3 848 30 1,243 44 (1,235) (44) 856 30Class 4 353,897 12,936 206,427 7,487 (146,094) (5,389) 414,230 15,034
Total net increase (decrease) $1,034,884 37,358 $1,148,348 41,093 $(1,337,590) (48,410) $ 845,642 30,041
Year ended December 31, 2020Class 1 $1,817,230 79,909 $ 412,849 16,378 $(2,437,918) (107,604) $(207,839) (11,317)Class 1A 4,177 174 264 10 (1,862) (81) 2,579 103Class 2 109,553 4,668 103,653 4,169 (595,244) (25,445) (382,038) (16,608)Class 3 914 38 661 26 (4,390) (184) (2,815) (120)Class 4 410,135 17,490 89,009 3,606 (327,826) (14,043) 171,318 7,053
Total net increase (decrease) $2,342,009 102,279 $ 606,436 24,189 $(3,367,240) (147,357) $(418,795) (20,889)
See end of tables for footnotes.

American Funds Insurance Series 307
Global Balanced Fund
Sales*Reinvestments of
distributions Repurchases*Net (decrease)
increase
Share class Amount Shares Amount Shares Amount Shares Amount Shares
Six months ended June 30, 2021Class 1 $ 4,134 283 $ 666 44 $(34,106) (2,374) $(29,306) (2,047)Class 1A 679 46 20 2 (86) (6) 613 42Class 2 3,617 250 1,228 82 (11,829) (810) (6,984) (478)Class 4 16,927 1,176 711 48 (3,612) (252) 14,026 972
Total net increase (decrease) $25,357 1,755 $ 2,625 176 $(49,633) (3,442) $(21,651) (1,511)
Year ended December 31, 2020Class 1 $29,379 2,319 $ 6,831 491 $(35,963) (2,860) $ 247 (50)Class 1A 379 27 127 9 (183) (13) 323 23Class 2 10,289 792 9,760 704 (28,821) (2,185) (8,772) (689)Class 4 11,783 881 4,655 339 (10,044) (767) 6,394 453
Total net increase (decrease) $51,830 4,019 $21,373 1,543 $(75,011) (5,825) $ (1,808) (263)
The Bond Fund of America
Sales*Reinvestments of
distributions Repurchases*Net increase(decrease)
Share class Amount Shares Amount Shares Amount Shares Amount Shares
Six months ended June 30, 2021Class 1 $1,938,652 168,484 $312,925 27,791 $ (329,786) (28,255) $1,921,791 168,020Class 1A 2,848 245 451 40 (1,244) (106) 2,055 179Class 2 150,108 13,024 162,183 14,611 (128,895) (11,224) 183,396 16,411Class 4 142,549 12,420 34,213 3,096 (30,706) (2,679) 146,056 12,837
Total net increase (decrease) $2,234,157 194,173 $509,772 45,538 $ (490,631) (42,264) $2,253,298 197,447
Year ended December 31, 2020Class 1 $1,499,439 128,201 $208,932 17,767 $(1,735,112) (150,736) $ (26,741) (4,768)Class 1A 3,563 306 255 22 (1,431) (124) 2,387 204Class 2 397,055 34,256 110,645 9,541 (449,029) (39,506) 58,671 4,291Class 4 242,089 20,999 17,962 1,553 (81,119) (7,132) 178,932 15,420
Total net increase (decrease) $2,142,146 183,762 $337,794 28,883 $(2,266,691) (197,498) $ 213,249 15,147
Capital World Bond Fund
Sales*Reinvestments of
distributions Repurchases*Net (decrease)
increase
Share class Amount Shares Amount Shares Amount Shares Amount Shares
Six months ended June 30, 2021Class 1 $ 90,907 7,206 $30,543 2,487 $(255,983) (20,296) $(134,533) (10,603)Class 1A 144 11 20 2 (132) (10) 32 3Class 2 61,906 4,952 32,054 2,632 (24,529) (1,974) 69,431 5,610Class 4 9,678 787 1,782 148 (9,021) (731) 2,439 204
Total net increase (decrease) $162,635 12,956 $64,399 5,269 $(289,665) (23,011) $ (62,631) (4,786)
Year ended December 31, 2020Class 1 $279,297 22,900 $34,711 2,801 $(244,497) (20,428) $ 69,511 5,273Class 1A 323 26 18 1 (135) (11) 206 16Class 2 104,127 8,595 28,474 2,321 (140,860) (11,802) (8,259) (886)Class 4 21,389 1,754 1,457 120 (13,943) (1,171) 8,903 703
Total net increase (decrease) $405,136 33,275 $64,660 5,243 $(399,435) (33,412) $ 70,361 5,106
See end of tables for footnotes.
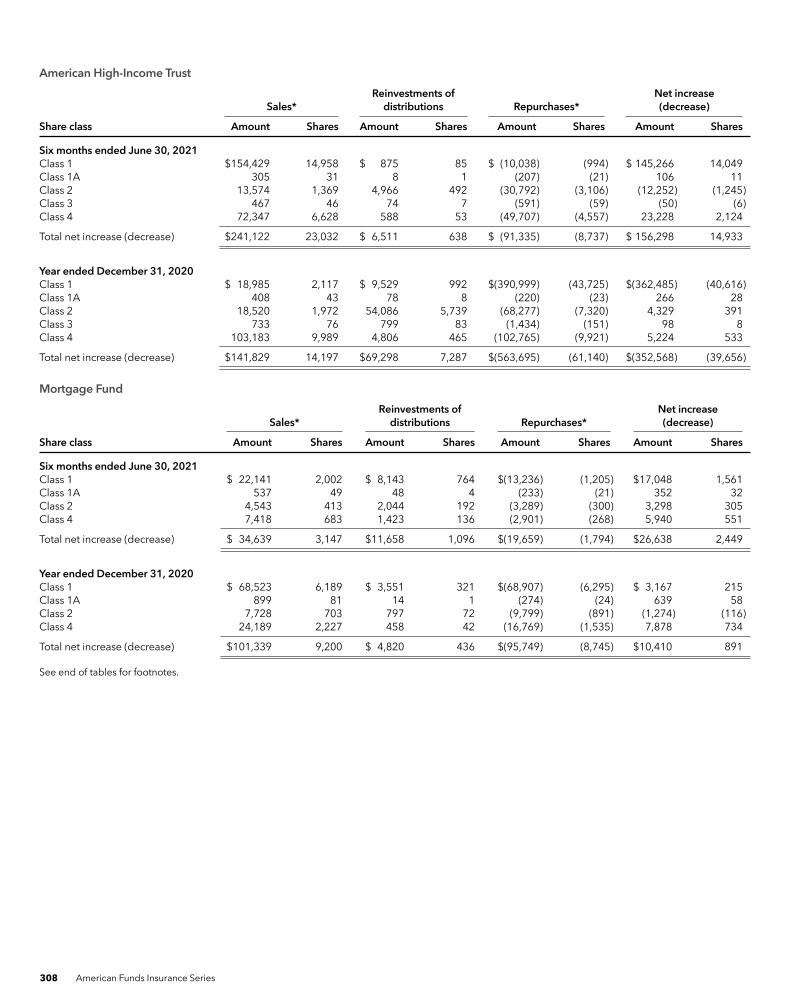
308 American Funds Insurance Series
American High-Income Trust
Sales*Reinvestments of
distributions Repurchases*Net increase(decrease)
Share class Amount Shares Amount Shares Amount Shares Amount Shares
Six months ended June 30, 2021Class 1 $154,429 14,958 $ 875 85 $ (10,038) (994) $ 145,266 14,049Class 1A 305 31 8 1 (207) (21) 106 11Class 2 13,574 1,369 4,966 492 (30,792) (3,106) (12,252) (1,245)Class 3 467 46 74 7 (591) (59) (50) (6)Class 4 72,347 6,628 588 53 (49,707) (4,557) 23,228 2,124
Total net increase (decrease) $241,122 23,032 $ 6,511 638 $ (91,335) (8,737) $ 156,298 14,933
Year ended December 31, 2020Class 1 $ 18,985 2,117 $ 9,529 992 $(390,999) (43,725) $(362,485) (40,616)Class 1A 408 43 78 8 (220) (23) 266 28Class 2 18,520 1,972 54,086 5,739 (68,277) (7,320) 4,329 391Class 3 733 76 799 83 (1,434) (151) 98 8Class 4 103,183 9,989 4,806 465 (102,765) (9,921) 5,224 533
Total net increase (decrease) $141,829 14,197 $69,298 7,287 $(563,695) (61,140) $(352,568) (39,656)
Mortgage Fund
Sales*Reinvestments of
distributions Repurchases*Net increase(decrease)
Share class Amount Shares Amount Shares Amount Shares Amount Shares
Six months ended June 30, 2021Class 1 $ 22,141 2,002 $ 8,143 764 $(13,236) (1,205) $17,048 1,561Class 1A 537 49 48 4 (233) (21) 352 32Class 2 4,543 413 2,044 192 (3,289) (300) 3,298 305Class 4 7,418 683 1,423 136 (2,901) (268) 5,940 551
Total net increase (decrease) $ 34,639 3,147 $11,658 1,096 $(19,659) (1,794) $26,638 2,449
Year ended December 31, 2020Class 1 $ 68,523 6,189 $ 3,551 321 $(68,907) (6,295) $ 3,167 215Class 1A 899 81 14 1 (274) (24) 639 58Class 2 7,728 703 797 72 (9,799) (891) (1,274) (116)Class 4 24,189 2,227 458 42 (16,769) (1,535) 7,878 734
Total net increase (decrease) $101,339 9,200 $ 4,820 436 $(95,749) (8,745) $10,410 891
See end of tables for footnotes.

American Funds Insurance Series 309
Ultra-Short Bond Fund
Sales*Reinvestments of
distributions Repurchases*Net (decrease)
increase
Share class Amount Shares Amount Shares Amount Shares Amount Shares
Six months ended June 30, 2021Class 1 $ 5,876 520 $ — — $ (12,519) (1,108) $ (6,643) (588)Class 1A — — — — — — — —Class 2 50,156 4,568 — — (80,950) (7,375) (30,794) (2,807)Class 3 542 49 — — (521) (47) 21 2Class 4 22,155 2,003 — — (19,666) (1,778) 2,489 225
Total net increase (decrease) $ 78,729 7,140 $ — — $(113,656) (10,308) $(34,927) (3,168)
Year ended December 31, 2020Class 1 $ 32,173 2,840 $104 9 $ (17,960) (1,586) $ 14,317 1,263Class 1A — — —† —† — — —† —†
Class 2 162,780 14,772 558 50 (104,954) (9,527) 58,384 5,295Class 3 2,553 229 8 1 (1,439) (129) 1,122 101Class 4 51,028 4,586 67 6 (32,890) (2,958) 18,205 1,634
Total net increase (decrease) $248,534 22,427 $737 66 $(157,243) (14,200) $ 92,028 8,293
U.S. Government Securities Fund
Sales*Reinvestments of
distributions Repurchases*Net (decrease)
increase
Share class Amount Shares Amount Shares Amount Shares Amount Shares
Six months ended June 30, 2021Class 1 $ 34,853 2,735 $ 32,361 2,771 $ (82,460) (6,462) $ (15,246) (956)Class 1A 2,726 213 464 40 (1,820) (149) 1,370 104Class 2 75,188 5,936 129,048 11,192 (59,432) (4,766) 144,804 12,362Class 3 129 10 836 72 (855) (67) 110 15Class 4 50,451 4,007 21,504 1,868 (80,347) (6,400) (8,392) (525)
Total net increase (decrease) $163,347 12,901 $184,213 15,943 $ (224,914) (17,844) $ 122,646 11,000
Year ended December 31, 2020Class 1 $194,142 14,793 $ 15,787 1,214 $(1,305,241) (98,066) $(1,095,312) (82,059)Class 1A 3,400 259 136 11 (2,557) (195) 979 75Class 2 211,715 16,419 51,919 4,038 (245,761) (18,789) 17,873 1,668Class 3 2,382 183 407 31 (1,812) (139) 977 75Class 4 301,535 23,299 9,187 715 (169,936) (13,051) 140,786 10,963
Total net increase (decrease) $713,174 54,953 $ 77,436 6,009 $(1,725,307) (130,240) $ (934,697) (69,278)
Managed Risk Growth Fund
Sales*Reinvestments of
distributions Repurchases*Net (decrease)
increase
Share class Amount Shares Amount Shares Amount Shares Amount Shares
Six months ended June 30, 2021Class P1 $ 1,457 82 $ 452 26 $ (2,346) (132) $ (437) (24)Class P2 25,688 1,464 25,039 1,458 (32,977) (1,879) 17,750 1,043
Total net increase (decrease) $27,145 1,546 $25,491 1,484 $(35,323) (2,011) $17,313 1,019
Year ended December 31, 2020Class P1 $ 3,987 282 $ 438 32 $ (1,595) (110) $ 2,830 204Class P2 54,142 3,714 24,836 1,828 (71,110) (4,841) 7,868 701
Total net increase (decrease) $58,129 3,996 $25,274 1,860 $(72,705) (4,951) $10,698 905
See end of tables for footnotes.

310 American Funds Insurance Series
Managed Risk International Fund
Sales*Reinvestments of
distributions Repurchases*Net increase(decrease)
Share class Amount Shares Amount Shares Amount Shares Amount Shares
Six months ended June 30, 2021Class P1 $ 486 42 $ 14 1 $ (400) (36) $ 100 7Class P2 5,401 487 917 81 (9,379) (836) (3,061) (268)
Total net increase (decrease) $ 5,887 529 $ 931 82 $ (9,779) (872) $(2,961) (261)
Year ended December 31, 2020Class P1 $ 1,063 104 $ 31 3 $ (311) (30) $ 783 77Class P2 14,905 1,575 3,216 348 (17,706) (1,759) 415 164
Total net increase (decrease) $15,968 1,679 $3,247 351 $(18,017) (1,789) $ 1,198 241
Managed RiskWashingtonMutual Investors Fund
Sales*Reinvestments of
distributions Repurchases*Net increase(decrease)
Share class Amount Shares Amount Shares Amount Shares Amount Shares
Six months ended June 30, 2021Class P1 $ 457 39 $ 24 2 $ (161) (14) $ 320 27Class P2 3,961 333 4,326 357 (28,108) (2,395) (19,821) (1,705)
Total net increase (decrease) $ 4,418 372 $ 4,350 359 $(28,269) (2,409) $(19,501) (1,678)
Year ended December 31, 2020Class P1 $ 947 85 $ 66 7 $ (241) (23) $ 772 69Class P2 24,832 2,333 16,834 1,640 (31,353) (2,866) 10,313 1,107
Total net increase (decrease) $25,779 2,418 $16,900 1,647 $(31,594) (2,889) $ 11,085 1,176
Managed Risk Growth-Income Fund
Sales*Reinvestments of
distributions Repurchases*Net increase(decrease)
Share class Amount Shares Amount Shares Amount Shares Amount Shares
Six months ended June 30, 2021Class P1 $ 29,746 2,054 $ 51,289 3,458 $ (76,683) (5,259) $ 4,352 253Class P2 8,779 612 7,481 508 (17,727) (1,218) (1,467) (98)
Total net increase (decrease) $ 38,525 2,666 $ 58,770 3,966 $ (94,410) (6,477) $ 2,885 155
Year ended December 31, 2020Class P1 $ 92,644 6,852 $140,694 11,020 $(143,917) (10,953) $ 89,421 6,919Class P2 24,533 1,843 20,073 1,584 (19,990) (1,489) 24,616 1,938
Total net increase (decrease) $117,177 8,695 $160,767 12,604 $(163,907) (12,442) $114,037 8,857
See end of tables for footnotes.

American Funds Insurance Series 311
Managed Risk Asset Allocation Fund
Sales*Reinvestments of
distributions Repurchases*Net increase(decrease)
Share class Amount Shares Amount Shares Amount Shares Amount Shares
Six months ended June 30, 2021Class P1 $ 595 41 $ 80 5 $ (106) (7) $ 569 39Class P2 26,974 1,915 30,961 2,147 (176,943) (12,616) (119,008) (8,554)
Total net increase (decrease) $27,569 1,956 $ 31,041 2,152 $(177,049) (12,623) $(118,439) (8,515)
Year ended December 31, 2020Class P1 $ 3,275 256 $ 204 16 $ (622) (45) $ 2,857 227Class P2 73,918 5,805 146,474 12,155 (280,685) (21,952) (60,293) (3,992)
Total net increase (decrease) $77,193 6,061 $146,678 12,171 $(281,307) (21,997) $ (57,436) (3,765)
*Includes exchanges between share classes of the fund.†Amount less than one thousand.

312 American Funds Insurance Series
11. Investment transactions and other disclosures
The following tables present additional information for each fund for the six months ended June 30, 2021 (dollars in thousands):
GlobalGrowthFund
GlobalSmall
CapitalizationFund
GrowthFund
InternationalFund
NewWorldFund
WashingtonMutualInvestorsFund
Purchases of investment securities* $913,466 $ 900,763 $6,005,499 $2,709,411 $1,019,151 $7,267,924Sales of investment securities* 949,187 1,622,002 6,886,699 3,545,484 1,017,212 8,150,667Non-U.S. taxes paid on dividend income 3,512 1,456 4,658 7,227 2,231 484Non-U.S. taxes paid on interest income — — — — 14 —Non-U.S. taxes paid on realized gains 179 2,021 — 6,391 737 —Non-U.S. taxes provided on unrealized
appreciation 6,444 12,511 — 24,162 14,066 —
CapitalWorldGrowth
and IncomeFund
Growth-IncomeFund
InternationalGrowth
and IncomeFund
CapitalIncomeBuilder
AssetAllocation
Fund
GlobalBalancedFund
Purchases of investment securities* $1,478,038 $5,484,959 $167,107 $523,544 $21,136,320 $ 86,190Sales of investment securities* 1,498,711 7,965,628 395,655 642,464 21,161,542 101,578Non-U.S. taxes paid on dividend income 1,578 6,463 1,595 866 5,080 199Non-U.S. taxes paid on interest income — — — — — 8Non-U.S. taxes paid (refunded) on realized
gains 2,560 (4) — 61 1,639 (4)Non-U.S. taxes provided on unrealized
appreciation 710 — — 129 1,684 23
The BondFund
of America
CapitalWorld Bond
Fund
AmericanHigh-Income
Trust
AmericanFunds
MortgageFund
Ultra-ShortBondFund
U.S.GovernmentSecurities
Fund
Purchases of investment securities* $33,592,753 $795,119 $416,447 $1,214,361 $— $3,261,101Sales of investment securities* 35,530,547 961,754 272,957 1,235,058 — 3,722,994Non-U.S. taxes paid on interest income 56 218 10 — — —Non-U.S. taxes paid on realized gains — 32 — — — —Non-U.S. taxes provided on unrealized
appreciation — 77 — — — —
ManagedRisk
GrowthFund
ManagedRisk
InternationalFund
ManagedRisk
WashingtonMutualInvestorsFund
ManagedRisk
Growth-IncomeFund
ManagedRiskAsset
AllocationFund
Purchases of investment securities* $145,064 $20,990 $38,330 $158,090 $ 98,352Sales of investment securities* 106,135 26,559 69,372 227,340 193,491
*Excludes short-term securities and U.S. government obligations, if any.
12. Ownership concentration
At June 30, 2021, American Funds Insurance Series - Portfolio Series - Managed Risk Growth and Income Portfolio held 21% and 15% ofthe outstanding shares of American Funds Insurance Series - Capital Income Builder and American Funds Insurance Series - CapitalWorld Growth and Income Fund, respectively. In addition, American Funds Insurance Series - Portfolio Series - Managed Risk GlobalAllocation Portfolio held 25% of the outstanding shares of American Funds Insurance Series - Global Balanced Fund.

American Funds Insurance Series 313
Net assetvalue,
beginningof period
Income (loss) frominvestment operations1 Dividends and distributions
Net assetvalue,end
of periodTotalreturn
Net assets,end of period(in millions)
Ratio ofexpensesto averagenet assets2
Ratio ofnet incometo averagenet assetsPeriod ended
Netinvestmentincome
Net gains(losses) onsecurities(both
realized andunrealized)
Total frominvestmentoperations
Dividends(from netinvestmentincome)
Distributions(from capital
gains)
Totaldividends
anddistributions
Global Growth Fund
Class 1:6/30/20213,4 $41.16 $.12 $ 4.67 $ 4.79 $(.12) $(2.17) $(2.29) $43.66 11.76%5 $4,080 .55%6 .54%6
12/31/2020 32.57 .20 9.56 9.76 (.21) (.96) (1.17) 41.16 30.79 3,309 .56 .5912/31/2019 25.74 .32 8.60 8.92 (.41) (1.68) (2.09) 32.57 35.61 2,515 .56 1.0712/31/2018 30.51 .29 (2.65) (2.36) (.28) (2.13) (2.41) 25.74 (8.81) 1,942 .55 .9812/31/2017 24.05 .26 7.30 7.56 (.26) (.84) (1.10) 30.51 31.80 2,010 .55 .9412/31/2016 26.39 .25 (.14) .11 (.29) (2.16) (2.45) 24.05 .87 1,630 .56 1.00
Class 1A:6/30/20213,4 41.02 .06 4.66 4.72 (.11) (2.17) (2.28) 43.46 11.625 14 .806 .296
12/31/2020 32.47 .12 9.52 9.64 (.13) (.96) (1.09) 41.02 30.49 12 .81 .3412/31/2019 25.69 .25 8.55 8.80 (.34) (1.68) (2.02) 32.47 35.22 8 .81 .8312/31/2018 30.46 .23 (2.66) (2.43) (.21) (2.13) (2.34) 25.69 (9.02) 5 .80 .7712/31/20173,7 24.50 .11 6.94 7.05 (.25) (.84) (1.09) 30.46 29.135 2 .806 .396
Class 2:6/30/20213,4 40.72 .06 4.62 4.68 (.11) (2.17) (2.28) 43.12 11.605 4,602 .806 .286
12/31/2020 32.24 .12 9.44 9.56 (.12) (.96) (1.08) 40.72 30.47 4,387 .81 .3412/31/2019 25.50 .24 8.51 8.75 (.33) (1.68) (2.01) 32.24 35.28 3,895 .81 .8312/31/2018 30.24 .22 (2.63) (2.41) (.20) (2.13) (2.33) 25.50 (9.04) 3,306 .80 .7312/31/2017 23.85 .19 7.23 7.42 (.19) (.84) (1.03) 30.24 31.47 4,012 .80 .6912/31/2016 26.19 .18 (.14) .04 (.22) (2.16) (2.38) 23.85 .62 3,483 .81 .76
Class 4:6/30/20213,4 40.45 .01 4.58 4.59 (.09) (2.17) (2.26) 42.78 11.475 648 1.056 .046
12/31/2020 32.05 .03 9.38 9.41 (.05) (.96) (1.01) 40.45 30.17 533 1.06 .0912/31/2019 25.39 .17 8.45 8.62 (.28) (1.68) (1.96) 32.05 34.87 382 1.06 .5712/31/2018 30.13 .14 (2.60) (2.46) (.15) (2.13) (2.28) 25.39 (9.24) 249 1.05 .4712/31/2017 23.81 .10 7.22 7.32 (.16) (.84) (1.00) 30.13 31.11 211 1.05 .3712/31/2016 26.16 .12 (.14) (.02) (.17) (2.16) (2.33) 23.81 .37 94 1.06 .50
See end of tables for footnotes.
Financial highlights

314 American Funds Insurance Series
Net assetvalue,
beginningof period
Income (loss) frominvestment operations1 Dividends and distributions
Net assetvalue,end
of periodTotalreturn
Net assets,end of period(in millions)
Ratio ofexpensesto averagenet assets2
Ratio ofnet (loss)income
to averagenet assetsPeriod ended
Netinvestment
(loss)income
Net gains(losses) onsecurities(both
realized andunrealized)
Total frominvestmentoperations
Dividends(from netinvestmentincome)
Distributions(from capital
gains)
Totaldividends
anddistributions
Global Small Capitalization Fund
Class 1:6/30/20213,4 $32.64 $(.02) $ 3.56 $ 3.54 $ — $ (.77) $ (.77) $35.41 10.86%5 $2,164 .74%6 (.13)%6
12/31/2020 26.80 (.01) 7.49 7.48 (.05) (1.59) (1.64) 32.64 30.04 2,391 .75 (.06)12/31/2019 21.75 .12 6.61 6.73 (.10) (1.58) (1.68) 26.80 31.84 2,050 .75 .4812/31/2018 25.38 .11 (2.51) (2.40) (.09) (1.14) (1.23) 21.75 (10.31) 1,453 .73 .4212/31/2017 20.24 .12 5.17 5.29 (.15) — (.15) 25.38 26.22 1,639 .73 .5412/31/2016 24.41 .12 .17 .29 (.11) (4.35) (4.46) 20.24 2.35 1,532 .74 .57
Class 1A:6/30/20213,4 32.49 (.06) 3.54 3.48 — (.77) (.77) 35.20 10.735 2 .996 (.35)6
12/31/2020 26.74 (.09) 7.48 7.39 (.05) (1.59) (1.64) 32.49 29.72 1 .99 (.33)12/31/2019 21.71 .05 6.61 6.66 (.05) (1.58) (1.63) 26.74 31.56 1 .99 .2212/31/2018 25.36 .05 (2.52) (2.47) (.04) (1.14) (1.18) 21.71 (10.56) —8 .98 .2112/31/20173,7 20.70 .08 4.71 4.79 (.13) — (.13) 25.36 23.195 —8 .966 .356
Class 2:6/30/20213,4 31.56 (.06) 3.44 3.38 — (.77) (.77) 34.17 10.725 2,720 .996 (.39)6
12/31/2020 26.02 (.08) 7.25 7.17 (.04) (1.59) (1.63) 31.56 29.72 2,653 1.00 (.31)12/31/2019 21.16 .05 6.43 6.48 (.04) (1.58) (1.62) 26.02 31.52 2,363 1.00 .2212/31/2018 24.72 .04 (2.44) (2.40) (.02) (1.14) (1.16) 21.16 (10.55) 2,056 .98 .1712/31/2017 19.72 .06 5.04 5.10 (.10) — (.10) 24.72 25.89 2,551 .98 .2712/31/2016 23.90 .07 .15 .22 (.05) (4.35) (4.40) 19.72 2.10 2,303 .99 .31
Class 4:6/30/20213,4 31.67 (.10) 3.45 3.35 — (.77) (.77) 34.25 10.565 334 1.246 (.62)6
12/31/2020 26.16 (.14) 7.27 7.13 (.03) (1.59) (1.62) 31.67 29.39 268 1.25 (.56)12/31/2019 21.28 (.01) 6.47 6.46 —9 (1.58) (1.58) 26.16 31.24 206 1.25 (.04)12/31/2018 24.91 (.02) (2.46) (2.48) (.01) (1.14) (1.15) 21.28 (10.80) 146 1.24 (.08)12/31/2017 19.91 —9 5.09 5.09 (.09) — (.09) 24.91 25.62 125 1.23 —10
12/31/2016 24.11 .01 .16 .17 (.02) (4.35) (4.37) 19.91 1.85 42 1.24 .03
See end of tables for footnotes.
Financial highlights (continued)

American Funds Insurance Series 315
Net assetvalue,
beginningof period
Income frominvestment operations1 Dividends and distributions
Net assetvalue,end
of periodTotalreturn
Net assets,end of period(in millions)
Ratio ofexpensesto averagenet assets2
Ratio ofnet income
(loss)to averagenet assetsPeriod ended
Netinvestmentincome(loss)
Net gainson securities
(bothrealized andunrealized)
Total frominvestmentoperations
Dividends(from netinvestmentincome)
Distributions(from capital
gains)
Totaldividends
anddistributions
Growth Fund
Class 1:6/30/20213,4 $120.22 $ .25 $14.79 $15.04 $(.16) $(16.81) $(16.97) $118.29 13.03%5 $17,535 .35%6 .40%6
12/31/2020 81.22 .43 41.28 41.71 (.53) (2.18) (2.71) 120.22 52.45 15,644 .35 .4612/31/2019 69.96 .83 19.63 20.46 (.76) (8.44) (9.20) 81.22 31.11 10,841 .35 1.0912/31/2018 77.85 .64 .25 .89 (.54) (8.24) (8.78) 69.96 (.01) 8,474 .34 .8112/31/2017 67.29 .55 17.89 18.44 (.55) (7.33) (7.88) 77.85 28.62 8,100 .35 .7512/31/2016 68.02 .67 5.40 6.07 (.67) (6.13) (6.80) 67.29 9.77 6,931 .35 1.03
Class 1A:6/30/20213,4 119.59 .10 14.69 14.79 (.12) (16.81) (16.93) 117.45 12.875 79 .606 .166
12/31/2020 80.92 .20 41.05 41.25 (.40) (2.18) (2.58) 119.59 52.07 60 .60 .2112/31/2019 69.77 .65 19.55 20.20 (.61) (8.44) (9.05) 80.92 30.79 18 .60 .8512/31/2018 77.74 .47 .24 .71 (.44) (8.24) (8.68) 69.77 (.26) 10 .59 .6012/31/20173,7 68.84 .35 16.38 16.73 (.50) (7.33) (7.83) 77.74 25.475 3 .596 .476
Class 2:6/30/20213,4 119.18 .09 14.65 14.74 (.11) (16.81) (16.92) 117.00 12.875 21,673 .606 .156
12/31/2020 80.57 .19 40.89 41.08 (.29) (2.18) (2.47) 119.18 52.10 20,594 .60 .2112/31/2019 69.48 .63 19.47 20.10 (.57) (8.44) (9.01) 80.57 30.77 15,885 .60 .8312/31/2018 77.35 .44 .27 .71 (.34) (8.24) (8.58) 69.48 (.25) 13,701 .59 .5512/31/2017 66.92 .37 17.76 18.13 (.37) (7.33) (7.70) 77.35 28.28 15,716 .60 .5012/31/2016 67.69 .51 5.36 5.87 (.51) (6.13) (6.64) 66.92 9.49 13,978 .60 .78
Class 3:6/30/20213,4 121.13 .14 14.91 15.05 (.13) (16.81) (16.94) 119.24 12.915 298 .536 .226
12/31/2020 81.84 .26 41.56 41.82 (.35) (2.18) (2.53) 121.13 52.20 279 .53 .2812/31/2019 70.44 .69 19.77 20.46 (.62) (8.44) (9.06) 81.84 30.86 213 .53 .9012/31/2018 78.32 .50 .26 .76 (.40) (8.24) (8.64) 70.44 (.18) 187 .52 .6212/31/2017 67.67 .42 17.98 18.40 (.42) (7.33) (7.75) 78.32 28.39 212 .53 .5712/31/2016 68.37 .56 5.42 5.98 (.55) (6.13) (6.68) 67.67 9.56 183 .53 .85
Class 4:6/30/20213,4 117.24 (.06) 14.40 14.34 (.08) (16.81) (16.89) 114.69 12.745 2,829 .856 (.10)6
12/31/2020 79.41 (.04) 40.24 40.20 (.19) (2.18) (2.37) 117.24 51.71 2,347 .85 (.04)12/31/2019 68.64 .44 19.19 19.63 (.42) (8.44) (8.86) 79.41 30.44 1,513 .85 .5912/31/2018 76.56 .24 .28 .52 (.20) (8.24) (8.44) 68.64 (.50) 1,076 .84 .3112/31/2017 66.41 .18 17.61 17.79 (.31) (7.33) (7.64) 76.56 27.99 954 .85 .2512/31/2016 67.26 .34 5.32 5.66 (.38) (6.13) (6.51) 66.41 9.22 458 .85 .53
See end of tables for footnotes.
Financial highlights (continued)

316 American Funds Insurance Series
Net assetvalue,
beginningof period
Income (loss) frominvestment operations1 Dividends and distributions
Net assetvalue,end
of periodTotalreturn
Net assets,end of period(in millions)
Ratio ofexpensesto averagenet assets2
Ratio ofnet incometo averagenet assetsPeriod ended
Netinvestmentincome
Net gains(losses) onsecurities(both
realized andunrealized)
Total frominvestmentoperations
Dividends(from netinvestmentincome)
Distributions(from capital
gains)
Totaldividends
anddistributions
International Fund
Class 1:6/30/20213,4 $23.64 $.14 $ .97 $ 1.11 $(.01) $ — $ (.01) $24.74 4.71%5 $5,060 .55%6 1.17%6
12/31/2020 20.86 .14 2.82 2.96 (.18) — (.18) 23.64 14.28 5,652 .55 .7112/31/2019 17.66 .30 3.74 4.04 (.34) (.50) (.84) 20.86 23.21 5,353 .54 1.5412/31/2018 21.71 .34 (2.97) (2.63) (.40) (1.02) (1.42) 17.66 (12.94) 4,811 .53 1.6212/31/2017 16.82 .26 5.16 5.42 (.30) (.23) (.53) 21.71 32.46 5,014 .53 1.3312/31/2016 18.08 .27 .30 .57 (.28) (1.55) (1.83) 16.82 3.78 3,652 .54 1.57
Class 1A:6/30/20213,4 23.55 .12 .96 1.08 —9 — —9 24.63 4.615 10 .806 .976
12/31/2020 20.80 .08 2.81 2.89 (.14) — (.14) 23.55 13.96 10 .80 .4312/31/2019 17.62 .25 3.72 3.97 (.29) (.50) (.79) 20.80 22.90 7 .79 1.2712/31/2018 21.67 .27 (2.93) (2.66) (.37) (1.02) (1.39) 17.62 (13.11) 5 .78 1.3212/31/20173,7 17.17 .09 4.93 5.02 (.29) (.23) (.52) 21.67 29.465 2 .776 .436
Class 2:6/30/20213,4 23.54 .11 .97 1.08 —9 — —9 24.62 4.615 4,492 .806 .946
12/31/2020 20.78 .09 2.80 2.89 (.13) — (.13) 23.54 13.97 4,481 .80 .4612/31/2019 17.60 .25 3.72 3.97 (.29) (.50) (.79) 20.78 22.88 4,311 .79 1.2912/31/2018 21.63 .29 (2.95) (2.66) (.35) (1.02) (1.37) 17.60 (13.13) 3,875 .78 1.4012/31/2017 16.76 .22 5.13 5.35 (.25) (.23) (.48) 21.63 32.14 4,422 .78 1.1012/31/2016 18.02 .23 .30 .53 (.24) (1.55) (1.79) 16.76 3.53 3,710 .79 1.35
Class 3:6/30/20213,4 23.69 .12 .99 1.11 (.01) — (.01) 24.79 4.675 24 .736 1.006
12/31/2020 20.92 .10 2.81 2.91 (.14) — (.14) 23.69 14.00 25 .73 .5312/31/2019 17.70 .27 3.75 4.02 (.30) (.50) (.80) 20.92 23.05 25 .72 1.3712/31/2018 21.75 .31 (2.98) (2.67) (.36) (1.02) (1.38) 17.70 (13.10) 24 .71 1.4812/31/2017 16.85 .23 5.17 5.40 (.27) (.23) (.50) 21.75 32.23 31 .71 1.1712/31/2016 18.11 .24 .30 .54 (.25) (1.55) (1.80) 16.85 3.57 27 .72 1.42
Class 4:6/30/20213,4 23.25 .08 .96 1.04 — — — 24.29 4.475 459 1.056 .716
12/31/2020 20.54 .04 2.76 2.80 (.09) — (.09) 23.25 13.66 423 1.05 .2112/31/2019 17.40 .20 3.69 3.89 (.25) (.50) (.75) 20.54 22.67 379 1.04 1.0312/31/2018 21.42 .23 (2.93) (2.70) (.30) (1.02) (1.32) 17.40 (13.41) 295 1.03 1.1312/31/2017 16.64 .11 5.16 5.27 (.26) (.23) (.49) 21.42 31.89 289 1.03 .5512/31/2016 17.93 .18 .29 .47 (.21) (1.55) (1.76) 16.64 3.21 66 1.04 1.03
See end of tables for footnotes.
Financial highlights (continued)

American Funds Insurance Series 317
Net assetvalue,
beginningof period
Income (loss) frominvestment operations1 Dividends and distributions
Net assetvalue,end
of periodTotal
return11
Net assets,end of period(in millions)
Ratio ofexpenses toaverage netassets beforewaivers2
Ratio ofexpenses toaverage netassets afterwaivers2,11
Ratio ofnet incometo averagenet assets11Period ended
Netinvestmentincome
Net gains(losses) onsecurities(both
realized andunrealized)
Total frominvestmentoperations
Dividends(from netinvestmentincome)
Distributions(from capital
gains)
Totaldividends
anddistributions
NewWorld Fund
Class 1:6/30/20213,4 $31.59 $.14 $ 3.07 $ 3.21 $(.09) $(1.07) $(1.16) $33.64 10.21%5 $2,542 .74%6 .56%6 .85%6
12/31/2020 25.84 .15 5.93 6.08 (.06) (.27) (.33) 31.59 23.89 2,309 .76 .64 .5812/31/2019 20.98 .28 5.79 6.07 (.29) (.92) (1.21) 25.84 29.47 2,129 .76 .76 1.1812/31/2018 25.30 .27 (3.65) (3.38) (.27) (.67) (.94) 20.98 (13.83) 1,702 .77 .77 1.1112/31/2017 19.72 .26 5.59 5.85 (.27) — (.27) 25.30 29.73 2,050 .77 .77 1.1412/31/2016 18.87 .24 .81 1.05 (.20) — (.20) 19.72 5.59 1,743 .78 .78 1.25
Class 1A:6/30/20213,4 31.43 .07 3.07 3.14 (.06) (1.07) (1.13) 33.44 10.055 9 .996 .816 .466
12/31/2020 25.74 .07 5.92 5.99 (.03) (.27) (.30) 31.43 23.63 18 1.01 .87 .2612/31/2019 20.92 .22 5.76 5.98 (.24) (.92) (1.16) 25.74 29.11 4 1.01 1.01 .9212/31/2018 25.25 .21 (3.64) (3.43) (.23) (.67) (.90) 20.92 (14.02) 2 1.02 1.02 .9112/31/20173,7 20.14 .13 5.24 5.37 (.26) — (.26) 25.25 26.725 1 1.006 1.006 .536
Class 2:6/30/20213,4 31.25 .10 3.04 3.14 (.08) (1.07) (1.15) 33.24 10.095 1,163 .996 .816 .596
12/31/2020 25.59 .08 5.87 5.95 (.02) (.27) (.29) 31.25 23.58 1,109 1.01 .89 .3412/31/2019 20.79 .22 5.73 5.95 (.23) (.92) (1.15) 25.59 29.15 981 1.01 1.01 .9312/31/2018 25.07 .20 (3.61) (3.41) (.20) (.67) (.87) 20.79 (14.04) 843 1.02 1.02 .8512/31/2017 19.54 .20 5.55 5.75 (.22) — (.22) 25.07 29.44 1,055 1.02 1.02 .8912/31/2016 18.71 .19 .79 .98 (.15) — (.15) 19.54 5.26 911 1.03 1.03 1.00
Class 4:6/30/20213,4 31.04 .06 3.00 3.06 (.06) (1.07) (1.13) 32.97 9.925 913 1.246 1.066 .356
12/31/2020 25.47 .02 5.83 5.85 (.01) (.27) (.28) 31.04 23.29 807 1.26 1.14 .0812/31/2019 20.71 .16 5.70 5.86 (.18) (.92) (1.10) 25.47 28.82 646 1.26 1.26 .6712/31/2018 24.99 .14 (3.59) (3.45) (.16) (.67) (.83) 20.71 (14.25) 464 1.27 1.27 .6112/31/2017 19.51 .14 5.52 5.66 (.18) — (.18) 24.99 29.06 427 1.27 1.27 .6112/31/2016 18.69 .14 .80 .94 (.12) — (.12) 19.51 5.04 240 1.28 1.28 .75
See end of tables for footnotes.
Financial highlights (continued)

318 American Funds Insurance Series
Net assetvalue,
beginningof period
Income (loss) frominvestment operations1 Dividends and distributions
Net assetvalue,end
of periodTotal
return11
Net assets,end of period(in millions)
Ratio ofexpenses toaverage netassets beforewaivers2
Ratio ofexpenses toaverage netassets afterwaivers2,11
Ratio ofnet incometo averagenet assets11Period ended
Netinvestmentincome
Net gains(losses) onsecurities(both
realized andunrealized)
Total frominvestmentoperations
Dividends(from netinvestmentincome)
Distributions(from capital
gains)
Totaldividends
anddistributions
Washington Mutual Investors Fund
Class 1:6/30/20213,4 $14.35 $.13 $ 2.04 $ 2.17 $(.06) $ — $ (.06) $16.46 15.14%5 $5,803 .42%6 .37%6 1.66%6
12/31/2020 13.56 .25 .95 1.20 (.26) (.15) (.41) 14.35 9.04 5,684 .43 .43 2.0012/31/2019 12.38 .30 2.25 2.55 (.30) (1.07) (1.37) 13.56 21.66 5,559 .42 .42 2.2812/31/2018 14.96 .31 (1.44) (1.13) (.31) (1.14) (1.45) 12.38 (8.45) 4,810 .41 .41 2.1312/31/2017 13.53 .32 1.96 2.28 (.32) (.53) (.85) 14.96 17.30 5,581 .41 .41 2.2712/31/2016 12.62 .31 1.97 2.28 (.29) (1.08) (1.37) 13.53 19.06 5,099 .41 .41 2.39
Class 1A:6/30/20213,4 14.28 .12 2.02 2.14 (.06) — (.06) 16.36 15.005 111 .676 .576 1.486
12/31/2020 13.51 .23 .93 1.16 (.24) (.15) (.39) 14.28 8.79 25 .67 .67 1.7812/31/2019 12.35 .26 2.24 2.50 (.27) (1.07) (1.34) 13.51 21.35 9 .67 .67 2.0312/31/2018 14.94 .26 (1.42) (1.16) (.29) (1.14) (1.43) 12.35 (8.67) 3 .66 .66 1.8412/31/20173,7 13.75 .28 1.75 2.03 (.31) (.53) (.84) 14.94 15.215 1 .656 .656 2.016
Class 2:6/30/20213,4 14.15 .11 2.02 2.13 (.06) — (.06) 16.22 15.035 3,283 .676 .626 1.416
12/31/2020 13.39 .22 .91 1.13 (.22) (.15) (.37) 14.15 8.68 3,082 .68 .68 1.7512/31/2019 12.24 .26 2.22 2.48 (.26) (1.07) (1.33) 13.39 21.38 3,093 .67 .67 2.0312/31/2018 14.80 .27 (1.42) (1.15) (.27) (1.14) (1.41) 12.24 (8.66) 2,850 .66 .66 1.8812/31/2017 13.39 .28 1.94 2.22 (.28) (.53) (.81) 14.80 17.04 3,551 .66 .66 2.0212/31/2016 12.51 .28 1.94 2.22 (.26) (1.08) (1.34) 13.39 18.70 3,412 .66 .66 2.16
Class 4:6/30/20213,4 14.06 .09 2.00 2.09 (.05) — (.05) 16.10 14.885 951 .926 .876 1.166
12/31/2020 13.31 .19 .91 1.10 (.20) (.15) (.35) 14.06 8.47 788 .93 .93 1.5112/31/2019 12.19 .23 2.20 2.43 (.24) (1.07) (1.31) 13.31 21.03 621 .92 .92 1.7812/31/2018 14.77 .23 (1.42) (1.19) (.25) (1.14) (1.39) 12.19 (8.92) 368 .91 .91 1.6212/31/2017 13.39 .25 1.93 2.18 (.27) (.53) (.80) 14.77 16.70 247 .91 .91 1.7612/31/2016 12.53 .24 1.96 2.20 (.26) (1.08) (1.34) 13.39 18.49 132 .91 .91 1.81
See end of tables for footnotes.
Financial highlights (continued)

American Funds Insurance Series 319
Net assetvalue,
beginningof period
Income (loss) frominvestment operations1 Dividends and distributions
Net assetvalue,end
of periodTotal
return11
Net assets,end of period(in millions)
Ratio ofexpenses toaverage netassets beforewaivers2
Ratio ofexpenses toaverage netassets afterwaivers2,11
Ratio ofnet incometo averagenet assets11Period ended
Netinvestmentincome
Net gains(losses) onsecurities(both
realized andunrealized)
Total frominvestmentoperations
Dividends(from netinvestmentincome)
Distributions(from capital
gains)
Totaldividends
anddistributions
Capital World Growth and Income Fund
Class 1:6/30/20213,4 $16.67 $.15 $ 1.53 $ 1.68 $(.04) $ (.40) $ (.44) $17.91 10.06%5 $ 785 .63%6 .55%6 1.71%6
12/31/2020 15.92 .22 1.14 1.36 (.23) (.38) (.61) 16.67 9.03 657 .66 .66 1.4912/31/2019 13.02 .31 3.67 3.98 (.32) (.76) (1.08) 15.92 31.39 625 .65 .65 2.0812/31/2018 15.81 .29 (1.62) (1.33) (.28) (1.18) (1.46) 13.02 (9.36) 492 .63 .63 1.9412/31/2017 13.02 .35 3.06 3.41 (.36) (.26) (.62) 15.81 26.40 485 .63 .63 2.4312/31/2016 12.35 .28 .66 .94 (.27) — (.27) 13.02 7.61 571 .63 .63 2.18
Class 1A:6/30/20213,4 16.62 .14 1.51 1.65 (.03) (.40) (.43) 17.84 9.945 3 .886 .806 1.566
12/31/2020 15.88 .18 1.13 1.31 (.19) (.38) (.57) 16.62 8.78 2 .90 .90 1.2312/31/2019 13.00 .26 3.68 3.94 (.30) (.76) (1.06) 15.88 31.04 2 .90 .90 1.7712/31/2018 15.81 .26 (1.63) (1.37) (.26) (1.18) (1.44) 13.00 (9.62) 1 .88 .88 1.7412/31/20173,7 13.21 .18 3.03 3.21 (.35) (.26) (.61) 15.81 24.545 —8 .846 .846 1.206
Class 2:6/30/20213,4 16.63 .13 1.53 1.66 (.03) (.40) (.43) 17.86 9.985 1,368 .886 .816 1.456
12/31/2020 15.89 .18 1.13 1.31 (.19) (.38) (.57) 16.63 8.73 1,349 .91 .91 1.2312/31/2019 12.99 .27 3.68 3.95 (.29) (.76) (1.05) 15.89 31.14 1,366 .90 .90 1.8412/31/2018 15.78 .26 (1.63) (1.37) (.24) (1.18) (1.42) 12.99 (9.63) 1,228 .88 .88 1.7012/31/2017 13.00 .31 3.05 3.36 (.32) (.26) (.58) 15.78 26.06 1,538 .88 .88 2.1112/31/2016 12.33 .25 .65 .90 (.23) — (.23) 13.00 7.34 1,405 .88 .88 1.98
Class 4:6/30/20213,4 16.35 .10 1.51 1.61 (.03) (.40) (.43) 17.53 9.825 202 1.136 1.056 1.226
12/31/2020 15.63 .14 1.12 1.26 (.16) (.38) (.54) 16.35 8.55 166 1.16 1.16 .9712/31/2019 12.81 .23 3.61 3.84 (.26) (.76) (1.02) 15.63 30.73 145 1.15 1.15 1.5612/31/2018 15.60 .21 (1.60) (1.39) (.22) (1.18) (1.40) 12.81 (9.89) 95 1.13 1.13 1.4312/31/2017 12.89 .22 3.08 3.30 (.33) (.26) (.59) 15.60 25.83 79 1.14 1.14 1.4912/31/2016 12.26 .21 .65 .86 (.23) — (.23) 12.89 7.04 16 1.13 1.13 1.63
See end of tables for footnotes.
Financial highlights (continued)

320 American Funds Insurance Series
Net assetvalue,
beginningof period
Income (loss) frominvestment operations1 Dividends and distributions
Net assetvalue,end
of periodTotalreturn
Net assets,end of period(in millions)
Ratio ofexpensesto averagenet assets2
Ratio ofnet incometo averagenet assetsPeriod ended
Netinvestmentincome
Net gains(losses) onsecurities(both
realized andunrealized)
Total frominvestmentoperations
Dividends(from netinvestmentincome)
Distributions(from capital
gains)
Totaldividends
anddistributions
Growth-Income Fund
Class 1:6/30/20213,4 $55.38 $ .38 $ 7.53 $ 7.91 $(.25) $ (.60) $ (.85) $62.44 14.30%5 $24,114 .29%6 1.30%6
12/31/2020 50.71 .75 6.02 6.77 (.80) (1.30) (2.10) 55.38 13.81 22,903 .29 1.5212/31/2019 45.39 1.00 10.40 11.40 (.92) (5.16) (6.08) 50.71 26.46 21,057 .29 2.0512/31/2018 50.22 .84 (1.25) (.41) (.84) (3.58) (4.42) 45.39 (1.55) 16,783 .28 1.6512/31/2017 44.41 .81 8.89 9.70 (.78) (3.11) (3.89) 50.22 22.68 15,765 .28 1.6912/31/2016 45.40 .79 4.09 4.88 (.75) (5.12) (5.87) 44.41 11.80 12,588 .29 1.79
Class 1A:6/30/20213,4 55.16 .31 7.48 7.79 (.23) (.60) (.83) 62.12 14.145 20 .546 1.066
12/31/2020 50.54 .63 5.99 6.62 (.70) (1.30) (2.00) 55.16 13.55 16 .54 1.2812/31/2019 45.28 .89 10.36 11.25 (.83) (5.16) (5.99) 50.54 26.14 11 .54 1.8212/31/2018 50.15 .72 (1.25) (.53) (.76) (3.58) (4.34) 45.28 (1.78) 7 .53 1.4312/31/20173,7 45.39 .67 7.96 8.63 (.76) (3.11) (3.87) 50.15 19.835 2 .526 1.416
Class 2:6/30/20213,4 54.66 .30 7.42 7.72 (.23) (.60) (.83) 61.55 14.145 14,983 .546 1.056
12/31/2020 50.08 .62 5.93 6.55 (.67) (1.30) (1.97) 54.66 13.54 14,012 .54 1.2712/31/2019 44.90 .87 10.27 11.14 (.80) (5.16) (5.96) 50.08 26.14 13,586 .53 1.8012/31/2018 49.71 .71 (1.23) (.52) (.71) (3.58) (4.29) 44.90 (1.79) 12,035 .53 1.4012/31/2017 44.00 .68 8.80 9.48 (.66) (3.11) (3.77) 49.71 22.38 13,930 .53 1.4512/31/2016 45.04 .67 4.05 4.72 (.64) (5.12) (5.76) 44.00 11.51 12,854 .54 1.54
Class 3:6/30/20213,4 55.49 .33 7.53 7.86 (.23) (.60) (.83) 62.52 14.195 165 .476 1.126
12/31/2020 50.81 .66 6.02 6.68 (.70) (1.30) (2.00) 55.49 13.60 154 .47 1.3412/31/2019 45.47 .91 10.43 11.34 (.84) (5.16) (6.00) 50.81 26.24 156 .46 1.8712/31/2018 50.29 .75 (1.25) (.50) (.74) (3.58) (4.32) 45.47 (1.72) 140 .46 1.4712/31/2017 44.47 .72 8.90 9.62 (.69) (3.11) (3.80) 50.29 22.47 168 .46 1.5212/31/2016 45.46 .71 4.09 4.80 (.67) (5.12) (5.79) 44.47 11.59 156 .47 1.61
Class 4:6/30/20213,4 53.99 .23 7.32 7.55 (.21) (.60) (.81) 60.73 14.005 1,695 .796 .816
12/31/2020 49.52 .49 5.85 6.34 (.57) (1.30) (1.87) 53.99 13.25 1,407 .79 1.0212/31/2019 44.47 .74 10.18 10.92 (.71) (5.16) (5.87) 49.52 25.86 1,216 .79 1.5612/31/2018 49.31 .58 (1.23) (.65) (.61) (3.58) (4.19) 44.47 (2.05) 899 .78 1.1512/31/2017 43.73 .56 8.73 9.29 (.60) (3.11) (3.71) 49.31 22.08 827 .78 1.1912/31/2016 44.82 .56 4.02 4.58 (.55) (5.12) (5.67) 43.73 11.25 495 .79 1.29
See end of tables for footnotes.
Financial highlights (continued)

American Funds Insurance Series 321
Net assetvalue,
beginningof period
Income (loss) frominvestment operations1 Dividends and distributions
Net assetvalue,end
of periodTotalreturn
Net assets,end of period(in millions)
Ratio ofexpensesto averagenet assets2
Ratio ofnet incometo averagenet assetsPeriod ended
Netinvestmentincome
Net gains(losses) onsecurities(both
realized andunrealized)
Total frominvestmentoperations
Dividends(from netinvestmentincome)
Distributions(from capital
gains)
Totaldividends
anddistributions
International Growth and Income Fund
Class 1:6/30/20213,4 $19.01 $.24 $ 1.13 $ 1.37 $(.07) $ — $(.07) $20.31 7.20%5 $ 995 .67%6 2.39%6
12/31/2020 18.18 .27 .85 1.12 (.29) — (.29) 19.01 6.24 1,120 .68 1.7012/31/2019 15.35 .46 3.03 3.49 (.47) (.19) (.66) 18.18 23.06 1,140 .66 2.7312/31/2018 17.72 .45 (2.39) (1.94) (.43) — (.43) 15.35 (11.00) 1,034 .65 2.6212/31/2017 14.48 .46 3.20 3.66 (.42) — (.42) 17.72 25.31 1,121 .66 2.7512/31/2016 14.72 .43 (.19) .24 (.42) (.06) (.48) 14.48 1.71 820 .68 2.93
Class 1A:6/30/20213,4 18.97 .21 1.13 1.34 (.06) — (.06) 20.25 7.085 4 .916 2.186
12/31/2020 18.15 .22 .85 1.07 (.25) — (.25) 18.97 5.98 3 .93 1.3812/31/2019 15.33 .41 3.04 3.45 (.44) (.19) (.63) 18.15 22.76 2 .91 2.4112/31/2018 17.70 .41 (2.39) (1.98) (.39) — (.39) 15.33 (11.24) 2 .90 2.3512/31/20173,7 14.69 .34 3.08 3.42 (.41) — (.41) 17.70 23.365 2 .916 1.996
Class 2:6/30/20213,4 18.95 .21 1.12 1.33 (.06) — (.06) 20.22 7.025 222 .916 2.176
12/31/2020 18.12 .23 .85 1.08 (.25) — (.25) 18.95 6.01 221 .93 1.4312/31/2019 15.30 .42 3.02 3.44 (.43) (.19) (.62) 18.12 22.76 257 .91 2.4912/31/2018 17.66 .41 (2.38) (1.97) (.39) — (.39) 15.30 (11.23) 230 .90 2.3812/31/2017 14.43 .43 3.17 3.60 (.37) — (.37) 17.66 25.03 276 .91 2.6012/31/2016 14.68 .40 (.21) .19 (.38) (.06) (.44) 14.43 1.44 244 .93 2.72
Class 4:6/30/20213,4 18.82 .19 1.11 1.30 (.06) — (.06) 20.06 6.885 123 1.166 1.936
12/31/2020 18.01 .19 .83 1.02 (.21) — (.21) 18.82 5.73 112 1.18 1.1912/31/2019 15.22 .37 3.01 3.38 (.40) (.19) (.59) 18.01 22.47 101 1.16 2.1812/31/2018 17.58 .36 (2.36) (2.00) (.36) — (.36) 15.22 (11.46) 71 1.15 2.1012/31/2017 14.38 .37 3.18 3.55 (.35) — (.35) 17.58 24.72 63 1.16 2.2412/31/2016 14.63 .36 (.19) .17 (.36) (.06) (.42) 14.38 1.18 37 1.18 2.43
See end of tables for footnotes.
Financial highlights (continued)

322 American Funds Insurance Series
Net assetvalue,
beginningof period
Income (loss) frominvestment operations1 Dividends and distributions
Net assetvalue,end
of periodTotal
return11
Net assets,end of period(in millions)
Ratio ofexpenses toaverage netassets beforewaivers2
Ratio ofexpenses toaverage netassets afterwaivers2,11
Ratio ofnet incometo averagenet assets11Period ended
Netinvestmentincome
Net gains(losses) onsecurities(both
realized andunrealized)
Total frominvestmentoperations
Dividends(from netinvestmentincome)
Distributions(from capital
gains)
Totaldividends
anddistributions
Capital Income Builder
Class 1:6/30/20213,4 $10.87 $.19 $ .88 $1.07 $(.13) $ — $(.13) $11.81 9.85%5 $499 .53%6 .27%6 3.31%6
12/31/2020 10.73 .31 .15 .46 (.32) — (.32) 10.87 4.64 621 .53 .35 3.0712/31/2019 9.37 .32 1.36 1.68 (.32) — (.32) 10.73 18.16 533 .53 .53 3.1712/31/2018 10.40 .31 (1.00) (.69) (.32) (.02) (.34) 9.37 (6.77) 317 .54 .54 3.0812/31/2017 9.46 .32 .93 1.25 (.31) — (.31) 10.40 13.29 254 .54 .54 3.2112/31/2016 9.40 .32 .07 .39 (.33) — (.33) 9.46 4.17 156 .54 .54 3.39
Class 1A:6/30/20213,4 10.86 .18 .87 1.05 (.11) — (.11) 11.80 9.725 7 .786 .526 3.096
12/31/2020 10.72 .28 .16 .44 (.30) — (.30) 10.86 4.38 6 .78 .60 2.8112/31/2019 9.36 .29 1.37 1.66 (.30) — (.30) 10.72 17.90 6 .78 .78 2.8412/31/2018 10.39 .28 (.99) (.71) (.30) (.02) (.32) 9.36 (7.01) 2 .79 .79 2.8212/31/20173,7 9.57 .27 .84 1.11 (.29) — (.29) 10.39 11.725 1 .796 .796 2.636
Class 2:6/30/20213,4 10.87 .18 .87 1.05 (.11) — (.11) 11.81 9.725 11 .786 .526 3.116
12/31/2020 10.72 .29 .16 .45 (.30) — (.30) 10.87 4.48 8 .78 .60 2.8312/31/2019 9.36 .30 1.35 1.65 (.29) — (.29) 10.72 17.89 6 .78 .78 2.9112/31/2018 10.40 .28 (1.00) (.72) (.30) (.02) (.32) 9.36 (7.08) 4 .79 .79 2.8312/31/2017 9.46 .29 .93 1.22 (.28) — (.28) 10.40 13.04 1 .79 .79 2.8212/31/2016 9.40 .27 .11 .38 (.32) — (.32) 9.46 4.08 —8 .80 .80 2.82
Class 4:6/30/20213,4 10.85 .16 .88 1.04 (.10) — (.10) 11.79 9.605 522 1.036 .776 2.846
12/31/2020 10.71 .26 .15 .41 (.27) — (.27) 10.85 4.11 462 1.03 .85 2.5512/31/2019 9.35 .27 1.36 1.63 (.27) — (.27) 10.71 17.62 454 1.03 1.03 2.6812/31/2018 10.38 .26 (1.00) (.74) (.27) (.02) (.29) 9.35 (7.25) 352 1.04 1.04 2.5812/31/2017 9.45 .27 .92 1.19 (.26) — (.26) 10.38 12.65 338 1.04 1.04 2.7212/31/2016 9.38 .27 .08 .35 (.28) — (.28) 9.45 3.78 256 1.04 1.04 2.88
See end of tables for footnotes.
Financial highlights (continued)

American Funds Insurance Series 323
Net assetvalue,
beginningof period
Income (loss) frominvestment operations1 Dividends and distributions
Net assetvalue,end
of periodTotalreturn
Net assets,end of period(in millions)
Ratio ofexpensesto averagenet assets2
Ratio ofnet incometo averagenet assetsPeriod ended
Netinvestmentincome
Net gains(losses) onsecurities(both
realized andunrealized)
Total frominvestmentoperations
Dividends(from netinvestmentincome)
Distributions(from capital
gains)
Totaldividends
anddistributions
Asset Allocation Fund
Class 1:6/30/20213,4 $26.50 $.23 $ 2.48 $ 2.71 $(.10) $ (.94) $(1.04) $28.17 10.22%5 $20,941 .30%6 1.67%6
12/31/2020 24.05 .43 2.59 3.02 (.46) (.11) (.57) 26.50 12.71 19,238 .30 1.8012/31/2019 21.29 .51 3.94 4.45 (.50) (1.19) (1.69) 24.05 21.54 17,730 .29 2.2112/31/2018 23.71 .48 (1.43) (.95) (.44) (1.03) (1.47) 21.29 (4.35) 14,627 .28 2.0412/31/2017 21.68 .44 3.06 3.50 (.41) (1.06) (1.47) 23.71 16.51 16,556 .29 1.9012/31/2016 20.62 .42 1.54 1.96 (.39) (.51) (.90) 21.68 9.69 13,008 .29 1.97
Class 1A:6/30/20213,4 26.42 .20 2.47 2.67 (.09) (.94) (1.03) 28.06 10.105 17 .556 1.436
12/31/2020 23.99 .37 2.58 2.95 (.41) (.11) (.52) 26.42 12.43 14 .55 1.5612/31/2019 21.26 .45 3.92 4.37 (.45) (1.19) (1.64) 23.99 21.19 11 .54 1.9512/31/2018 23.69 .42 (1.42) (1.00) (.40) (1.03) (1.43) 21.26 (4.58) 7 .53 1.8212/31/20173,7 21.97 .39 2.78 3.17 (.39) (1.06) (1.45) 23.69 14.785 4 .536 1.696
Class 2:6/30/20213,4 26.21 .19 2.44 2.63 (.08) (.94) (1.02) 27.82 10.065 5,496 .556 1.426
12/31/2020 23.79 .37 2.56 2.93 (.40) (.11) (.51) 26.21 12.46 5,242 .55 1.5512/31/2019 21.08 .45 3.89 4.34 (.44) (1.19) (1.63) 23.79 21.23 5,154 .54 1.9612/31/2018 23.49 .41 (1.41) (1.00) (.38) (1.03) (1.41) 21.08 (4.60) 4,668 .53 1.7812/31/2017 21.49 .37 3.04 3.41 (.35) (1.06) (1.41) 23.49 16.23 5,480 .54 1.6412/31/2016 20.45 .36 1.53 1.89 (.34) (.51) (.85) 21.49 9.41 5,144 .54 1.72
Class 3:6/30/20213,4 26.53 .21 2.48 2.69 (.09) (.94) (1.03) 28.19 10.145 36 .486 1.496
12/31/2020 24.08 .39 2.59 2.98 (.42) (.11) (.53) 26.53 12.50 33 .48 1.6212/31/2019 21.32 .47 3.93 4.40 (.45) (1.19) (1.64) 24.08 21.30 32 .47 2.0212/31/2018 23.73 .43 (1.41) (.98) (.40) (1.03) (1.43) 21.32 (4.49) 29 .46 1.8512/31/2017 21.70 .39 3.07 3.46 (.37) (1.06) (1.43) 23.73 16.29 38 .47 1.7212/31/2016 20.64 .38 1.54 1.92 (.35) (.51) (.86) 21.70 9.49 35 .47 1.79
Class 4:6/30/20213,4 26.06 .16 2.44 2.60 (.08) (.94) (1.02) 27.64 9.975 5,856 .806 1.186
12/31/2020 23.67 .31 2.54 2.85 (.35) (.11) (.46) 26.06 12.16 5,131 .80 1.3012/31/2019 20.99 .39 3.87 4.26 (.39) (1.19) (1.58) 23.67 20.92 4,493 .79 1.7112/31/2018 23.40 .35 (1.40) (1.05) (.33) (1.03) (1.36) 20.99 (4.83) 3,594 .78 1.5412/31/2017 21.43 .32 3.02 3.34 (.31) (1.06) (1.37) 23.40 15.91 3,582 .79 1.4012/31/2016 20.40 .31 1.53 1.84 (.30) (.51) (.81) 21.43 9.16 2,861 .79 1.47
See end of tables for footnotes.
Financial highlights (continued)

324 American Funds Insurance Series
Net assetvalue,
beginningof period
Income (loss) frominvestment operations1 Dividends and distributions
Net assetvalue,end
of periodTotalreturn
Net assets,end of period(in millions)
Ratio ofexpensesto averagenet assets2
Ratio ofnet incometo averagenet assetsPeriod ended
Netinvestmentincome
Net gains(losses) onsecurities(both
realized andunrealized)
Total frominvestmentoperations
Dividends(from netinvestmentincome)
Distributions(from capital
gains)
Totaldividends
anddistributions
Global Balanced Fund
Class 1:6/30/20213,4 $14.19 $.09 $ .78 $ .87 $(.02) $(.07) $(.09) $14.97 6.10%5 $116 .72%6 1.29%6
12/31/2020 13.51 .17 1.24 1.41 (.19) (.54) (.73) 14.19 10.53 139 .72 1.2912/31/2019 11.67 .24 2.17 2.41 (.20) (.37) (.57) 13.51 20.79 134 .72 1.8812/31/2018 12.75 .23 (.96) (.73) (.20) (.15) (.35) 11.67 (5.81) 110 .72 1.8212/31/2017 11.08 .21 1.99 2.20 (.15) (.38) (.53) 12.75 19.91 93 .72 1.6812/31/2016 10.74 .19 .32 .51 (.17) — (.17) 11.08 4.73 64 .72 1.73
Class 1A:6/30/20213,4 14.16 .08 .77 .85 (.02) (.07) (.09) 14.92 5.985 4 .976 1.116
12/31/2020 13.49 .14 1.23 1.37 (.16) (.54) (.70) 14.16 10.25 3 .97 1.0312/31/2019 11.65 .21 2.17 2.38 (.17) (.37) (.54) 13.49 20.54 2 .97 1.6312/31/2018 12.74 .18 (.94) (.76) (.18) (.15) (.33) 11.65 (6.03) 2 .98 1.4412/31/20173,7 11.18 .16 1.92 2.08 (.14) (.38) (.52) 12.74 18.715 —8 .946 1.276
Class 2:6/30/20213,4 14.16 .08 .77 .85 (.02) (.07) (.09) 14.92 5.985 212 .976 1.096
12/31/2020 13.48 .14 1.23 1.37 (.15) (.54) (.69) 14.16 10.30 208 .97 1.0312/31/2019 11.65 .21 2.16 2.37 (.17) (.37) (.54) 13.48 20.44 207 .97 1.6412/31/2018 12.72 .20 (.96) (.76) (.16) (.15) (.31) 11.65 (6.01) 185 .97 1.5712/31/2017 11.06 .18 1.98 2.16 (.12) (.38) (.50) 12.72 19.57 210 .96 1.4312/31/2016 10.72 .16 .32 .48 (.14) — (.14) 11.06 4.48 178 .97 1.48
Class 4:6/30/20213,4 14.02 .06 .76 .82 (.02) (.07) (.09) 14.75 5.825 125 1.226 .866
12/31/2020 13.36 .10 1.22 1.32 (.12) (.54) (.66) 14.02 10.00 105 1.22 .7812/31/2019 11.55 .18 2.14 2.32 (.14) (.37) (.51) 13.36 20.21 94 1.22 1.3712/31/2018 12.63 .17 (.96) (.79) (.14) (.15) (.29) 11.55 (6.31) 69 1.22 1.3412/31/2017 11.00 .13 1.99 2.12 (.11) (.38) (.49) 12.63 19.38 51 1.22 1.0712/31/2016 10.69 .12 .33 .45 (.14) — (.14) 11.00 4.21 10 1.24 1.12
See end of tables for footnotes.
Financial highlights (continued)

American Funds Insurance Series 325
Net assetvalue,
beginningof period
(Loss) income frominvestment operations1 Dividends and distributions
Net assetvalue,end
of periodTotal
return11
Net assets,end of period(in millions)
Ratio ofexpenses toaverage netassets beforewaivers2
Ratio ofexpenses toaverage netassets afterwaivers2,11
Ratio ofnet incometo averagenet assets11Period ended
Netinvestmentincome
Net (losses)gains onsecurities(both
realized andunrealized)
Total frominvestmentoperations
Dividends(from netinvestmentincome)
Distributions(from capital
gains)
Totaldividends
anddistributions
The Bond Fund of America
Class 1:6/30/20213,4 $11.89 $.10 $(.18) $ (.08) $(.03) $(.47) $(.50) $11.31 (.67)%5 $8,408 .40%6 .33%6 1.68%6
12/31/2020 11.17 .23 .87 1.10 (.27) (.11) (.38) 11.89 9.96 6,844 .40 .40 2.0012/31/2019 10.47 .30 .71 1.01 (.31) — (.31) 11.17 9.70 6,481 .39 .39 2.7612/31/2018 10.82 .29 (.35) (.06) (.28) (.01) (.29) 10.47 (.45) 5,962 .38 .38 2.7012/31/2017 10.80 .24 .18 .42 (.24) (.16) (.40) 10.82 3.88 6,434 .38 .38 2.1912/31/2016 10.70 .21 .14 .35 (.21) (.04) (.25) 10.80 3.27 6,829 .38 .38 1.91
Class 1A:6/30/20213,4 11.84 .08 (.18) (.10) (.02) (.47) (.49) 11.25 (.79)5 11 .656 .586 1.436
12/31/2020 11.13 .20 .87 1.07 (.25) (.11) (.36) 11.84 9.68 9 .65 .65 1.7412/31/2019 10.45 .27 .71 .98 (.30) — (.30) 11.13 9.36 7 .64 .64 2.4812/31/2018 10.80 .26 (.33) (.07) (.27) (.01) (.28) 10.45 (.60) 3 .63 .63 2.5012/31/20173,7 10.82 .22 .15 .37 (.23) (.16) (.39) 10.80 3.465 1 .626 .626 2.016
Class 2:6/30/20213,4 11.73 .08 (.18) (.10) (.02) (.47) (.49) 11.14 (.81)5 3,829 .656 .586 1.426
12/31/2020 11.02 .20 .86 1.06 (.24) (.11) (.35) 11.73 9.73 3,840 .65 .65 1.7512/31/2019 10.34 .27 .70 .97 (.29) — (.29) 11.02 9.36 3,561 .64 .64 2.5112/31/2018 10.69 .26 (.34) (.08) (.26) (.01) (.27) 10.34 (.71) 3,524 .63 .63 2.4512/31/2017 10.67 .21 .18 .39 (.21) (.16) (.37) 10.69 3.67 3,966 .63 .63 1.9412/31/2016 10.58 .18 .13 .31 (.18) (.04) (.22) 10.67 2.95 3,959 .63 .63 1.65
Class 4:6/30/20213,4 11.69 .07 (.18) (.11) (.02) (.47) (.49) 11.09 (.93)5 820 .906 .836 1.186
12/31/2020 11.00 .17 .85 1.02 (.22) (.11) (.33) 11.69 9.38 714 .90 .90 1.4812/31/2019 10.33 .24 .70 .94 (.27) — (.27) 11.00 9.08 502 .89 .89 2.2512/31/2018 10.68 .23 (.33) (.10) (.24) (.01) (.25) 10.33 (.89) 366 .88 .88 2.2212/31/2017 10.70 .19 .16 .35 (.21) (.16) (.37) 10.68 3.29 297 .88 .88 1.7212/31/2016 10.61 .15 .15 .30 (.17) (.04) (.21) 10.70 2.80 102 .88 .88 1.41
See end of tables for footnotes.
Financial highlights (continued)

326 American Funds Insurance Series
Net assetvalue,
beginningof period
(Loss) income frominvestment operations1 Dividends and distributions
Net assetvalue,end
of periodTotal
return11
Net assets,end of period(in millions)
Ratio ofexpenses toaverage netassets beforewaivers2
Ratio ofexpenses toaverage netassets afterwaivers2,11
Ratio ofnet incometo averagenet assets11Period ended
Netinvestmentincome
Net (losses)gains onsecurities(both
realized andunrealized)
Total frominvestmentoperations
Dividends(from netinvestmentincome)
Distributions(from capital
gains)
Totaldividends
anddistributions
Capital World Bond Fund
Class 1:6/30/20213,4 $12.94 $.12 $(.52) $ (.40) $(.07) $(.31) $(.38) $12.16 (3.20)%5 $1,016 .59%6 .49%6 1.96%6
12/31/2020 12.12 .26 .95 1.21 (.18) (.21) (.39) 12.94 10.17 1,219 .59 .52 2.0812/31/2019 11.42 .31 .61 .92 (.22) — (.22) 12.12 8.08 1,077 .58 .58 2.6012/31/2018 11.88 .30 (.44) (.14) (.28) (.04) (.32) 11.42 (1.14) 1,015 .57 .57 2.5612/31/2017 11.22 .28 .52 .80 (.07) (.07) (.14) 11.88 7.11 1,273 .56 .56 2.3712/31/2016 11.01 .26 .06 .32 (.09) (.02) (.11) 11.22 2.92 1,115 .57 .57 2.26
Class 1A:6/30/20213,4 12.91 .11 (.53) (.42) (.06) (.31) (.37) 12.12 (3.24)5 1 .846 .746 1.726
12/31/2020 12.10 .23 .95 1.18 (.16) (.21) (.37) 12.91 9.89 1 .83 .76 1.8312/31/2019 11.41 .28 .60 .88 (.19) — (.19) 12.10 7.75 1 .83 .83 2.3512/31/2018 11.87 .27 (.43) (.16) (.26) (.04) (.30) 11.41 (1.29) 1 .82 .82 2.3612/31/20173,7 11.22 .26 .52 .78 (.06) (.07) (.13) 11.87 7.005 —8 .726 .726 2.276
Class 2:6/30/20213,4 12.84 .11 (.53) (.42) (.06) (.31) (.37) 12.05 (3.26)5 1,060 .846 .746 1.726
12/31/2020 12.03 .22 .95 1.17 (.15) (.21) (.36) 12.84 9.90 1,058 .84 .77 1.8312/31/2019 11.34 .28 .60 .88 (.19) — (.19) 12.03 7.77 1,002 .83 .83 2.3512/31/2018 11.79 .27 (.43) (.16) (.25) (.04) (.29) 11.34 (1.33) 1,032 .82 .82 2.3212/31/2017 11.14 .25 .51 .76 (.04) (.07) (.11) 11.79 6.86 1,164 .81 .81 2.1212/31/2016 10.93 .23 .07 .30 (.07) (.02) (.09) 11.14 2.71 1,121 .82 .82 2.01
Class 4:6/30/20213,4 12.71 .09 (.52) (.43) (.06) (.31) (.37) 11.91 (3.41)5 60 1.096 .996 1.466
12/31/2020 11.92 .19 .94 1.13 (.13) (.21) (.34) 12.71 9.62 61 1.09 1.02 1.5812/31/2019 11.24 .24 .60 .84 (.16) — (.16) 11.92 7.54 49 1.08 1.08 2.0912/31/2018 11.70 .24 (.43) (.19) (.23) (.04) (.27) 11.24 (1.61) 40 1.07 1.07 2.0912/31/2017 11.08 .22 .51 .73 (.04) (.07) (.11) 11.70 6.63 31 1.06 1.06 1.8912/31/2016 10.89 .20 .06 .26 (.05) (.02) (.07) 11.08 2.42 12 1.07 1.07 1.76
See end of tables for footnotes.
Financial highlights (continued)

American Funds Insurance Series 327
Net assetvalue,
beginningof period
Income (loss) frominvestment operations1 Dividends and distributions
Net assetvalue,end
of periodTotal
return11
Net assets,end of period(in millions)
Ratio ofexpenses toaverage netassets beforewaivers2
Ratio ofexpenses toaverage netassets afterwaivers2,11
Ratio ofnet incometo averagenet assets11Period ended
Netinvestmentincome
Net gains(losses) onsecurities(both
realized andunrealized)
Total frominvestmentoperations
Dividends(from netinvestmentincome)
Distributions(from capital
gains)
Totaldividends
anddistributions
American High-Income Trust
Class 1:6/30/20213,4 $ 9.80 $.26 $ .39 $ .65 $(.08) $— $(.08) $10.37 6.62%5 $276 .53%6 .45%6 5.18%6
12/31/2020 9.87 .61 .17 .78 (.85) — (.85) 9.80 8.21 123 .52 .52 6.4612/31/2019 9.34 .67 .52 1.19 (.66) — (.66) 9.87 12.85 525 .51 .51 6.7112/31/2018 10.19 .64 (.84) (.20) (.65) — (.65) 9.34 (2.15) 501 .50 .50 6.3212/31/2017 10.18 .63 .10 .73 (.72) — (.72) 10.19 7.25 632 .49 .49 5.9812/31/2016 9.19 .61 1.02 1.63 (.64) — (.64) 10.18 17.83 949 .49 .49 6.18
Class 1A:6/30/20213,4 9.78 .25 .38 .63 (.07) — (.07) 10.34 6.495 1 .786 .716 4.986
12/31/2020 9.86 .56 .20 .76 (.84) — (.84) 9.78 7.94 1 .78 .78 5.8512/31/2019 9.33 .65 .51 1.16 (.63) — (.63) 9.86 12.61 1 .75 .75 6.4712/31/2018 10.18 .62 (.84) (.22) (.63) — (.63) 9.33 (2.35) 1 .75 .75 6.1112/31/20173,7 10.28 .60 .02 .62 (.72) — (.72) 10.18 6.025 —8 .726 .726 5.746
Class 2:6/30/20213,4 9.61 .25 .37 .62 (.07) — (.07) 10.16 6.505 690 .786 .716 5.006
12/31/2020 9.70 .55 .19 .74 (.83) — (.83) 9.61 7.94 665 .78 .78 5.8812/31/2019 9.19 .64 .50 1.14 (.63) — (.63) 9.70 12.55 667 .76 .76 6.4512/31/2018 10.03 .61 (.83) (.22) (.62) — (.62) 9.19 (2.34) 661 .75 .75 6.0712/31/2017 10.04 .59 .10 .69 (.70) — (.70) 10.03 6.89 776 .74 .74 5.7212/31/2016 9.06 .58 1.01 1.59 (.61) — (.61) 10.04 17.69 799 .74 .74 5.92
Class 3:6/30/20213,4 9.84 .26 .38 .64 (.07) — (.07) 10.41 6.565 11 .716 .646 5.076
12/31/2020 9.92 .57 .19 .76 (.84) — (.84) 9.84 7.93 10 .71 .71 5.9412/31/2019 9.38 .66 .52 1.18 (.64) — (.64) 9.92 12.70 10 .69 .69 6.5212/31/2018 10.23 .63 (.85) (.22) (.63) — (.63) 9.38 (2.33) 10 .68 .68 6.1412/31/2017 10.22 .61 .10 .71 (.70) — (.70) 10.23 7.02 12 .67 .67 5.7912/31/2016 9.22 .59 1.03 1.62 (.62) — (.62) 10.22 17.68 13 .67 .67 5.99
Class 4:6/30/20213,4 10.54 .25 .41 .66 (.07) — (.07) 11.13 6.285 96 1.036 .956 4.736
12/31/2020 10.56 .57 .22 .79 (.81) — (.81) 10.54 7.74 69 1.03 1.03 5.5812/31/2019 9.96 .67 .54 1.21 (.61) — (.61) 10.56 12.27 63 1.01 1.01 6.2112/31/2018 10.82 .63 (.90) (.27) (.59) — (.59) 9.96 (2.64) 31 1.00 1.00 5.8312/31/2017 10.79 .61 .10 .71 (.68) — (.68) 10.82 6.63 34 .99 .99 5.4612/31/2016 9.73 .60 1.07 1.67 (.61) — (.61) 10.79 17.29 21 .99 .99 5.55
See end of tables for footnotes.
Financial highlights (continued)

328 American Funds Insurance Series
Net assetvalue,
beginningof period
(Loss) income frominvestment operations1 Dividends and distributions
Net assetvalue,end
of periodTotal
return11
Net assets,end of period(in millions)
Ratio ofexpenses toaverage netassets before
waivers
Ratio ofexpenses toaverage netassets afterwaivers11
Ratio ofnet incometo averagenet assets11Period ended
Netinvestmentincome
Net (losses)gains onsecurities(both
realized andunrealized)
Total frominvestmentoperations
Dividends(from netinvestmentincome)
Distributions(from capital
gains)
Totaldividends
anddistributions
American Funds Mortgage Fund
Class 1:6/30/20213,4 $11.11 $.03 $(.09) $(.06) $(.02) $(.37) $(.39) $10.66 (.57)%5 $231 .50%6 .31%6 .52%6
12/31/2020 10.56 .10 .64 .74 (.17) (.02) (.19) 11.11 6.98 224 .48 .36 .9312/31/2019 10.30 .24 .30 .54 (.28) — (.28) 10.56 5.30 210 .47 .47 2.2612/31/2018 10.47 .20 (.14) .06 (.23) — (.23) 10.30 .58 209 .48 .48 1.9712/31/2017 10.56 .16 —9 .16 (.18) (.07) (.25) 10.47 1.47 265 .47 .47 1.5212/31/2016 10.61 .15 .11 .26 (.20) (.11) (.31) 10.56 2.50 269 .46 .46 1.39
Class 1A:6/30/20213,4 11.08 .01 (.07) (.06) (.02) (.37) (.39) 10.63 (.60)5 2 .756 .566 .276
12/31/2020 10.55 .07 .63 .70 (.15) (.02) (.17) 11.08 6.63 1 .73 .59 .6112/31/2019 10.28 .22 .30 .52 (.25) — (.25) 10.55 5.09 1 .71 .71 2.0412/31/2018 10.46 .18 (.14) .04 (.22) — (.22) 10.28 .36 1 .73 .73 1.7712/31/20173,7 10.55 .14 —9 .14 (.16) (.07) (.23) 10.46 1.315 —8 .706 .706 1.386
Class 2:6/30/20213,4 11.09 .01 (.08) (.07) (.02) (.37) (.39) 10.63 (.70)5 59 .756 .566 .276
12/31/2020 10.54 .08 .63 .71 (.14) (.02) (.16) 11.09 6.72 58 .73 .60 .6812/31/2019 10.28 .21 .31 .52 (.26) — (.26) 10.54 5.04 56 .72 .72 2.0112/31/2018 10.45 .18 (.15) .03 (.20) — (.20) 10.28 .32 57 .73 .73 1.7212/31/2017 10.54 .14 (.01) .13 (.15) (.07) (.22) 10.45 1.22 63 .72 .72 1.2712/31/2016 10.59 .12 .12 .24 (.18) (.11) (.29) 10.54 2.25 63 .71 .71 1.14
Class 4:6/30/20213,4 10.97 —9 (.08) (.08) (.01) (.37) (.38) 10.51 (.74)5 41 1.006 .816 .026
12/31/2020 10.44 .04 .63 .67 (.12) (.02) (.14) 10.97 6.38 37 .98 .85 .4112/31/2019 10.19 .18 .31 .49 (.24) — (.24) 10.44 4.80 28 .97 .97 1.7112/31/2018 10.38 .15 (.15) —9 (.19) — (.19) 10.19 .07 24 .98 .98 1.4912/31/2017 10.48 .11 —9 .11 (.14) (.07) (.21) 10.38 .97 12 .97 .97 1.0312/31/2016 10.52 .09 .12 .21 (.14) (.11) (.25) 10.48 2.01 8 .96 .96 .86
See end of tables for footnotes.
Financial highlights (continued)

American Funds Insurance Series 329
Net assetvalue,
beginningof period
(Loss) income frominvestment operations1 Dividends and distributions
Net assetvalue,end
of periodTotalreturn
Net assets,end of period(in millions)
Ratio ofexpensesto averagenet assets
Ratio ofnet (loss)income
to averagenet assetsPeriod ended
Netinvestment
(loss)income
Net (losses)gains onsecurities(both
realized andunrealized)
Total frominvestmentoperations
Dividends(from netinvestmentincome)
Distributions(from capital
gains)
Totaldividends
anddistributions
Ultra-Short Bond Fund
Class 1:6/30/20213,4 $11.31 $(.01) $(.01) $(.02) $ — $— $ — $11.29 (.18)%5 $ 37 .36%6 (.26)%6
12/31/2020 11.30 .02 .02 .04 (.03) — (.03) 11.31 .34 44 .37 .1612/31/2019 11.31 .22 —9 .22 (.23) — (.23) 11.30 1.92 30 .36 1.9212/31/2018 11.29 .18 —9 .18 (.16) — (.16) 11.31 1.58 37 .35 1.6012/31/2017 11.27 .08 (.01) .07 (.05) — (.05) 11.29 .66 37 .35 .6812/31/201612 11.26 .01 —9 .01 — — — 11.27 .09 37 .35 .11
Class 1A:6/30/20213,4 11.31 (.01) (.01) (.02) — — — 11.29 (.18)5 —8 .356 (.25)6
12/31/2020 11.30 .03 .01 .04 (.03) — (.03) 11.31 .32 —8 .35 .2612/31/2019 11.31 .22 —9 .22 (.23) — (.23) 11.30 1.92 —8 .37 1.9012/31/2018 11.29 .18 —9 .18 (.16) — (.16) 11.31 1.58 —8 .35 1.6012/31/20173,7 11.27 .08 —9 .08 (.06) — (.06) 11.29 .675 —8 .346 .696
Class 2:6/30/20213,4 10.99 (.03) —9 (.03) — — — 10.96 (.27)5 256 .616 (.51)6
12/31/2020 11.01 —9 —9 —9 (.02) — (.02) 10.99 .03 288 .62 (.05)12/31/2019 11.03 .18 —9 .18 (.20) — (.20) 11.01 1.62 230 .61 1.6612/31/2018 11.01 .15 —9 .15 (.13) — (.13) 11.03 1.36 247 .60 1.3412/31/2017 10.99 .05 —9 .05 (.03) — (.03) 11.01 .46 249 .60 .4212/31/201612 11.01 (.02) —9 (.02) — — — 10.99 (.18) 297 .60 (.14)
Class 3:6/30/20213,4 11.12 (.02) (.01) (.03) — — — 11.09 (.27)5 4 .546 (.44)6
12/31/2020 11.13 —9 .02 .02 (.03) — (.03) 11.12 .13 4 .55 .0312/31/2019 11.14 .20 —9 .20 (.21) — (.21) 11.13 1.76 3 .54 1.7412/31/2018 11.12 .16 (.01) .15 (.13) — (.13) 11.14 1.38 4 .53 1.4212/31/2017 11.10 .06 —9 .06 (.04) — (.04) 11.12 .54 4 .53 .5012/31/201612 11.11 (.01) —9 (.01) — — — 11.10 (.09) 4 .53 (.08)
Class 4:6/30/20213,4 11.08 (.04) —9 (.04) — — — 11.04 (.36)5 43 .866 (.76)6
12/31/2020 11.13 (.04) .01 (.03) (.02) — (.02) 11.08 (.25) 40 .87 (.35)12/31/2019 11.15 .16 —9 .16 (.18) — (.18) 11.13 1.40 22 .86 1.4012/31/2018 11.13 .12 .01 .13 (.11) — (.11) 11.15 1.14 18 .86 1.1112/31/2017 11.12 .02 —9 .02 (.01) — (.01) 11.13 .16 15 .85 .1912/31/201612 11.17 (.04) (.01) (.05) — — — 11.12 (.45) 13 .85 (.40)
See end of tables for footnotes.
Financial highlights (continued)

330 American Funds Insurance Series
Net assetvalue,
beginningof period
(Loss) income frominvestment operations1 Dividends and distributions
Net assetvalue,end
of periodTotal
return11
Net assets,end of period(in millions)
Ratio ofexpenses toaverage netassets before
waivers
Ratio ofexpenses toaverage netassets afterwaivers11
Ratio ofnet incometo averagenet assets11Period ended
Netinvestmentincome
Net (losses)gains onsecurities(both
realized andunrealized)
Total frominvestmentoperations
Dividends(from netinvestmentincome)
Distributions(from capital
gains)
Totaldividends
anddistributions
U.S. Government Securities Fund
Class 1:6/30/20213,4 $13.04 $.08 $ (.26) $ (.18) $(.03) $(1.11) $(1.14) $11.72 (1.31)%5 $ 374 .39%6 .34%6 1.20%6
12/31/2020 12.34 .16 1.07 1.23 (.26) (.27) (.53) 13.04 10.09 429 .38 .38 1.2112/31/2019 11.94 .25 .43 .68 (.28) — (.28) 12.34 5.69 1,418 .37 .37 2.0712/31/2018 12.08 .24 (.13) .11 (.25) — (.25) 11.94 .91 1,445 .36 .36 2.0212/31/2017 12.05 .21 .01 .22 (.19) — (.19) 12.08 1.83 1,558 .36 .36 1.6812/31/2016 12.31 .16 .03 .19 (.20) (.25) (.45) 12.05 1.44 1,467 .36 .36 1.31
Class 1A:6/30/20213,4 13.00 .06 (.25) (.19) (.03) (1.11) (1.14) 11.67 (1.42)5 5 .646 .586 1.026
12/31/2020 12.32 .09 1.10 1.19 (.24) (.27) (.51) 13.00 9.75 4 .64 .64 .6912/31/2019 11.93 .22 .43 .65 (.26) — (.26) 12.32 5.42 2 .62 .62 1.8212/31/2018 12.08 .22 (.14) .08 (.23) — (.23) 11.93 .70 1 .61 .61 1.8212/31/20173,7 12.05 .18 .03 .21 (.18) — (.18) 12.08 1.735 —8 .586 .586 1.536
Class 2:6/30/20213,4 12.89 .06 (.25) (.19) (.03) (1.11) (1.14) 11.56 (1.36)5 1,434 .646 .596 .986
12/31/2020 12.21 .09 1.10 1.19 (.24) (.27) (.51) 12.89 9.80 1,439 .64 .64 .7312/31/2019 11.82 .22 .42 .64 (.25) — (.25) 12.21 5.31 1,343 .62 .62 1.8212/31/2018 11.96 .21 (.14) .07 (.21) — (.21) 11.82 .73 1,323 .61 .61 1.7712/31/2017 11.93 .17 .02 .19 (.16) — (.16) 11.96 1.59 1,473 .61 .61 1.4312/31/2016 12.20 .13 .02 .15 (.17) (.25) (.42) 11.93 1.19 1,503 .61 .61 1.05
Class 3:6/30/20213,4 13.07 .07 (.26) (.19) (.03) (1.11) (1.14) 11.74 (1.41)5 9 .576 .526 1.036
12/31/2020 12.37 .10 1.12 1.22 (.25) (.27) (.52) 13.07 9.91 10 .57 .57 .7812/31/2019 11.97 .23 .43 .66 (.26) — (.26) 12.37 5.49 9 .55 .55 1.8812/31/2018 12.11 .22 (.14) .08 (.22) — (.22) 11.97 .71 9 .54 .54 1.8412/31/2017 12.07 .18 .03 .21 (.17) — (.17) 12.11 1.72 10 .54 .54 1.5012/31/2016 12.34 .14 .02 .16 (.18) (.25) (.43) 12.07 1.24 11 .54 .54 1.12
Class 4:6/30/20213,4 12.88 .04 (.25) (.21) (.02) (1.11) (1.13) 11.54 (1.58)5 237 .896 .846 .706
12/31/2020 12.22 .05 1.10 1.15 (.22) (.27) (.49) 12.88 9.48 272 .89 .89 .4212/31/2019 11.84 .19 .42 .61 (.23) — (.23) 12.22 5.14 124 .87 .87 1.5612/31/2018 11.98 .18 (.12) .06 (.20) — (.20) 11.84 .50 91 .86 .86 1.5312/31/2017 11.96 .14 .01 .15 (.13) — (.13) 11.98 1.28 62 .86 .86 1.1812/31/2016 12.22 .10 .03 .13 (.14) (.25) (.39) 11.96 .99 57 .86 .86 .82
See end of tables for footnotes.
Financial highlights (continued)

American Funds Insurance Series 331
Net assetvalue,
beginningof period
Income (loss) from investment operations1 Dividends and distributions
Net assetvalue, endof period Total return11
Net assets,end of period(in millions)
Ratio ofexpensesto averagenet assetsbeforewaivers/
reimburse-ments13
Ratio ofexpensesto averagenet assets
afterwaivers/
reimburse-ments11,13
Neteffectiveexpense
ratio4,11,14
Ratio ofnet (loss)income
to averagenet assets11Period ended
Netinvestment
(loss)income
Net gains(losses) onsecurities(both
realized andunrealized)
Total frominvestmentoperations
Dividends(from netinvestmentincome)
Distribu-tions
(from capitalgains)
Totaldividends
anddistribu-tions
Managed Risk Growth Fund
Class P1:6/30/20213,4 $17.25 $(.01) $ 1.30 $ 1.29 $(.08) $ (.74) $ (.82) $17.72 7.56%5 $ 11 .42%6 .37%6 .72%6 (.13)%6
12/31/2020 13.78 .07 4.20 4.27 (.12) (.68) (.80) 17.25 32.45 11 .42 .37 .72 .4912/31/2019 12.30 .15 2.44 2.59 (.19) (.92) (1.11) 13.78 22.01 6 .42 .37 .73 1.1912/31/2018 13.22 .11 (.04) .07 (.10) (.89) (.99) 12.30 (.04)15 3 .4215 .3715 .7115 .8215
12/31/2017 10.71 .08 2.70 2.78 (.07) (.20) (.27) 13.22 26.2315 2 .4215 .3615 .7015 .6915
12/31/2016 11.49 .08 .20 .28 (.05) (1.01) (1.06) 10.71 2.8915 1 .5015 .3415 .6815 .7915
Class P2:6/30/20213,4 17.11 (.03) 1.30 1.27 (.04) (.74) (.78) 17.60 7.535 588 .676 .626 .976 (.36)6
12/31/2020 13.71 .03 4.16 4.19 (.11) (.68) (.79) 17.11 32.03 554 .67 .62 .97 .2012/31/2019 12.21 .09 2.45 2.54 (.12) (.92) (1.04) 13.71 21.74 434 .68 .63 .99 .7312/31/2018 13.14 .06 (.04) .02 (.06) (.89) (.95) 12.21 (.37) 340 .68 .63 .97 .4612/31/2017 10.64 .04 2.70 2.74 (.04) (.20) (.24) 13.14 25.99 286 .69 .63 .97 .3412/31/2016 11.43 .05 .19 .24 (.02) (1.01) (1.03) 10.64 2.52 200 .79 .63 .97 .43
Managed Risk International Fund
Class P1:6/30/20213,4 $11.07 $(.01) $ .31 $ .30 $(.09) $ — $ (.09) $11.28 2.73%5,15 $ 2 .43%6,15 .36%6,15 .88%6,15 (.22)%6,15
12/31/2020 11.01 .08 .22 .30 (.16) (.08) (.24) 11.07 3.1315 2 .4315 .3515 .8615 .8215
12/31/2019 9.82 .17 1.54 1.71 (.20) (.32) (.52) 11.01 17.9115 1 .4115 .3315 .8415 1.6415
12/31/2018 11.25 .32 (1.44) (1.12) (.26) (.05) (.31) 9.82 (10.11)15 —8 .3315 .2815 .7715 3.0215
12/31/2017 8.89 .11 2.47 2.58 (.10) (.12) (.22) 11.25 29.2815 —8 .2815 .2015 .6915 1.1315
12/31/2016 9.48 .10 (.35) (.25) (.12) (.22) (.34) 8.89 (2.59)15 —8 .3915 .2315 .7415 1.1515
Class P2:6/30/20213,4 10.99 (.03) .32 .29 (.06) — (.06) 11.22 2.645 169 .706 .636 1.156 (.48)6
12/31/2020 10.92 .04 .23 .27 (.12) (.08) (.20) 10.99 2.80 168 .71 .63 1.14 .4212/31/2019 9.76 .13 1.55 1.68 (.20) (.32) (.52) 10.92 17.64 165 .71 .63 1.14 1.2112/31/2018 11.15 .16 (1.32) (1.16) (.18) (.05) (.23) 9.76 (10.50) 151 .69 .64 1.13 1.4912/31/2017 8.83 .11 2.41 2.52 (.08) (.12) (.20) 11.15 28.69 148 .71 .63 1.12 1.0312/31/2016 9.43 .09 (.38) (.29) (.09) (.22) (.31) 8.83 (3.05) 97 .79 .63 1.14 .97
Managed RiskWashington Mutual Investors Fund
Class P1:6/30/20213,4 $11.24 $ .02 $ 1.00 $ 1.02 $(.15) $ — $ (.15) $12.11 9.08%5,15 $ 2 .41%6,15 .35%6,15 .76%6,15 .41%6,15
12/31/2020 12.01 .18 (.35) (.17) (.26) (.34) (.60) 11.24 (.93)15 2 .4015 .3515 .7615 1.6615
12/31/2019 11.28 .25 1.28 1.53 (.20) (.60) (.80) 12.01 14.1415 1 .3815 .3315 .7415 2.1415
12/31/2018 13.04 .40 (1.27) (.87) (.45) (.44) (.89) 11.28 (6.99)15 —8 .3315 .2815 .6715 3.2115
12/31/2017 11.67 .19 1.59 1.78 (.22) (.19) (.41) 13.04 15.4815 —8 .3015 .2515 .6415 1.5915
12/31/2016 10.80 .20 1.25 1.45 (.21) (.37) (.58) 11.67 13.7715 —8 .4315 .2715 .6715 1.8315
Class P2:6/30/20213,4 11.18 .01 1.00 1.01 (.15) — (.15) 12.04 8.995 361 .686 .626 1.036 .096
12/31/2020 11.91 .13 (.33) (.20) (.19) (.34) (.53) 11.18 (1.25) 355 .68 .63 1.04 1.1812/31/2019 11.21 .18 1.31 1.49 (.19) (.60) (.79) 11.91 13.88 365 .68 .63 1.04 1.6212/31/2018 12.96 .19 (1.10) (.91) (.40) (.44) (.84) 11.21 (7.38) 336 .68 .63 1.02 1.4912/31/2017 11.61 .17 1.55 1.72 (.18) (.19) (.37) 12.96 15.03 367 .68 .63 1.02 1.4312/31/2016 10.76 .23 1.18 1.41 (.19) (.37) (.56) 11.61 13.39 291 .79 .63 1.03 2.04
See end of tables for footnotes.
Financial highlights (continued)

332 American Funds Insurance Series
Net assetvalue,
beginningof period
Income (loss) from investment operations1 Dividends and distributions
Net assetvalue, endof period Total return11
Net assets,end of period(in millions)
Ratio ofexpensesto averagenet assetsbeforewaivers/
reimburse-ments13
Ratio ofexpensesto averagenet assets
afterwaivers/
reimburse-ments11,13
Neteffectiveexpense
ratio4,11,14
Ratio ofnet (loss)income
to averagenet assets11Period ended
Netinvestment
(loss)income
Net gains(losses) onsecurities(both
realized andunrealized)
Total frominvestmentoperations
Dividends(from netinvestmentincome)
Distribu-tions
(from capitalgains)
Totaldividends
anddistribu-tions
Managed Risk Growth-Income Fund
Class P1:6/30/20213,4 $14.01 $ .03 $1.21 $1.24 $(.15) $(.20) $ (.35) $14.90 8.82%5 $2,259 .41%6 .36%6 .66%6 .37%6
12/31/2020 13.76 .17 1.08 1.25 (.26) (.74) (1.00) 14.01 9.85 2,120 .41 .36 .66 1.2412/31/2019 11.73 .22 2.01 2.23 (.10) (.10) (.20) 13.76 19.14 1,987 .42 .37 .67 1.7112/31/2018 12.66 (.02) (.15) (.17) (.19) (.57) (.76) 11.73 (1.66) 1,662 .40 .35 .64 (.20)12/31/2017 11.07 .19 2.03 2.22 (.13) (.50) (.63) 12.66 20.6415 2 .4415 .3715 .6615 1.6115
12/31/2016 11.25 .16 .52 .68 (.16) (.70) (.86) 11.07 6.4915 1 .5215 .3615 .6415 1.4615
Class P2:6/30/20213,4 13.93 .01 1.21 1.22 (.14) (.20) (.34) 14.81 8.765 333 .666 .616 .916 .126
12/31/2020 13.69 .14 1.07 1.21 (.23) (.74) (.97) 13.93 9.58 315 .66 .61 .91 1.0212/31/2019 11.67 .19 2.00 2.19 (.07) (.10) (.17) 13.69 18.84 283 .67 .62 .92 1.4712/31/2018 12.58 .16 (.36) (.20) (.14) (.57) (.71) 11.67 (1.97) 230 .69 .64 .93 1.2512/31/2017 11.02 .13 2.05 2.18 (.12) (.50) (.62) 12.58 20.40 206 .70 .63 .92 1.0812/31/2016 11.22 .12 .52 .64 (.14) (.70) (.84) 11.02 6.08 160 .79 .63 .91 1.13
Managed Risk Asset Allocation Fund
Class P1:6/30/20213,4 $13.84 $ .02 $1.17 $1.19 $(.20) $ — $ (.20) $14.83 8.62%5 $ 6 .41%6 .36%6 .66%6 .30%6
12/31/2020 13.81 .25 .51 .76 (.21) (.52) (.73) 13.84 6.10 5 .41 .36 .66 1.9112/31/2019 12.23 .26 1.92 2.18 (.03) (.57) (.60) 13.81 18.25 2 .41 .36 .65 2.0112/31/2018 13.59 .22 (.80) (.58) (.25) (.53) (.78) 12.23 (4.63) 2 .37 .32 .59 1.6712/31/2017 12.02 .19 1.60 1.79 (.10) (.12) (.22) 13.59 15.06 1,656 .43 .38 .66 1.4512/31/2016 11.72 .19 .67 .86 (.19) (.37) (.56) 12.02 7.57 1,217 .43 .38 .66 1.65
Class P2:6/30/20213,4 13.45 —9 1.14 1.14 (.16) — (.16) 14.43 8.465 2,852 .666 .616 .916 .036
12/31/2020 13.46 .15 .56 .71 (.20) (.52) (.72) 13.45 5.88 2,773 .66 .61 .91 1.1512/31/2019 12.22 .19 1.93 2.12 (.31) (.57) (.88) 13.46 17.98 2,830 .66 .61 .90 1.5112/31/2018 13.55 .17 (.79) (.62) (.18) (.53) (.71) 12.22 (4.89) 2,541 .62 .57 .84 1.2712/31/2017 12.01 .15 1.61 1.76 (.10) (.12) (.22) 13.55 14.80 2,798 .68 .63 .91 1.1312/31/2016 11.71 .14 .69 .83 (.16) (.37) (.53) 12.01 7.27 2,342 .68 .63 .91 1.20
See end of tables for footnotes.
Financial highlights (continued)

American Funds Insurance Series 333
Portfolio turnover rate for all share classesexcluding mortgage dollar roll transactions16,17
Six months endedJune 30, 20213,4,5
Year ended December 31,
2020 2019 2018 2017 2016
Capital Income Builder 37% 110% 44% 42% 59% 41%Asset Allocation Fund 27 49 47 34 39 43Global Balanced Fund 23 68 60 30 28 43The Bond Fund of America 42 72 146 98 153 108Capital World Bond Fund 35 88 110 78 74 70American Funds Mortgage Fund 28 123 84 60 98 113U.S. Government Securities Fund 51 112 103 76 120 273
Portfolio turnover rate for all share classesincluding mortgage dollar roll transactions, if applicable16,17
Six months endedJune 30, 20213,4,5
Year ended December 31,
2020 2019 2018 2017 2016
Global Growth Fund 11% 17% 14% 25% 31% 27%Global Small Capitalization Fund 17 38 50 43 33 40Growth Fund 5 32 21 35 24 26International Fund 27 40 32 29 29 31NewWorld Fund 25 70 38 58 56 32Washington Mutual Investors Fund 75 40 37 49 34 30Capital World Growth and Income Fund 69 36 29 49 41 57Growth-Income Fund 14 33 27 39 27 27International Growth and Income Fund 12 56 28 38 51 32Capital Income Builder 58 184 72 98 88 53Asset Allocation Fund 77 145 79 86 85 83Global Balanced Fund 25 86 74 51 41 65The Bond Fund of America 332 461 373 514 502 375Capital World Bond Fund 46 145 159 125 105 154American High-Income Trust 31 78 58 67 78 89American Funds Mortgage Fund 511 1143 350 811 680 713U.S. Government Securities Fund 260 867 277 446 551 539Ultra-Short Bond Fund —18 —18 —18 —18 —18 —12,18
Managed Risk Growth Fund 19 80 10 7 25 15Managed Risk International Fund 13 71 8 8 25 26Managed Risk Washington Mutual Investors Fund 11 101 13 11 32 9Managed Risk Growth-Income Fund 7 38 6 14 26 14Managed Risk Asset Allocation Fund 4 30 8 12 1 3
1Based on average shares outstanding.2Ratios do not include expenses of any Central Funds. The fund indirectly bears its proportionate share of the expenses of any Central Funds, if applicable.3Based on operations for a period that is less than a full year.4Unaudited.5Not annualized.6Annualized.7Class 1A shares began investment operations on January 6, 2017.8Amount less than $1 million.9Amount less than $.01.
10Amount less than .01%.11This column reflects the impact of certain waivers/reimbursements from CRMC. During some of the periods shown, CRMC waived a portion of investmentadvisory services fees on some funds, including each of the managed risk funds. In addition, during some of the periods shown, CRMC reimbursed a portionof miscellaneous fees and expenses for some of the managed risk funds.
12On May 1, 2016, the fund converted from a cash fund to an ultra-short-term bond fund and changed its name from Cash Management Fund to Ultra-ShortBond Fund.
13This column does not include expenses of the underlying funds in which each fund invests.14This column reflects the net effective expense ratios for each fund and class, which include each class’s expense ratio combined with the weighted average netexpense ratio of the underlying funds for the periods presented. See expense example for further information regarding fees and expenses.
15All or a significant portion of assets in this class consisted of seed capital invested by CRMC and/or its affiliates. Certain fees (including, where applicable, feesfor distribution services) are not charged or accrued on these seed capital assets. If such fees were paid by the fund on seed capital assets, fund expenseswould have been higher and net income and total return would have been lower.
16Refer to Note 5 for further information on mortgage doller rolls.17Rates do not include the fund’s portfolio activity with respect to any Central Funds, if applicable.18Amount is either less than 1% or there is no turnover.
See notes to financial statements.
Financial highlights (continued)

334 American Funds Insurance Series
The funds in American Funds InsuranceSeries serve as the underlying investmentvehicle for various insurance products. Asan owner of an insurance contract thatinvests in one of the funds in the series, youincur two types of costs: (1) transactioncosts, such as initial sales charges onpurchase payments and contingentdeferred sales charges on redemptions(loads), and (2) ongoing costs, includingmanagement fees, distribution and service(12b-1) fees, and other expenses.Additional fees are charged by theinsurance companies related to the variousbenefits they provide. This example isintended to help you understand yourongoing costs (in dollars) of investing in theunderlying funds so you can comparethese costs with the ongoing costs ofinvesting in other mutual funds that serve asimilar function in other annuity products.The example is based on an investment of$1,000 invested at the beginning of theperiod and held for the entire six-monthperiod (January 1, 2021, throughJune 30, 2021).
Actual expenses:The first line of each share class in the tables on the following pages providesinformation about actual account values and actual expenses. You may use theinformation in this line, together with the amount you invested, to estimate the expensesthat you paid over the period. Simply divide your account value by $1,000 (for example,an $8,600 account value divided by $1,000 = 8.6), then multiply the result by thenumber in the first line under the heading titled “Expenses paid during period” toestimate the expenses you paid on your account during this period.
Hypothetical example for comparison purposes:The second line of each share class in the tables on the following pages providesinformation about hypothetical account values and hypothetical expenses based on theactual expense ratio for the share class and an assumed rate of return of 5.00% per yearbefore expenses, which is not the actual return of the share class. The hypotheticalaccount values and expenses may not be used to estimate the actual ending accountbalance or expenses you paid for the period. You may use this information to comparethe ongoing costs of investing in the fund and other funds. To do so, compare this 5.00%hypothetical example with the 5.00% hypothetical examples that appear in theshareholder reports of the other funds.
Notes:Additional fees are charged by the insurance companies related to the various benefitsthey provide. You can estimate the impact of these fees by adding the amount of thefees to the total estimated expenses you paid on your account during the period ascalculated above. In addition, your ending account value would be lower by the amountof these fees.
Note that the expenses shown in the tables on the following pages are meant tohighlight your ongoing costs only and do not reflect any transactional costs. Therefore,the second line of each share class in the tables is useful in comparing ongoing costsonly and will not help you determine the relative total costs of owning different funds. Inaddition, if these transactional costs were included, your costs would have been higher.
Expense example unaudited

American Funds Insurance Series 335
Beginningaccount value
1/1/2021
Endingaccount value
6/30/2021
Expensespaid during
period1
Annualizedexpense
ratio
Global Growth FundClass 1 – actual return $1,000.00 $1,117.57 $2.89 .55%Class 1 – assumed 5% return 1,000.00 1,022.07 2.76 .55
Class 1A – actual return 1,000.00 1,116.18 4.20 .80Class 1A – assumed 5% return 1,000.00 1,020.83 4.01 .80
Class 2 – actual return 1,000.00 1,115.99 4.20 .80Class 2 – assumed 5% return 1,000.00 1,020.83 4.01 .80
Class 4 – actual return 1,000.00 1,114.72 5.51 1.05Class 4 – assumed 5% return 1,000.00 1,019.59 5.26 1.05
Global Small Capitalization FundClass 1 – actual return $1,000.00 $1,108.58 $3.87 .74%Class 1 – assumed 5% return 1,000.00 1,021.12 3.71 .74
Class 1A – actual return 1,000.00 1,107.25 5.17 .99Class 1A – assumed 5% return 1,000.00 1,019.89 4.96 .99
Class 2 – actual return 1,000.00 1,107.24 5.17 .99Class 2 – assumed 5% return 1,000.00 1,019.89 4.96 .99
Class 4 – actual return 1,000.00 1,105.61 6.47 1.24Class 4 – assumed 5% return 1,000.00 1,018.65 6.21 1.24
Growth FundClass 1 – actual return $1,000.00 $1,130.26 $1.85 .35%Class 1 – assumed 5% return 1,000.00 1,023.06 1.76 .35
Class 1A – actual return 1,000.00 1,128.69 3.17 .60Class 1A – assumed 5% return 1,000.00 1,021.82 3.01 .60
Class 2 – actual return 1,000.00 1,128.70 3.17 .60Class 2 – assumed 5% return 1,000.00 1,021.82 3.01 .60
Class 3 – actual return 1,000.00 1,129.11 2.80 .53Class 3 – assumed 5% return 1,000.00 1,022.17 2.66 .53
Class 4 – actual return 1,000.00 1,127.40 4.48 .85Class 4 – assumed 5% return 1,000.00 1,020.58 4.26 .85
International FundClass 1 – actual return $1,000.00 $1,047.12 $2.79 .55%Class 1 – assumed 5% return 1,000.00 1,022.07 2.76 .55
Class 1A – actual return 1,000.00 1,046.06 4.06 .80Class 1A – assumed 5% return 1,000.00 1,020.83 4.01 .80
Class 2 – actual return 1,000.00 1,046.08 4.06 .80Class 2 – assumed 5% return 1,000.00 1,020.83 4.01 .80
Class 3 – actual return 1,000.00 1,046.71 3.70 .73Class 3 – assumed 5% return 1,000.00 1,021.17 3.66 .73
Class 4 – actual return 1,000.00 1,044.74 5.32 1.05Class 4 – assumed 5% return 1,000.00 1,019.59 5.26 1.05
NewWorld FundClass 1 – actual return $1,000.00 $1,102.08 $2.92 .56%Class 1 – assumed 5% return 1,000.00 1,022.02 2.81 .56
Class 1A – actual return 1,000.00 1,100.48 4.22 .81Class 1A – assumed 5% return 1,000.00 1,020.78 4.06 .81
Class 2 – actual return 1,000.00 1,100.88 4.22 .81Class 2 – assumed 5% return 1,000.00 1,020.78 4.06 .81
Class 4 – actual return 1,000.00 1,099.22 5.52 1.06Class 4 – assumed 5% return 1,000.00 1,019.54 5.31 1.06
See end of tables for footnotes.
Expense example (continued)

336 American Funds Insurance Series
Beginningaccount value
1/1/2021
Endingaccount value
6/30/2021
Expensespaid during
period1
Annualizedexpense
ratio
Washington Mutual Investors FundClass 1 – actual return $1,000.00 $1,151.38 $1.97 .37%Class 1 – assumed 5% return 1,000.00 1,022.96 1.86 .37
Class 1A – actual return 1,000.00 1,149.96 3.04 .57Class 1A – assumed 5% return 1,000.00 1,021.97 2.86 .57
Class 2 – actual return 1,000.00 1,150.26 3.31 .62Class 2 – assumed 5% return 1,000.00 1,021.72 3.11 .62
Class 4 – actual return 1,000.00 1,148.77 4.64 .87Class 4 – assumed 5% return 1,000.00 1,020.48 4.36 .87
Capital World Growth and Income FundClass 1 – actual return $1,000.00 $1,100.61 $2.86 .55%Class 1 – assumed 5% return 1,000.00 1,022.07 2.76 .55
Class 1A – actual return 1,000.00 1,099.39 4.16 .80Class 1A – assumed 5% return 1,000.00 1,020.83 4.01 .80
Class 2 – actual return 1,000.00 1,099.82 4.22 .81Class 2 – assumed 5% return 1,000.00 1,020.78 4.06 .81
Class 4 – actual return 1,000.00 1,098.20 5.46 1.05Class 4 – assumed 5% return 1,000.00 1,019.59 5.26 1.05
Growth-Income FundClass 1 – actual return $1,000.00 $1,143.03 $1.54 .29%Class 1 – assumed 5% return 1,000.00 1,023.36 1.45 .29
Class 1A – actual return 1,000.00 1,141.39 2.87 .54Class 1A – assumed 5% return 1,000.00 1,022.12 2.71 .54
Class 2 – actual return 1,000.00 1,141.38 2.87 .54Class 2 – assumed 5% return 1,000.00 1,022.12 2.71 .54
Class 3 – actual return 1,000.00 1,141.87 2.50 .47Class 3 – assumed 5% return 1,000.00 1,022.46 2.36 .47
Class 4 – actual return 1,000.00 1,140.02 4.19 .79Class 4 – assumed 5% return 1,000.00 1,020.88 3.96 .79
International Growth and Income FundClass 1 – actual return $1,000.00 $1,072.02 $3.44 .67%Class 1 – assumed 5% return 1,000.00 1,021.47 3.36 .67
Class 1A – actual return 1,000.00 1,070.84 4.67 .91Class 1A – assumed 5% return 1,000.00 1,020.28 4.56 .91
Class 2 – actual return 1,000.00 1,070.24 4.67 .91Class 2 – assumed 5% return 1,000.00 1,020.28 4.56 .91
Class 4 – actual return 1,000.00 1,068.80 5.95 1.16Class 4 – assumed 5% return 1,000.00 1,019.04 5.81 1.16
Capital Income BuilderClass 1 – actual return $1,000.00 $1,098.46 $1.40 .27%Class 1 – assumed 5% return 1,000.00 1,023.46 1.35 .27
Class 1A – actual return 1,000.00 1,097.22 2.70 .52Class 1A – assumed 5% return 1,000.00 1,022.22 2.61 .52
Class 2 – actual return 1,000.00 1,097.20 2.70 .52Class 2 – assumed 5% return 1,000.00 1,022.22 2.61 .52
Class 4 – actual return 1,000.00 1,095.97 4.00 .77Class 4 – assumed 5% return 1,000.00 1,020.98 3.86 .77
See end of tables for footnotes.
Expense example (continued)

American Funds Insurance Series 337
Beginningaccount value
1/1/2021
Endingaccount value
6/30/2021
Expensespaid during
period1
Annualizedexpense
ratio
Asset Allocation FundClass 1 – actual return $1,000.00 $1,102.24 $1.56 .30%Class 1 – assumed 5% return 1,000.00 1,023.31 1.51 .30
Class 1A – actual return 1,000.00 1,100.99 2.87 .55Class 1A – assumed 5% return 1,000.00 1,022.07 2.76 .55
Class 2 – actual return 1,000.00 1,100.61 2.86 .55Class 2 – assumed 5% return 1,000.00 1,022.07 2.76 .55
Class 3 – actual return 1,000.00 1,101.41 2.50 .48Class 3 – assumed 5% return 1,000.00 1,022.41 2.41 .48
Class 4 – actual return 1,000.00 1,099.74 4.16 .80Class 4 – assumed 5% return 1,000.00 1,020.83 4.01 .80
Global Balanced FundClass 1 – actual return $1,000.00 $1,061.04 $3.68 .72%Class 1 – assumed 5% return 1,000.00 1,021.22 3.61 .72
Class 1A – actual return 1,000.00 1,059.77 4.95 .97Class 1A – assumed 5% return 1,000.00 1,019.98 4.86 .97
Class 2 – actual return 1,000.00 1,059.77 4.95 .97Class 2 – assumed 5% return 1,000.00 1,019.98 4.86 .97
Class 4 – actual return 1,000.00 1,058.21 6.23 1.22Class 4 – assumed 5% return 1,000.00 1,018.74 6.11 1.22
The Bond Fund of AmericaClass 1 – actual return $1,000.00 $ 993.28 $1.63 .33%Class 1 – assumed 5% return 1,000.00 1,023.16 1.66 .33
Class 1A – actual return 1,000.00 992.06 2.86 .58Class 1A – assumed 5% return 1,000.00 1,021.92 2.91 .58
Class 2 – actual return 1,000.00 991.88 2.86 .58Class 2 – assumed 5% return 1,000.00 1,021.92 2.91 .58
Class 4 – actual return 1,000.00 990.71 4.10 .83Class 4 – assumed 5% return 1,000.00 1,020.68 4.16 .83
Capital World Bond FundClass 1 – actual return $1,000.00 $ 968.01 $2.39 .49%Class 1 – assumed 5% return 1,000.00 1,022.36 2.46 .49
Class 1A – actual return 1,000.00 967.55 3.61 .74Class 1A – assumed 5% return 1,000.00 1,021.12 3.71 .74
Class 2 – actual return 1,000.00 967.40 3.61 .74Class 2 – assumed 5% return 1,000.00 1,021.12 3.71 .74
Class 4 – actual return 1,000.00 965.88 4.83 .99Class 4 – assumed 5% return 1,000.00 1,019.89 4.96 .99
American High-Income TrustClass 1 – actual return $1,000.00 $1,066.15 $2.31 .45%Class 1 – assumed 5% return 1,000.00 1,022.56 2.26 .45
Class 1A – actual return 1,000.00 1,064.90 3.64 .71Class 1A – assumed 5% return 1,000.00 1,021.27 3.56 .71
Class 2 – actual return 1,000.00 1,064.95 3.64 .71Class 2 – assumed 5% return 1,000.00 1,021.27 3.56 .71
Class 3 – actual return 1,000.00 1,065.57 3.28 .64Class 3 – assumed 5% return 1,000.00 1,021.62 3.21 .64
Class 4 – actual return 1,000.00 1,062.78 4.86 .95Class 4 – assumed 5% return 1,000.00 1,020.08 4.76 .95
See end of tables for footnotes.
Expense example (continued)

338 American Funds Insurance Series
Beginningaccount value
1/1/2021
Endingaccount value
6/30/2021
Expensespaid during
period1
Annualizedexpense
ratio
American Funds Mortgage FundClass 1 – actual return $1,000.00 $ 994.33 $1.53 .31%Class 1 – assumed 5% return 1,000.00 1,023.26 1.56 .31
Class 1A – actual return 1,000.00 994.02 2.77 .56Class 1A – assumed 5% return 1,000.00 1,022.02 2.81 .56
Class 2 – actual return 1,000.00 993.00 2.77 .56Class 2 – assumed 5% return 1,000.00 1,022.02 2.81 .56
Class 4 – actual return 1,000.00 992.65 4.00 .81Class 4 – assumed 5% return 1,000.00 1,020.78 4.06 .81
Ultra-Short Bond FundClass 1 – actual return $1,000.00 $ 998.23 $1.78 .36%Class 1 – assumed 5% return 1,000.00 1,023.01 1.81 .36
Class 1A – actual return 1,000.00 998.23 1.73 .35Class 1A – assumed 5% return 1,000.00 1,023.06 1.76 .35
Class 2 – actual return 1,000.00 997.27 3.02 .61Class 2 – assumed 5% return 1,000.00 1,021.77 3.06 .61
Class 3 – actual return 1,000.00 997.30 2.67 .54Class 3 – assumed 5% return 1,000.00 1,022.12 2.71 .54
Class 4 – actual return 1,000.00 996.39 4.26 .86Class 4 – assumed 5% return 1,000.00 1,020.53 4.31 .86
U.S. Government Securities FundClass 1 – actual return $1,000.00 $ 986.91 $1.67 .34%Class 1 – assumed 5% return 1,000.00 1,023.11 1.71 .34
Class 1A – actual return 1,000.00 985.82 2.86 .58Class 1A – assumed 5% return 1,000.00 1,021.92 2.91 .58
Class 2 – actual return 1,000.00 986.38 2.91 .59Class 2 – assumed 5% return 1,000.00 1,021.87 2.96 .59
Class 3 – actual return 1,000.00 985.85 2.56 .52Class 3 – assumed 5% return 1,000.00 1,022.22 2.61 .52
Class 4 – actual return 1,000.00 984.18 4.13 .84Class 4 – assumed 5% return 1,000.00 1,020.63 4.21 .84
See end of tables for footnotes.
Expense example (continued)

American Funds Insurance Series 339
Beginningaccount value
1/1/2021
Endingaccount value
6/30/2021
Expensespaid during
period1,2Annualized
expense ratio2
Effectiveexpenses paidduring period3
Effectiveannualized
expense ratio4
Managed Risk Growth FundClass P1 – actual return $1,000.00 $1,075.60 $1.90 .37% $3.71 .72%Class P1 – assumed 5% return 1,000.00 1,022.96 1.86 .37 3.61 .72
Class P2 – actual return 1,000.00 1,075.25 3.19 .62 4.99 .97Class P2 – assumed 5% return 1,000.00 1,021.72 3.11 .62 4.86 .97
Managed Risk International FundClass P1 – actual return $1,000.00 $1,027.33 $1.81 .36% $4.42 .88%Class P1 – assumed 5% return 1,000.00 1,023.01 1.81 .36 4.41 .88
Class P2 – actual return 1,000.00 1,026.42 3.17 .63 5.78 1.15Class P2 – assumed 5% return 1,000.00 1,021.67 3.16 .63 5.76 1.15
Managed RiskWashington Mutual Investors FundClass P1 – actual return $1,000.00 $1,090.84 $1.81 .35% $3.94 .76%Class P1 – assumed 5% return 1,000.00 1,023.06 1.76 .35 3.81 .76
Class P2 – actual return 1,000.00 1,089.86 3.21 .62 5.34 1.03Class P2 – assumed 5% return 1,000.00 1,021.72 3.11 .62 5.16 1.03
Managed Risk Growth-Income FundClass P1 – actual return $1,000.00 $1,088.19 $1.86 .36% $3.42 .66%Class P1 – assumed 5% return 1,000.00 1,023.01 1.81 .36 3.31 .66
Class P2 – actual return 1,000.00 1,087.56 3.16 .61 4.71 .91Class P2 – assumed 5% return 1,000.00 1,021.77 3.06 .61 4.56 .91
Managed Risk Asset Allocation FundClass P1 – actual return $1,000.00 $1,086.16 $1.86 .36% $3.41 .66%Class P1 – assumed 5% return 1,000.00 1,023.01 1.81 .36 3.31 .66
Class P2 – actual return 1,000.00 1,084.57 3.15 .61 4.70 .91Class P2 – assumed 5% return 1,000.00 1,021.77 3.06 .61 4.56 .91
1The “expenses paid during period” are equal to the “annualized expense ratio,” multiplied by the average account value over the period, multiplied by thenumber of days in the period, and divided by 365 (to reflect the one-half year period).
2The “expenses paid during period” and “annualized expense ratio” do not include the expenses of the underlying funds in which each fund invests.3The “effective expenses paid during period” are equal to the “effective annualized expense ratio,” multiplied by the average account value over the period,multiplied by the number of days in the period, and divided by 365 (to reflect the period).
4The “effective annualized expense ratio” reflects the net annualized expense ratio of the class plus the class’s pro-rata share of the weighted average expenseratio of the underlying funds in which it invests.
Expense example (continued)

340 American Funds Insurance Series
Approval of Investment Advisory and Service Agreement — American Funds Insurance Series
The series’ board has approved the continuation of the series’ Investment Advisory and Service Agreement (the “agreement”) with Capital Research and Management Company (“CRMC”) for an additional one-year term through April 30, 2022. The agreement was amended to add additional advisory fee breakpoints for Global Growth Fund when the fund‘s net assets exceed $5 billion and $8 billion. The board approved the agreement following the recommendation of the series’ Contracts Committee (the “committee”), which is composed of all the series’ independent board members. The board and the committee determined in the exercise of their business judgment that the advisory fee structure for each fund within the series was fair and reasonable in relation to the services provided, and that approving the agreement was in the best interests of each fund and its shareholders.
In reaching this decision, the board and the committee took into account their interaction with CRMC as well as information furnished to them throughout the year and otherwise provided to them, as well as information prepared specifi cally in connection with their review of the agreement, and were advised by their independent counsel with respect to the matters considered. They considered the following factors, among others, but did not identify any single issue or particular piece of information that, in isolation, was the controlling factor, and each board and committee member did not necessarily attribute the same weight to each factor.
1. Nature, extent and quality of servicesThe board and the committee considered the depth and quality of CRMC’s investment management process, including its global research capabilities; the experience, capability and integrity of its senior management and other personnel; the low turnover rates of its key personnel; the overall fi nancial strength and stability of CRMC and the Capital Group organization; the resources and systems CRMC devotes to investment management (the manner in which each fund’s assets are managed, including liquidity management), fi nancial, investment operations, compliance, trading, proxy voting, shareholder communications, and other services; and the ongoing evolution of CRMC’s organizational structure designed to maintain and strengthen these qualities. The board and the committee also considered the nature, extent and quality of administrative and shareholder services provided by CRMC to the funds under the agreement and other agreements, as well as the benefi ts to each fund’s shareholders from investing in a fund that is part of a large family of funds. The board and the committee considered the risks assumed by CRMC in providing services to the funds, including operational, business, fi nancial, reputational, regulatory and litigation risks. The board and the committee concluded that the nature, extent and quality of the services provided by CRMC have benefi ted and should continue to benefi t each fund and its shareholders.
2. Investment resultsThe board and the committee considered the investment results of each fund in light of its objectives. They compared each fund’s investment results with those of other funds (including funds that currently form the basis of the Lipper index for the category in which each fund is included), and data such as relevant market and fund indexes over various periods (including each fund’s lifetime) through September 30, 2020. They generally placed greater emphasis on investment results over longer term periods. On the basis of this evaluation and the board’s and the committee’s ongoing review of investment results, and considering the relative market conditions during certain reporting periods, the board and the committee concluded that each fund’s investment results have been satisfactory for renewal of the agreement, and that CRMC’s record in managing the funds indicated that its continued management should benefi t each fund and its shareholders.
3. Advisory fees and total expensesThe board and the committee compared the advisory fees and total expense levels of each fund to those of other relevant funds. They observed that the advisory fees and total expenses of each fund generally compared favorably to those of other similar funds included in the comparable Lipper category.

American Funds Insurance Series 341
The board and the committee also considered the breakpoint discounts in each fund’s advisory fee structure that reduce the level of fees charged by CRMC to the fund as fund assets increase. In addition, they reviewed information regarding the effective advisory fees charged to non-mutual fund clients by CRMC and its affi liates. They noted that, to the extent there were differences between the advisory fees paid by each fund and the advisory fees paid by those clients, the differences appropriately refl ected the investment, operational, regulatory and market differences between advising the funds and the other clients. The board and the committee concluded that each fund’s cost structure was fair and reasonable in relation to the services provided, as well as in relation to the risks assumed by the adviser in sponsoring and managing each fund, and that each fund’s shareholders receive reasonable value in return for the advisory fees and other amounts paid to CRMC by the funds.
4. Ancillary benefi tsThe board and the committee considered a variety of other benefi ts that CRMC and its affi liates receive as a result of CRMC’s relationship with the series and other American Funds, including fees for administrative services provided to certain share classes; fees paid to CRMC’s affi liated transfer agent; sales charges and distribution fees received and retained by the series’ principal underwriter, an affi liate of CRMC; and possible ancillary benefi ts to CRMC and its institutional management affi liates in managing other investment vehicles. The board and the committee reviewed CRMC’s portfolio trading practices, noting that through December 31, 2018, CRMC benefi ted from research obtained with commissions from portfolio transactions made on behalf of the funds, and since that time has undertaken to bear the cost of obtaining such research. The board and the committee took these ancillary benefi ts into account in evaluating the reasonableness of the advisory fees and other amounts paid to CRMC by the funds.
5. Adviser fi nancial informationThe board and the committee reviewed information regarding CRMC’s costs of providing services to the American Funds, including personnel, systems and resources of investment, compliance, trading, accounting and other administrative operations. They considered CRMC’s costs and related cost allocation methodology as well as its track record of investing in technology, infrastructure and staff to maintain and expand services and capabilities, respond to industry and regulatory developments, and attract and retain qualifi ed personnel. They noted information regarding the compensation structure for CRMC’s investment professionals. They reviewed information on the profi tability of the investment adviser and its affi liates. The board and the committee also compared CRMC’s profi tability and compensation data to the reported results and data of several large, publicly held investment management companies. The board and the committee noted the competitiveness and cyclicality of both the mutual fund industry and the capital markets, and the importance in that environment of CRMC’s long-term profi tability for maintaining its independence, company culture and management continuity. They further considered the breakpoint discounts in the funds’ advisory fee structure and CRMC’s sharing of potential economies of scale, or effi ciencies, through breakpoints and other fee reductions and costs voluntarily absorbed. The board and the committee concluded that each fund’s advisory fee structure refl ected a reasonable sharing of benefi ts between CRMC and the funds’ shareholders.

342 American Funds Insurance Series
Approval of Investment Advisory and Service Agreement and Subadvisory Agreement — American Funds Insurance Series Managed Risk Funds
The series’ board has approved the continuation of the series’ Investment Advisory and Service Agreement (the “advisory agreement”) with Capital Research and Management Company (“CRMC”) with respect to the Managed Risk Funds for an additional one-year term through April 30, 2022. The board has also approved the series’ Subadvisory Agreement (the “subadvisory agreement”) with CRMC and Milliman Financial Risk Management LLC (“Milliman FRM”) with respect to these funds for the same term. The advisory and subadvisory agreements are jointly referred to below as the “agreements.” The board approved the agreements following the recommendation of the series’ Contracts Committee (the “committee”), which is composed of all the series’ independent board members. The board and the committee determined in the exercise of their business judgment that the advisory fee structure for each fund within the series was fair and reasonable in relation to the services provided, and that approving the agreements was in the best interests of each fund and its shareholders.
In reaching this decision, the board and the committee took into account their interaction with CRMC and Milliman FRM as well as information furnished to them throughout the year and otherwise provided to them, as well as information prepared specifi cally in connection with their review of the agreements, and were advised by their independent counsel with respect to the matters considered. They considered the following factors, among others, but did not identify any single issue or particular piece of information that, in isolation, was the controlling factor, and each board and committee member did not necessarily attribute the same weight to each factor.
1. Nature, extent and quality of servicesThe board and the committee considered the depth and quality of CRMC’s investment management process, including its global research capabilities; the experience, capability and integrity of its senior management and other personnel; the low turnover rates of its key personnel; the overall fi nancial strength and stability of CRMC and the Capital Group organization; the resources and systems CRMC devotes to investment management (the manner in which each fund’s assets are managed, including liquidity management), fi nancial, investment operations, compliance, trading, proxy voting, shareholder communications, and other services; and the ongoing evolution of CRMC’s organizational structure designed to maintain and strengthen these qualities. The board and the committee also considered the nature, extent and quality of the oversight of Milliman FRM’s services provided by CRMC, administrative and shareholder services provided by CRMC to the funds under the advisory agreement and other agreements, as well as the benefi ts to each fund’s shareholders from investing in a fund that is part of a large family of funds. The board and the committee considered the risks assumed by CRMC in providing services to the funds, including operational, business, fi nancial, reputational, regulatory and litigation risks. The board and the committee concluded that the nature, extent and quality of the services provided by CRMC have benefi ted and should continue to benefi t each fund and its shareholders.
The board and the committee also considered the depth and quality of Milliman FRM’s investment management process, including its experience in applying the Milliman Managed Risk Strategy to other funds in the series and risk management services for other clients; the experience, capability and integrity of its senior management and other personnel; and the services provided to each fund under the subadvisory agreement. The board and the committee concluded that the nature, extent and quality of the services provided by Milliman FRM have benefi ted and should continue to benefi t each fund and its shareholders.
2. Investment resultsThe board and the committee considered the investment results of each fund in light of its objectives. They compared each fund’s investment results with those of other funds (including funds that currently form the basis of the Lipper index for the category in which each fund is included), and data such as relevant market and fund indexes over various periods (including each fund’s lifetime) through September 30, 2020. They generally placed greater emphasis on investment results over longer term periods. The board and the committee also considered the volatility of the funds compared with the S&P 500 Managed Risk indexes and those of a group of funds with volatility management strategies identifi ed by management over various periods (including each fund’s lifetime) through September 30, 2020. On the basis of this evaluation and the board’s and the committee’s ongoing review of investment results, and considering the relative market conditions during certain reporting periods, the board and the committee concluded that each fund’s investment results and the results of the services provided by CRMC and Milliman FRM have been satisfactory for renewal of the agreement, and that CRMC’s and Milliman FRM’s record in managing the funds indicated that their continued management should benefi t each fund and its shareholders.

American Funds Insurance Series 343
3. Advisory fees and total expensesThe board and the committee compared the advisory fees and total expense levels of each fund to those of other relevant funds. The board and the committee noted CRMC’s waiver of a portion of the advisory fee payable by each fund under the advisory agreement, CRMC’s commitment not to remove the waiver without board approval and CRMC’s agreement to pay the fees due to Milliman FRM under the subadvisory agreement. They observed that each fund’s advisory fees and total expenses generally compared favorably to those of other similar funds included in the comparable Lipper category.
The board and the committee also considered the breakpoint discounts in each underlying fund’s advisory fee structure that reduce the level of fees charged by CRMC to the underlying fund as its assets increase. In addition, they reviewed information regarding the effective advisory fees charged to non-mutual fund clients by CRMC and its affi liates. They noted that, to the extent there were differences between the advisory fees paid by the fund and the advisory fees paid by those clients, the differences appropriately refl ected the investment, operational, regulatory and market differences between advising the funds and the other clients. They also reviewed the fees paid to Milliman FRM by other funds which it advised or subadvised. The board and the committee concluded that each fund’s cost structure was fair and reasonable in relation to the services that CRMC provided, directly and through Milliman FRM, as well as in relation to the risks assumed by the adviser in sponsoring and managing each fund, and that each fund’s shareholders receive reasonable value in return for the advisory fees and other amounts paid to CRMC (and indirectly to Milliman FRM) by the funds.
4. Ancillary benefi tsThe board and the committee considered a variety of other benefi ts that CRMC and its affi liates receive as a result of CRMC’s relationship with the series and the other American Funds, including fees for administrative services provided to certain share classes; fees paid to CRMC’s affi liated transfer agent; sales charges and distribution fees received and retained by the series’ principal underwriter, an affi liate of CRMC; and possible ancillary benefi ts to CRMC and its institutional management affi liates in managing other investment vehicles. The board and the committee reviewed CRMC’s portfolio trading practices, noting that through December 31, 2018, CRMC benefi ted from research obtained with commissions from portfolio transactions made on behalf of the funds, and since that time has undertaken to bear the cost of obtaining such research. The board and the committee also reviewed similar ancillary benefi ts received by Milliman FRM as a result of its relationship with the series. The board and the committee took these ancillary benefi ts into account in evaluating the reasonableness of the advisory fees and other amounts paid to CRMC (and indirectly to Milliman FRM) by each fund.
5. Adviser fi nancial informationThe board and the committee reviewed information regarding CRMC’s costs of providing services to the American Funds, including personnel, systems and resources of investment, compliance, trading, accounting and other administrative operations. They considered CRMC’s costs and related cost allocation methodology as well as its track record of investing in technology, infrastructure and staff to maintain and expand services and capabilities, respond to industry and regulatory developments, and attract and retain qualifi ed personnel. They noted information regarding the compensation structure for CRMC’s investment professionals. They reviewed information on the profi tability of the investment adviser and its affi liates. The board and the committee also compared CRMC’s profi tability and compensation data to the reported results and data of several large, publicly held investment management companies. The board and the committee noted the competitiveness and cyclicality of both the mutual fund industry and the capital markets, and the importance in that environment of CRMC’s long-term profi tability for maintaining its independence, company culture and management continuity. They further considered the breakpoint discounts in the funds’ advisory fee structure and CRMC’s sharing of potential economies of scale, or effi ciencies, through breakpoints and other fee reductions and costs voluntarily absorbed. The board and the committee concluded that each fund’s advisory fee structure refl ected a reasonable sharing of benefi ts between CRMC and the funds’ shareholders.

344 American Funds Insurance Series
Office of the series333 South Hope StreetLos Angeles, CA 90071-1406
Investment adviserCapital Research and Management Company333 South Hope StreetLos Angeles, CA 90071-1406
Investment subadviserMilliman Financial Risk Management LLC(Managed Risk Funds only)71 South Wacker Drive, 31st FloorChicago, IL 60606
Custodian of assetsState Street Bank and Trust CompanyOne Lincoln StreetBoston, MA 02111
CounselMorgan, Lewis & Bockius LLPOne Federal StreetBoston, MA 02110-1726
Independent registered public accounting firmPricewaterhouseCoopers LLP601 South Figueroa StreetLos Angeles, CA 90017-3874

Investors should carefully consider investment objectives, risks, charges and expenses. This and other important information is contained in the series prospectuses and summary prospectuses, which can be obtained from your financial professional and should be read carefully before investing. You may also call American Funds Service Company (AFS) at (800) 421-4225 or visit the Capital Group website at capitalgroup.com.
“American Funds Proxy Voting Procedures and Principles” — which describes how we vote proxies relating to portfolio securities — is available on the Capital Group website or upon request by calling AFS. The series files its proxy voting record with the U.S. Securities and Exchange Commission (SEC) for the 12 months ended June 30 by August 31. The proxy voting record is available free of charge on the SEC website at sec.gov and on the Capital Group website.
American Funds Insurance Series files a complete list of its portfolio holdings with the SEC for the first and third quarters of each fiscal year on Form NPORT-P. This filing is available free of charge on the SEC website and on our website.
This report is for the information of American Funds Insurance Series investors, but it also may be used as sales literature when preceded or accompanied by the current prospectuses or summary prospectuses for American Funds Insurance Series and the prospectus for the applicable insurance contract, which give details about charges, expenses, investment objectives and operating policies of the series. If used as sales material after September 30, 2021, this report must be accompanied by a statistical update for the most recently completed calendar quarter.
Fund attribution data was produced using FactSet, a third-party software system, based on daily portfolios. Securities in their initial period of acquisition may not be included in this analysis. The analysis includes equity investments only and excludes forward contracts and fixed income investments, if applicable. It does not account for buy-and-sell transactions that might have occurred intraday. As a result, average portfolio weight percentages are approximate, and the actual average portfolio weight percentages might be higher or lower. Data elements, such as pricing, income, market cap, etc., were provided by FactSet. The indexes provided for attribution are based on FactSet’s methodology. The indexes are broad-based market benchmarks and may not be used by Capital Group as the sole comparative index for the funds. Capital Group believes the software and information from FactSet to be reliable. However, Capital Group cannot be responsible for inaccuracies, incomplete information or updating of information by FactSet.
Hedge instruments, including exchange-traded futures contracts and exchange-traded put options, may not provide an effective hedge of the underlying securities because changes in the prices of such instruments may not track those of the securities they are intended to hedge. In addition, the managed risk strategy may not effectively protect the funds from market declines and will limit the funds’ participation in market gains. The use of the managed risk strategy could cause the funds’ returns to lag those of the applicable underlying funds in certain rising market conditions.
Bloomberg® is a trademark and service mark of Bloomberg Finance L.P. (collectively with its affiliates, “Bloomberg”). Barclays® is a trademark and service mark of Barclays Bank Plc (collectively with its affiliates, “Barclays”), used under license. Bloomberg or Bloomberg’s licensors, including Barclays, own all proprietary rights in the Bloomberg Barclays Indices. Neither Bloomberg nor Barclays approve or endorse this material, or guarantees the accuracy or completeness of any information herein, or makes any warranty, express or implied, as to the results to be obtained therefrom and, to the maximum extent allowed by law, neither shall have any liability or responsibility for injury or damages arising in connection therewith. MSCI has not approved, reviewed or produced this report, makes no express or implied warranties or representations and is not liable whatsoever for any data in the report. You may not redistribute the MSCI data or use it as a basis for other indices or investment products. The S&P 500 is a product of S&P Dow Jones Indices LLC and/or its affiliates and has been licensed for use by Capital Group. Copyright © 2021 S&P Dow Jones Indices LLC, a division of S&P Global, and/or its affiliates. All rights reserved. Redistribution or reproduction in whole or in part is prohibited without written permission of S&P Dow Jones Indices LLC.
American Funds Distributors, Inc., member FINRA.

Lit. No. INGESRX-998-0821P Litho in USA RCG/RRD/6311-S85205 © 2021 Capital Group. All rights reserved.
Since 1931, Capital Group, home of American Funds, has helped investors pursue long-term investment success. Our consistent approach — in combination with The Capital SystemSM — has resulted in superior outcomes.
Aligned with investor success
We base our decisions on a long-term perspective, which we believe aligns our goals with the interests of our clients. American Funds Insurance Series portfolio managers average 27 years of investment industry experience, including 22 years at our company, reflecting a career commitment to our long-term approach.1
The Capital System
The Capital System combines individual accountability with teamwork. Funds using The Capital System are divided into portions that are managed independently by investment professionals with diverse backgrounds, ages and investment approaches. An extensive global research effort is the backbone of our system.
American Funds Insurance Series’ superior outcomes
American Funds Insurance Series equity funds have beaten their comparable Lipper indexes in 91% of 10-year periods and 100% of 20-year periods.2 Our fi xed income funds have helped investors achieve diversifi cation through attention to correlation between bonds and equities.3 We strive to keep management fees competitive. Over the past 20 years, most funds’ fees have been below industry averages.4
The Capital Advantage®
1 Portfolio manager experience as of the American Funds Insurance Series prospectus dated May 1, 2021.2 Based on Class 1 share results for rolling calendar-year periods starting the fi rst full calendar year after each fund’s inception through December 31, 2020.
Periods covered are the shorter of the fund’s lifetime or since the inception date of the comparable Lipper index or average. The comparable Lipper indexes are: Global Funds Index (Global Growth Fund, Capital World Growth and Income Fund), Growth Funds Index (Growth Fund), International Funds Index (International Fund), Emerging Markets Funds Index (New World Fund), Growth & Income Funds Index (Washington Mutual Investors Fund, Growth-Income Fund) and Balanced Funds Index (Asset Allocation Fund). The Lipper Global Small-/Mid-Cap Funds Average was used for Global Small Capitalization Fund. Lipper source: Refi nitiv Lipper. There have been periods when the fund has lagged the index.
3 Based on Class 1 share results as of December 31, 2020. Three of our fi ve fi xed income funds showed a three-year correlation below 0.3. Standard & Poor’s 500 Index was used as an equity market proxy. Correlation based on monthly total returns. Correlation is a statistical measure of how two securities move in relation to each other. A correlation ranges from –1 to 1. A positive correlation close to 1 implies that as one security moves, either up or down, the other security will move in “lockstep,” in the same direction. A negative correlation close to –1 indicates that the securities have moved in the opposite direction.
4 Based on management fees for the 20-year period ended December 31, 2020, versus comparable Lipper categories, excluding funds of funds.
All Capital Group trademarks mentioned are owned by The Capital Group Companies, Inc., an affi liated company or fund. All other company and product names mentioned are the property of their respective companies.