INVESTIGATIONS ON DEMERSAL FISH IN THE BARENTS SEA …
78
J O I N T R E P O R T S E R I E S IMR/PINRO 5 2001 INVESTIGATIONS ON DEMERSAL FISH IN THE BARENTS SEA WINTER 2000 Detailed report BOTNFISKUNDERSØKINGAR I BARENTSHAVET VINTEREN 2000 Detaljert rapport Asgeir Aglen I , Konstantin Drevetnyak 2 , Tore Jakobsen I , Knut Korsbrekke I , Yuri Lepesevich 2 , Sigbjørn Mehl I , Odd Nakken I and Kjell H. Nedreaas I I Institute of Marine Research 2 PINRO Polar Research Institute of Marine Fisheries and Oceanography - PINRO Institute of Marine Research - IMR
Transcript of INVESTIGATIONS ON DEMERSAL FISH IN THE BARENTS SEA …
JO
I NT R E P O R T S E
RI E
S
I M R / P I N R O
52001
INVESTIGATIONS ON DEMERSAL FISHIN THE BARENTS SEA WINTER 2000
Detailed report
BOTNFISKUNDERSØKINGAR IBARENTSHAVET VINTEREN 2000
Detaljert rapport
Asgeir AglenI , Konstantin Drevetnyak2 , Tore JakobsenI ,Knut KorsbrekkeI , Yuri Lepesevich2 , Sigbjørn MehlI ,
Odd NakkenI and Kjell H. NedreaasI
I Institute of Marine Research 2 PINRO
Polar Research Inst i tu te of Mar ineFisher ies and Oceanography - PINRO
Inst i tu te of Mar ine Research - IMR

This report should be cited as: Aglen, A., Drevetnyak, K., Jakobsen, T., Korsbrekke, K., Lepesevich, Y., Mehl, S.,
Nakken, O., and Nedreaas, K. H. 2001. Investigations on demersal fish in the Barents Sea winter 2000. Detailed report. Botnfiskundersøkingar i Barentshavet vinteren 2000.
Detaljert rapport. IMR/PINRO Joint Report Series. No. 5/2001. ISSN 1502-8828. 74 pp.

1
IMR/PINRO Joint Report Series, No. 5/2001
Investigations on demersal fish in the Barents Sea winter 2000 Detailed report
Botnfiskundersøkingar i Barentshavet vinteren 2000 Detaljert rapport
Asgeir Aglen1, Konstantin Drevetnyak2, Tore Jakobsen1, Knut Korsbrekke1, Yuri
Lepesevich2, Sigbjørn Mehl1 , Odd Nakken1
and Kjell H. Nedreaas1
1 Institute of Marine Research
P.O. Box 1870 Nordnes
N-5024 Bergen
NORWAY
2 PINRO
6 Knipovich Street
183 763 Murmansk
RUSSIA

2
CONTENTS
PREFACE 4
SAMANDRAG 5
SUMMARY 6
1. INTRODUCTION 7
2. METHODS 8
2.1 Acoustic measurements 8
2.2 Swept area measurements 10
2.3 Sampling of catch and age-length keys. 13
3. SURVEY OPERATION 15
4. HYDROGRAPHY 18
5. TOTAL ECHO ABUNDANCE OF COD AND HADDOCK 20
5.1 Horizontal distribution 20
5.2 Vertical distribution 23
6. DISTRIBUTION AND ABUNDANCE OF COD 26
6.1 Acoustic estimation 26
6.2 Swept area estimation 32
6.3 Growth 37
6.4 Considerations and conclusion 40
7. DISTRIBUTION AND ABUNDANCE OF HADDOCK 42
7.1 Acoustic estimation 42
7.2 Swept area estimation 47
7.3 Growth 53

3
7.4 Conclusion 56
8. DISTRIBUTION AND ABUNDANCE OF REDFISH 57
8.1 Acoustic estimation 57
8.2 Swept area estimation 60
9. DISTRIBUTION AND ABUNDANCE OF GREENLAND HALIBUT 66
10. COMPARISONS BETWEEN RESEARCH VESSELS 68
11. LITERATURE 73
12. LIST OF PARTICIPANTS 74

4
PREFACE Annual catch quotas and other regulations of the Barents Sea fisheries are set through
negotiations between Norway and Russia. Assessment of the state of the stocks and quota
advices are given by the International Council for the Exploration of the Sea (ICES). Their
work is based on survey results and the international landings statistics. The results from the
Norwegian demersal fish winter survey in the Barents Sea are an important source of
information for the annual stock assessment.
These surveys started in the mid 1970-ties, focused on acoustic measurements of cod and
haddock. Since 1981 the survey has been designed to give both acoustic and swept area
estimates of fish abundance. Some development has taken place since then, both in terms of
area coverage and in terms of methodology. The development is described in more detail by
Jacobsen et al. (1997). At present this survey provides the main data input for a number of
projects at Institute of Marine Research, Bergen:
- monitoring abundance of the Barents Sea demersal stocks
- mapping fish distribution in relation to climate and prey abundance
- monitoring food consumption and growth
- estimating predation mortality caused by cod
This report presents the results from the survey in February 2000. This year the Russian
research vessel “Persey III” participated in addition to the Norwegian research vessels “G.O.
Sars” and “Johan Hjort” and the hired factory trawler “Varegg”. The total duration of the survey
was from 27 January to 29 February. The total scientific crew on the Norwegian vessels was 28
(see Chapter 11). One scientist from PINRO, Murmansk, participated onboard ”Johan Hjort”,
and a Russian observer participated on both ”G.O. Sars” and ”Johan Hjort”. Both vessels
visited Murmansk for inspection at 3 February.

5
SAMANDRAG
Eit kombinert akustikk- og botntråltokt med sikte på å framskaffa indeksar for talet på fisk og
data for individuell lengde og vekt av kvar aldersgruppe av viktige botnfiskartar er gjennomført
kvar vinter (4-6 veker i januar - mars) sidan 1981 i Barentshavet. Hovudinnsatsen er retta mot
ungfiskbestandane av torsk og hyse, men i seinare år er slike indeksar også utarbeidde for
uerartane og blåkveite. Sidan 1993 er undersøkingsområdet utvida mot nord og aust for å få ei
fullstendig dekking av den isfrie delen av utbreiingsområdet til dei yngste årsklassane av torsk.
Vinteren 1997 vart berre den norske delen av Barentshavet samt ein mindre del av Svalbard-
området dekka, medan ein i 1998 fekk tilgang til ein liten del av russisk sone. I 1999 og 2000
hadde ein full tilgang til russisk sone.
Resultata for 2000 viser:
- 1998-årsklassen av torsk er svak og 1999-årsklassen er svært svak
- indeksane for 3-6 år gamal torsk (1997-1994 årsklassane) er omlag som venta ut frå
siste bestandsvurdering og på nivå med gjennomsnittet for 1993-1999
- det er lite att av 7 år gamal og eldre torsk
- dødsraten har gått noko ned i høve til dei fire siste år for dei fleste aldersgrupper av
torsk
- lengde, vekt og individuell tilvekst for torsk er omlag som i 1999
- 1998 -årsklassen av hyse er godt over middels, medan 1999-årsklassen er omlag
middels. 1996-årsklassen viser seg som middels sterk i dei akustiske målingane,
men godt under middels i botntrål estimatet.
- indeksane for eldre hyse er reduserte til under halvparten av middels nivå og er til
dels svært svake
- lengde, vekt og individuell tilvekst for hyse er omlag som i 1999
- total dødsrate for hyse har gått ned i høve til tidlegare år
- indeksane for uerartane er mellom dei lågaste i tidsserien og det er ingen teikn på
nyrekruttering
- for snabeluer er det ei svak auke for fisk over 25-30 cm p.g.a. dei siste gode
årsklassane (1989-1990) i bestanden
- for blåkveite mellom 25 og 40 cm er indeksen over det den var på heile 1990-talet,
men for dei andre lengdegrupper omlag på gjennomsnittet for 1990-talet

6
SUMMARY A combined acoustic and bottom trawl survey to obtain indices of abundance and estimates of
length and weight at age has been carried out each winter (4-6 weeks in January- March) since
1981 in the Barents Sea. The target species are cod and haddock, but in recent years abundance
indices have also been worked out for the redfish species and Greenland halibut. Since 1993 the
survey area has been extended to the north and east in order to obtain a more complete coverage
of the younger age groups of cod. In winter 1997 only the Norwegian part of the Barents Sea
and a small part of the Svalbard area was covered, while in 1998 also a small part of the
Russian EEZ was covered. In 1999 and 2000 the vessels had full access to the Russian EEZ.
The main results in 2000 were:
- the 1998 year class of cod is weak and the 1999 year class is very weak
- the abundance indices of 3-6 year old cod (1997-1994 year classes) are as expected
from the last cod stock assessment and at the 1993-1999 average
- the numbers of 7 year and older cod are very low
- length and weight at age and weight increment are low but improving
- the mortality rate has been reduced compared with the previous four years for most of
the cod age groups
- the 1998 year class of haddock is well above average and the 1999 year class is about
average. The 1996 year class turns out as an average one from the acoustic estimation,
but well below average in the swept area estimate.
- the abundance indices of older haddock are below average and partly very poor
- length and weight at age and weight increment are improving slowly, most clearly seen
for ages 1 and 2.
- the abundance indices of the redfish species are among the lowest in the time series
and there are no signs of improved recruitment
- the index of S .mentella larger than 25-30 cm shows an increase due to the last good
year classes (1989-1990) in the stock
- the abundance index of Greenland halibut between 25 and 40 cm is greater than in
the 1990-ies, while for the other length groups the indices are about the average 1990-
ies level.

7
1. INTRODUCTION The Institute of Marine Research (IMR), Bergen, has performed acoustic measurements of
demersal fish in the Barents Sea since 1976. Since 1981 a bottom trawl survey has been
combined with this acoustic survey. The survey area was extended in 1993. Since then the
typical effort of the combined survey has been 10-14 vessel-weeks, and about 350 bottom trawl
hauls have been made each year. Most years 3 vessels have participated from about 1 February
to 1 March.
The purpose of the investigations is: - Obtain acoustic abundance indices of cod, haddock and redfish
- Obtain swept area abundance indices by length (and age) groups of cod haddock, redfish
and Greenland halibut.
- Map the geographical distribution of those fish stocks
- Estimate length, weight and maturity at age for those stocks
- Collect stomach samples from cod as a basis for estimating predation by cod
The results and the collected data are used both in the ICES stock assessments and by several
research projects at IMR.
In the early 1990-ies the cod distribution area increased both due to improved climate and
increasing stock size. In 1993 the survey area therefore was increased, and since then the survey
has been aimed towards covering the whole cod distribution area outside the ice-border. In
1997 and 1998 the Norwegian research vessels were not allowed to cover the Russian EEZ, and
in 1999 the coverage was partly limited by a rather unusually wide ice-extension. Adjustments,
associated with large uncertainties, are applied to the estimates in 1997 and 1998 to compensate
for the lack of coverage. The results for those years may therefore not be comparable to the
results for other years. The coverage in 2000 was far better then in the three previous years.

8
2. METHODS
2.1 Acoustic measurements The method is explained by Dalen and Smedstad (1979, 1983), Dalen and Nakken (1983),
MacLennan and Simmonds (1991) and Jakobsen et al. (1997). The acoustic equipment has be
continously improved. Since the early 1990-ies a Simrad EK500 echo sounder and Bergen Echo
Integrator (BEI, Knudsen 1990) has been used. In the mid 1990-ies the echo sounder
transducers were moved from the hull to a protrudable centreboard. This latter change has
largely reduced the signal loss due to air bubbles close to the ship’s hull.
Acoustic backscattering values (sA) are stored at high resolution in the BEI-system. After
scrutinizing and allocting the values to species or species groups, the values are stored with
10m vertical resolution and 1 nautical mile horizontal resolution. The procedure for allocation
by species is based on:
- composition in trawl catches (pelagic and demersal hauls)
- the appearence of the echo recordings
- inspection of targeth strength distributions
For each trawl catch the relative sA-contribution from each species is calculated (Korsbrekke
1996) and used as a guideline for the allocation. In these calculations the fish length dependent
catching efficiency of cod and haddock in the bottom trawl (Aglen and Nakken 1997, see
below) is taken into account. If the trawl catch gives the true composition of the species
contributing to the observed sA value, those catch-based sA -proportions could be used directly
for the allocation. In the scrutinizing process the scientists have to evaluate to what extent these
catch-based sA -proportions are reasonable, or if they should be modified on the basis of
knowledge about the fish behaviour and the catching performance of the gear.
Estimation procedures
The area is divided into rectangles of 1/2� latitude and 1� longitude. For each rectangle and
each species an arithmetic mean sA is calculated for the demersal zone (less than 10m above
bottom) and the pelagic zone (more than 10m above bottom). Each of those acoustic densities
by rectangle are then converted to fish densities by the equation:
��
AA
A
s� (1)

9
�A is average fish density (number of fish / square n.mile) by rectangle sA is average acoustic density (square m / square n.mile) by rectangle � A is average backscattering cross-section (square m) by rectangle
For cod, haddock and redfish the backscattering cross-section (� ), target strength (TS) and fish
length (L cm) is related by the equation (Foote, 1987):
TS � ����
��� � � 10
420 68log log( )
�
�
L (2)
From 1992 onward the following target strength function has been applied for cod, haddock and
redfish:
TS � � �218 74 9. log( ) .L (3)
The data for the period 1981-1992 has been recalculated (Aglen and Nakken 1997) for taking
account of:
-changed target strength function
-changed bottom trawl gear (Godø and Sunnanå 1992)
-size dependant catching efficiency for cod and haddock (Dickson 1993a,b).
In 1999 some errors in the time series were discovered and corrected (Bogstad et al. 1999).
Those errors related to cod for the years 1983-1998 and for haddock for the years 1985-1998.
Combining equations 1,2 and 3 gives: �A As L� � �5 021 105 2. / (3)
L2 is average squared fish length by rectangle and by depth channels (i.e., pelagic and bottom)
As a basis for estimating L2 trawl catches considered to be representative for each rectangle
and depth zone are selected. (Anon. 1998). This is a partly subjective process, and in some
cases catches from neighbouring rectangles are used. Only bottom trawl catches are used for the
demersal zone. Obtaining a sufficient number of useful pelagic catches requires huge effort, and
uncertainties concerning the fish behaviour relative to the pelagic trawl often lead to doubts
about the representativity of the pelagic catches. Therefore, both pelagic and bottom trawl
catches are applied to the pelagic zone. Length frequency by 5cm length groups form the basis
for calculating mean squared length. The bottom trawl catches are normalised to 1 nautical mile

10
towing distance and adjusted for length dependant fishing efficiency (Aglen and Nakken 1997,
see below). Pelagic catches are applied unmodified.
Let f i be the (adjusted) catch by length group i and let Li be the midpoint (cm) of the length
interval i. Then:
Lf L
f
i ii i
i
ii i
i2
2
�
�
�
�
�
�
min
max
min
max (4)
For each species the total density ( �A ) by rectangle and depth zone is calculated by equation
(3). This total density is then split on length groups according to the estimated length
distributions. These densities are further converted to abundance by multiplying with the area of
the rectangle. The estimated abundance by rectangle is then added for defined main areas
(Figure 3.2). Estimates by length are converted to estimates by age by using age an length key
for each main area derived from the age sampling during the survey.
2.2 Swept area measurements All vessels were equipped with the standard research bottom trawl Campelen 1800 shrimp
trawl with 80 mm (stretched) mesh size in the front. Until and including 1993 a cod-end with
35-40 mm (stretched) mesh size and a cover net with 70 mm mesh size were used. Since this
mesh size may lead to considerable escapement of 1 year old cod, the cod ends were in 1994
replaced by cod-ends with 22 mm mesh size. At present a cover net with 116 mm meshes is
mostly used. The ground gear has also been changed during the time series. The trawl is now
equipped with a rockhopper ground gear. Until and including 1988 a bobbins gear was used,
and the cod and haddock indices from the time period 1981-1988 have since been recalculated
to ‘rockhopper indices’ and adjusted for fish length dependent fishing or sweep width (Godø
and Sunnanå 1992, Aglen and Nakken 1997). The sweep wire length is 40 m. Vaco doors
(6m2, 1500kg), which are considered to be the best compromise when doing both pelagic and
bottom trawling, have earlier been used as standard trawldoors on board the research vessels,
except on R/V “Jan Mayen” where Steinshamn W-9 doors (7.1m2, 2050kg) are used. In 2000,
R/V “Johan Hjort” and R/V “G.O.Sars” used Vaco doors (6m2, 1500kg), while R/V “Persey
III” and the hired commercial trawler F/Tr “Varegg” used Steinshamn W-9 doors (7.1m2,
2050kg). In order to achieve constant sampling width of a trawl haul independent of e.g. depth

11
and wirelength, a 10 m rope “locks” the distance between the trawl wires 150 m in front of the
trawl doors. This is called “strapping”. The distance between the trawl doors then become
almost constant of 48-50 m (Engås and Ona 1993, Engås 1995). The trawl’s catchability of
different species and length groups then becomes independent of bottom depth. Without
strapping, the distance between the doors was 50-60 m and increasing with increasing depth
assuming a constant relationship between wirelength and trawldepth. In 1993 strapping was
used on board the research vessels, in 1994 on every third haul, in 1995-1997 on every second
haul on all vessels, and since 1998 on all hauls when weather conditions allow for it. Standard
towing time is 30 minutes (until 1985 the towing time was 60 min.). On all trawl stations the
trawl performance is constantly followed by Scanmar trawl sensors, i.e., distance between the
doors, vertical opening of the trawl and bottom contact control.
The geographical position of the trawl stations are pre-defined and kept fixed from year to year.
When the swept area investigations started in 1981 the investigated area was divided into four
main areas (A, B, C og D) and 35 strata (smaller and, by experience, more uniform biotops).
During the first years the number of trawl stations in each stratum was set based on expected
fish distribution in order to reduce the variance, i.e., more hauls in strata with high and variable
fish density. In recent years the trawl stations have been spread out more evenly, although the
distance between stations in the central cod distribution area is shorter (20 naut.miles)
compared to the more marginal areas (30 naut.miles). Considerable amounts of young cod were
during the 1990-ies distributed outside the initial four main areas, and in 1993 the investigated
area was therefore enlarged by areas D’, E, and the ice-free part of Svalbard (S) (Fig. 3.2 and
Tabell 3.1), altogether 28 new strata. In the 1993- and 1994 survey reports, the Svalbard area
was included in A’ and the western (west of 30�E) part of area E. Since 1996 the number of
strata has been 23, and the fixed trawl stations have been spread out with either 20 or 30 naut.
miles distance to each other based on the fish distribution in recent previous years. The main
reason for reducing the number of strata was the necessity to get sufficient trawl stations in each
stratum to get reliable estimates of density and variance.
Swept area fish density estimation
Swept area fish density estimates (�s,l) by species (s) and length (l) were estimated for each
bottom trawl haul by the equation:

12
ls
lsls a
f
,
,, ��
ls,� number of fish of length l per n.m.2 observed on trawl station s
lsf , estimated frequency of length l
lsa , swept area:
1852,
lsls
EWda �
�
ds towed distance (n.m.)
lEW length dependent effective fishing width: �
� lEWl �� for �minl maxll �
minll EWEW � = �� minl� for minll �
maxll EWEW � = �� maxl� for maxll �
The parameters are given in the text table below:
Species ���� ���� lmin lmax
Torsk 5.91 0.43 15 cm 62 cm
Hyse 2.08 0.75 15 cm 48 cm The fishing width was previously fixed to 25 m = 0.0135 nm. Based on Dickson (1993a,b),
length dependent effective fishing width for cod and haddock was included in the calculations
in 1995 (Korsbrekke et al., 1995). Aglen and Nakken (1997) have adjusted both the acoustic
and swept area time series back to 1981 for this length dependency based on mean-length-at-
age information. In 1999, the swept area 1983-1995 time series was recalculated for cod and
haddock using the new area and strata divisions (Bogstad et al. 1999).
For redfish, Greenland halibut and other species, a fishing width of 25 m was applied,
independent of fish length.
Observations of fish density by length are summed together in 5 cm length-groups �s l, where l
is the length-group. Stratified indices by length-group and stratum will then be:
���
psls
p
plp S
AL
stratumin ,, �
Lp l, index, stratum p, length-group l

13
Ap area (n.m.2) of stratum p (or the part of the stratum covered by the survey) S p number of trawl stations in stratum p
The coverage of the northern- and easternmost strata differs from year to year. The strata area is
therefore recalculated when necessary by multiplying the total stratum area by the ratio of trawl
stations taken. Indices are estimated for each stratum within the main areas A, B, C, D, D’, E
and S. Total number of fish in each 5 cm length group in each main area is estimated by adding
all strata within the area. Total number of fish at age is estimated by using an age-length key
constructed for each main area. Total indices on length and age are estimated adding all main
areas.
2.3 Sampling of catch and age-length keys. Sorting, weighing, measuring and sampling of the catch are done according to instructions
given in Fotland et al. (1997). Since 1999 all data except age are recorded electronically by
Scantrol Fishmeter (ref ?), a measuring board connected to stabilized Marel scales. The whole
catch or a representative subsample of most species was length measured on each station.
On each bottom and pelagic trawl station age (otoliths) and stomach were sampled from 1 cod
per 5 cm length-group. All cod above 90 cm were sampled. Most of the stomachs were
analysed on board according to the simplyfied procedure given in Fotland et al. (1997). From
haddock only age was sampled from 1 specimen per 5 cm length-group. Regarding the redfish
species, Sebastes marinus and S. mentella, otoliths for age determination were sampled from 5
fish in every 5 cm length-group on every second station with more than 10 specimens in the
catch. This regular sampling was supplied with extra samples from hauls with big redfish
catches. Greenland halibut were sorted by sex before length measurement and age (otolith)
sampling. From this species otoliths were collected from 5 fish per 5 cm length group per sex
on all stations. Table 3.2 gives an account of the sampled material.
One age-length key is constructed for each main area. All age samples are included and
weighted according to:
wLnp l
p l
p l,
,
,�
lpw , - weighting factor
lpL , - swept area index of number fish in length-group l in stratum p

14
np l, - number of age samples in length-group l and stratum p
Portions are estimated according to:
Pn w
n wal
p a l p lp
p l p lp
( ), , ,
, ,
�
�
�
�
�
pal( ) - weighted portion of age a in length-group l and stratum p
np a l, , - number of age samples of age a in length-group l and stratum p
Number of fish by age is then estimated following the equation:
N L Pa p l al
lp� ��� ,
( )
Mean length and –weight by age is then estimated according to (only shown for weight):
WW w
wa
a p l j p ljlp
p ljlp
�
����
���
, , , ,
,
Wa p l j, , , - weight of sample j in length-group l, stratum p and age a

15
3. SURVEY OPERATION The survey in 2000 was conducted with R/V "G.O. Sars" 29.01-24.02 (BEI-survey no.
2000002, series no. 80001-80200), R/V "Johan Hjort" 01.02-29.02 (BEI-survey no. 2000202,
series no. 80201-80400), F/Tr ”Varegg” 27.01-06.02 (BEI-survey no. 2000805, series no.
80201-80400), and R/V “Persey III” from PINRO 07.02-17.02 (series no. 80351-80366) . Fig.
3.1 shows survey tracks and trawl stations, and fig. 3.2 shows the survey area with the main
areas A, B, C, D, D', E and S (part of the Svalbard area). Tabell 3.1 shows the area in square
n.miles of each main area covered by the survey every year. Altogether 250 hydrographical
(CTD) stations and 265 trawl stations were taken; of these were 246 fixed, pre-defined, bottom
trawl stations. 226 of the fixed bottom trawl stations are included in the calculation of swept
area indices (fig. 3.2). 10 of the trawl stations were pelagic trawl hauls using Åkrahamn pelagic
trawl (3200 mm mesh size in front and 20 mm in the cod end; see Valdemarsen and Misund
1995) in order to get more samples and information to improve the echo scrutinizing by species
and fish length. This was the first year that a Russian research vessel participated in the survey.
“Persey III” used the same trawl gear (Campelen 1800 purchased at NOFI, Tromsø) as the
Norwegian vessels. Sixteen comparative trawl hauls between “Persey III” and “Johan Hjort”
were conducted (see chapter 10, page 64) and the results from 12 trawl hauls taken by the
Russian vessel were added to the swept area abundance estimation. “Persey III” also conducted
a survey in the Russian EEZ according to a national program.
Before starting the survey in the Russian Federation’s Exclusive Economic Zone (Russian
EEZ), both ”G.O. Sars” and ”Johan Hjort” had to go to Murmansk for inspection at 3 February.
One scientist from PINRO, Murmansk, participated onboard ”Johan Hjort”, and a Russian
observer participated on both "Johan Hjort" and “G.O.Sars” as long as the vessels were working
in Russian EEZ. The ice border was further to the east this year compared with 1999 leading to
a wider and better coverage of the fish distribution. Some ice-free parts of the Hopen Deep and
the Sentralbanken were not covered completely.
Logg-, catch- and temperature data were regularly sent by telex via Inmarsat C to the head
vessel ”Johan Hjort” from the other vessels. The cruise leader on board the head vessel led the
survey. Here all data were edited and prepared for abundance estimation and presentation.
Table 3.2 gives an account of sampled length- and age material from fixed and free (set out on
echo registration) bottom trawl stations as well as pelagic trawl stations.

16
76°
75°
74°
73°
72°
71°
70°
69°
68°14° 18° 22° 26° 30° 34° 38° 42° 46° 50° 54°
Figure 3.1. Survey tracks and trawl stations; R/V "G.O. Sars" 29.1-24.2, R/V "Johan Hjort" 1.2-29.2, F/F ”Varegg” 27.1-6.2. and F/F ”Persey III” 7.2-17.2.2000.
Kurslinjer og trålstasjonar; F/F "G.O. Sars" 29.1-24.2, F/F "Johan Hjort" 1.2-29.2, F/F ”Varegg” 27.1-6.2. og F/F ”Persey III” 7.2-17.2.2000.
76°
75°
74°
73°
72°
71°
70°
69°
68°34°14° 18° 22° 26° 30° 38° 42° 46° 50° 54°
S E
A
B
C
D
D'
Figure 3.2. The survey area with main areas A, B, C and D, additional areas D’, E and S and stations taken in the
swept area survey (bottom trawl) 27.1-29.2.2000. Undersøkingsområdet med hovudområde A, B, C og D, tilleggsområde D’, E og S og trålstasjonar
teke i botntrålundersøkinga 27.1-29.2.2000.
PerseyIII

17
Table 3.1. Area (n.miles2) covered in the bottom trawl surveys in the Barents Sea winter 1981-2000. Areal (n.mil2) dekka i botntrålundersøkingane i Barentshavet vinteren 1981-2000.
Område År (Year)
(Area) 1981-1992 1993 1994 1995 1996 19971 19981 1999 2000
A B C D D' E
Svalbard
23299 8372 5348 51116
- -
23929 8372 5348 51186 23152 8965 16690
27131 8372 5348 51186 24975 12576 14252
27131 8372 5348 51186 56822 14859 22836
25935 9701 5048 53932 53247 5818 11600
27581 9701 504823592 2684 195416989
27581 9701 5048 23592 5886 3819 23587
27581 9701 5048 43786 7961 5772 18470
2705497015048
52836289631414824685
ABCD 88835 88835 92037 92037 94016 65922 65922 86116 94639Total 88835 137642 143840 186554 165281 87549 99214 118320 162435
1) Norwegian EEZ and part of the Svalbard area Norsk sone og del av Svalbardområdet Table 3.2. Number of trawl stations, fish measured for length (L) and age (A) for main areas and trawl types in the
Barents Sea winter 2000. B1=fixed bottom trawl, B2=other bottom trawl, P=pelagic trawl. Tal for trålstasjonar, lengdemålt (L) og aldersbestemt (A) fisk for kvart hovudområde og stasjonstype i Barentshavet vinteren 2000. B1=fast botntrål, B2=annan botntrål, P=pelagisk trål. Område (Area)
Trål type (Trawl type)
Tal hal (No.
hauls)
Torsk (Cod)
Hyse (Haddock)
Vanleg uer (S.marinus)
Snabeluer (S. mentella)
Blåkveite (Greenland
halibut) L A L A L A L A L A A
B1 B2 P
54 7
14
3181 91
154
5910
41
4919136705
3110
66
26552
400
4258 1
56
20 0 0
5500
3100
B
B1 B2 P
22 5 0
625 155
1
19100
2416716
0
19900
20010
0
3300
329 0 0
16 0 0
400
200
C
B1 B2 P
11 0 0
899 0 0
13400
89600
9700
5800
2600
467 0 0
98 0 0
700
500
D
B1 B2 P
128 15 14
14297 2920
500
11433346
120721803
694
6211041
33537
0
10600
1481 5 0
125 0 0
11012
0
10030
D'
B1 B2 P
33 1 1
1497 38 13
7500
52810
2200
100
000
0 0 0
0 0 0
000
000
E
B1 B2 P
17 0 1
1350 0 0
14400
43700
2100
1100
000
41 0 0
5 0 0
21300
16800
S
B1 B2 P
50 6 0
5800 0 0
47300
55800
3800
23700
2000
2101 0 0
42 0 0
14500
4500
Total
B1 B2 P
317 34 30
27671 3204
668
27513387
2182626561399
130910
107
110752
2
18900
8677 6
56
306 0 0
53412
0
35130
Sum 381 31543 2871 25881 1426 1161 189 8739 306 546 354

18
4. HYDROGRAPHY
Measurements of temperature and salinity where recorded for the whole water column on all
fixed trawl stations. In addition, the standard hydrographical section ”Semøyene – north” was
taken by ”Johan Hjort” (fig. 4.1).
Fig. 4.2 shows the drift ice border and temperature distribution close to surface, at 100 m depth
and at the bottom. The ice border in 2000 was far to the east and north and hampered only to a
minor extent the survey coverage. The Barents Sea was slightly warmer in 2000 compared to
the year before. This was especially noticeable by the extension of the 2º C isotherm at bottom,
which extended far to the northeast and southeast.
The standard hydrographical sections ”Fugløya-Bjørnøya” and “Vardø-north” which were taken
one week before the fish survey, showed almost the same mean temperatures at 50-200 m depth
as in 1999 and in the beginning of the 90’s. The Sem Islands section, which was not taken in
1997-1999, also showed a similar high temperature as in the early 90’s. In average the
temperatures in the Barents Sea are 0,5-1,0°C above the long term mean.
-2,00
-1,00
0,00
1,00
2,00
3,00
4,00
5,00
6,00
1977 1979 1981 1983 1985 1987 1989 1991 1993 1995 1997 1999
ÅR
TEM
PER
ATU
R A
B
C
Figure 4.1. Mean temperatures in 50-200 m depth in 1977-2000. A) "Fugløya-Bjørnøya" in March, B) "Vardø-Nord" in March, C) Sem Islands in January-February. Gjennomsnittleg temperatur i 50-200 m djup i 1977 – . A) Fugløya-Bjørnøya i mars, B) Vardø-Nord (B) mars, C) Semøyene-nord i januar-februar.

19
7 6 °
7 5 °
7 4 °
7 3 °
7 2 °
7 1 °
7 0 °
6 9 °
6 8 °
D r i f t I c e b o r d e r
3 4 °1 4 ° 1 8 ° 2 2 ° 2 6 ° 3 0 ° 3 8 ° 4 2 ° 4 6 ° 5 0 ° 5 4 °
4
30
A
6
1 2 3 4 5
1 0
2 1
35 2 1
2
7 6 °
7 5 °
7 4 °
7 3 °
7 2 °
7 1 °
7 0 °
6 9 °
6 8 °
D r i f t I c e b o r d e r
3 4 °1 4 ° 1 8 ° 2 2 ° 2 6 ° 3 0 ° 3 8 ° 4 2 ° 4 6 ° 5 0 ° 5 4 °
B
1
23
2
0
5
4
3
6
5
1 2 3 4
4 3 2 15
4
123
7 6 °
7 5 °
7 4 °
7 3 °
7 2 °
7 1 °
7 0 °
6 9 °
6 8 °
D r i f t I c e b o r d e r
3 4 °1 4 ° 1 8 ° 2 2 ° 2 6 ° 3 0 ° 3 8 ° 4 2 ° 4 6 ° 5 0 ° 5 4 °
0123
4
5
012
4
0
- 1
3
3
34
2 1
2
5
6
7
C
Figure 4.2. Temperature distribution February 2000. A) surface, B) 100 m depth, C) bottom. Temperaturfordeling februar 2000. A) ved overflata, B) i 100 m djup, C) ved botnen.

20
5. TOTAL ECHO ABUNDANCE OF COD AND HADDOCK
5.1 Horizontal distribution
The geographical distributions of total echo abundance of cod and haddock are shown in fig.
5.1 and 5.2, respectively, where also the drift ice border is drawn. The densest registrations of
cod were made in the southern part of the Barents Sea outside the Norwegian coast and at Bear
Island. Also in 2000 cod were registered over most of the area covered by the survey. The
figure also shows that the area of distribution was not completely covered northwest of Bear
Island and north of the Central Bank.
The haddock registrations do not extend as far north as for cod (usually not beyond the 2°C
isotherm). The densest registrations were found around the Norwegian-Russian border in the
southern part of the Barents Sea east and northeast of Vardø.
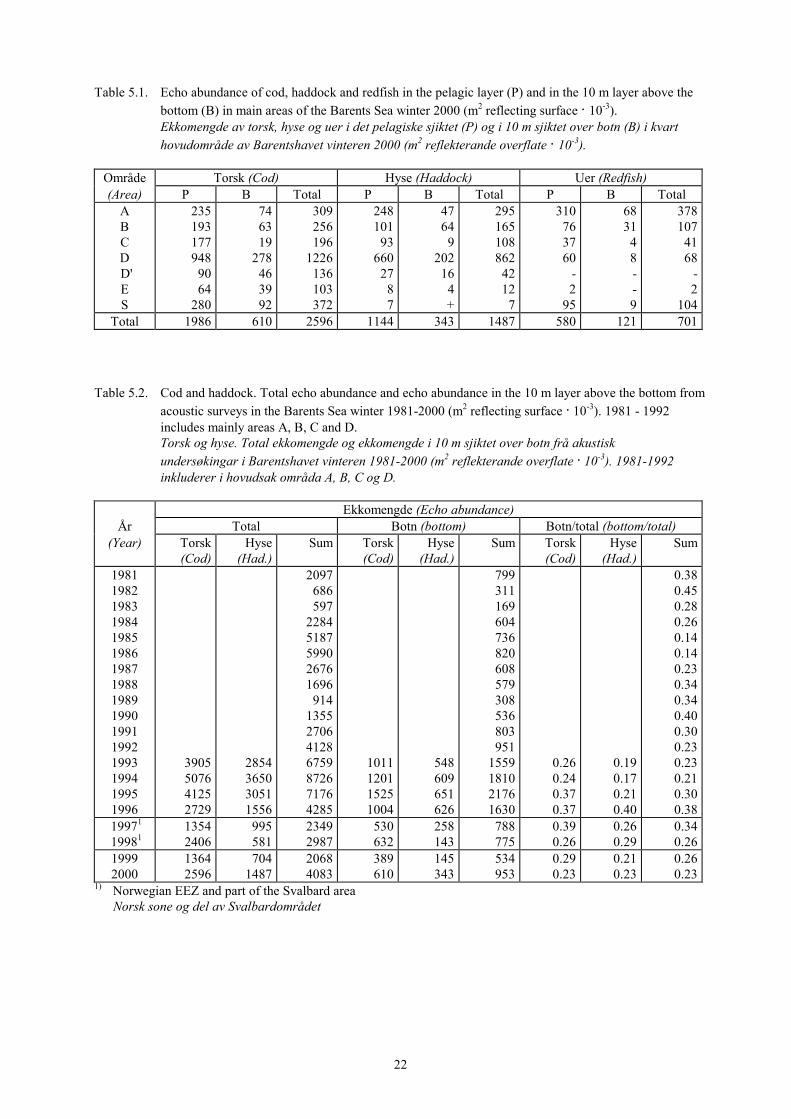
Table 5.1 shows the echo abundance (echo density multiplied with area) distributed on main
areas as well as on pelagic versus bottom channels. In 1999 the echo abundance of cod was
reduced by nearly 50% compared with the year before. In 2000 the echo abundance of cod
increased by 90% compared with 1999. The increase was especially noticeable in the pelagic
channel, and was observed in all main areas. The echo abundance of haddock showed a similar
increase compared with 1999, a more than 100% increase was detected in both the pelagic and
bottom channels. Also the total echo abundance of redfish increased in all main areas,
especially in the pelagic channel.
Table 5.2 presents the time series of total echo abundance of cod and haddock in the
investigated areas. Despite the increase compared to the year before, the total echo abundance
for cod and haddock are 75% and 63%, respectively, of the average values for the 1990-ies. The
relative echo abundance for cod in the bottom channel (0-10 m above bottom) decreased from
29% in 1999 to 23% in 2000, while for haddock it increased from 21% to 23%.

21
76°
75°
74°
73°
72°
71°
70°
69°
68°
Area coveredDrift Iceborder
50.0-99.9
25.0-49.9
>100
10.0-24.9
0.1-9.9
34°14° 18° 22° 26° 30° 38° 42° 46° 50° 54° Figure 5.1. COD. Distribution of total echo abundance winter 2000. Unit is integrated back scattering
surface per square nautical mile (m2/nm2). TORSK. Fordeling av total ekkotettleik vinteren 2000. Eining er integrert reflekterande
overflate pr. kvadrat nautisk mil (m2/nm2).
76°
75°
74°
73°
72°
71°
70°
69°
68°
Area coveredDrift Iceborder>50
25.0-49.9
10.0-24.9
0.1-9.9
34°14° 18° 22° 26° 30° 38° 42° 46° 50° 54° Figure 5.2. HADDOCK. Distribution of total echo abundance winter 2000. Unit is integrated back scattering
surface per square nautical mile (m2/nm2). HYSE. Fordeling av total ekkotettleik vinteren 2000. Eining er integrert reflekterande overflate pr.
kvadrat nautisk mil (m2/nm2).
22
Table 5.1. Echo abundance of cod, haddock and redfish in the pelagic layer (P) and in the 10 m layer above the bottom (B) in main areas of the Barents Sea winter 2000 (m2 reflecting surface · 10-3).
Ekkomengde av torsk, hyse og uer i det pelagiske sjiktet (P) og i 10 m sjiktet over botn (B) i kvart hovudområde av Barentshavet vinteren 2000 (m2 reflekterande overflate · 10-3).
Område Torsk (Cod) Hyse (Haddock) Uer (Redfish) (Area) P B Total P B Total P B Total
A B C D D' E S
235 193 177 948
90 64
280
74 63 19
278 46 39 92
309256196
1226136103372
248101
93660
2787
4764
9202
164+
295165108862
4212
7
310 76 37 60
- 2
95
68 31
4 8 - - 9
378107
4168
-2
104Total 1986 610 2596 1144 343 1487 580 121 701
Table 5.2. Cod and haddock. Total echo abundance and echo abundance in the 10 m layer above the bottom from
acoustic surveys in the Barents Sea winter 1981-2000 (m2 reflecting surface · 10-3). 1981 - 1992 includes mainly areas A, B, C and D.
Torsk og hyse. Total ekkomengde og ekkomengde i 10 m sjiktet over botn frå akustisk undersøkingar i Barentshavet vinteren 1981-2000 (m2 reflekterande overflate · 10-3). 1981-1992 inkluderer i hovudsak områda A, B, C og D.
Ekkomengde (Echo abundance) År Total Botn (bottom) Botn/total (bottom/total)
(Year) Torsk (Cod)
Hyse (Had.)
Sum Torsk(Cod)
Hyse(Had.)
Sum Torsk (Cod)
Hyse (Had.)
Sum
1981 1982 1983 1984 1985 1986 1987 1988 1989 1990 1991 1992 1993 1994 1995 1996
3905 5076 4125 2729
2854 3650 3051 1556
2097686597
22845187599026761696
9141355270641286759872671764285
1011120115251004
548609651626
799311169604736820608579308536803951
1559181021761630
0.26 0.24 0.37 0.37
0.19 0.17 0.21 0.40
0.380.450.280.260.140.140.230.340.340.400.300.230.230.210.300.38
19971
19981 1354 2406
995 581
23492987
530632
258143
788775
0.39 0.26
0.26 0.29
0.340.26
1999 2000
1364 2596
704 1487
20684083
389610
145343
534953
0.29 0.23
0.21 0.23
0.260.23
1) Norwegian EEZ and part of the Svalbard area Norsk sone og del av Svalbardområdet
23
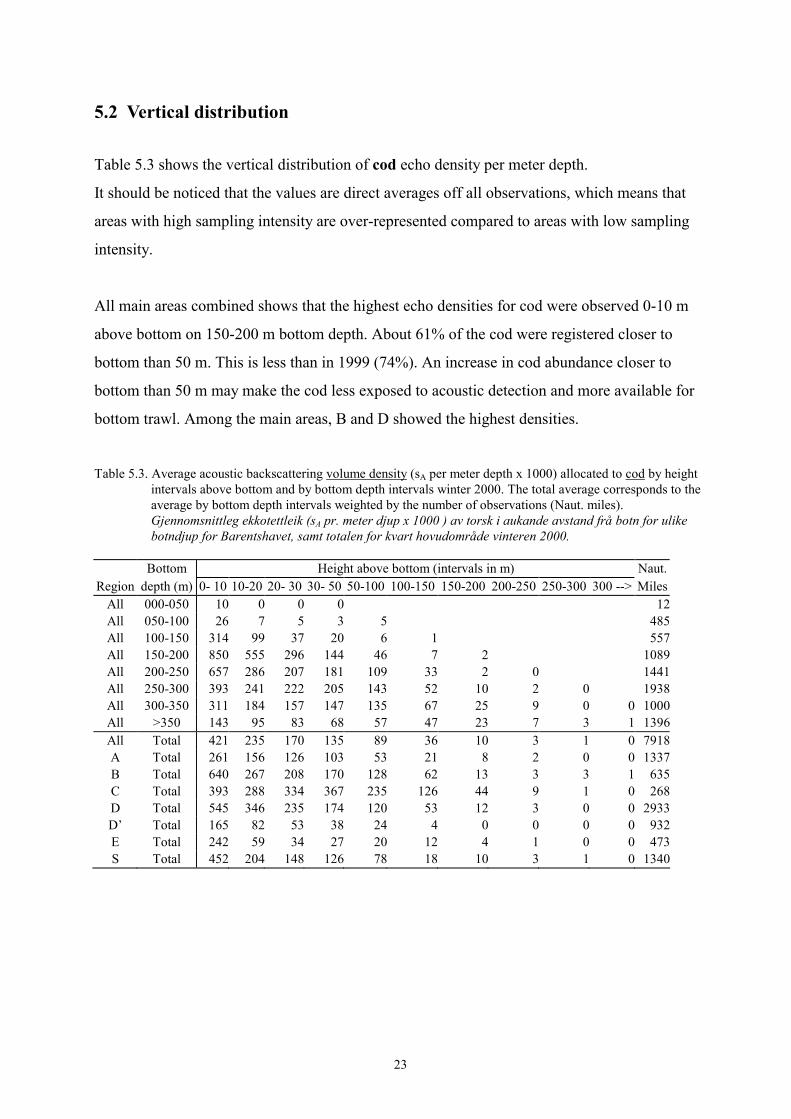
5.2 Vertical distribution
Table 5.3 shows the vertical distribution of cod echo density per meter depth.
It should be noticed that the values are direct averages off all observations, which means that
areas with high sampling intensity are over-represented compared to areas with low sampling
intensity.
All main areas combined shows that the highest echo densities for cod were observed 0-10 m
above bottom on 150-200 m bottom depth. About 61% of the cod were registered closer to
bottom than 50 m. This is less than in 1999 (74%). An increase in cod abundance closer to
bottom than 50 m may make the cod less exposed to acoustic detection and more available for
bottom trawl. Among the main areas, B and D showed the highest densities.
Table 5.3. Average acoustic backscattering volume density (sA per meter depth x 1000) allocated to cod by height
intervals above bottom and by bottom depth intervals winter 2000. The total average corresponds to the average by bottom depth intervals weighted by the number of observations (Naut. miles). Gjennomsnittleg ekkotettleik (sA pr. meter djup x 1000 ) av torsk i aukande avstand frå botn for ulike botndjup for Barentshavet, samt totalen for kvart hovudområde vinteren 2000.
Bottom Height above bottom (intervals in m) Naut.
Region depth (m) 0- 10 10-20 20- 30 30- 50 50-100 100-150 150-200 200-250 250-300 300 --> MilesAll 000-050 10 0 0 0 12All 050-100 26 7 5 3 5 485All 100-150 314 99 37 20 6 1 557All 150-200 850 555 296 144 46 7 2 1089All 200-250 657 286 207 181 109 33 2 0 1441All 250-300 393 241 222 205 143 52 10 2 0 1938All 300-350 311 184 157 147 135 67 25 9 0 0 1000All >350 143 95 83 68 57 47 23 7 3 1 1396All Total 421 235 170 135 89 36 10 3 1 0 7918A Total 261 156 126 103 53 21 8 2 0 0 1337B Total 640 267 208 170 128 62 13 3 3 1 635C Total 393 288 334 367 235 126 44 9 1 0 268D Total 545 346 235 174 120 53 12 3 0 0 2933D’ Total 165 82 53 38 24 4 0 0 0 0 932E Total 242 59 34 27 20 12 4 1 0 0 473S Total 452 204 148 126 78 18 10 3 1 0 1340

24
Table 5.4 shows the vertical distribution of haddock echo density per meter depth. As for cod,
the highest echo densities for haddock were observed 0-10 m above bottom on 150-200 m
bottom depth. As in 1999 the highest densities were observed in main area B. About 63% of the
haddock were observed closer to bottom than 50 m. This is slightly more than was found in
1999 (57%), 1998 (60%) and 1997 (53%).
Table 5.4. Average acoustic backscattering volume density (sA per meter depth x 1000) allocated to haddock by height intervals above bottom and by bottom depth intervals. The total average corresponds to the average by bottom depth intervals weighted by the number of observations (Naut. miles).
Bottom Height above bottom (intervals in m) Naut.Region depth (m) 0- 10 10-20 20- 30 30- 50 50-100 100-150 150-200 200-250 250-300 300 --> Miles
All 000-050 8 2 9 8 12All 050-100 7 1 0 0 0 485All 100-150 460 152 53 19 3 0 557All 150-200 657 426 229 124 34 5 0 1089All 200-250 309 185 156 132 67 14 1 0 1441All 250-300 189 150 157 141 90 39 10 3 0 1938All 300-350 142 98 83 76 65 32 10 3 0 0 1000All >350 28 29 31 34 37 28 11 3 1 0 1396All Total 248 157 118 92 54 22 6 2 0 0 7918A Total 177 136 130 118 68 25 9 3 0 0 1337B Total 670 230 147 95 56 28 4 1 0 0 635C Total 203 142 177 187 121 87 25 4 0 0 268D Total 400 282 202 153 89 32 8 2 0 0 2933D’ Total 71 35 22 14 7 1 0 0 0 0 932E Total 21 9 7 4 2 1 0 0 0 0 473S Total 1 4 3 2 1 0 0 0 0 0 1340
Table 5.5 shows the vertical distribution of redfish echo density per meter depth. The highest
echo densities for redfish were observed 0-10 m above bottom deeper than 350 m bottom depth.
The highest densities were observed in main area B and A. About 54% of the redfish were
registered closer to bottom than 50 m.

25
Table 5.5. Average acoustic backscattering volume density (sA per meter depth x 1000) allocated to redfish by height intervals above bottom and by bottom depth intervals winter 2000. The total average corresponds to the average by bottom depth intervals weighted by the number of observations (Naut. miles). Gjennomsnittleg ekkotettleik (sA pr. meter djup x 1000 ) av uer i aukande avstand frå botn for ulike botndjup for Barentshavet, samt totalen for kvart hovudområde vinteren 2000.
Bottom Height above bottom (intervals in m) Naut.Region depth (m) 0- 10 10-20 20- 30 30- 50 50-100 100-150 150-200 200-250 250-300 300 --> Miles
All 000-050 1 0 0 0 12All 050-100 1 0 0 0 0 485All 100-150 21 4 1 1 0 0 557All 150-200 45 10 5 2 0 0 0 1089All 200-250 54 24 16 12 6 1 0 0 1441All 250-300 64 39 30 26 17 7 1 0 0 1938All 300-350 119 100 81 60 41 19 5 1 0 0 1000All >350 155 134 124 92 64 37 23 8 4 1 1396All Total 76 52 43 33 22 11 5 2 1 0 7918A Total 205 158 130 90 50 25 15 4 2 1 1337B Total 285 117 83 64 48 19 2 1 0 0 635C Total 90 60 60 69 55 28 9 2 0 0 268D Total 19 13 12 12 10 5 1 0 0 0 2933D’ Total 0 0 0 0 0 0 0 0 0 0 932E Total 0 0 0 0 0 0 0 0 0 0 473S Total 47 53 48 34 23 11 8 3 1 0 1340
26
6. DISTRIBUTION AND ABUNDANCE OF COD
6.1 Acoustic estimation
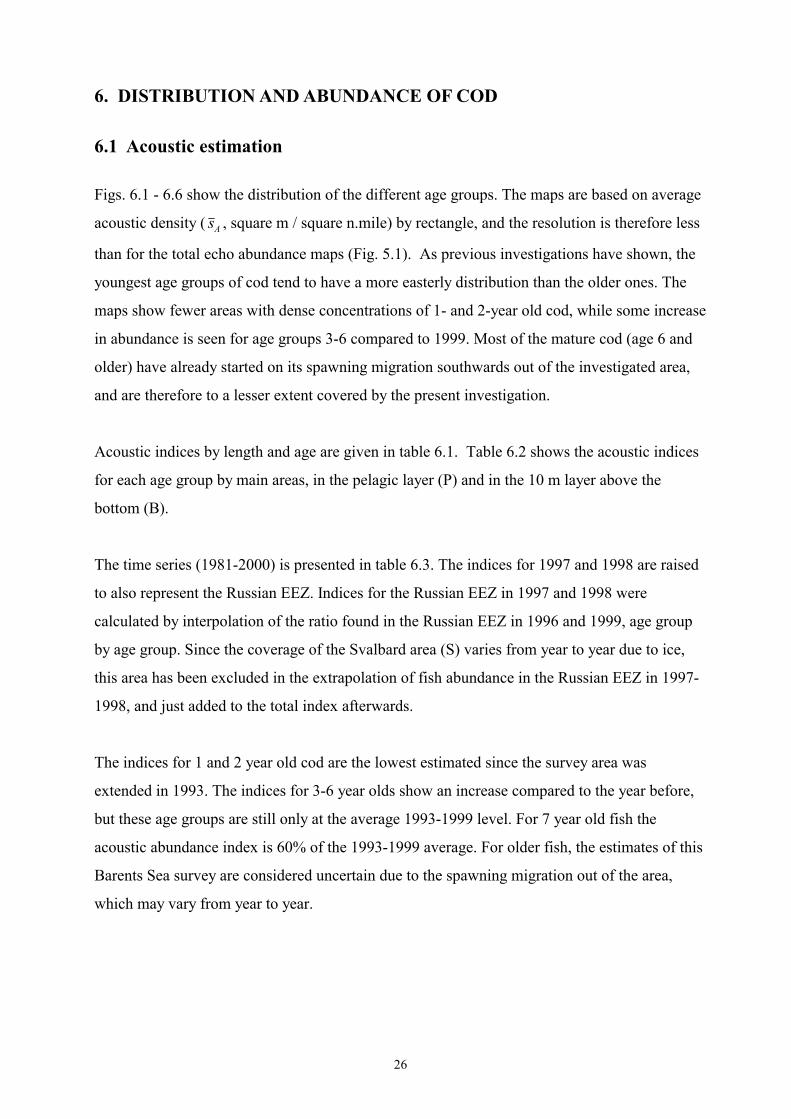
Figs. 6.1 - 6.6 show the distribution of the different age groups. The maps are based on average
acoustic density ( sA , square m / square n.mile) by rectangle, and the resolution is therefore less
than for the total echo abundance maps (Fig. 5.1). As previous investigations have shown, the
youngest age groups of cod tend to have a more easterly distribution than the older ones. The
maps show fewer areas with dense concentrations of 1- and 2-year old cod, while some increase
in abundance is seen for age groups 3-6 compared to 1999. Most of the mature cod (age 6 and
older) have already started on its spawning migration southwards out of the investigated area,
and are therefore to a lesser extent covered by the present investigation.
Acoustic indices by length and age are given in table 6.1. Table 6.2 shows the acoustic indices
for each age group by main areas, in the pelagic layer (P) and in the 10 m layer above the
bottom (B).
The time series (1981-2000) is presented in table 6.3. The indices for 1997 and 1998 are raised
to also represent the Russian EEZ. Indices for the Russian EEZ in 1997 and 1998 were
calculated by interpolation of the ratio found in the Russian EEZ in 1996 and 1999, age group
by age group. Since the coverage of the Svalbard area (S) varies from year to year due to ice,
this area has been excluded in the extrapolation of fish abundance in the Russian EEZ in 1997-
1998, and just added to the total index afterwards.
The indices for 1 and 2 year old cod are the lowest estimated since the survey area was
extended in 1993. The indices for 3-6 year olds show an increase compared to the year before,
but these age groups are still only at the average 1993-1999 level. For 7 year old fish the
acoustic abundance index is 60% of the 1993-1999 average. For older fish, the estimates of this
Barents Sea survey are considered uncertain due to the spawning migration out of the area,
which may vary from year to year.

27
76°
75°
74°
73°
72°
71°
70°
69°
68°
Area coveredDrift Iceborder
>10000
1000-9999
100-999
1-99
34°14° 18° 22° 26° 30° 38° 42° 46° 50° 54° Figure 6.1. 1-GROUP COD. Distribution winter 2000 (echo recordings, no. of fish per square nautical mile).
1-GRUPPE TORSK. Fordeling vinteren 2000 (ekkoregistreringar, talet på fisk pr. kvadratnautisk mil).
76°
75°
74°
73°
72°
71°
70°
69°
68°
Area coveredDrift Iceborder
>10000
1000-9999
100-999
1-99
34°14° 18° 22° 26° 30° 38° 42° 46° 50° 54°
Figure 6.2. 2-GROUP COD. Distribution winter 2000 (echo recordings, no. of fish per square nautical mile). 2-GRUPPE TORSK. Fordeling vinteren 2000 (ekkoregistreringar, talet på fisk pr. kvadratnautisk mil).

28
76°
75°
74°
73°
72°
71°
70°
69°
68°
Area coveredDrift Iceborder
10000-24999
1000-9999
>25000
100-999
1-99
34°14° 18° 22° 26° 30° 38° 42° 46° 50° 54° Figure 6.3. 3-GROUP COD. Distribution winter 2000 (echo recordings, no. of fish per square nautical mile). 3-GRUPPE TORSK. Fordeling vinteren 2000 (ekkoregistreringar, talet på fisk pr. kvadratnautisk mil).
76°
75°
74°
73°
72°
71°
70°
69°
68°
Area coveredDrift Iceborder
>10000
1000-9999
100-999
1-99
34°14° 18° 22° 26° 30° 38° 42° 46° 50° 54° Figure 6.4. 4-GROUP COD. Distribution winter 2000 (echo recordings, no. of fish per square nautical mile).
4-GRUPPE TORSK. Fordeling vinteren 2000 (ekkoregistreringar, talet på fisk pr. kvadratnautisk mil).

29
76°
75°
74°
73°
72°
71°
70°
69°
68°
Area coveredDrift Iceborder>1000
100-999
1-99
34°14° 18° 22° 26° 30° 38° 42° 46° 50° 54° Figure 6.5. 5-GROUP COD. Distribution winter 2000 (echo recordings, no. of fish per square nautical mile).
5-GRUPPE TORSK. Fordeling vinteren 2000 (ekkoregistreringar, talet på fisk pr. kvadratnautisk mil).
76°
75°
74°
73°
72°
71°
70°
69°
68°
Area coveredDrift Iceborder
>1000
100-999
1-99
34°14° 18° 22° 26° 30° 38° 42° 46° 50° 54° Figure 6.6. 6-GROUP AND OLDER COD. Distribution winter 2000 (echo recordings, no. of fish per square nautical mile). 6-GRUPPE OG ELDRE TORSK. Fordeling vinteren 2000 (ekkoregistreringar, talet på fisk pr. kvadratnautisk mil).

30
Table 6.1. COD. Abundance indices at length and age from the acoustic survey in the Barents Sea winter 2000 (numbers in millions). TORSK. Mengdeindeksar for lengde- og aldersgrupper frå den akustiske undersøkinga i Barentshavet
vinteren 2000 (talet på fisk i millionar).
Lengde Alder (årsklasse) / Age (year-class) (Length)
cm 1
(99) 2
(98) 3
(97) 4
(96) 5
(95) 6
(94) 7
(93) 8
(92) 9
(91) 10+ Sum
5-9 10-14 15-19 20-24 25-29 30-34 35-39 40-44 45-49 50-54 55-59 60-64 65-69 70-74 75-79 80-84 85-89 >90
2.2 132.7
19.2
2.1
75.9 118.4
24.9 0.1
0.5 33.3
102.5 85.6 20.7
2.4 0.1
2.113.557.158.023.1
3.90.80.4
1.07.2
32.655.134.5
9.51.70.4
0.32.8
10.717.111.3
2.60.6
+
0.1
0.50.33.53.21.40.60.1
0.30.20.30.61.21.20.50.2
+ 0.3 1.0 0.9 0.7
0.2
+ 0.9
2.2134.8
95.6151.6129.6
99.378.967.656.161.847.027.516.8
6.83.52.91.51.8
Sum 154.1 221.4 245.2 158.9 142.1 45.4 9.6 4.7 3.0 1.1 985.4 Table 6.2. COD. Acoustic abundance indices in the pelagic layer (P) and in the 10 m layer above the bottom (B)
for the main areas of the Barents Sea winter 2000 (numbers in millions). TORSK. Akustiske mengdeindeksar i det pelagiske sjiktet (P) og i 10 m sjiktet over botn (B) for
kvart hovudområde av Barentshavet vinteren 2000 (talet på fisk i millionar).
Omr. Sjikt Alder (årsklasse) / Age (year-class) (Area) (Layer) 1
(99) 2
(98) 3
(97) 4
(96) 5
(95) 6
(94) 7
(93) 8
(92) 9
(91) 10+ Total
A P B
2.42.3
2.8 1.6
3.71.7
8.42.2
18.95.0
8.12.8
1.00.4
0.4 0.2
0.2 0.2
0.1 +
46.116.2
B P B
2.80.9
1.5 0.4
2.51.1
2.60.7
7.32.1
6.02.0
3.01.1
1.5 0.5
1.1 0.3
0.3 0.1
28.69.3
C P B
17.81.8
8.2 0.9
4.60.5
4.10.4
13.31.4
4.50.5
1.00.1
0.4 +
0.3 +
0.1 -
54.35.6
D P B
71.226.0
76.9 35.3
110.043.9
78.622.3
46.210.6
12.52.7
2.20.5
1.1 0.2
0.6 0.1
0.4 0.1
399.6141.7
D' P B
3.45.6
39.1 22.1
19.78.8
1.90.9
0.40.3
0.40.2
++
- -
- -
- -
65.038.0
E P B
6.35.4
7.2 5.8
8.75.8
4.52.3
3.01.6
1.00.6
0.1+
0.1 +
- -
- -
30.821.6
S P B
4.93.3
14.6 5.0
26.08.3
22.27.7
24.17.9
3.11.0
0.20.1
0.2 +
0.1 +
0.0 0.0
95.533.2
ABCD P B
94.231.0
89.2 38.1
120.847.1
93.725.6
85.619.1
31.18.0
7.12.0
3.4 1.0
2.2 0.6
0.9 0.2
528.6172.8
Total P B
Sum
108.845.3
154.1
150.4 71.0
221.4
175.269.9
245.1
122.436.5
158.9
113.228.9
142.1
35.69.8
45.4
7.42.19.6
3.6 1.0 4.7
2.4 0.6 3.0
0.9 0.2 1.1
719.8265.5985.4

31
Table 6.3. COD. Abundance indices from acoustic surveys in the Barents Sea winter 1981-2000 (numbers in millions). 1981-1992 includes mainly areas A, B C and D.
TORSK. Mengdeindeksar frå akustiske undersøkingar i Barentshavet vinteren 1981- 2000 (talet på fisk i millionar). 1981-1992 inkluderer i hovudsak områda A, B, C og D.
År Alder (Age)
(Year) 1 2 3 4 5 6 7 8 9 10+ Total
1981 1982 1983 1984 1985 1986 1987 1988 1989 1990 1991 1992 1993 1994 1995 1996
8.0 4.0
60.5 745.4
69.1 353.6
1.6 2.0 7.5
81.1 181.0 241.4
1074.0 858.3
2619.2 2396.0
82.05.02.8
146.1446.3243.9
34.126.3
8.024.9
219.5562.1494.7577.2292.9339.8
40.0 49.0
5.3 39.1
153.0 499.6
62.8 50.4 17.0 14.8 50.2
176.5 357.2 349.8 166.2
92.9
63.043.014.313.6
141.6134.3204.9
35.534.420.634.665.8
191.1404.5159.8
70.5
106.040.017.411.319.765.941.456.221.426.129.318.8
108.2193.7210.1
85.8
103.026.011.1
7.47.68.3
10.46.5
53.824.328.913.220.863.668.874.7
16.028.0
5.62.83.32.21.21.46.9
39.816.9
7.68.1
12.116.720.6
3.02.03.00.20.20.40.20.21.02.4
17.34.55.03.72.12.8
1.0 +
0.5 0.0 0.1 0.1 0.7 0.0 0.1 0.1 0.9 2.8 2.3 1.7 0.7 0.3
1.0 0.0 0.1 0.0 0.0 0.0 0.0 0.0 0.1 0.0 0.0 0.2 2.5 0.9 1.0 0.4
423.0197.0120.5966.0840.9
1308.2357.3178.4150.1234.1578.7
1092.92264.02465.43537.43083.8
19971
19981 1623.5 3401.3
430.5632.9
188.3 427.7
51.7182.6
49.342.3
37.233.5
22.326.9
4.013.6
0.7 1.7
0.1 0.3
2407.54762.8
1999 2000
358.3 154.1
304.3221.4
150.0 245.2
96.4158.9
45.1142.1
10.345.4
6.49.6
4.14.7
0.8 3.0
0.3 1.1
976.0985.4
1) Indices raised to also represent the Russian EEZ. Indeksar oppjusterte til også å omfatta russisk sone.
32
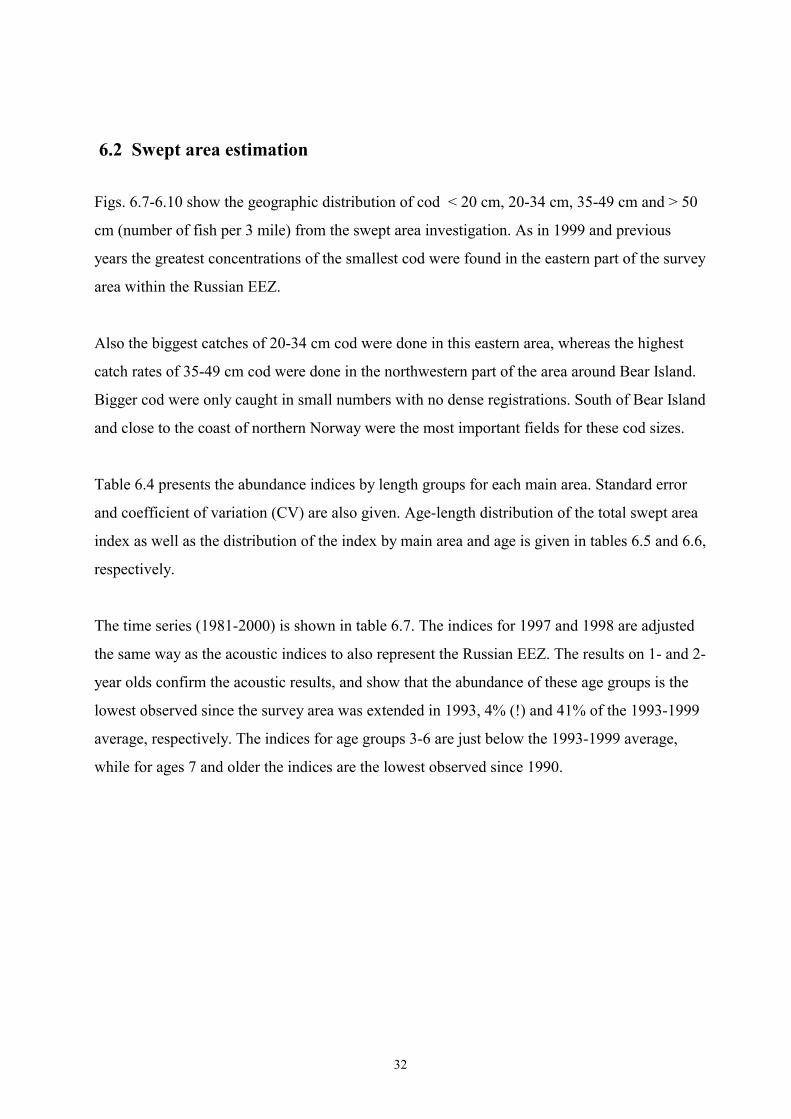
6.2 Swept area estimation
Figs. 6.7-6.10 show the geographic distribution of cod < 20 cm, 20-34 cm, 35-49 cm and > 50
cm (number of fish per 3 mile) from the swept area investigation. As in 1999 and previous
years the greatest concentrations of the smallest cod were found in the eastern part of the survey
area within the Russian EEZ.
Also the biggest catches of 20-34 cm cod were done in this eastern area, whereas the highest
catch rates of 35-49 cm cod were done in the northwestern part of the area around Bear Island.
Bigger cod were only caught in small numbers with no dense registrations. South of Bear Island
and close to the coast of northern Norway were the most important fields for these cod sizes.
Table 6.4 presents the abundance indices by length groups for each main area. Standard error
and coefficient of variation (CV) are also given. Age-length distribution of the total swept area
index as well as the distribution of the index by main area and age is given in tables 6.5 and 6.6,
respectively.
The time series (1981-2000) is shown in table 6.7. The indices for 1997 and 1998 are adjusted
the same way as the acoustic indices to also represent the Russian EEZ. The results on 1- and 2-
year olds confirm the acoustic results, and show that the abundance of these age groups is the
lowest observed since the survey area was extended in 1993, 4% (!) and 41% of the 1993-1999
average, respectively. The indices for age groups 3-6 are just below the 1993-1999 average,
while for ages 7 and older the indices are the lowest observed since 1990.

33
76°
75°
74°
73°
72°
71°
70°
69°
68°
Area coveredDrift Iceborder>100
1-99
34°14° 18° 22° 26° 30° 38° 42° 46° 50° 54° Figure 6.7. COD < 20 cm. Distribution in the trawl catches winter 2000(number per hour trawling). TORSK < 20 cm. Fordeling i trålfangstane vinteren 2000(talet på fisk pr. tråltime).
76°
75°
74°
73°
72°
71°
70°
69°
68°
100-999
1-99
34°14° 18° 22° 26° 30° 38° 42° 46° 50° 54°
>1000D rift IceborderArea covered
Figure 6.8. COD 20-34 cm. Distribution in the trawl catches winter 2000(number per hour trawling).
TORSK 20-34 cm. Fordeling i trålfangstane vinteren 2000(talet på fisk pr. tråltime).

34
76°
75°
74°
73°
72°
71°
70°
69°
68°
Area coveredDrift Iceborder>1000
100-999
1-99
34°14° 18° 22° 26° 30° 38° 42° 46° 50° 54° Figure 6.9. COD 35-49 cm. Distribution in the trawl catches winter 2000(number per hour trawling). TORSK 35-49 cm. Fordeling i trålfangstane vinteren 2000(talet på fisk pr. tråltime).
76°
75°
74°
73°
72°
71°
70°
69°
68°
Area coveredD rift Iceborder
>100
1-99
34°14° 18° 22° 26° 30° 38° 42° 46° 50° 54° Figure 6.10. COD � 50 cm. Distribution in the trawl catches winter 2000(number per hour trawling). TORSK � 50 cm. Fordeling i trålfangstane vinteren 2000(talet på fisk pr. tråltime).
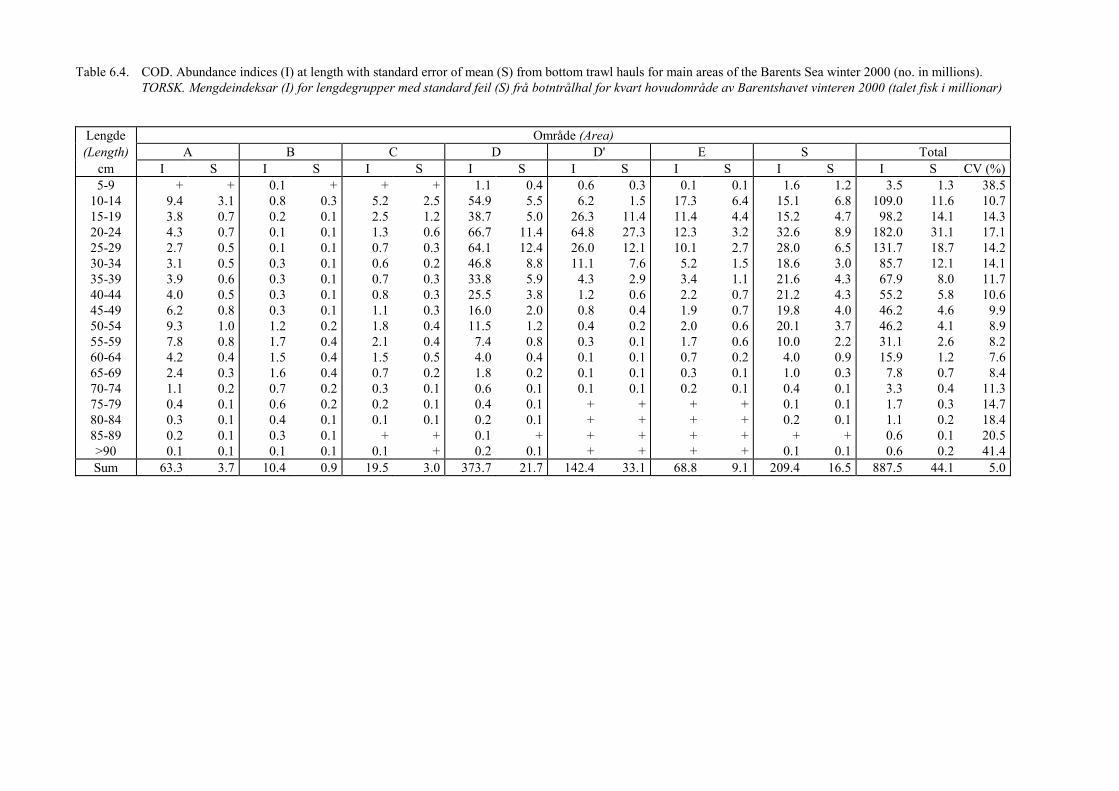
Table 6.4. COD. Abundance indices (I) at length with standard error of mean (S) from bottom trawl hauls for main areas of the Barents Sea winter 2000 (no. in millions). TORSK. Mengdeindeksar (I) for lengdegrupper med standard feil (S) frå botntrålhal for kvart hovudområde av Barentshavet vinteren 2000 (talet fisk i millionar)
Lengde Område (Area) (Length) A B C D D' E S Total
cm I S I S I S I S I S I S I S I S CV (%) 5-9
10-14 15-19 20-24 25-29 30-34 35-39 40-44 45-49 50-54 55-59 60-64 65-69 70-74 75-79 80-84 85-89 >90
+9.43.84.32.73.13.94.06.29.37.84.22.41.10.40.30.20.1
+ 3.1 0.7 0.7 0.5 0.5 0.6 0.5 0.8 1.0 0.8 0.4 0.3 0.2 0.1 0.1 0.1 0.1
0.1 0.8 0.2 0.1 0.1 0.3 0.3 0.3 0.3 1.2 1.7 1.5 1.6 0.7 0.6 0.4 0.3 0.1
+0.30.10.10.10.10.10.10.10.20.40.40.40.20.20.10.10.1
+5.22.51.30.70.60.70.81.11.82.11.50.70.30.20.1
+0.1
+2.51.20.60.30.20.30.30.30.40.40.50.20.10.10.1
++
1.154.938.766.764.146.833.825.516.011.5
7.44.01.80.60.40.20.10.2
0.45.55.0
11.412.4
8.85.93.82.01.20.80.40.20.10.10.1
+0.1
0.66.2
26.364.826.011.1
4.31.20.80.40.30.10.10.1
++++
0.3 1.5
11.4 27.3 12.1
7.6 2.9 0.6 0.4 0.2 0.1 0.1 0.1 0.1
+ + + +
0.117.311.412.310.1
5.23.42.21.92.01.70.70.30.2
++++
0.16.44.43.22.71.51.10.70.70.60.60.20.10.1
++++
1.615.115.232.628.018.621.621.219.820.110.0
4.01.00.40.10.2
+0.1
1.26.84.78.96.53.04.34.34.03.72.20.90.30.10.10.1
+0.1
3.5109.0
98.2182.0131.7
85.767.955.246.246.231.115.9
7.83.31.71.10.60.6
1.311.614.131.118.712.1
8.05.84.64.12.61.20.70.40.30.20.10.2
38.5 10.7 14.3 17.1 14.2 14.1 11.7 10.6
9.9 8.9 8.2 7.6 8.4
11.3 14.7 18.4 20.5 41.4
Sum 63.3 3.7 10.4 0.9 19.5 3.0 373.7 21.7 142.4 33.1 68.8 9.1 209.4 16.5 887.5 44.1 5.0

Table 6.5. COD. Abundance indices at length and age from the bottom trawl survey in the Barents Sea winter 2000 (numbers in millions).
TORSK. Mengdeindeksar for lengde- og aldersgrupper frå botntrålundersøkinga i Barentshavet vinteren 2000 (talet på fisk i millionar).
Lengde Alder (årsklasse) / Age (year-class) (Length)
(cm) 1
(99) 2
(98) 3
(97) 4
(96) 5
(95) 6
(94) 7
(93) 8
(92) 9
(91) 10+ Sum
5-9 10-14 15-19 20-24 25-29 30-34 35-39 40-44 45-49 50-54 55-59 60-64 65-69 70-74 75-79 80-84 85-89 >90
3.5 106.9
18.4
2.0
78.9 143.9
23.4 +
0.9 38.2
105.3 72.9 16.7
1.2 +
3.0 12.7 50.1 47.1 16.5
2.0 0.7 0.1
1.26.8
29.442.722.5
4.90.70.1
0.31.57.6
10.65.31.30.3
+
+
0.20.11.51.60.70.2
+
0.10.10.30.30.60.40.20.1
+ 0.2 0.5 0.3 0.2
0.1
0.1 0.3
3.5109.0
98.2182.0131.7
85.767.955.246.246.231.115.9
7.83.31.71.1
0.60.6
Sum 128.8 248.3 235.2 132.1 108.3 26.9 4.3 2.0 1.2 0.4 887.5 Table 6.6. COD. Abundance indices from bottom trawl hauls for main areas of the Barents Sea winter 2000 (numbers in millions.) TORSK. Mengdeindeksar frå botntrålhal for kvart hovudområde av Barentshavet vinteren 2000 (talet på fisk i millionar).
Omr. Alder (årsklasse) / Age (year-class) (Area) 1
(99) 2
(98) 3
(97) 4
(96) 5
(95) 6
(94) 7
(93) 8
(92) 9
(91) 10+ Total
A 10.1 6.8 7.3 10.1 19.2 7.7 1.1 0.5 0.3 0.1 63.3 B 0.9 0.4 0.9 1.0 2.8 2.3 1.2 0.6 0.4 0.1 10.4 C 6.1 2.9 1.6 1.5 5.3 1.7 0.3 0.1 0.1 + 19.5 D 62.8 92.5 117.3 64.4 28.1 6.7 1.2 0.4 0.2 0.1 373.7 D' 9.9 94.6 34.5 2.1 0.6 0.6 0.1 - - - 142.4 E 22.6 17.5 16.3 6.2 4.3 1.6 0.1 0.1 - - 68.8 S 16.4 33.5 57.3 46.9 48.0 6.4 0.4 0.3 + + 209.4
ABCD 79.9 102.6 127.1 77.0 55.4 18.4 3.8 1.6 1.0 0.3 466.6 Total 128.8 248.3 235.2 132.1 108.3 26.9 4.3 2.0 0.4 0.4 887.5

37
Table 6.7. COD. Abundance indices from bottom trawl surveys in the Barents Sea winter 1981-2000 (numbers in millions). 1981-1992 includes only main areas A, B, C and D). TORSK. Mengdeindeksar frå botntrålundersøkingar i Barentshavet vinteren 1981-2000 (talet på fisk i millionar). 1981-1992 inkluderer berre hovudområda A, B, C og D.
År Alder (Age)
(Year) 1 2 3 4 5 6 7 8 9 10+ Total
1981 1982 1983 1984 1985 1986 1987 1988 1989 1990 1991 1992 1993 1994 1995 1996
4.6 0.8
152.9 2755.0
49.5 665.8
30.7 3.2 8.2
207.2 460.5 126.6 534.5
1035.9 5253.1 5768.5
34.32.9
13.4379.1660.0399.6445.072.815.656.7
220.1570.9420.4535.8541.5707.6
16.4 28.3 25.0 97.5
166.8 805.0 240.4 148.0 46.4 28.4 45.9
158.3 273.9 296.5 274.6 170.0
23.327.752.328.3
126.0143.9391.180.575.934.933.757.7
140.1310.2241.4115.4
40.023.643.321.419.964.154.3
173.337.834.625.717.872.5
147.4255.9137.2
38.415.517.011.77.78.3
15.720.590.220.621.512.815.850.676.7
106.1
4.816.05.84.13.31.92.03.69.8
27.212.27.76.29.3
18.524.0
1.01.43.20.40.20.30.50.50.91.6
12.74.33.92.42.42.9
0.3 0.2 1.0 0.1 0.1 0.0 0.0 0.0 0.1 0.4 0.6 2.7 2.2 1.6 0.8 0.4
0.0 0.0 0.1 0.1 0.1 0.0 0.0 0.0 0.1 0.0 0.0 0.2 2.4 1.3 1.1 0.5
163.1116.4313.9
3297.71033.62089.11179.8502.5285.0411.5832.7959.0
1471.92391.06666.27032.5
19971
19981 4815.5 2418.5
1045.1643.7
238.0 396.0
64.0181.3
70.436.5
52.725.9
28.317.8
5.78.6
0.9 1.0
0.5 0.5
6321.13729.8
1999 2000
484.6 128.8
340.1248.3
211.8 235.2
173.2132.1
58.1108.3
13.426.9
6.54.3
5.12.0
1.2 1.2
0.4 0.4
1294.4887.5
1) Indices raised to also represent the Russian EEZ. Indeksar oppjusterte til også å omfatta russisk sone.
6.3 Growth
Table 6.8 and 6.10 show length and weight by age for each main area. For ages 3 and older,
the smallest and lightest fish are observed furthest to the north and east (area D, D’, E and S),
while for ages 1 and 2 the picture is nearly the opposite. In some areas and for the oldest fish
there are few observations and the values are therefore more uncertain.
Tables 6.9 and 6.11 present the time series for mean length (1978-2000) and weight at age
(1983-2000) for the entire investigated area. Since the smallest and lightest cod usually are
found in the eastern part of the distribution area, the values for 1997 and 1998, when this part
was not covered, were adjusted using factors for each age group achieved by interpolating
between “1996-total-value/1996-Norwegian EEZ-value” and “1999-total-value/ 1999-
Norwegian EEZ-value”. Mean length and weight at age 1 and 2 are the highest since 1992,

38
while for the other age groups the values are still low. Except for the oldest age groups, yearly
weight increments were simila to previous year (table 6.12).
Table 6.8. COD. Length (cm) at age in main areas of the Barents Sea winter 2000.
TORSK. Lengde (cm) ved alder i kvart hovudområde av Barentshavet vinteren 2000.
Omåde Alder (årsklasse / Age (year-class) (Area) 1
(99) 2
(98) 3
(97) 4
(96) 5
(95) 6
(94) 7
(93) 8
(92) A B C D D' E S
12.9 12.6 13.1 12.8 13.4 13.5 12.6
20.0 19.9 19.9 21.0 21.5 21.1 19.7
30.1 35.9 30.7 28.9 29.2 28.0 27.8
42.6 51.5 41.5 39.6 42.1 39.5 38.9
53.0 57.4 55.2 51.2 52.8 51.7 50.4
62.1 64.5 63.5 61.2 55.3 61.1 60.7
71.4 71.0 72.4 68.9 72.3 71.2 70.3
75.3 78.1 77.5 73.6
- 88.3 71.8
Total 13.0 21.0 28.7 39.7 51.5 61.6 70.5 75.7 Table 6.9. COD. Length (cm) at age in the Barents Sea from the investigations winter 1978 - 2000. TORSK. Lengde (cm) ved alder i Barentshavet frå undersøkingane vinteren 1978 -2000.
År Alder (Age) (Year) 1 2 3 4 5 6 7 8 1978 1979 1980 1981 1982 1983 1984 1985 1986 1987 1988 1989 1990 1991 1992 1993 1994 1995 1996
14.2 12.8 17.6 17.0 14.8 12.8 14.2 16.5 11.9 13.9 15.3 12.5 14.4 13.6 13.2 11.3 12.0 12.7 12.6
23.1 22.9 24.8 26.1 25.8 27.6 28.4 23.7 21.6 21.0 23.3 25.4 27.9 27.2 23.9 20.3 18.3 18.7 19.6
32.1 33.1 34.2 35.5 37.6 34.8 35.8 40.3 34.4 31.8 29.7 34.7 39.4 41.6 41.3 35.9 30.5 29.9 28.1
45.9 40.0 40.5 44.7 46.3 45.9 48.6 48.7 49.9 41.3 38.7 39.9 47.1 51.7 49.9 50.8 44.7 42.0 41.0
54.2 52.3 52.5 52.0 54.7 54.5 56.6 61.3 59.8 56.3 47.6 46.8 53.8 59.5 60.2 59.0 55.4 54.1 49.3
64.6 64.4 63.5 61.3 63.1 62.7 66.2 71.1 69.4 66.3 56.8 56.2 60.6 67.1 68.4 68.2 64.3 64.1 61.4
67.6 74.7 73.6 69.6 70.8 73.1 74.1 81.2 80.3 77.6 71.7 67.0 68.2 72.3 76.1 76.8 73.5 74.8 72.2
76.9 83.0 83.6 77.9 82.9 78.6 79.7 85.7 93.8 87.9 79.4 83.3 79.2 77.6 82.8 85.8 82.4 80.6 85.3
19971
19981 11.4 10.9
18.8 17.4
28.0 28.7
40.4 40.0
49.9 50.5
59.3 58.9
69.1 67.5
80.6 76.3
1999 2000
12.1 13.0
18.8 21.0
29.0 28.7
40.6 39.7
50.6 51.5
59.9 61.6
70.3 70.5
78.0 75.7
1) Adjusted lengths Justerte lengder

39
Table 6.10. COD. Weight (g) at age in main areas of the Barents Sea winter 2000. TORSK. Vekt (g) ved alder i kvart hovudområde av Barentshavet vinteren 2000. Område Alder (årsklasse) / Age (year-class) (Area) 1
(99) 2
(98) 3
(97) 4
(96) 5
(95) 6
(94) 7
(93) 8
(92) A B C D D' E S
14 15 16 16 16 21 15
62 69 60 77 80 86 67
237 415 245 219 212 206 183
671 1202 594 557 668 599 513
1260 1750 1353 1176 1234 1230 1113
2011 2378 1927 1944 1523 1977 1882
3039 3192 3134 2755 3189 2869 2787
3582 4279 3959 3504
- 4773 3261
Total 17 77 210 559 1189 1978 2989 3797 Table 6.11. COD. Weight (g) at age in the Barents Sea from the investigations winter 1983-2000. TORSK. Vekt (g) ved alder i Barentshavet frå undersøkingane vinteren 1983-2000.
År Alder (Age) (Year) 1 2 3 4 5 6 7 8 1983 1984 1985 1986
19871
1988 1989 1990 1991 1992 1993 1994 1995 1996
- 23 - -
21 24 16 26 18 20 9
13 16 15
190 219 171 119 65 114 158 217 196 136 71 55 54 62
372 421 576 377 230 241 374 580 805 619 415 259 248 210
923 1155 1003 997 490 492 604 1009 1364 1118 1179 788 654 636
1597 1806 2019 1623 1380 892 947
1435 2067 1912 1743 1468 1335 1063
2442 2793 3353 2926 2300 1635 1535 1977 2806 2792 2742 2233 2221 1999
3821 3777 5015 3838 3970 3040 2582 2829 3557 3933 3977 3355 3483 3344
4758 4566 6154 7385
- 4373 4906 4435 4502 5127 5758 4908 4713 5514
19972
19982 12 10
54 47
213 231
606 579
1112 1145
1790 1732
2851 2589
4761 3930
1999 2000
13 17
55 77
219 210
604 559
1161 1189
1865 1978
2981 2989
3991 3797
1) Estimated weights (Estimerte vekter) 2) Adjusted weights (Justerte vekter)

40
Table 6.12. COD. Yearly weight increment (g) from the investigations in the Barents Sea winter 1983 - 2000. TORSK. Årleg tilvekst (g) frå undersøkingane i Barentshavet vinteren 1983 - 2000.
År Alder (Age)
(Year) 1-2 2-3 3-4 4-5 5-6 6-7 7-8
1983-84 1984-85 1985-86 1986-87 1987-88 1988-89 1989-90 1990-91 1991-92 1992-93 1993-94 1994-95 1995-96 1996-97 1997-98 1998-99 1999-00
- 148
- -
93 134 201 170 118 51 46 41 46 39 35 45 64
231 357 206 111 176 260 422 588 423 279 188 193 156 151 177 172 155
783 582 421 113 262 363 635 784 313 560 373 395 388 396 366 373 340
883 864 620 383 402 455 831 1058 548 625 289 547 409 476 539 582 585
1196 1547 907 677 255 643 1030 1371 725 830 490 753 664 727 621 720 817
1335 2222 485 1044 740 947 1294 1580 1127 1185 613 1250 1123 852 799 1249 1124
745 2377 2370
- 403 1866 1853 1673 1570 1825 931 1358 2031 1417 1079 1402 816
6.4 Considerations and conclusion
When using the abundance indices for stock assessment it is important to be aware of all the
technical changes introduced during the time series. Better acoustic equipment after 1990 has
increased the quality of the indices for all age groups. The survey area was enlarged in 1993.
This led to higher indices, especially for the youngest age groups, and the indices also became
more accurate all over. The introduction of more fine meshed cod-ends in 1994 and fish
length dependent fishing width of the trawl in the calculations (the time series is adjusted for
this) did also lead to (relative) more small fish. Table 6.13 shows that during the time series 1993 – 1999 there was a clear increase in the
total mortality rate (natural + fishing mortality) for all age groups that were covered by the
swept area investigations (ages 1-6). For the youngest age groups (ages 1-3) this was caused
by increased cannibalism, while for the other age groups it is caused by increased fishing
pressure. The total mortality rate for these age groups are well above the mortality estimated
in the ICES assessment. The reason for this may be found in the assessment models, changes
within the index series, unreported commercial catches and/or discards.

41
The mortality rates estimated from the 2000 survey results show a decrease in total mortality
for all age groups to the lowest level since 1994-1995.
The observed mortality rates in the acoustic investigations have been more variable. This is
explained by changes in fish behaviour and how available the fish is for acoustic registration.
During the winter survey 1998 the relative abundance of cod in the bottom channel was lower
than the years before, and hence the fish were more available for acoustic registration. This
led to lower mortality rates of all year classes from 1997 to 1998 in the acoustic series
compared with the swept area series. A similar situation is observed in 2000 compared with
1999.
Table 6.13. Total mortality observed for cod during the winter survey in the Barents Sea in 1993-2000. Total dødsrate for torsk observert under vintertoktet i Barentshavet i perioden 1993-2000.
År Alder (Age)
(Year) 1-2 2-3 3-4 4-5 5-6 6-7 7-8 8-9
Akustiske undersøkingar (Acoustic investigations)
1993-94 1994-95 1995-96 1996-97 1997-98 1998-99 1999-00
0.62 1.08 2.04 1.72 0.94 2.41 0.48
0.35 1.24 1.15 0.59 0.01 1.44 0.22
-0.12 0.78 0.86 0.59 0.03 1.49 -0.06
-0.01 0.66 0.62 0.36 0.20 1.40 -0,39
0.53 1.03 1.03 0.83 0.39 1.41 0.00
0.55 1.34 1.21 1.21 0.33 1.65 0.07
0.78 1.77 1.80 1.65 0.49 1.88 0.33
1.06 1.65 2.10 1.39 0.85 2.86 0.31
Botntrål-undersøkingar (Bottomtrawl investigations)
1993-94 1994-95 1995-96 1996-97 1997-98 1998-99 1999-00
0.00 0.65 2.00 1.71 2.01 1.96 0.70
0.35 0.67 1.16 1.09 0.97 1.11 0.34
-0.12 0.21 0.87 0.98 0.27 0.83 0.51
-0.05 0.19 0.57 0.49 0.56 1.14 0.46
0.36 0.65 0.88 0.96 1.00 1.00 0.65
0.54 1.00 1.16 1.32 1.09 1.39 1.01
0.94 1.35 1.87 1.44 1.19 1.25 1.18
0.88 1.12 1.84 1.14 1.74 2.00 1.63

42
7. DISTRIBUTION AND ABUNDANCE OF HADDOCK
7.1 Acoustic estimation
Figs. 7.1 - 7.6 show the distribution of different haddock age groups. As for cod, the echo
density map (fig. 5.2) gives a better resolution.
The distribution of the different age groups in 2000 was very similar to the year before. Minor
differences are likely to be explained by differences in year class strength (e.g., 1 year olds in
1999 distributed around Bear Island). The 2000 distributions of 1 and 2, 3 and 4, 5 and 6-year-
old haddock are pair wise very similar.
Also most of the mature haddock (age 7 and older) are on its spawning migration
southwestwards out of the investigated area. The distribution of 1- and 2 year olds showing
some dense concentrations and a more northward extension compared with the previous
recent years reflects the strength of these year classes and the hydrographical conditions
expressed by a tongue of 2�C seawater protruding northwards. The survey managed this year
to cover all age groups satisfactorily in north and east.
Table 7.1 shows the acoustic abundance indices by length and age, and table 7.2 presents the
indices by age for each channel (pelagic and bottom) within the main areas. More than 90% of
the haddock were less than 30 cm. Almost 60% of the haddock were registered in main area
D, and this was similar to the year before.
The time series (1981-2000), with adjusted indices for 1997 and 1998, is presented in table
7.3. The indices for 1- and 2 year olds are among the best observed since the strong 1990-year
class. If we exclude the strong 1990-year class from the average, the abundance indices in
2000 for older haddock, except 4 year olds, are low and less than 50% of the 1993-1999
average. The age 4 index (1996 year class), however, is slightly above this average.

43
76°
75°
74°
73°
72°
71°
70°
69°
68°
Area coveredDrift Iceborder
25999-49999
10000-24999
>50000
1000-9999
1-999
34°14° 18° 22° 26° 30° 38° 42° 46° 50° 54° Figure 7.1. 1-GROUP HADDOCK. Distribution winter 2000 (echo recordings, number of fish per square
nautical mile). 1-GRUPPE HYSE. Fordeling vinteren 2000 (ekkoregistreringar, talet på fisk pr. kvadratnautisk mil).
76°
75°
74°
73°
72°
71°
70°
69°
68°
Area coveredDrift Iceborder
10000-24999
1000-9999
>25000
100-999
1-99
34°14° 18° 22° 26° 30° 38° 42° 46° 50° 54° Figure 7.2. 2-GROUP HADDOCK. Distribution winter 2000 (echo recordings, number of fish per square
nautical mile). 2-GRUPPE HYSE. Fordeling vinteren 2000 (ekkoregistreringar, talet på fisk pr. kvadratnautisk mil).

44
76°
75°
74°
73°
72°
71°
70°
69°
68°
Area coveredDrift Iceborder
>1000
100-999
1-99
34°14° 18° 22° 26° 30° 38° 42° 46° 50° 54° Figure 7.3. 3-GROUP HADDOCK. Distribution winter 2000 (echo recordings, number of fish per square
nautical mile). 3-GRUPPE HYSE. Fordeling vinteren 2000 (ekkoregistreringar, talet på fisk pr. kvadratnautisk mil).
76°
75°
74°
73°
72°
71°
70°
69°
68°
Area coveredDrift Iceborder
>1000
100-999
1-99
34°14° 18° 22° 26° 30° 38° 42° 46° 50° 54° Figure 7.4. 4-GROUP HADDOCK. Distribution winter 2000 (echo recordings, number of fish per square
nautical mile). 4-GRUPPE HYSE. Fordeling vinteren 2000 (ekkoregistreringar, talet på fisk pr. kvadratnautisk mil).

45
76°
75°
74°
73°
72°
71°
70°
69°
68°
Area coveredDrift Iceborder>1000
100-999
1-99
34°14° 18° 22° 26° 30° 38° 42° 46° 50° 54° Figure 7.5. 5-GROUP HADDOCK. Distribution winter 2000 (echo recordings, number of fish per square
nautical mile). 5-GRUPPE HYSE. Fordeling vinteren 2000 (ekkoregistreringar, talet på fisk pr. kvadratnautisk mil).
76°
75°
74°
73°
72°
71°
70°
69°
68°
Area coveredDrift Iceborder>10000
100-999
1-99
34°14° 18° 22° 26° 30° 38° 42° 46° 50° 54° Figure 7.6. 6-GROUP AND OLDER HADDOCK. Distribution winter 2000 (echo recordings, number of fish
per square nautical mile). 6-GRUPPE OG ELDRE HYSE. Fordeling vinteren 2000 (ekkoregistreringar, talet på fisk pr. kvadratnautisk mil).

46
Table 7.1. HADDOCK. Abundance indices at length and age from the acoustic survey in the Barents Sea winter 2000 (numbers in millions).
HYSE. Mengdeindeksar for lengde- og aldersgrupper frå den akustiske undersøkinga i Barentshavet vinteren 2000 (talet på fisk i millionar).
Lengde Alder (årsklasse) / Age (year-class) (Length)
(cm) 1
(99) 2
(98) 3
(97) 4
(96) 5
(95) 6
(94) 7
(93) 8
(92) 9
(91) 10+ Sum
5-9 10-14 15-19 20-24 25-29 30-34 35-39 40-44 45-49 50-54 55-59 60-64 65-69 70-74 75-79 80-84 85-89 >90
0.1 242.5 780.3
1.6
160.0 229.3 118.8
0.8
14.3 13.4
4.2 0.2
0.22.6
12.731.914.7
2.8
0.12.2
10.45.00.8
1.12.55.01.60.2
0.7
0.10.50.2
+
0.1
0.20.2
0.2 0.7 0.3 0.6
0.1 +
0.1
0.1 +
0.1242.5940.3230.9133.3
16.817.136.327.613.2
3.90.90.60.1
+
Sum 1024.4 508.9 32.2 64.9 18.5 10.5 1.6 0.5 1.8 0.4 1663.8 Table 7.2. HADDOCK. Acoustic abundance indices in the pelagic layer (P) and in the 10 m layer above the
bottom (B) for the main areas of the Barents Sea winter 2000 (numbers in millions). HYSE. Akustiske mengdeindeksar i det pelagiske sjiktet (P) og i 10 m sjiktet over botn (B) for kvart hovudområde av Barentshavet vinteren 2000 (talet på fisk i millionar).
Omr. Sjikt Alder (årsklasse) / Age (year-class)
(Area) (Layer) 1 (99)
2 (98)
3 (97)
4 (96)
5 (95)
6 (94)
7 (93)
8 (92)
9 (91)
10+ Total
A P B
152.345.2
64.1 15.7
4.90.7
13.70.9
4.80.5
4.60.5
0.3+
0.1 +
1.2 0.3
0.1 +
246.363.9
B P B
75.150.3
43.3 26.6
2.71.2
3.52.4
1.41.0
0.30.2
0.30.1
0.1 0.1
0.1 +
+ 0.0
126.881.8
C P B
67.35.9
9.7 1.0
0.90.1
4.60.5
2.80.3
1.60.2
0.10.0
0.2 0.0
0.0 0.0
0.0 +
87.38.0
D P B
489.8101.0
232.0 85.3
13.66.3
29.39.1
6.11.6
2.40.5
0.60.2
0.0 0.0
0.0 0.0
0.2 0.0
774.0204.1
D' P B
6.66.7
14.1 8.5
1.20.6
0.50.2
0.00.0
0.10.0
0.00.0
0.0 0.0
0.0 0.0
0.0 0.0
22.516.0
E P B
10.95.0
2.1 1.0
0.1+
0.1+
0.00.0
0.00.0
0.00.0
0.0 0.0
0.0 0.0
0.0 0.0
13.36.1
S P B
8.00.3
5.3 0.2
0.00.0
0.00.0
0.00.0
0.00.0
0.00.0
0.0 0.0
0.0 0.0
0.0 0.0
13.30.5
ABCD P B
784.5202.4
349.1 128.5
22.08.2
51.112.9
15.13.4
9.01.4
1.20.3
0.4 0.1
1.5 0.3
0.3 +
1234.3357.7
Total P B
Sum
810.0214.4
1024.4
370.6 138.2 508.9
23.38.8
32.1
51.813.164.8
15.13.4
18.5
9.01.4
10.4
1.20.31.6
0.4 0.1 0.5
1.5 0.3 1.8
0.3 +
0.3
1283.4380.3
1663.7

47
Table 7.3. HADDOCK. Abundance indices from acoustic surveys in the Barents Sea winter 1981-2000 (numbers in millions). 1981-1992 includes mainly areas A, B, C and D.
HYSE. Mengdeindeksar frå akustiske undersøkingar i Barentshavet vinteren 1981-2000 (talet på fisk i mllionar). 1981-1992 inkluderer i hovudsak områda A, B, C og D.
År Alder (Age)
(Year) 1 2 3 4 5 6 7 8 9 10+ Total
1981 1982 1983 1984 1985 1986 1987 1988 1989 1990 1991 1992 1993 1994 1995 1996
7 9 0
1685 1530
556 85 18 52
270 1890 1135
947 562
1379 249
1425
173776266
1745
35252868626193285229
5 3 2 6
215 452
49 8 6 3
45 134 563 255
36 44
214325
189171
2311
38
23130631111
31
60411++
504620
432
13111387
76
1810
1++++7
2173++
1242
151
164+++++2
113+++28
++2++++00261++++
+ + + + + + 0 0 0 + + 2 + + + 0
+ + + + + + + + 0 + 0 + 3 + + +
1263818
186725261463
372106117335
22102165228217642242
788 19971
19981 693 220
24122
51 20
1728
1212
435
4313
216
+ 1
+ +
885437
1999 2000
856 1024
46509
57 32
1365
1419
411
12
21
2 2
+ +
9941664
1) Indices raised to also represent the Russian EEZ. Indeksar oppjusterte til også å omfatta russisk sone.
7.2 Swept area estimation
Figs. 7.5 - 7.8 show the horizontal distribution of haddock < 20 cm, 20-34 cm, 35-49 cm and
> 50 cm (number of haddock per 3 naut. mile) from the swept area investigations. The
distribution patterns for the different length groups were very similar to previous years, but
with 20-34 cm haddock distributed somewhat further to the north than the year before.
Table 7.4 presents the abundance indices by length groups for each main area. Standard error
and coefficient of variation (CV) are also given.
Table 7.5 show the abundance indices by age- and length groups, and table 7.6 presents the
indices for each age group by main areas. The time series (1981-2000) is shown in table 7.7.
The indices for 1997 and 1998 are adjusted the same way as for cod (as the acoustic indices)
to also represent the Russian EEZ.
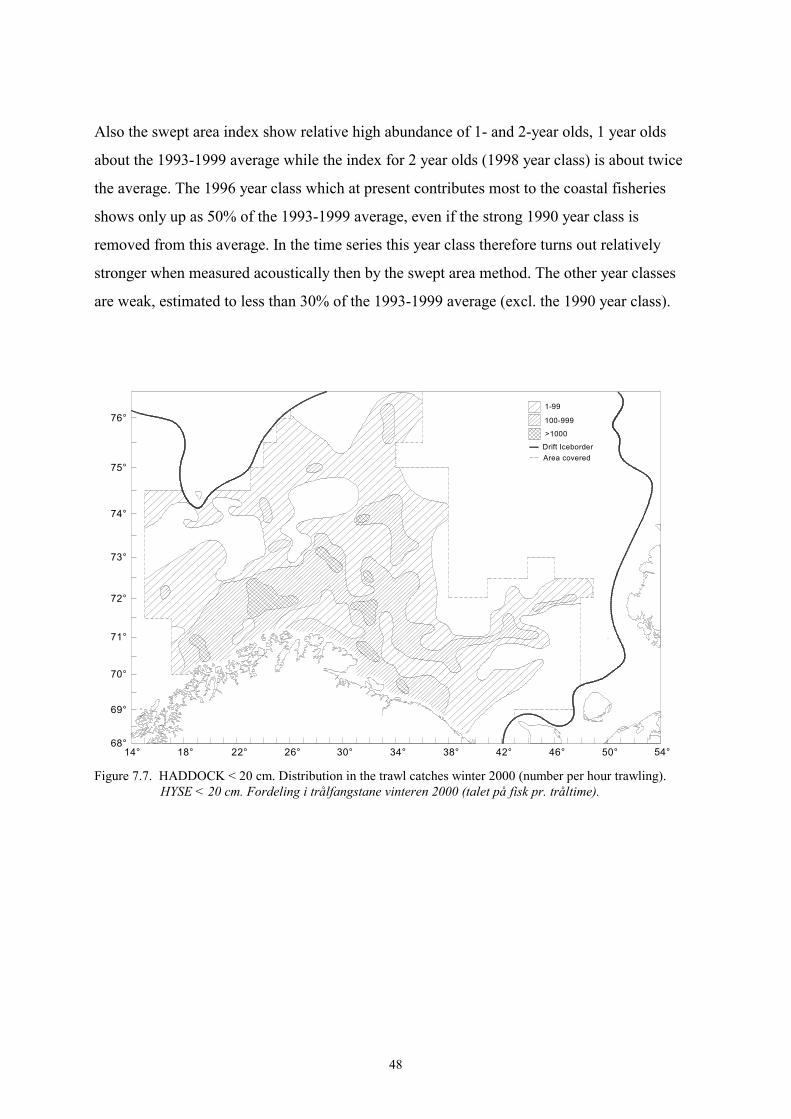
48
Also the swept area index show relative high abundance of 1- and 2-year olds, 1 year olds
about the 1993-1999 average while the index for 2 year olds (1998 year class) is about twice
the average. The 1996 year class which at present contributes most to the coastal fisheries
shows only up as 50% of the 1993-1999 average, even if the strong 1990 year class is
removed from this average. In the time series this year class therefore turns out relatively
stronger when measured acoustically then by the swept area method. The other year classes
are weak, estimated to less than 30% of the 1993-1999 average (excl. the 1990 year class).
76°
75°
74°
73°
72°
71°
70°
69°
68°
Area coveredDrift Iceborder
>1000
100-999
1-99
34°14° 18° 22° 26° 30° 38° 42° 46° 50° 54° Figure 7.7. HADDOCK < 20 cm. Distribution in the trawl catches winter 2000 (number per hour trawling).
HYSE < 20 cm. Fordeling i trålfangstane vinteren 2000 (talet på fisk pr. tråltime).

49
76°
75°
74°
73°
72°
71°
70°
69°
68°
Area coveredDrift Iceborder
>1000
100-999
1-99
34°14° 18° 22° 26° 30° 38° 42° 46° 50° 54° Figure 7.8. HADDOCK 20-34 cm. Distribution in the trawl catches winter 2000 (number per hour trawling). HYSE 20-34 cm. Fordeling i trålfangstane vinteren 2000 (talet på fisk pr. tråltime).
76°
75°
74°
73°
72°
71°
70°
69°
68°
Area coveredDrift Iceborder>100
1-99
34°14° 18° 22° 26° 30° 38° 42° 46° 50° 54° Figure 7.9. HADDOCK 35-49 cm. Distribution in the trawl catches winter 2000 (number per hour trawling).
HYSE 35-49 cm. Fordeling i trålfangstane vinteren 2000 (talet på fisk pr. tråltime).

50
76°
75°
74°
73°
72°
71°
70°
69°
68°
Area coveredDrift Iceborder1-99
34°14° 18° 22° 26° 30° 38° 42° 46° 50° 54° Figure 7.10. HADDOCK > 50 cm. Distribution in the trawl catches winter 2000 (number per hour trawling).
HYSE > 50 cm. Fordeling i trålfangstane vinteren 2000 (talet på fisk pr. tråltime).

Table 7.4. HADDOCK. Abundance indices (I) at length with standard error of mean (S) from bottom trawl hauls for main areas of the Barents Sea winter 2000 (no. in mill). HYSE. Mengdeindeksar (I) for lengdegrupper med standard feil (S) frå botntrålhal for kvart hovudområde av Barentshavet vinteren 2000 (talet fisk i millionar).
Lengde Område (Area) (Length) A B C D D' E S Total
cm I S I S I S I S I S I S I S I S CV (%) 5-9
10-14 15-19 20-24 25-29 30-34 35-39 40-44 45-49 50-54 55-59 60-64 65-69 70-74 75-79 80-84 85-89 >90
059.7
230.126.9
4.91.51.41.72.41.70.90.40.1
++000
0 13.3 39.5
4.5 1.3 0.3 0.3 0.3 0.5 0.4 0.3 0.1
+ + + 0 0 0
+ 18.5
105.8 19.7
2.0 1.8 1.0 1.0 1.6 0.8 0.5 0.2
+ + 0 0 0 0
+4.2
26.64.40.60.50.20.30.50.30.10.1
++0000
06.3
35.64.20.90.20.30.71.10.90.30.1
+00000
02.6
15.01.40.30.10.10.20.30.20.10.1
+00000
0101.7366.1113.3108.3
8.47.5
14.98.51.20.20.1
000000
014.149.215.318.6
2.11.12.51.20.20.1
+000000
03.15.96.8
24.82.00.30.2
+0+0000000
0 1.2 2.9 3.9
18.0 1.4 0.3 0.2
+ 0 + 0 0 0 0 0 0 0
08.4
26.35.50.7
00.10.3
0000000000
04.5
11.42.80.5
00.10.3
0000000000
05.1
16.15.20.3
+++
0.10.1
+0+00000
02.45.81.20.1
+++
0.1+0+000000
+202.9785.9181.5141.9
13.910.618.913.7
4.61.80.70.10.1
+000
+20.771.317.325.9
2.61.22.61.50.60.30.1
+++000
0 100.0
10.2 9.1 9.5
18.3 18.7 11.4 13.7 10.5 12.4 16.9 20.6 35.4 79.9
100.0 0 0
Sum 331.6 42.0 152.9 27.3 50.6 15.3 730.1 56.7 43.1 18.7 41.3 12.5 27.0 6.4 1376.5 80.6 5.9

Table 7.5. HADDOCK. Abundance indices at length and age from the bottom trawl survey in the Barents Sea winter 2000 (numbers in millions).
HYSE. Mengdeindeksar for lengde- og aldersgrupper frå botntrålundersøkinga i Barentshavet vinteren 2000 (talet på fisk i millionar).
Lengde Alder (årsklasse) / Age (year-class) (Length)
(cm) 1
(99) 2
(98) 3
(97) 4
(96) 5
(95) 6
(94) 7
(93) 8
(92) 9
(91) 10+ Sum
5-9 10-14 15-19 20-24 25-29 30-34 35-39 40-44 45-49 50-54 55-59 60-64 65-69 70-74 75-79
+ 202.9 643.1
1.2
142.9 180.4 128.4
0.6
13.3 11.1
2.6 0.2
0.1 2.1 7.9
16.6 7.7 0.9
0.11.24.91.90.4
0.41.11.70.70.1
0.4
0.10.30.1
+
+
0.10.1
0.1 0.3 0.3 0.1
+ +
0.1 0.1
+
+202.9785.9181.5141.9
13.910.618.913.7
4.61.80.70.10.1
+Sum 847.2 452.2 27.2 35.4 8.4 4.0 0.8 0.3 0.7 0.2 1376.6
Table 7.6 HADDOCK. Abundance indices from bottom trawl hauls for main areas of the Barents Sea winter 2000 (numbers
in millions). . HYSE. Mengdeindeksar frå botntrålhal for kvart hovudområde av Barentshavet vinteren 2000 (talet på fisk i millionar).
Omr. Alder (årsklasse) / Age (year-class) (Area) 1
(99) 2
(98) 3
(97) 4
(96) 5
(95) 6
(94) 7
(93) 8
(92) 9
(91) 10+ Total
A 237.7 81.5 3.8 4.3 1.7 1.7 0.1 0.1 0.6 0.1 331.7 B 91.4 53.4 2.7 3.3 1.4 0.3 0.2 0.1 + + 152.9 C 42.0 5.1 0.3 1.5 0.9 0.6 + 0.1 0 0 50.6 D 418.8 261.6 18.1 25.3 4.5 1.3 0.4 0 0.1 0.1 730.2 D' 9.0 31.6 2.0 0.5 0 0 0 0 0 0 43.1 E 34.7 6.0 0.2 0.4 0 0 0 0 0 0 41.3 S 13.5 13.1 0.1 0.1 0 0.1 0 0 0 0 26.9
ABCD 790.0 401.5 24.9 34.4 8.4 3.9 0.8 0.3 0.7 0.2 1265.3 Total 847.2 452.2 27.2 35.4 8.4 4.0 0.8 0.3 0.7 0.2 1376.6

53
Table 7.7. HADDOCK. Abundance indices from bottom trawl surveys in the Barents Sea winter 1981-2000 (numbers in millions). 1981-1992 includes only main areas A, B, C and D.
HYSE. Mengdeindeksar frå botntrålundersøkingar i Barentshavet vinteren 1981-2000 (talet på fisk i millionar). 1981-1992 inkluderer berre hovudområda A, B, C og D.
År Alder (Age)
(Year) 1 2 3 4 5 6 7 8 9 10+ Total
1981 1982 1983 1984 1985 1986 1987 1988 1989 1990 1991 1992 1993 1994 1995 1996
3.1 3.9
2919.3 3832.6 1901.1
665.0 163.8
35.4 81.2
644.1 2006.0 1659.4
727.9 603.2
1463.6 309.5
7.3 1.5 4.8
514.6 1593.8
370.3 79.9 15.3
9.5 54.6
300.3 1375.5
599.0 228.0 179.3 263.6
2.3 1.7 3.1
18.9 475.9 384.6 154.4
25.3 14.1
4.5 33.4
150.5 507.7 339.5
53.6 52.5
7.8 1.8 2.4 1.5
14.7 110.8 290.2
68.9 21.6
3.4 5.1
24.4 105.6 436.6 171.1
48.1
1.8 1.90.90.80.50.6
52.9116.4
34.05.04.22.1
10.549.7
339.5148.6
5.3 4.81.90.20.50.20.0
13.832.7
9.22.70.60.63.4
34.5252.8
0.52.42.50.10.10.10.00.13.4
11.81.70.70.40.22.8
11.6
0.20.20.70.40.10.10.00.00.11.84.21.60.30.10.00.9
0.00.00.00.10.40.10.00.00.00.00.02.30.40.20.10.0
0.0 0.0 0.0 0.0 0.3 0.1 0.3 0.0 0.0 0.0 0.0 0.0 1.1 0.6 0.0 0.1
163.1 116.4
2935.5 4369.2 3987.4 1531.9
741.6 275.0 196.5 734.5
2357.7 3217.0 1953.4 1661.5 2244.6 1087.6
19971
19981 1268.0
212.9 67.9
137.9 86.1 22.7
28.0 33.2
19.413.2
46.73.4
62.28.0
3.58.1
0.10.7
0.0 0.1
1581.8 440.0
1999 2000
1244.9 847.2
57.6 452.2
59.8 27.2
12.2 35.4
10.28.4
2.84.0
1.00.8
1.70.3
1.10.7
0.0 0.2
1391.4 1376.6
1) Indices raised to also represent the Russian EEZ. Indeksar oppjusterte til også å omfatta russisk sone.
7.3 Growth
Mean length and weight at age for each main area are shown in table 7.8 and 7.10. Few samples from
the main areas D’, E and S make these results less precise. There is no clear trend towards better growth
in the southwestern areas, and for some age groups (e.g., age 2) mean length and weight at age are
greatest in the east.
The time series (1983-2000, tables 7.9 and 7.11), with adjusted values for 1997 and 1998, shows an
increase in mean length and weight for ages 1 and 2 compared with the year before. For all ages the
mean lengths in 2000 are about the long term mean 1983-1999, whereas the mean weights are slightly
less. The weight increment for a year class from 1999 to 2000 was for age groups 1-5 similar or slightly
greater than the 1983-1999 average (table 7.12).

54
Table 7.8. HADDOCK. Length (cm) at age in main areas of the Barents Sea winter 2000. HYSE. Lengde (cm) ved alder i kvart hovudområde av Barentshavet vinteren 2000.
Område Alder (årsklasse) / Age (year-class) (Area) 1
(99) 2
(98) 3
(97) 4
(96) 5
(95) 6
(94) 7
(93) 8
(92) A B C D D' E S
16.0 16.4 16.5 15.6 14.8 15.5 15.4
20.0 20.0 22.6 23.5 26.0 21.0 20.4
28.7 31.2 33.9 30.3 32.0 28.0 29.2
42.4 40.8 45.6 41.4 41.1 40.6 38.4
48.2 50.2 48.8 46.5
- - -
51.4 55.0 52.3 48.5
- -
53.0
56.3 58.5 62.0 44.1
- - -
59.5 48.3 60.4
- - - -
Total 15.8 22.5 30.3 41.6 47.7 50.8 51.1 56.5 Table 7.9. HADDOCK. Length (cm) at age in the Barents Sea from the investigations winter 1983 – 2000. HYSE. Lengde (cm) ved alder i Barentshavet frå undersøkingane vinteren 1983 – 2000.
År Alder (Age) (Year) 1 2 3 4 5 6 7 1983 1984 1985 1986 1987 1988 1989 1990 1991 1992 1993 1994 1995 1996
16.8 16.6 15.7 15.1 15.4 13.5 16.0 15.7 16.8 15.1 14.5 14.7 15.4 15.4
25.2 27.5 23.9 22.4 22.4 24.0 23.2 24.7 24.0 23.9 21.4 21.0 20.1 21.6
34.9 32.7 35.6 31.5 29.2 28.7 31.1 32.7 35.7 33.9 31.8 29.7 28.7 28.6
44.7 -
41.9 43.0 37.3 34.7 36.5 43.4 44.4 45.5 42.4 38.5 34.2 37.8
52.5 56.6 58.5 54.6 46.5 41.5 41.7 46.1 52.4 53.1 50.6 47.8 42.8 42.0
58.0 62.4 61.9
- -
47.9 46.4 50.1 54.8 59.2 56.1 54.2 51.2 46.7
62.4 61.8 63.9
- -
54.6 52.9 52.4 55.6 60.6 59.4 56.9 55.8 55.3
19971
19981 16.1 14.4
21.1 22.9
27.7 29.2
35.4 35.8
39.7 41.3
47.5 48.4
50.1 50.9
1999 2000
14.7 15.8
20.8 22.5
32.3 30.3
39.4 41.6
45.5 47.7
52.3 50.8
54.6 56.5
1) Adjusted lengths Justerte lengder Table 7.10. HADDOCK. Weight (g) at age in main areas of the Barents Sea winter 2000.
HYSE. Vekt (g) ved alder i kvart hovudområde av Barentshavet vinteren 2000. Område Alder (årsklasse) / Age (year-class) (Area) 1
(99) 2
(98) 3
(97) 4
(96) 5
(95) 6
(94) 7
(93) 8
(92) A B C D D' E S
34 34 32 31 28 34 29
70 74 94
121 169 88 79
220 287 351 273 303 195 239
786 724 865 701 698 690 515
1150 1250 1121 972
- - -
1400 1684 1399 1164
- -
1600
1754 1930 2412 949
- - -
2162 1320 2156
- - - -
Total 32 108 269 720 1068 1341 1430 1910

55
Table 7.11. HADDOCK. Weight (g) at age in the Barents Sea from the investigations winter 1983 - 2000. HYSE. Vekt (g) ved alder i Barentshavet frå undersøkingane vinteren 1983 - 2000.
År Alder (Age)
(Year) 1 2 3 4 5 6 7 1983 1984 1985 1986
19871
1988 1989 1990 1991 1992 1993 1994 1995 1996
52 36 35 47 24 23 43 34 41 32 26 25 30 30
133 196 138 100 91 139 125 148 138 136 93 86 71 93
480 289 432 310 273 232 309 346 457 392 317 250 224 220
1043 964 731 734 542 442 484 854 880 949 766 545 386 551
1641 1810 1970
- 934 743 731 986 1539 1467 1318 1041 765 741
2081 2506 2517
- -
1193 1012 1295 1726 2060 1805 1569 1286 1016
2592 2240
- - -
1569 1399 1526 1808 2274 2166 1784 1644 1782
19972
19982 35 25
88 112
200 241
429 470
625 746
1063 1169
1286 1341
1999 2000
27 32
85 108
333 269
614 720
947 1068
1494 1341
1616 1430
1) Estimated weights (Estimerte vekter)
2) Adjusted weights (Justerte vekter) Table 7.12. HADDOCK. Yearly weight increment (g) from the investigations in the Barents Sea winter 1983 - 2000. HYSE. Årleg tilvekst (g) frå undersøkingane i Barentshavet vinteren 1983 - 2000.
År Alder (Age)
(Year) 1-2 2-3 3-4 4-5 5-6 6-7
1983-84 1984-85 1985-86 1986-87 1987-88 1988-89 1989-90 1990-91 1991-92 1992-93 1993-94 1994-95 1995-96 1996-97 1997-98 1998-99 1999-00
144 102 65 44 115 102 105 104 95 61 60 46 63 58 77 60 81
156 236 172 173 141 170 221 309 254 181 157 138 149 107 153 221 184
484 442 302 232 169 252 545 534 492 374 228 136 327 209 270 373 387
767 1006
- 200 201 289 502 685 587 369 275 220 355 74 316 477 464
865 707
- -
259 269 564 740 521 338 251 245 251 322 544 748 394
159 - - - -
206 514 513 548 106
- 75 496 270 277 447 -64
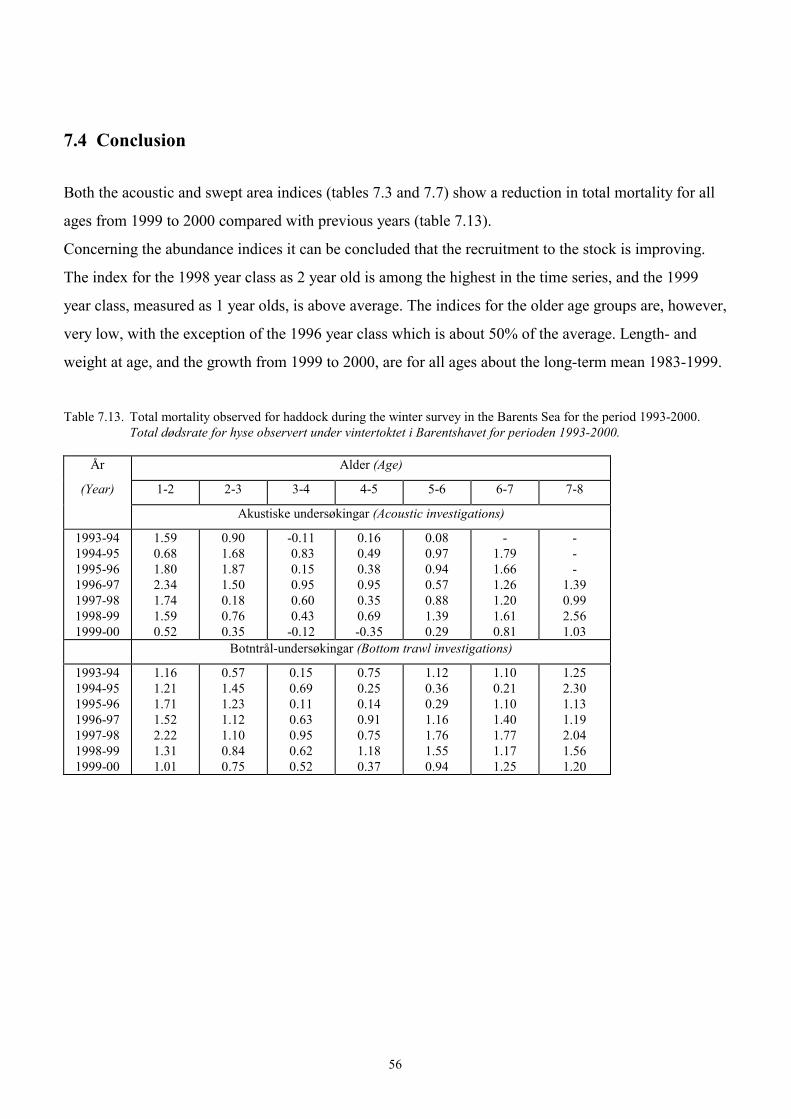
56
7.4 Conclusion
Both the acoustic and swept area indices (tables 7.3 and 7.7) show a reduction in total mortality for all
ages from 1999 to 2000 compared with previous years (table 7.13).
Concerning the abundance indices it can be concluded that the recruitment to the stock is improving.
The index for the 1998 year class as 2 year old is among the highest in the time series, and the 1999
year class, measured as 1 year olds, is above average. The indices for the older age groups are, however,
very low, with the exception of the 1996 year class which is about 50% of the average. Length- and
weight at age, and the growth from 1999 to 2000, are for all ages about the long-term mean 1983-1999.
Table 7.13. Total mortality observed for haddock during the winter survey in the Barents Sea for the period 1993-2000. Total dødsrate for hyse observert under vintertoktet i Barentshavet for perioden 1993-2000.
År Alder (Age)
(Year) 1-2 2-3 3-4 4-5 5-6 6-7 7-8
Akustiske undersøkingar (Acoustic investigations)
1993-94 1994-95 1995-96 1996-97 1997-98 1998-99 1999-00
1.59 0.68 1.80 2.34 1.74 1.59 0.52
0.90 1.68 1.87 1.50 0.18 0.76 0.35
-0.11 0.83 0.15 0.95 0.60 0.43 -0.12
0.16 0.49 0.38 0.95 0.35 0.69 -0.35
0.08 0.97 0.94 0.57 0.88 1.39 0.29
- 1.79 1.66 1.26 1.20 1.61 0.81
- - -
1.39 0.99 2.56 1.03
Botntrål-undersøkingar (Bottom trawl investigations)
1993-94 1994-95 1995-96 1996-97 1997-98 1998-99 1999-00
1.16 1.21 1.71 1.52 2.22 1.31 1.01
0.57 1.45 1.23 1.12 1.10 0.84 0.75
0.15 0.69 0.11 0.63 0.95 0.62 0.52
0.75 0.25 0.14 0.91 0.75 1.18 0.37
1.12 0.36 0.29 1.16 1.76 1.55 0.94
1.10 0.21 1.10 1.40 1.77 1.17 1.25
1.25 2.30 1.13 1.19 2.04 1.56 1.20
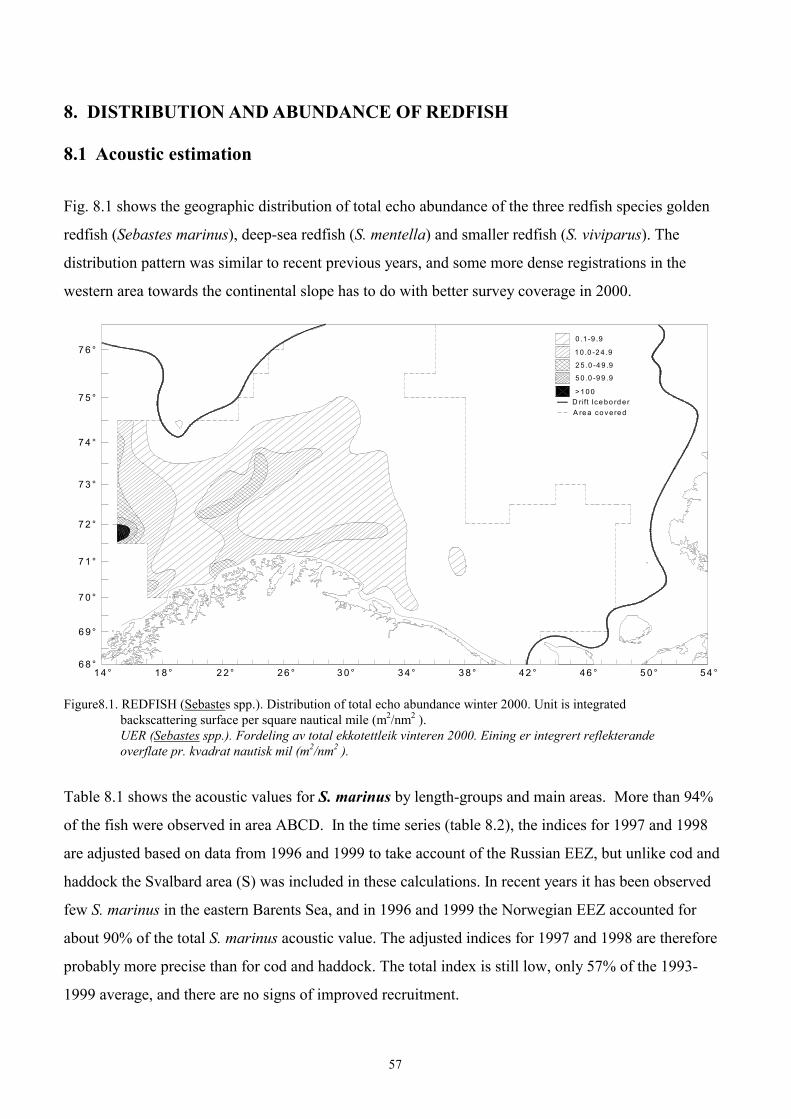
57
8. DISTRIBUTION AND ABUNDANCE OF REDFISH
8.1 Acoustic estimation
Fig. 8.1 shows the geographic distribution of total echo abundance of the three redfish species golden
redfish (Sebastes marinus), deep-sea redfish (S. mentella) and smaller redfish (S. viviparus). The
distribution pattern was similar to recent previous years, and some more dense registrations in the
western area towards the continental slope has to do with better survey coverage in 2000.
7 6 °
7 5 °
7 4 °
7 3 °
7 2 °
7 1 °
7 0 °
6 9 °
6 8 °
A re a co v e re dD rift Ic e bo rd e r
5 0 .0 -9 9 .9
2 5 .0 -4 9 .9
> 1 0 0
1 0 .0 -2 4 .9
0 .1 -9 .9
3 4 °1 4 ° 1 8 ° 2 2 ° 2 6 ° 3 0 ° 3 8 ° 4 2 ° 4 6 ° 5 0 ° 5 4 °
Figure8.1. REDFISH (Sebastes spp.). Distribution of total echo abundance winter 2000. Unit is integrated backscattering surface per square nautical mile (m2/nm2 ).
UER (Sebastes spp.). Fordeling av total ekkotettleik vinteren 2000. Eining er integrert reflekterande overflate pr. kvadrat nautisk mil (m2/nm2 ).
Table 8.1 shows the acoustic values for S. marinus by length-groups and main areas. More than 94%
of the fish were observed in area ABCD. In the time series (table 8.2), the indices for 1997 and 1998
are adjusted based on data from 1996 and 1999 to take account of the Russian EEZ, but unlike cod and
haddock the Svalbard area (S) was included in these calculations. In recent years it has been observed
few S. marinus in the eastern Barents Sea, and in 1996 and 1999 the Norwegian EEZ accounted for
about 90% of the total S. marinus acoustic value. The adjusted indices for 1997 and 1998 are therefore
probably more precise than for cod and haddock. The total index is still low, only 57% of the 1993-
1999 average, and there are no signs of improved recruitment.

58
Table 8.1. SEBASTES MARINUS. Acoustic abundance indices for main areas of the Barents Sea winter 2000 (numbers in millions). VANLEG UER. Akustiske mengdeindeksar for kvart hovudområde av Barentshavet vinteren 2000 (talet på fisk i millionar).
Område Lengdegruppe (cm) / Length group (cm) (Area) 10-14 15-19 20-24 25-29 30-34 35-39 40-44 >45 Total
A B C D D' E S
+ 1.4 0.3 0.7
- - -
+2.20.10.4
---
+ 2.8 0.1 1.2
- -
0.1
1.01.40.40.9
--
0.8
3.02.91.51.1
--
1.0
1.02.81.10.9
--
0.1
0.42.40.40.2
--+
0.6 0.7 0.4 0.2
- - +
6.316.7
4.45.6
--
2.0ABCD 2.5 2.7 4.1 3.8 8.5 5.9 3.4 1.9 33.0Total 2.5 2.7 4.2 4.6 9.5 6.0 3.4 2.0 35.0
Table 8.2. SEBASTES MARINUS. Abundance indices from acoustic surveys in the Barents Sea winter 1986-2000
(numbers in millions). 1986-1992 includes only the area covered in 1986. VANLEG UER. Mengdeindeksar frå akustiske undersøkingar i Barentshavet vinteren 1986-2000 (talet på fisk i millionar). 1986-1992 inkluderer berre området som vart dekka i 1986.
År Lengdegruppe (cm) / Length group (cm) (Year) 10-14 15-19 20-24 25-29 30-34 35-39 40-44 >45 Total1986 1987 1988 1989 1990 1991 1992 1993 1994 1995 1996
4 6 1 4 2
21 2 3 5 5 1
717 1 3 2
10 46
1111
4
7 13 5 7 6
15 9 9 5
15 9
8 8 4 9 9
201111
51313
5 3 2 6 9
211324
71415
1 3 1 4 6
141118
51622
+21257582
1010
6 3 + 1 4 7 3 7 1 6 4
38 55 15 36 43
115 5886419077
19971
19981 0
8 23
9 9
1111
1211
129
66
3 4
5661
1999 2000
1 2
+3
2 4
45
610
46
23
1 2
2035
1) Indices raised to also represent the Russian EEZ. Indeksar oppjusterte til også å omfatta russisk sone.
About 80% of S. mentella (table 8.3) were observed in area ABCD. In 1996 and 1999, nearly 100 %
and 96%, respectively, of the total index was registered in the Norwegian EEZ and at Svalbard (S).
Accordingly, only minor adjustments were therefore necessary to take account for the Russian EEZ in
1997 and 1998 (table 8.4). The acoustic index in 2000 is for most of the length-groups higher than the
very low indices in 1999. For 25 cm and larger fish the acoustic abundance indices for 2000 are at or
above the 1993-1999 average, while the indices for smaller fish are the lowest observed.

59
Table 8.3. SEBASTES MENTELLA.1 Acoustic abundance indices for main areas of the Barents Sea winter 2000 (numbers in millions).
SNABELUER.1 Akustiske mengdeindeksar for kvart hovudområde av Barentshavet vinteren 2000 (talet på fisk i millionar).
Område Lengdegruppe (cm) / Length group (cm) (Area) 10-14 15-19 20-24 25-29 30-34 35-39 40-44 >45 Total
A B C D D' E S
2.4 0.2 2.0
12.6 -
0.6 0.1
15.40.20.37.7
-1.35.7
35.7 1.5 4.0
22.9 -
0.4 7.7
69.02.23.37.9
-0.1
27.3
54.55.17.56.2
-+
13.9
15.35.11.21.0
--
5.4
5.30.60.4
+--
0.8
1.1 +
0.1 - - - -
198.813.918.858.4
-2.4
61.0ABCD 17.3 23.6 64.3 82.4 63.4 22.6 6.4 1.3 291.2Total 18.0 30.6 72.4 109.8 87.3 28.0 7.2 1.3 354.6
1) Includes unidentified Sebastes specimens, mostly less than 15 cm. Inkluderer uidentifiserte Sebastes individer, for det meste mindre enn 15 cm. Table 8.4. SEBASTES MENTELLA.1 Abundance indices from acoustic surveys in the Barents Sea winter 1988-2000 (numbers in millions).) 1986-1992 includes only the area covered in 1986. SNABELUER.1 Mengdeindeksar frå akustiske undersøkingar i Barentshavet vinteren 1986-2000 (talet på fisk i millionar). 1986-1992 inkluderer berre området som vart dekka i 1986.
År Lengdegruppe (cm) / Length group (cm) (Year) 10-14 15-19 20-24 25-29 30-34 35-39 40-44 >45 Total1986 1987 1988 1989 1990 1991 1992 1993 1994 1995 1996
83 17 13 35 77 549 386
1560 687
80 147
54178 46 12 12 88
207599299565183
11 86 75 89 33 31 24
188 111 414 283
223415367375234818
108128
191013 6
23382347137844
9 3 8
104033 8
184
3415
21123314134
1 + + + 1 + + + + 1 +
201 329 171 190 262 817 672
246411331283
723 19972
19982 167 133
4179
229 98
165213
4468
2550
25
0 1
672646
1999 2000
4 18
3531
18 72
44110
1987
728
17
+ 1
130355
1) Includes unidentified Sebastes specimens, mostly less than 15 cm. Inkluderer uidentifiserte Sebastes individer, for det meste mindre enn 15 cm.
2) Indices raised to also represent the the Russian EEZ. Indeksar oppjusterte til også å omfatta russisk sone.
As in previous years, most of the S. viviparus are observed in area AB (table 8.5). The survey covers
only the northern margin of this species’ geographical distribution. Large variation in the indices from
year to year is therefore likely due to variable area coverage in the south-western part of the survey area
in addition to a very patchy distribution.
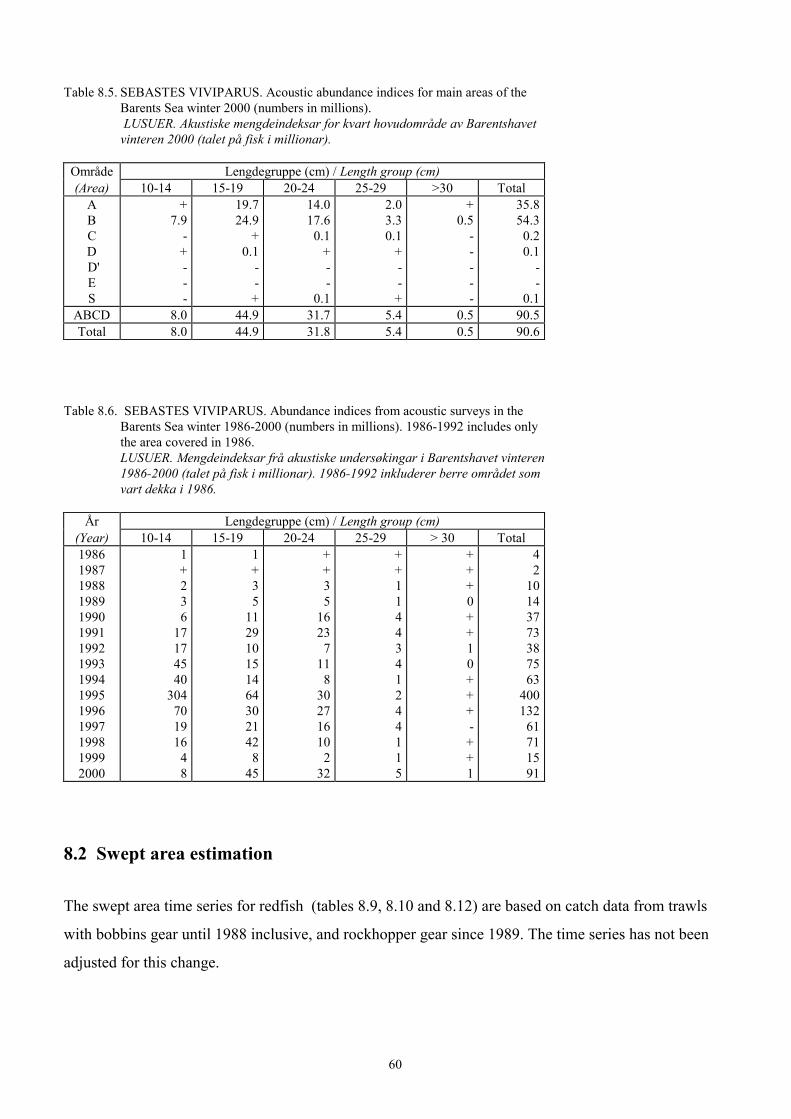
60
Table 8.5. SEBASTES VIVIPARUS. Acoustic abundance indices for main areas of the Barents Sea winter 2000 (numbers in millions). LUSUER. Akustiske mengdeindeksar for kvart hovudområde av Barentshavet vinteren 2000 (talet på fisk i millionar).
Område Lengdegruppe (cm) / Length group (cm) (Area) 10-14 15-19 20-24 25-29 >30 Total
A B C D D' E S
+ 7.9
- + - - -
19.7 24.9
+ 0.1
- - +
14.017.6
0.1+--
0.1
2.03.30.1
+--+
+0.5
-----
35.854.3
0.20.1
--
0.1ABCD 8.0 44.9 31.7 5.4 0.5 90.5Total 8.0 44.9 31.8 5.4 0.5 90.6
Table 8.6. SEBASTES VIVIPARUS. Abundance indices from acoustic surveys in the Barents Sea winter 1986-2000 (numbers in millions). 1986-1992 includes only the area covered in 1986. LUSUER. Mengdeindeksar frå akustiske undersøkingar i Barentshavet vinteren 1986-2000 (talet på fisk i millionar). 1986-1992 inkluderer berre området som vart dekka i 1986.
År Lengdegruppe (cm) / Length group (cm) (Year) 10-14 15-19 20-24 25-29 > 30 Total 1986 1987 1988 1989 1990 1991 1992 1993 1994 1995 1996 1997 1998 1999 2000
1 + 2 3 6
17 17 45 40
304 70 19 16
4 8
1 + 3 5
11 29 10 15 14 64 30 21 42
8 45
++35
1623
711
830271610
232
++1144341244115
+++0 ++10+++-++1
42
10143773387563
400132
61711591
8.2 Swept area estimation
The swept area time series for redfish (tables 8.9, 8.10 and 8.12) are based on catch data from trawls
with bobbins gear until 1988 inclusive, and rockhopper gear since 1989. The time series has not been
adjusted for this change.

61
Fig. 8.2 shows the horizontal distribution of bottom trawl catch rates of S. marinus during the swept
area investigation. The distribution is very similar to 1999. Table 8.7 presents swept area indices with
standard error for each main area in addition to the coefficient of variation for the total.
The time series for 1986-2000 (table 8.9), with adjusted indices for 1997 and 1998, shows historic low
indices for most of the length-groups, and the lowest total index ever observed. There are no signs of
improved recruitment.
76°
75°
74°
73°
72°
71°
70°
69°
68°
Area coveredDrift Iceborder
>100
1-99
34°14° 18° 22° 26° 30° 38° 42° 46° 50° 54° Figure 8.2. SEBASTES MARINUS. Distribution in the trawl catches winter 2000 (no. per hour trawling). VANLEG UER. Fordeling i trålfangstane vinteren 2000 (talet på fisk pr. tråltime). The mapping of the distribution of S. mentella is not complete in the north-western part of the surveyed
area due to this species’ extensive distribution further north in the Svalbard area, west and north of
Spitsbergen. The 2000 coverage was nevertheless more complete than before (fig. 8.3), and the low
abundance is therefore another confirmation of the poor stock condition.
Table 8.8 presents the swept area indices with corresponding standard errors for each main area in
addition to the coefficient of variation of the total.

Table 8.7. SEBASTES MARINUS. Abundance indices (I) at length with standard error of mean (S) from bottom trawl hauls for main areas of the Barents Sea winter 2000 (numbers in millions).
VANLEG UER. Mengdeindeksar (I) for lengdegrupper med standard feil (S) frå botntrålhal for kvart hovudområde av Barentshavet vinteren 2000 (talet på fisk i millionar).
Lengde Område (Area) (Length) A B C D D' E S Total
cm I S I S I S I S I S I S I S I S CV (%) 5-9
10-14 15-19 20-24 25-29 30-34 35-39 40-44 > 45
+0.1
+0.20.51.41.60.90.7
0 +
0.1 +
0.1 0.3 1.0 1.0 0.8
0 0.4 0.6 1.1 0.5 0.7 0.9 0.6 0.1
00.30.20.50.10.20.40.2
+
00.1
+0
0.10.50.40.10.1
00.1
+0
0.10.30.20.10.1
0.40.60.62.01.61.10.30.20.1
0.20.20.20.80.50.40.10.10.1
000
0.100000
0 0 0
0.1 0 0 0 0 0
0.10+
0.20.1
0+00
0.10+
0.10.1
0+00
0+
0.10.71.91.40.20.1
+
0+
0.10.20.80.80.1
++
0.51.11.54.24.75.03.51.81.2
0.20.30.31.01.01.41.10.50.3
36.8 30.4 20.4 23.3 21.8 27.9 30.8 28.8 25.0
Sum 5.5 1.6 4.9 0.8 1.3 0.4 6.9 1.1 0.1 0.1 0.5 0.2 4.5 1.2 23.5 2.4 10.2 Table 8.8. SEBASTES MENTELLA.1 Abundance indices (I) at length with standard error of mean (S) from bottom trawl hauls for main areas of the Barents Sea winter 2000
(numbers in millions). SNABELUER.1 Mengdeindeksar (I) for lengdegrupper med standard feil (S) frå botntrålhal for kvart hovudområde av Barentshavet vinteren 2000 (talet på fisk i millionar).
Lengde Område (Area) (Length) A B C D D' E S Total
cm I S I S I S I S I S I S I S I S CV (%) 5-9
10-14 15-19 20-24 25-29 30-34 35-39 40-44 > 45
3.24.8
21.446.293.766.316.8
5.91.2
0.8 1.2 5.2 9.7
20.4 20.4
8.0 4.9 1.1
0.1 0.2 0.2 1.1 1.6 3.2 2.7 0.3
+
0.10.10.21.01.02.12.50.2
+
0.21.10.23.32.35.00.80.30.1
0.10.50.11.81.11.90.30.1
+
3.15.34.7
11.84.53.00.4
00
0.60.81.22.81.71.80.2
00
000000000
0 0 0 0 0 0 0 0 0
0.90.91.20.2
00.1
000
0.60.40.80.2
00.1
000
1.60.5
11.614.239.719.5
5.90.40.3
0.80.32.93.0
11.26.82.30.20.3
9.012.739.476.8
141.997.126.6
6.91.5
1.41.66.1
10.823.421.8
8.75.01.3
15.7 12.7 15.5 14.0 16.5 22.4 32.6 71.8 86.5
Sum 259.4 32.3 9.4 3.5 13.3 2.9 32.8 4.1 0 0 3.2 1.1 93.8 13.9 411.8 35.7 8.7
1) Includes unidentified Sebastes specimens, mostly less than 15 cm. Inkluderer uidentifiserte Sebastes individer, for det meste mindre enn 15 cm.

Table 8.9. SEBASTES MARINUS. Abundance indices from bottom trawl surveys in the Barents Sea winter 1986-2000 (numbers in millions). 1986-1992 includes only main areas A, B, C and D.
VANLEG UER. Mengdeindeksar frå botntrålundersøkingar i Barentshavet vinteren 1986-2000 (talet på fisk i millionar). 1986-1992 inkluderer berre hovudområda A, B, C og D.
År Lengdegruppe (cm) / Length group (cm)
(Year) 5-9 10-14 15-19 20-24 25-29 30-34 35-39 40-44 > 45 Total 1986 1987 1988 1989 1990 1991 1992 1993 1994 1995 1996
3.0 7.7 1.0
48.7 9.2 4.2 1.8 0.1 0.7 0.6
+
11.7 12.7 5.6 4.9 5.3 13.6 3.9
1.2 6.5 5.0 0.7
26.4 32.8 5.5 4.3 6.5 8.4 7.7 3.5 9.3
13.1 3.5
34.3 7.7
14.211.8 9.4
19.420.6
6.911.711.5
6.4
17.7 6.4
12.615.915.518.019.710.311.5
9.19.4
21.0 3.4 7.3
12.214.016.113.714.519.415.911.7
12.8 3.8 5.2 6.6 8.0
14.810.512.5
9.117.216.6
4.4 3.8 4.1 4.8 4.0 6.0 6.68.64.4
10.97.9
2.6 4.2 3.7 3.0 3.4 4.0 5.8 6.3 2.8 4.7 3.9
134 83 59
114 75
105 9264758860
19971
19981 -
0.2 0.5 6.0
1.5 2.5
3.210.5
6.649.5
21.425.2
28.013.1
8.46.9
3.3 2.3
73116
1999 2000
0.2 0.5
0.9 1.1
2.1 1.5
4.04.2
4.64.7
6.45.0
6.03.5
5.31.8
3.3 1.2
3324
1) Indices raised to also represent the Russian EEZ. Indeksar oppjusterte til også å omfatta russisk sone.
The time series for 1986-2000, with adjusted indices for 1997 and 1998, is presented in table 8.10.
Similar to the acoustic abundance indices, the swept area indices for 2000 show that the abundance of
25 cm and larger S. mentella are at or above the 1993-1999 average, while the indices for smaller fish
are the lowest observed. The smaller the fish the less abundant it is. The index for S. mentella smaller
than 15 cm is only about 10% (!) of the 1993-1999 average. The future of the S. mentella stock is
relying on the survival of the last good year classes born in 1989-1990 before the recruitment collapse
in 1991. These year classes, at present about 30 cm, compose the bulk of the stock, and should be
protected as much as possible if we want to improve the recruitment to maintain a fishery on this
resource in the future.

64
76°
75°
74°
73°
72°
71°
70°
69°
68°
Area coveredDrift Iceborder
>1000
100-999
1-99
34°14° 18° 22° 26° 30° 38° 42° 46° 50° 54° Figure 8.3. SEBASTES MENTELLA. Distribution in the trawl catches winter 2000 (no. per hour trawling).
SNABELUER. Fordeling i trålfangstane vinteren 2000 (talet på fisk pr. tråltime). Table 8.10. SEBASTES MENTELLA.1 Abundance indices from bottom trawl surveys in the Barents Sea winter 1986-2000 (numbers in millions). 1986-1992 includes only main areas A, B, C and D. SNABELUER.1 Mengdeindeksar frå botntrålundersøkingar i Barentshavet vinteren 1986-2000 (talet på fisk i millionar). 1986-1992 inkluderer berre hovudområde A, B, C og D.
År Lengdegruppe (cm) / Length group (cm) (Year) 5-9 10-14 15-19 20-24 25-29 30-34 35-39 40-44 > 45 Total 1986 1987 1988 1989 1990 1991 1992 1993 1994 1995 1996
81.3 71.8
587.0 622.9 323.6 395.2 139.0
30.8 6.9
263.7 213.1
151.9 25.1 25.2 55.0
304.5 448.8 366.5 592.7 258.6
71.4 100.2
205.4 227.4 132.6 28.4 36.4 86.2
227.1 320.2 289.4 637.8 191.2
87.7 56.1
182.1177.1 55.9 38.9 34.6
116.3284.3505.8337.6
169.2 34.6 39.6 58.0 80.2 95.655.224.251.490.8
134.3
129.8 11.4 50.1 9.4
12.9 34.8 34.425.069.868.841.9
87.5 5.3
47.9 8.0
12.524.3
7.56.3
19.931.316.6
23.6 1.1 3.6 1.9 1.5 2.51.81.01.43.91.4
13.8 0.1 0.1 0.3 0.2 0.2 0.5
+ 0.1 0.5 0.3
951 433
1070 962 830
1123867
1117979
16741037
19972
19982 63.2
1.3 120.9
88.2 24.8 62.5
278.2101.0
271.8203.2
70.940.4
39.812.9
5.21.1
0.1 0.2
875511
1999 2000
2.2 9.0
6.8 12.7
68.2 39.4
36.876.8
167.4141.9
71.397.1
21.026.6
3.16.9
0.1 1.5
374412
1) Includes unidentified Sebastes specimens, mostly less than 15 cm. Inkluderer uidentifiserte Sebastes individer, for det meste mindre enn 15 cm. 2) Indices raised to also represent the Russian EEZ. Indeksar oppjusterte til også å omfatta russisk sone.
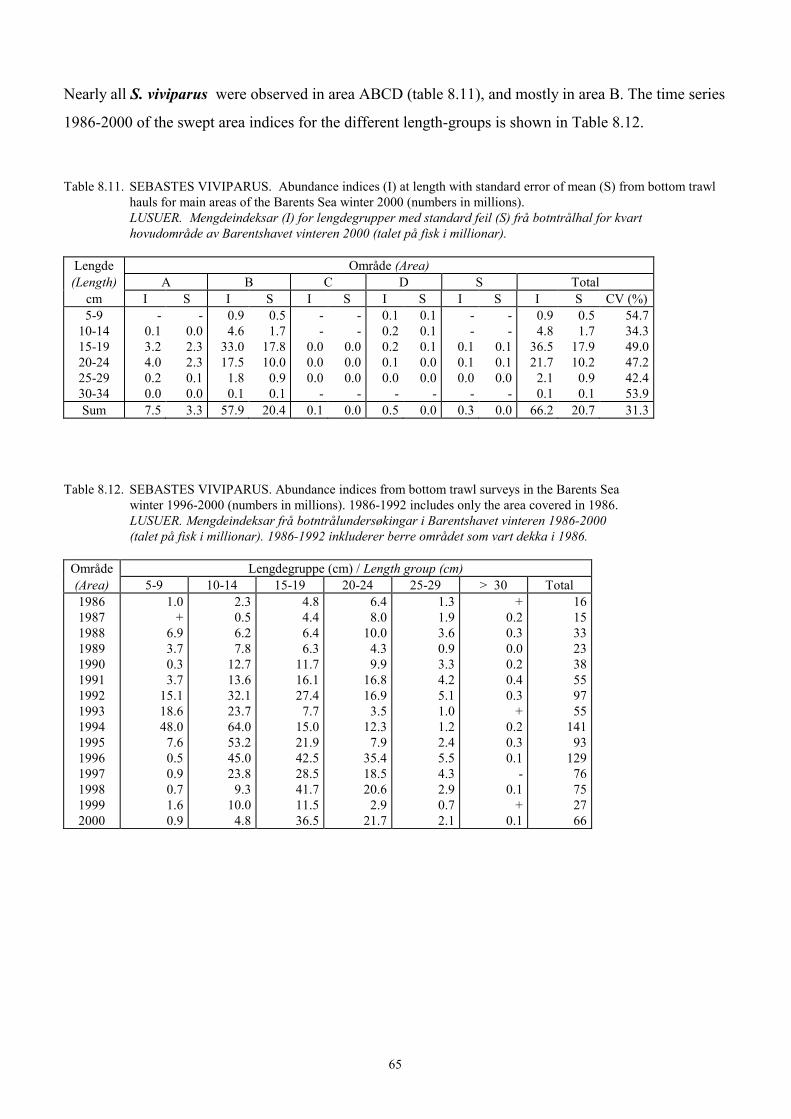
65
Nearly all S. viviparus were observed in area ABCD (table 8.11), and mostly in area B. The time series
1986-2000 of the swept area indices for the different length-groups is shown in Table 8.12.
Table 8.11. SEBASTES VIVIPARUS. Abundance indices (I) at length with standard error of mean (S) from bottom trawl
hauls for main areas of the Barents Sea winter 2000 (numbers in millions). LUSUER. Mengdeindeksar (I) for lengdegrupper med standard feil (S) frå botntrålhal for kvart hovudområde av Barentshavet vinteren 2000 (talet på fisk i millionar).
Lengde Område (Area) (Length) A B C D S Total
cm I S I S I S I S I S I S CV (%) 5-9
10-14 15-19 20-24 25-29 30-34
- 0.1 3.2 4.0 0.2 0.0
- 0.0 2.3 2.3 0.1 0.0
0.94.6
33.017.5
1.80.1
0.5 1.7
17.8 10.0
0.9 0.1
- -
0.0 0.0 0.0
-
--
0.00.00.0
-
0.10.20.20.10.0
-
0.10.10.10.00.0
-
--
0.10.10.0
-
--
0.10.10.0
-
0.94.8
36.521.7
2.10.1
0.5 1.7
17.9 10.2
0.9 0.1
54.7 34.3 49.0 47.2 42.4 53.9
Sum 7.5 3.3 57.9 20.4 0.1 0.0 0.5 0.0 0.3 0.0 66.2 20.7 31.3 Table 8.12. SEBASTES VIVIPARUS. Abundance indices from bottom trawl surveys in the Barents Sea winter 1996-2000 (numbers in millions). 1986-1992 includes only the area covered in 1986. LUSUER. Mengdeindeksar frå botntrålundersøkingar i Barentshavet vinteren 1986-2000 (talet på fisk i millionar). 1986-1992 inkluderer berre området som vart dekka i 1986.
Område Lengdegruppe (cm) / Length group (cm) (Area) 5-9 10-14 15-19 20-24 25-29 > 30 Total 1986 1987 1988 1989 1990 1991 1992 1993 1994 1995 1996 1997 1998 1999 2000
1.0 +
6.9 3.7 0.3 3.7
15.1 18.6 48.0
7.6 0.5 0.9 0.7 1.6 0.9
2.3 0.5 6.2 7.8
12.7 13.6 32.1 23.7 64.0 53.2 45.0 23.8
9.3 10.0
4.8
4.8 4.4 6.4 6.3
11.7 16.1 27.4
7.7 15.0 21.9 42.5 28.5 41.7 11.5 36.5
6.4 8.0
10.0 4.3 9.9
16.816.9
3.512.3
7.935.418.520.6
2.921.7
1.31.93.60.93.34.25.11.01.22.45.54.32.90.72.1
+0.20.30.00.20.40.3
+0.20.30.1
-0.1
+0.1
16 15 33 23 38 55 97 55
141 93
129 76 75 27 66

66
9. DISTRIBUTION AND ABUNDANCE OF GREENLAND HALIBUT
Fig. 9.1 shows the horizontal distribution of Greenland halibut in the swept area investigations.
Important parts of this species’ distribution, e.g., northern part of Svalbard and the continental slope,
are not covered by the survey. The distribution pattern was otherwise similar to the years before, i.e.,
mainly in the Bear Island channel towards the Hopen Deep.
Table 9.1 presents the swept area indices with corresponding standard errors for each main area in
addition to the coefficient of variation of the total.
The time series for 1990-2000, with indices adjusted for 1997 and 1998 the same way as for redfish
(i.e., the Svalbard area (S) included when extrapolating for the Russian EEZ), is presented in table 9.2.
About 75 % of the Greenland halibut survey catches are taken in the Norwegian EEZ and at Svalbard.
76°
75°
74°
73°
72°
71°
70°
69°
68°
Area coveredDrift Iceborder>100
1-99
34°14° 18° 22° 26° 30° 38° 42° 46° 50° 54° Figure 9.1. GREENLAND HALIBUT. Distribution in the trawl catches winter 2000 (no. per hour trawling).
BLÅKVEITE. Fordeling i trålfangstane vinteren 2000 (talet på fisk pr. tråltime).

Table 9.1. GREENLAND HALIBUT. Abundance indices (I) at length with standard error of mean (S) from bottom trawl hauls for main areas of the Barents Sea winter 2000 (numbers in thousands).
BLÅKVEITE. Mengdeindeksar (I) for lengdegrupper med standard feil (S) frå botntrålhal for kvart hovudområde av Barentshavet vinteren 2000 (i tusen). Lengde Område (Area) (Length) A B C D D' E S ABCD Total
cm I S I S I S I S I S I S I S I I S CV(%) 5-9
10-14 15-19 20-24 25-29 30-34 35-39 40-44 45-49 50-54 55-59 60-64 65-69 70-74 75-79 > 80
------
2379
302402334295
894633
-
------
2346
110178129118
514633
-
- - - - - - - - - -
57 19
- - - -
- - - - - - - - - -
41 19
- - - -
---------
459123
----
---------
457023
----
--
4120
148557179163328297283229
88-
42-
--
282082
18362679185847244
-30
-
----------------
----------------
--
122122284690
113633661710
406284243203
-41
-
--
88122244690927
2333898141144143
97-
41-
--
21182161
273239563
1115708393387155
--
--
21182161
101103158413328147181
86--
--
4120
148557202242630744765566177
4675
-
-122184322859
1753384121901599214317151163
564242
75-
-88
127245695947
2337908256481398226192106
44-
- 72 69 76 81 54 61 41 16 23 23 19 34 44 59
- Sum 1601 287 76 45 159 86 2373 283 - - 8604 2782 3956 625 4209 16769 2882 17
Table 9.2. GREENLAND HALIBUT. Abundance indices from the bottom trawl surveys in the Barents Sea winter 1990-2000 (numbers in thousands). 1990-1992 includes only main areas A, B, C and D. Indices for 1997 and 1998 are raised to also represent the Russian EEZ. BLÅKVEITE. Mengdeindeksar frå botntrålundersøkingar i Barentshavet vinteren 1990-2000 (talet på fisk i tusen). 1990-1992 inkluderer berre hovudområda A, B, C
og D. Indeksane for 1997 og 1998 er oppjusterte til også å omfatta russisk sone. År Lengdegruppe (cm) / Length group (cm)
(Year) <14 15-19 20-24 25-29 30-34 35-39 40-44 45-49 50-54 55-59 60-64 65-69 70-74 75-79 > 80 Total 1990 1991 1992 1993 1994 1995 1996
210
1400
423149
199 42 35
0 0 0 0
777 262
64 17 16
0 0
785618149
6799
00
1205655509265142
8361
1657868843959
1191149124
1829954
10962310262532281163
2043132010724004386692403969
1349 1875 1029 3374 2885 7438 4425
4791577
8271911179628111824
159847633
1247753
23361041
160165108482440909593
403431
13925
468346
403431
13925
46873
00
2634
00
12
10800 9270 6500
14840 13838 26761 16781
1997
1998 0
80 65
217 0
1006 0
444173532
227403
8581064
43443888
5500 6331
27252977
15451725
632633
282337
6676
2243
16439 19765
1999 41 82 261 427 576 264 757 1706 3069 1640 1077 483 109 74 28 10594 2000 122 184 322 859 1753 3841 2190 1599 2143 1715 1163 564 242 75 0 16769
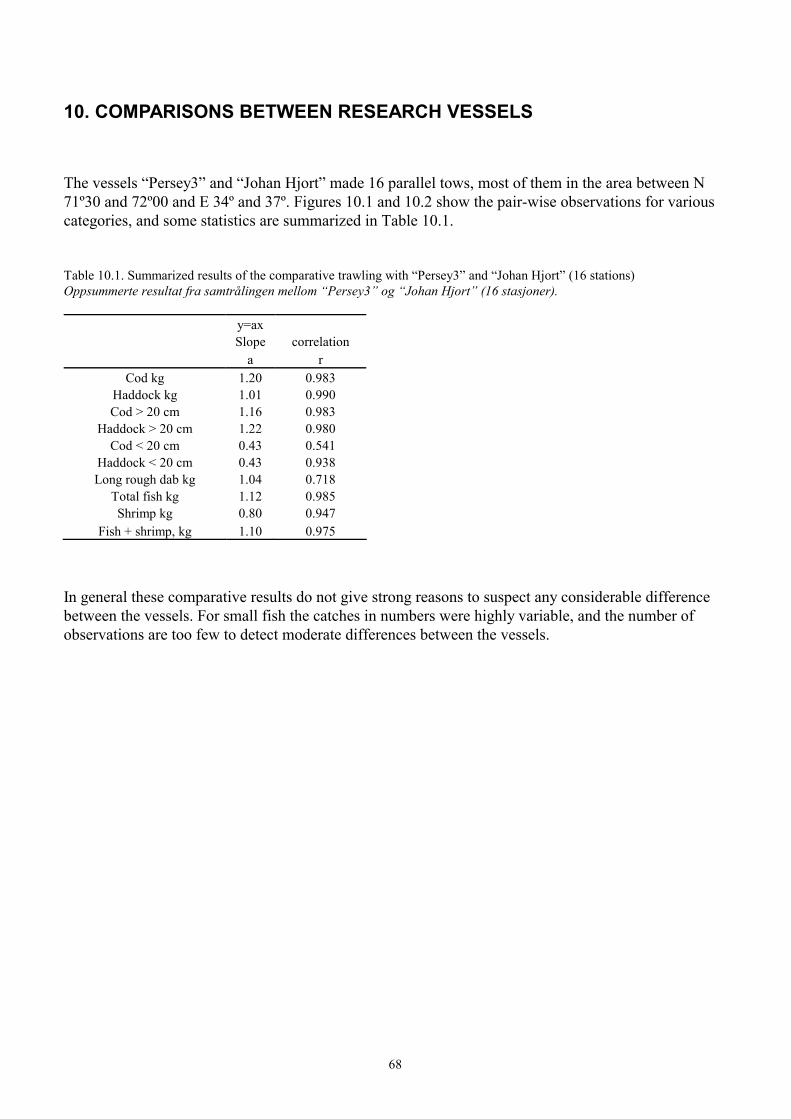
68
10. COMPARISONS BETWEEN RESEARCH VESSELS The vessels “Persey3” and “Johan Hjort” made 16 parallel tows, most of them in the area between N 71º30 and 72º00 and E 34º and 37º. Figures 10.1 and 10.2 show the pair-wise observations for various categories, and some statistics are summarized in Table 10.1. Table 10.1. Summarized results of the comparative trawling with “Persey3” and “Johan Hjort” (16 stations) Oppsummerte resultat fra samtrålingen mellom “Persey3” og “Johan Hjort” (16 stasjoner).
y=ax Slope correlation
a r Cod kg 1.20 0.983
Haddock kg 1.01 0.990 Cod > 20 cm 1.16 0.983
Haddock > 20 cm 1.22 0.980 Cod < 20 cm 0.43 0.541
Haddock < 20 cm 0.43 0.938 Long rough dab kg 1.04 0.718
Total fish kg 1.12 0.985 Shrimp kg 0.80 0.947
Fish + shrimp, kg 1.10 0.975 In general these comparative results do not give strong reasons to suspect any considerable difference between the vessels. For small fish the catches in numbers were highly variable, and the number of observations are too few to detect moderate differences between the vessels.

69
Figure 10.2. Comparison of catches of cod and haddock at parallel hauls. The two upper panels show catch in weight, the remaining show catch in numbers. Resultat av samtråling. De to øverste figurene viser fangst i vekt, de øvrige viser fangst i antall.
COD kg
0
100
200
300
400
0 100 200 300 400
Johan Hjort
Pers
ey3
COD>20CM
0
100
200
300
400
500
600
700
800
0 200 400 600 800
Johan Hjort
Pers
ey3
HADDOCK kg
0
50
100
150
0 50 100 150
Johan Hjort
Pers
ey3
HADDOCK>20CM
0
200
400
600
800
0 200 400 600 800
Johan Hjort
Pers
ey3
COD<20CM
0
20
40
60
0 20 40 60
Johan Hjort
Pers
ey3
HADDOCK<20CM
0
200
400
600
800
1000
1200
0 200 400 600 800 1000 1200
Johan Hjort
Pers
ey3

70
Figure 10.1. Comparison of catches (weight) at parallel hauls. Sammenlikning av fangster (i vekt) under samtråling. A further comparison was made by considering the total area of overlap between the Russian and the two Norwegian vessels during the survey. This overlapping area represents 28423 square nautical miles (within Main area D). In this area the Norwegian vessels had 54 bottom trawl hauls and the Russian vessel had 81. For comparison these estimates were based on a fishing width of 25m, independent of the fish length. The results for cod and haddock are shown by length groups and age in Figure 10.3 and Table 10.2. For cod the estimates by length are very similar, while the age distribution differs somewhat. For small haddock (less than about 30 cm) the Norwegian estimates are somewhat lower than the Russian. Close to the Russian coast the Norwegian vessels had fewer stations than the Russian vessel. This could explain some of the observed differences.
L.R. DAB kg
0
20
40
60
80
0 20 40 60 80
Johan Hjort
Pers
ey3
Total fish kg
0
200
400
600
0 200 400 600
Johan Hjort
Pers
ey3
SHRIMP kg
0
50
100
150
200
250
0 50 100 150 200 250
Johan Hjort
Pers
ey3
SHRIMP + FISH kg
0
200
400
600
0 200 400 600
Johan Hjort
Pers
ey3

71
Figure 10.3. Swept area estimates (referring to 25m fishing width, independent of fish length) for cod and haddock by Russian (Rus) and Norwegian (Nor) vessels in the overlapping area of coverage. Bunntrål-estimat (basert på 25m fiskebredde, uavhengig avfiskens lengde) for torsk og hyse for russisk (Rus) og norske (Nor) forskningsfartøy i felles deknings-område.
Cod
0
10
20
30
40
50
60
70
80
7.5
17.5
27.5
37.5
47.5
57.5
67.5
77.5
87.5
97.5
Length
Sw. a
rea
estim
ate
(mill
.) Nor Rus
Cod
0
20
40
60
80
100
120
1 2 3 4 5 6 7 8 9 10+
Age
Sw. a
rea
estim
ate
(mill
)
Nor Rus
Haddock
0
20
40
60
80
100
120
140
160
180
200
7.5
12.5
17.5
22.5
27.5
32.5
37.5
42.5
47.5
52.5
57.5
62.5
67.5
72.5
Length
Sw. a
rea
estim
ate
(mill
.)
Nor Rus
Haddock
0
50
100
150
200
250
300
350
1 2 3 4 5 6 7 8 9 10+
Age
Sw. a
rea
estim
ate
(mill
)Nor Rus

72
Table 10.2. Swept area estimates in millions (referring to 25m fishing width, independent of fish length) for cod and haddock from Russian (Rus) and Norwegian (Nor) vessels in the overlapping area of coverage. Bunntrålestimat i millioner (basert på 25m fiskebredde, uavhengig av fiskens lengde) for torsk og hyse for russisk (Rus) og norske (Nor) forskningsfartøy i felles dekningsområde. L-interval Cod Cod Haddock Haddock Cod Cod Haddock Haddockmidpoint Nor Rus Nor Rus Age Nor Rus Nor Rus
7.5 0.45 0.93 0.00 0.04 1 34.96 32.58 107.31 208.14 12.5 26.82 31.07 28.72 43.68 2 113.77 88.60 212.35 288.64 17.5 32.00 42.36 91.53 159.98 3 75.11 87.88 18.81 64.15 22.5 70.63 68.54 79.20 168.81 4 30.13 56.00 24.62 36.11 27.5 46.84 46.78 127.23 179.41 5 15.57 21.09 3.37 3.24 32.5 39.20 34.98 10.37 11.25 6 3.19 5.28 0.99 2.11 37.5 22.46 24.08 7.83 10.43 7 0.66 0.75 0.42 0.00 42.5 15.25 18.34 14.13 19.51 8 0.29 0.17 0.00 0.00 47.5 9.31 10.89 7.98 7.86 9 0.03 0.02 0.00 0.09 52.5 4.97 6.62 0.82 1.27 10+ 0.09 0.02 0.02 57.5 2.77 3.84 0.07 0.17 Total 273.79 292.39 367.90 602.48 62.5 1.28 2.33 0.02 0.04 67.5 1.00 0.82 0.00 0.00 72.5 0.40 0.55 0.00 0.02 77.5 0.21 0.08 82.5 0.06 0.13 87.5 0.02 0.02 92.5 0.10 0.00 97.5 0.02 0.00
102.5 0.03 0.02 Total 273.79 292.39 367.90 602.49
73
11. LITERATURE
Anon. 1998. Manual for bunnfiskundersøkelser i Barentshavet. Versjon 14.01.98. Seksjon Bunnfisk, Senter for Marine Ressurser, Havforskningsinstituttet. 7s. (upubl.).
Aglen, A. and Nakken, O. 1997. Improving time series of abundance indices applying new knowledge. Fisheries Research, 30: 17-26.
Bogstad, B., Fotland, Å. and Mehl, S. 1999. A revision of the abundance indices for cod and haddock from the Norwegian winter survey in the Barents Sea, 1983-1999. Working Document, ICES Arctic Fisheries Working Group, 23 August - 1 September 1999.
Dalen, J. and Nakken, O. 1983. On the application of the echo integration method. ICES CM 1983/B: 19, 30 pp.
Dalen, J. and Smedstad, O. 1979. Acoustic method for estimating absolute abundance of young cod and haddock in the Barents Sea. ICES CM 1979/G:51, 24pp.
Dalen, J. and Smedstad, O. 1983. Abundance estimation of demersal fish in the Barents Sea by an extended acoustic method. In Nakken, O. and S.C. Venema (eds.), Symposium on fisheries acoustics. Selected papers of the ICES/FAO Symposium on fisheries acoustics. Bergen, Norway, 21-24 June 1982. FAO Fish Rep., (300): 232-239.
Dickson, W. 1993a. Estimation of the capture efficiency of trawl gear. I: Development of a theoretical model. Fisheries Research 16: 239-253. Dickson, W. 1993b. Estimation of the capture efficiency of trawl gear. II: Testing a theoretical model. Fisheries
Research 16: 255-272. Engås, A. 1995. Trålmanual Campelen 1800. Versjon 1, 17. januar 1995, Havforskningsinstituttet, Bergen. 16 s.
(upubl.). Engås, A. and Ona, E. 1993. Experiences using the constraint technique on bottom trawl doors. ICES CM
1993/B:18, 10pp. Foote, K.G. 1987. Fish target strengths for use in echo integrator surveys. Journal of the
Acoustical Society of America, 82: 981-987. Fotland, Å., Borge, A., Gjøsæter, H., og Mjanger, H. 1997. Håndbok for prøvetaking av fisk og krepsdyr.
Versjon 3.14 januar 1997. Havforskningsinstituttet, Bergen. 145s. Godø, O.R. and Sunnanå, K. 1992. Size selection during trawl sampling of cod and
haddock and its effect on abundance indices at age. Fisheries Research, 13: 293-310. Jakobsen, T., Korsbrekke, K., Mehl, S. and Nakken, O. 1997. Norwegian combined acoustic
and bottom trawl surveys for demersal fish in the Barents Sea during winter. ICES CM 1997/Y: 17, 26 pp. Korsbrekke, K. 1996. Brukerveiledning for TOKT312 versjon 6.3. Intern program dok., Havforskningsinstituttet, september 1996. 20s. (upubl.). Korsbrekke, K., Mehl, S., Nakken, O. og Sunnanå, K. 1995. Bunnfiskundersøkelser i
Barentshavet vinteren 1995. Fisken og Havet nr. 13 - 1995, Havforskningsinstituttet, 86 s. Knudsen, H.P. 1990. The Bergen Echo Integrator: an introduction. - Journal du Conseil
International pour l’Exploration de la Mer, 47: 167-174. MacLennan, D.N. and Simmonds, E.J. 1991. Fisheries Acoustics. Chapman Hall, London, England. 336pp. Valdemarsen, J.W. and Misund, O. 1995. Trawl design and techniques used by norwegian research vessels to
sample fish in the pelagic zone. Pp. 135-144 in Hylen, A. (ed.): Precision and relevance of pre-recruit studies for fishery management related to fish stocks in the Barents Sea and adjacent waters. Proceedings of the sixth IMR-PINRO symposium, Bergen, 14-17 June 1994. Institute of Marine Research, Bergen, Norway. ISBN 82-7461-039-3.
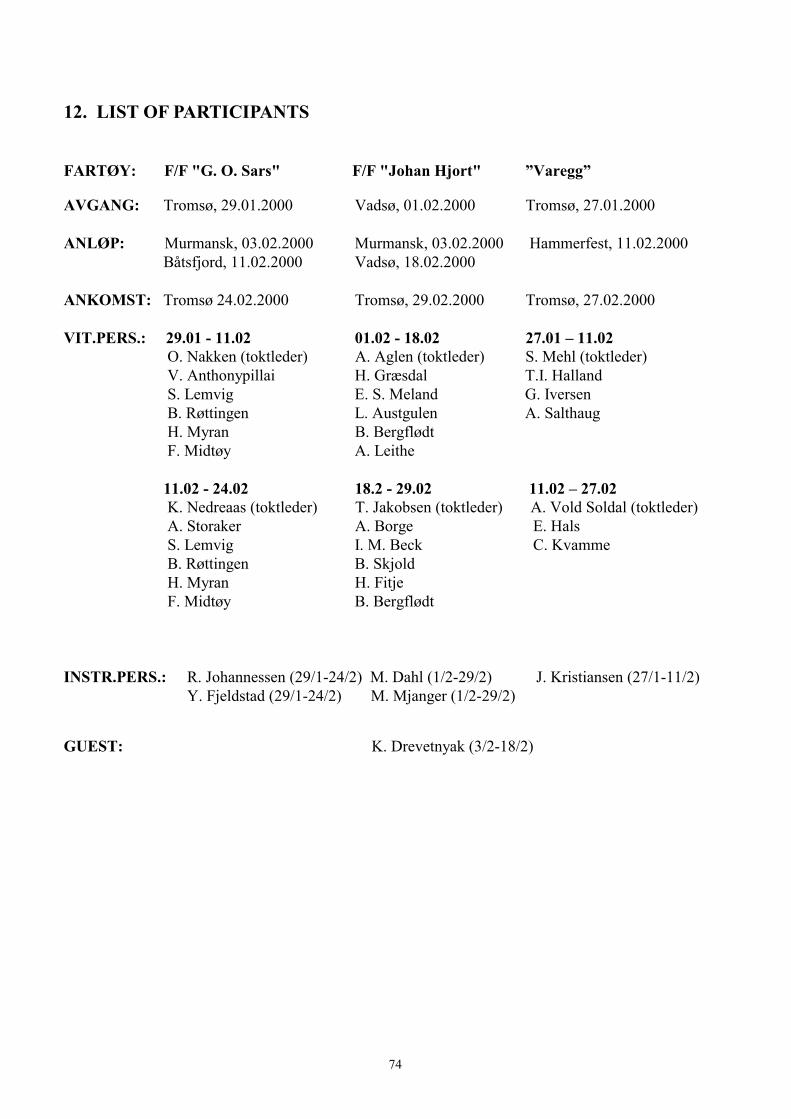
74
12. LIST OF PARTICIPANTS FARTØY: F/F "G. O. Sars" F/F "Johan Hjort" ”Varegg” AVGANG: Tromsø, 29.01.2000 Vadsø, 01.02.2000 Tromsø, 27.01.2000 ANLØP: Murmansk, 03.02.2000 Murmansk, 03.02.2000 Hammerfest, 11.02.2000 Båtsfjord, 11.02.2000 Vadsø, 18.02.2000 ANKOMST: Tromsø 24.02.2000 Tromsø, 29.02.2000 Tromsø, 27.02.2000 VIT.PERS.: 29.01 - 11.02 01.02 - 18.02 27.01 – 11.02 O. Nakken (toktleder) A. Aglen (toktleder) S. Mehl (toktleder) V. Anthonypillai H. Græsdal T.I. Halland S. Lemvig E. S. Meland G. Iversen B. Røttingen L. Austgulen A. Salthaug H. Myran B. Bergflødt F. Midtøy A. Leithe 11.02 - 24.02 18.2 - 29.02 11.02 – 27.02 K. Nedreaas (toktleder) T. Jakobsen (toktleder) A. Vold Soldal (toktleder) A. Storaker A. Borge E. Hals S. Lemvig I. M. Beck C. Kvamme B. Røttingen B. Skjold H. Myran H. Fitje F. Midtøy B. Bergflødt INSTR.PERS.: R. Johannessen (29/1-24/2) M. Dahl (1/2-29/2) J. Kristiansen (27/1-11/2) Y. Fjeldstad (29/1-24/2) M. Mjanger (1/2-29/2) GUEST: K. Drevetnyak (3/2-18/2)

IMR/PINRO Joint Report Series 2001
No. 1 Anon. 2001. Survey report from the joint Norwegian/Russian acoustic survey of
pelagic fish in the Barents Sea, September – October 2000. IMR/PINRO Joint Report Series. No. 1/2001. ISSN 1502-8828. 30 pp.
No. 2
Anon. 2001. Report of the international 0-group fish survey in the Barents Sea and adjacent waters in August – September 1998. IMR/PINRO Joint Report Series. No.
2/2001. ISSN 1502-8828. 26 pp.
No. 3 Anon. 2001. Report of the international 0-group fish survey in the Barents Sea and adjacent waters in August – September 1999. IMR/PINRO Joint Report Series. No.
3/2001. ISSN 1502-8828. 26 pp.
No. 4 Anon. 2001. Report of the international 0-group fish survey in the Barents Sea and adjacent waters in August – September 2000. IMR/PINRO Joint Report Series. No.
4/2001. ISSN 1502-8828. 26 pp.

Institute ofMarine Research
Nordnesgaten 50,5817 Bergen
Norway
Polar ResearchInstitute of MarineFisheries and Oceano-graphy (PINRO)6 Knipovich Street,183763 MurmanskRussia