Investigation on KTP performance as active element for the...
110
Republic of Iraq Ministry of Higher Education And Scientific Research Al-Qadisiyah University College of Education Department of Physics Investigation on KTP performance as active element for the optical limiting and harmonic generation at IR-Vis.lasers A Thesis Submitted to the Deanery of College of Education at Al- Qadisiyah University in Partial Fulfillment of the certificate of M. Sc. Science in Physics by Manar Lilo Dayekh B.Sc. in Physics Supervised By Prof. Dr. Raad Shaker. Alnayli 2017 A.D. 1439A.H.
Transcript of Investigation on KTP performance as active element for the...

Republic of Iraq
Ministry of Higher Education
And Scientific Research
Al-Qadisiyah University
College of Education
Department of Physics
Investigation on KTP performance as
active element for the optical limiting and
harmonic generation at IR-Vis.lasers
A Thesis
Submitted to the Deanery of College of Education at
Al- Qadisiyah University in Partial Fulfillment of the
certificate of M. Sc. Science in Physics
by
Manar Lilo Dayekh B.Sc. in Physics
Supervised By
Prof. Dr. Raad Shaker. Alnayli
2017 A.D. 1439A.H.

يزفع الله الذيه آمنوا منكم والذيه أوتوا العلم ﴿
﴾درجات والله بما تعملون خبري
( 11اآلية )جزء من سورة المجادلة

Dedication
To the great teacher of humanity prophet Muhammad
(pbuh).
To my lady Fatima Al-Zahraa (peace be on her).
To the martyrs of Popular Mobilization.
To My family who stood by me and helped me reaching
this stage.
To my brother Ali for his help.
Manar

Acknowledgment
Praise be to Allah, the Lord of all mankind and pray and peace on his propel
Mohammed and his household.
I would like to thank and appreciation to almighty God on the Completion
of thesis. I would like to thank and gratitude to the Supervisor (prof. Dr. Raad
Sh. Alnaily) for his valuable a device and guidance to achieve this research and
prepare my thesis.
Also thanks are due to the denary college of Education and all physics
Department Staff.
Thanks are due to Prof. Dr. Fadhil I. Sharrad, the head department of
Physics at the college of Science, Karbala University. Special thanks for Prof
.Dr. Khawla Jameel Tahir.
I extend my thanks and gratitude to my family, who bore the burden of study
and the difficulty of continuing to complete the research


I
Abstract
The present study is related with our extensive study of the linear optical,
the nonlinear optical properties, the optical power limiting effect and second
harmonic generation for KTP crystal as an active element which has a
dimension of 6х6х3 mm3 by using Nd:YAG with the continuous wave (CW)at
wavelength 1064 nm and double frequency 532 nmwith two powers 25 and 80
mW respectively.
The linear absorption and transmittance spectra of KTP crystal were
analyzed by using an advice (UV-VIS spectrophotometer). The measurement
shows that the crystal has a high transmission reached to 88% with the
wavelength 1095 nm and estimated the optical constant. Also the direct
forbidden optical energy gap, was found 3.8 eV.
The properties of nonlinear optics for KTP crystal had been studied by
using the Z-scan technique and laser Nd: YAG of a continuous wave (CW). The
nonlinear refraction index has been determined by using a close aperture of z-
scan method and its magnitude was 3.59 10-14
cm2/mW, 3.35 10
-14 and
3.67
10-14
cm2/mW. While the nonlinear absorption coefficient was calculated using
the open aperture z-scan method were 2.71 10-3
cm/mW, 4.32 10-3
and 4.37
10-3
cm/mW.
The experimental results and the theoretical calculation, proved that
potassium Titanyl Phosphate KTP crystal has a negative refraction index (self –
defocusing), and the nonlinear absorption coefficient is established two photon
absorption.
Also, the study of optical limiter for this KTP crystal by using the laser
beam Z-scan technique and Nd: YAG CW double frequency 532nm for variable
powers of (10-85) mW and good optical properties were obtained. The threshold
powers limiting was 60mW.

II
The results that obtained showed that KTP crystal occurs a large nonlinear
optical effects that makes it to be a good materials in the applications of the
nonlinear optical devices and optical power limiting.
The ability for producing second harmonic generation of Nd: YAG CW at
power of 35mW.The efficiency conversion about 13% generate green
wavelength. KTP crystal is very satisfying for this type nonlinear phenomenon.

III
List of Abbreviations
Meaning
Abbreviation
Nonlinear Optics NLO
Second Harmonic Generation SHG
Sum Frequency Generation SFG
Different Frequency Generation DFG
Optical Parametric Generation OPG
Optical Parametric Oscillation OPO
Quasi-Phase Matching QPM
Third Harmonic Generation THG
High Harmonic Generation HHG
X-ray Diffrectometer XRD
Ultra –Violate UV
Potassium Titanyl Phosphate KTP
β-Barium Borate β-BaB2O4
Lithium Tribute Li3BO5
Potassium Titanyl Arsenate KTA
Rubidium Titanyl Arsenate RTA
Rubidium Titanyl Phosphate RTP
Cesium Titanyl Arsenate CTA
Noncritical Phase Matching NCPM
Close Aperture CA
Two Photon Absorption TPA
Reverse Saturable Absorption RSA RA,
Optical Limiting OL
Free-Carrier Absorption FCA
Continuous Wave CW
Laser Power Meter LPM

IV
List of Symbols
Unit Definition
Symbol
- The Transmittance T
- The Absorbance A
- The Reflectance R
- The intensity refractive light IR
- The Extinction Coefficient k
- The optical Energy Gap Eg
- The Refractive Index of the material n
eV The Energy Photon hυ
S-1
The Optical Conductivity σ
Coul./m2
The Polarization of the material Р
V/m The electric field strength E
F/m The Permittivity of the Vacuum ϵ˳
- The electric Susceptibility of the
medium
χ
- The linear Susceptibility χ1
- The Second nonlinear Susceptibility 2
χ
- The Third nonlinear Susceptibility χ3
- The number density of dipole moments N
- The individual dipole moment ρ
mw The Power of Laser beam p
m The Effective Area of beam cross
section A
mm The beam radius at focal point ɷ
Pm/v The Nonlinear Coefficient deff
mW/cm2
The Intensity of the laser beam at the
focus
I
mm Crystal length L
mW/cm2
Incident Power beam harmonic
generation
pw
mW/cm2
Output power Second harmonic
generation
P2w
- The Phase matching ΔK
μm The coherence length Lc
V
m/s The speed of Light c
rad The angular Frequency ɷ
m-1
The wavenumber k
mm-1
The wave vector of the fundamental
beam
Kw
mm-1
The wave vector of the second
harmonic beam
K2w
mm-1
The wave vector of the Third harmonic
beam
K3w
mW/cm2
The Intensity of the input beam at
frequency ɷ
Iɷ
mW/cm2
The Intensity of Second Harmonic
Generation
I2ɷ
mW/cm2
The Intensity of Third Harmonic
Generation
I3ɷ
- The harmonics order q
mm Rayleigh length z˳
nm Wavelength λ
mm The position was obtained by moving
the samples along the axes of the
incident beam (z-direction )with respect
to the focal point
z
- Normalized crystal transmittance when
mentioned at the position of maximum
transmittance peak
Tp
- Normalized crystal transmittance when
mentioned at the position of minimum
transmittance valley
Tv
mW The Difference between the normalized
peak and valley transmittance
ΔTp-v
rad The variation of phase shift ΔΦ˳
cm The effective thickness of the crystal Leff
cm The thickness of the crystal t
mW The one peak value at the open aperture
Z-scan curve
ΔT
cm/mW The nonlinear Absorption Coefficient β
cm-1
The Linear Absorption Coefficient α

VI
m2kg/s The Plank constant һ
Hz The frequency υ
- The number of molecules per unit area
in the ground state
N
sec The decay time τ
- The cross section for the absorption σ
- The intensity propagation Nc
- The free carrier absorption σc
- The effective Nonlinear refraction
Index
Neff
- The effective carrier mass M*
- The change in the index due to
population of excited states
σr
- The Conversion efficiency of Second
Harmonic Generation
ηSHG

VII
List of Figures
Page Title
No.
11 The main regions of optical absorption edge 2-1
13 Types of Electronic Transition 2-2
14 The - E relation for (a) a linear dielectric
medium, and (b) a nonlinear medium
2-3
16 Geometry of second –harmonic generation. (b)
Energy –level diagram describing second –
harmonic generation
2-4
18 second harmonic output intensity vs. Δk 2-5
19 Frequency conversion processes 2-6
21 The condition phase matching 2-7
23 Geometry of Third –harmonic generation. (b)
Energy –level diagram describing second –
harmonic generation
2-8
24 HHG spectrum 2-9
62 nonlinear absorption Two-photon Absorption 2-10
27 The Z-scan experimental arrangement 2-11
29 Graph of propagation of focused intense
radiation through a nonlinear self –focusing
medium for a sample placed a in front of the
focus and b behind it.
2-12
30 Normalized transmittance in the closed aperture
graph for the media with the positive (solid
curve) and negative (dashed curve) nonlinear
refractive indices
2-13
31 forms of Z-scan technique open aperture,
(a).Tow photon absorption, (b). Saturated
absorption
2-14
33 Idea of ideal optical limiting 2-15
39 Characteristics of an optical limiter (a) Ideal
optical limiter (b) realistic optical limiter,
repotted form
2-16
41 the KTP crystal structure 2-17
VIII
42 Transmission for KTP crystal 2-18
44 pumped at 532nm 2-19
44 Type II KTP crystal NCPM OPO 2-20
47 UV-Visible Spectrophotometer 3-1
49 The (KTiOPO3) crystal 6*6*3mm3
3-2
05 The Z-scan technique set –up experimental in
532nm
3-3
01 Picture of the Z-scan set –up experimental
L: Lens, C: Crystal, A: aperture, D: detector,
M: mirror
3-4
06 set –up of Optical Limiting for (KTiOPo3)
crystal
3-5
06 The set – up of Optical Limiting for
(KTiOPO3)
3-6
53 Atypical configuration for second harmonic
generation.
3-7
05 The set-up of SHG measurements at
wavelength 1064nm
3-8
04 Crystal thickness tilts using bevel protractor. 3-9
02 The Absorbance versus wavelength for
KTiOPO3
4-1
57 The Transmittance versus wavelength for
KTiOPO3
4-2
58 Reflectance spectra for KTiPO3 4-3
59 Absorption coefficient versus photon energy 4-4
59 Refractive index variation of photon energy 4-5
60 Extinction coefficient versus incident photon
energy
4-6
61 The variation of the (αһν)3/2
with the incident
photon energy
4-7
61 The optical conductivity versus the wavelength 4-8
62 The refractive index on the wavelength 4-9
63 Dependence of reflectance on the angle of
incident
4-10
IX
65 The transmittance curve as a function of
position for the crystal at wavelength 1064nm
with power 35mW. (a) The transmittance curve
when the close aperture (b) the when the open
aperture. (c) The transmittance curves that
resulted from the division the transmittance
curve for the close aperture to transmittance
curve for open
4-11
66 The transmittance curve as a function of
position for the crystal at wavelength 532nm
with power 80mW. (a) The transmittance curve
when the close aperture (b) the transmittance
curve when the open aperture. (c) The
transmittance curves that resulted from the
division the transmittance curve for the close
aperture to transmittance curve for open
4-12
67 The transmittance curve as a function of
position for the crystal at wavelength 532nm
with power 25mW. (a) The transmittance curve
when the close aperture (b) the transmittance
curve when the open aperture. (c) The
transmittance curves that resulted from the
division the transmittance curve for the close to
transmittance curve for open.
4-13
69 nonlinear absorption a function to the
wavelength
4-14
70 The Optical Limiting for KTP crystal in
wavelength 532nm at power 85mW.
4-15
70 the transmittance curve via input power for
KTP crystal
4-16
71 Harmonic generation output intensity versus
incident angle
4-17

X
List of Table
Page Table
No.
42 Characterization of Nd: YAG laser 3-1
47 Specifications for KTP Crystal 3-2
53 Chemical, Structure, Linear and
Nonlinear Optical Properties of
KTiOPO3 crystal
3-3
54 Chemical, Structure, Linear and
Nonlinear Optical Properties of
KTiOPO4 crystal
3-4
26 Linear optical properties for Potassium
Titanyl Phosphate (KTiPO3)
4-1
26 The results of nonlinear optical
properties for KTiOPO3 crystal by Z-
scan technique.
4-2
71 The value of the power-limiting
threshold.
4-3
72 The efficiency of Second Harmonic
Generation
4-4

Contents
Page Contents
I Abstract
III List of Abbreviations
VI List of Symbols
VII List of Figures
X List of Tables
List of Contents
Page Subject
Section
Chapter One :Introduction and Previous Works
1 Introduction to Nonlinear Optics 1.1
3 Nonlinear Optical Materials 1.2
4 Literature Survey 1.3
8 Aims of the Study 1.4
Chapter Two : Theoretical Part
9 Introduction 2.1
9 Linear Optical Properties 2.2
10 Optical Constants 2.2.1
11 Optical Absorption Edge 2.2.2
12 Electronics Transitions 2.2.3
13 Optical Energy Gap 2.2.4
13 Optical Conductivity 2.2.5
14 The Basic of Nonlinear Optics 2.3
16 Second Harmonic Generation 2.4
18 Frequency Conversion 2.4.1
19 Optical Parametric Oscillator 2.4.2
19 Phase Matching 2.4.3
21 Quasi- Phase matching 2.4.4
21 Third Harmonic Generation 2.5

23 High Harmonic Generation 2.6
24 The nonlinear Absorption and nonlinear
Refraction Index
2.7
25 Saturable Absorption 2.7.1
25 Two Photon Absorption 2.7.2
26 The self –focusing and self –defocusing 2.8
27 Z-Scan Technique 2.9
28 Close Aperture Z-Scan 2.9.1
30 Open Aperture Z-Scan 2.9.2
32 Optical Limiting 2.10
33 Mechanisms Types of Optical Limiting 2.10.1
34 The effect of Nonlinear Absorption in OL 2.10.2
35 Two Photon Absorption 2.10.2.1
35 Reverse Saturable Absorption 2.10.2.2
36 Free Carrier Absorption 2.10.2.3
36 The Effect of Nonlinear Refraction in OL 2.10.3
37 Nonlinear Scattering 2.10.4
38 The Comparison ideal Optical Limiter
and realistic Optical Limiter
2.10.5
39 Main Characteristics of Potassium Titanyl
Phosphate Crystal
2.11
40 Growth Crystal 2.11.1
41 Structure Crystal 2.11.2
42 Potassium Titanyl Phosphate KTiOPO3
(KTP) crystal
2.11.3
42 Application for SHG and SFG of Nd :
Lasers
2.11.4
43 Application for OPG, OPA and OPO
2.11.5
Chapter Three : Experimental Part 45 Introduction 3.1
45 Spectrophotometer 3.2
46 Nd:yag CW Laser 3.3
46 The Detector 3.4
46 Potassium Titanyl Phosphate Crystal 3.5
48 Z- Scan Technique Experimental 3.6

49 Optical Limiting Set up 3.7
51 Second Harmonic Generation Set- up 3.8
Chapter Four :The result and Discussion
55 Introduction 4.1
55 Optical Properties for Potassium Titanyl
Phosphate
4.2
55 Linear Optical properties 4.2.1
56 Absorbance 4.2.1.1
57 Transmittance 4.2.1.2
58 Reflection 4.2.1.3
58 Absorption Coefficient 4.2.1.4
59 Refraction Index 4.2.1.5
60 Extinction Coefficient 4.2.1.6
60 The Band Gap Energy 4.2.1.7
61 Optical Conductivity 4.2.1.8
62 Linear Optical Properties Theoretically 4.2.2
64 Nonlinear Optical Properties 4.2.3
69 Optical Power Limiting 4.3
71 The Intensity of Second Harmonic
Generation SHG
4.4
73 Conclusion 4.5
74 The Future Works 6.4
83 - 75 References

Chapter One INTRODUCTION AND PREVIOUS WORKS

Chapter One Introduction
1
1.1 Introduction to Nonlinear Optics
Nonlinear optics is the study of phenomena that occurs as a consequence of
the modification of the optical properties of a material system by the presence of
light. Typically , only laser light is sufficiently intense to modify the optical
properties of material system .The beginning of the field of nonlinear optics is
often taken to be the discovery of second harmonic generation by Franken et al
(1961) [1]. The theory of nonlinear optics builds on the well-understood theory
of linear optics .Particularly that part is known as the interaction of light and
matter. Ordinary matter consisted of a collection of positively charged cores (of
atoms or molecules) and surrounding negatively charged electrons. Light
interacts primarily with matter via the valence electrons in the outer shells of
electron orbitals. The fundamental parameter in this light-matter interaction
theory is the electronic polarization of the material induced by light [2].
The discovery of the nonlinear phenomena was the important; the second
Harmonic Generation in Quartz crystal at pumping in Ruby laser beam, by
Franken et al after a short period of laser discovery [3], great role in initiating a
new branch of science is the nonlinear optics. This branch gets into experimental
scientific field firmly, interaction of laser beam with matter, it is grew and
developed hastily .Many researchers studied the effects and nonlinear
phenomenon which contributed to discover many of physical phenomena [1, 2,
4]. The field of nonlinear optics became important by researchers since that time
for both theoretical and practical .Then the study this .Phenomenon has been
extended to include many of scientific fields like physics, chemistry, biology
and engineering et al [5, 6].
The study of nonlinear optics can led to increase for knowing the basic
concepts to nonlinear optical with the discovery the properties of the nonlinear
different material. Thus it could be worked to improve it , developed so that it

Chapter One Introduction
2
could be suit with the practical applications in the various different technical
,like the optical communications ,the optical data store ,the optical power
limiting , the optical switchers and Opt-electronic and photonic devices… etc.
[4,7,8].
From the practical side, there are two types of nonlinear effects, the first
relates by frequency conversion, whereas the second relates by optical
modulation. Generation new frequencies from the interaction of laser beam with
nonlinear matter, as the optical harmonic generation or Sum or difference -
frequency -generation for incident beam on the medium and four-wave mixing
are example for frequency conversion. While the electro-optic effect (Kerr
effect), self-phase modulation, self-focusing and induced absorption saturation
are example for optical modulation process [9, 10].
Generating new frequencies at the interaction of the electromagnetic
radiation with nonlinear materials. It prescribed to Induced nonlinear
polarization from the electromagnetic radiation at its interaction with the
material in a suitable frequency. In the optical frequency modulation process,
the laser beam work to module and develop the optical properties for material
medium such as absorption coefficient and refraction index.
The typical properties for laser beam contributed more in growth and
development the field of nonlinear optics. High intensity and width of narrow
broading spectra with the coherence of radiation as well as to the good
directional to laser beam that allows in its focusing to the smallest possible
point, all make the possibility of observation the nonlinear optical phenomenon
that comes out of interaction these beams with the nonlinear material more
easily. It is difficult to achieve this at the interaction of the sources of normal
light non coherence of low intensity with matter, The properties of materials
stay, such as the absorption coefficient and refraction index, don’t effected
highly in this low intensity to the incident radiations on it because there is no

Chapter One Introduction
3
effect for the atomic fields for matter. This is what happened in the processes
that are known as linear optics, such as reflection, refraction and linear
absorption. From practical aspect, it is possible to notice some of the effect of
nonlinear optics at low intensities, for laser beam when there is increase for
optical effect. If the induced dipoles vibration in the material medium at a
coherent method there will be phase matching, the electromagnetic fields that
portaged can be added to each other to produce a large intensity that operates on
increments the nonlinear effects, if the incident light frequency on the matter
suit with the effect frequency of ringing of oscillating dipoles, and multi photons
processes are example for this case [11,2].
The search on nonlinear new materials are able to appear nonlinear response,
improve, and develop these materials for practical uses is the most important
duty in the field of nonlinear optics. This duty demands new understanding to
the nature of these materials and huge study for its optical factors that has a role
in the effect of its nonlinear behavior.
1.2 Nonlinear Optical Materials
It is well know from the nonlinear optics are interacted with the incident
light radiation on it and generated a nonlinear response by polarization material
for electric field for this radiation.
Generally, the materials are classified in to two kinds, Organic material and
Inorganic material [5, 12, 13]. Organic nonlinear optic material meets large
attention because of the need to obtain the necessary information to optical
communication technique and photonic device. It is low cost, has optical
properties, and can be adopted whereas nonlinear optical Inorganic are well
know because this has mechanical stability and good chemical. In addition, they
have large nonlinear optical properties such as Lithium niobate (LiNbO3),

Chapter One Introduction
4
Potassium dihydrogen Phosphate (KH2PO4), Gallium Arsenide (GaAs) and
Potassium Titanyl Phosphate (KTP).
The focus in this study is on Potassium Titanyl Phosphate (KTiOPO3 or KTP)
crystal, which is considered as a type of crystal that draws attention due to the
nonlinear optical properties that give us good results since it represents as an
active element in application of nonlinear optical properties, optical power
limiter and second harmonic generation[14].
1.3 Literature Survey
Many researches and studies for Potassium Titanyl Phosphate (KTP) that
includes the types KTiOPO4, KTiOPO3, and KTiOPO7 crystal were done for
what it has features and properties in the aspect of optical device and nonlinear
optics. Most of the studies were on the type of KTiOPO4.these studies and
researches were:
John. D.Bierlein, et al (1989), [15]. The researcher has done in a study
structure and crystal growth of KTP and its nonlinear and nonlinear optics,
SHG, OPO, phase matching, optical electric and wave-guide. found that
important material for SHG of Nd:YAG and other Nd:YAG doped laser and has
been shown to have attractive properties SUM-Difference ,OPO.it also has large
electro-optic cofficiencey mixing and low dielectric constant that make it
potentially useful and for integrated optics application high optical damage.
P.A. Thomas, et al (1990), [16]. Notes proof the results demonstrate further
proof that the short Ti-O bonds in KTP are the important structural features
leading to the high optical nonlinear of KTP.
R.Desalvo, D.J.Hagan, et al (1992), [17]. Studied phase change produced
by a cascaded x(2)
: x(2)
process in KTP near the phase matching angle on a
picosecond 1.64μm wavelength beam using the Z-scan technique .this nonlinear

Chapter One Introduction
5
refraction is observed to change sign as the crystal is rotated through the phase
match angle in accordance with theory. Theory predicts the maximum small –
signal effective nonlinear refractive index for an
angle detuning of from phase match for this 1mm this crystal with measured
deff of 3.1pm/v . For affixed phase mismatch, this n2eff
scales linearly with
length and as deff; however, for the maximum n2eff
the nonlinear phase distortion
becomes sublinear with irradiance for phase shifts near π/4.
D.S. Armstrong, et al (1996), [18]. Measured absolute magnitudes of the
effect nonlinearity deff for seven KTP crystals. The deff derived from the
parametric again of an 800nm signal wave in the sample crystals when were
pumped by the frequency doubled, particularly filtered light from an injection
seeded, the KTP crystal all type II phase-matched with propagation in the x-z
plane, had deff values ranging from 1.97 to 3.50 pm/v. Measurements of gain as
a function of phase velocity mismatch indicates that two of the KTP crystals
clearly contain multiply ferroelectric domains. The uncertainly in our
measurements of deff values is +5% for KTP. Through the study Q- switching
results demonstrated that KTP can have widely varying values of deff.
Hiromitsu. Kiriyama et al (2000), [19]. The researcher developed an
efficient four –pass quadrature frequency conversion Scheme. A high
conversion efficiency in excess of 80% has been achieved for frequency
doubling of 1064nm in KTP with a low fundamental laser intensity of 76μw/cm2
a second harmonic output of 486mJwith 607mJ of the input 1064nm
fundamental laser at 10 Hz.
H.P.Li, C.H.Kam, et al (2001), [20]. Investigated of third order optical
nonlinearity in KTP crystal using the z- scan technique with 780nm femto
second, and determined the nonlinear refraction index n2 in KTP crystal is
1.2x10⁻¹⁵
cm2/w it is found that the measured n2 values in KTP crystal is constant
Chapter One Introduction
6
with the theoretical predication based on the two band models for the bound
electronic career nonlinearity. From the open aperture, they have not observed
no photon absorption because the band gap energy of KTP crystal that was
measured (3.6) eV is greater than the energy of two 780nm photons. In addition,
they found results show the nonlinear refraction KTP is dependent of the
polarization of the laser beam.
Sebastin. Favre, et al (2003),[21]. Presented the results and analysis of
SHG with a free-running Nd: yag slap laser and KTP crystal. The SHG
efficiency is in flounced by the pulse width in this regime, a sub linear
increased with laser intensity is observed at high intensity with respect to the
ideal phase-matched case and the total power conversion is ultimately limited by
catastrophic damage at the output fact . The second efficiency loses towards the
end of the laser pulses and the sublinear behavior of the generated SHG intensity
peak power of 146w at conversion efficiency of 14.6% and achieved for 15mm
long KTP crystal.
E.MB, et al (2009), [22]. The studied optical transmission showed the
incorporation of more defects into the KTP crystals. That grown by spontaneous
nucleation that was also confirmed by micro morphological studies.
Akchav .Dhavdhry, et al (2009), [23]. Reports the measurement of
refraction indices using thin plate using reflection elliposmetry a KTP crystal at
different wavelength of lasers technique, and compered with different existing
theoretical and experimental values of KTP and found to be in good agreement
with them.
Ali. Hussain. Reshak, et al ,(2010), [24]. They have performed calculations
of the linear optical properties of potassium Titanyl phosphate KTiOPO4 (KTP)
using the state-of-the-art FP-LAPW method. Our calculated energy gap (direct)
using EV-GGA is 3.1 eV. This is in good agreement with the measured gap of
Chapter One Introduction
7
3.2 eV. We have found a good agreement between the measured and calculated
reflectivity spectra and analyzed in terms of the calculated band structure, and
have found that there is a considerable anisotropy between the various
Components of the optical properties. KTP possesses positive Birefringence at
zero energy of about 0.07.
J. Rajeev .Gandhi, et al (2011), [25]. studied characterized by XRD,UV ,and
found the powder X-ray different were performed on the KTP grown to
determine the lattice parameter values and also found the data of ASTM
standard for KTioPO4 , While the UV the absorption spectra of growth crystals
were studied using (Varian Carry 5E UV – visible – NIR) spectrometer in the
spectral region of (200-2500) nm. The curve UV shows the cutoff wavelength at
353 nm.
J. Rajeev. Gandhi, et al(2014) [26], grown KTP crystal and studied to
various characterization from through powder XRD and UV analysis, measured
the nonlinear index by using a CW He-Ne laser at 632.8 nm. The measured
values of nonlinear refraction of different growth planes (001), (011), (201) are
in the order of 10-12
cm2/W.
Arne .Potreak, et al, (2014). [27]. studied SHG of KTP and report high
efficient generation of SHG radiation at a wavelength 532nm and conversion
efficiency of 76 3% was demonstrated using method to detect gray-tracking .it
is revealed that the gray tracking could be a limiting factor for aspaceborne
application due to the change in absorption and the resulting changes in thermal
lensing .
Feng .Hui. Cao, et al
(2016),[28].The researcher describes the theory of
frequency doubling crystal, and gave summarization suitable for double
frequency Characteristics of the nonlinear optical crystals put forward the theory
of frequency doubling crystal choice Choose KTP crystal design Nd +3
: YAG

Chapter One Introduction
8
green laser, the stability of 532 nm laser output, the conversion efficiency of
49.3%.
Sudipta. Gangopadhyay,(2017), [29]. Analyzed of nonlinear optical
properties of potassium Titanyl phosphate (KTiOPO4) . The excellent properties
KTP crystal has a number advantage for different applications, SHG, SFG,
DFG, OPO, and an optical waveguide modulator that is nearly a factor 2 larger
than that for another inorganic material.
Aims of the Study:-
The objectives of this work is to study:-
1- The properties of linear and nonlinear optics for KTiOPO3 has been studied.It
has different wavelengths and output powers.
2- Study the performance of KTiOPO3 crystal as optical limiter with optical
powers.
3- The study also tackles the possibility of generating of the second harmonic in
KTiOPO3 or KTP crystal.

Chapter Two THEORTICAL PART

Chapter Two Theoretical Part
8
2.1 Introduction
This chapter includes the theoretical concepts of the linear optics
properties, the basic Concepts of Nonlinear Optics, the theoretical concept for
KTP crystal and explains the Z-scan technique as well as the optical limiter
application.
2.2 Linear Optical Properties
The study of optical properties is important in finding and limiting the
absorption and transmittance of the material. In addition, it limits optical
constants. Through it can be recognized on the optical energy gap and the
optical conductivity [30].
Transmittance 1-
Transmittance is defined as the ratio between the intensity of the transmitted
beam from the matter to intensity incident beam, and can be expressed as [30]:
T= / . … (2-1)
2- Absorption
Is the ratio between the intensity-absorbed beam with absorbed by the matter
to the original intensity incident beam on it, and gives the ratio [31].
. … (2-2)
Reflection 3-
Is defined as the ratio between intensity reflective light on the matter to
intensity incident beam on it, and gives in the following relationship [31]:
…. (2-3) / R =
The reflection joins with transmittance and absorption through the relationships
[32]: … (2-4)

Chapter Two Theoretical Part
01
Optical constants: 2.2.1
Absorption coefficient 1-
Absorption coefficient is the ratio of decrease in the incident beam on the
matter in accordance with the distance towards spread the wave inside the
matter. The absorption coefficient depends on the incident photon energy and on
the properties of the matter. It could know on the nature of the electronics
transition if it was direct or indirect. In addition, it could be limited by the
following equation [33]:
…. (2-5)
Where I˳ is the intensity incident beam, I is the transmittance of matter.α is the
absorption coefficient, t is the thickness material, and after the Re-form the
equation (2-5), we get [34]:
…. (2-6)
Refractive Index: 2-
Refractive Index is defined as the ratio between the speed of the light in the
vacuum to its speed in any other material medium. It also can be found through
knowing extinction coefficient and magnitude of refraction value of matter.it
could be calculated as the following [34]:
n˳ = √ √ …. (2-7)
Where n˳ is the linear refractive Index, R is the reflection value of matter
Extinction coefficient 3-
Extinction coefficient is the quantity of energy that absorbed by electronics
valance band at the incident of beam on the matter. i.e. (The magnitude energy
that put out these electronics from the incident beams) or is the quantity of

Chapter Two Theoretical Part
00
attenuation in energy incident beams. The extinction coefficient dependents on
the absorption coefficient for each matter and the magnitude of the wavelength
for incident beams and counted from the ratio [35]:
… (2-8)
Where k is the extinction coefficient, α is the linear absorption coefficient, λ is
the wavelength.
2.2.2 Optical Absorption Edge
Absorption of optical edge has three regions:
1-High absorption Region, the high absorption results from electronic transitions
from the found levels of the valence band to the found levels of conduction band
as in figure (2-1 ).Through this region knowing the forbidden energy gap and the
absorption coefficient ( α ≥ 104 cm
-1).As illustrated in figure (2-1A).
2-Exponential Region: The electronic transitions in this region are from the
found levels in valence band to the positional levels in the valley of Conduction
band or reverse of the valence band to the levels of conduction band. The
absorption coefficient in this region is (1˂ α ˂ 104) cm
-1 as shown in figure (1-
1B). 3-Low absorption Region .The transitions in this region depends on the
intensity of cases inside movement gap resulted from structural defects .The
figure (1-1-C) shows the region [35].
Shows the main regions of optical absorption edge [36]. Figure (2-1)

Chapter Two Theoretical Part
01
Electronics Transitions: 2.2.3
Electronics Transitions are divided into direct transition and indirect
transition as illustrated in figure (2-2).
Direct Optical Transition 2.2.3.1
In this transition, the valley of conduction band and top of valance band in
the wave space in the same point (ΔK=0) and in this type, the absorption when it
was (hυ = ).It happens without change in the momentum and it is two types.
Allowed direct transition: It happens when transition between highest and lowest
in the valance conduct band. In this transition r = (1/2).
Forbidden Direct transition, it happens when the transition are between the
neighbor points to the highest and lowest point. In this transition r = (3/2). [37].
2.2.3.2 Indirect Optical Transitions
The transition of indirect optical electronica happens when the valley of
conduction band and the top of the valance band in different areas to the wave
space (K) , and this type of transition happens by the phonon assistance to keep
the momentum that resulted from change wave factor for the electron. These are
two types of transitions:-
Allowed indirect transition: This transition is between the highest in the
valance band and lowest point from the conduction band that found in different
areas and r is (2) [38].
Forbidden indirect transition: This transition is between neighbor points two
the highest and lowest point in the valance band and r is (3) [38], [39].

Chapter Two Theoretical Part
02
Figure (2-2) shows types of Electronic Transition [36].
Optical Energy Gap 2.2.4
Energy gap is the magnitude of power that electronics transition needs it
from the top of valance band to the conduction band or the nearest position level
for transition .the value of energy gap can be computed to the allowed direct
transition or the forbidden and the indirect transition from (Taus equation).
( ) ( )r….. (2-9)
Whereas β is the transition constant .its value one if transition is from direct or
indirect [40].
2.2.5 Optical conductivity
Is the increase in the number of charges at the slip of the light beam on the
material and can be calculated from the ratio as the following:
….. (2-10)
Where σ is the optical conductivity [41].

Chapter Two Theoretical Part
03
2.3 The Basic Theoretical Concepts of Nonlinear Optics
A linear dielectric medium is characterized by a linear relation between the
polarization density and the electric field, Р = χE, where ϵo is the permittivity
of free space and χ is the electric susceptibility of the medium. A nonlinear
relation between Р and E, as illustrated in Fig (2-3), on the other hand,
characterizes a nonlinear dielectric medium.
The nonlinearity may be of microscopic or macroscopic origin. The
polarization density Р = N ρ is a product of the individual dipole moment
induced by the applied electric field E and the number density of dipole moments
N . The nonlinear behavior may reside either in or in N [42].
Figure (2-3) the Р- E relation for
(a) a linear dielectric medium, and (b) a nonlinear medium[42].
The relation between P and E is linear when E is small, but becomes
nonlinear when E acquires values comparable to interatomic electric fields, which
are typically ~ 105- 10
8 V/m. This may be understood in terms of a simple
Lorentz model in which the dipole moment is = −ex, where x is the
displacement of a mass with charge −e to which an electric force −eE is applied.
If the restraining elastic force is proportional to the displacement (i.e., if Hooke’s
law is satisfied), the equilibrium displacement x is proportional to E. In that, case
E
P P
E

Chapter Two Theoretical Part
04
P is proportional to E and the medium is linear. However, if the restraining force is
a nonlinear function of the displacement, the equilibrium displacement x and the
polarization density Р are nonlinear functions of E and, consequently, the medium
is nonlinear.
Since externally applied, optical electric fields are typically small in
comparison with characteristic interatomic or crystalline fields, even when
focused laser light is used, the nonlinearity is usually weak. The relation between
P and E is then approximately linear for small E, deviating only slightly from
linearity as E increases (see Fig. 2-3). Under these circumstances, the function
that relates P to E can be expanded in a Taylor series about 0E ,
P = ( ) + ( ) ( ) (2.11)
Where χ (1)
is the linear susceptibility and χ (2)
, χ (3)
. . . are the nonlinear
susceptibilities of the medium. The linear susceptibility is related to the
refractive index through χ (1)
= n2 − 1 and is responsible for the linear optical
properties of the medium such as refraction, dispersion, absorption, and
birefringence. The second-order susceptibility χ(2)
gives rise to familiar
nonlinear optical processes such as second-harmonic generation (SHG), sum-
and difference frequency mixing, the linear electro-optic (Pockels) effect, and,
most importantly in the context of this treatment, optical parametric generation
and amplification. The third order nonlinear susceptibility χ (3)
is responsible for
the phenomena of third-harmonic generation, optical bistability, phase
conjugation, and the optical Kerr effect. The susceptibilities χ (1)
, χ (2)
, χ (3)
. . .
are tensors of the second, third, fourth, and higher rank, respectively [4].
In centro-symmetric media, which have inversion symmetry so that the
properties of the medium are not altered by the transformation r → −r, the Р- E
function must have odd symmetry, so that the reversal of E results in the
reversal of Р without any other change. The second-order nonlinear coefficient

Chapter Two Theoretical Part
05
d must then vanish, and the lowest order nonlinearity is of third order.
Typical values of the second-order nonlinear coefficient d for dielectric
crystals, semiconductors, and organic materials used in photonics applications lie
in the range d = 10−24
-10−21
(C/V2 in MKS units).
Typical values of the third-order nonlinear coefficient χ(3)
for glasses,
crystals, semiconductors, semiconductor-doped glasses, and organic materials of
interest in photonics are approximately χ (3)
= 10−34
-10−29
(Cm/V3 in MKS units).
Biased or asymmetric quantum wells offer large nonlinearities in the mid and far
infrared [42].
2.4 Second Harmonic Generation
Franken demonstrated frequency doubling of a ruby laser using a quartz
crystal in 1961[43].This was the first experiment optical frequency conversion and
hence an important milestone of the investigation of the nonlinear optical
properties of matter [43]. The processes of second harmonic generation involves
the interaction of two waves at frequency to produce a wave with the frequency
2 . It is plotted illustrated in figure (2-4) below [44].
Figure (2-4) (a) Geometry of second –harmonic generation. (b) Energy –level
diagram describing second –harmonic generation [1].

Chapter Two Theoretical Part
06
Figure (2-4) shows that the energies of the two absorbed photons aren't the same
.This is the general case of "three wave mixing" where a third photon with the sum
of the energies of the original photons are produced from the interaction of two
photons combine with material . Therefore, we have two photons with the same
energy level combining to produce a third with the sum of the energies of the two
original photon in the case of SHG [1].
Second-order nonlinear processes can only happened in materials without
inversion center. In practice, the nonlinear coefficient, d, is more frequently used
than χ (2)
and they are interrelated by the expression:
….. (2.12)
Where I, j, k are the Cartesian indices of the different frequency components
polarization [45][46].
One of the most important tasks in SHG is to obtain high conversion efficiency.
We know that intensity is the power (P) per unit Area (A) [47]:
….. (2.13)
A=
… (2.14)
Where ˳ is a radius of the beam and A is effective area of the beam cross section.
The output intensity ISHG has the following dependence on the effective nonlinear
coefficient deff the crystal length L, the input intensity I and phase
(
) ….. (2.15)
When Δk the refractive indices of incident fundamental and second harmonic
waves are equal and the intensity of SHG process is maximal .The characteristics
dependence of SHG intensity on phase mismatch is illustrated in figure (2-5).

Chapter Two Theoretical Part
07
Therefore, the SHG efficiency can be defined as:
(
) ….. (2.16)
Where P2 is the SH output power and P is the incident beam power [47].
Figure (2-5) shows second harmonic output intensity vs. Δk[47].
2.4.1 Frequency Conversion
There are mainly two types of frequency conversion processes [48 ].The
first conditions for such processes to appear is the photon energy conservation
.Two waves , at frequency ɷ1and ɷ2,incident on a nonlinear medium can
combine in different ways , for SFG, the photon energies are added to create a
new photon with higher energy , ɷ3 = ɷ2 + ɷ1. SHG is a special case of SFG
when the two photons have the same frequency and come from the same laser
mode, ɷ3=2ɷ1=2ɷ2. In the case of DFG, a photon with low energy is created by
subtraction of the lower energy from the higher, ɷ3 = ɷ1- ɷ2. In OPG, a pump
photon is split into two lower energy photons, called the single photon of
frequency ɷs and the idler photon of frequency ɷi, respectively .To keep the
energy conservation, ɷp =ɷs + ɷi .. If the OPG is put into a resonator, an optical
parametric oscillator (OPO) is constructed figure(2-6) illustrates these processes
[46].

Chapter Two Theoretical Part
08
Figure (2-6) present Frequency conversion processes [46].
2.4.2 Optical Parametric Oscillator
In the process of harmonic generation, two photons combine their energies
into a single photon. We have also seen that the reverse process, in which a
single photon splits its energy into two photons, which will have lower energy
than the incident photon, is also possible. By conservation of energy, the energy
of the resulting photons must sum to the energy of the incident photon. In an
optical parametric oscillator (OPO) configuration, a pump beam incident on a
nonlinear crystal produces two resultant photons at different wavelengths. One
wavelength, called the signal, exits the device as the output beam; the second
wavelength, essentially useless, called the idler beam, stays within the cavity of
the device, as depicted in Figure. The frequencies of the idler and output beam
sum to the frequency of the pump beam (as required for conservation of energy).
An OPO is not a laser since it does not amplify; rather, it is an oscillator only. It
is, however, a coherent oscillator-producing laser light [49].
2.4.3 Phase Matching
Phase matching is a very important concept in the nonlinear optics. Phase
matching technology adopted, the nonlinear effect of conversion efficiency
Chapter Two Theoretical Part
11
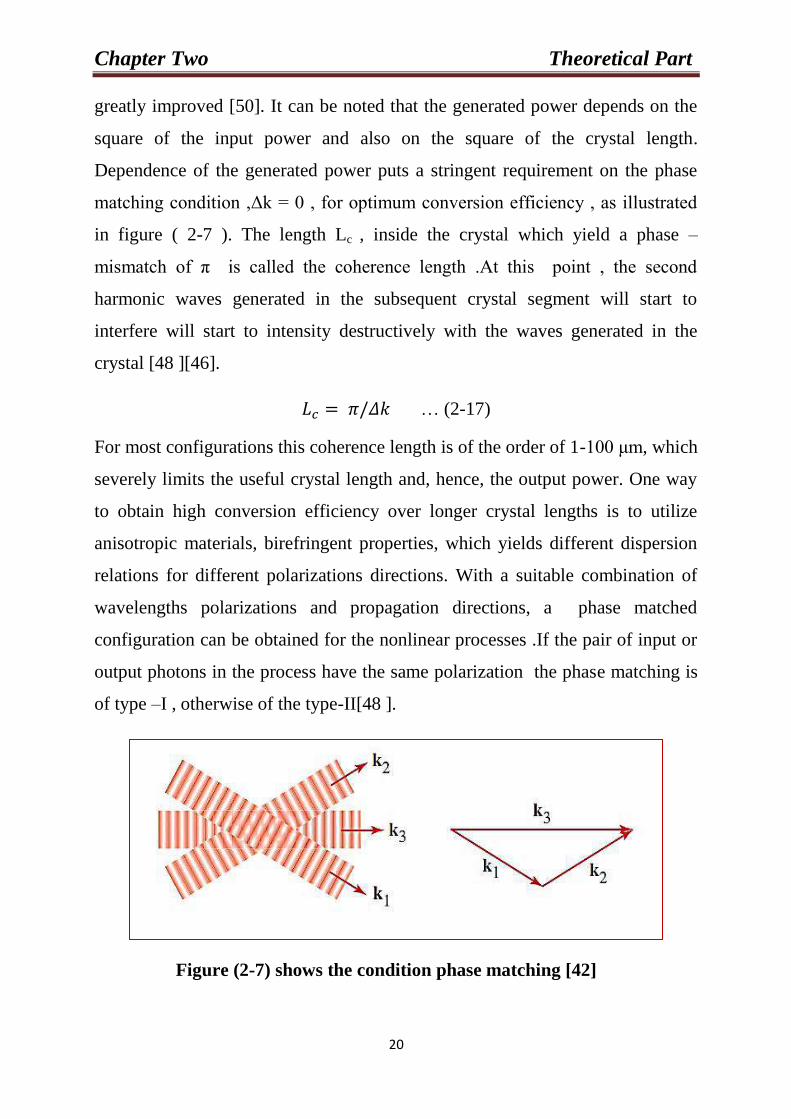
greatly improved [50]. It can be noted that the generated power depends on the
square of the input power and also on the square of the crystal length.
Dependence of the generated power puts a stringent requirement on the phase
matching condition ,Δk = 0 , for optimum conversion efficiency , as illustrated
in figure ( 2-7 ). The length Lc , inside the crystal which yield a phase –
mismatch of π is called the coherence length .At this point , the second
harmonic waves generated in the subsequent crystal segment will start to
interfere will start to intensity destructively with the waves generated in the
crystal [48 ][46].
… (2-17)
For most configurations this coherence length is of the order of 1-100 μm, which
severely limits the useful crystal length and, hence, the output power. One way
to obtain high conversion efficiency over longer crystal lengths is to utilize
anisotropic materials, birefringent properties, which yields different dispersion
relations for different polarizations directions. With a suitable combination of
wavelengths polarizations and propagation directions, a phase matched
configuration can be obtained for the nonlinear processes .If the pair of input or
output photons in the process have the same polarization the phase matching is
of type –I , otherwise of the type-II[48 ].
Figure (2-7) shows the condition phase matching [42]
Chapter Two Theoretical Part
10
Quasi-phase matching 2.4.4
QPM is a technique for compensation of the phase-velocity differences
between the interacting waves in a nonlinear frequency conversion processes. In
QPM, the accumulation of phase mismatch is prevented through a spatial
modulation of the sign of the nonlinear susceptibility. Thus, the nonlinear
medium is physically altered in a periodic fashion along the length of the crystal
to prevent the flow of energy away from the generated wave [44]. Armstrong et
al first proposed this technique in 1962 [46].
The idea is to correct the phase-mismatch between the interacting fields at
regular intervals by imposing a periodic structure to the material. In second
harmonic generation , If the process is not phase matched, the energy will after
the first coherence length in the crystal starts to flow back from the generated
field to the incident and after 2L, the generated field is back to zero energy .
This energy fluctuation is repeated with a period of 2L and the generated wave
will not grow with distance [46].
2.5 Third Harmonic Generation
Third order nonlinear process is applicable to either centro– symmetric or
non-centro symmetric optical materials. The development of Q –switched lasers
has made it possible to generate third harmonic crystals [51]. Equation P3
= χ3E3, represents the third order nonlinear polarization term. In this Process,
an intense laser beam of angular frequency is passed through a crystal such that
the beam emerging from the crystal contains the angular frequencies ɷ1 of the
input beam and ɷ3= 3ɷ1 which is thrice the frequency of the input beam [52].
That is if infrared radiation of wavelength 1064 nm is made to incident on a
crystal from an Nd: YAG laser then the output from the crystal must contain
Chapter Two Theoretical Part
11
radiation in UV region with wavelength 266nm in addition to the original 1064
nm radiation[53].
Third harmonic generation provides a mechanism for light control and hence
can be used in optical switching, optical bistability and sensor protection,
optical phase conjugation, four wave mixing, self -focusing , Stimulated
Raman scattering, optical Kerr effect, two photon emission or absorption and
coherent anti stokes Raman scattering. Third harmonic nonlinear interactions
involving three frequencies degenerate input waves have been the field of active
research and are used m problems of generating holographic images, which are
developing rapidly and is called real-time holography [53].
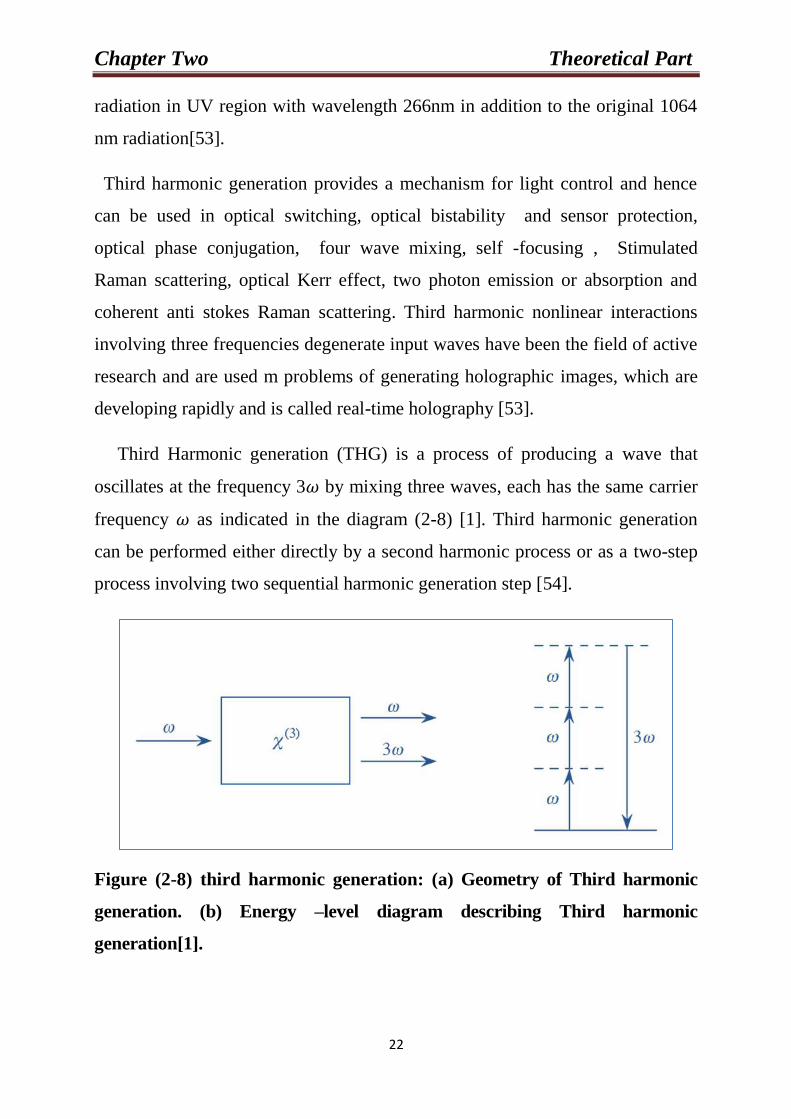
Third Harmonic generation (THG) is a process of producing a wave that
oscillates at the frequency 3 by mixing three waves, each has the same carrier
frequency as indicated in the diagram (2-8) [1]. Third harmonic generation
can be performed either directly by a second harmonic process or as a two-step
process involving two sequential harmonic generation step [54].
Figure (2-8) third harmonic generation: (a) Geometry of Third harmonic
generation. (b) Energy –level diagram describing Third harmonic
generation[1].
Chapter Two Theoretical Part
12
The absolute value of the third order nonlinear optical susceptibility |χ(3)
| can be
expressed by the following relation [55] :-
|χ (3)
| = Re (χ (3)
) +Im (χ (3)
) …..(2-18)
Where Re (χ (3)
): is the real part of the third order nonlinear optical susceptibility
χ (3)
, Im (χ (3)
): is imagery part of the third nonlinear optical susceptibility χ (3)
,
were expressed through nonlinear refraction index and nonlinear absorption
coefficient, by the following relation [54]:
Re [χ (3)
] (esu) = 10-4
(cm
2/W) … (2-19)
Im [χ (3)
] (esu) = 10-2
(cm2/W) … (2-20)
Where c: is the speed of the light, n˳: the linear refractive index, λ: is the
wavelength, n2: is the nonlinear refractive index ,β: is the nonlinear absorption
coefficient.
2.6 High Harmonic Generation
The first generation of high –harmonic orders in 1987 [56] by McPherson et
al who successfully generated harmonic emission up to the 17 order at 248nm in
neon gas [57]. HHG provides an attractive source of coherent radiation in the
extreme ultraviolet (XUV) radiation and soft X-ray region and is currently
finding wide application in physics, chemistry, biochemistry and biology [57].
The HHG spectrum given a linearly polarized driving field in fig (2-9) [58].

Chapter Two Theoretical Part
13
Figure (2-9) Typical HHG spectrum [57].
A typical HHG spectrum can be divided into three parts: the perturbative region
at low orders, the plateau region at intermediate orders and the cutoff at region
at highest orders. Perturbation theory can be used to describe the appearance of
lower order harmonics (q˂ 9) which are produced at low intensities during the
leading edge or trailing edge of the laser pulse. The harmonic yields in this
region decrease as a power low [57]. High Harmonic Generation produces
coherent light in high frequency regions of electromagnetic spectrum higher
than any laser currently available [59].
2.7 The nonlinear refraction index and the nonlinear absorption.
The basic optical properties included in the light-mater interaction are
absorption, which is defined by the absorption coefficient and refraction that is
defined by the index of refraction n. When the material is irradiated, the energy
of the absorbed photons makes it possible for the transition from the ground
state to the excited state. This gives rise to what we call linear absorption. The
further excitation may be possible due to the abundance of incoming photons;
this gives rise to what we cell nonlinear absorption. The absorption of the
material (α) is intensity dependent given by [60]:-
… (2-21)

Chapter Two Theoretical Part
14
Where, α˳: linear absorption coefficient, β: the nonlinear absorption coefficient
relate to the intensity.
There is also a change in the refraction index when a material is placed in a
strong electric field. At high intensity, the refractive index is given by [60]:-
… (2-22)
Where, n2: the nonlinear refractive index related to the flounce, n˳: linear
refractive index .The coefficients n, α are related to the intensity of the laser.
2.7.1 Saturable Absorption
Saturable absorption is the nonlinear optical process .Many material system
have the property that their absorption coefficient decreases when measured
using high laser intensity I of the incident laser radiation is given by the
expression [1] :-
2-23)… ( α =
Where α˳ is the initial value of absorption coefficient, and Is is a parameter
known as the saturable intensity [1].
2.7.2 Two photon Absorption
Two-photon absorption is a process of a current absorption for two photons
either they have the same energy or different in energy [5, 61, 62, 63]. In this
process, the two photons are absorbed by the atoms of media and moved from
the ground state to the excited level passing through virtual state or virtual level.
The reason is that the two photons have no enough energy to complete the
transition to the excited level. As in figure (2-10).

Chapter Two Theoretical Part
15
Figure (2-10) nonlinear absorption Two-photon Absorption [64].
2.8 The Self-focusing and the Self –defocusing.
When Gaussian beam passed, through a media, that has high intensity, it
will make inhomogeneous change in the optical density and nonlinear refractive
index to the materialistic media .When the beam progresses inside medium.
Because refractive index media depends on electrical field intensity for the
electromagnetic wave. Then media becomes effective on the lights that passed
through the inhomogeneous optical to the range medium will lead to the change
in laser beam by passing through media, either to self-narrow or to self-
widening in the width of laser beam. In the first case, the intensity in laser beam
maximum and the center of beam. Thus, the magnitude of refraction index larger
and low down at the edges of the beam, in this case the media operates as a
convex lens for beam and it is called the self-focusing. It is referred to refractive
index as positive while in the second case, the magnitude of refraction index at
the center beam minimum and it is increased at the edges of beam.
Consequently, laser beam widening the media operates as a concave lens to
beam and it is called self-defocusing and indicates refraction index as a negative
[1, 2].

Chapter Two Theoretical Part
16
2.9 Z-scan Technique
There are many techniques that are used to measure the nonlinear optical
properties for the mater. Z-scan technique is to be considered as the simplest
method to measure the properties that described in its high sensitivity to the
single light beam [65].
Sheikh Bahae et al developed a sensitive focusing measurement technique
that involves focusing a laser beam through a thin sample is known Z-scan
technique in 1989 [2] [4]. The Z-scan was used measure the magnitude and sign
of nonlinear properties [66].It has been used to measure nonlinear optical
properties of semi-conductors, dielectric, and glass, organic or carbon-based
molecules and liquid crystals [67].The essential geometry is shown in figure (2-
11).
Figure (2-11) the Z-scan experimental arrangement [68]
The Z-scan works on the principle of moving the sample through the focus of
the Gaussian beam in the Z-direction. The interaction of the medium with the
laser light changes, as the sample moves .This because the sample experiences
different intensities dependent on the sample position (z) relative the
focus(z=0)[66]. The sample is usually put at the focus point of lens, and then is
continuously moved along the z axis at a distance of z˳ which is expressed by
the Rayleigh length z˳ [69]:
…. (2-24)

Chapter Two Theoretical Part
17
Where λ: is the wavelength, : radius of the Laser beam.
There are two types of Z-scan: Close aperture and Open aperture. The close
aperture Z-scan is used to measure the nonlinear refraction, while the open
aperture Z-scan is used to measure the nonlinear absorption [69].
2.9.1 Close Aperture Z-Scan Technique
In close aperture, the sample is moved through the focal point of the focused
Gaussian laser beam, the transmittance is measured through a finite aperture
placed in far field, and the sign and magnitude of the nonlinear refractive index
(n2) are determined from the resulting transmittance curve [69]. To clarify the
principle of the Z- scan method, we regard the propagation of focused intense
laser radiation through a material under study. Regard nonlinear refraction and
suppose that the medium gives a positive nonlinear addition to the refractive
index (n2). If the sample placed at a large distance from the focus ( The region of
negative values of z ) , the radiation intensity in the medium is not sufficient to
excite remarkable nonlinear refraction , and the transmission of radiation
through an aperture mounted in the far-field zone stays in not variable and close
to unity , as illustrated in figure (2-12). As the sample approaches the focal
point, the radiation intensity increases and the self- focusing, effect appears in
the medium (note solid straight lines behind the sample in figure). As a result,
the far-field radiation has a larger divergence and, hence, transmission through
the limiting aperture decreases [70].

Chapter Two Theoretical Part
18
Fig (2-12) The propagation of focused intense radiation through a nonlinear
self –focusing medium for a sample placed (a): in front of the focus and (b):
behind it [70].
As the sample is scanned along the z-axis, transmission will decrease until
the point z1 is arrived (figure 2-12), where transmission is minimal. Decrease in
the curvature of the wave front of Gaussian beam near the focus cases the
general decrease in the far-field radiation divergence, and as the sample extra
approaches the beam waist, transmission through the aperture increases. After
the sample passes through the waist. Self-focusing reduces the far-field radiation
divergence. This will go on until the influence of self-focusing on the radiation
propagation through the aperture will be maximal (at the point z2 in figure
corresponding to the maximum of the solid curve). As the sample is extra
displaced, the influence of this nonlinear optical process on the transmission of
radiation through the aperture will decrease because of the decrease in the
radiation intensity until the normalization transmission fulfill its stationary value
close to unity. The medium has a positive nonlinear refractive index (n2 > 0)
when the maximum of the normalization of transmission follows after the
minimum during Z-scan, on the contrary the medium has self-defocusing

Chapter Two Theoretical Part
21
properties (n2< 0), when the transmission maximum first appears and then
minimum [69].
Fig (2-13) Normalized transmittance in the closed aperture graph for the
media with the positive (solid curve) and negative (dashed curve) nonlinear
refractive indices [70].
2.9.2 Open Aperture of Z-Scan Technique
The open aperture Z-scan method is used to measure the nonlinear
absorption coefficient (β). In this case, the aperture is removed. Therefore, Z-
scan technique be sensitive to the nonlinear absorption. When the absorption,
increase in the sample with the increase laser beam intensity, the transmittance
minimum in the focal lens as it is shown in figure (2-14a), the nonlinear
absorption produces from two-photon absorption. Whereas it decrease the
absorption sample with the increase of laser beam intensity ,the transmittance
maximum at focal point ,as its illustrated in figure (2-14b),the nonlinear
produces from saturable absorption[65]. In figure (2-14) present forms of Z-scan
technique, open aperture [65].

Chapter Two Theoretical Part
20
(a) (b)
Figure (2-14) forms of Z-scan technique open aperture,
(a).Two photon absorption, (b). Saturated absorption.
2.9.3Theory of the Z-scan technique
The nonlinearity can often be evaluated from the difference between the
maximum and minimum vales of the normalized transmittance; ΔT is proportion
to the nonlinear phase shift ΔФ˳,
The relation is define as [4]
ΔTp-v =0.406│ΔФ˳│ … (2-25)
Where 0.406 constant quantity. And
ΔФ˳=k n2 I˳ Leff … (2-26)
ΔΦ˳: nonlinear phase shift, k is wave number [71], I˳ is the initial intensity of
the laser beam at focus z=0.
I˳ = P / 2π ѡ˳2
…. (2-27)
Where ѡ˳2 the radius of laser beam, P :is the power of laser beam
Where Leff is the effective thickness of the sample [72].
Leff = (1- exp (-αt)
/α) …. (2-28)
The nonlinear refraction index n2 is given by:
n2 =ΔФ / k I˳ Leff … (2-29)
The change of the nonlinear refraction index Δn with the laser beam
intensity I˳ in the following relation [65]:
Chapter Two Theoretical Part
21
Δ n = n2 I˳ …. (2-30)
From the open aperture curve, the nonlinear absorption coefficient β can be
calculate from the formula [73]:
β = √
…. (2-31)
Where ΔT is the one peak or one valley at the open aperture z- scan curve.
The real part of the third order nonlinear optical susceptibility χ (3)
, and the
imagery part of the third nonlinear optical susceptibility χ (3)
, were expressed
through nonlinear refraction index and nonlinear absorption coefficient,
according two relation (2-19),(2-20) respectively.
The absolute value of the third order nonlinear optical susceptibility /χ(3)
/ can be
expressed by the following relation [65] :-
|χ (3)
| = [Re (χ (3)
) +Im (χ (3)
)] 1/2
… (2-32)
2.10 Optical Limiting
An optical limiter is a nonlinear optical process in which the transmittance of
a material decreases, when increased incident light intensity [74].The study of the
optical limiting (OL) laser radiation in various materials opens the possibility of
using these materials as laser shutters for protection against intense of laser
radiation and is important in investigating the essential properties of nonlinear
optical media [70]. One of the major potential applications of these devices is
sensor and eye protection [75] .All photonic sensors, including human eye have a
threshold intensity above which they can be damaged [76]. By using the suitable
materials as optical limiters, allowing them to function optimally to function at
higher input intensities [75]. The figure (2-15) shows the idea of ideal optical
limiter has a linear transmittance at low input intensities, but above the threshold
intensity its transmittance becomes constant [75].

Chapter Two Theoretical Part
22
Figure (2-15) idea of ideal optical limiting [77].
2.10.1 Mechanisms Types of Optical Limiting
Optical Limiting can be achieved by means of nonlinear optical
mechanisms, including self- focusing, self- defocusing, scattering, two photon
absorption, free carrier, absorption, and reverse absorption in nonlinear materials
[75]. The nonlinear optical mechanism can be employed for the design and
performance of optical limiting devices, which can be classified into types. The
first type is an energy spreading and the second is an energy absorption [74]
[76]. The limiting function of an energy is based on intensity dependent change
is a spatial structure of laser beam passing through a nonlinear medium [74].
This type is requirement to place an aperture in front of a detector [77]. At low
input intensity levels. This change can be neglected and the whole laser beam
can be detected through a property aperture in front of a detector [74]. At high
intensity levels, this change becomes server that only. Small fraction of the
transmitted beam can pass through the same aperture and finally detector [74].
In this type of mechanism, the nonlinear refraction that can be employed for
optical limiting [77]. The optical limiting effect of refraction nonlinear optical
mechanism was induced the self- focusing, self- defocusing, and scattering [75].
Chapter Two Theoretical Part
23
The second type of optical limiting is based on the intensity – dependent
nonlinear attention of the laser energy in a given nonlinear materials, whereas
the beam-structure changes is not so important. [74]. We only consider the
second type of optical limiting power limiting device, for which the intensity
dependent transmission changes in a nonlinearity absorptions material is most
important [74] . In this type of mechanism, the nonlinear absorption can be
employed for optical limiting was induced the two-photon absorption (TPA),
reverse absorption, free carrier absorption (FCA) [75].
2.10.2The Effect of Nonlinear Absorption in OL
The energy absorption type of devices is the intensity dependent nonlinear
absorption of laser energy in a nonlinear material. In this case, the beam
structure change is not essentially important and therefor no aperture is needed
[70]. The ideal requirements for choosing a paper nonlinearity absorbing
material for OL can be described medium as follows: (1) there should be no
linear absorption at the working wavelength range so that the material is highly
transparent for work input light signals. (2) There is a strong dependence of the
NLT on the input light intensity so that the medium is highly absorptive for
intense input laser signals. (3) Threshold be a very fast temporal response of
nonlinear transmission change .The following the intensity change of the input
signals. (4) The optical Limiting effects should be reversible and reproducible
for the input laser points [74].
Three main nonlinear absorption mechanism can be employed for OL is
reverse saturable, two-photon absorption and the free carrier absorption [75,
77,78].

Chapter Two Theoretical Part
24
2.10.2.1Two – Photon Absorption (TPA)
For the two photon absorption (TPA) the interaction of electromagnetic
radiation with matter [76]. Tow – photon absorption is an instantaneous
nonlinearity that involves the absorption of a photon from the field to promote
an electron from its initial state to a virtual intermediate state, followed by
second photon, which takes the electron to its final state. Since the intermediate
state is a virtual state, no energy is conserved and the system can be represented
as a two or three level system.
The attenuation and excited state populations can be given by[76]:-
and
……….. (2-33)
Here α is the linear absorption coefficient, N the number of molecules per unit
area in the ground state, β is two- photon absorption coefficient and σ is a
macroscopic parameter characterizing the material [76]. The cross section of the
two photon absorption is determined by the two photon absorption coefficient
band relies on the wavelength [75].
2.10.2.2 Reverse Saturable Absorption
Reverse saturable absorption can be noted in a system that absorbs more in
the excited state than in the ground state [78].If the cross section for the
absorption from the ground and the excited states are respectively σ1and σ2, the
medium becomes more transparent when σ1> σ2. This is because the population
difference between the ground and the excited states decreases when the system
absorbs light. These medium are known as reverse saturable absorbers [1]. The
simplest electronic system possessing reverse saturable absorption has three
Chapter Two Theoretical Part
25
vibronically broadened electronic energy levels [78]. The RSA is a two-step and
successive one photon absorption process [4].
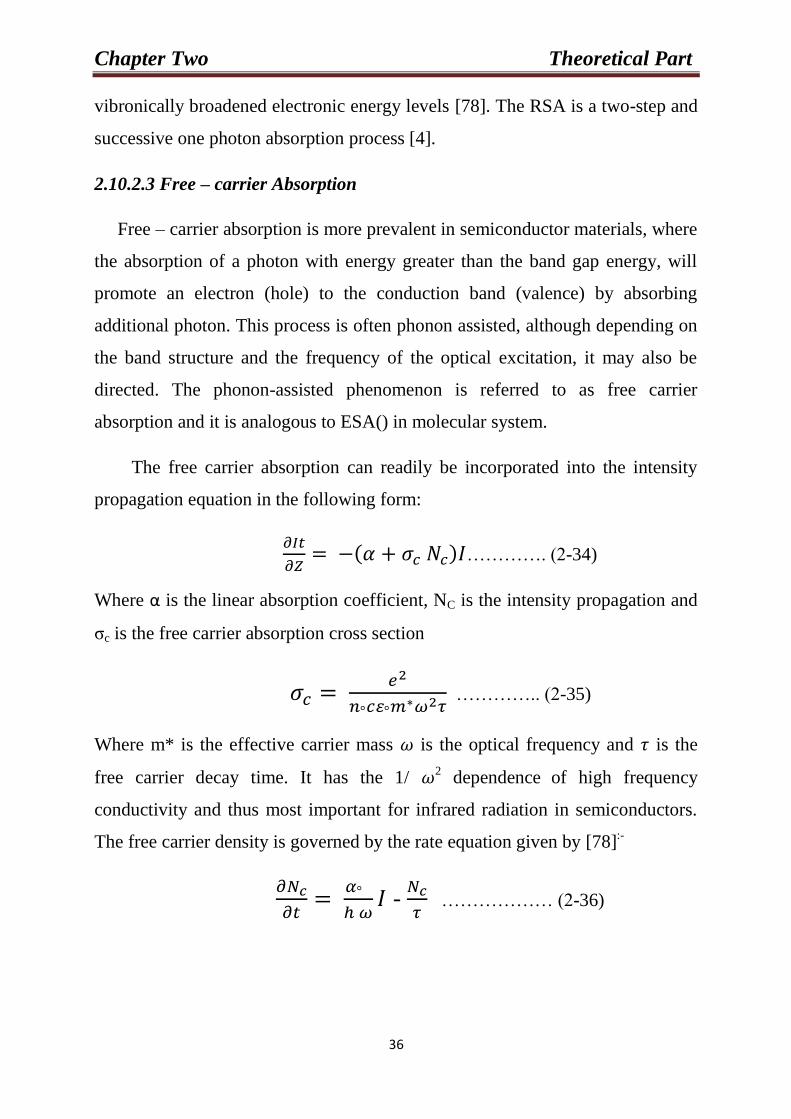
2.10.2.3 Free – carrier Absorption
Free – carrier absorption is more prevalent in semiconductor materials, where
the absorption of a photon with energy greater than the band gap energy, will
promote an electron (hole) to the conduction band (valence) by absorbing
additional photon. This process is often phonon assisted, although depending on
the band structure and the frequency of the optical excitation, it may also be
directed. The phonon-assisted phenomenon is referred to as free carrier
absorption and it is analogous to ESA() in molecular system.
The free carrier absorption can readily be incorporated into the intensity
propagation equation in the following form:
( ) …………. (2-34)
Where α is the linear absorption coefficient, NC is the intensity propagation and
σc is the free carrier absorption cross section
………….. (2-35)
Where m* is the effective carrier mass is the optical frequency and is the
free carrier decay time. It has the 1/ 2 dependence
of high frequency
conductivity and thus most important for infrared radiation in semiconductors.
The free carrier density is governed by the rate equation given by [78]:-
-
……………… (2-36)

Chapter Two Theoretical Part
26
2.10.3 The Effect of Nonlinear Refraction in OL
The energy –spreading is the intensity dependent change in the beam
structure and the spatial energy distribution of a laser beam passing through the
nonlinear medium. At low intensity level, this change can be neglected and all
laser beams can be detected through a properly placed aperture in front of a
detector. Whereas at high intensity levels, this change becomes more severe and
only a small portion of beam energy can pass through the aperture and be finally
detected [74, 77]. From Kramers – Kronig relations, we know that all materials
exhibiting nonlinear refraction. This can usually be expressed as:
….. (2-37)
Where n2: describes instantaneous index changes properties to incident
irradiance and σr : describes the change in the index due to population of excited
states. Third –order optical nonlinearities, n2 is required to the TPA coefficient,
β, by Kramers –Kronig relations. As a focused beam has a spatially varying
irradiance, then the induced index change varies across the beam profile,
causing the beam to be strongly distorted upon propagation. Near focus, the
beam is usually brightest in the center, so for a negative index change (where the
index decreases with increasing irradiance or flounce), the nonlinear material
will behave like a lens with negative focal length, and the beam is defocused.
This process is referred to as self-defocusing. If the sign of the index change is
positive, self-focusing results [4].
2.10.4 Nonlinear Scattering
The presence of irregularities in the medium that can be associated with
variation of the refractive index, results in the scattering of light, i.e. give rise to
the extinction of the light beam. When the power of the incident light is high

Chapter Two Theoretical Part
27
enough to produce or modify scattering cross section increases with the intensity
suppressing the intensity of the transmitted light leading to OL [76].
In the case of nonlinear scattering, the formation of small scattering centers
in the device can be thermally induced local changes (such as density or in the
form of phase changes) or, by utilizing a heterogeneous material whose
components have matching refractive indices for low input intensities, while for
higher power the indices become mismatched, and therefore nonlinear scattering
occurs. Increased scattering at higher intensity limits the directly transmitted
intensity [75].
2.10.5 Comparison Ideal Optical Limiter and Realistic Optical
Limiter
The ideal optical limiter is illustrated in figure (2-16 (a)).For some materials,
e.g., two photon absorbers, this transmittance may be near 100 %, and the input
–output curve would have a slope of 45ᵒ. On the other hand, RSA materials
require a certain amount of linear absorption, and thus the input- output slope in
the linear regime< 45ᵒ . At some critical intensity or threshold in an ideal limiter,
the transmittance changes abruptly and exhibits an inverse intensity or fluent
dependence.
In a real material, illustrated in figure (2-16 (b)), this transition is not so
abrupt. The definition of threshold is not precise. In addition, in a real material,
the output is not always clamped at a constant value, but the input-output slope
is decreased as shown in figure (2-16(b)). Thus, if the input-output slope is
nonzero, at a some input above threshold the device will faill to provide
protection. In some cases, the material itself may be damaged if its damage
threshold is below this point, or the intensity/ flounce dependent transmittance
may approach a constant asymptote so that the input-output slope again
increases[2][77].

Chapter Two Theoretical Part
28
Figure (2-16) Characteristics of an optical limiter (a) Ideal optical limiter
(b) realistic optical limiter, repotted form [2][77].
2.11 Main Characteristics of Potassium Titanyl phosphate crystal.
KTP was first developed in the end of the 1970[79]. It got a new attention.
Tordjman et al analyzed the crystal structure in details in 1974 ,and in 1976
researcher at Dupont Inc ,USA, started to investigate KTP,s nonlinear optical as
well as its mechanical properties[79 ].The KTP is biaxial crystal[80]. The crystal
possesses high nonlinear, it has a high resistant to optical [79], and has been
widely used in a various nonlinear-optical applications in particular in SHG and
OPO devices [79]. KTP crystal is orthorhombic and belongs to the acentric point
group mm2, with only slightly different lattice parameters [81]. For this point
group symmetry class, there are five non-zero nonlinear coefficients, d15 =
6.1pm/V, d31=6.5pm/V, d24=7.6pm/V, d32=5.0pm/V, and d33= 13.7pm/V [81]
[82] .These values are still considerably higher than many other nonlinear

Chapter Two Theoretical Part
31
materials including urea, β-BaB2O4 and LiB3O5 [82]. There are two main
techniques presently used to grow a KTP crystal, which includes the
hydrothermal and flux method [25]. Potassium Titanyl Phosphate (KTP) crystal
is nonlinear crystal .The famous type is KTiOPO4.Another type such as
KTiOPO7, KTiOPO3.All these types are Orthorhombic and belonged to it with
only slightly different lattice parameters.
2.11.1 Growth Crystal
There are mainly two methods for growing KTP. In the first , the crystals
are growing from a solvent that contains the dissolved components necessary to
form the crystal .The solvent is called flux and has given name to the processes
,flux growth. If the solvent only contains the material which constitutes the
crystal is named a self-flux .The self-flux is kept in Pt-containers at a high
temperatures (800-950C) and the growth started in the supersaturated melt and
continuous during cooling. The stability of the temperature is an important issue
for this processes .It should be better than +/-0.05 Kat the crystal position
otherwise flux inclusions and growth striations might appear .Cheng at el, have
synthesized KTP,KTA,RTA,RTP and CTA crystals using the method of self –
flux growth[79].
The other method is called hydrothermal growth. Here the synthesis takes
place in a container called autoclave at high temperatures and pressures, where
aqueous solvents are used to dissolve and recrystallize the material .Typical
parameters foe hydrothermal temperatures of 400-500C and pressures of 1-
2kbar.Growing KTP by a self-flux process is faster than using the hydrothermal
technique[79].
2.11.2 Structure KTiOPO4 Crystal
KTP is orthorhombic and belong to the centric mm cemetery group. It is
also a member of the space group Pna21, which implies that the

Chapter Two Theoretical Part
30
Crystallographic direction a, b, c, corresponded to the optic axis x, y, z with c
being the polar axis. KTP's structure consists of distorted TiO6 octahedra , which
is linked at two corners to form chains . Ti atom is displaced from the center of
the octahedron, leading to one long , one short and for medium Ti-O bonds in
the structure .These alternating lengths of the Ti-O bonds case a net c-directed
polarization in KTP .The TiO6 chains are separated by slightly distorted PO4
tetrahedra , see figure (2-17). The K+ ions are weakly bonded to both the
tetrahedra and octahedra and can a copy to different sites – other an eight –fold
or nine-fold coordinated. Further, the actions can be diffusion mechanism travel
through channels, which exist along the c direction .The diffuse by a vacancy
hopping mechanism that cases the ionic conductivity along the c axis to be
several orders of magnitude higher than in the other direction [46].
(b) (a)
Figure (2-17) the KTP crystal structure [46] [24].

Chapter Two Theoretical Part
31
2.11.3 Potassium Titanyl Phosphate KTiOPO3 (KTP) crystal
KTiOPO3 single crystal is orthorhombic and belongs to the centric point
group mm. the space group of KTP is Pna21 and the lattice parameters are a =
6.404 Aᵒ, b = 10.616 Aᵒ, c = 12.814 Aᵒ. KTP is optically biaxial crystal; the
refractive indices for the principle axes of the material are all different, nx ny
nz [79]. It has been widely used frequency doubling of the near –IR from Nd-
YAG lasers into the green and for near –IR OPOs. The figure (2-18) shows the
transmission for the potassium [83]. KTiOPO3 has wide range of transparency
between (350-45000) nm [84].
Figure (2-18) Transmission for KTP crystal [77].
The magnitudes of the d-coefficients to be d15 = 6.1pm/V, d31=6.5pm/V,
d24=7.6pm/V, d32=5.0pm/V, and d33= 13.7pm/V. The expressions for deff for
type II interaction to
│deff│= (d24- d15)sin 2θ sin 2ϕ- (d15sin2ϕ+ d24cos2ϕ)sin θ …(2-38)
The angle θ is measured relative to the z-axis and ϕ is measured in the xy-plane
from the x-axis[81].

Chapter Two Theoretical Part
32
2.11.4 Application for SHG and SFG of Nd : Lasers
KTP is the most commonly used material for frequency doubling of Nd :
YAG and other Nd –doped lasers , particularly when the power density is at a
low or medium level. To date, extra –and intra –cavity frequency doubled
Nd:lasers using KTP have become a preferred pumping source for visible dye
lasers and tunable Ti: Saphire lasers as well as their amplifiers .They also useful
green sources for many research and industry applications[84] .
More than 80% conversion efficiency and 700 mJ green laser were obtained
with a 900 mJ injection –seeded Q-switch Nd: YAG Laser by using extra –
cavity KTP .
8W green laser was generated from a 15w LD pumped Nd:YV04 with intra –
cavity KTP.
200 mW green outputs are generated from 1 W LD pumped Nd : YV04 lasers
by using THATSHIGH's 2x2x5 mm KTP and 3x3x1 mm Nd : YV04.
2-5mw green outputs are generated from 180 mw LD pumped Nd : YV 04 and
KTP glued crystals . For more details, please refer to Glued Crystals. KTP is
also being used for intra cavity mixing of 0.81µm diode and 1.064µm Nd: YAG
laser to generate blue light and intra cavity SHG of Nd: YAG or Nd: YAP lasers
at 1.3µm to produce red light.
2.11.5 Application for OPG, OPA and OPO
As an efficient OPO crystal pumped by a Nd : laser and its second
harmonics , KTP plays an important role for parametric sources for tunable
outputs from visible (600nm) to mid-IR (4500nm) as shown in fig (2- 19) .
Generally, KTP's OPOs provide stable and continuous pulse outputs (signal and
idler) in Fs. with 108 Hz repetition rate and a mW average power level. A KTP's
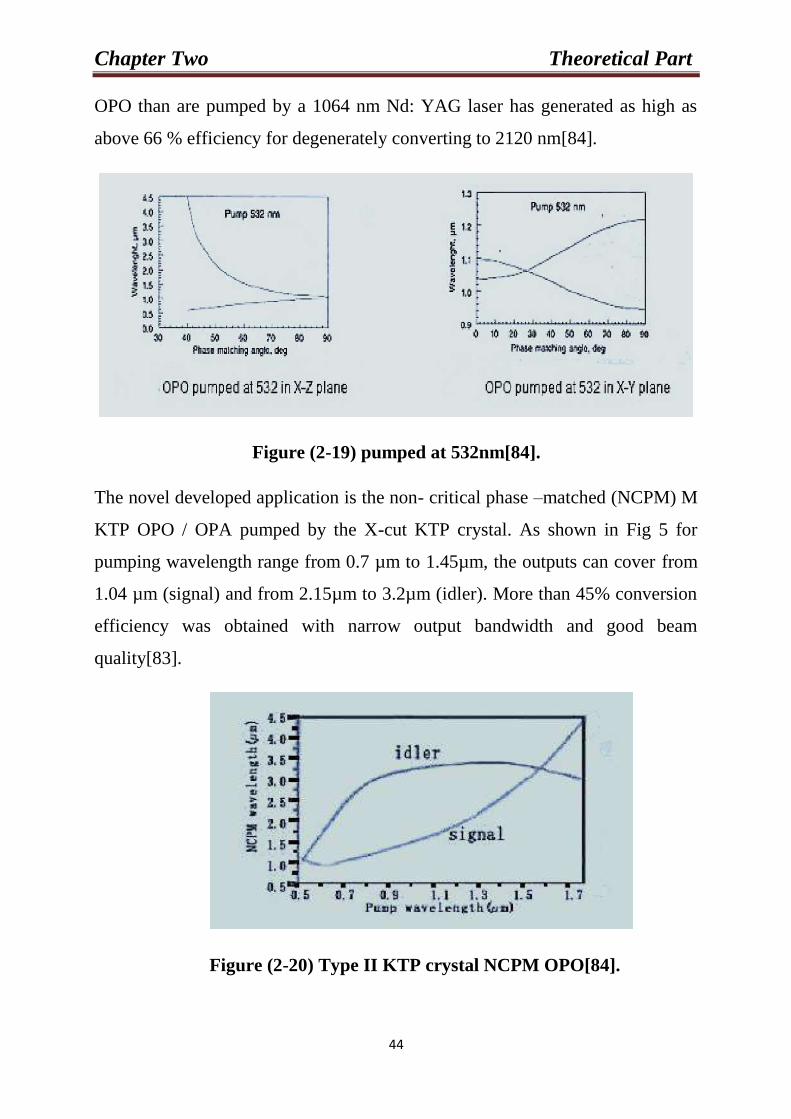
Chapter Two Theoretical Part
33
OPO than are pumped by a 1064 nm Nd: YAG laser has generated as high as
above 66 % efficiency for degenerately converting to 2120 nm[84].
Figure (2-19) pumped at 532nm[84].
The novel developed application is the non- critical phase –matched (NCPM) M
KTP OPO / OPA pumped by the X-cut KTP crystal. As shown in Fig 5 for
pumping wavelength range from 0.7 µm to 1.45µm, the outputs can cover from
1.04 µm (signal) and from 2.15µm to 3.2µm (idler). More than 45% conversion
efficiency was obtained with narrow output bandwidth and good beam
quality[83].
Figure (2-20) Type II KTP crystal NCPM OPO[84].

Chapter Three
EXPERIMENTAL PART

Chapter Three Experimental Part
74
3.1 Introduction.
This chapter focuses on the materials , devise that are taken to be involved
for the current work and it demonstrates the Z-scan technique to determine the
nonlinear optical properties and optical limiter .As well as explains the second
harmonic generation .the measurement were achieved at wavelength (1064nm
,double frequncy532nm).
3.2 Spectrophotometer
To determine the optical properties for KTP crystal, The Mega -2100 Double
Beam UV-Vis-IR Spectrophotometer) has been used (Mega (UV-2100) at
wavelength range from 200 to 1100 nm. The transmission and absorption
spectra measured as function for wavelength. From absorption spectra, the
calculation of absorption coefficient and calculation of optical constants that
represented by equation (2-6) refractive index, by depending the equations (2-7)
respect that special for each constant.
Figure (3-1) UV-Visible Spectrophotometer

Chapter Three Experimental Part
74
3.3 Nd: YAG Laser
In this work, the CW Nd: YAG laser was used. It composes of wavelength
1064nm at power (35mw) and double frequency 532nm at powers (85,25mw).
The characteristics of Nd: YAG laser listed the below table (3-1).
Table (3-1) Characterization of Nd: YAG laser.
Physical and Chemical Properties Optical properties
Chemical Formula Nd:Y3A15O12
Lasing Wavelength (532,1064) nm
Radiative Lifetime 550 ms
Melting Point 1970°C (2243K) Divergence angle 0.625 mard
Density 4.56 g/cm3 Linewidth 0.6 nm
Refractive Index 1.82
3.4 Detector
Laser power meter Lp1, detector LpoA1 and Laser power meter were used.
Laser power meter LPO1 that has 40µw -40mw .OPT-1A power in dicator scale
from 20mw – 200mw, while laser power meter has its scale from 100nm -
1100nm.
3.5 The Potassium Titanyl Phosphate Crystal
KTP Potassium Titanyl Phosphate (KTiOPO3 or KTP) Crystals are widely
used in both commercial and military laser including laboratory and medical
systems, range finders, lidar, optical communication and industrial systems.

Chapter Three Experimental Part
74
Figure (3-2) The (KTiOPO3) crystal 6*6*3mm3
Table (3-2) shows Specifications for KTP Crystal
Dimension Tolerance (W±𝟎. 𝟏𝒎𝒎) × (𝑯 ± 𝟎. 𝟏) × (𝑳 + 𝟎. 𝟓/−𝟎. 𝟏𝒎𝒎)(𝑳 ≥
𝟐. 𝟓𝒎𝒎)(𝑾 ± 𝟎. 𝟏𝒎𝒎) × (𝑯 ± 𝟎. 𝟏𝒎𝒎) × (𝑳 + 𝟎. 𝟏/
−𝟎. 𝟏𝒎𝒎)(𝑳 < 𝟐. 𝟓𝒎𝒎) Angle Tolerance ∆𝜽 ≤ 𝟎. 𝟐𝟓° ∆∅ ≤ 𝟎. 𝟐𝟓°
Clear Aperture 90% of central area
Chamfer Chip
≤0.2mm@45 ≤ 0.1mm
Damage Threshold[GW/cm2] ˃ 0.5 for
1064nm,TEM00,10ns,10Hz(AR-
coated)
˃ 0.3 for
532nm,TEM00,10ns,10Hz (AR- coated)
Flatness ˂ λ/8@ 633nm
Parallelism ˂20"
Perpendicularity ≤ 5,
Surface Quality [S/D] ˂ 10/5
Wave front Distortion ˂ λ/8@ 633nm
Coating AR coating available upon
request No visible scattering
paths or centers [inspected by
50mw green laser]
Interior Quality

Chapter Three Experimental Part
05
3.6 Z- Scan Technique Experimental
The nonlinear optical properties for Potassium Titanyl Phosphate (KTiOPO3
or KTP) crystal is explained through z-scan measurements to determine the
nonlinear refraction index and the nonlinear absorption coefficient. The z- scan
experiment illustrates in the figure (3-3).
Figure (3-3) the Z-scan technique set –up experimental in 532nm
In figure (3-3) shows the elements z- scan experiment. In this experiment
consisted of the laser frequency doubler Nd: YAG 532 nm by a power (25) mw
and the lens which for focal length 15 cm. The crystal with dimensions
(6x6x3mm3) was scanned using transition system along direction z- axes
through the focusing area. As well as the aperture place a front detector which
its diameter 1mm. The detector was placed at the far field of laser beam.
In figure (3-4) shows the elements z-scan experiment consisted of the Nd: YAG
with wavelength 1064 nm at a power 35 mw. Then we used the laser He / Ne
which alignment in perpendicular to the set-up .After that mirror reflected the
laser beam inside the set-up. He /Ne laser reflected and transmits laser beam
toward Nd: YAG laser source. We used the lens with focal length 15 cm too,
and the aperture placed between the crystal and the detector, which measures the
transmission. The measurements of the normalization transmissions varies

Chapter Three Experimental Part
05
crystal position, allow the determination of the nonlinear refraction index and
the nonlinear absorption coefficient.
Figure (3-4) picture of the Z-scan set –up experimental
L: Lens, C: Crystal, A: aperture, D: detector, M: mirror
3.7 Experimental Set – up of the Optical Limiting
The optical Limiting experiment was performed for KTiOPO3 crystal using
continuous wave second harmonic Nd: YAG laser of wavelength – 532nm and
power 85mw. The experimental limiting set-up for the demonstration of Optical
Limiting behavior as shown in Fig (3-5, 3-6).

Chapter Three Experimental Part
05
Figure (3-5) set –up of Optical Limiting for (KTiOPO3) crystal
Figure (3-6) the set – up of Optical Limiting for (KTiOPO3)
The laser beam focuses by lens with focal length 15 cm. The Crystal is placed at
the position in focal point. A variable beam splitter (VBS) and was used to vary
to input power. The input power of the laser beam is varied systematically and
the corresponding output power is detected by a power meter.
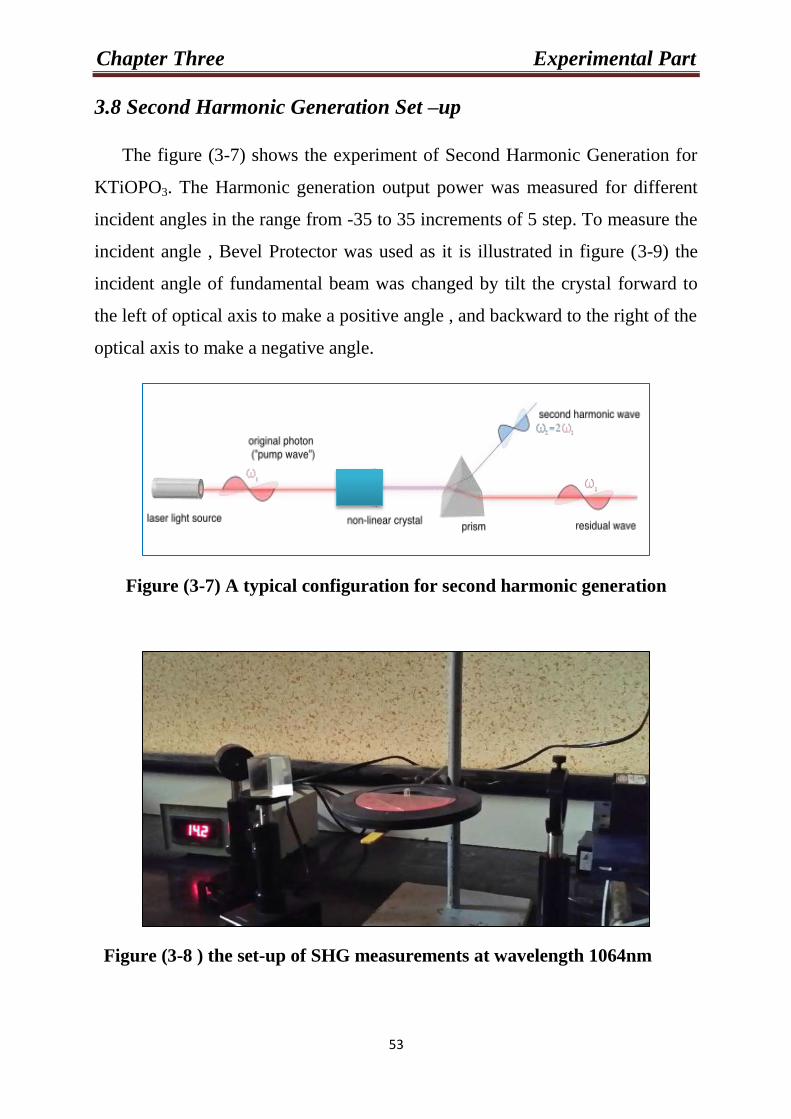
Chapter Three Experimental Part
05
3.8 Second Harmonic Generation Set –up
The figure (3-7) shows the experiment of Second Harmonic Generation for
KTiOPO3. The Harmonic generation output power was measured for different
incident angles in the range from -35 to 35 increments of 5 step. To measure the
incident angle , Bevel Protector was used as it is illustrated in figure (3-9) the
incident angle of fundamental beam was changed by tilt the crystal forward to
the left of optical axis to make a positive angle , and backward to the right of the
optical axis to make a negative angle.
Figure (3-7) A typical configuration for second harmonic generation
Figure (3-8 ) the set-up of SHG measurements at wavelength 1064nm

Chapter Three Experimental Part
07
Figure (3-9) crystal thickness tilts using bevel protractor.

Chapter Three Experimental Part
00
Table (3-3) chemical, structure, linear and nonlinear optical properties of
KTiOPO3 crystal [46, 80, 82, 84]
Chemical Structure KTiOPO3
Crystal Structure Orthorhombic, space group Pna21,point
group mm2
Lattice Parameter a=6.404 Aᵒ, b=10.616 Aᵒ, c=12.814 Aᵒ
Mohs Hardness 5
Density 3.01 g/cm3
Linear and Nonlinear Optical Properties
Thermal Expansion Coefficient αx= 11x10-6
/k, αy= 9x10⁻⁶
/k, αz=0.6x10⁻⁶
/k
Transparency Range 350~4500nm
Therm-optic Coefficients
(/°C)
dnx /dT= 6.1X10⁻⁶
, dny /dT= 8.3X10⁻⁶
dnz /dT= 14.5X10⁻⁶
Absorption Coefficients <0.1%/cm
-1 at 1064nm <1%/cm
-1 at
532nm
For Type II SHG of a Nd:YAG
laser at 1064nm
Temperature Acceptance: 24°C-cm-1
Spectral Acceptance: 0.56 nm-cm-1
Angular Acceptance: 14.2 mrad-cm-1
(φ);55.3 mrad-cm-1
(θ)
Walk-off Angle: 0.55°
NLO Coefficients deff(II)≈(d24-d15)sin2φsin2θ-(d15sin2φ
+ d24cos2φ) sinθ
Non-vanished NLO susceptibilities
[pm/V]
d31=6.5 pm/V d24=7.6 pm/V
d32=5 pm/V d15=6.1 pm/V
d33=13.7 pm/V
Sellmeier Equations
(λ in μm)
nx2=3.0065+0.03901/(λ2-0.04251)-
0.01327λ 2
ny2=3.0333+0.04154/(λ 2-0.04547)-
0.01408λ2
nz2=3.3134+0.05694/(λ 2-0.05658)-
0.01682λ2
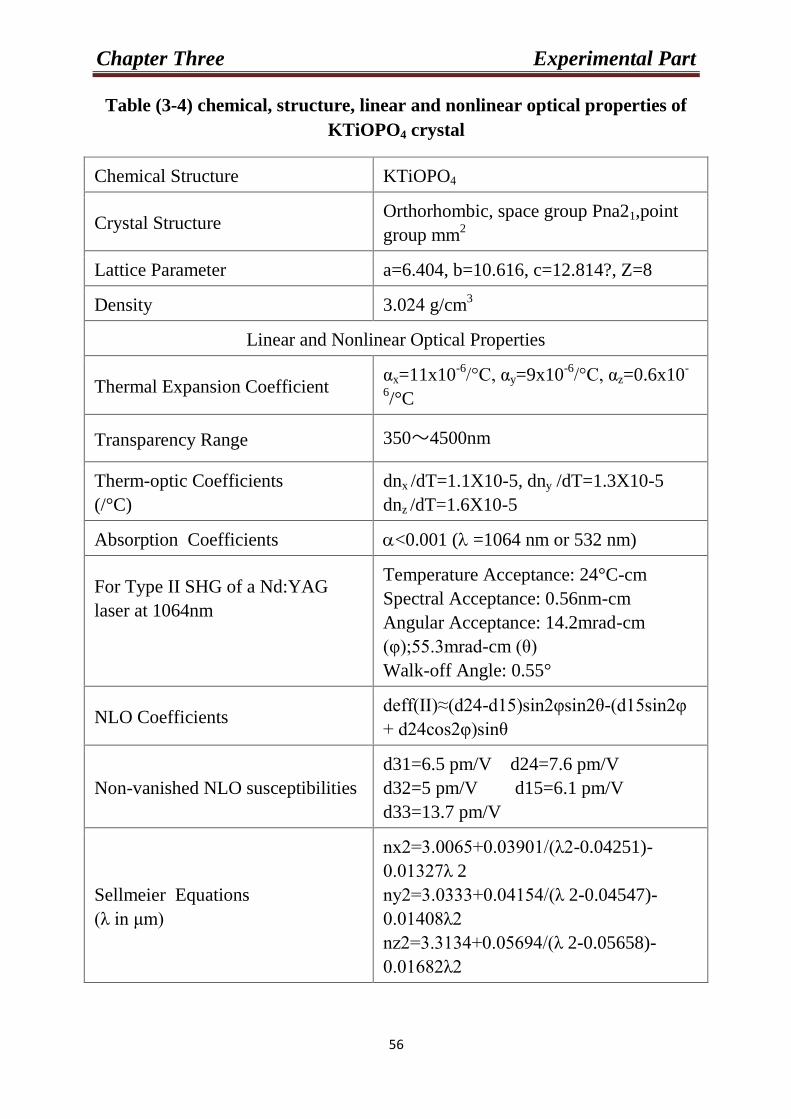
Chapter Three Experimental Part
05
Table (3-4) chemical, structure, linear and nonlinear optical properties of
KTiOPO4 crystal
Chemical Structure KTiOPO4
Crystal Structure Orthorhombic, space group Pna21,point
group mm2
Lattice Parameter a=6.404, b=10.616, c=12.814?, Z=8
Density 3.044 g/cm3
Linear and Nonlinear Optical Properties
Thermal Expansion Coefficient αx=11x10
-6/°C, αy=9x10
-6/°C, αz=0.6x10
-
6/°C
Transparency Range 350~4500nm
Therm-optic Coefficients
(/°C)
dnx /dT=1.1X10-5, dny /dT=1.3X10-5
dnz /dT=1.6X10-5
Absorption Coefficients <0.001 (=1064 nm or 532 nm)
For Type II SHG of a Nd:YAG
laser at 1064nm
Temperature Acceptance: 24°C-cm
Spectral Acceptance: 0.56nm-cm
Angular Acceptance: 14.2mrad-cm
(φ);55.3mrad-cm (θ)
Walk-off Angle: 0.55°
NLO Coefficients deff(II)≈(d24-d15)sin2φsin2θ-(d15sin2φ
+ d24cos2φ)sinθ
Non-vanished NLO susceptibilities
d31=6.5 pm/V d24=7.6 pm/V
d32=5 pm/V d15=6.1 pm/V
d33=13.7 pm/V
Sellmeier Equations
(λ in μm)
nx2=3.0065+0.03901/(λ2-0.04251)-
0.01327λ 2
ny2=3.0333+0.04154/(λ 2-0.04547)-
0.01408λ2
nz2=3.3134+0.05694/(λ 2-0.05658)-
0.01682λ2

Chapter Four
RESULTS
AND
DISCUSSIONN

Chapter Four The Results and Discussion
55
4.1 Introduction
This chapter explains the experimental results and discussion that gained
them through the study of linear and nonlinear optical properties for KTiOPO3
crystal, which has dimensions of 6x6x3 mm3. The optical results represent by
absorption, transmission spectra and calculation of optical constants, the optical
energy gap, and to calculate the optical conductivity.
The nonlinear optical properties represent absorption nonlinear coefficient,
and refraction nonlinear index into wavelength (1064, 532) nm for Nd:YAG
laser by using Z-scan technique. In addition to display results of second
harmonic generation for KTP crystal in 1064nm.
4.2 Optical properties for Potassium Titanyl Phosphate
4.2.1 Linear Optical Properties
We studied the spectral of absorbance and transmittance for KTP crystal by
the use of the spectrophotometer (UV-Visible). Here the obtained results from
this study.
The figure (4-1) shows the absorbance spectra for KTP crystal, the highest
value for the absorbance is 0.312 at wavelength 330 nm. Figure (4-2) shows the
transmittance spectrum for KTP crystal, which possess highest value for
transmittance, is 88.34% at wavelength (1095) nm.
Through the absorbance and transmittance spectrum, the reflective curve
was calculated that is related with the absorbance and transmittance through the
relation (2-4) .Also the optical constants were calculated , the linear absorption
coefficient, the extinction coefficient, and the refraction index , as well as the
calculation of the optical energy gap and the optical conductivity that explained
in figures (4-3,4-4,4-5,4-6,4-7,4-8) receptivity.

Chapter Four The Results and Discussion
55
Through our linear optical measurements for KTP crystal, we found from
these measurements, the highest value for absorption coefficient is 2.399 when
incident photon energy is 3.75 eV as illustrated in the figure (4-4). The highest
value for refractive index is 2.621 when the incident photon energy is 3.6 eV as
shown in the figure (4-5). The highest value for extinction coefficient is
6.46х10-9
when the incident photon energy 3.6 eV as illustrated in the figure (4-
6). We found that the optical energy gap is 3.8 eV as shown in the figure (4-7).
The highest value of the optical conductivity is 2.621 at wavelength 344 nm as
illustrated in the figure (4-8).
4.2.1.1 Absorbance
The absorbance of KTiOPO3 is measured by the spectrophotometer (UV-
Visible) at wavelengths (300-1100) nm recorded using Mega (UV-2100) for
constant thickness (3mm).
Figure (4-1) illustrates the values of absorbance as far as the wavelength that
shows the KTiOPO3 crystal has the highest value for the absorbance is 0.312
when incident photon energy is 330 nm. After that, rapidly it decreased with the
increased of the wavelength.
Figure (4-1): The Absorbance versus wavelength for KTiOPO3.
0
0.05
0.1
0.15
0.2
0.25
0.3
0.35
300 400 500 600 700 800 900 1000 1100
Ab
sorp
anse
wavelength nm

Chapter Four The Results and Discussion
55
The crystal is the strong absorption .It is caused by OH groups grown into, or
trapped in the crystal during grow. The OH group oscillates as a hydroxyl
molecule and forms an OH defect in the crystal. This is attribute to the vibration
in the PO tetrahedral.
4.2.1.1 Transmittance
Transmittance spectra studied in wavelength range (300-1100) nm for
KTiOPO3 crystal with constant thickness (3mm).The transmittance spectra
depends on many factors such as quantity of energy levels, which connects in
chemical structure and matter crystallization. It also depends on thickness that
has a vital role in matter transmittance. Figure shows (4-2) the transmittance
spectra for KTP crystal as function for wavelengths. The transmittance spectra is
reversed in behavior to the absorbance spectra. It illustrates the transmittance
that has a decreased with value at short wavelength then increased the
transmittance with the increment of wavelength. It is observed from the same
figure (4-2) the highest value for transmittance, is 88.34% at wavelength 1095
nm.
Figure (4-2): The Transmittance versus the wavelength.
0
0.1
0.2
0.3
0.4
0.5
0.6
0.7
0.8
0.9
1
300 400 500 600 700 800 900 1000 1100
Tran
smit
ance
Wavelength nm

Chapter Four The Results and Discussion
55
4.2.1.3 Reflection
The calculation of reflection depending on absorption and transmittance by
the relation (2-4). The figure (4-3) displays the curve of reflection as a function
of photon energy for KTP crystal and shows the similarities of this curve with
absorption coefficient because reflection conect in a relation with absorbance.
The highest value begins for reflective spectra is 0.2 when incident photon
energy is 3.5 eV and up.
Figure (4-3): Reflectance spectra for KTiOPO3
4.2.1.4 Absorption Coefficient
The calculation of absorption for KTP crystal in thickness 3mm through the
relation (2-6). The absorption coefficient depends on incident photons energy
and on the properties of the matter that represented by energy gap and electronic
transmission types that happened among energy bands. The figure (4-4) shows
the relation of absorption coefficient as a function for photon energy for KTP
crystal, the values of absorption coefficient increased gradually with the increase
of photon energy then it reaches highest value for absorption coefficient 2.399
when incident photon energy is 3.75 eV and up.
0.1
0.12
0.14
0.16
0.18
0.2
0.22
3 3.5 4 4.5 5 5.5 6 6.5
Ref
lect
ance
Photon energy eV

Chapter Four The Results and Discussion
55
Figure (4-4): Absorption coefficient versus photon energy.
4.2.1.5 Refraction Index
Through the relationship (2-7), the refraction index has been calculated of
KTP crystal. The figure (4-5) explains the change of refraction index with
photon energy, and the highest value for refractive index is 2.621 when the
incident photon energy is 3.6 eV. Therefore, it is observed that the refraction
curve similar to reflection curve because of the connection the reflection with
the refraction index according to relation (2-7).The refraction index depends on
the type of material and its crystallization structure.
Figure (4-5): Refractive index variation of photon energy
0
0.5
1
1.5
2
2.5
3
3 3.5 4 4.5 5 5.5 6 6.5
Ab
sorp
tio
n c
oef
fici
ent
cm
-1
Photon energy eV
2
2.1
2.2
2.3
2.4
2.5
2.6
2.7
3 3.5 4 4.5 5 5.5 6 6.5
Ref
rara
ctiv
e n
dex
Photon energy eV

Chapter Four The Results and Discussion
56
4.2.1.6 Extinction coefficient
Extinction coefficient was calculated through the values of absorption
coefficient by using the equation (2- 8). The figure (4-6) shows the change of
extinction coefficient with photon energy for KTP crystal and the highest value
for extinction coefficient is 6.32х10-5
when the incident photon energy 3.67 eV.
Figure (4-6): Extinction coefficient versus incident photon energy.
4.2.1.7 The Band Energy Gap
The value of optical energy gap is one of the most important of optical
magnitudes that effected by the structure of material. The energy gap of
KTiOPO3 crystal determined for forbidden direct electronic transition by using
the relation (2-9), it was r=3/2. The draws the relation between (һν) 3/2 and
photon energy (һν) and draws the straight part to cut axis of photon energy at the
point (һν) = 0. The energy gap to forbidden direct transition , is (3.8eV) for KTP
crystal as shown in figure (4-7).This magnitude is near for KTiOPO3 energy
value when our comparison for this results with the results of energy gap to
KTiOPO4 crystal that found in[],[] and the comparison was corresponding.
0.00E+00
1.00E-05
2.00E-05
3.00E-05
4.00E-05
5.00E-05
6.00E-05
7.00E-05
0 1 2 3 4 5 6 7
Ext
inct
ion
Co
effi
cien
t ×1
0-7
Photon Energy eV
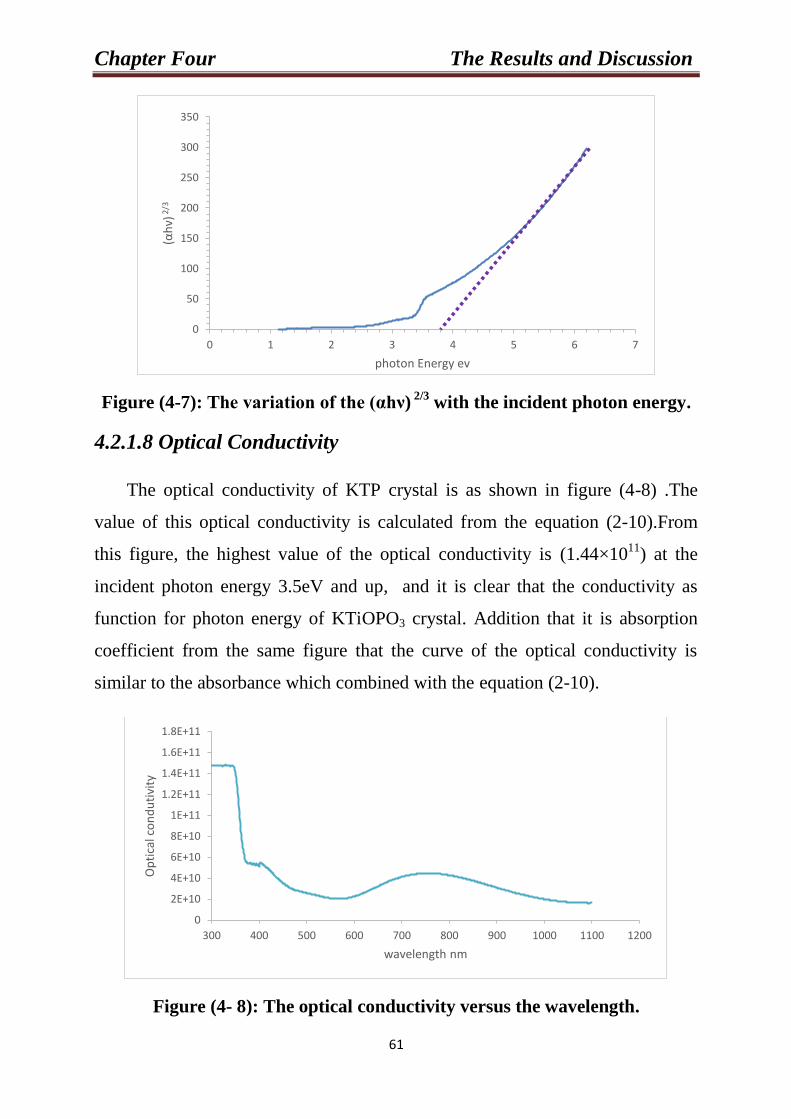
Chapter Four The Results and Discussion
56
Figure (4-7): The variation of the (αһν) 2/3
with the incident photon energy.
4.2.1.8 Optical Conductivity
The optical conductivity of KTP crystal is as shown in figure (4-8) .The
value of this optical conductivity is calculated from the equation (2-10).From
this figure, the highest value of the optical conductivity is (1.44×10¹¹
) at the
incident photon energy 3.5eV and up, and it is clear that the conductivity as
function for photon energy of KTiOPO3 crystal. Addition that it is absorption
coefficient from the same figure that the curve of the optical conductivity is
similar to the absorbance which combined with the equation (2-10).
Figure (4- 8): The optical conductivity versus the wavelength.
0
50
100
150
200
250
300
350
0 1 2 3 4 5 6 7
(αhν)
2/3
photon Energy ev
0
2E+10
4E+10
6E+10
8E+10
1E+11
1.2E+11
1.4E+11
1.6E+11
1.8E+11
300 400 500 600 700 800 900 1000 1100 1200
Op
tica
l co
nd
uti
vity
wavelength nm
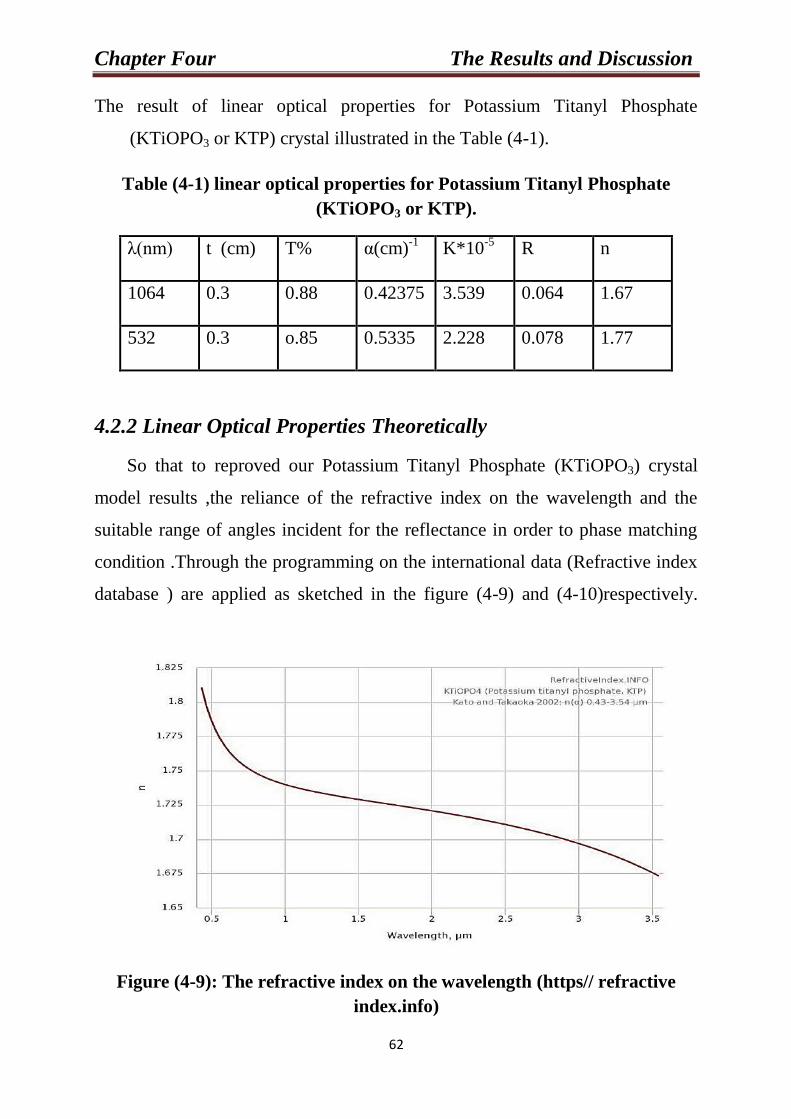
Chapter Four The Results and Discussion
56
The result of linear optical properties for Potassium Titanyl Phosphate
(KTiOPO3 or KTP) crystal illustrated in the Table (4-1).
Table (4-1) linear optical properties for Potassium Titanyl Phosphate
(KTiOPO3 or KTP).
n R K*10-5
(cm)-1
α T% t (cm)
λ(nm)
1.67 0.064 3.539 0.42375 0.88 0.3
1064
1.77 0.078 2.228 0.5335 o.85 0.3
532
4.2.2 Linear Optical Properties Theoretically
So that to reproved our Potassium Titanyl Phosphate (KTiOPO3) crystal
model results ,the reliance of the refractive index on the wavelength and the
suitable range of angles incident for the reflectance in order to phase matching
condition .Through the programming on the international data (Refractive index
database ) are applied as sketched in the figure (4-9) and (4-10)respectively.
Figure (4-9): The refractive index on the wavelength (https// refractive
index.info)

Chapter Four The Results and Discussion
56
The figure (4-9) shows that refractive index of KTiOPO3 decreases gradually
with the increased of the wavelength .The refractive index at 1064nm was (1.67)
and (1.77) at wavelength 532nm, that is agreement with our experimental
results.
Figure (4-10) Dependence of reflectance on the angle of incident (https//
refractive index.info)
In the figure (4-10) is illustrated the relation between the reflectance and the
incident face of KTP crystal, and noticed that the ref ectance from the incident
face of T crysta is 35 degree.

Chapter Four The Results and Discussion
56
4.2.3 Nonlinear optical properties
The practical results that we obtained from Z-scan technique for both close
and open aperture to Potassium Titanyl Phosphate KTP crystal by using laser
CW Nd:YAG in to two wavelengths 1064 nm and frequency doubler 532 nm
with different powers(25,35,80) mW as illustrated in the figures(4-11,4-12, and
4-13) respectively.
The magnitude of nonlinear optical coefficients for Potassium Titanyl
Phosphate KTP crystal has been calculated. The calculation of nonlinear
refraction index (n2) value from the equation (2-29), the change in the value of
refraction index (Δn) from the equation (2-30), whereas the magnitude of
nonlinear absorption coefficient calculated from the equation (2-31), as well as
the absolute value the third order nonlinear optical susceptibility |χ(3)
|from the
equation (2-32).
The figures (4-11 (a),4-12 (a), 4-13 (a)) represent the transmittance curve of
KTP crystal depends on a different position in the close aperture Z-scan, and the
figures (4-11 (b), 4-12 (b), 4-13 (b)) The transmission curve of KTP crystal
depends on a different position in the open aperture Z-scan.
To obtain the nonlinear refraction index only, the values of transmission
laser beam in case of close aperture is divided on the values transmission in case
of open aperture as illustrated in the figures (4-11 (c), 4-12 (c), 4-13(c)).

Chapter Four The Results and Discussion
55
(a)
(b)
(c)
Figure (4-11): The normalize transmittance curve as a function of position
for the crystal at wavelength 1064nm with power 35mW. (a) The
transmittance curve when the close aperture (b) when the open aperture.
(c) The transmittance curves that resulted from the division of the
transmittance curve for the close aperture to transmittance curve for open.
15
17
19
21
23
25
27
29
31
-5 -4 -3 -2 -1 0 1 2 3 4 5
No
rmal
ize
Tran
smis
sio
n
Z (cm)
30
30.5
31
31.5
32
32.5
33
33.5
34
34.5
-5 -4 -3 -2 -1 0 1 2 3 4 5
No
rmal
ize
Tran
smis
sio
n
Z cm
0.5
0.55
0.6
0.65
0.7
0.75
0.8
0.85
0.9
0.95
-5 -4 -3 -2 -1 0 1 2 3 4 5
No
rmal
ized
Tra
nsm
itta
nce
Z cm

Chapter Four The Results and Discussion
55
(a)
(b)
(c)
Figure (4-12): The normalize transmittance curve as a function of position
for the crystal at wavelength 532nm with power 80mW. (a) The
transmittance curve when the close aperture (b) The transmittance curve
when the open aperture. (c) The transmittance curves that resulted from
the division of the transmittance curve for the close aperture to
transmittance curve for open.
71
72
73
74
75
76
77
78
79
80
-5 -4 -3 -2 -1 0 1 2 3 4 5
No
rmal
ize
Tran
smis
sio
n
Z cm
0.98
1
1.02
1.04
1.06
1.08
1.1
1.12
-5 -4 -3 -2 -1 0 1 2 3 4 5
N0
rmal
ized
Tra
nsm
itta
nce
Z cm
67
68
69
70
71
72
73
74
75
-5 -4 -3 -2 -1 0 1 2 3 4 5
No
rmal
ize
Tran
smis
sio
n
Z cm

Chapter Four The Results and Discussion
55
(a)
(b)
(c)
Figure (4-13): The normalize transmittance curve as a function of position
for the crystal at wavelength 532nm with power 25mW. (a) The
transmittance curve when the close aperture (b) The transmittance curve
when the open aperture. (c) The transmittance curves that resulted
transmittance curve for the close aperture to transmittance curve for open.
0.98
1
1.02
1.04
1.06
1.08
1.1
1.12
1.14
-5 -4 -3 -2 -1 0 1 2 3 4 5
No
rmal
ized
Tra
nsm
itta
nce
Z cm
22
22.5
23
23.5
24
24.5
25
-5 -4 -3 -2 -1 0 1 2 3 4 5
No
rmal
ize
Tran
smis
sio
n
Z cm
21
21.5
22
22.5
23
23.5
-5 -4 -3 -2 -1 0 1 2 3 4 5
No
rmal
ize
Tran
smis
sio
n
Z cm

Chapter Four The Results and Discussion
55
The observed from the results of Z-scan technique for KTP crystal that the
non inear refraction index va ue is 3.59х10-14
cm2/mW at wavelength 1064 nm,
and the value of nonlinear refraction index n2 is 3.67х10-14
, 3.35х10-14
cm2/mW
at the wavelength frequency doubler 532 nm with powers 80, 25 mW
receptivity.
The magnitude of non inear absorption coefficient β is 2.71х10-3
cm/mW at
wavelength 1064 nm. The magnitude of nonlinear absorption coefficient β is
4.32х10-3
, 3.37х 10-3
cm/mW at wavelength frequency doubler 532nm with two
powers 80, 25 mW receptivity.
The value of the third order nonlinear optical susceptibility |χ (3)
| is 2.55х10-5
at wave ength 1064 nm with power 35 mW. Its va ue is 2.28х10-5, 2.32х10
-5 at
wavelength frequency doubler 532 nm with two powers 80, 25 mW receptivity.
The Table (4-2) is summarized the nonlinear optical properties that
calculated for KTP crystal.
Table (4-2): The results of nonlinear optical properties for KTiOPO3 crystal
by Z-scan technique.
λ
(nm)
Power of
laser(mW)
ΔΦ
(Rad)
ΔTp-v n2×10-14
(cm2/mW)
Δn
×
10-9
Tmin β ×10-3
(cm/mW)
│χ(3)│×
10-3
(esu)
1064 35 24.137 9.8 3.59 4.08 31.2 2.71 2.55
532 80 17.241 7 3.67 5.77 68 4.32 2.28
25 4.926 2 3.35 1.65 21.5 4.37 2.32
Moreover, we found that the values of nonlinear absorptions coefficient
influence by the wavelength. The results of our study of KTP crystal, that the
non inear absorption coefficient β 4.32х10-3
, 4.37х10-3
cm/mW at the
wavelength frequency doubler 532nm, with for two different intensities larger

Chapter Four The Results and Discussion
55
than the magnitude of that nonlinear absorption coefficient 2.71х 10-3
at
wavelength 1064 nm. As illustrated in figure (4-14), because the absorbance of
crystal decrease with the increase of wavelength.
Figure (4-14) nonlinear absorption coefficient a function to the wavelength
From the result that obtained for Potassium Titanyl Phosphate KTP crystal
from the Z-scan technique for both close and open aperture , we found that KTP
crystal has self-defocusing effect and two photons absorption , also it has a high
va ues to the third order non inear optica susceptibi ity χ (3)
.
4.3 Optical Power Limiting
We made a study to optical power limiter for Potassium Titanyl Phosphate
KTP crystal by use Z-scan technique and Nd: YAG laser CW at frequency
doubler 532 nm with power rang (10-85) mW. The figure (4-15) represent the
optical power limiter. It is observed from this figure that KTP crystal occurs a
good optical power limiter at 60 mW threshold.
5.00E-04
1.00E-03
1.50E-03
2.00E-03
2.50E-03
3.00E-03
3.50E-03
4.00E-03
4.50E-03
5.00E-03
200 400 600 800 1000 1200
β c
m/m
W
Wavelength nm

Chapter Four The Results and Discussion
56
Figure (4-15) The Optical Limiting for KTP crystal.
The figure (4-15)shows the input power in the range (10,20,30,40, 50
,60,65,70,75,80,85) mW .the output beam power increases with increasing
input beam power for KTP crystal ,up to 60mw the output beam power is
constant, because its nonlinear absorption coefficient increases with increases in
the incident irradiance. The volume of limiting threshold for KTP crystal is
found 60 mw. Result that KTP crystal is good for optical limiter. To obtain other
representation for optical power limiter, we draw transmittance laser beam
(output power/ input power) on the expense input laser beam power to crystal, as
it is shown in the following figure (4-16).
Figure (4-16): The transmittance curve via input power for KTP crystal.
0
10
20
30
40
50
60
0 10 20 30 40 50 60 70 80 90
ou
t p
ut
p (
mw
)
in put p( mw)
0
0.2
0.4
0.6
0.8
1
10 20 30 40 50 60 70 80 90
No
rmal
ized
Tra
nsm
itta
nce
Input power mW

Chapter Four The Results and Discussion
56
The values of optical limiter for KTiOPO3 crystal listed in Table (4-3).
Table (4-3) the value of the power-limiting threshold.
Power Limiting
Threshold Lm (mw)
λ (nm) crystal
60 532 KTP
4.4 The Intensity of Second Harmonic Generation.
The figure (4- 17) shows the experimental results. The intensity of harmonic
generation as a function of the incident ang e range which was obtained at -35
and 35 . The path ength inside the T crysta was decreased when increasing
the incident angle .Harmonics generation intensity was disappear at the critical
incident angles because no signal will be detected at the critical angles.
Figure (4-17) Harmonic generation output intensity versus incident angle
The different values of harmonic generation of intensity at each the input
power due to the charge in the incident angle of fundamental beam. The cause of
the change in the incident angle of the fundamental beam is to get the efficient
20
22
24
26
28
30
32
34
36
38
-40 -35 -30 -25 -20 -15 -10 -5 0 5 10 15 20 25 30 35 40
Har
mo
nic
Gen
erat
ion
Inte
nsi
ty
mW
/cm
2
Incident Angle(deg

Chapter Four The Results and Discussion
56
harmonics generation intensity at was indicated a change in refractive index,
which is well agreement with our theoretical results, illustrated figure (4-9).
When the input power of 1064nm Nd: YAG laser was 35mw the generated of
the second harmonics 532nm by using T crysta was obtained at incident
ang e 1 with 14.3mW powerful.
The efficiency of harmonic generation can be calculated from equation (2-
16). It can be noticed from the results in Table (4-4).
Table (4-4) present the result experimental of Second Harmonic Generation
of Potassium Titanyl Phosphate (KTiOPO3 or KTP).
The efficiency
%
Harmonic
Generation
Input Power
(mW)
Laser Type
13 SHG 35 Nd:YAG
1064nm

Chapter Four The Results and Discussion
56
4.5 Conclusion
Through the results that obtained from the study of optical properties, the
nonlinear optical properties, optical power limiting and second harmonic
generation for KTP crystal conclude the following:
1- KTP crystal has a high transmittance because of low of attenuation. The
calculation of energy gap has been determined for direct forbidden uses; it is
found that it equals (3.8 eV).
2- The results presented the simplicity, sensitivity and cases Z-scan technique
and determined the nonlinear refraction index , nonlinear absorption coefficient,
Nonlinear optics susceptibility χ(3)
and also the change in refraction index Δn ,
KTP crystal shows self-defocusing and two photons absorption, moreover it
shows that KTP crystal has high values for both nonlinear refraction index and
nonlinear absorption coefficient ; good and acceptable results are achieved
between theoretical and practical. The crystal has large nonlinear properties.
3-The limiting effect of the crystal occurred at a threshold power value of
60mw for 532nm and measured from deviation of linearity.
4- KTP crystal possesses a high linear properties and a large response to the
nonlinear effects, which enables this crystal to be fit material at the linear,
nonlinear, optical power limiter and second harmonic generation applications.
5- The result of the second harmonic generation that the crystal is excellent
for second SHG to convert the ultraviolet frequency to the visible.

Chapter Four The Results and Discussion
56
4.6 Future Works
In the program of our work, .We suggest the following:
1-Study on the performance of KTiOPO3 crystal as an optical limiter with
different laser wavelength.
2-Investigation of KTP crystal activation by using z- scan technique for two
laser beams.
3-The related experiments by the generation of third and higher for KTP crystal.
4-Invistigate on using KTP crystal to combination the optical parametric
oscillator of type II phase matching, with the second harmonics generation.
5-The study of the better performance of KTP crystal as an element for Q-
Switching solid –state laser with high power pulsing.
6-The study the nonlinear optical properties of KTP crystal to motivate the three
wave mixing.

57
References
[1]-R. w. Boyed, "Nonlinear Optics ", Third Edition, New York, 2007.
[2]- R. L. Sutherland, "Hand book of Nonlinear Optics", Second Edition, New
York, 2003.
[3]- P.A. Franken, A. E. Hill, C.W. Peters, and G. Weinreich, "Generation of
Optical Harmonics ", Journal Physics Review Letters, Vol.7, PP.118, 1961.
[4]- D. J.Hagan,"Handbook of Optics Fiber Optics and Nonlinear Optics
Volume IV", second Edition, 2001.
[5]-P.N. prasad and D.J. Williams, "Introduction to Nonlinear Optical Effects in
Molecules and Polymers", John Wily and Sons, Inc, Now York, USA, 1991.
[6]- J.Zyss,"Molecular Nonlinear Optics: Materials, Physics, and Devices,
Academic Press,Inc.,San Diego, USA, 1994.
[7]- H.Ditlbacher, J.R.Krenn, B.L, A.Leitner, and F.R.Aussengg, "Spectrally
coded optical data storage by metal nanoparticals', J.Opt.Lett.Vol.25, PP.563,
2000.
[8]- F.Z. Henri and S. Cassidy, "Nonlinear optical properties and all optical
switching of congo red in solution", J. Optik, Vol.123, PP.711, 2012.
[9]-Y.R. Shen, "The Principles of Nonlinear Optics ", Second Edition (John
Wiley and Sons, Inc., New York, USA, 2003.
[10]- A. Yariv, "Quantum Electronics", Third Edition, John Wiley and Sons,
Inc., New York, USA, 1989.
[11]- T. Kobayashi," Nonlinear Optics of Organics and Semiconductors",
Springer Proceeding in Physics, Vol.36, Springer-Verlag, Berin Germany, 1989.
[12]- A.J. Steckl, H. Spaeth, H. You, E. Gomez, and J. Grote, "DNA as an
Optical Material", Optics and Photonics News,Vol.22,PP.34,2011.
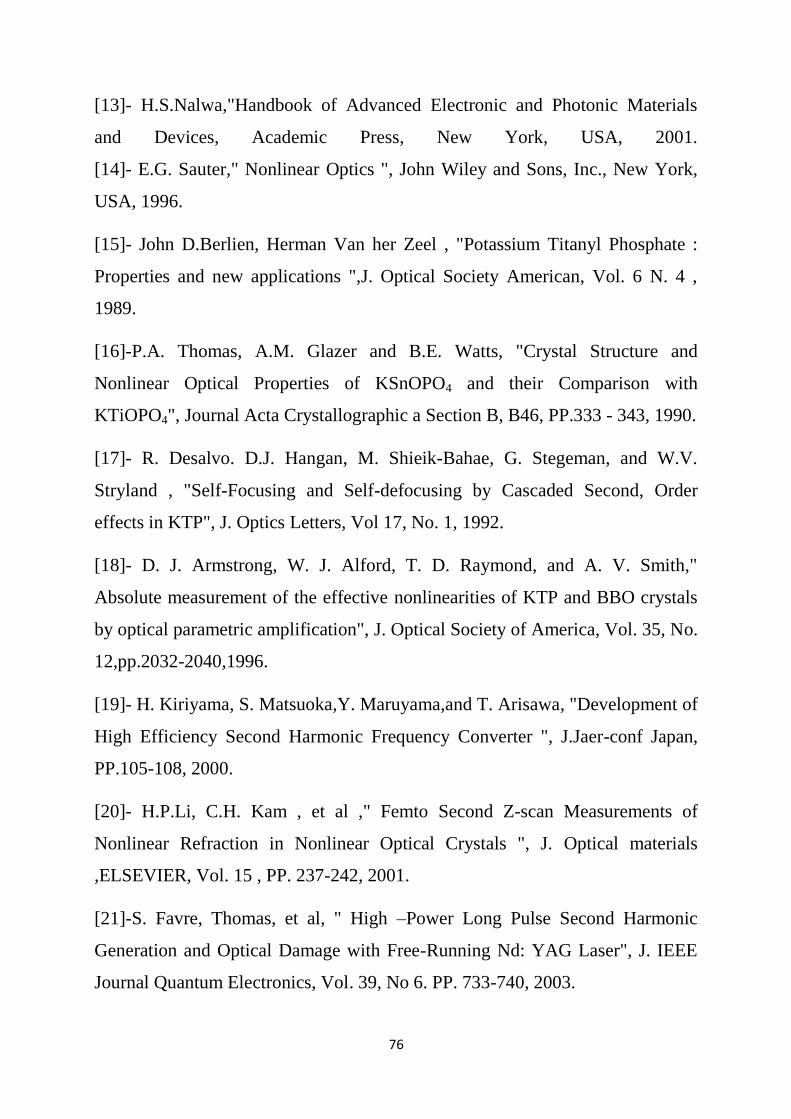
57
[13]- H.S.Nalwa,"Handbook of Advanced Electronic and Photonic Materials
and Devices, Academic Press, New York, USA, 2001.
[14]- E.G. Sauter," Nonlinear Optics ", John Wiley and Sons, Inc., New York,
USA, 1996.
[15]- John D.Berlien, Herman Van her Zeel , "Potassium Titanyl Phosphate :
Properties and new applications ",J. Optical Society American, Vol. 6 N. 4 ,
1989.
[16]-P.A. Thomas, A.M. Glazer and B.E. Watts, "Crystal Structure and
Nonlinear Optical Properties of KSnOPO4 and their Comparison with
KTiOPO4", Journal Acta Crystallographic a Section B, B46, PP.333 - 343, 1990.
[17]- R. Desalvo. D.J. Hangan, M. Shieik-Bahae, G. Stegeman, and W.V.
Stryland , "Self-Focusing and Self-defocusing by Cascaded Second, Order
effects in KTP", J. Optics Letters, Vol 17, No. 1, 1992.
[18]- D. J. Armstrong, W. J. Alford, T. D. Raymond, and A. V. Smith,"
Absolute measurement of the effective nonlinearities of KTP and BBO crystals
by optical parametric amplification", J. Optical Society of America, Vol. 35, No.
12,pp.2032-2040,1996.
[19]- H. Kiriyama, S. Matsuoka,Y. Maruyama,and T. Arisawa, "Development of
High Efficiency Second Harmonic Frequency Converter ", J.Jaer-conf Japan,
PP.105-108, 2000.
[20]- H.P.Li, C.H. Kam , et al ," Femto Second Z-scan Measurements of
Nonlinear Refraction in Nonlinear Optical Crystals ", J. Optical materials
,ELSEVIER, Vol. 15 , PP. 237-242, 2001.
[21]-S. Favre, Thomas, et al, " High –Power Long Pulse Second Harmonic
Generation and Optical Damage with Free-Running Nd: YAG Laser", J. IEEE
Journal Quantum Electronics, Vol. 39, No 6. PP. 733-740, 2003.

55
[22]- E. Gharibshahian, M. J. Tafreshi, and M. Fazli, "Growth of KTiOPO4
crystals by Flux Technique and Their Characterization ", Indian J. of pure and
applied Physics, Vol.47, PP.356-361, 2009.
[23]- A .K. Chaudhary , A. Molla, and A. Asfaw , " Measurement of Refractive
Index of Biaxial Potassium , Titanyl Phosphate Crystal Plate using Refraction
Spectroscopic Ellipsometry technique " J. Pramana Journal of physics , Vol
73,No. 4 . PP. 731-741, 2009.
[24]- A. H. Reshak, I. V. Kityk, "Investigation of the Linear and Nonlinear
Optical Susceptibilities of KTiOPO4 Single Crystals: Theory and Experiment ",
J. Phys. Chem. B, Vol. 114, PP. 16705–16712, 2010.
[25]-J.R. Gandhi, B. Vijayalakshmi, M. Ratnakumari, and P. Sureshkumar ,
"Growth of Pure and Mo-Doped Potassium Titanyl Phosphate KTP crystals
:Influence of KTP / flux Ratios on the Growth Morphology " , J. of minerals and
materials characterizations and engineering , Vol. 10 , No. 8, PP. 683-691, 2011.
[26]-J.R. Ghandi, M. Rathnakumari, K. Ramamurthi, R.R. Babu, D. Sastikumar
and P. Sureshkumar ," Measurement of Nonlinear Refractive Index of Pure and
Dopped KTP Crystal by z-scan Technique using CW He-Ne Laser ", J. Optik ,
Vol.125, PP.6462 - 6465 , 2014.
[27]-A. Potreck, H. Schroder, M. Lammers, G. Tzeremes, and W. Riede ,
"Nonlinear Optical Frequency Conversion with KTP and BiBO crystals for
Laser in Space, Tokyo, 2014.
[28]- F. H. Cao , Yueli , Y.F. Dong, Y.L. Wang, and X. Chen, " Passed on the
KTP crystal double frequency laser experiment system research ", J. advances in
Engineering research AER , Vol.107 , PP. 527-531, 2016 .
[29]-S. Gangopadhyaya, "Properties and Application of Nonlinear Biaxial
Crystal Potassium, Titanyl Phosphate ", Vol. 13, No. 1, PP. 162-165, 2017.
57
[30]-J. Singh, "Electronic and Optoelectronic properties of Semiconductor
Structures", Cambridge University, 2003.
[31]- W.D. Callister, "Fundamental of materials Science and Engineering",
2001.
[32]- M.A. Omar, "Elementary Solid State Physics Principle and Applications",
PP. 35-578, 1985.
[33]- B. Saporal and C. Herman, "Physics of Semiconductors" by Springer
verlag, New York, Inc.1995.
[34]- D.A. Neamen,"Semiconductor physics and Devices ", University of New
Mexico, 1992.
[35]-Sirotin and M.Shaskolskys,"Fundamentals of Crystal Physics ", Mir
Publishers, Moscow, 1982.
[36]- J.Taus ,"Amorphous and Liquids Semiconductors", Plenum Press ,
London, New York,1974.
[37]-K.W. Whitten, R.E. Davis , " Chemistry", Tenth Edition .M. Larry Peck,
George G. Stanley, 2014.
[38]- C. Kittle, "Introduction to Solid State Physics", Sixth Edition, Wiley, 1986.
[39]-S.O. Kasap, "Principles of Electronic Materials and Devices ", McGraw-
Hill, New York, 2002.
[40]- S. Ben, "Solid State Electronic Devices", Hall International , Inc., U.S.A,
1990.
[41]- L. J. Tomar, P. J. Bhatt, et al ," Effect of Preparation Method on Optical
and Structural Properties of TiO2/ZrO2 Nano composite", Journal of
Nanotechnology & Advanced Materials,Vol.2, No.1,PP.27-33. 2014.

57
[42]- N. Bloembergen, "Fundamental Optics and Photonics ", Chapter 19, 1996.
[43]-A. Fragemann, "Optical Parametric Amplification with Periodically Poled
KTiOPO4",Ph.D.Thesis, Royal Institute of Technology, 2005.
[44]-S. A. Ponomarenko, "Fundamentals of Nonlinear Optics ", Lecture Notes,
PP.74, 2016.
[45]-C. R. Vazquez, "Optical Parametric Processes with Femtosecond Pulses in
Nonlinear Crystals. Novel Schemes and Application ", Ph.D. Thesis, Salamanca,
2012.
[46]- S .Wang, "Fabrication and Characterization of Periodically Poled KTP and
Rb –doped KTP for applications in the Visible and UV" Ph.D. thesis, Sweden,
2005.
[47]- K .Sunkhoy,"Generation of Second Harmonic Radiation in LBO , KTP
and PPLN crystal using passively Q-switched sub-naro second microchip laser",
Master thesis ,University of Manitoba, Canada, 2011.
[48]- H. Karsson, "Fabrication of Periodically Poled Crystals from the KTP
Family and their applications in nonlinear optics", Ph.D. thesis, Royal Institute
of Technology, Sweden, 1999.
[49]-M. Csele, "Fundamentals of Lights sources and Lasers ", Wiley Inter
science, Chapter 8, Canada, 2004.
[50]- X. Jianjun, X. Y. Chao, Y. Lime ", Research on the Method of Optimal
PMN placement ", International Journal of Online engineering ,Vol. 9, PP. 42-
29, 2013.
[51]- M. Bass, P.A. Franken, A.E. Hill, C.W. Peters and G. Weinreich, Journal
Physics Review letters Vol. 8, PP. 18, 1962.
[52]- M. Sodha, "Theory of nonlinear refraction, Self-Focusing of Laser beams",
Journal Physics.Edu Ind , Vol.1,1973.

78
[53]-W. T. Silfast, "Laser Fundamentals", Cambridge University Press, 1999.
[54]- S. A. Aakif, "Investigation on Higher Harmonics Generation with BBO (β-
BaB2O4) crystal", Master thesis, Al-Huraa University in Holland, 2009.
[55]-T. Cassano, R. Tommasi, M. Ferrara,F. Baabudri,G.M. Farinola and F.
Nsso, "Substituent –dependence of the optical nonlinearities in poly (2.5-
diakoxy-p-phenylenevinylene) Polymers investigated by Z-scan technique",
Journal .Chemistry Physics, Vol. 272, PP.111, 2001.
[56]-S.Teichmann, "High Harmonic Generation for Coherent Diffractive
Imaging", Ph.D. thesis, Australia, 2009.
[57]-B. K. Dinh , "Phase-Matched High Order Harmonic Generation and
Appreciation ",Ph.D. Thesis, Australia 2012.
[58]- J. Renink, "Pulse Shaping for High Harmonic generation ", Master Thesis,
University of Twentc , Faculty of Science and Technology.
[59]- Benjamin K.Miller, "Classical Analysis of High Harmonic Generation,
Undergraduate Honors thesis, PP.8, 2015.
[60]- A. A. Ali, Z. F. Mahdi, "Investigation of nonlinear optical properties for
laser dyes-doped polymer thin film", Iraqi Journal of Physics, Vol.10, No.19,
PP.54- 69, 2012.
[61]-P.N. Butcher and D. Cotter, "The Element of Nonlinear optics ",
Cambridge University Press, Cambridge, UK, 1990.
[62]-R.R. Krishnamurthy and R. Alkoudan, "Nonlinear characterization of
Mercurochrome dye for Potential application in optical limiting ", Journal
Optica Application, Vol.40, PP.127, 2010.
[63]-N.K.M. Srinivas, S. V. Rao and D.N. Rao, "Saturable and reverse saturable
absorption of Rhodamine B in Methanol and water ", Journal .Optical Society
American, B.20, PP.2470, 2003.

78
[64]- H. H. Al-Ghanemy, "A Study of Nonlinear Optical Properties of Polymer
Thin Film Doped by Laser Dyes-R6G", Master thesis, University of Karbala,
2015.
[65]-M. Sheik- Bahae, A.A. Said, and E.W. Van Stryland, "High Sensitive
Measurement Single Beam n2 Measurements", J.Opt. Lett, Vol. 14,PP.955,1989.
[66]- P. Neethling, "Determining Nonlinear Optical properties using the Z-scan
technique", Master thesis, The University of Stellenbosch, , 2005.
[67]- P.B. Chapple, J. Starom,Y. Mska, J.A. Hermann and T.J. Mckay, "Single –
Beam Z-scan: Measurement Technique and analysis ", Nonlinear Optical
Physics and Materials, Vol. 6 No.3, PP. 251-293, 1997.
[68]- S. Kumaresanand and M.B. Ahamed, "Single Beam Z-scan Measurement
of the Third order Optical Nonlinearities of Styryl7 Dye" J. Optik-International
Journal for Light and Electron Optics, Vol.125, PP.6152-6154, 2014.
[69]- M. Fonatalovo, A.Gareia,S.Valbuena and F.Racedo, "Measurements of
Nonlinear refractive index of organic materials by Z-Scan ", Journal of Physics
conference series, Colombia, 2016.
[70]- R. A.Ganeev, "Nonlinear Optical Properties of Materials", Springer Book,
New York, 2013.
[71]- S. K. Saadi, A,A, Naimee and S.S. Ahmed, " Third –Order nonlinear
Optical Properties of Spatial Light Modulator ", J. of Basic and Applied
Sciences, Vol. 11,No.7, 2017.
[72]-E.Shahriari, W.Mahmood, and M. Yunus, "Signal Beam Z-scan
Measurements of Nonlinear Refraction and Nonlinear absorption coefficient in
Silver Nano-Fluid", American J. of Engineering andSciencec,Vol.3,No.1,PP.98-
101,2010.

78
[73] - M. Sheik- Bahae, A.A. Said, T. Wei, D.J. Hagan, and E.W. Van Stryland,
"Sensitive Measurement of Optical Nonlinear using a Single Beam", IEEE J.
Quantum Electron.QE-26, PP.760, 1990.
[74]- G. S. He, "Nonlinear Optics and Photonics", First Edition, Oxford, 2015.
[75]- D. Marciu,"Optical Limiting and Degenerate Four – Wave Mixing in
Novel Fullerenes" Doctor of Philosophy .Blacksburg, Virginia, 1999.
[76]- V. Vanyukov , " Effects of Nonlinear Light Scattering on Optical Limiting
in Nano carbon Suspensions", Publications of University of eastern Finland ,
Dissertation in Frosty and national Science Number 182,2015.
[77]- M. Rashdian and D. Dorranian, "Investigation of Optical Limiting in Nano
materials ", Journal Advanced material Sci. Vol.40,PP.110-162, 2015.
[78]-V. Nalla, "Synthesis and Characterization of Cds Nanoparticles: It's
Application to Optical Limiting ", Master of Philosophy, Hyderabad, India,
2004.
[79]- J. Hellstrom,"Nanosecond optical parametric Oscillators and amplifiers
based on Periodically Poled KTiOPO4 ", Ph.D. thesis, 2001.
[80]-D.N.Nikogosyan,"Nonlinear Optics Crystal: complete Survey" Second
Edition, springer 2003.
[81]- R.W. Munn and C. N. Ironside, "Principles and Application of Nonlinear
Optical Materials", First Edition, Springer, 1993.
[82]- M. J. Weber, "Hand Book of Optical Materials " Second Edition, New
York, 2003.
[83]-Nonlinear Crystal Potassium Titanyl Phosphate, eksma optics,
http://eksmaoptics.com/out/media/LBO_Crystals_Brochure.pdf , Optical
properties.

78
[84]-Potassium Titanyl Phosphate (KTiOPO3 or KTP) crystal,
http://www.thatshigh.com/products_datail/productld=29.html.

اىخالصح
رض دساسح اىخصائص اىثصشح اىخطح و اىالخطح وذأثش حذد اىقذسج اىثصشي ذ اىذساسح اىحاىح
واىر اتعادها )معصش فعاه ((KTPاىثا ىثيىسج تىذاسى ذراو فىسفاخ رىافقرىىذ اىاىو
ي ( 3
( عذ Continuous wave CWعو تاىىخح اىسرشج ) اك اىزي–تاسرخذا ىضس اىذى
و80اىرش وتقذسذ 532دد اىضاعف ي واط واىرش35اىرش تقذسج 1064اىطىه اىىخ
ي واط عيى اىرىاى. 25
ذ ذحييها تاسرخذا خهاص اىطاف فىسفاخ،أطاف االرصاصح واىفارح ىثيىسج تىذاسى ذراو
(Spectrophotometer) سج وذث ا تيىKTP ىخ وا اىذريل فارح عاىح ذضداد تضادج اىطىه
حذدخ اىرىه، وقذقصا اىرش، تسثة 1095% عذ اىطىه اىىخ 88ذنى اعيى فارح ىيثيىسج
فىىظ.اىنرشو 3.8فدىج اىطاقح اىثصشح ىالرقاالخ اىثاششج اىىعح ىيثيىسج وذنى
وىضس Zدسسد اىخصائص اىثصشح اىالخطح ىثيىسج تاسرخذا ذقح سح حضح اىيضس عيى اىحىس
( عذ اىطىه Continuous wave CWاىزي عو تاىىخح اىسرشج ) Nd: YAG اك -اىذى
طي وا25و 80اىرش وتقذسذ 532ي واط واىرشدد اىضاعف 35اىرش تقذسج 1064اىىخ
.عيى اىرىاى
3.59 وماد قره طشقح اىفرحح اىغيقح )اىغيقح خضئا( ذ حساب عاو االنساس اىالخط خاله
10-14
س 2
-14 3.35 وي واط / 10 3.67و 10
-14س
2اا عاو االرصاص . /ي واط
10 2.71قره اىفرىحح وماداىالخط فقذ ذ حساته خاله طشقح اىفرحح -3
4.32ي واط / س
10 -3
10 4.32 و-3
. /ي واط س
عذ ذأثشحذوز وذريل عاو انساس رو قح ساىثح أظهشخ اىرائح اىر ذ اىحصىه عيها ا اىثيىسج
.فىذى رو ارصاص ال خط( β)و ذريل عاو ارصاص Self-defocusing) )اىرشمض اىزاذ
.اىثصشح اىالخطح رأثشحاىقح اىطيقح ىيما ذ حساب اىرغش ف عاو االنساس وحساب
تاسرخذا ذقح KTPىثيىسج ((The Optical Power Limiting اىثصشيمزىل دسط حذد اىقذسج
عرثح إدادذ .KTP اىثصشي ىثيىسجعيى خىاص خذج ىحذد اىقذسج ا وىقذ حصي Zسح ىحضح اىيضس
ي واط. 60حذد اىقذسج اىثصشي واىر ذساوي

ذأثشاخ الخطح مثشج ا دعيها ال ذنى ذظهش KTPا تيىسج ذث اىرائح اىر ذ اىحصىه عيها
اىقذسج.ادج خذج ف ذطثقاخ األخهضج اىثصشح اىالخطح وحذد
اىسرشج رو اىىخح ( Nd: YAGاك ) –اىذى اىثاح ىيضساىقذسج عيى ذىىذ اىرىافقح ما دسسد
CW ا ىرج 13مفاءج اىرحىو ىرىىذ اىطىه اىىخ االخضش ومادي واط . 35وتقذسج . %
ماد حققح خذا مىرج ىيظىاهش اىالخطح. KTPتيىسج تىذاسى ذراو فىسفاخ

الـــــــــــــــعراق جمــــــــهىريت
وزارة الخعليم العالي والبحث العلمي
جامـــــــــعت القــــــــــــادسيت
كليت الخربيت
قسم الفيسياء
كعنصر فعال للحد البصري KTPداء أالبحث في
وححج الحمراء والخىليد الخىافقي لليسراث المرئيت
مقدمترسالت
الى
جامعت القادسيت -كليت التربيت عمادة
ماجستير في علىم الفيزياء شهادة وهي جزء من متطلباث نيل
من قبل الطالبت
منار ليلى دايخ
بكالىريىس في الفيزياء
بأشراف
. د رعد شاكر عبيس النائليأ
ه0419 م 7102