
Investigation of Turnout Clothing Contamination and ...
43
© 2017 Fire Protection Research Foundation 1 Batterymarch Park, Quincy, MA 02169-7417, USA Email: [email protected] | Web: nfpa.org/foundation Investigation of Turnout Clothing Contamination and Validation of Cleaning Procedures – Phase 1 INTERIM REPORT BY: Jason Allen, Intertek Testing Services NA, Inc., Cortland, NY USA May, 2017
Transcript of Investigation of Turnout Clothing Contamination and ...
© 2017 Fire Protection Research Foundation
1 Batterymarch Park, Quincy, MA 02169-7417, USA Email: [email protected] | Web: nfpa.org/foundation
Investigation of Turnout Clothing Contamination and Validation of Cleaning Procedures – Phase 1
INTERIM REPORT BY:
Jason Allen, Intertek Testing Services NA, Inc., Cortland, NY USA May, 2017

—— Page i ——
This page intentionally blank
—— Page ii ——
Foreword Cancer is a leading concern for fire fighter health and is presumed to be associated with fireground exposures relating to protection/hygiene practices and persistent harmful contamination found in Personal Protective Equipment (PPE). While general cleaning procedures have been established in NFPA 1851, Standard on Selection, Care, and Maintenance of Protective Ensembles for Structural Fire Fighting and Proximity Fire Fighting, procedures or requirements are lacking to demonstrate whether current cleaning practices, including those specified in NFPA 1851, will remove contaminants from firefighter protective clothing. There have been prior studies on this general topic that have identified fire ground contaminants persistent in structural firefighting PPE. However, such studies have not yet addressed validated procedures for cleaning PPE after it becomes contaminated. A task group has been formed under the Technical Committee on Structural and Proximity Fire Fighting Protective Clothing and Equipment for the revision of NFPA 1851. This task group’s work is focused on the development of specific cleaning validation procedures that will determine the effectiveness of specific PPE cleaning equipment, cleaning agents and procedures. This interim report is in support of these efforts. This effort has been characterized as a phase one effort since it is in support of another subsequent larger effort that is more comprehensively addressing this topic. Overall, this project showed that contamination of fire fighter gear can be complex and the determination of specific contaminants requires special attention to the selected extraction and analytical procedures. It was further demonstrated that while a smoke deposition contamination technique might have merit, this technique provided inconsistent results that can be difficult to analyze as part of a validation process. Nevertheless, some success was obtained when conventional chemical doping was combined with a mechanical means of applying a soot-like substances to approximate fireground exposure conditions. The use of a soot surrogate was found to be important in affecting decontamination efficiency. Based on this work, it was possible to recommend preliminary test procedures for qualifying cleaning effectiveness. Keywords: Contamination, Cleaning, PPE, Personal Protective Equipment, Gear, Fire Service, Fire Fighter, Validation Report number: FRPF-2017-07

—— Page iii ——
This page intentionally blank

—— Page iv ——
Acknowledgements This research study and interim report was funded through generous support from the following organizations:
Fire-Dex
L.N. Curtis & Sons
Globe Manufacturing
PBI Performance Products
LionFirst Responder Products
TenCate Protective Fabrics
National Fire Protection Association
The Fire Protection Research Foundation expresses gratitude to the report author Jason Allen, Intertek Testing Services NA, Inc., Cortland, NY USA The content, opinions and conclusions contained in this report are solely those of the authors and do not necessarily represent the views of the Fire Protection Research Foundation, NFPA, Technical Panel or Sponsors. The Foundation makes no guaranty or warranty as to the accuracy or completeness of any information published herein. About the Fire Protection Research Foundation The Fire Protection Research Foundation plans, manages, and communicates research on a broad range of fire safety issues in collaboration with scientists and laboratories around the world. The Foundation is an affiliate of NFPA. About the National Fire Protection Association (NFPA) Founded in 1896, NFPA is a global, nonprofit organization devoted to eliminating death, injury, property and economic loss due to fire, electrical and related hazards. The association delivers information and knowledge through more than 300 consensus codes and standards, research, training, education, outreach and advocacy; and by partnering with others who share an interest in furthering the NFPA mission. All NFPA codes and standards can be viewed online for free. NFPA's membership totals more than 60,000 individuals around the world.

—— Page v ——
This page intentionally blank
—— Page vi ——
Project Technical Panel
David Bernzweig, Columbus Fire Department (OH)
Jack Binder, Edmar Chemical Company (OH)
Bill Brooks, Alliance Corp. (WI)
Gregory Mackin, Boston Fire Department (MA)
Larry Petrick, IAFF (DC)
Jeff Stull, International Personal Protection (TX)
Dan Silvestri, 9-1-1 Safety (PA)
Jay Tarley, NIOSH NPPTL (WV)
Tim Tomlinson, Gear Cleaning Solutions (TX)
Keith Tyson, Firefighter Cancer Support Network (FL)
PROJECT SPONSORS
Steve Allison, Fire-Dex (OH)
Paul Curtis, L.N. Curtis & Sons (CA)
Charlie Dunn, TenCate Protective Fabrics
Chris Farrell, National Fire Protection Association (MA)
Rob Freese, Globe Manufacturing (NH)
Diane Hess, PBI Performance Products (NC)
Karen Lehtonen, LionFirst Responder Products (OH)

—— Page vii ——
This page intentionally blank
Investigation of Turnout Clothing Contamination and Validation of Cleaning
– Draft –
Provided to: NFPA Fire Protection Research
Project Manager: Casey Grant
Telephone: 617-984-7284
Email: [email protected]
Intertek Project Manager: Jason Allen
Email: [email protected]
Intertek Ref No. G102185701
Report Date
January 31, 2017 (Original Draft)
April 30, 2017 (Review Copy)

Investigation of Turnout Clothing Contamination and Validation of Cleaning April 30, 2017
2
Table of Contents Table of Figures ............................................................................................................................................................. 3
Executive Summary ....................................................................................................................................................... 4
Contaminated Gear Analysis ........................................................................................................................................ 5
Gear Selection ........................................................................................................................................................... 5
Initial Chemical Analysis ............................................................................................................................................ 6
Controlled Contamination of Clothing Samples ........................................................................................................... 9
Soot Deposition Approach ........................................................................................................................................ 9
Conventional Sample Doping Approach (Unwashed Samples) ............................................................................... 12
Chemical Doping Approach (Washed Samples) ...................................................................................................... 13
Augmentation of Contamination with Carbon Particles ......................................................................................... 17
Overall Study Findings and Recommendations ......................................................................................................... 31
Proposed NFPA Public Input Information .................................................................................................................. 33
Investigation of Turnout Clothing Contamination and Validation of Cleaning April 30, 2017
3
Table of Figures Figure 1 – Bunker Gear Log-in and Labelling 5 Figure 2 – Bunker Pants log-in and Labeling 6 Figure 3 – Perkin Elmer Analyzer 7 Figure 4 – Mass Spectrum showing 1-phenoxypropan-2-ol 8 Figure 5 – Mass spectrum showing p-cresidine 8 Figure 6 – Mass spectrum showing N-methyldioctylamine 9 Figure 7 – Tube Furnace Assembly 10 Figure 8 – Sample Mounting fixture 10 Figure 9 – Sample Contamination Chamber 10 Figure 10 – Mounted Tube Furnace Contaminated materials 11 Figure 11 – Contaminated material 11 Figure 12 – Original suspected contaminant list 12 Figure 13- Fabric contamination levels using conventional doping technique 12 Figure 14 - Agilent 7890A GC/MS Used during analysis 14 Figure 15 - Thermo fisher Element 2 SF-ICP-MS 15 Figure 16 – Recovery of Organic Contaminants 15 Figure 17 – SIM Chromatogram for Sample after Methylene Chloride Extraction 16 Figure 18 – Inorganic Recovery data 17 Figure 19 – Martindale Abrasion Machine with Carbon Soot Loaded 18 Figure 20 – Mounted Gemini XT Figure 21 – Lab-Grade Carbon Black 18 Figure 22 – Specimen Preparation Plan. Each material evaluated in triplicate 19 Figure 23 – Complete contaminated sample package Figure 24-Individual Package sample 20 Figure 25 – Pre-laundered Bunker Gear Coat Front 20 Figure 26 – Pre-laundered Bunker Gear Coat Back 21 Figure 27 – Test Specimen Mounting Locations 21 Figure 28 – Mounted Test Specimens 22 Figure 29 – Mounted Organic Test Specimens Figure 30 – Mounted Inorganic Test Specimens 22 Figure 31 – Post Laundering Specimens 23 Figure 32 – Post Laundering Inorganic Specimens 24 Figure 33 – Post Laundering Inorganic Specimens 24 Figure 34 – Close-up of laundered Carbon and Chemical Loaded Fabric 25 Figure 35 – Recovered Percentages of Analyte 26 Figure 36 – Overlaid SIM Chromatogram of contaminated fabric with and without a spike 26 Figure 37 – Calculated Decontamination Efficiencies for Carbon and Non-carbon Specimens 27 Figure 38 – Graphical Representation of Calculated Decontamination Efficiencies 28 Figure 39 – Inorganic Analyte Recovery 29 Figure 40 – Graphical Representation of Arsenic / Lead Decontamination Efficiencies 30

Investigation of Turnout Clothing Contamination and Validation of Cleaning April 30, 2017
4
Executive Summary
A project was undertaken by Intertek for the Fire Protection Research Foundation as a
preliminary effort to investigate the effectiveness of laundering for removing chemical
contaminants from firefighter protective clothing. The project involved several parts that
included an analysis of representative sets of contaminated clothing and the development of a
prospective procedure for realistically and repeatably contaminating protective clothing. The
latter part of the project was pursued as a means for creating contaminated clothing samples
that could then be subjected to given laundering procedures and then evaluated for residual
contamination as a means for assessing decontamination efficiency.
Intertek was provided a number of contaminated clothing items from the NFPA Task
Group on Firefighter Clothing Cleaning that had been collected from various departments.
Selected items of clothing were selected and samples were taken for analysis of contaminants.
The identification of chemical contaminants involved a unique piece of analytical equipment
that permitted simultaneous GC-MS and thermographic analysis. This testing showed a variety
of contaminants that included some chemicals that were not typical fireground contaminants
such as benzophenone, terephthalate, 1-phenoxypropan-2-ol, and p-cresidine. One of the
principal finding from this work was the difficult in consistently extracting samples for
recovering contaminants and discriminating among contaminants that are present at very low
levels.
A principal portion of the research effort involved the development of a technique
whereby contaminants could be deposited on a protective clothing sample for later analysis of
the sample both before and after cleaning. Initial efforts by Intertek involved using a special
tube furnace with a set burning fuel to push smoke across a sample to simulate how a fabric
would be contaminated in the field. After conducting several experiments to optimize the
heating conditions using a PVC-based fuel, samples were obtained that showed soot
deposition. However, this approach proved difficult in getting uniform and detectable forms of
relevant contamination.
Intertek then compared a more conventional way of doping samples with contaminants
and added soot by grinding the soot on to the fabric. The placement of soot along with finite
amount of liquid chemicals was thought to be a hybrid approach that account for both ordinary
soiling by soot deposition but also combined a more controllable way of putting chemicals onto
the fabric. Several experiments were carried out using these techniques and the contaminated
samples were laundered using the NFPA 1971 procedures for proving a general assessment of
cleaning effectiveness. By using a range of representative fireground chemicals, Intertek was
able to show different levels of chemical decontamination of the samples used in this fashion,
though it was concluded that remaining soot on the samples was an indication of either excess
soot in the contamination process or an incomplete cleaning process.

Investigation of Turnout Clothing Contamination and Validation of Cleaning April 30, 2017
5
Overall, while the work in this project showed that contamination of firefighter clothing
can be complex and the determination of specific contaminants requires special attention to
the selected extraction and analytical procedures. It was further demonstrated that while a
smoke deposition contamination technique might have merit, this technique provided
inconsistent results, which can be difficult to analyze. Nevertheless, some success was obtained
when conventional chemical doping was combined with a mechanical means of applying a soot-
like substances to approximate fireground exposure conditions. The use of a soot surrogate was
found to be important in affecting decontamination efficiency. Based on this work, it was
possible to recommend preliminary test procedures for qualifying cleaning effectiveness.
Contaminated Gear Analysis
Gear Selection A total of 81 samples of firefighter protective coat and pants were received via the NFPA
Task Group on Firefighter Clothing Cleaning. This gear was provided from New York City, NY;
Philadelphia, PA; Oxnard, CA; Irvine, CA; Chicago, IL; and Carlsbad, CA. Upon receipt, all samples
were photographed as seen in the examples provided in Figures 1 and 2 below and specific
observations were made regarding the areas of significant visible contamination.
FIGURE 1 – BUNKER GEAR LOG-IN AND LABELLING

Investigation of Turnout Clothing Contamination and Validation of Cleaning April 30, 2017
6
FIGURE 2 – BUNKER PANTS LOG-IN AND LABELING
Due to an uncertain exposure history, this gear was placed aside for quick, rough
qualitative analysis and validation of sampling techniques. Additionally, sets of gear were
provided directly to Intertek by Boston, MA and Columbus, OH. This gear was selected
specifically for this project immediately post fire, prepared within non-off gassing PTFE
containers and shipped to Intertek with a brief incident report in an attempt to frame possible
exposure contaminants versus those found via chemical analysis.
Samples were removed from garments and each individual layer was placed within glass
vials with lids securely installed. Samples were then extracted utilizing a Soxhlet extraction
method.
Initial Chemical Analysis In order to analyze the turnout gear, a new instrument technology was used. The
instrument is a hyphenated system manufactured by PerkinElmer consisting of a Pyris 1 TGA, a
Frontier FT-IR and a GC/MS system composed of a Clarus 580 GC and a Clarus SQ 8 MS (Figure
3). This system allows three instruments to be run in tandem, collecting data from all of the
instruments simultaneously.

Investigation of Turnout Clothing Contamination and Validation of Cleaning April 30, 2017
7
FIGURE 3 – PERKIN ELMER ANALYZER
The instrument was used running only the TGA and GC/MS modes in parallel. This
configuration was selected to utilize the heat control of the TGA to produce a precisely
controlled off gassing of the test samples. The off gassing products from the TGA were then
passed though the GC/MS for characterization of the constituents of the off gassed material.
Initial set-up was configured such that the temperature on the TGA was ramped to
800ºC. During this method there were peaks that showed a strong resemblance to benzene and
toluene. It is thought that these peaks were due to degradation of the base material.
Additional samples were run based upon a starting temperature of 100ºC which was
held for 30 seconds. Following the initial hold, the temperature was ramped at 200ºC/min to a
final temperature 200ºC and held at this temperature for an additional 4 minutes. The software
for the tandem system turned the GC/MS on 0.1 minutes after the TGA programming began.
The GC/MS used a sample loop that opened from 0.1-1.0 minutes, injecting onto the column at
the end of this interval. The GC method was started at a temperature of 40ºCfor the first 5
minutes, followed by a ramp of 20ºC/min for 10 minutes and finally held at 240ºC for 5 minutes
for a total of 20 minutes.
The results showed three major peaks in the analysis of the outer shell of the turnout
gear. The first of the peaks showed a mass spectrum that had characteristics of benzophenone
derivatives. The second peak showed similarities to a terephthalate compound with a strong
peak at atomic mass of 163, which is very common for a terephthalate compound, such as
dimethyl or another dialkyl compound. The last of the peaks showed strong similarities to long
chain aliphatic acid or alcohols.
Further in depth analysis was performed on additions sets of bunker gear in order to
better identify the contaminants on the exposed turnout gear. Once again, a 4-hour Soxhlet
Investigation of Turnout Clothing Contamination and Validation of Cleaning April 30, 2017
8
extraction was used. From each sample to be analyzed a 2” circle was cut and then each layer
of the turnout gear was placed in a Soxhlet extractor with 75 mL of methanol. After the 4 hour
extraction, a fraction of the extraction solution was collected for analysis on GC-MS to attempt
to identify extracted contaminants.
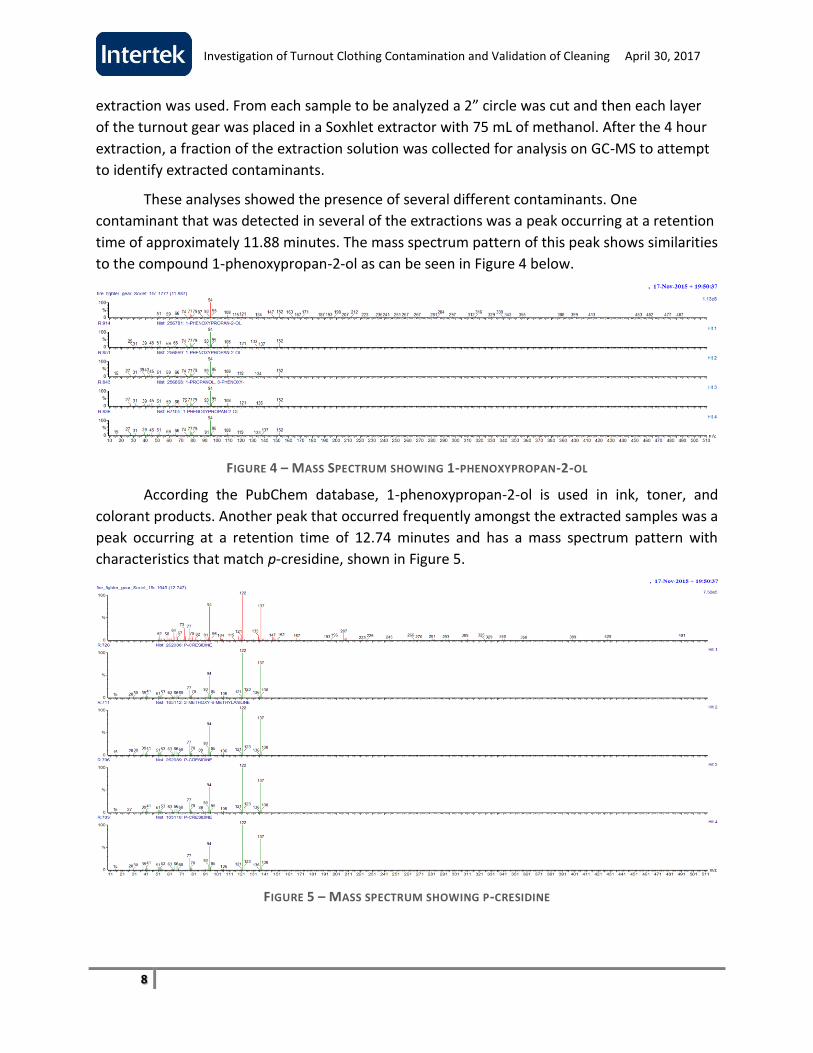
These analyses showed the presence of several different contaminants. One
contaminant that was detected in several of the extractions was a peak occurring at a retention
time of approximately 11.88 minutes. The mass spectrum pattern of this peak shows similarities
to the compound 1-phenoxypropan-2-ol as can be seen in Figure 4 below.
FIGURE 4 – MASS SPECTRUM SHOWING 1-PHENOXYPROPAN-2-OL
According the PubChem database, 1-phenoxypropan-2-ol is used in ink, toner, and
colorant products. Another peak that occurred frequently amongst the extracted samples was a
peak occurring at a retention time of 12.74 minutes and has a mass spectrum pattern with
characteristics that match p-cresidine, shown in Figure 5.
FIGURE 5 – MASS SPECTRUM SHOWING P-CRESIDINE

Investigation of Turnout Clothing Contamination and Validation of Cleaning April 30, 2017
9
According to the PubChem, the sole purpose of the p-cresidine is to be used as an
intermediate in the production of dyes. A final peak that showed a strong match to a compound
within the NIST MS library was that of N-methyldioctylamine (Figure 6).
FIGURE 6 – MASS SPECTRUM SHOWING N-METHYLDIOCTYLAMINE
The primary use of N-methyldioctylamine is as a surfactant per the PubChem Database.
There were several additional peaks that were not consistently identified via matching
to the NIST database and further analysis of the peaks was needed to identify these
compounds.
This investigation of used bunker gear repeatedly demonstrated inconsistent at best
recovery of contaminants and showed significant variations from sample to sample.
Controlled Contamination of Clothing Samples
Soot Deposition Approach In an effort to repeatedly create byproducts of common fire contaminants, a multi-stage
tube furnace was configured as seen below. The tube furnace allowed pelletized items such as
PVC to be heated in a controlled manner creating smoke with desired particulates. These
particulates were then flushed through the 4 inch heating tube into a sample contamination
chamber as seen in Figures 7 and 9 below. Within this chamber a stainless steel sample holder
was mounted such that the airstream impacted the surface of an outer shell sample (Figure 8).

Investigation of Turnout Clothing Contamination and Validation of Cleaning April 30, 2017
10
Air sampling probes were also inserted both before and after the sample holder to collect
contaminants. The absorbent within the tubes was also analyzed via to assist in determining
volume and types of contaminants the fabrics were exposed to.
FIGURE 7 – TUBE FURNACE ASSEMBLY
FIGURE 9 – SAMPLE CONTAMINATION CHAMBER
Multiple test runs were performed in this configuration utilizing simple chemicals such
as pelletized Lab grade PVC. While most of the test runs created visibly similar deposition of
combustion by products chemical analysis showed significantly varied results at best and the
FIGURE 8 – SAMPLE MOUNTING FIXTURE
Investigation of Turnout Clothing Contamination and Validation of Cleaning April 30, 2017
11
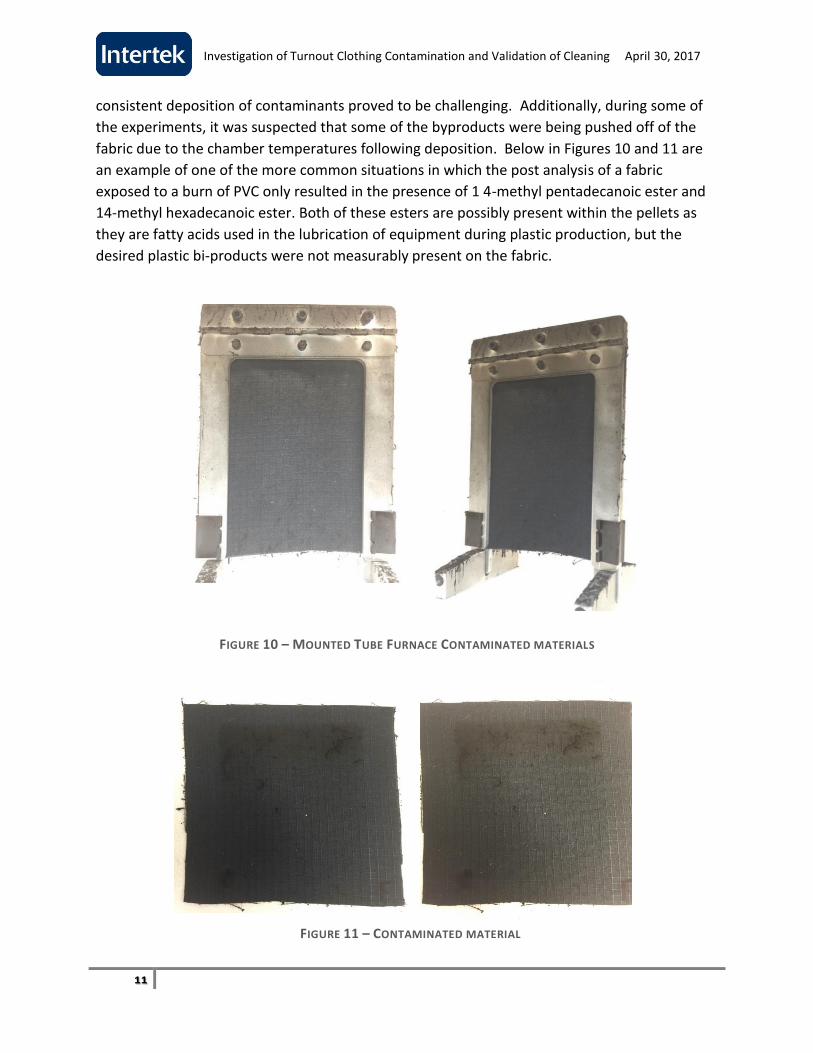
consistent deposition of contaminants proved to be challenging. Additionally, during some of
the experiments, it was suspected that some of the byproducts were being pushed off of the
fabric due to the chamber temperatures following deposition. Below in Figures 10 and 11 are
an example of one of the more common situations in which the post analysis of a fabric
exposed to a burn of PVC only resulted in the presence of 1 4-methyl pentadecanoic ester and
14-methyl hexadecanoic ester. Both of these esters are possibly present within the pellets as
they are fatty acids used in the lubrication of equipment during plastic production, but the
desired plastic bi-products were not measurably present on the fabric.
FIGURE 10 – MOUNTED TUBE FURNACE CONTAMINATED MATERIALS
FIGURE 11 – CONTAMINATED MATERIAL

Investigation of Turnout Clothing Contamination and Validation of Cleaning April 30, 2017
12
Conventional Sample Doping Approach (Unwashed Samples) Based upon the non-repeatable results from the tube furnace experiment, an
alternative procedure was explored in which pristine outer shell material was immersed for 1-
Hour in 100,000µg/ml concentrations of 3 representative chemical types highlighted from
original suspected contaminant list (Figure 12). Fabric swatches were then allowed to fully dry
within a chemical hood and then extracted utilizing a Soxhlet and methanol as the solvent.
Target Contaminant Classification
Phenanthrene, Pyrene PAH
4-Methyl Phenol, Pentachlorophenol Phenol
DEHP Phthalate
PBDE-47 Fire retardant
Octacosane Hydrocarbon
Arsenic, Lead Heavy metal
Xylene (mixed) VOC
FIGURE 12 – ORIGINAL SUSPECTED CONTAMINANT LIST
Extraction liquids were then analyzed and resulted in the following fabric contamination
levels. These contamination levels were not as high as anticipated, but did show significant
potential for a repeatable deposition of chemicals upon a fabric. It was suspected that the
pristine materials topical finishes reduced the amount of chemical that could be absorbed by
the fabric. It is noteworthy that the final concentrations of each chemical in fabric samples
varied even though the fabric samples were exposed to the same concentration of chemical in
the doping liquid. This further demonstrated that fabric absorption would be affected by the
specific chemical(s) being use.
Chemical Concentration, µg/mL Total µg found µg/cm²
Naphthalene 12.32 924 2.92
Pentachlorophenol 8.96 672 2.03
Dioctyl terephthalate 18.05 1354 4.28
FIGURE 13- FABRIC CONTAMINATION LEVELS USING CONVENTIONAL DOPING TECHNIQUE
Investigation of Turnout Clothing Contamination and Validation of Cleaning April 30, 2017
13
Chemical Doping Approach (Washed Samples) With the prior experiments, it was suspected that topical finishes on the outer shell
material inhibited absorption of the surface contaminants. To determine if greater amount of
chemicals could be absorbed through the fabric, samples of the selected Gemini XT were
laundered for 10 cycles in accordance with NFPA 1971-13 in accordance with Section 8.1.2.
This experiment was also expanded further to look at a more complete grouping of
contaminants that included:
Bis(2-ethylhexyl)phthalate
Pentachlorophenol
Phenanthrene
Naphthalene
Octacosane
Xylene
2,2’,4,4’,5,5’-hexachlorobiphenyl
2,2’,4,4’-tetrabromodiphenyl ether
Arsenic
Lead
This portion of the project was performed in collaboration with Intertek’s Allentown, PA
lab which specializes in complex chemical analytics. Different analytical approaches were
applied to different chemical groups (organic versus inorganic) as described in the following
sections.
Organic components:
To prepare the contaminated fabric, approximately 0.5 g of the fabric was placed in a
large mouth jar and a known quantity of a standard solution containing bis(2-ethylhexyl)
phthalate, pentachlorophenol, phenanthrene, naphthalene, octacosane and m-xylene was
adding to the fabric by dripping small amounts on the fabric. The 2,2’,4,4’,5,5’-hexachloro-
biphenyl and 2,2’,4,4’-tetrabromodiphenyl ether were also added in the same way using
standards purchased as solutions and added as received. After the fabric had dried, the
analytes were extracted using methylene chloride and the solution was analyzed to determine
how much chemical was absorbed in the fabric and how much remained in solution.
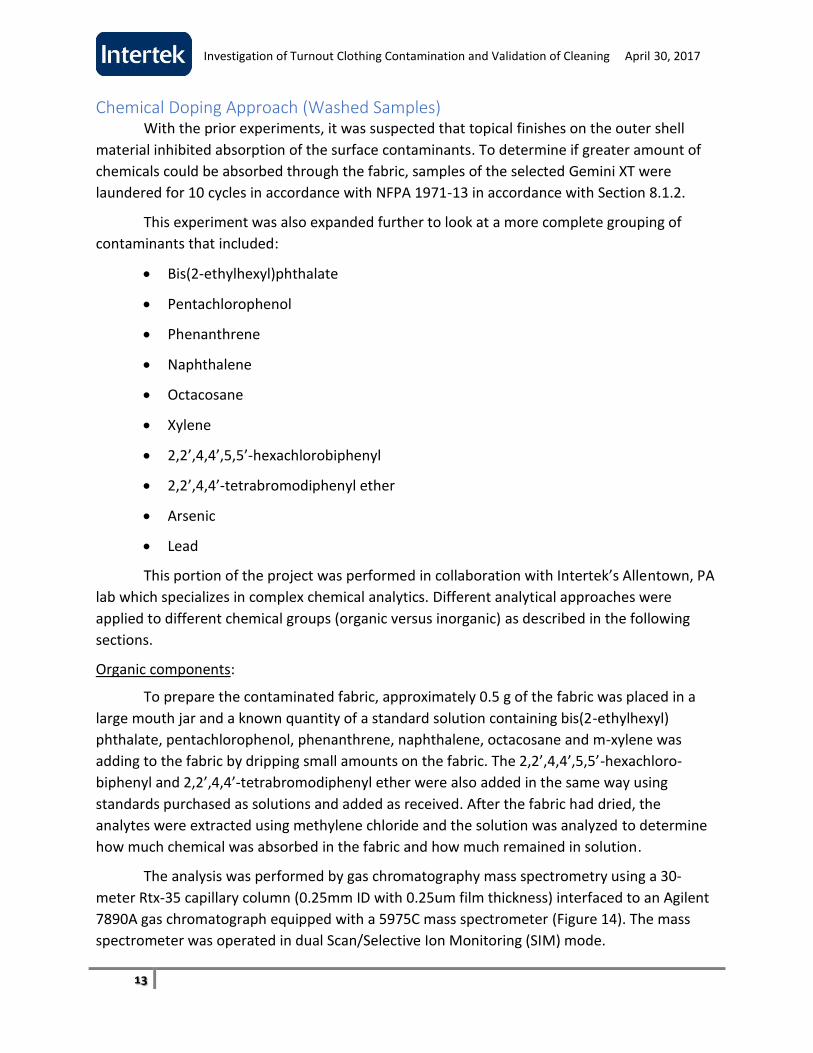
The analysis was performed by gas chromatography mass spectrometry using a 30-
meter Rtx-35 capillary column (0.25mm ID with 0.25um film thickness) interfaced to an Agilent
7890A gas chromatograph equipped with a 5975C mass spectrometer (Figure 14). The mass
spectrometer was operated in dual Scan/Selective Ion Monitoring (SIM) mode.
Investigation of Turnout Clothing Contamination and Validation of Cleaning April 30, 2017
14
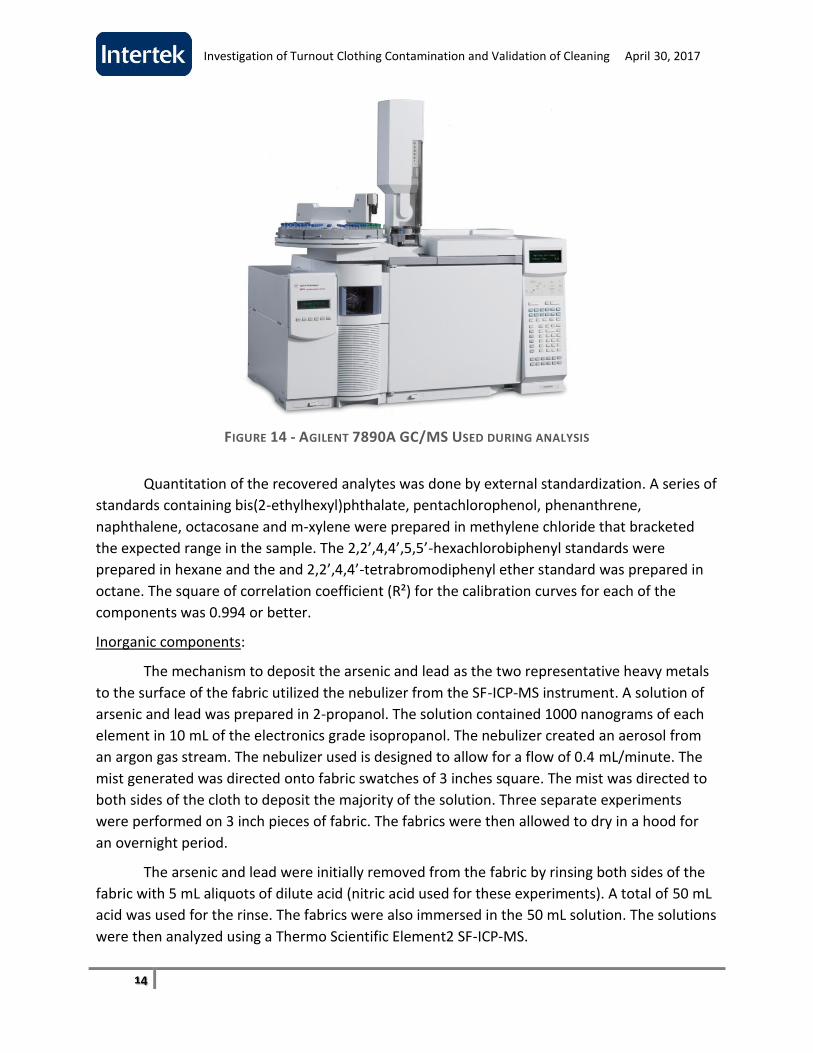
FIGURE 14 - AGILENT 7890A GC/MS USED DURING ANALYSIS
Quantitation of the recovered analytes was done by external standardization. A series of
standards containing bis(2-ethylhexyl)phthalate, pentachlorophenol, phenanthrene,
naphthalene, octacosane and m-xylene were prepared in methylene chloride that bracketed
the expected range in the sample. The 2,2’,4,4’,5,5’-hexachlorobiphenyl standards were
prepared in hexane and the and 2,2’,4,4’-tetrabromodiphenyl ether standard was prepared in
octane. The square of correlation coefficient (R²) for the calibration curves for each of the
components was 0.994 or better.
Inorganic components:
The mechanism to deposit the arsenic and lead as the two representative heavy metals
to the surface of the fabric utilized the nebulizer from the SF-ICP-MS instrument. A solution of
arsenic and lead was prepared in 2-propanol. The solution contained 1000 nanograms of each
element in 10 mL of the electronics grade isopropanol. The nebulizer created an aerosol from
an argon gas stream. The nebulizer used is designed to allow for a flow of 0.4 mL/minute. The
mist generated was directed onto fabric swatches of 3 inches square. The mist was directed to
both sides of the cloth to deposit the majority of the solution. Three separate experiments
were performed on 3 inch pieces of fabric. The fabrics were then allowed to dry in a hood for
an overnight period.
The arsenic and lead were initially removed from the fabric by rinsing both sides of the
fabric with 5 mL aliquots of dilute acid (nitric acid used for these experiments). A total of 50 mL
acid was used for the rinse. The fabrics were also immersed in the 50 mL solution. The solutions
were then analyzed using a Thermo Scientific Element2 SF-ICP-MS.
Investigation of Turnout Clothing Contamination and Validation of Cleaning April 30, 2017
15
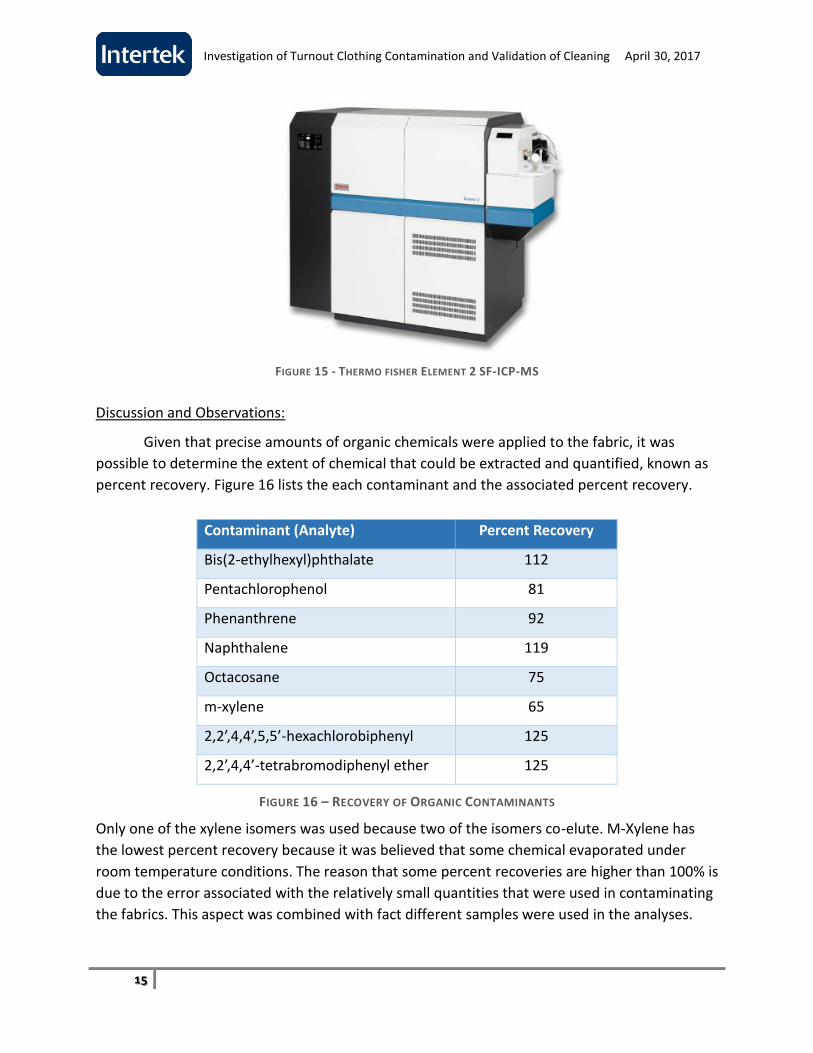
FIGURE 15 - THERMO FISHER ELEMENT 2 SF-ICP-MS
Discussion and Observations:
Given that precise amounts of organic chemicals were applied to the fabric, it was
possible to determine the extent of chemical that could be extracted and quantified, known as
percent recovery. Figure 16 lists the each contaminant and the associated percent recovery.
Contaminant (Analyte) Percent Recovery
Bis(2-ethylhexyl)phthalate 112
Pentachlorophenol 81
Phenanthrene 92
Naphthalene 119
Octacosane 75
m-xylene 65
2,2’,4,4’,5,5’-hexachlorobiphenyl 125
2,2’,4,4’-tetrabromodiphenyl ether 125
FIGURE 16 – RECOVERY OF ORGANIC CONTAMINANTS Only one of the xylene isomers was used because two of the isomers co-elute. M-Xylene has
the lowest percent recovery because it was believed that some chemical evaporated under
room temperature conditions. The reason that some percent recoveries are higher than 100% is
due to the error associated with the relatively small quantities that were used in contaminating
the fabrics. This aspect was combined with fact different samples were used in the analyses.
Investigation of Turnout Clothing Contamination and Validation of Cleaning April 30, 2017
16
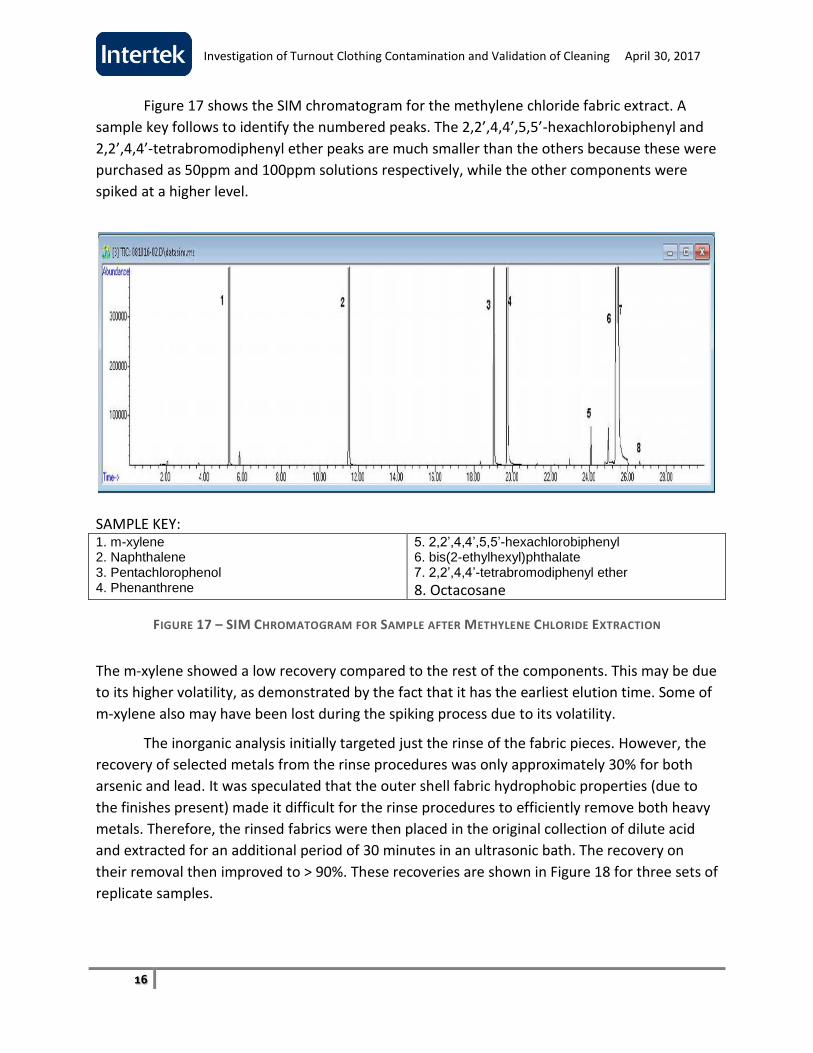
Figure 17 shows the SIM chromatogram for the methylene chloride fabric extract. A
sample key follows to identify the numbered peaks. The 2,2’,4,4’,5,5’-hexachlorobiphenyl and
2,2’,4,4’-tetrabromodiphenyl ether peaks are much smaller than the others because these were
purchased as 50ppm and 100ppm solutions respectively, while the other components were
spiked at a higher level.
SAMPLE KEY: 1. m-xylene 2. Naphthalene 3. Pentachlorophenol 4. Phenanthrene
5. 2,2’,4,4’,5,5’-hexachlorobiphenyl 6. bis(2-ethylhexyl)phthalate 7. 2,2’,4,4’-tetrabromodiphenyl ether
8. Octacosane
FIGURE 17 – SIM CHROMATOGRAM FOR SAMPLE AFTER METHYLENE CHLORIDE EXTRACTION
The m-xylene showed a low recovery compared to the rest of the components. This may be due
to its higher volatility, as demonstrated by the fact that it has the earliest elution time. Some of
m-xylene also may have been lost during the spiking process due to its volatility.
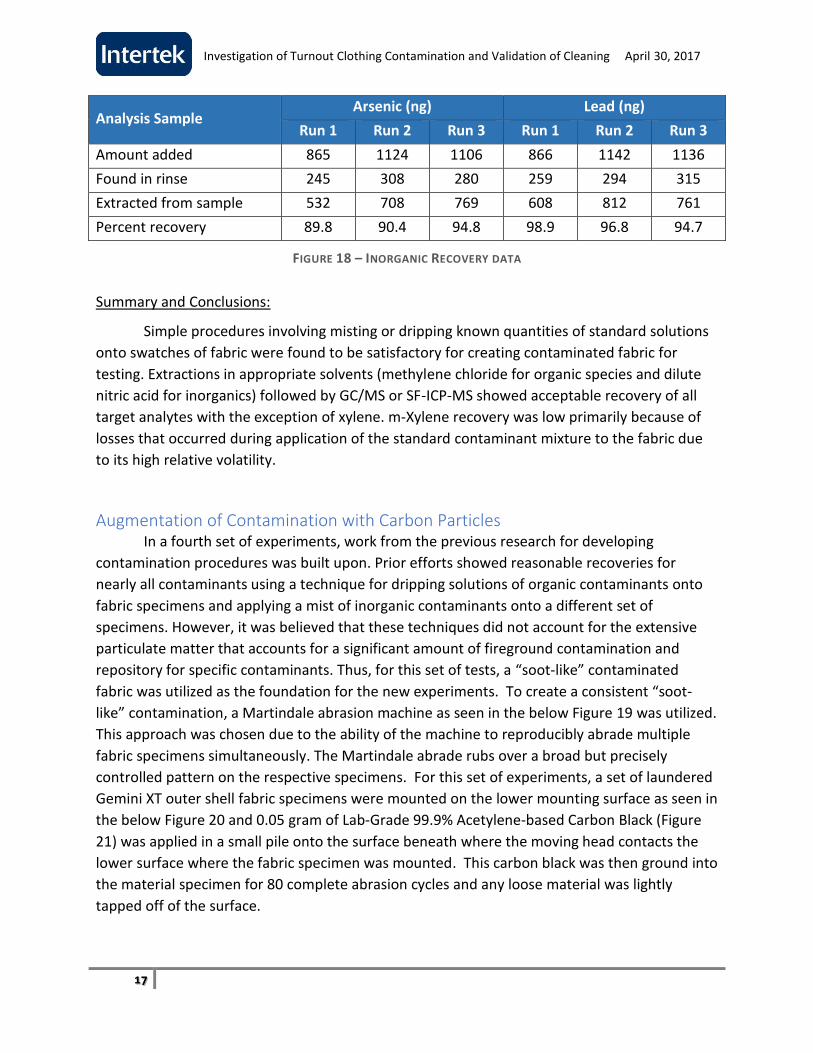
The inorganic analysis initially targeted just the rinse of the fabric pieces. However, the
recovery of selected metals from the rinse procedures was only approximately 30% for both
arsenic and lead. It was speculated that the outer shell fabric hydrophobic properties (due to
the finishes present) made it difficult for the rinse procedures to efficiently remove both heavy
metals. Therefore, the rinsed fabrics were then placed in the original collection of dilute acid
and extracted for an additional period of 30 minutes in an ultrasonic bath. The recovery on
their removal then improved to > 90%. These recoveries are shown in Figure 18 for three sets of
replicate samples.
Investigation of Turnout Clothing Contamination and Validation of Cleaning April 30, 2017
17
Analysis Sample Arsenic (ng) Lead (ng)
Run 1 Run 2 Run 3 Run 1 Run 2 Run 3
Amount added 865 1124 1106 866 1142 1136
Found in rinse 245 308 280 259 294 315
Extracted from sample 532 708 769 608 812 761
Percent recovery 89.8 90.4 94.8 98.9 96.8 94.7
FIGURE 18 – INORGANIC RECOVERY DATA
Summary and Conclusions:
Simple procedures involving misting or dripping known quantities of standard solutions
onto swatches of fabric were found to be satisfactory for creating contaminated fabric for
testing. Extractions in appropriate solvents (methylene chloride for organic species and dilute
nitric acid for inorganics) followed by GC/MS or SF-ICP-MS showed acceptable recovery of all
target analytes with the exception of xylene. m-Xylene recovery was low primarily because of
losses that occurred during application of the standard contaminant mixture to the fabric due
to its high relative volatility.
Augmentation of Contamination with Carbon Particles In a fourth set of experiments, work from the previous research for developing
contamination procedures was built upon. Prior efforts showed reasonable recoveries for
nearly all contaminants using a technique for dripping solutions of organic contaminants onto
fabric specimens and applying a mist of inorganic contaminants onto a different set of
specimens. However, it was believed that these techniques did not account for the extensive
particulate matter that accounts for a significant amount of fireground contamination and
repository for specific contaminants. Thus, for this set of tests, a “soot-like” contaminated
fabric was utilized as the foundation for the new experiments. To create a consistent “soot-
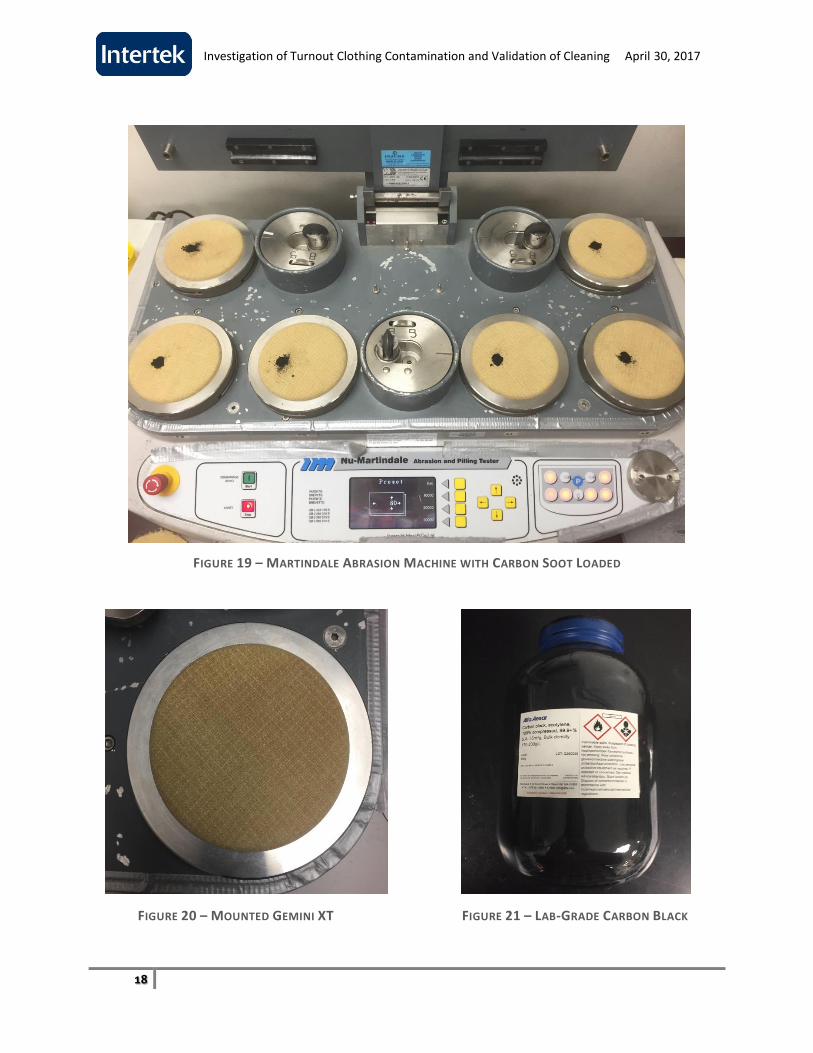
like” contamination, a Martindale abrasion machine as seen in the below Figure 19 was utilized.
This approach was chosen due to the ability of the machine to reproducibly abrade multiple
fabric specimens simultaneously. The Martindale abrade rubs over a broad but precisely
controlled pattern on the respective specimens. For this set of experiments, a set of laundered
Gemini XT outer shell fabric specimens were mounted on the lower mounting surface as seen in
the below Figure 20 and 0.05 gram of Lab-Grade 99.9% Acetylene-based Carbon Black (Figure
21) was applied in a small pile onto the surface beneath where the moving head contacts the
lower surface where the fabric specimen was mounted. This carbon black was then ground into
the material specimen for 80 complete abrasion cycles and any loose material was lightly
tapped off of the surface.
Investigation of Turnout Clothing Contamination and Validation of Cleaning April 30, 2017
18
FIGURE 19 – MARTINDALE ABRASION MACHINE WITH CARBON SOOT LOADED
FIGURE 20 – MOUNTED GEMINI XT FIGURE 21 – LAB-GRADE CARBON BLACK

Investigation of Turnout Clothing Contamination and Validation of Cleaning April 30, 2017
19
Specimen Handling and Treatment:
Following being loaded with carbon, the fabric specimens were individually laid flat,
wrapped in aluminum foil, and then stacked on top of each other within a plastic bag for
shipping to Intertek Allentown for contamination with liquid chemicals.
Once received in Allentown, fabric specimens were placed in large mouth jars and a
known quantity of a standard solution containing all of the target compounds was applied by
carefully dripping small amounts onto the fabric. After the spiked fabric had dried, some of the
fabric specimens were laundered and others were not.
The nebulizer from an ICP instrument was used to deposit the arsenic and lead solution
to the surface of the fabric specimen. The solution of arsenic and lead was prepared in 2-
propanol. The solution contained 100 ng of each element per milliliter in electronics grade
isopropanol.
Within 48 hours of the fabrics drying, specimens were split in sample groups according
to the table below (Figure 22) and were then repackaged within new pieces of aluminum foil
and sent to Intertek Cortland. Figures 23 and 24 show photographs for the respective manner
for how the individual specimens were packaged, repackaged, and labeled.
Sample Group*
Analyte Group
Cortland-Carbon
Allentown Chemical Loaded
Cortland Laundered
Allentown Chemical Analysis
A Organic X X X X
B Organic X X X
C Organic X X
D Organic X X X
E Inorganic X X X X
F Inorganic X X X
G Inorganic X X
H Inorganic X X X
* Equal sets of specimens were prepared for each sample group
FIGURE 22 – SPECIMEN PREPARATION PLAN. EACH MATERIAL EVALUATED IN TRIPLICATE

Investigation of Turnout Clothing Contamination and Validation of Cleaning April 30, 2017
20
FIGURE 23 – COMPLETE CONTAMINATED SAMPLE PACKAGE FIGURE 24-INDIVIDUAL PACKAGE SAMPLE
Intertek Cortland then removed specimens from their packaging and mounted the 12 specified
specimens onto clean bunker coat as shown in Figures 25 and 26 at the positions shown and
listed in Figure 27. Mounted specimens are shown in Figures 28 through 30.
FIGURE 25 – PRE-LAUNDERED BUNKER GEAR COAT FRONT

Investigation of Turnout Clothing Contamination and Validation of Cleaning April 30, 2017
21
FIGURE 26 – PRE-LAUNDERED BUNKER GEAR COAT BACK
FIGURE 27 – TEST SPECIMEN MOUNTING LOCATIONS
ID Chemical Carbon Loaded (Y/N)
A3 Organic Y
A4 Organic Y
A5 Organic Y
D1 Organic N
D2 Organic N
D3 Organic N
E1 Inorganic Y
E2 Inorganic Y
E3 Inorganic Y
H7 Inorganic N
H8 Inorganic N
H9 Inorganic N

Investigation of Turnout Clothing Contamination and Validation of Cleaning April 30, 2017
22
FIGURE 28 – MOUNTED TEST SPECIMENS
FIGURE 29 – MOUNTED ORGANIC TEST SPECIMENS FIGURE 30 – MOUNTED INORGANIC TEST SPECIMENS
Post mounting, the contaminated specimens were then washed one complete cycle in
accordance with NFPA 1971, Section 8.1.11 utilizing the standard AATCC specified detergent,
ballast loading, and temperatures and then dried also in accordance with the NFPA 1971
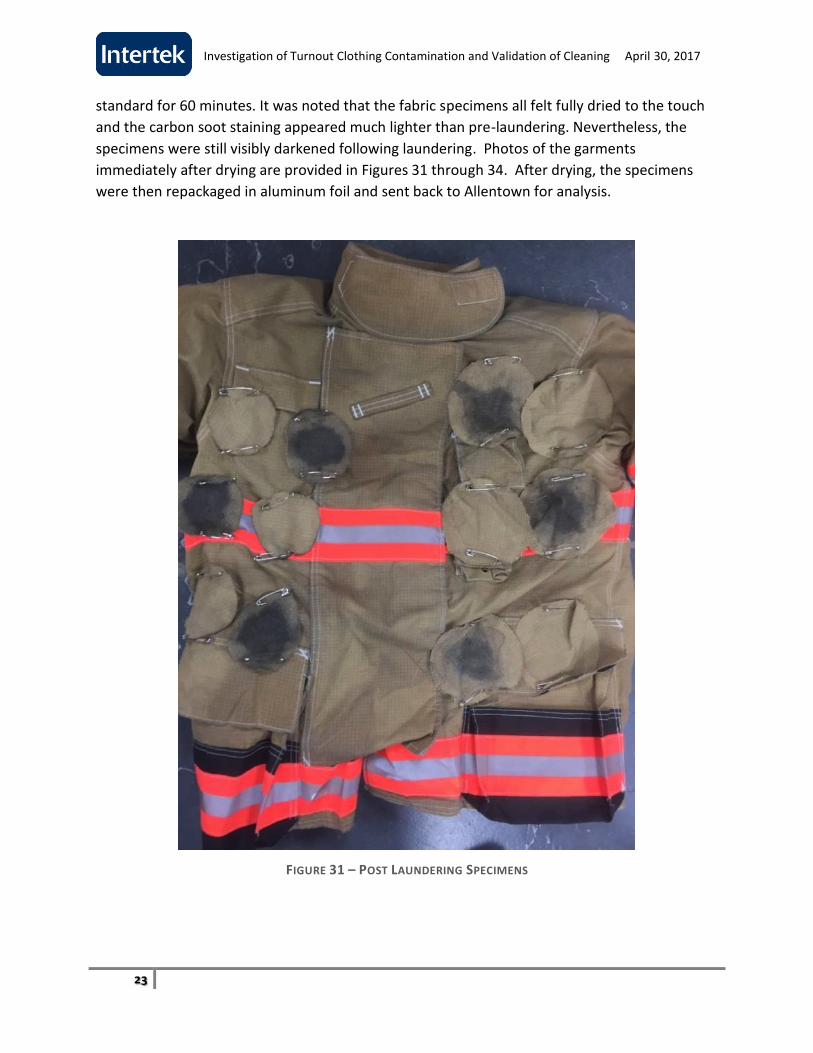
Investigation of Turnout Clothing Contamination and Validation of Cleaning April 30, 2017
23
standard for 60 minutes. It was noted that the fabric specimens all felt fully dried to the touch
and the carbon soot staining appeared much lighter than pre-laundering. Nevertheless, the
specimens were still visibly darkened following laundering. Photos of the garments
immediately after drying are provided in Figures 31 through 34. After drying, the specimens
were then repackaged in aluminum foil and sent back to Allentown for analysis.
FIGURE 31 – POST LAUNDERING SPECIMENS

Investigation of Turnout Clothing Contamination and Validation of Cleaning April 30, 2017
24
FIGURE 32 – POST LAUNDERING INORGANIC SPECIMENS
FIGURE 33 – POST LAUNDERING INORGANIC SPECIMENS
Investigation of Turnout Clothing Contamination and Validation of Cleaning April 30, 2017
25
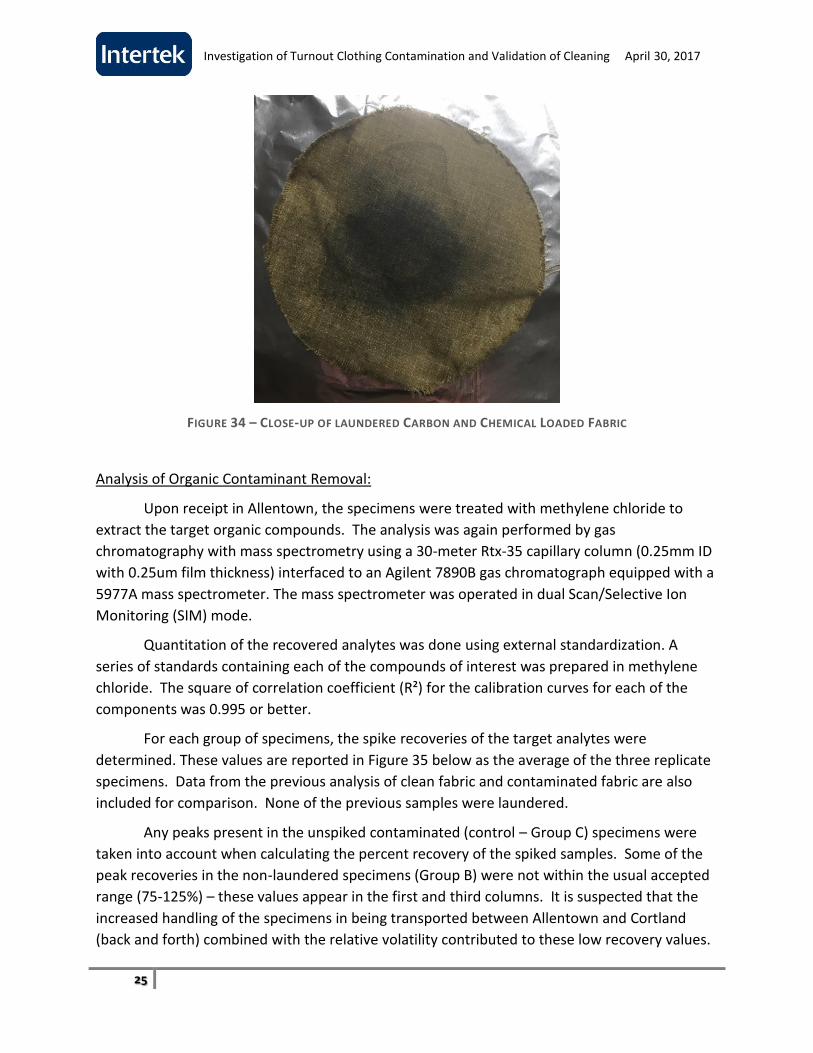
FIGURE 34 – CLOSE-UP OF LAUNDERED CARBON AND CHEMICAL LOADED FABRIC
Analysis of Organic Contaminant Removal:
Upon receipt in Allentown, the specimens were treated with methylene chloride to
extract the target organic compounds. The analysis was again performed by gas
chromatography with mass spectrometry using a 30-meter Rtx-35 capillary column (0.25mm ID
with 0.25um film thickness) interfaced to an Agilent 7890B gas chromatograph equipped with a
5977A mass spectrometer. The mass spectrometer was operated in dual Scan/Selective Ion
Monitoring (SIM) mode.
Quantitation of the recovered analytes was done using external standardization. A
series of standards containing each of the compounds of interest was prepared in methylene
chloride. The square of correlation coefficient (R²) for the calibration curves for each of the
components was 0.995 or better.
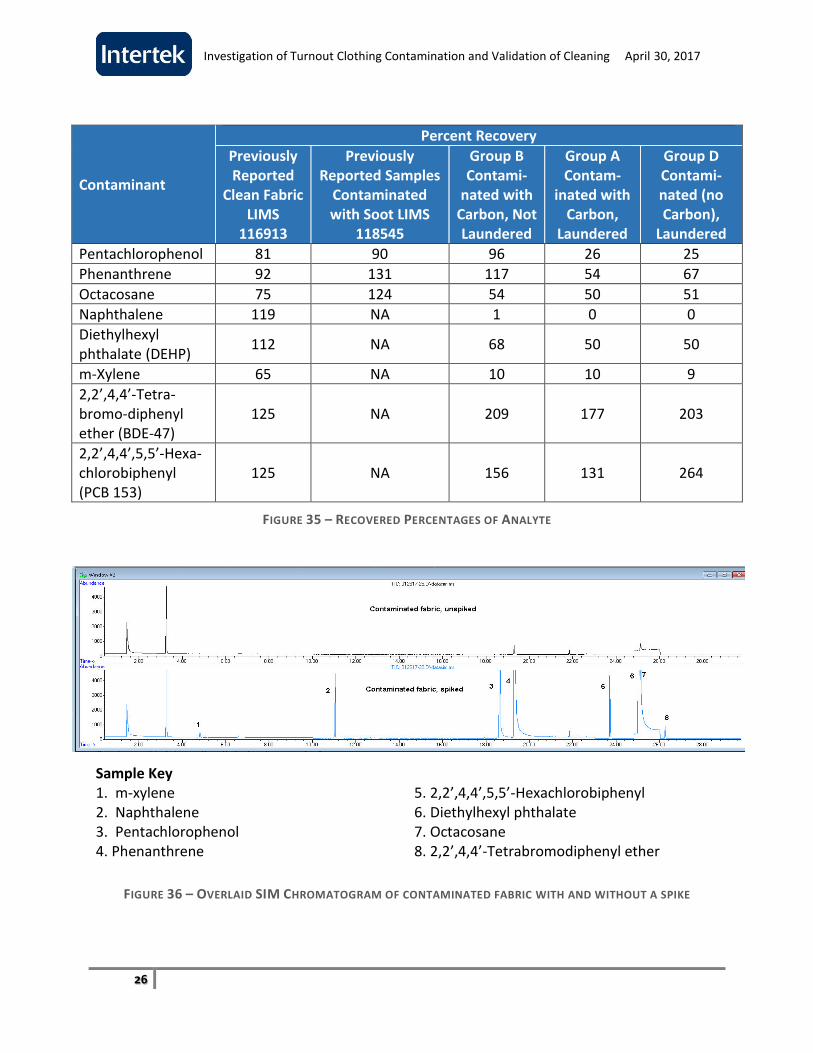
For each group of specimens, the spike recoveries of the target analytes were
determined. These values are reported in Figure 35 below as the average of the three replicate
specimens. Data from the previous analysis of clean fabric and contaminated fabric are also
included for comparison. None of the previous samples were laundered.
Any peaks present in the unspiked contaminated (control – Group C) specimens were
taken into account when calculating the percent recovery of the spiked samples. Some of the
peak recoveries in the non-laundered specimens (Group B) were not within the usual accepted
range (75-125%) – these values appear in the first and third columns. It is suspected that the
increased handling of the specimens in being transported between Allentown and Cortland
(back and forth) combined with the relative volatility contributed to these low recovery values.
Investigation of Turnout Clothing Contamination and Validation of Cleaning April 30, 2017
26
Contaminant
Percent Recovery
Previously Reported
Clean Fabric LIMS
116913
Previously Reported Samples
Contaminated with Soot LIMS
118545
Group B Contami-
nated with Carbon, Not Laundered
Group A Contam-
inated with Carbon,
Laundered
Group D Contami-nated (no Carbon),
Laundered
Pentachlorophenol 81 90 96 26 25
Phenanthrene 92 131 117 54 67
Octacosane 75 124 54 50 51
Naphthalene 119 NA 1 0 0
Diethylhexyl phthalate (DEHP)
112 NA 68 50 50
m-Xylene 65 NA 10 10 9
2,2’,4,4’-Tetra-bromo-diphenyl ether (BDE-47)
125 NA 209 177 203
2,2’,4,4’,5,5’-Hexa-chlorobiphenyl (PCB 153)
125 NA 156 131 264
FIGURE 35 – RECOVERED PERCENTAGES OF ANALYTE
Sample Key 1. m-xylene 2. Naphthalene 3. Pentachlorophenol 4. Phenanthrene
5. 2,2’,4,4’,5,5’-Hexachlorobiphenyl 6. Diethylhexyl phthalate 7. Octacosane 8. 2,2’,4,4’-Tetrabromodiphenyl ether
FIGURE 36 – OVERLAID SIM CHROMATOGRAM OF CONTAMINATED FABRIC WITH AND WITHOUT A SPIKE

Investigation of Turnout Clothing Contamination and Validation of Cleaning April 30, 2017
27
The spike recoveries for the laundered samples were low, which led to the conclusion
that the laundering of the samples assisted in removing the components of interest. However,
it was clear contaminant removal was not complete, and in most cases the compounds were
still detected even if at lower levels. To more clearly illustrate these findings, these analytical
results were also presented on the basis of decontamination efficiencies taking into account the
ability to recover specific analytes by comparing the raw specimen chemical concentration
values for Specimen Set B (contaminated but not laundered) with both Set A (contaminated
with carbon, laundered) and Set D (contaminated without carbon, laundered). These values are
presented in Figure 37. The results are also shown graphically in Figure 38.
Contaminant
Concentration (ppm) Decontamination
Efficiency
Contaminated
Carbon-loaded
Unlaundered
Contaminated
Carbon-loaded
Unlaundered
Contaminated
Laundered
With Carbon
Without Carbon
Pentachlorophenol 57.8 14.0 15.3 75.7 73.5
Phenanthrene 61.8 25.3 35.5 59.1 42.5
Octacosane 46.7 39.4 43.8 15.5 6.2
Naphthalene 0.5 0.0 0.0 98.7 98.3
Diethylhexyl phthalate (DEHP)
82.8 56.6 60.5 31.6 26.9
m-Xylene 5.9 5.8 5.8 1.0 1.0
2,2’,4,4’-Tetra-bromo-diphenyl ether (BDE-47)
1.0 0.8 0.9 16.3 5.8
2,2’,4,4’,5,5’-Hexa-chlorobiphenyl (PCB 153)
1.8 1.6 1.9 11.4 0
FIGURE 37 – CALCULATED DECONTAMINATION EFFICIENCIES FOR CARBON AND NON-CARBON SPECIMENS

Investigation of Turnout Clothing Contamination and Validation of Cleaning April 30, 2017
28
FIGURE 38 – GRAPHICAL REPRESENTATION OF CALCULATED DECONTAMINATION EFFICIENCIES
A number of interesting observations can be made with respect to the reported
decontamination efficiencies.
Reasonably high levels of decontamination (70 to 100%) took place for
pentachlorophenol and naphthalene, although as previously pointed, the recovery for
naphthalene based on the applied amount was low.
Intermediate to low levels of decontamination (30 to 70%) were found for
phenanthrene and DEHP.
Relatively low levels of decontamination occurred for all of the other chemicals.
Xylene decontamination was practically nil and it believed that this chemical simply
evaporated with any residue indicative of an insignificant part of the chemical that was
retained by the fabric.
Some differences were noted between fabric specimens that included carbon versus
those that did not include carbon. For most chemicals, the decontamination efficiency was
higher for non-carbon loaded specimens. This suggests that the carbon acts to retain some
contaminant. This is a potentially important finding that would support that increased removal
of soot ensures greater cleaning.
0 10 20 30 40 50 60 70 80 90 100
PCB 153
BDE-47
m-Xylene
DEHP
Naphthalene
Octacosane
Phenanthrene
Pentachlorophenol
Without Carbon With Carbon
Investigation of Turnout Clothing Contamination and Validation of Cleaning April 30, 2017
29
It is noted that the NFPA 1971 laundering procedures used in this study for
demonstration purposes are not optimized for soil removal, but rather to create conditions to
remove finishes. Many independent service providers use more extensive laundering
procedures that are coupled with presoak steps and longer suds or detergent use in the
washing process.
Inorganic components:
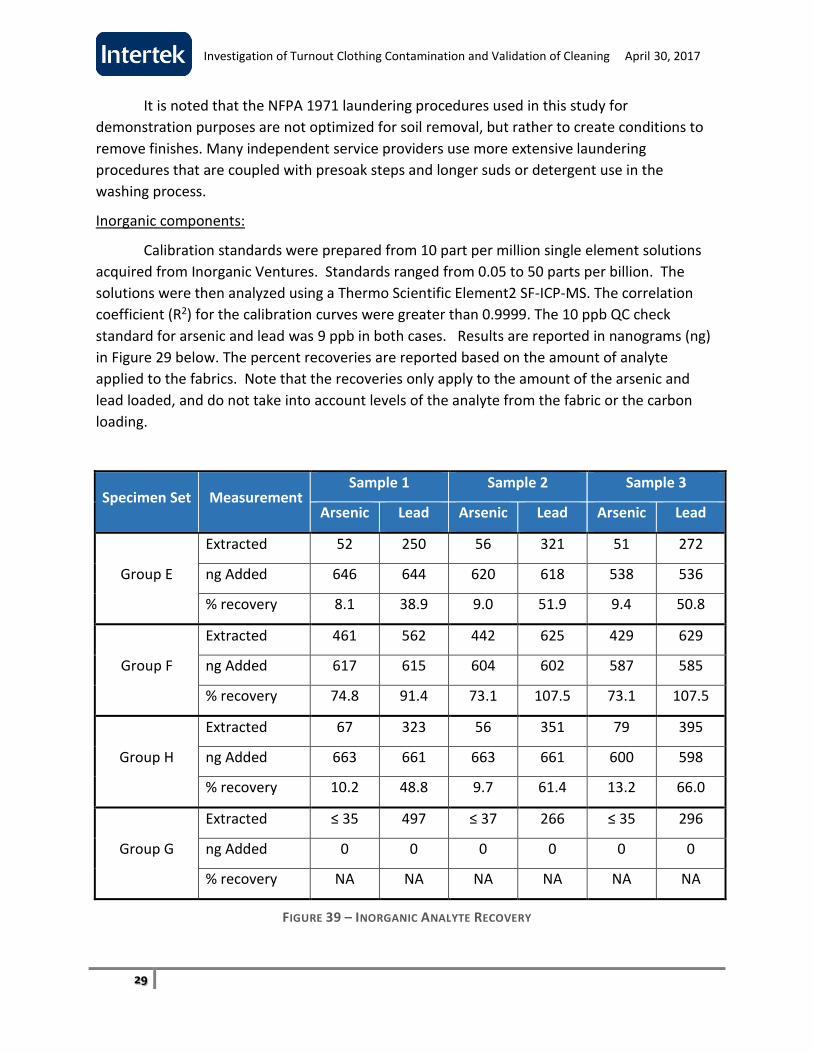
Calibration standards were prepared from 10 part per million single element solutions
acquired from Inorganic Ventures. Standards ranged from 0.05 to 50 parts per billion. The
solutions were then analyzed using a Thermo Scientific Element2 SF-ICP-MS. The correlation
coefficient (R2) for the calibration curves were greater than 0.9999. The 10 ppb QC check
standard for arsenic and lead was 9 ppb in both cases. Results are reported in nanograms (ng)
in Figure 29 below. The percent recoveries are reported based on the amount of analyte
applied to the fabrics. Note that the recoveries only apply to the amount of the arsenic and
lead loaded, and do not take into account levels of the analyte from the fabric or the carbon
loading.
Specimen Set Measurement Sample 1 Sample 2 Sample 3
Arsenic Lead Arsenic Lead Arsenic Lead
Group E
Extracted 52 250 56 321 51 272
ng Added 646 644 620 618 538 536
% recovery 8.1 38.9 9.0 51.9 9.4 50.8
Group F
Extracted 461 562 442 625 429 629
ng Added 617 615 604 602 587 585
% recovery 74.8 91.4 73.1 107.5 73.1 107.5
Group H
Extracted 67 323 56 351 79 395
ng Added 663 661 663 661 600 598
% recovery 10.2 48.8 9.7 61.4 13.2 66.0
Group G
Extracted ≤ 35 497 ≤ 37 266 ≤ 35 296
ng Added 0 0 0 0 0 0
% recovery NA NA NA NA NA NA
FIGURE 39 – INORGANIC ANALYTE RECOVERY
Investigation of Turnout Clothing Contamination and Validation of Cleaning April 30, 2017
30
The levels of arsenic and lead in the starting fabric were measured in the original work
in August 2016. (Allentown request number 116913; CSA IntertekCortland072216av1-MM)
This work included blanks consisting of clean fabric with no carbon or analyte loading. The
concentration of arsenic extracted from these blanks was determined to be below measureable
levels, while lead levels were 20 to 50 ng. The carbon-loaded blank in the current work (Group
G) shows significant lead concentrations in the extract even though no metals were applied to
the fabric. It therefore appears that the carbon black contains lead, which will skew the
recovery data for Groups E, F, and G. It should also be noted that carbon loading of Group G
Sample 1 was done at a different time from the carbon loading for Groups E and F and Group G
Samples 2 and 3. This could explain the higher lead levels detected in Group G Sample 1 versus
the other two samples in that group.
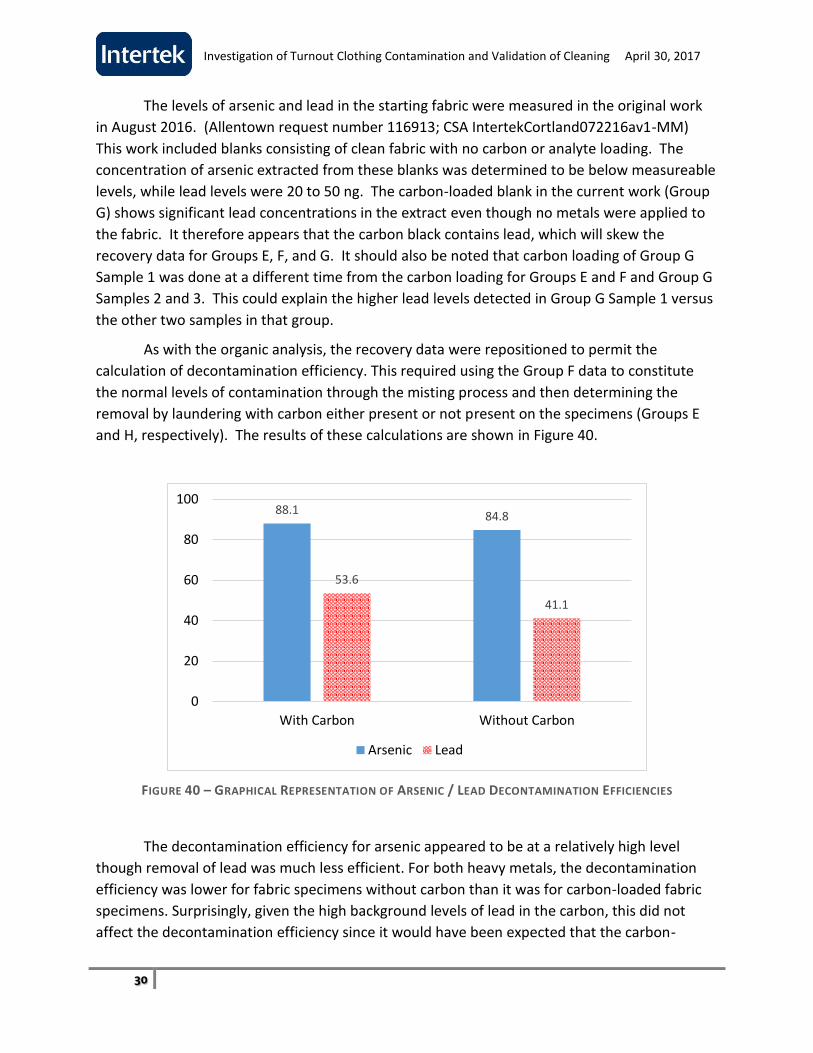
As with the organic analysis, the recovery data were repositioned to permit the
calculation of decontamination efficiency. This required using the Group F data to constitute
the normal levels of contamination through the misting process and then determining the
removal by laundering with carbon either present or not present on the specimens (Groups E
and H, respectively). The results of these calculations are shown in Figure 40.
FIGURE 40 – GRAPHICAL REPRESENTATION OF ARSENIC / LEAD DECONTAMINATION EFFICIENCIES
The decontamination efficiency for arsenic appeared to be at a relatively high level
though removal of lead was much less efficient. For both heavy metals, the decontamination
efficiency was lower for fabric specimens without carbon than it was for carbon-loaded fabric
specimens. Surprisingly, given the high background levels of lead in the carbon, this did not
affect the decontamination efficiency since it would have been expected that the carbon-
88.1 84.8
53.6
41.1
0
20
40
60
80
100
With Carbon Without Carbon
Arsenic Lead
Investigation of Turnout Clothing Contamination and Validation of Cleaning April 30, 2017
31
loaded fabrics would have had a lower decontamination efficiency, which they did not. Instead,
it appears that some adsorption of heavy metals on the carbon and the removal of carbon
provided for some improvement of cleaning effectiveness. The mechanisms for large
differences between arsenic and lead removal are not yet understood but could be affected by
relative solubilities of the heavy metal salts as applied to the fabric specimens.
Summary and Conclusions:
The previously developed methods detailed within second set of experiment for
applying the target compounds were utilized on the carbon-loaded and clean fabrics.
Extraction in methylene chloride followed by GC/MS analysis showed variable recovery of the
organic target compounds before laundering that may be due to chemical volatility and the
extended period of time for analysis. The laundering of the specimens show widely varying
levels of contaminant removal. The results suggested that the presence of carbon allowed
greater fabric specimen retention of contaminant though the differences were small for several
chemicals. Recoveries of the inorganic components were also acceptable; however, it was
noted that the carbon black had background levels of lead. Lower levels of decontamination
efficiency were noted for lead as compared to arsenic. Decontamination efficiencies were
higher for carbon-loaded fabrics as compared to non-carbon specimens.
Overall Study Findings and Recommendations A preliminary investigation was undertaken to evaluate chemical contaminants in used,
exposed firefighter clothing and developed methodology that could be used to assess cleaning
effectiveness.
The ability to analyze clothing materials for contaminants is fraught with multiple issues
for discerning contamination levels. The specific identification and quantification of
contaminants is strongly affected by the extraction and analytical procedures that are used. In
this study, several substances were found at higher levels that may have more to do with the
fabric composition and general use of the product than fireground contamination such as fabric
dyes/finishes and fatty acids from skin contact. Therefore, any analytical work to discern
contaminated levels over a broad range of chemical substances must include relatively low
levels of sensitivity and specifically target certain groups of chemical substances of interest,
e.g., phthalates and polynuclear aromatic compounds. Detailed extraction and analytical
procedures should be standardized to enable consistent forms of determining contamination.
It is recognized that in order to understand cleaning effectiveness, specific techniques
are needed to provide uniformly and repeatably contaminate specimens that can be subjected
to a specific cleaning or laundering process and then evaluated for residual chemical. Ideally,
the contamination process should emulate fireground exposures and in particular the
deposition of carbon particles via soot onto clothing materials.
Investigation of Turnout Clothing Contamination and Validation of Cleaning April 30, 2017
32
Intertek attempted to create a soot deposition technique by the burning of a known fuel
in a tube furnace and direct the off gassing particles and chemicals onto fabric specimens in the
effluent path. While this approach appeared to provide samples that simulate the appearance
of field contaminated clothing, the method proved to be inconsistent and not yield full range of
contaminants of interest for general firefighter clothing use in structural fires. While additional
efforts could have been spent optimizing fuel load and exposure conditions, it was believed
that the technique simply could not reliably contaminate specimens for evaluating cleaning
process effectiveness.
Intertek was able to develop a hybrid technique though a stepwise development
process that entailed the use of carbon black as a soot surrogate in combination with more
conventional chemical doping methods. The specific approach use was to grind a known
amount of carbon black into the material and then either drip or mist a specific quantity of
either organic or inorganic contaminants onto the carbon loaded specimens. It was observed
that direct chemical addition to fabric specimens provided high rates of recovery, i.e., the
amounts of chemical found from extraction analysis closely matched the applied levels of
chemical. When carbon was added to the material and a larger period of time transpired
between carbon loading, chemical contamination, and analysis, lower recoveries were found.
This finding suggests that specific care must be applied in the selection of chemicals such that
the chosen chemical do not evaporate or are not affected by long-term storage.
The technique for contaminating fabric specimens with carbon and chemicals did prove
useful for evaluating cleaning effectiveness. For the range of organic chemicals and
representative inorganic heavy metals, specific decontamination efficiencies were measured.
These efficiencies were compared for both carbon-loaded and non-carbon-loaded specimens.
As a result of this analysis, it was learned that carbon-loaded fabrics retain more organic
chemical during laundering than fabric specimens without the additional carbon. However, the
reverse was true for the inorganic heavy metals. It was further learned that the carbon itself
could be a source of lead contamination. Therefore, adjustments are needed in the types of
soils to ensure relatively clean backgrounds.
Based on the visual appearance of the fabrics following laundering, it was recognized
that some adjustment of the amount of carbon added to the fabric must be made since the
selected cleaning process still indicated the presence of carbon-based soils. It is expected that
with refinement of the process for adding carbon to the fabric specimens, improvements for
the realism of the contamination levels and general effectiveness for visual soiling removal as
now achieved by current laundering practices can be mimicked. Therefore, with the
optimization of carbon deposition levels, careful selection of chemical contaminants (based on
relevance, physical properties, and analytical capabilities), and appropriate application of
chemicals, a reliable contamination technique can be established.

Investigation of Turnout Clothing Contamination and Validation of Cleaning April 30, 2017
33
Proposed NFPA Public Input Information Based upon a significant amount of anticipated changes within NFPA 1851- 2017
edition, specific sections and organization of the below method will likely be different in the
final accepted version of the test method. Below are suggested high-level test method details
for the consideration by the committee:
11.3.7 For verification of an organization’s advanced cleaning services, the certification
organization shall evaluate the organization’s procedures in accordance with Section 7.3 of this
standard. For verification of an ISP’s advanced cleaning services, the certification organization
shall evaluate the ISP’s procedures in accordance with Section 7.3 of this standard and evaluate
the effectiveness of its cleaning processes against the requirements specified in 11.3.7.1.
11.3.7.1 When tested for removal of selected products of combustion as specified in 12.4,
Chemical Decontamination Efficacy Test, the ISP cleaning process shall provide for a 90% or
greater decontamination efficiency for each of the specified surrogate contaminants.
12.4 Chemical Decontamination Efficacy Test
12.4.1 Application. This test method shall apply to the decontamination of outer shell material
that is subjected to ISP cleaning procedures for advanced cleaning employed for the removal of
products of combustion from structural firefighting protective garments.
12.4.2 Samples. Pristine 100 mm (4.0 in.) diameter surrogate outer shell material samples shall
be laundered ten times in accordance with Section 8.1.2 of NFPA 1971, 2013 edition.
12.4.2 Specimens. A total of 12 pieces of surrogate outer shell material shall be tested.
12.4.3 Procedure.
12.4.3.1 Six Specimens shall be mounted to the lower mounting stage of a Martindale abrasion
machine.
12.4.3.2 Specimens shall be loaded with 0.05 g ± 0.005 g each of 99.9% Acetylene based Carbon
black for 80 cycles at utilizing 9kPa head pressure. The top abradant head shall be the 30 mm
(1.2 in.) diameter stainless steel head only configured as seen in Figure 12.4.3.2 (to be
provided).
12.4.3.3 All 12 specimens shall be contaminated with the following chemical quantities as
specified in Table 12.4.3.3:

Investigation of Turnout Clothing Contamination and Validation of Cleaning April 30, 2017
34
Table 12.4.3.3 Selected Surrogate Chemical Contaminants and Doses
Specimens Chemical Amount
1-6 Pentachlorophenol 2.5 g of a 625 ppm standard
1-6 Phenanthrene 2.5 g of a 625 ppm standard
1-6 Octacosane 2.5 g of a 625 ppm standard
1-6 Naphthalene 2.5 g of a 625 ppm standard
1-6 Diethylhexyl phthalate 2.5 g of a 625 ppm standard
1-6 Xylene 2.5 g of a 625 ppm standard
1-6 2,2’,4,4’-Tetrabromodiphenyl ether 2.5 g of a 625 ppm standard
1-6 2,2’,4,4’,5,5’-Hexachlorobiphenyl 2.5 g of a 625 ppm standard
7-12 Arsenic 600+/-50 ng
7-12 Lead 600 +/-50 ng
12.4.3.4 Organic chemical contamination shall be performed by placing fabric samples in large
mouth jars and dripping above specified quantity of a standard solution containing all of the
target compounds on the carbon loaded portion of the fabric.
12.4.3.5 Inorganic chemical contamination shall be performed utilizing the nebulizer from an
ICP instrument to deposit the arsenic and lead to the carbon loaded surface of the fabric. A
solution of arsenic and lead was prepared in 2-propanol. The solution contained 100 ng of each
element per milliliter in electronics grade isopropanol.
12.4.3.6 All Specimens shall be allowed to fully dry within a chemical hood for 24 hours
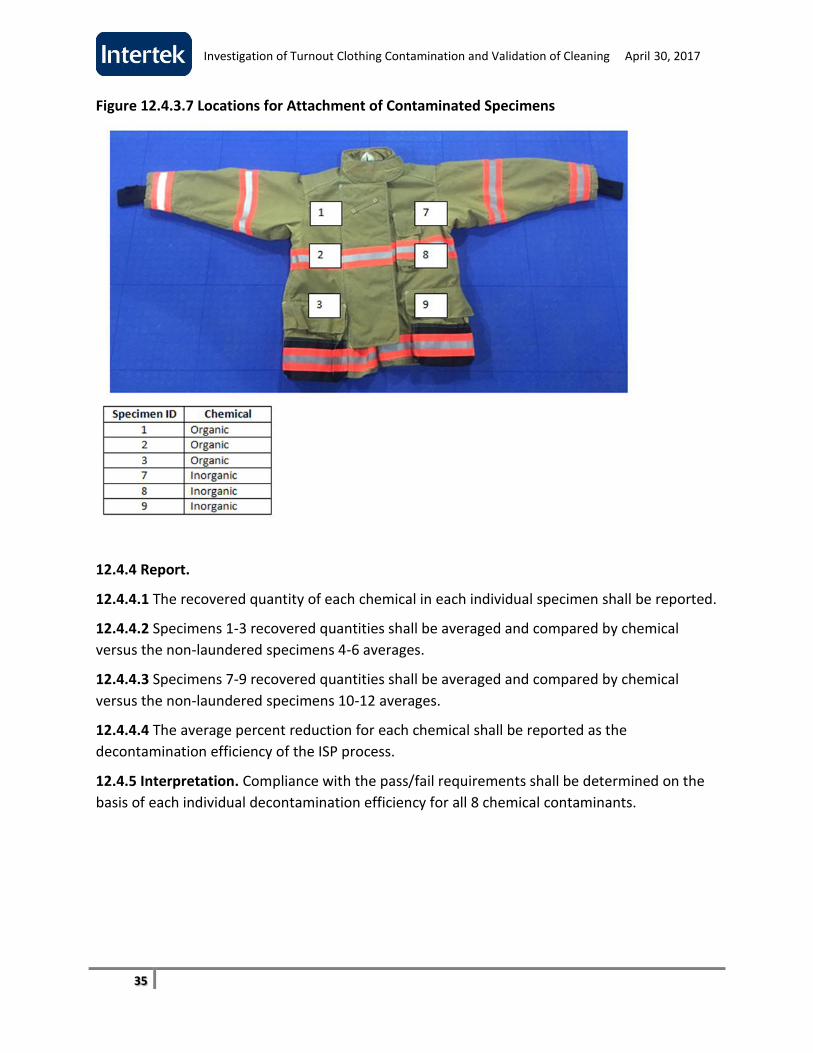
12.4.3.7 Specimens shall be mounted in the locations as seen in Figure 12.4.3.7 to a standard
protective coat that is certified to NFPA 1971-2013 by fastening with a safety pin through the
top and bottom of the circles to the outer shell.
12.4.3.8 The protective coat and surrogate specimen assembly shall be cleaned in accordance
with the procedures of the ISP. Sufficient ballast of suitable type shall be provided to make up a
full load.
12.4.3.9 All 6 organic specimens shall be extracted using methylene chloride or another suitable
methodology.
12.4.3.10 All 6 inorganic specimens shall be extracted using a suitable methodology.
Investigation of Turnout Clothing Contamination and Validation of Cleaning April 30, 2017
35
Figure 12.4.3.7 Locations for Attachment of Contaminated Specimens
12.4.4 Report.
12.4.4.1 The recovered quantity of each chemical in each individual specimen shall be reported.
12.4.4.2 Specimens 1-3 recovered quantities shall be averaged and compared by chemical
versus the non-laundered specimens 4-6 averages.
12.4.4.3 Specimens 7-9 recovered quantities shall be averaged and compared by chemical
versus the non-laundered specimens 10-12 averages.
12.4.4.4 The average percent reduction for each chemical shall be reported as the
decontamination efficiency of the ISP process.
12.4.5 Interpretation. Compliance with the pass/fail requirements shall be determined on the
basis of each individual decontamination efficiency for all 8 chemical contaminants.