Investigation of the Vortical Flow Above an F/A-18 Using ...
19
Investigation of the Vortical Flow Above an F/A-18 Using Doppler Global Velocimetry James F. Meyers Joseph W. Lee NASA - Langley Research Center Hampton, Virginia 23681 Angelo A. Cavone ViGYAN, Inc. Hampton, Virginia 23666 and Karen E. Suzuki Wright Laboratory Wright-Patterson Air Force Base Dayton, Ohio 45433 ASME Fifth International Conference on Laser Anemometry - Advances and Applications August 23-27, 1993 Koningshof, Veldhoven, The Netherlands
Transcript of Investigation of the Vortical Flow Above an F/A-18 Using ...

Investigation of the Vortical Flow
Above an F/A-18 Using
Doppler Global Velocimetry
James F. MeyersJoseph W. LeeNASA - Langley Research CenterHampton, Virginia 23681
Angelo A. CavoneViGYAN, Inc.Hampton, Virginia 23666
and
Karen E. SuzukiWright LaboratoryWright-Patterson Air Force BaseDayton, Ohio 45433
ASME Fifth International Conference onLaser Anemometry - Advances and Applications
August 23-27, 1993Koningshof, Veldhoven, The Netherlands


Investigation of the Vortical Flow Above an F/A-18Using Doppler Global Velocimetry
James F. Meyers*, Joseph W. Lee*, Angelo A. Cavone**,and Karen E. Suzuki***
* NASA - Langley Research Center, Hampton, Virginia 23681, USA** ViGYAN, Inc., Hampton, Virginia 23666, USA*** Wright Laboratory, Wright-Patterson Air Force Base,
Dayton, Ohio 45433, USA
Abstract
The flow above an F/A-18 model, set to 25-degrees angle of attack, wasmeasured using a Doppler global velocimeter, (DGV). The investigationindicated that the complex flow contained many similarities to thevortical flow above a simple delta wing set to a high-angle of attack,including flow standard deviations greater than 30-percent of free-stream. These standard deviation levels were also comparable toresults found during a previous investigation of the vortical flow abovea YF-17 using fringe-type laser velocimetry. The global measurementcapability of the DGV provided the first evidence that the burst vorticesabove the model were structured. These structures were found tomaintain their spatial coherence while the flow varied in an overallsense.
Introduction
The development of modern, highly maneuverable aircraft relies onvortex lift and other complicated flows to increase performance to apoint where the aerodynamics are pushed to the edge of stability. Theability of electronic fly-by-wire technology to instantly return theaircraft to stable flight from unstable excursions can not be easilysimulated using traditional development approaches. Standard windtunnel testing to determine force and balance parameters must besupp l emented by theo re t i c a l p r ed i c t i ons o f the f l ow and the i rexperimental verification by off-body measurements. Computationalfluid dynamics (CFD) is becoming increasingly sophisticated and hassucces s fu l l y pred i c t ed many c la s s i c f l ow f i e ld s . However, th i stechnology is being expanded to predict flows that have not or can not bemeasured with conventional instrumentation. If the extrapolation

continues without experimental verification, the usefulness of thepredictions quickly becomes questionable. The burden now shifts to theexperimentalist and the instrumentation engineer to develop newmeasurement techniques that can provide experimental databases forcode validation and the direct measure of the flow field / airframeinteractions.
The advent of the laser has provided the instrumentation engineer witha tool that serves as the basis for several new instrumentation systems.Fanning the laser beam into a light sheet provides a visualization of thef l ow f i e l d w i th g r e a t e r c apab i l i t y and f l e x i b i l i t y t han c l a s s i cshadowgraphy. The coherent characteristic of laser light is used as thebas i s f o r l a ser ve lo c imetry, a non int rus ive , ve l o c i t y measur ingtechnique capable of measuring time dependent, three-componentvelocity flow fields with accuracies better than 0.5 percent. Finally,these two ideas are now being combined in a new technique, Dopplerglobal velocimetry, which can provide simultaneous three componentvelocity measurements within a desired measurement plane in realtime.
The capabilities of this new technique were first examined in a windtunnel environment by investigating the vortical flow above a 75-degreedelta wing in a small, subsonic wind tunnel
1
. The results of this flowsurvey compared favorably with earlier fringe-type laser velocimetrymeasurements of the same flow. The advantages of rapid globalmeasurements were clearly demonstrated with the finding that the flowacts as a solid body of revolution within the transition from stable toburst vortical flow, and the finding of the first evidence that burstvortices were spatially coherent. The ability of the DGV to provideinsight into classic vortical flows showed that the technique could beused to examine the intricate structure of the interacting vortices abovean F/A-18.
The Doppler Global Velocimeter
In 1964, Yeh and Cummins2
invented the Laser Doppler Velocimeter(LDV) when they used an interferometric optical system to combineDoppler-shifted, scattered laser light collected from particles passingthrough a laser beam with a portion of that beam. These coaxial lightbeams were directed to a photomultiplier where they heterodyned onthe photocathode surface. The resulting output signal oscillated at theDoppler frequency. As shown in figure 1, the LDV measurementd i rec t i on was the vec tor ia l d i f f e rence between the propagat iondirect ion of the col lected scattered l ight, ô , and the laser beam
2

propagation direction, î. The relationship between velocity and theDoppler shift is given by:
∆νν
=•
o(ô- î) V
c (1)
where Dν is the Doppler shift frequency, ν is the laser frequency, V isthe particle velocity, and c is the speed of light. Thus, different velocitycomponents can be measured by using various laser propagat iondirections and/or locations of the receiver optical system.
In 1991, Komine, et al3
used the same principle to develop a new laserDoppler velocimeter. Instead of using heterodyne detection, Komineused the edge of an absorption line in Iodine vapor as an opticalfrequency discriminator, figure 2, to provide a direct measure of theDoppler frequency. Adjusting the laser frequency to the midpoint alongthe edge, the scattered light from a stationary object in the laser beamwould be attenuated 50 percent as it passed through the Iodine vaporcell. If the object were moving through the laser beam, the scatteredlight would be attenuated more (or less if the direction of travel werereversed) by the Iodine vapor since the Doppler effect would change thefrequency of the scattered light. The greater the velocity, the greater(or lesser) the attenuation.
To better illustrate this process, an optical system was configured,figure 3, to illuminate and view a rotating wheel. Closer examination ofthe optical configuration shown in figure 3(a) reveals the spreading ofthe laser beam into a cone of light, and the use of two CCD cameras asdetectors. These deviations from standard laser Doppler velocimetersystems are possible since this technique provides a direct measure ofthe scattered light optical frequency. Resolving individual particles,required by standard laser velocimetry and particle image velocimetry,is not necessary. The technique only requires photons of scattered lightsufficient to activate the detector. It makes no difference whether thelight scatters from a solid surface, e.g., the rotating wheel, micron sizedpart ic les , or even natural ly occurr ing 0 .01 micron condensat ionclusters in supersonic wind tunnels. Unfortunately, the amount ofcollected scattered light is influenced by the number of particles withinthe viewed laser beam, their size distribution, and even the Gaussianintensity profile of the beam cross section. Therefore, a second detectoris added to sample a portion of the collected scattered light prior to theIodine vapor cell as a reference signal. Normalization of the signaldetector output by the reference detector output removes all intensityin f luence s on the co l l e c t ed s ca t t e r ed l i gh t ex cep t the ve l o c i t ydependence yielded by the Iodine vapor. Since square law detectors,such as photocathode surfaces, are not required to provide optical
3

heterodyning, linear detectors such as charge coupled devices, e.g., CCDvideo cameras, can be used to convert the collected light to electricalenergy.
Images of the rotating wheel, il luminated by a single frequency Argonion laser, were simultaneously acquired by both the signal and referencecameras. These images were processed using standard and customimage processing techniques to adjust for variations in individual pixelsensit iv i t ies , charge transfer noise within the CCD array, imaged i s tor t i ons imposed by opt i ca l e l ements , w indows , and v iewingperspective, and laser frequency drift
4
. The average of 5 normalizedimage frames (10 fields) of the wheel rotating at 16,000 rpm is presentedas a gray scaled contour mapping with the measured 256 gray levelsreduced to 7 levels for greater clarity in figure 4. If the normalizedintensities obtained from pixels viewing the vertical diameter areplotted versus the horizontal velocity of the wheel, a detailed transferfunction of the Iodine vapor cell can be obtained. This plot along with athird order polynomial fit are shown for the left side of the absorptionline in figure 5. The accuracy of this calibration can be determined bycomparing the measured velocity profile along the vertical diameter ofthe wheel rotating at 12,000 rpm with the actual velocity, figure 6. Theaverage error of the 300 pixel measurements was -0.96 m/sec with astandard deviation of +3.65 m/sec. This measurement of standarddeviation is consistent with the expected level generated by chargetransfer noise in the CCD video camera. It is expected that chargetransfer noise wi l l remain constant , and be the dominate factorgoverning the variation in velocity measurement during wind tunneltesting.
Experimental Arrangement
The investigation of the vortical flow above an F/A-18 model wasconducted in the Langley Basic Aerodynamic Research Tunnel (BART)
5
.The tunnel was an open circuit tunnel with a test section that measured0.71 m high, 1.02 m wide, and 3.07 m long. The tunnel could obtain amaximum velocity of 67 m/sec in the test section with a Reynoldsnumber of 0.43 million per meter. The air entering the tunnel wasconditioned by a honeycomb structure and four antiturbulence screensprior to accelerating in an 11:1 contraction nozzle before entering thetest section. The turbulence intensity was measured with a hot wire andfound to be less than 0.08 percent for all flow conditions. Propyleneglycol seed particles were produced by a vaporization/condensationgenerator placed upstream of the honeycomb structure. The particlesize distribution peaked at 0.7 microns with a skewed distributionextending to 10 microns
6
.
4

The DGV receiver optical system was located upstream, on top of thetest section, viewing the top surface of the F/A-18 model, figure 7. Thethree velocity components were measured sequentially by routing thelight sheet through the left side window, top window, and right sidewindow in turn. Resolving the measurement components into standardUVW velocities was not attempted since sequential measurementsimpose the assumption of isometric flow, clearly not the case for thep r e s en t inve s t i g a t i on . I f t h r e e r e c e i v e r op t i c a l s y s t ems weresynchronized for simultaneous measurement, standard UVW velocitiescould be determined without assumptions.
Flow Field Investigation
The goal of the present investigation was to determine if the flow abovethe F/A-18 at 25-degrees angle of attack had similar characteristics tothe flow found above a simple delta wing at high angles of attack
1
,f igure 8. The DGV measurements above the delta wing found the flow tohave a spatially coherent structure, even when the vortices burst.Previous fringe-type laser velocimetry (LV) flow measurements above amodel o f the prototype F/A-18 , the YF-17
7
, ind icated the three -component velocity maintained a structure, figure 9, although thestandard deviation was quite large, figure 10. The location of thesemeasurements, station 524 - the position where the leading edge of thevertical stablizers go below the top of the fuselage, figure 11, was alsochosen for the current investigation.
The geometries involved in DGV, figure 3, prohibit a direct measure ofstandard u , v , and w components when the measurement plane wasplaced perpendicular to the streamwise direct ion. Although thestandard components could be resolved from three-component DGVmeasurements, the stringent requirements on pixel viewing overlapamong the three measurement images disallow resolving acquired dataobtained during different tunnel runs. The component defined by thepropagation of the light sheet from the left side of the test section,figure 12, yielded the average velocity mapping shown in figure 13. Theclipped image on the right of the model in figure 13 was the shadow in thelight sheet caused by the model fuselage, figure 14. The mirror of thiscomponent, figure 15, was obtained by propagating the light sheetthrough the right side. As expected, the velocity map, figure 16, was amirror of figure 13. The third component, figure 17, obtained bypropagation of the light sheet through the top of the test section, yieldedthe velocity map shown in figure 18. The standard deviation of velocityfor each pixel measurement used to produce figure 13 is shown infigure 19. The standard deviations were found to be greater than
5

30 pe r c en t o f f r e e s t r e am , wh i ch c ompa r e we l l w i t h p r e v i ou smeasurements above a delta wing
1
and the YF-17.7
Examination of individual DGV images revealed flow patterns similar tothose found above a delta wing at high angles of attack. It appears thatthe main vortex generated by the leading edge extension was notaffected by intrusions from other flow structures such as vorticesoriginating at the aircraft forebody and wing, and flow separationsabove the wing. It therefore seems that the characteristics of vortexflow remain the same among the delta wing, YF-17, and F/A-18. Therepetition of large velocity changes in a coherent manner, as found inthis investigation, could provide the necessary forcing function thatcauses oscillation of the vertical stabilizers, resulting in stress cracksto be formed at their attachment points on the fuselage.
Summary
An investigation of the vortical flow above an F/A-18 at 25-degrees angleof attack using a Doppler global velocimeter (DGV) has been presented.The capability of the DGV to simultaneously measure the velocitydistribution within a selected plane provided evidence that the burstvortical flow had similar characteristics as the flow above a standarddelta wing at high angles of attack. The vortex generated by the leadingedge extens ion appeared to be unaf fected by other vort i ca l andseparated flows above the aircraft. The velocity variations of thestructured flow within the burst vortices appear to be sufficient to causethe oscillations of the vertical stabilizers found at high angles of attack.
References
1. Meyers, J. F.; Lee, J. W.; and Cavone, A. A.: Three Component
Doppler Global Velocimeter Measurements of the Flow Above a
Delta Wing . Sixth International Symposium on Applications ofLaser Techniques to F lu id Mechan ics , paper 13 .2 , L i sbon ,Portugal, July 20-23, 1992.
2. Yeh, Y.; and Cummins, H. Z.: Localized Fluid Flow Measurements
with a He-Ne Laser Spectrometer . Applied Physics Letters, vol. 4,no. 10, pp. 176-178, May 1964.
3. Komine, H.; Brosnan, S. J.; Litton, A. B.; and Stappaerts, E. A.:Real Time, Doppler Global Velocimetry . AIAA 29th AerospaceSciences Meeting, Reno, NV, paper no. AIAA-91-0337, January 7-10, 1991.
6

4. Meyers, J. F.: Doppler Global Velocimetry The Next Generation?
AIAA 17th Aerospace Ground Testing Conference, paper AIAA-92-3897, Nashville, TN, July 6-8, 1992.
5. Sellers, W. L., III; and Kjelgaard, S. O.: The Basic Aerodynamics
Research Tunnel A Facility Dedicated to Code Validation . AIAA15th Aerodynamic Testing Conference, San Diego, CA, paper no.AIAA-88-1997, May 18-20, 1988.
6. Meyers, J. F.: Generation of Particles and Seeding . von KarmanInstitute for Fluid Dynamics, Lecture series 1991-08, LaserVelocimetry, Brussels, Belgium, June 10-14, 1991.
7. Sellers, W. L., III; Meyers, J. F.; and Hepner, T. E.: LDV Surveys
over a Fighter Model at Moderate to High Angles of Attack . SAE1988 Aerospace Technology Conference & Exposition, Anaheim,CA, October 3-6, 1988.
Figure 1.- Diagram depicting the velocity measurement direction.
7
Laser Propagation Direction, î
Collected ScatteredLight Direction, ô
Measured VelocityComponent
( ô - î )
θ2
θ2

Figure 2.- Transfer function of the Iodine vapor cell , IVC.
Figure 3a.- Doppler global velocimeter optical configuration.
8
100
50
0
Tra
nsm
issio
nth
rou
gh
Iod
ine
ce
ll,p
erc
en
t
0 500 1000 1500 2000
Laser frequency from etalon flash point, MHz
Laser settingfor DGV
Wheel
SignalCamera
Iodine Cell
ReferenceCamera
Laser
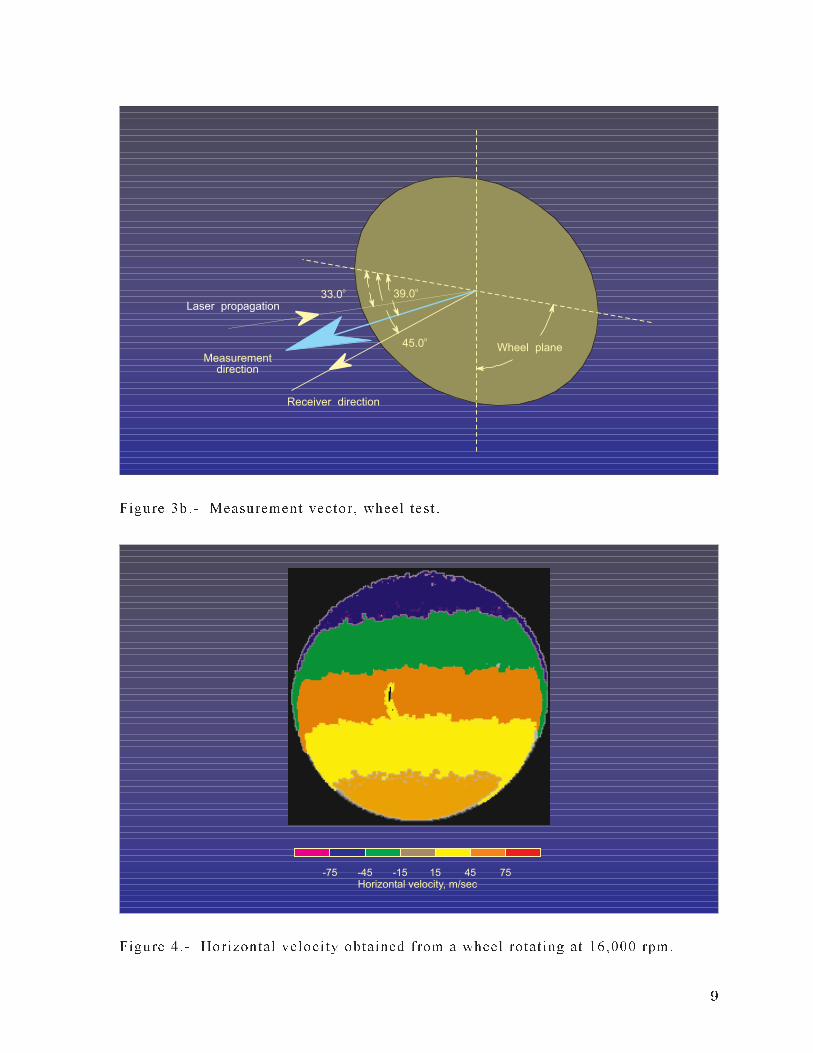
Figure 3b.- Measurement vector, wheel test .
Figure 4.- Horizontal velocity obtained from a wheel rotating at 16,000 rpm.
9
-75 -45 -15 15 45 75Horizontal velocity, m/sec
39.0o
45.0o
33.0o
Wheel plane
Laser propagation
Receiver direction
Measurementdirection

Figure 5.- IVC transfer function determined by DGV measurements.
Figure 6.- DGV measurements along the vertical wheel diameter, 12,000 rpm,
Average error = -0.96 m/sec, Standard deviation = 3.65 m/sec.
10
100
50
0
-50
-100
-0.10 -0.05 0 0.05 0.10
Velo
city,
m/s
ec
Radial distance, m
ε = -0.69 m/sec
= 3.61 m/secσε
200
150
100
50
0
Pix
ela
mp
litu
de
,co
un
ts
-100 -50 0 50 100
Velocity, m/sec

Figure 7.- DGV installed in the Basic Aerodynamics Research Tunnel.
Figure 8.- DGV measurements of the cross flow above a 75-degree delta wing,
AoA = 40o.
11
Normalized mean velocity
-.6 -.2 .2 .6 1.0 1.4
10
0
5
15
Heig
ht,
cm
-15 -10 -5 0 5 10 15
Span, cm

Figure 9.- LV measurements above the YF-17 model, AoA = 25.0o.
Figure 10.- Normalized standard deviation above the YF-17 model, AoA = 25.0o.
12
He
igh
t,cm
Span, cm
5
0
-5
-20 -15 -10 -5 0
.05 .10 .15 .20 .25 .30
W / Urms ∞
0 .2 .4 .6 .8 1.0
Normalized U-component mean
Freestream
He
igh
t,cm
Span, cm
5
0
-5
-20 -15 -10 -5 0

Figure 11.- Three view diagram of the YF-17 configuration.
Figure 12.- DGV measurement vector with laser beam entering the left side of the
test section.
13
Streamwise(downstream)
Cross Flow
Vertical
121.6o
33.9o
Laser Propagation
35 ft 52.5 ft
FuselageStation
440 524
440 524
266 in

Figure 13.- DGV measurements above the F/A-18, component shown in figure 12.
Figure 14.- Laser light sheet visualization of the vortical flow above the F/A-18.
14
He
igh
t,cm
Span, cm
10
0
-10
-20 -10 0 10 20
-50 -25 0 25 50 75
Velocity, m/s
θ = −121.6 φ = 33.9ο ο

Figure 15.- DGV measurement vector with laser beam entering the right side of the
test section.
Figure 16.- DGV measurements above the F/A-18, component shown in figure 15.
15
Heig
ht,
cm
Span, cm
10
0
-10
-20 -10 0 10 20
-50 -25 0 25 50 75
Velocity, m/s
θ = 121.6 φ = 33.9ο ο
Streamwise(downstream)
Cross Flow
Laser Propagation
Vertical
121.6o
33.9o
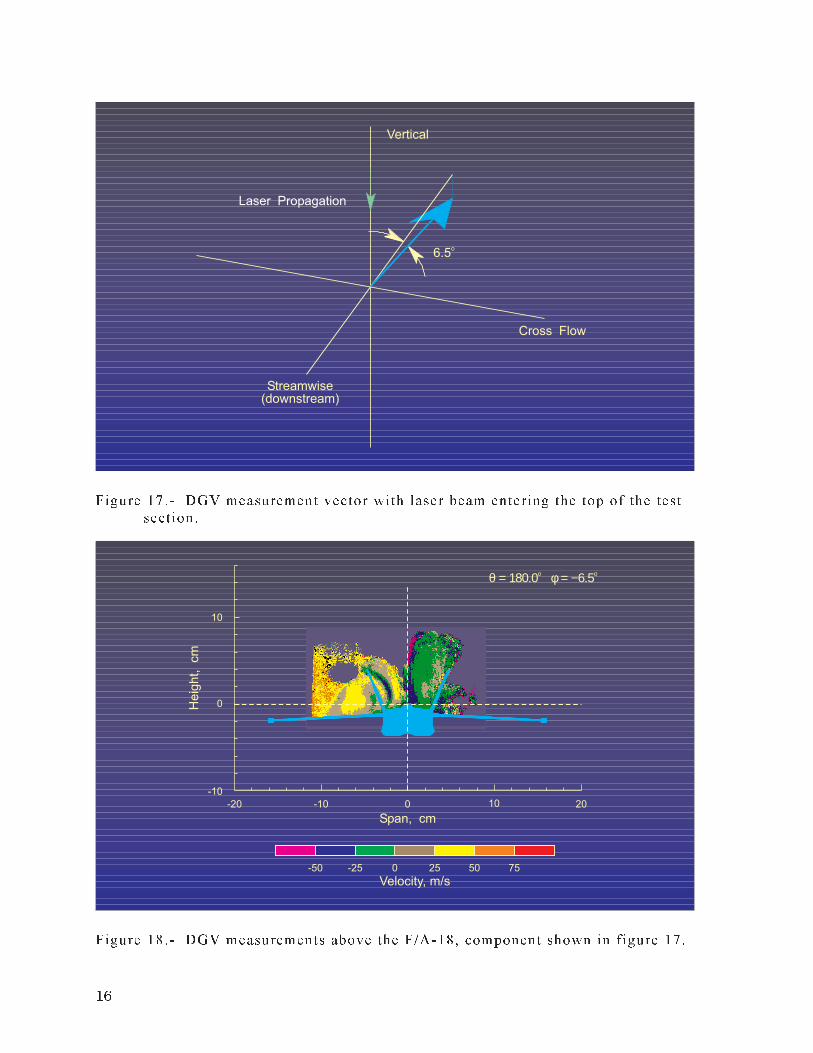
Figure 17.- DGV measurement vector with laser beam entering the top of the test
section.
Figure 18.- DGV measurements above the F/A-18, component shown in figure 17.
16
Heig
ht,
cm
Span, cm
10
0
-10
-20 -10 0 10 20
-50 -25 0 25 50 75
Velocity, m/s
θ = 180.0 φ = −6.5ο ο
Streamwise(downstream)
Cross Flow
Vertical
6.5o
Laser Propagation

Figure 19.- Normalized standard deviations of the velocity measurements shown
in figure 13.
17
Heig
ht,
cm
Span, cm
10
0
-10
-20 -10 0 10 20
5 10 15 20 25 30
σ / V , percent∞
θ = −121.6 φ = 33.9ο ο


![A PDMS Self-Vortical Micromixer Without Obstructions · A PDMS Self-Vortical Micromixer Without ... electrical fields [6], ... A PDMS Self-Vortical Micromixer Without Obstructions](https://static.fdocuments.us/doc/165x107/5b3f733d7f8b9a91078c28b5/a-pdms-self-vortical-micromixer-without-obstructions-a-pdms-self-vortical-micromixer.jpg)