Investigation of the use of osmotic induction to reduce the ... Minnesota Department of Natural...
26
3 0307 00075 5879 12 - 0866
Transcript of Investigation of the use of osmotic induction to reduce the ... Minnesota Department of Natural...

illffljiJ~JD11111!3 0307 00075 5879
12 - 0866

1
Minnesota Department of Natural Resources
Investigational Report 557, May 2012
Investigation of the use of Osmotic Induction to Reduce
the Immersion Period for Marking Early Life Stages of Walleye
with Fluorescent Chemicals1
Dale E. Logsdon
Minnesota Department of Natural Resources
Post Office Box 86
Waterville, Minnesota 56096, USA
Abstract.—Preceding the immersion of walleyes in either oxytetracycline (OTC) or calcein with
immersion in a concentrated salt solution (osmotic induction) allowed fluorescent marking of either fry or
juvenile walleyes with a shorter immersion duration than commonly necessary. The fry immersed in 1.0-
4.5% NaCl for up to 90 s followed by immersion for 1-3 h in 700 mg OTC/L appeared to tolerate the
treatment well but the quality of the marks produced on their otoliths was inconsistent. Juvenile walleyes
immersed in 2.5-5.0% NaCl for up to 4 min followed by immersion in 0.5% calcein for 4 min consistently
formed marks but showed less tolerance to the treatment procedure and experienced variable mark reten-
tion. Weekly inspections of calcein treated walleyes revealed rapid mark degradation on structures ex-
posed to sunlight, but at least some marks were visible on all of the walleyes treated by pre-immersion in
5% NaCl for 4 min at the end of the experiment 15 weeks post-treatment.
Key words: walleye, fry, oxytetracycline, calcein, osmotic inductions, fluorescent mark
1 This project was funded in part by the Federal Aid in Sport Fish Restoration (Dingell-Johnson) Program. Completion Report,
Study 614, D-J Project F-26-R Minnesota.
This document is made available electronically by the Minnesota Legislative Reference Library as part of an ongoing digital archiving project. http://www.leg.state.mn.us/lrl/lrl.asp

2
Introduction
The Minnesota Department of Natural
Resources (MNDNR) stocks approximately 300
million walleye Sander vitreus fry into lakes and
rivers annually. Evaluating the contribution of
these stocked fry to the fisheries, however, can
be complicated by annual variability in natural
reproduction and the inability to discern between
stocked and wild walleyes. Marking the stocked
walleyes allows analysis of the stock composi-
tion, but conventional fish marking techniques
such as fin clips or tags are not practical due to
the small size of walleye fry at the time of mark-
ing.
Immersion in fluorochrome dyes may be
a practical alternative for marking larval wall-
eyes (Brooks et al. 1994). Oxytetracycline
(OTC) and calcein are the most common fluoro-
chrome dyes used to mark fish (Guy et al. 1996).
These chemicals are readily absorbed by the fish
and deposited in their calcified tissues (Thomas
et al. 1995). When subjected to ultraviolet light,
the marked tissues fluoresce at specific wave-
lengths. Tetracycline marked tissues appear yel-
low-gold (Weber and Ridgway 1962; Brooks et
al. 1994; Logsdon et al. 2004) whereas calcein
marked tissues appear bright-green (Brooks et
al. 1994; Negus and Tureson 2004).
The earliest published fluorochrome
marking experiments on fish were conducted
with tetracycline by Weber and Ridgway (1962;
1967). They were able to produce visible marks
on salmon by administering tetracycline as a
food supplement, by injection, or by immersion.
These marking techniques have been since repli-
cated and modified to mark a variety of salmon-
ids (Odense and Logan 1974; Bilton 1986; Hall
1991), as well as coregonids (Dabrowski and
Tsukamota 1986), sciaenids (Bumguardner
1991), moronids (Secor et al. 1991), clupeids
(Lorson and Mudrak 1987; Hendricks et al.
1991) and percids (Scidmore and Olson 1969;
Kayle 1992; Brooks et al. 1994; Unkenholz et al.
1997; Lucchesi 2002; Logsdon et al. 2004).
Despite early success in immersion-
marking of walleye fingerlings (Scidmore and
Olson 1969), a procedure for mass-marking
walleye fry did not appear in the literature until
described by Brooks et al. in 1994. Brooks et al.
(1994) marked 4-5 day old walleye fry by im-
mersion in a pH buffered solution of 500 mg
OTC/L. The OTC solution was first mixed in
the bags used to transport fry, then the fry were
added to the solution and allowed to immerse for
6 hours. This procedure resulted in fluorescence
marks that were visible on 100% of the otoliths
from walleyes that were inspected 11 months
later using equipment similar to that described
by Bumguardner (1991).
Poor success producing fluorescent
marks on walleye fry less than 4 days old
(Younk and Cook 1991; Brooks et al. 1994) led
researchers to believe that otoliths of younger
fish were not developed enough for deposition
of OTC. Subsequent research, however, has
demonstrated that the walleye otoliths could be
successfully marked in newly hatched fry if the
concentration of OTC was increased to 700mg/L
(Logsdon et al. 2004). The ability to mark the
otoliths of newly hatched fry in-transit greatly
simplified the marking process by removing the
need to separate and hold different aged fish in
the hatchery and allowed the Minnesota DNR to
mark over 30 million walleye fry annually for
stocking into Red Lake with little interruption of
standard hatchery procedures (Logsdon 2006).
Perhaps the best way to further improve
the marking procedure would be to reduce the
immersion period. A shorter immersion period
would allow in-transit marking at higher fish
densities and reduce the amount of chemicals
required to mark a given number of fry. Use of
osmotic induction (Mohler 2003) may allow for a
significant reduction in the length of time neces-
sary to produce a fluorescent mark on walleye
fry by increasing the uptake rate of the OTC so-
lution. The osmotic induction protocol differs
from the marking procedure commonly used for
walleye fry (Brooks et al. 1994; Fielder 2002;
Lucchesi 2002; Logsdon et al. 2004) in that the
fish are immersed in a salt solution prior to im-
mersion in the labeling solution. Immersion in
the salt solution produces an osmotic gradient
and promotes the partial loss of water from the
fish tissue to their environment. An abrupt
movement from the salt solution to the labeling
solution then reverses the osmotic gradient and
results in a rapid uptake of the labeling solution
as water is replaced in the fish tissue via osmosis
across the skin and gills (Alcobendas et al. 1991;
Mohler 2003). Osmotic induction has been suc-

3
cessfully used to reduce the contact time neces-
sary to produce both tetracycline and calcein
marks in the elvers of the European eel (Anguil-
la anguilla) (Alcobendas et al. 1991) as well as
calcein marks in larval and juvenile salmonids
(Mohler 2003; Negus and Tureson 2004).
The use of calcein as a labeling agent
for walleye fry may hold some advantages over
the use of OTC. Oxytetracycline marks undergo
photolysis when exposed to extended periods of
sunlight (Lorson and Mudrak 1987; Muth and
Bestgen 1991; Macfarlane et al. 2002). This
renders the external marks unreadable and re-
quires the sacrifice of the fish for removal of
internal calcified structures such as otoliths for
mark detection. Calcein marks can also fade
when exposed to light (Leips et al. 2001;
Honeyfield et al. 2008; Honeyfield et al. 2011),
however, calcein has been reported to produce
marks on fin rays, scales, and other calcified
structures that remain visible for several months
via external examination with a portable detec-
tion device or epifluorescent microscopy
(Mohler 2003; Negus and Tureson 2004;
Honeyfield et al. 2011). If external visibility of
the calcein marks persists over a reasonable pe-
riod of time on walleyes then this technique
could allow for a simplified, non-lethal method
of assessing walleye stocking contribution.
The purpose of this study was to evalu-
ate the use of osmotic induction for reducing the
immersion period necessary to produce fluores-
cent marks on walleyes by determining: 1) the
tolerance of walleyes to the osmotic induction
procedure, 2) the quality of marks produced by
OTC after osmotic induction in a NaCl solution,
3) the quality of marks produced by calcein us-
ing the osmotic induction procedure described in
Option B under Investigational New Animal
Drug (INAD) Protocol 10-987 (USFWS 2003),
and 4) the retention and ease of non-lethal mark
determination on calcein treated walleyes.
The original vision for this study was to
evaluate osmotic induction using both OTC and
calcein on newly hatched fry. However, the lack
of calcification of tissues other than otoliths on
newly hatched walleye fry (McElman and Balon
1979; Figure 1), suggested a very low likelihood
of producing external marks during in-transit
immersion in calcein. In addition to the necessi-
ty of having calcified structures present for mark
production, the size of the calcified structures
present at the time of immersion has also been
reported to affect later calcein mark detection.
Negus and Tureson (2004) observed a corre-
sponding decline in mark visibility as the pro-
portion of marked to unmarked tissue decreased
due to fish growth. Negus and Tureson (2004)
reported that calcein marks produced on rainbow
trout Oncorhynchus mykiss at 3.5 months post-
hatch remained visible when inspected 35
months post hatch, whereas marks produced on
trout 0.5 months post-hatch had faded noticeably
when inspected at 12 months post-hatch and
were not visible at all when inspected next at 22
months post-hatch.
Since non-lethal mark detection is the
major advantage reported for the use of calcein
over OTC, a life stage that maximized the prob-
ability of long-term mark detection was selected
for initial calcein experimentation. Calcein has
not been approved by the U.S. Food and Drug
Administration (FDA) for use in marking food
fish. It has, however, been granted a compas-
sionate aquaculture investigational new animal
drug (INAD) exemption that is administered
through the U.S. Fish and Wildlife Service. This
exemption, however, restricts the use of calcein
to fish weighing less than 2 grams. The largest
life stage of walleye that was available under the
2 gram restriction was that which MNDNR staff
commonly refer to as “frylings”. Frylings are
walleyes that are reared at high densities in
drainable ponds at the MNDNR hatchery facili-
ties at New London and Waterville then harvest-
ed from the ponds when the zooplankton levels
in the ponds can no longer support rapid growth.
Harvest generally occurs at 40 to 50 days post-
hatch and the harvested frylings typically range
between 30 and 40 mm TL.
Methods
Oxytetracycline
Treatment.—Newly hatched walleye fry
(<24 h post-hatch) were treated by immersion in
a NaCl solution, followed by immersion in an
OTC solution. The treatments began by mixing
a bulk solution of 700 mg OTC/L (Fielder 2002;
Lucchesi 2002; Logsdon et al. 2004) with Ter-
ramycin 343 (Pfizer, New York, then buffer-

4
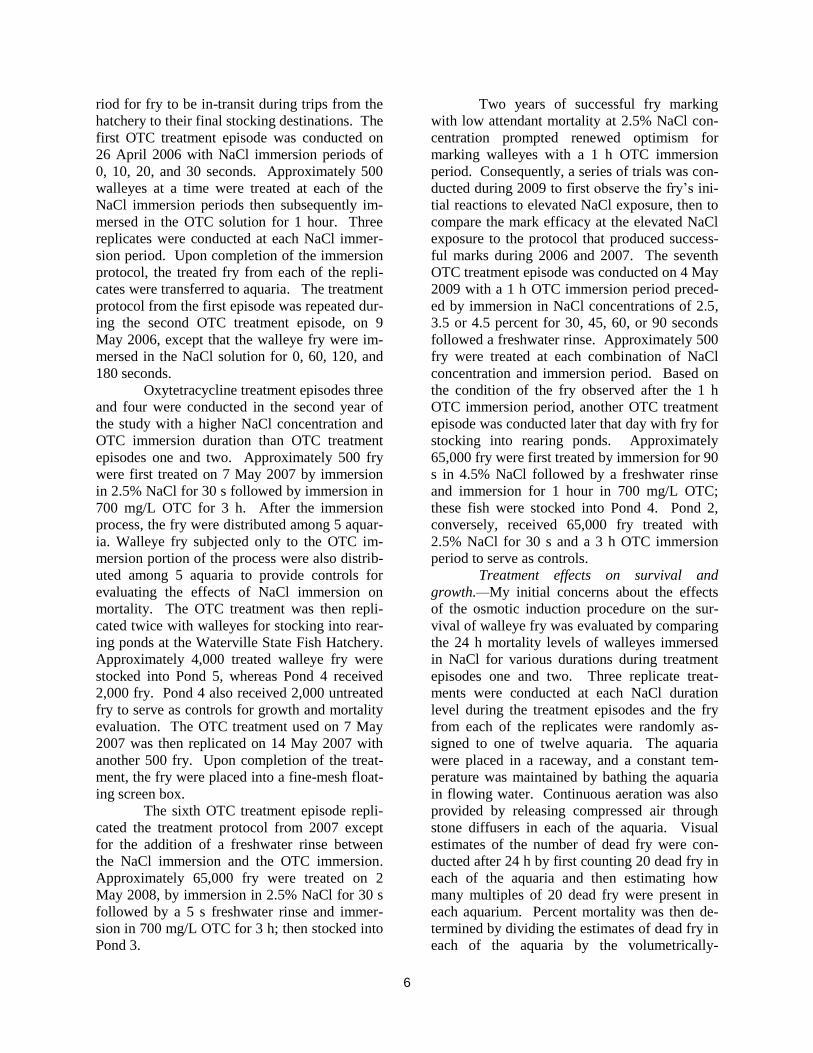
Figure 1. Photographs of a newly hatched (<24 h post-hatch) walleye fry. Photograph (a) is
the ventral-lateral view of the entire fish, whereas photograph (b) is a close up of the head region showing the presence of calcified otoliths.
Otoliths →
a)a)
b)a)

5
-ing the solution to pH 6.8 with sodium phos-
phate dibasic (Sigma, St. Louis, MO). A sili-
con-based surfactant (No-Foam, Argent Chemi-
cal, Redmond, WA) was also added to the solu-
tion at a rate of 0.04 mL surfactant/L to reduce
foaming of the OTC solution. Various NaCl
solutions were then mixed, depending on the
treatment requirements, with Hi-Grade evapo-
rated salt (Cargill, Minneapolis, MN). All solu-
tions were mixed using the Waterville Hatchery
supply water; which is ponded well-water that
was pumped to a head/settling tank then allowed
to gravity feed through the incubation batteries
and fry tank.
The fish were first collected from the fry
tank with a fine-mesh dip-net and allowed to
drain until the water ceased flowing from the net
in a constant stream. The fry in treatments that
used 4,000 or less fry were then volumetrically
enumerated by scooping 2.5, 9.9, or 19.7 ml fry
with a kitchen-style measuring spoon. Then
they were transferred to a larval concentrator
(Secor et al. 1991) that consisted of a 100 mm
diameter PVC tube with mesh-covered bottom
that had been placed in a bucket of NaCl solu-
tion. The fry remained in the NaCl solution un-
til the end of the prescribed immersion period;
after which the larval concentrator was removed
from the NaCl solution, the solution allowed to
drain away from the fry, and the fry then poured
into a container of OTC solution.
During treatments that used 65,000 fry,
the entire contents of the dip net remained in the
net and the bag of the net that contained the fry
was lowered into a shallow container of the
NaCl solution for the prescribed immersion pe-
riod. After the NaCl immersion, the fry were
allowed to drain again and then enumerated
gravimetrically by pouring them into a container
of OTC solution on an electronic balance. Both
fry and OTC solution were poured into a con-
tainer with additional OTC solution after weigh-
ing.
The containers used for the OTC im-
mersion portion of the treatments were those
commonly used by the MNDNR to transport
walleye fry. These containers consisted of col-
lapsible, 19-L clear plastic water jugs with the
caps modified by the addition of automotive tire-
valve stems to facilitate inflation with oxygen.
The fry were combined with 11.4 L of OTC so-
lution in the containers, then the containers were
partially collapsed to expel the ambient air,
capped, and inflated with oxygen. The fry re-
mained in the containers for the duration of the
immersion period and care was taken to reduce
fry exposure to sunlight and changes in tempera-
ture during the entire process. Upon completion
of the immersion process, the fry were either
separated from the solution with the larval con-
centrator and placed into 19 L aquaria, placed
into fine-mesh screen boxes floating in a 1700 L
raceway, or stocked into one of the 4 ha draina-
ble ponds at the Waterville State Fish Hatchery.
Upon the advice of Molly Negus (MNDNR, per-
sonal communication), the procedure was modi-
fied during 2008 and 2009 with the addition of a
5 s freshwater rinse between immersion in the
NaCl solution and immersion in the OTC solu-
tion.
Treatment episodes.—The OTC treat-
ments of newly hatched walleye fry were evalu-
ated with an integrated sampling design that uti-
lized samples of walleyes from seven different
treatment episodes across three years. The gen-
eral approach of the design was to first evaluate
the effects of various combinations of NaCl con-
centration, NaCl immersion duration, and OTC
immersion durations on small batches of fish
held under controlled hatchery conditions; then
to further evaluate, under production-level con-
ditions, the treatment combinations that pro-
duced clear marks with low attendant mortality.
Because of the small size of the fry at
the time of treatment and the stenohaline nature
of fresh-water obligate species such as walleye
(Smith 1982), I had concerns about their toler-
ance to the NaCl solution. Consequently, the
initial treatments were conducted at a much low-
er NaCl concentration than that reported to pro-
duce successful marks on anadromous species
such as european eels (Alcobendas et al. 1991),
atlantic salmon (Salmo salar; Mohler 2003)
Chinook salmon (Oncorhynchus tshawytscha) and
rainbow trout (O. mykiss; Negus and Tureson
2004).
Two OTC treatment episodes were con-
ducted during the first year of the study to eval-
uate mark efficacy and tolerance to immersion in
1% NaCl followed by 1 h immersion in 700 mg
OTC/L. The OTC immersion period was set at
1 h because it represented a reasonable time pe-
6
riod for fry to be in-transit during trips from the
hatchery to their final stocking destinations. The
first OTC treatment episode was conducted on
26 April 2006 with NaCl immersion periods of
0, 10, 20, and 30 seconds. Approximately 500
walleyes at a time were treated at each of the
NaCl immersion periods then subsequently im-
mersed in the OTC solution for 1 hour. Three
replicates were conducted at each NaCl immer-
sion period. Upon completion of the immersion
protocol, the treated fry from each of the repli-
cates were transferred to aquaria. The treatment
protocol from the first episode was repeated dur-
ing the second OTC treatment episode, on 9
May 2006, except that the walleye fry were im-
mersed in the NaCl solution for 0, 60, 120, and
180 seconds.
Oxytetracycline treatment episodes three
and four were conducted in the second year of
the study with a higher NaCl concentration and
OTC immersion duration than OTC treatment
episodes one and two. Approximately 500 fry
were first treated on 7 May 2007 by immersion
in 2.5% NaCl for 30 s followed by immersion in
700 mg/L OTC for 3 h. After the immersion
process, the fry were distributed among 5 aquar-
ia. Walleye fry subjected only to the OTC im-
mersion portion of the process were also distrib-
uted among 5 aquaria to provide controls for
evaluating the effects of NaCl immersion on
mortality. The OTC treatment was then repli-
cated twice with walleyes for stocking into rear-
ing ponds at the Waterville State Fish Hatchery.
Approximately 4,000 treated walleye fry were
stocked into Pond 5, whereas Pond 4 received
2,000 fry. Pond 4 also received 2,000 untreated
fry to serve as controls for growth and mortality
evaluation. The OTC treatment used on 7 May
2007 was then replicated on 14 May 2007 with
another 500 fry. Upon completion of the treat-
ment, the fry were placed into a fine-mesh float-
ing screen box.
The sixth OTC treatment episode repli-
cated the treatment protocol from 2007 except
for the addition of a freshwater rinse between
the NaCl immersion and the OTC immersion.
Approximately 65,000 fry were treated on 2
May 2008, by immersion in 2.5% NaCl for 30 s
followed by a 5 s freshwater rinse and immer-
sion in 700 mg/L OTC for 3 h; then stocked into
Pond 3.
Two years of successful fry marking
with low attendant mortality at 2.5% NaCl con-
centration prompted renewed optimism for
marking walleyes with a 1 h OTC immersion
period. Consequently, a series of trials was con-
ducted during 2009 to first observe the fry’s ini-
tial reactions to elevated NaCl exposure, then to
compare the mark efficacy at the elevated NaCl
exposure to the protocol that produced success-
ful marks during 2006 and 2007. The seventh
OTC treatment episode was conducted on 4 May
2009 with a 1 h OTC immersion period preced-
ed by immersion in NaCl concentrations of 2.5,
3.5 or 4.5 percent for 30, 45, 60, or 90 seconds
followed a freshwater rinse. Approximately 500
fry were treated at each combination of NaCl
concentration and immersion period. Based on
the condition of the fry observed after the 1 h
OTC immersion period, another OTC treatment
episode was conducted later that day with fry for
stocking into rearing ponds. Approximately
65,000 fry were first treated by immersion for 90
s in 4.5% NaCl followed by a freshwater rinse
and immersion for 1 hour in 700 mg/L OTC;
these fish were stocked into Pond 4. Pond 2,
conversely, received 65,000 fry treated with
2.5% NaCl for 30 s and a 3 h OTC immersion
period to serve as controls.
Treatment effects on survival and
growth.—My initial concerns about the effects
of the osmotic induction procedure on the sur-
vival of walleye fry was evaluated by comparing
the 24 h mortality levels of walleyes immersed
in NaCl for various durations during treatment
episodes one and two. Three replicate treat-
ments were conducted at each NaCl duration
level during the treatment episodes and the fry
from each of the replicates were randomly as-
signed to one of twelve aquaria. The aquaria
were placed in a raceway, and a constant tem-
perature was maintained by bathing the aquaria
in flowing water. Continuous aeration was also
provided by releasing compressed air through
stone diffusers in each of the aquaria. Visual
estimates of the number of dead fry were con-
ducted after 24 h by first counting 20 dead fry in
each of the aquaria and then estimating how
many multiples of 20 dead fry were present in
each aquarium. Percent mortality was then de-
termined by dividing the estimates of dead fry in
each of the aquaria by the volumetrically-
7
estimated total number of fry stocked into the
aquaria after treatment. Surviving fry were re-
tained in the aquaria for an additional 9 d to al-
low for fluorescent mark formation on the oto-
liths. Visual estimates of 24 h mortality were
also conducted for fry samples held in the hatch-
ery after treatment episodes three, and four. Dif-
ferences in mortality between walleyes treated at
different NaCl immersion durations were deter-
mined through chi-square analysis.
Further evaluation of the effect of the
entire treatment process on walleyes was evalu-
ated by comparing growth and survival between
the treated and untreated walleyes that were
stocked into Pond 4 during 2007. The fry
stocked into Pond 4 were measured volumetri-
cally to maximize parity in numbers between
treated and untreated fry. After 5 months, the
pond was harvested and 100 fingerlings were
collected. The total length of each walleye was
measured to the nearest millimeter, and the oto-
liths were examined for the presence of a mark.
Differences in mortality between the treated and
untreated walleyes were determined through chi-
square comparison of the ratio of marked finger-
lings in the sample to the ratio of treated fry at
stocking. Growth was analyzed by t-test com-
parison of the total length between the marked
and unmarked groups.
Treatment efficacy.—Inspection of wall-
eyes of various life stages for the presence of an
OTC mark was conducted following the meth-
ods of Secor et al. (1991) and Brooks et al.
(1994). The sagittal otoliths were first removed
from the specimens and wiped dry. The otoliths
were then prepared by securing them to a glass
microscope slide with cyanoacrylate cement and
polishing them with 600, 1,200, or 2,000 grit
sandpaper until the inner growth rings be-
came visible under 100 X magnification with
transmitted light. Inspection for a mark was
then conducted in a room with reduced lighting,
under an epifluorescent microscope with fluo-
rescent lighting and filter blocks designed to
optimize tetracycline fluorescence
(Bumguardner 1991; Brooks et al. 1994). The
specific system employed was a Nikon Eclipse
E-400 microscope with B-3A filter cube (505
nm dichroic mirror, 420-490 nm exciter filter,
and 520 nm barrier filter), 10 X and 20 X objec-
tives, and a 100 W mercury UV light source.
The intensity of the mark observed under 200 X
was categorized using a rating system similar to
that described by Weber and Ridgway (1967)
where: absent = no mark evident, faint = the
mark is present but not clearly visible, clear =
the mark is readily visible but not vivid, and in-
tense = the mark is both readily visible and viv-
id.
Oxytetracycline marks do not become
visible on the otoliths of newly hatched fry until
several days after treatment. Logsdon et al.
(2004) observed that faint fluorescent marks
were visible on 30% of their inspected sample 3
days post-treatment but that clear or intense
marks did not become visible on the entire sam-
ple until 9 days post-treatment. Consequently, I
evaluated initial mark formation on samples of
fry from treatment episodes 1, 2, 3, and 4 only
after they had been held in the hatchery for 10
days post-treatment. Further evaluation of mark
efficacy/retention was conducted by inspecting
samples of walleyes harvested from rearing
ponds between 53 and 145 days post-treatment.
Calcein
Treatment.—Walleye “frylings” (42-52
d post-hatch) were treated with calcein in ac-
cordance with Option B under the study protocol
for INAD 10-987 (USFWS 2003); where the
fish were first immersed in a NaCl solution then
immersed in a calcein solution. The treatments
began by mixing 4 L of 0.5% calcein solution in
a 19 L plastic bucket using SE-MARK (Western
Chemical, Ferndale, WA) concentrated calcein.
Four liters of either 2.5% or 5.0% NaCl solution
was mixed in another 19 L bucket using Hi-
Grade evaporated salt (Cargill, Minneapolis,
MN) and another 19 L bucket was filled with
approximately 4 L of fresh hatchery water. Ox-
ygen was then bubbled into the solutions
through circular diffuser hoses.
The frylings were treated in batches of
35 to 100 fish. Each batch was first netted from
a holding tank, allowed to drain until the water
ceased flowing from the net in a constant stream,
and then poured into a perforated 7.6 L plastic
bucket that had been lowered into the NaCl solu-
tion. The fish remained in the NaCl solution
until the end of the prescribed immersion period
and then the perforated bucket was removed
from the NaCl solution, the solution allowed to

8
drain away from the fish, then the bucket of fish
transferred to the calcein solution. After the pre-
scribed immersion period, the calcein was rinsed
off the fish either with freshwater from a low
pressure sprayer (Jerre Mohler, USFWS, per-
sonal communication) or by dipping again in a
bucket of freshwater. Upon completion of the
immersion process, the frylings were either
placed in 19 L aquaria or transferred to a 473 L
hauling tank and subsequently stocked into one
of the 4 ha drainable ponds at the Waterville
State Fish Hatchery. Upon the advice of Molly
Negus (MNDNR, personal communication), the
procedure was modified during 2008 and 2009
with the addition of a 5 s immersion in freshwa-
ter between the NaCl immersion and the calcein
immersion.
Treatment episodes.—The sampling de-
sign for evaluating calcein treatments on frylings
utilized samples of walleyes from five treatment
episodes across three years. The approach mir-
rored that for the OTC evaluation in that the ini-
tial treatments were conducted with small batch-
es of fish under controlled hatchery conditions,
then expanded to be more representative of pro-
duction-level conditions.
Two calcein treatment episodes were
conducted during the first year of the study to
evaluate mark efficacy and tolerance to immer-
sion in 0.5% calcein for 4 min preceded by im-
mersion in 2.5% NaCl. The first calcein treat-
ment episode was conducted on 8 June 2006
with NaCl immersion periods of 0, 2, 3, and 4
minutes. Single scoops of between 37 and 87
frylings were treated at a time and three replicate
treatments were conducted at each NaCl immer-
sion period. Upon completion of the immersion
protocol, the treated frylings from each of the
replicates were rinsed with freshwater from a
low pressure sprayer then transferred to aquaria.
The 4 min NaCl immersion protocol from the
first episode was replicated with approximately
3,600 frylings on 13 June 2006 and those fish
stocked into Pond 3.
A single calcein treatment episode was
conducted during 2007. On 7 June 2007, ap-
proximately 3,500 frylings were treated by im-
mersion for 4 min in 2.5% calcein followed by a
4 min immersion in 0.5% calcein. This was a
replicate of treatment episode two except that
the final freshwater rinse was conducted by dip-
ping the fish in a bucket of freshwater instead of
spraying them with a low pressure sprayer. Fish
treated during calcein treatment episode three
were stocked into Pond 9.
The remainder of the calcein treatments
were conducted with both a higher NaCl concen-
tration than the previous treatment episodes and
a 5 s freshwater rinse between the NaCl immer-
sion and the OTC immersion. Approximately
3,500 frylings were treated on 20 June 2008 (ep-
isode four) by immersion in 5.0% NaCl fol-
lowed by a freshwater rinse and immersion in
0.5% calcein for 4 min. Upon completion of the
calcein immersion, the frylings were rinsed with
a 5 s dip in freshwater then transported to Pond
10 for stocking. Due to high mortality observed
prior to stocking and the inability to later sample
fish from Pond 10, another 1,444 frylings were
treated on 11 July 2008 and stocked into Pond
10. This treatment episode (five) followed the
same protocol as calcein treatment episode four
except that the frylings were allowed to recover
for 1 h in a hauling tank with oxygen saturated
water prior to transportation and stocking into
Pond 10. The protocol from calcein treatment
episode five was replicated with 7,550 frylings
on 26 June 2009 and the fish stocked into Pond
2.
Treatment effects on survival.—The ef-
fects of the osmotic induction procedure on
acute mortality of walleye frylings was formally
evaluated during the first year of the study.
Three replicate treatments were conducted at
each NaCl duration level during treatment epi-
sode one and the frylings from each of the repli-
cates were randomly assigned to one of twelve
aquaria outfitted with perforated covers and con-
tinuous flow-through hatchery water. The num-
ber of dead walleyes were enumerated after 24
hours and the fish were retained in the aquaria
for another 6 days to allow for fluorescent mark
formation on the otoliths. Differences in mortal-
ity between walleyes treated at different NaCl
immersion durations were determined through
chi-square analysis.
Treatment efficacy and mark reten-
tion.—All walleyes inspected for the presence of
calcein marks were inspected following the
study protocol for INAD 10-987 (USFWS 2003)
using a SE-MARK handheld calcein detector
(Western Chemical, Ferndale, WA). The wall-

9
eyes inspected immediately after treatment were
inspected live, whereas those inspected later
were sacrificed prior to inspection. Inspection
was conducted in a dark, windowless room with
only enough ambient light to locate equipment
and fish in pails. Each fish was inspected at a
distance of 1–2 inches and the intensity of the of
the marks on the pectoral fin rays, pelvic fin
rays, operculum, ventral surface of the jaw, and
scales along the lateral surface for each fish
were either rated using the same category system
used for OTC marks (Weber and Ridgway 1967)
or quantified by comparing them to calcein
marks on a standardized colorimetric key
(Honeyfield et al. 2008). A fresh colorimetric
key, when used, was prepared within 6 h prior to
examination of each sample of fish by serially
diluting the stock calcein solution with distilled
water and brushing a single stripe of each con-
centration onto a sheet of printer paper (sheets
from same package used for all keys). The cal-
cein concentration of the stock 10,000 mg calce-
in/L SE-MARK solution was first decreased to
1,000 mg calcein/L and then to 500 mg/L. After
which, concentrations were reduced by 100 mg/l
for each decremental concentration between 500
and 100 mg/L, by 5 mg/L for each concentration
between 100 and 20 mg/L, and by 1 mg/L for
each concentration between 20 mg/L and 1
mg/L. The key was then allowed to air dry in
the dark and then laminated with clear plastic to
keep it dry during use. Sagittal otoliths and
scale samples from the ventral surface between
the pelvic fins were also collected from a sub-
sample of externally inspected walleyes and
viewed under the same epi-fluorescent micro-
scope used to inspect for OTC marks. The oto-
liths were processed using the same procedure as
those inspected for OTC marks, whereas the
scales were viewed under the fluorescent light-
ing without further preparation.
During the first year of the study,
frylings were only inspected for calcein marks
after being later re-sampled. A sample of fish
treated during episode one was inspected after
being held in an aquarium for 7 d and a sample
of fish treated during episode two was inspected
upon harvest of Pond 3 at 117 d post-treatment.
Samples of fish from all subsequent treatments
were inspected both immediately after treatment
and when later harvested from the ponds.
The inability to detect external marks on
walleyes harvested from the ponds during 2006
and 2007 raised doubt about the persistence of
calcein marks. Consequently, the sampling re-
gime and mark rating system were modified dur-
ing 2008 to assess the rate and extent of mark
degradation. Samples of walleyes from treat-
ment episode five were collected weekly from
Pond 10 and the intensity of the marks on the
pectoral fin rays, pelvic fin rays, operculum,
ventral surface of the jaw, and scales along the
lateral surface of each fish was quantified by
comparing the intensity of the observed marks to
a colorimetric key. A sample of 100 walleyes
was collected when the pond was harvested at
15 weeks post-treatment. Ten walleyes were
inspected immediately with the SE-MARK de-
tector, whereas the remaining walleyes were
frozen for later inspection of the otoliths under
an epi-fluorescent microscope. In addition to 5
body structures that were quantitatively exam-
ined during the previous inspections; a qualita-
tive examination of all the external surfaces of
the fish as well as the inside of the mouth and
gills, was also conducted with the SE-MARK
detector to identify the body structures with the
most persistent marks.
Samples of at least 100 scales were also
collected from the ventral surfaces of each of the
10 walleyes that were immediately inspected
after harvest of Pond 10 and the scales stored in
various media to evaluate the potential for de-
layed inspection of the mark using epi-
fluorescent microscopy. Five different media
were used to store the scales: 1) mineral oil, 2)
glycerin, 3) 70% isopropyl alcohol, 4) distilled
water, and 5) dry in paper coin envelopes. Sam-
ples of scales from each of the media were
stored either in a freezer or in a closet protected
from exposure to the light. Ten scales from each
of the fish were stored in each of the resulting 10
storage combinations for 2 weeks and then in-
spected with the same epi-fluorescent micro-
scope used to inspect for OTC marks. The in-
tensity of the marks on the scales was qualita-
tively rated using the same category system used
for OTC marks (Weber and Ridgway 1967).
Differences in mark intensity between frozen
and non-frozen scales were evaluated with the
Mann-Whitney rank sum test, whereas differ-
ences in mark quality among scales stored in

10
different media within the frozen and non-frozen
groups was evaluated with Kruskal-Wallis rank
sum test followed by post hoc pairwise compari-
sons using the Tukey test. Otoliths were also
inspected from a sample of 20 walleyes collect-
ed from Pond 10 using the above microscope
and rating system.
Results
Oxytetracycline
Treatment effects on survival and
growth.—The walleye fry appeared stressed (le-
thargic, pale and congregating near the surface)
when immersed in the NaCl solution but became
motile, well pigmented, and well distributed in
the transport jugs following immersion in the
OTC solution. Less than 1% mortality was ob-
served immediately following treatment. Mor-
tality after 24 h, however, ranged from 0% to
50% among individual aquaria. The highest
mortality occurred following the first treatment
episode; during which I had the least experience
with the marking process and kept the fry out of
the water the longest during transfer between the
tanks, the NaCl bath, and the transport jugs.
Treatment episode one compared 1 h im-
mersion in OTC preceded by immersion in 1%
NaCl for 0, 10, 20, or 30 s. The resulting mean
24 h mortality ranged from 8.3% for those im-
mersed for 10 s to 23.3% for those immersed for
30 s (Table 1). Chi-square testing indicated sig-
nificant differences in mean mortality among the
immersion periods (P<0.001). Mortality did not
appear to be dependent upon NaCl immersion
duration, however, since fry not subjected to the
NaCl pre-treatment actually suffered higher
mean mortality than all but the 30 s immersion
group. In contrast, mortality during the 24 h
following treatment episode two ranged from
only 0% to 5% among aquaria; with those not
pre-treated in NaCl suffering the lowest mortali-
ty (Table 1). Chi-square test results indicated
significant differences in mortality among im-
mersion periods (P=0.016)
Mortality evaluations during 2007, how-
ever, failed to identify significantly higher
(α=0.05) mortality of walleyes pre-treated in the
NaCl solution even though the NaCl concentra-
tion was raised to 2.5%. Pre-treated fry from
treatment episode three averaged 3.8% mortality
after 24 h but those subjected to only OTC im-
mersion averaged 4.8% mortality (Table 2).
Similar results were observed for fry treated dur-
ing treatment episode four. Fry held in floating
baskets after treatment episode four suffered
4.6% mortality during the first 24 h whereas
those subjected to only the OTC immersion suf-
fered 5.0% mortality (Table 2). Treated wall-
eyes were also recovered from Pond 3 in the
same proportion (50:50) that they were stocked
145 d prior (2=0.0200, P=0.888); indicating
similar survival between those subjected to the
osmotic induction/OTC immersion process and
those not treated at all. Further mortality testing
was truncated due to space limitations in the
hatchery but no mortalities were observed within
1 h after any of the various combinations of
NaCl concentration and immersion periods dur-
ing treatment episode 6. Less than 1% mortality
was observed during treatment episode 7.
Table 1. Comparison (Pearson chi-square) of walleye mortality 24 hours after being treated as newly hatched fry by
immersion for various durations in 1% NaCl solution followed immediately by 1 hour immersion in 700 mg/L OTC solution. Approximately 1500 fry were treated at each NaCl immersion duration.
OTC
treatment
episode Mortality (%) by NaCl immersion duration χ2 P
0 seconds 10 seconds 20 seconds 30 seconds
1 16.7 8.3 11.7 23.3 50.29 <0.001
0 seconds 60 seconds 120 seconds 360 seconds
2 1.3 5.0 4.0 4.0 10.26 0.016
11
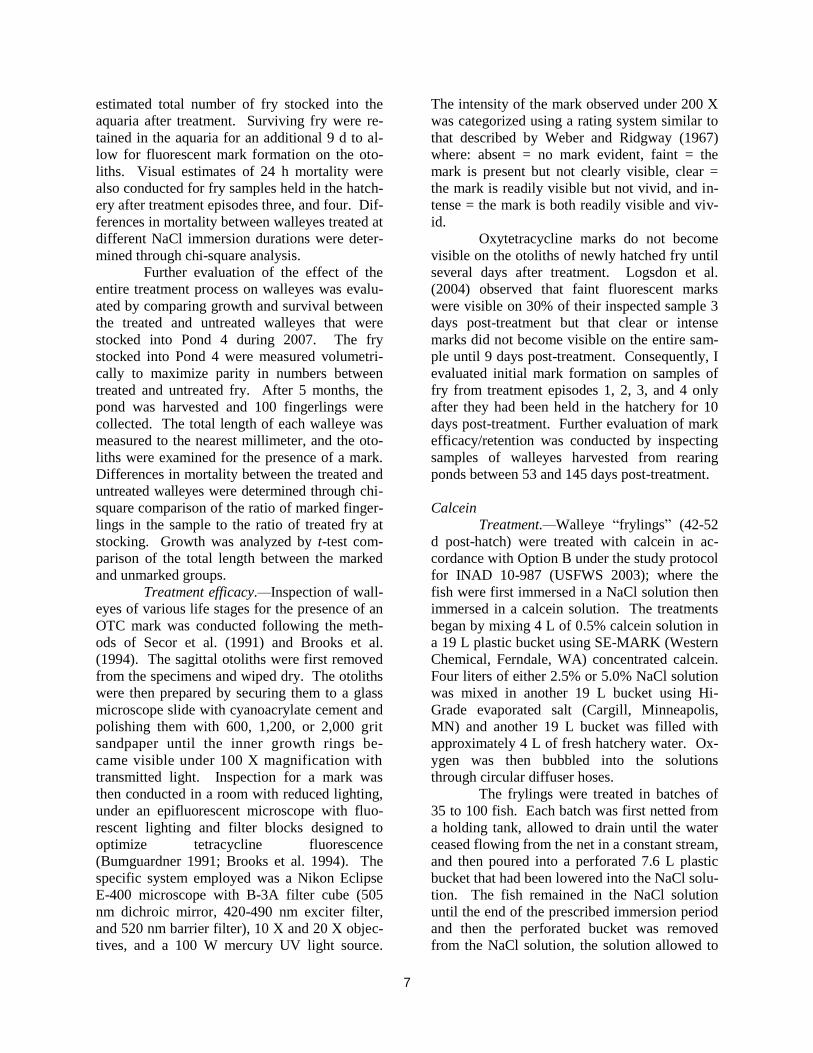
Table 2. Comparison (Pearson chi-square) of mean total mortality of walleyes 24 hours after being treated as newly hatched fry by immersion for 0, or 30 seconds in 2.5% NaCl solution followed immediately by 1 hour im-mersion in 700 mg/L OTC solution. Approximately 1500 fry were treated at each NaCl immersion duration.
OTC
treatment Mortality (%) by NaCl immersion duration
episode 0 seconds 30 seconds χ2 P
3 4.8 3.8 0.389 0.533
4 5.0 4.6 0.022 0.882
No apparent effect of the osmotic induc-
tion/OTC immersion process on the growth of
walleyes was observed during this study. Mean
total length of the treated walleyes harvested
from Pond 3 in 2007 was 138.1, whereas the
mean length of the untreated controls was 140.1
(t=0.318, P=0.751).
Treatment efficacy and mark reten-
tion.—One hour immersion in 700 mg OTC/L
preceded by immersion in 1% NaCl failed to
produce suitable marks on the walleye fry treat-
ed in 2006. Although many of the inspected fish
possessed discernible marks on their otoliths, all
the samples included many marks that were faint
and difficult to detect. All the samples except
for those immersed in NaCl for 20 s also includ-
ed fish without marks (Table 3).
Increasing the OTC immersion period to
3 h and the NaCl concentration to 2.5% (30 s
NaCl immersion duration) in 2007 succeeded in
increasing the quality of marks produced
through osmotic induction. All of the walleyes
inspected 10 days following OTC treatment epi-
sodes three and four possessed intense fluores-
cent marks, whereas 98% of the sample of wall-
eyes from treatment episode three also possessed
either clear or intense marks when inspected 135
d later. Replication of the 2007 treatment regi-
men in 2008, albeit with the addition of a fresh-
water rinse between the NaCl and OTC immer-
sions, also produced easily detectable marks on
all the walleyes inspected 53 d post-treatment.
Increasing the NaCl concentration to
4.5% in 2009, however, failed to produce suitable
marks on walleyes when followed up with only a
1 h immersion in the OTC solution. Of the 50
walleyes inspected 45 d post-treatment, 86% of
the marks were either absent or difficult to de-
tect. Surprisingly, replication of the treatment
regime successfully used in 2007 and 2008 also
failed to produce suitable marks on the walleyes
in 2009. As many as seventy-six percent of the
marks were either absent or difficult to detect.
Calcein
Treatment effects on survival.—The
frylings first swam erratically, then lost equilib-
rium and floated to the surface when first im-
mersed in the NaCl solution. During the first
calcein treatment episode, all of the treated wall-
eyes retained vigor after being transferred to the
aquaria. Only two walleyes died within the first
24 hours, and one of those was a fish from the
control group that was not immersed in the NaCl
solution (Table 4). Chi-square testing failed to
indicate a significant difference in mortality
among the NaCl immersion durations
(P=0.596).
All subsequent treatments were con-
ducted under more production-level conditions;
with many more fish treated, more sequential
dips in the same solutions, and more crowded
conditions preceding and immediately following
treatments. The appearance of fish after transfer
to freshwater differed among treatments but, in
all cases, the subsequent abundance of walleyes
harvested from ponds stocked with calcein-
treated frylings was lower than expected by the
hatchery manager (Bruce Pittman, MNDNR,
personal communication). All the walleyes
treated during episode three retained vigor after
transfer to freshwater but many of the walleyes
treated during episodes two, four, five, and six
remained pale and lethargic. Only seven wall-
eyes treated during episode two were recovered
during harvest of Pond 3, no feeding activity
was observed or walleyes sampled from Pond 10
following treatment episode four, and no wall-
eyes treated during episode six were recovered
during harvest of Pond 2.

12
Table 3. Quality of fluorescent marks observed on the otoliths of walleyes treated as newly hatched fry at various combinations of NaC l concentration, NaCl immersion duration and OTC immersion durations. The numbers represent the percentages of walleyes that were assigned to each mark quality cate-gory based on the visibility of the mark under 200X magnification.
Treatment Inspection
OTC NaCl NaCl OTC
treatment concentration immersion immersion Mark quality
episode (%) duration (s) duration (h) n Age (d) Absent Faint Clear Intense
2006
1 1.0 0 1 20 10 10 55 20 5
1 1.0 10 1 20 10 30 60 10 0
1 1.0 20 1 20 10 0 45 40 15
1 1.0 30 1 20 10 20 60 15 5
2 1.0 0 1 20 10 15 65 10 10
2 1.0 60 1 20 10 20 75 5 0
2 1.0 120 1 20 10 50 45 5 0
2 1.0 180 1 20 10 30 60 10 0
2007
3 2.5 30 3 12 10 0 0 0 100
3 2.5 30 3 100 145 0 2 52 46
4 2.5 30 3 10 10 0 0 0 100
2008
5 2.5 30 3 100 53 0 0 48 52
2009
7 2.5 30 3 50 43 6 70 20 4
7 4.5 90 1 50 45 14 72 12 2

13
Table 4. Comparison (Pearson chi-square) of walleye mortality 24 hours after being treated as 42-day post-hatch
frylings by immersion for various durations in 2.5% NaCl solution followed immediately by 4 minute immer-sion in 0.5% calcein solution. One hundred sixty five walleyes were treated at each NaCl immersion dura-tion.
OTC
treatment Mortality (%) by NaCl immersion duration
episode 0 minutes 2 minutes 3 minutes 4 minutes χ2 P
1 0.68 0.0 0.0 0.38 1.889 0.596
Treatment efficacy and mark reten-
tion.—All of the calcein treatments successfully
produced fluorescent marks on the treated
frylings. The entire bodies of treated frylings
possessed a distinctive green glow that was visi-
ble to the unaided eye immediately following
treatment and all of the frylings inspected with
the SE-MARK detector within a week of treat-
ment possessed either clear or intense fluores-
cent green marks on the outer surfaces of their
pectoral fin rays, pelvic fin rays, operculum,
jaw, and scales along their lateral surfaces.
The frylings treated by pre-immersion in
2.5% NaCl for 4 min, however, failed to exhibit
visible marks on their external surfaces when
inspected again at 117 or 119 days post treat-
ment. This apparent lack of mark retention
prompted the increase in NaCl concentration to
5% in 2008 in hopes of producing longer lasting
marks. Weekly comparison of mark intensity to
the colorimetric key was also conducted during
2008 to document the rate and extent of mark
degradation.
Frylings treated during 2008 exhibited
distinct differences in initial mark intensity
among the structures examined. Mean mark
intensity on the pelvic fin rays, jaw, and opercu-
lum ranged from 620 to 730 ppm calcein (rela-
tive to the colorimetric key), whereas the mean
mark intensity of the pectoral fin rays, head, and
lateral scales ranged between 140 and 220 ppm
calcein (Figure 2). Mark intensities decreased
by at least 50% during the first week and contin-
ued decreasing exponentially through Week 15.
The dichotomous grouping of the mark intensi-
ties among structures continued to some extent
throughout the study. By week 12, many of the
inspected walleye failed to possess discernible
marks on pectoral fin rays or head, but at least
faint marks were visible on the pelvic fin rays,
operculum, jaw, and lateral scales throughout
the 15 weeks of the project. Whole body inspec-
tions conducted at Week 15 also documented
that marks persisted on the upper roof of the
mouth, the gill arches, and the scales between
the pelvic insertions (Figure 3).
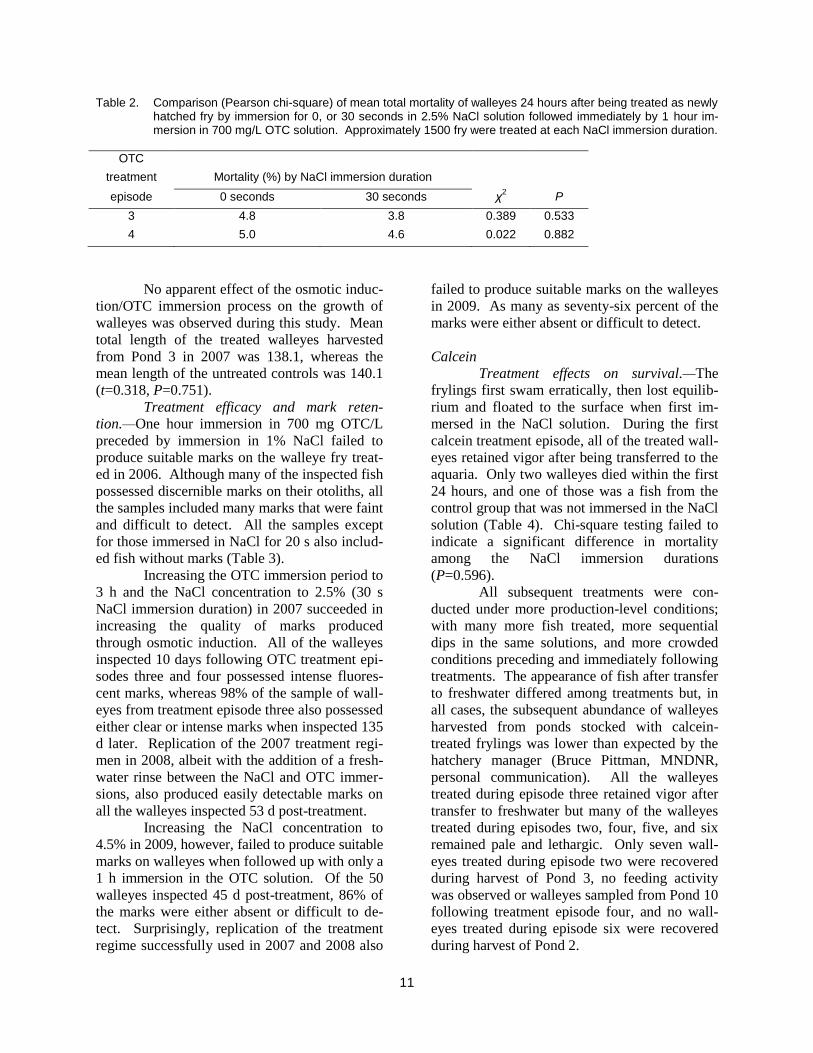
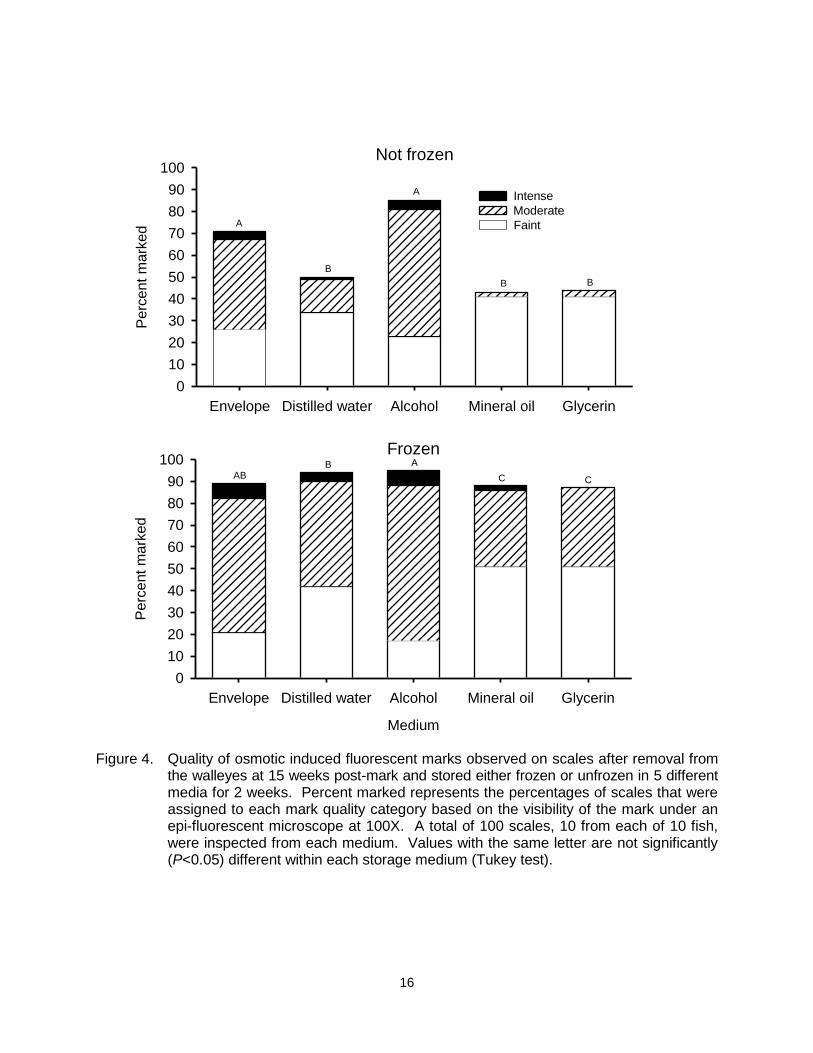
All of the walleyes whose scales were
sampled at Week 15 had visible marks on at
least some of the scales from each of the storage
media, but not all scales examined for each me-
dia had discernible marks (Figure 4). A higher
percentage of the scales stored in frozen media
possessed visible marks than those that were
kept at room temperature. In addition, Mann-
Whitney testing indicated that the marks of the
frozen scales were generally brighter than their
non-frozen counterparts (T=199956.5, P<0.001).
Kruskal-Wallace tests indicated significant dif-
ferences in mark quality among storage media
for both the frozen scales (H= 51.9, P <0.001)
and the non-frozen scales (H=122.5, P<0.001).
Scales stored in alcohol possessed the highest
percentage of marks, whether frozen or not, but
post hoc Tukey tests failed to detect a significant
difference (P<0.05) between the quality of
marks on scales stored in alcohol and those
simply stored dry in a coin envelopes (Figure 4).
All of the otoliths from walleyes treated
during 2008 also showed discernible marks
when viewed under the epi-fluorescent micro-
scope. The calcein marks on the otoliths dif-
fered in shape from that of the OTC marks on
otoliths in that the entire center section of the
otolith fluoresced; whereas the OTC marks ap-
peared as a fluorescent band associated with the
daily growth ring that was being formed at the
time of treatment (Figure 5). Many of the

14
Figure 2. Mean (SD) mark intensity (y) across time (χ) of various anatomical structures of
walleyes treated by immersion in 2.5% NaCl solution followed by a 5 second fresh-water rinse and immersion in 2.5% calcein solution for 4 minutes (osmotic induction) then held in Pond 10. Trend lines represent the exponential regression equations best fitting the mean observed mark intensities of each structure: pectoral fin ray (y=139.75e(-2.21x), r2=0.95), pelvic fin ray (y=687.53e(-0.46x), r2=0.97), operculum (y=601.55e(-0.96x), r2=0.92), jaw (y=643.47e(-1.11x), r2=0.85), scale (y = 149.53e(-1.82x), r2=0.96), and head (y=218.35e(-1.53x), r2=0.94).
Weeks post treatment
0 1 2 3 4 5 6 7 8 9 10 11 12 13 14 15
Mark
inte
nsity (
ppm
calc
ein
)
0
100
200
300
400
500
600
700
800
900
1000
1100
Pectoral fin ray
Pelvic fin ray
Operculum
Jaw
Scale
Head

15
Figure 3. Calcein marks on walleyes 4 months after treatment by immersion for 4 minutes in a
5% saline bath followed by immersion for 4 minutes in a 0.5% calcein bath. Photo-graph (a) shows the ventral surface of the jaw, (b) a lateral view of the gill area with operculum lifted up, (c) the pelvic area of the ventral surface, and (d) 100X magnifi-cation of a scale from the pelvic area of the ventral surface.
a)
a)
a)
a)
b)
a)
c)
a)
d)
a)
16
Figure 4. Quality of osmotic induced fluorescent marks observed on scales after removal from the walleyes at 15 weeks post-mark and stored either frozen or unfrozen in 5 different media for 2 weeks. Percent marked represents the percentages of scales that were assigned to each mark quality category based on the visibility of the mark under an epi-fluorescent microscope at 100X. A total of 100 scales, 10 from each of 10 fish, were inspected from each medium. Values with the same letter are not significantly (P<0.05) different within each storage medium (Tukey test).
Frozen
Medium
Envelope Distilled water Alcohol Mineral oil Glycerin
Pe
rce
nt
ma
rke
d
0
10
20
30
40
50
60
70
80
90
100
A
B
A
B B
ABB A
C C
Not frozen
Envelope Distilled water Alcohol Mineral oil Glycerin
Pe
rce
nt
ma
rke
d
0
10
20
30
40
50
60
70
80
90
100
Faint
Moderate
Intense
A
B
A
B B

17
Figure 5. Fluorescent marks on the otoliths of walleye fingerlings after harvest from rearing ponds in the October, 2008. Photograph (a) shows the yellow-gold ring of a walleye marked as a newly hatched fry with OTC, whereas (b) is an off-centered photograph showing apple-green stained center of an otolith of a walleye treated with calcein as a fryling. Both photographs were taken at 200 X through an epifluorescent micro-scope.
calcein marks were visible under 100 X magni-
fication without any type of processing of the
otoliths. Removing some of the overlying mate-
rial through polishing with fine sandpaper, how-
ever, enhanced the visibility of the mark and
often revealed a brighter ring on the edge of the
mark. The enhanced marks of the polished oto-
liths had similar appearance under the micro-
scope as those on the scales except that the edg-
es of the marks on the scales were much bright-
er.
Discussion
This study demonstrated that immersion
of walleyes in a concentrated NaCl solution fol-
lowed by immersion in either OTC or calcein
can produce fluorescent marks at shorter immer-
sion periods than those typically used to mark
fish by immersion in OTC or calcein alone.
However, this study also demonstrated that the
tolerance of the walleyes to the treatment pro-
cess, the intensity of the marks, and the retention
of the marks can be inconsistent.
The utility of a marking method can be
negated if the marking process adversely affects
the survival or growth of the fish being marked.
Researchers have generally reported little mor-
tality associated with immersion marking of
walleye fry in OTC solutions (Younk and Cook
1991; Peterson and Carline 1996), but the effects
of OTC immersion preceded by immersion in a
concentrated NaCl solution has not been evalu-
ated. Walleye fry treated during the current
study obviously became stressed when im-
mersed in the NaCl solution but appeared to re-
cover almost immediately upon transfer to the
OTC solution. The high mortality that followed
the first treatment episode was likely exacerbat-
ed by stress caused by the additional handling
that accompanied my learning how to efficiently
conduct the osmotic induction process. Mortali-
ty varied among treatments, but not consistently
with NaCl immersion durations. Subsequent
treatment episodes also failed to result in higher
mortality of the NaCl immersed walleyes even
thought they were conducted at a higher NaCl
concentration. The return of marked walleyes
from Pond 3 in the same ratio that they were
stocked and the similarity in total length be-
tween the two groups also indicates that the
walleye fry tolerate the osmotic/OTC marking
procedure conducted under production level
conditions at the Waterville State Fish Hatchery.
a)a)
b)a)

18
The ability of the osmotic/OTC proce-
dure to consistently produce detectable marks on
walleye fry, however, is much less conclusive.
The groups of fry treated with 1 h immersion in
OTC, whether they were pre-treated in 1% NaCl
or 4.5% NaCl, both had high percentages of in-
dividuals with absent or very faint marks. It is
not uncommon to have variability in the quality
of marks produced by treating walleye fry by
immersion in OTC (Brooks et al. 1994; Lucchesi
2002; Logsdon et al. 2004), but the difficulty I
experienced detecting marks on such a high per-
centage of the walleyes would render this tech-
nique useless in stocking evaluations because
poorly marked fish could be mistaken for natu-
rally reproduced fish.
Increasing the concentrations of NaCl to
2.5% and the OTC immersion period to 3 h in-
creased the quality of the resultant marks. I only
had difficulty detecting the marks on two of the
212 walleyes inspected from three treatment epi-
sodes across 2 years. Given the exacting nature
of the sanding necessary to expose the mark
(Logsdon et al. 2004) it is possible that the two
difficulties I had observing marks was simply
due to irregularities in the preparation of the oto-
liths.
Pre-immersing the fry in 2.5% for 30 s
seemed to be a valid method for reducing the
OTC immersion period by half of the 6 h com-
monly used (Brooks et al. 1994; Fielder 2002;
Lucchesi 2002; Logsdon et al. 2004) for mark-
ing walleye fry. Perplexingly, replication of the
procedure (30 s immersion in 2.5% NaCl fol-
lowed by 3 h immersion in 700 mg OTC/L) dur-
ing 2009 left over 75% of the treated walleyes
with absent or difficult to detect marks. It is
unclear why the treatment failed during 2009 but
the appearance (Figure 6) and behavior of the
Terramycin 343 that was used as the source of
OTC in 2009 differed from that in the past. The
powder was coarser and darker in color than the
older Terramycin 343. It immediately sank in-
stead of floated and required more sodium phos-
phate dibasic to raise the pH to 6.8 than previ-
ously used. An unusual amount of powdery pre-
cipitate was also observed in the bottom of the
fry jugs after the end of the immersion period.
It's appearance and reaction in the water was
more similar to Oxymarine (Alpharma, Bridge-
water, New Jersey); a formulation of OTC pow-
der that produced poor mark efficacy when pre-
viously used to treat walleye fry by immersion
in 700 mg OTC/L for 6 h (unpublished data).
Unbeknownst at the time, Pfizer had ceased
manufacture of Terramycin 343 and the batch
that I used in 2009 was from the last lot that they
produced. Whether the observed differences in
appearance and behavior are indicative of a dif-
ference in the chemical makeup of the formula-
tion and whether these possible changes could
affect the efficacy of the treatment can only be
speculated; but further evaluation of reduced
OTC immersion periods using the osmotic in-
duction procedure should be conducted with the
newly FDA approved formulation marketed by
PennField Animal Health (Omaha, Nebraska)
under the Pennox 343 brand.
The SE-MARK calcein solution, con-
versely, appeared and reacted consistently across
all the treatment episodes. The calcein treat-
ments consistently produced easily-visible
marks on many of the external tissues of the fish
and the intensity of the marks on the otoliths
appeared to increase when the NaCl concentra-
tion was increased from 2.5% to 5%. The toler-
ance of the frylings to the treatment process and
the retention of the marks once produced were
the issues of most concern regarding the osmot-
ic/calcein treatment experiments. Similar to the
osmotic/OTC treatments, the walleyes became
obviously stressed when first immersed in the
NaCl solution. Unlike the OTC treated fish,
which recovered when transferred to the OTC
solution, the calcein treated fish did not appear
to recover until after they had completed the cal-
cein immersion portion of the treatment and
were transferred to freshwater. Similar observa-
tions were reported by Negus and Tureson
(2004). They described the chinook salmon as
simply appearing agitated during the immersion
in salt and calcein but noted that some of the
rainbow trout, similar to the walleyes treated
during the current study, lost equilibrium during
immersion in salt and calcein.
Overall, osmotic/calcein treatments have
been reported to have no long lasting effects on
the treated fish. Mohler (2003), Negus and
Tureson (2004), and Hill and Quesada (2010)
all reported no additional mortality or reduction
in growth of salmonid fry treated by osmotic
induction. Mohler (2003), and Negus and

19
Figure 6. Photograph showing the appearance of the Terramycin 343 used as a source of OTC during 2009 ("New" Terramycin 343) compared to the appearance of the Terramycin 343 used previously ("Old" Terramycin 343) and OxyMarine.
Tureson (2004) also treated fish that were closer
in size to the frylings treated during the current
study without indication of any increased mor-
tality associated with the treatment. They treat-
ed relatively few fish, however, and did so under
controlled conditions, thus their conditions were
similar to those of mortality tests I conducted
following treatment episode one.
Increasing the number of treated frylings
to a level that would be useful for management
purposes resulted in more crowded conditions
preceding and immediately following treat-
ments, more sequential dips in the same solu-
tions, more time out of the water during the pro-
cess, and higher apparent mortality. The most
problematic part of the treatment process was
rinsing the calcein from the fish after treatment.
The restrictions of INAD Number 10-987 pre-
vented the discharge of any of the calcein solu-
tion into the environment. This meant that any
unused calcein leftover from the treatment and
any of the rinse-water contaminated with calcein
be collected in leak proof containers and subse-
quently shipped to Tacoma, Washington for
proper disposal (USFWS 2003). This require-
ment was simple to comply with when treating
the few fish during episode one but treatment of
the larger numbers of frylings in subsequent epi-
sodes had the potential to quickly generate more
contaminated rinse-water than was practical to
collect and ship. To reduce the amount of con-
taminated rinse-water produced, a low pressure
sprayer was used to spray freshwater across the
treated frylings until all the visible solution was
removed from the fish (Jerry Mohler, USFWS,
personal communication). The oily consistency
of the solution, however, made the calcein ad-
here to the fish and slowed down the rate at
which it drained from both the fish and the per-
forated buckets. This substantially increased the
amount of time that the fish were out of the wa-
ter. Abandoning the low pressure sprayer in
favor of sequential dips in buckets of freshwater
improved the process but still resulted in the fish
being handled more, and out of the water for
longer time periods, than I would have preferred.
The unhealthy appearance and apparent-
ly high mortality of many of the walleyes fol-
lowing treatment was likely exacerbated by ele-
vated water temperatures. Brooks et al. (1994)
reported higher mortality of walleye fry im-
mersed in calcein than those immersed in either
OTC or calcein blue when treated at 10oC and
elevated mortality of all groups when treated
20
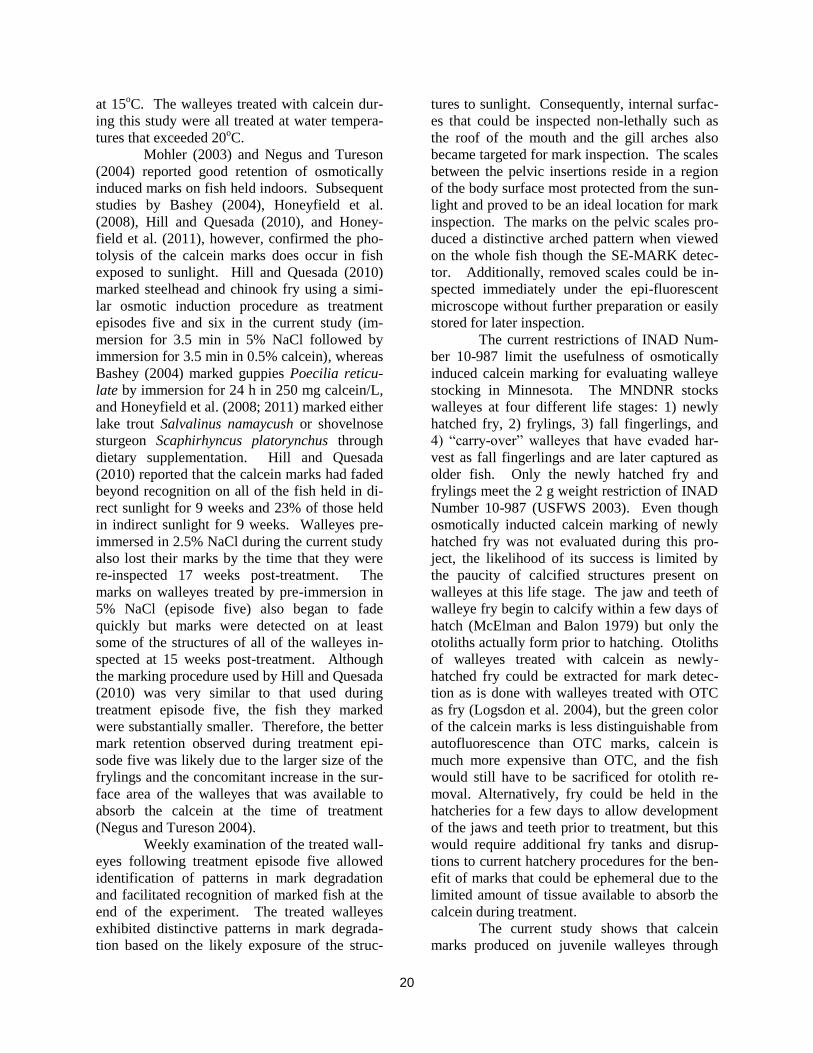
at 15oC. The walleyes treated with calcein dur-
ing this study were all treated at water tempera-
tures that exceeded 20oC.
Mohler (2003) and Negus and Tureson
(2004) reported good retention of osmotically
induced marks on fish held indoors. Subsequent
studies by Bashey (2004), Honeyfield et al.
(2008), Hill and Quesada (2010), and Honey-
field et al. (2011), however, confirmed the pho-
tolysis of the calcein marks does occur in fish
exposed to sunlight. Hill and Quesada (2010)
marked steelhead and chinook fry using a simi-
lar osmotic induction procedure as treatment
episodes five and six in the current study (im-
mersion for 3.5 min in 5% NaCl followed by
immersion for 3.5 min in 0.5% calcein), whereas
Bashey (2004) marked guppies Poecilia reticu-
late by immersion for 24 h in 250 mg calcein/L,
and Honeyfield et al. (2008; 2011) marked either
lake trout Salvalinus namaycush or shovelnose
sturgeon Scaphirhyncus platorynchus through
dietary supplementation. Hill and Quesada
(2010) reported that the calcein marks had faded
beyond recognition on all of the fish held in di-
rect sunlight for 9 weeks and 23% of those held
in indirect sunlight for 9 weeks. Walleyes pre-
immersed in 2.5% NaCl during the current study
also lost their marks by the time that they were
re-inspected 17 weeks post-treatment. The
marks on walleyes treated by pre-immersion in
5% NaCl (episode five) also began to fade
quickly but marks were detected on at least
some of the structures of all of the walleyes in-
spected at 15 weeks post-treatment. Although
the marking procedure used by Hill and Quesada
(2010) was very similar to that used during
treatment episode five, the fish they marked
were substantially smaller. Therefore, the better
mark retention observed during treatment epi-
sode five was likely due to the larger size of the
frylings and the concomitant increase in the sur-
face area of the walleyes that was available to
absorb the calcein at the time of treatment
(Negus and Tureson 2004).
Weekly examination of the treated wall-
eyes following treatment episode five allowed
identification of patterns in mark degradation
and facilitated recognition of marked fish at the
end of the experiment. The treated walleyes
exhibited distinctive patterns in mark degrada-
tion based on the likely exposure of the struc-
tures to sunlight. Consequently, internal surfac-
es that could be inspected non-lethally such as
the roof of the mouth and the gill arches also
became targeted for mark inspection. The scales
between the pelvic insertions reside in a region
of the body surface most protected from the sun-
light and proved to be an ideal location for mark
inspection. The marks on the pelvic scales pro-
duced a distinctive arched pattern when viewed
on the whole fish though the SE-MARK detec-
tor. Additionally, removed scales could be in-
spected immediately under the epi-fluorescent
microscope without further preparation or easily
stored for later inspection.
The current restrictions of INAD Num-
ber 10-987 limit the usefulness of osmotically
induced calcein marking for evaluating walleye
stocking in Minnesota. The MNDNR stocks
walleyes at four different life stages: 1) newly
hatched fry, 2) frylings, 3) fall fingerlings, and
4) “carry-over” walleyes that have evaded har-
vest as fall fingerlings and are later captured as
older fish. Only the newly hatched fry and
frylings meet the 2 g weight restriction of INAD
Number 10-987 (USFWS 2003). Even though
osmotically inducted calcein marking of newly
hatched fry was not evaluated during this pro-
ject, the likelihood of its success is limited by
the paucity of calcified structures present on
walleyes at this life stage. The jaw and teeth of
walleye fry begin to calcify within a few days of
hatch (McElman and Balon 1979) but only the
otoliths actually form prior to hatching. Otoliths
of walleyes treated with calcein as newly-
hatched fry could be extracted for mark detec-
tion as is done with walleyes treated with OTC
as fry (Logsdon et al. 2004), but the green color
of the calcein marks is less distinguishable from
autofluorescence than OTC marks, calcein is
much more expensive than OTC, and the fish
would still have to be sacrificed for otolith re-
moval. Alternatively, fry could be held in the
hatcheries for a few days to allow development
of the jaws and teeth prior to treatment, but this
would require additional fry tanks and disrup-
tions to current hatchery procedures for the ben-
efit of marks that could be ephemeral due to the
limited amount of tissue available to absorb the
calcein during treatment.
The current study shows that calcein
marks produced on juvenile walleyes through

21
osmotic induction can remain visible for at least
15 weeks. This level of mark retention is suita-
ble for short-term management evaluations such
as Petersen mark-recapture population estimates,
but the high mortality following the treatment
negates its utility. The walleyes exhibited an
obviously negative reaction to immersion in
both the salt and the calcein, but the additional
handling at the temperatures prevalent at the
time of walleye harvest likely also contributed to
elevated mortality. Mohler and Bradley (2008)
described an activated charcoal filtration system
that could facilitate recovery of calcein from
large volumes of waste-water and subsequently
lead to reduced handling of the fish during
treatment. This filtration system, if approved by
all appropriate regulatory agencies, would allow
a more practical application of the osmotic in-
duction procedure on large numbers of fish.
Perhaps the greatest potential for the use
in osmotically induced calcein marking in Min-
nesota is for marking fall fingerlings. The IN-
AD under which OTC evaluations were con-
ducted (INAD Number 9033) also included a 2 g
maximum size restriction which was lifted when
OTC immersion marking met final approval. A
similar removal of the size restriction upon ap-
proval of calcein would allow marking of wall-
eyes large enough (900-1500 mm) to accept a
mark at a time of the year when cooler water
temperatures allow more safe handling of the
fish. The benefits of batch marking and in-hand
mark detection with the SE-MARK detector that
are associated with calcein marking would have
to be weighed against the benefits of other fish
marking techniques available to fish of that size
such as coded wire tagging, passive integrated
transponder (PIT) tagging, visible implant tag-
ging, and immersion marking with OTC (Guy et
al. 1996). Of particular interest would be its
comparison to OTC immersion marking which,
when used on percids with well-developed
spines at the time of treatment, can be detected
non-lethally by removal of a spine and later ex-
amination under an epi-fluorescent microscope
(Brown et al. 2002).
References
Alcobendas, M., F. Lecomte, J. Castanet, F. J.
Meunier, P. Maire, M. Holl, and G.
Panon. 1991. Massal labelling of elvers
with fast balneation in fluorochromes.
Application to tetracycline labelling of
500 kg of elvers. Bulletin Francais de la
Peche et de la Pisciculture 321(2):43-54.
1991. In French with English summ. FR
37(2).
Bashey, F. 2004. A comparison of the suitability
of alizarin red S and calcein for inducing
a nonlethally detectable mark in juvenile
guppies Transactions of the American
Fisheries Society 133:1516-1523.
Bilton, H. T. 1986. Marking chum salmon fry
vertebrae with oxytetracycline. North
American Journal of Fisheries
Management 6:126-128.
Brooks, R. C., R. C. Heidinger, and C. C.
Kohler. 1994. Mass-marking otoliths of
larval and juvenile walleyes by
immersion in oxytetracycline, calcein,
or calcein blue. North American Journal
of Fisheries Management 14:143-150.
Brown, M. L., J. L. Powell, and D. O. Lucchesi.
2002. In-transit oxytetracycline
marking, nonlethal mark detection, and
tissue residue depletion in yellow perch.
North American Journal of Fisheries
Management 22:236–242.
Bumguardner, B. W. 1991. Marking subadult
red drums with oxytetracycline.
Transactions of the American Fisheries
Society 120:537-540.
Dabrowski, K., and K. Tsukamota. 1986.
Tetracycline tagging in coregonid
embryos and larvae. Journal of Fish
Biology 29:691-698.
Fielder, D. G. 2002. Methodology for immersion
marking walleye fry in oxytetracycline
hydrochloride and its detection with
fluorescence microscopy. Michigan
Department of Natural Resources,
Fisheries Technical Report 2002-1, Ann
Arbor.
Guy, C. S., H. L. Blankenship, and L. A.
Nielsen. 1996. Tagging and Marking.
Pages 353-383 in B. R. Murphy, and D.
W. Willis, editors. Fisheries Techniques,

22
2nd edition. American Fisheries Society,
Bethesda, Maryland.
Hall, D. L. 1991. Age validation and aging
methods for stunted brook trout.
Transactions of the American Fisheries
Society 120:644-649.
Hendricks, M. L., T. R. Bender, Jr., and V. A.
Mudrak. 1991. Multiple marking of
American shad otoliths with tetracycline
antibiotics. North American Journal of
Fisheries Management 11:212-219.
Hill, M. S., and C. J. Quesada. 2010. Calcein
Mark Retention in Chinook Salmon and
Steelhead Fry in Artificial and Natural
Rearing Environments North American
Journal of Fisheries Management
30:1370-1375.
Honeyfield, D. C., T. Kehler, J. W. Fletcher, and
J. W. Mohler. 2008. Effect of artificial
sunlight on the retention of external
calcein marks on lake trout. North
American Journal of Fisheries
Management 28:1243-1248.
Honeyfield, D. C., G. A. Kindschi, T. A. Bell,
and J. W. Mohler. 2011. Dietary calcein
marking of shovelnose sturgeon and the
effect of sunlight on mark retention.
North American Journal of Aquaculture
73:129-134.
Kayle, K. A. 1992. Use of oxytetracycline to
determine the contribution of stocked
fingerling walleyes. North American
Journal of Fisheries Management
12:353-355.
Leips, J., C. T. Baril, F. H. Rodd, J. Travis, D.
N. Reznick, F. Bashey, and G. J. Visser.
2001. The Suitability of Calcein to Mark
Poeciliid Fish and a New Method of
Detection. Transactions of the American
Fisheries Society 130:501-507.
Logsdon, D. E. 2006. Contribution of fry
stocking to the recovery of the walleye
population in the Red Lakes. Minnesota
Department of Natural Resources,
Division of Fish and Wildlife, Section of
Fisheries, Investigational Report 535, St.
Paul.
Logsdon, D. E., B. J. Pittman, and G. C.
Barnard. 2004. Oxytetracycline marking
of newly hatched walleye fry. North
American Journal of Fisheries
Management 24:1071–1077.
Lorson, R. D., and V. A. Mudrak. 1987. Use of
tetracycline to mark otoliths of
American shad fry. North American
Journal of Fisheries Management 7:453-
455.
Lucchesi, D. O. 2002. Evaluating the
contribution of stocked walleye fry and
fingerlings to South Dakota walleye
populations through mass marking with
oxytetracycline. North American
Journal of Fisheries Management
2002:985-994.
Macfarlane, A. J., D. L. Sutherland, T. R. Goff,
and K. M. Gilmour. 2002. In vivo
photostabilization of tetracycline
hydrochloride by reduced glutathione
for use as an ecological marker in Salmo
salar. Aquaculture 213:253-263.
McElman, J. F., and E. K. Balon. 1979. Early
ontogeny of walleye, Stizostedion
vitreum, with steps of saltatory
development. Environmental Biology of
Fishes 4:309-348.
Mohler, J. W. 2003. Producing fluorescent
marks on Atlantic salmon fin rays and
scales with calcein via osmotic
induction. North American Journal of
Fisheries Management 23:1108-1113.
Muth, R. T., and K. R. Bestgen. 1991. Effect of
sunlight on tetracycline marks in otoliths
of Colorado squawfish larvae.
Transactions of the American Fisheries
Society 120:666-668.
Negus, M. T., and F. T. Tureson. 2004.
Retention and nonlethal external
detection of calcein marks in rainbow
trout and Chinook salmon. North
American Journal of Fisheries
Management 24:741-747.
Odense, P. H., and V. H. Logan. 1974. Marking
Atlantic salmon (Salmo salar) with
oxytetracycline. Journal of the Fisheries
Research Board of Canada 31:348-350.
Peterson, D. L., and R. F. Carline. 1996. Effects
of tetracycline marking, transport
density, and transport time on short-term
survival of walleye fry. Progressive
Fish-Culturist 58:29-31.

23
Scidmore, W. J., and D. E. Olson. 1969.
Marking walleye fingerings with
oxytetracycline. Progressive Fish-
Culturist 31:213-216.
Secor, D. H., M. G. White, and J. M. Dean.
1991. Immersion marking of larval and
juvenile hatchery produced striped bass
with oxytetracycline. Transactions of the
American Fisheries Society 120:261-
266.
Smith, L. S. 1982. Introduction to Fish
Physiology. T. F. H. Publications, Inc.,
Neptune, New Jersey.
Thomas, L. M., S. A. Holt, and C. R. Arnold.
1995. Chemical marking techniques for
larval and juvenile red drum (Sciaenops
ocellatus) otoliths using different
fluorescent markers. Pages 703-717 in
D. H. Secor, J. M. Dean, and S. E.
Campana, editors. Recent developments
in fish otolith research. University of
South Carolina Press, Columbia.
Unkenholz, E. G., M. L. Brown, and K. L. Pope.
1997. Oxytetracycline making efficacy
for yellow perch fingerlings and
temporal assays of tissue residues. The
Progressive Fish-Culturist 59:280-284.
USFWS. 2003. Study protocol for a
compassionate aquaculture
investigational new animal drug (INAD)
exemption for calcein (SE-MARKTM
)
(INAD #10-987). Available:
http://fws.gov/fisheries/aadap/calcein.ht
m. (April 2007).
Weber, D. D., and G. J. Ridgway. 1962. The
deposition of tetracycline drugs in bones
and scales of fish and its possible use for
marking. Progressive Fish-Culturist
24:150-155.
Weber, D. D., and G. J. Ridgway. 1967.
Marking Pacific salmon with
tetracycline antibiotics. J. Fish. Res.
Board Can. 24:849-865.
Younk, J., and M. Cook. 1991. Fluorescent
chemical marking of walleye larvae with
a selected literature review of similar
investigations. Minnesota Department of
Natural Resources Section of Fisheries,
Investigational Report 408, St. Paul.

Acknowledgements
I thank Jerre Mohler, Molly Negus, Dave Lucchesi, and Ron Brooks for theirtechnical advice on marking techniques, Bruce Pittman for assistance andaccommodations at the Waterville Fish Hatchery, and Seth Luchau for assistance infish sampling and mark inspection. Steve Shroyer, Charles Anderson, and DonPereira also deserve thanks for providing constructive recommendations to the textof this manuscript.
INVESTIGATIONAL REI)Oj:;!T~'
reclailuil1lg Minnesota walh~\/e f'&>l'lriiI1NInduced winterkiil as a maina!gernelltSteven M. Shl'oVI~r
No. 547
No. 548 POIPul,atic1n cl::ol()gy and prey C0l1lsulrnp1:ionimll0rtarlce of detritus larval fish.l:;ij:l>,,,, ..hd from of Freshwater
wetlands:D. Zimmer.
No. 549 An examination of Minnesota's waters.Donald L Pereira. Environ Bioi Fish
No. 550 level
No. 551 ...."',..~ •." at age estimates of and white craippie among lake claiss·es,l'e~:eI"VOiirl';_ Iml:»olmclmlmts, and rivers in Minnesota. C. Mclne,rnv and
2008.
No. 552 Can minimum limits size structure in Minnesota blackDaniel A. Isermann and Andrew J. Carlson. March 2009.
No. 553 Evaluation of an 11-in maximumnortheastern Minnesota. Dr.and Melissa Drake. March 2009.
limit for smallmouth bass pOIPulath>ns inA. Kevin S. Paul Ra1dorns.,i,
No. 554 Statewide evaluation of introduction andsummary of results. Andrew J, Carlson and Daniel A. Isermann. November2009.
No. 555 in lake
No. 556 LOIUI-{erlm evaluations of northernROlclnEiY B. Pierce.
in Minnesota
•A list of all in the series is available from Minnesota n.P>ln.::ufmIPlnt ofNatural Division of Fish and Box 500 lafavEitteMinnesota 55155-4020.
Imrestigati-on,ill niDolrts startirlg at #367 are av.!ilable on the DNR web site at: