Investigation of the Potential for Biofuel Blends in ... · 1.5/3913e021.doc 1 ... Investigation of...
24
1.5/3913e021.doc 1 (09/2005) BNL-93682-2009-IR Investigation of the Potential for Biofuel Blends in Residual Oil-Fired Power Generation Units as an Emissions Reduction Strategy for New York State C.R. Krishna and Roger J. McDonald May 2009 Energy Sciences and Technology Department/Energy Resources Division Brookhaven National Laboratory P.O. Box 5000 Upton, NY 11973-5000 www.bnl.gov Notice: This manuscript has been authored by employees of Brookhaven Science Associates, LLC under Contract No. DE-AC02-98CH10886 with the U.S. Department of Energy. The publisher by accepting the manuscript for publication acknowledges that the United States Government retains a non-exclusive, paid-up, irrevocable, world-wide license to publish or reproduce the published form of this manuscript, or allow others to do so, for United States Government purposes.
Transcript of Investigation of the Potential for Biofuel Blends in ... · 1.5/3913e021.doc 1 ... Investigation of...
1.5/3913e021.doc 1 (09/2005)
BNL-93682-2009-IR
Investigation of the Potential for Biofuel Blends in Residual Oil-Fired Power Generation Units as an Emissions Reduction Strategy for New York State
C.R. Krishna and Roger J. McDonald
May 2009
Energy Sciences and Technology Department/Energy Resources Division
Brookhaven National Laboratory P.O. Box 5000
Upton, NY 11973-5000 www.bnl.gov
Notice: This manuscript has been authored by employees of Brookhaven Science Associates, LLC under Contract No. DE-AC02-98CH10886 with the U.S. Department of Energy. The publisher by accepting the manuscript for publication acknowledges that the United States Government retains a non-exclusive, paid-up, irrevocable, world-wide license to publish or reproduce the published form of this manuscript, or allow others to do so, for United States Government purposes.
1.5/3913e021.doc 2 (09/2005)
DISCLAIMER
This report was prepared as an account of work sponsored by an agency of the United States Government. Neither the United States Government nor any agency thereof, nor any of their employees, nor any of their contractors, subcontractors, or their employees, makes any warranty, express or implied, or assumes any legal liability or responsibility for the accuracy, completeness, or any third party’s use or the results of such use of any information, apparatus, product, or process disclosed, or represents that its use would not infringe privately owned rights. Reference herein to any specific commercial product, process, or service by trade name, trademark, manufacturer, or otherwise, does not necessarily constitute or imply its endorsement, recommendation, or favoring by the United States Government or any agency thereof or its contractors or subcontractors. The views and opinions of authors expressed herein do not necessarily state or reflect those of the United States Government or any agency thereof.

1
Investigation of the Potential for Biofuel Blends in Residual Oil-Fired Power Generation Units as an Emissions
Reduction Strategy for New York State
Brookhaven National Laboratory Energy Sciences and Technology Department
Energy Resources Division
May 2009
C.R. Krishna and Roger J. McDonald
Under Agreement 10081 New York State Energy Research and Development Authority
2
Legal Notes
NYSERDA
This report was prepared by Brookhaven National Laboratory in the course of performing work contracted for and sponsored by the New York State Energy Research and Development Authority (NYSERDA). The opinions expressed in this report do not necessarily reflect those of NYSERDA or the State of New York, and reference to any specific product, service, or method does not constitute an implied or expressed recommendation or endorsement of it. Further, NYSERDA and the State of New York make no warranties or representations, expressed or implied, as to the fitness for particular purpose or merchantability of any product, apparatus, or service, or the usefulness, completeness or accuracy of any process, methods, or other information contained, described, disclosed, or referred to in this report. NYSERDA, the State of New York, and the contractor make no representations that the use of any product, apparatus, process, method, or other information will not infringe privately owned rights and will assume no liability for any loss, injury, or damage resulting from, or occurring in connection with, the use of information contained, described, disclosed, or referred to in this report.
United States Department of Energy
This report was prepared as an account of work sponsored by an agency of the United States Government. Neither the United States Government nor any agency thereof, nor any of their employees, nor any of their contractors, subcontractors, or their employees makes any warranty, express or implied, or assumes any legal liability or responsibility for the accuracy, completeness, or usefulness of any information, apparatus, product, or process disclosed, or represents that its use would not infringe privately owned rights. Reference herein to any specific commercial product, process, or service by trade name, trademark, manufacturer, or otherwise, does not necessarily constitute or imply its endorsement, recommendation, or favoring by the United States Government or any agency, contractor or subcontractor thereof. The views and opinions of authors expressed herein do not necessarily state or reflect those of the United States Government or any agency, contractor, or subcontractor thereof.
3
Table of Contents Legal notes ........................................................................................................2 List of figures ....................................................................................................4 List of tables .....................................................................................................4
1. Introduction .................................................................................................5 2. Experimental Setup .....................................................................................5 3. Measurement Techniques .........................................................................10 4. Experimental Results ................................................................................14
4.1 Combustion Tests in the commercial boiler .......................................14 4.2 Particulate Measurement tests in the commercial boiler
(Residual oil and blends) ....................................................................17 4.3 Particulate Measurement tests in a residential boiler
(Filter Temperature effect tests) ..........................................................18 4.4 Carbon content analysis ......................................................................21
5. Conclusions ...............................................................................................21 6. Acknowledgements ...................................................................................22 7. References .................................................................................................22
4
List of Figures
1. Blending System .........................................................................................6 2. Test Boiler ...................................................................................................7 3. Internal Mixing Twin Fluid Atomizer ........................................................7 4. Electric Steam Generator ............................................................................8 5. Sampling Stack with Induced Draft Fan Shown at Mezzanine ..................8 6. Particulate Sampling and Measurement System .........................................9 7. Boiler and PM2.5 Sampling for Filter Temperature Tests .......................10 8. Schematic of the PM 2.5 Measurement ....................................................12 9. NOx Emission from The Fuels Compared ................................................15 10. SO2 Emission from # 6 and RB 40 Fuels Compared ...............................16 11. CO Emission from the Three Fuels Compared .........................................16
List of Tables 1. No. 6 Fuel Analysis ...................................................................................14 2. Particulate Emission Data for No. 6 fuel ..................................................17 3. Particulate Emission Data for RB10 .........................................................18 4. Particulate Emission Data for RB40 .........................................................18 5. Emissions Data, Residential Boiler ASTM No. 2 Fuel Baseline ..............19 6. Fine Particulate 2.5 µm Emission - Low Filter Temperature ...................19 7. Emissions Data, Residential Boiler No. 2 Fuel, High Filter Temperature 20 8. Fine Particulate 2.5 µm Emission - High Filter Temperature ...................20 9. Carbon Content Analysis ..........................................................................21

5
1. Introduction There is a significant amount of oil, about 12.6 million barrels per year, used for
power generation in New York State [1]. The majority of it is residual oil. The primary reason for using residual oil probably is economic, as these fuels are cheaper than distillates. However, the stack emissions from the use of such fuels, especially in densely populated urban areas, can be a cause for concern. The emissions of concern include sulfur and nitrogen oxides and particulates, particularly PM 2.5. Blending with distillate (ASTM #2) fuels may not reduce some or all of these emissions. Hence, a case can be made for blending with biofuels, such as biodiesel, as they tend to have very little fuel bound sulfur and nitrogen and have been shown in prior work at Brookhaven National Laboratory (BNL) [2] to reduce NOx emissions as well in small boilers. Some of the research carried out at CANMET in Canada [3] has shown potential reductions in PM with blending of biodiesel in distillate oil. There is also the benefit obtaining from the renewable nature of biofuels in reducing the net carbon dioxide emitted thus contributing to the reduction of green house gases that would otherwise be emitted to the atmosphere.
The present project was conceived to examine the potential for such benefits of blending biofuels with residual oil. A collaboration was developed with personnel at the New York City Poletti Power Plant of the New York Power Authority. Their interest arose from an 800 MW power plant that was using residual oil and which was mandated to be shut down in 2010 because of environmental concerns. A blend of 20% biodiesel in residual oil had also been tested for a short period of about two days in that boiler a couple of years back. [4] In this project, emission measurements including particulate measurements of PM2.5 were made in the commercial boiler test facility at BNL described below. Baseline tests were done using biodiesel as the blending biofuel. Biodiesel is currently and probably in the foreseeable future more expensive than residual fuel. So, another task was to explore potential alternative biofuels that might confer emission benefits similar to those of biodiesel, while being potentially significantly cheaper. Of course, for power plant use, availability in the required quantities is also a significant criterion.
A subsidiary study to determine the effect of the temperature of the filter used to collect and measure the PM 2.5 emissions was conducted. This was done for reasons of accuracy in a residential boiler using distillate fuel blends.
The present report details the results obtained in these tests with the baseline ASTM No. 6 fuel and blends of biodiesel with it as well as the results of the filter temperature study. The search for the alternative ‘cheaper’ biofuel identified a potential candidate, but difficulties encountered with the equipment during the testing prevented testing of the alternative biofuel.
2. Experimental Setup
The blending of the residual fuel and the biodiesel for the combustion tests in the commercial boiler are made in the system shown in Figure 1. It consists of 55-gallon drums to hold the base residual fuel, the biodiesel and the blend. Two pumps are used to circulate the different fuels. The required connections were made with copper tubing and included valves, pressure gauges and pressure relief valves to provide control and safety. The high viscosities of the residual fuel and the blend at normal ambient temperatures are reduced for pumping by the heating of the corresponding drums by drum band heaters.

6
The mixing drum is set on a scale and the blends are made by weight of the blending fuels. The fuel to the burner is supplied from this mixing drum through a heated line and the flow rate can be calculated by timing the change in weight on the scale.
Figure 1. Blending System
The combustion tests are carried out in the boiler shown in Figure 2. This is a
Peerless 0-715-FDA-W boiler capable of a firing rate of about 1.5 million Btu/hr. It is normally equipped with a standard distillate oil burner, common in such boiler installations. This burner has a pressure atomizer, which is unsuited for residual oil and so was replaced by a Delavan 30615-10 Airo air atomizing nozzle, which is an internal mixing type. A cutaway picture of this atomizer is shown in Figure 3. Unlike pressure atomizers, the fuel flow rate is not fixed by the nozzle at a given fuel pressure and hence a metering orifice is used in the fuel system to regulate the fuel flow rate. For the present tests, as mentioned earlier, the atomizing medium was steam which was generated by the electric steam generator shown in Figure 4 and transported through insulated piping to the burner. The fuel is transported to the burner by a separate pump from the blend drum. The fuel piping is heat traced to a location as close to the burner as is possible. The distillate burner’s pump is left connected to the atomizer as well and supplies distillate fuel from a tank outside the laboratory for starting. After the distillate oil flame is established, the fuel from the blend drum is gradually fed into the atomizer while the distillate oil flow is reduced with the help of valves in the two fuel lines. The burner blower is used to supply combustion air for starting on (No. 2) distillate fuel and for firing the blends.
The boiler as shown in Figure 2 has two exhaust stacks for conveying the combusted gases outside the building. The larger one, termed the main stack, is used normally. This connects to the chimney outside the laboratory room and operates by natural convection. However, the proximity of the right angle bend makes it unsatisfactory for particulate measurements. Hence, the smaller stack is used for making the emission measurements. This stack has an extended length that brings it to a

7
mezzanine in the lab and is connected to an induced draft fan for venting to the outside. This part of the stack with the fan is shown in Figure 5 below.
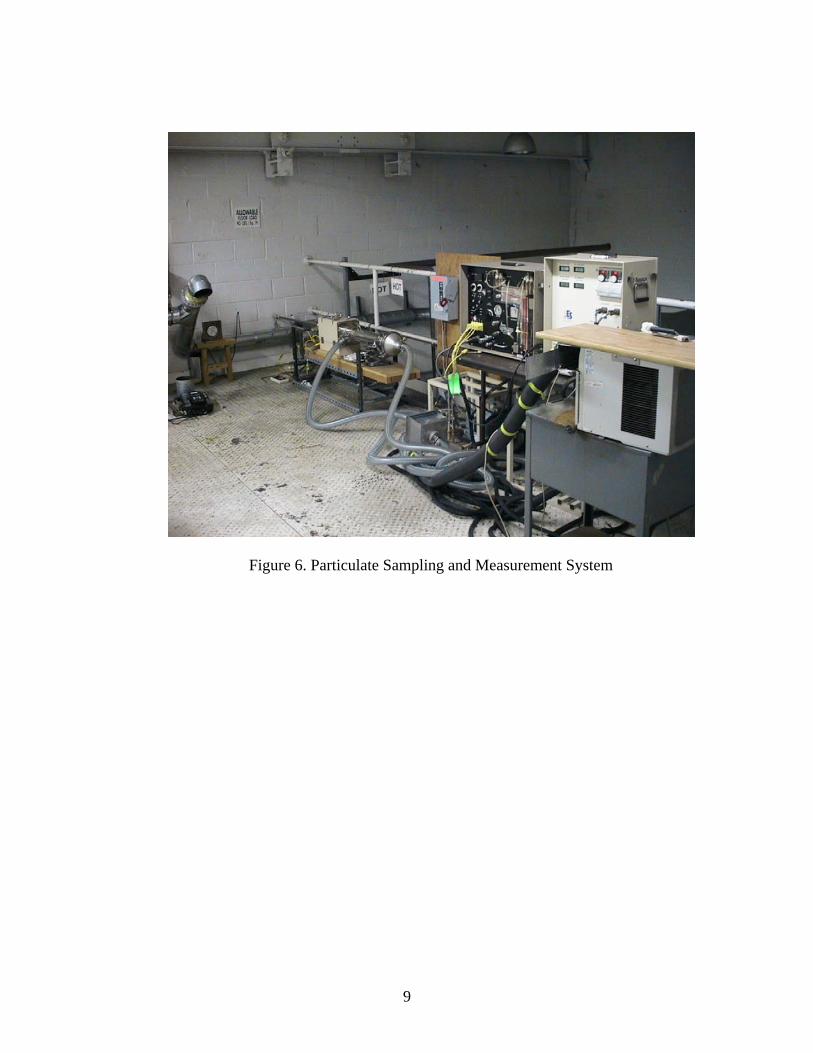
The particulate dilution sampling and PM 2.5 measurement system to CTM-39 is shown with the sampling probe set up on the mezzanine level in Figure 6 below. The gaseous emissions are measured with the Testo Model 350 test instrument. The fuel temperatures are measured with thermocouples, and the fuel flow rate is measured by timing with a stopwatch a known change in the drum weight.
The tests to determine the effects of filter temperature on the PM2.5 measurement were carried out in the residential boiler shown in Figure 7 below.
Figure 2. Test Boiler
Figure 3. Internal Mixing Twin Fluid Atomizer

8
Figure 4. Electric Steam Generator
Figure 5. Sampling Stack With Induced Draft Fan Shown at Mezzanine
9
Figure 6. Particulate Sampling and Measurement System

10
Figure 7. Boiler and PM2.5 Sampling for Filter Temperature Tests 3. Measurement Techniques
The fuel flow rate was measured by timing the change in weight of the blend drum. The blend or residual density can be used to calculate the volumetric flow rate. The fuel temperature and the steam pressure were measured with a thermocouple and a pressure gauge to set the operating conditions. The smoke number (per ASTM D1256-94) was set at #1 typically. For performance measurements, the combustion air was varied by changing the setting on the burner air register at the same fuel flow rate to obtain different oxygen values in the stack. The PM measurements were carried out at one excess air level, that is, one oxygen concentration in the stack.
The basic flue gas emissions data were obtained using an electro-chemical based analyzer capable of measuring oxygen, CO, NO, NO2 and SO2 as well as measuring stack gas temperature and determining steady state efficiency. The acceptance of portable electrochemical-based analyzers by state and federal environmental agencies has grown significantly over the past decade. Numerous third party organizations have tested and evaluated the technology and found that not only do they satisfy the accuracy requirements of many compliance-testing programs, but also offer a more affordable and better time managed solution. Coupled with great cross utilization capability that can identify improvements in the combustion process and product quality, this makes these analyzers a valuable asset to many types of combustion research. The specific analyzer used in this project was a Testo Model 350 equipped with low range CO and NOx capabilities. This specific device was evaluated, tested and its performance verified under the US EPA’s Environmental Technology Verification (ETV) Program by the Advanced Monitoring Systems (AMS) Center, one of six technology areas under ETV and operated
11
by Battelle (Columbus, OH) in cooperation with the EPA’s National Exposure Laboratory.
Fine particulate measurements were conducted by a series of tests to determine the gravimetric amounts of particulates below 2.5 microns (PM 2.5). This measurement technique is based on US EPA Conditional Tests Method (CTM) 39 for Measurements of PM2.5 and PM10 Emissions by Dilution Tunnel Sampling (Constant Sampling Rate Procedures). This method was developed for large emission sources like oil or gas-fired power generation utilities or manufacturing plants. These units have stack dimensions typically sized several feet and not a few inches as in our application. So, the method was modified to accommodate the tighter geometry found with residential heating appliance vents. The primary modification included using only a single particle-sizing cyclone with a cut size of 2.5 microns. These cyclones are normally used inside the stack and are intended to function at the stack temperature. Due to the small diameter of the flue (6-inch) used the procedure was modified to install the cyclone outside the flue with a wrap heater and temperature controller to maintain the temperature at the same level as the internal stack temperature.
At the test conditions established, a series of three measurements were made. The three samples were obtained at the same operating conditions and provided data evaluation based on the standard deviation for statistical reasons. If the standard deviation was high due to one measurement that test was repeated to see if more consistent data was obtainable. A fourth sample was obtained for analysis of elemental carbon and organic carbon present in the particulate sample. These samples needed to be obtained on a pre-conditioned pure quartz media filter. The preconditioning involved baking any impurities out of the blank filter by placing it in an oven at 800 degrees Celsius for a period of at least two hours.
The smoke measurement was obtained using a “Bacharach” smoke tester designed to conform to ASTM D1256-94 (1999), ‘Standard Test Method for Smoke Density in Flue Gases from Burning Distillate Fuels.’ The “Bacharach” smoke tester is a manually operated smoke pump used usually to set up the appropriate air-fuel ratio.
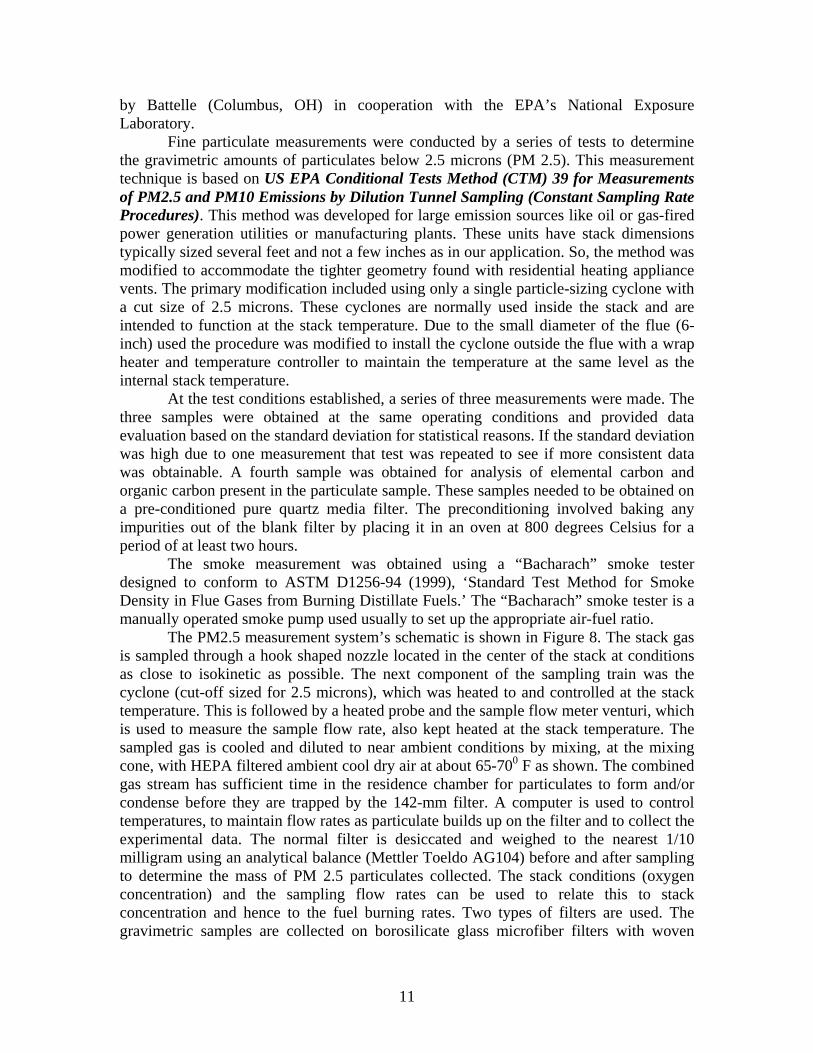
The PM2.5 measurement system’s schematic is shown in Figure 8. The stack gas is sampled through a hook shaped nozzle located in the center of the stack at conditions as close to isokinetic as possible. The next component of the sampling train was the cyclone (cut-off sized for 2.5 microns), which was heated to and controlled at the stack temperature. This is followed by a heated probe and the sample flow meter venturi, which is used to measure the sample flow rate, also kept heated at the stack temperature. The sampled gas is cooled and diluted to near ambient conditions by mixing, at the mixing cone, with HEPA filtered ambient cool dry air at about 65-700 F as shown. The combined gas stream has sufficient time in the residence chamber for particulates to form and/or condense before they are trapped by the 142-mm filter. A computer is used to control temperatures, to maintain flow rates as particulate builds up on the filter and to collect the experimental data. The normal filter is desiccated and weighed to the nearest 1/10 milligram using an analytical balance (Mettler Toeldo AG104) before and after sampling to determine the mass of PM 2.5 particulates collected. The stack conditions (oxygen concentration) and the sampling flow rates can be used to relate this to stack concentration and hence to the fuel burning rates. Two types of filters are used. The gravimetric samples are collected on borosilicate glass microfiber filters with woven
12
glass cloth bonded with PTFE (Teflon). This is done in triplicate for reasonable statistics. A pure quartz filter is used for one measurement for subsequent analysis to determine the split between elemental and organic carbon in the particulate. This quartz filter is pre-conditioned by baking it at 8000 C for two hours to remove any possible carbon contaminants before use with the sampling system. The elemental and organic carbon components in the particulate sample on the quartz filter were analyzed by a testing laboratory (Sunset Labs) using the thermal optical technique (NIOSH 5040). The protocol followed (CTM-39) for setting up and operating the sampling system is more complex than suggested in this outline of the procedure. The complete method can be downloaded from the US EPA’s website at http://www.epa.gov/ttn/emc/ctm.html.
The compact size of the dilution tunnel sampler used in this project provides for the ability to wash it down with acetone and subsequent recovery of the particulate residue on the walls. The acetone rinse and residue is collected in pre-weighed aluminum tins. Then the acetone is evaporated in a hood and the residue is weighed using the analytical balance to determine the amount of particulate material recovered. A similar technique using an acetone wash was used to recover the sample from the 2.5 cut size cyclone. Several other research organizations have conducted dilution tunnel sampling using very large apparatus that preclude an accurate recovery of this residue.
Figure 8. Schematic of the PM 2.5 Measurement

13
Prior to the start of this work, BNL hosted a research team from the US EPA tasked with conducting a detailed speciation profile of the fine particulates for a typical residential oil-fired boiler. This project involved testing a single unit with a single sample of fuel and was conducted over a three-day period. The EPA team utilized a very large dilution tunnel sampler built for EPA. This measurement system has been deployed to conduct speciation profiles for various different types of fine particulate generating sources. These include power generation units, commercial boilers, engine sources, etc. This was done to determine if there are any unique emissions characteristics from these generic source types that could then be traced in their detailed air quality monitoring stations located throughout the country. This would then enable them to apportion ambient particulate concentrations to be the result of these various generic sources. The EPA dilution tunnel involved a large truckload of equipment and components. This emissions sampler was a modified dilution sampling system like that used by Hildemann et al. [5]. After researching different possibilities BNL had acquired a very compact dilution sampler. It was built by a commercial vendor of emissions sampling equipment and was based on the EPA design developed for EPA CTM-039. This design was generated by another arm of the US EPA tasked with instrumentation development for multiple users interested in conducting fine particulate measurements for compliance to EPA regulations concerning fine particulate emissions.
The availability of both dilution tunnel samplers allowed BNL to conduct a direct simultaneous side-by-side comparison of the two measurement systems. While the EPA researchers were at BNL conducting their project BNL ran its measurement system in parallel sampling off the same stack simultaneously. This provided BNL an opportunity to evaluate the performance of its compact dilution sampler against using a larger version of a modified dilution sampling systems like that used by Hildemann et al. [5].
The boiler used in the testing was a conventional cast iron boiler equipped with a flame retention head burner. At EPA’s request the boiler was tested under cyclic on and off conditions according to the duty cycle specified in ASHRAE Standard 103-1193. The unit was fired with conventional ASTM No. 2 heating oil with a sulfur content of 1,440 ppm. The test was repeated three times over the course of three days. The gravimetric fine particulate emission factor measured by the EPA group was reported as 49 +/- 5 mg/kg. The BNL measurement using the compact dilution sampler was 46 mg/kg with a standard deviation of 8 mg/kg, which indicates close agreement between the two sampling methods. These can be compared to the existing emission factor of 57 mg/kg listed in EPA AP-42.
During the evaluation dealing with the effects of filter temperature on PM results all of the flexible air ducts lines were shortened and insulated to preserve the temperature of the cool or hot air as required. In attempting to run the tests at the low temperature condition the air conditioner used to dehumidify the dilution air was set to run at maximum cooling capacity. A 1500 watt heater in an enclosed plenum was used to preheat the dilution air prior to its intake to the HEPA filter to achieve the high filter temperature condition. A conventional residential boiler running continuously was used in these tests. As stated before three tests were conducted for statistical reasons.
14
4. Experimental Results 4.1. Combustion Tests in the commercial boiler
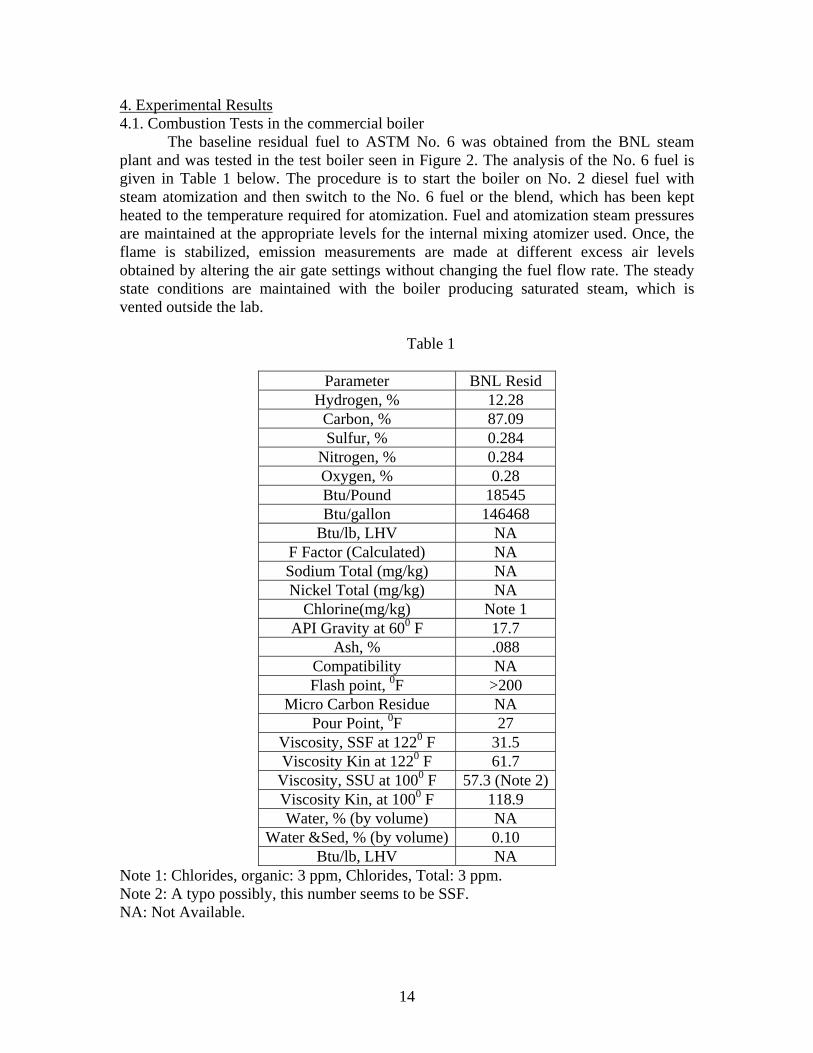
The baseline residual fuel to ASTM No. 6 was obtained from the BNL steam plant and was tested in the test boiler seen in Figure 2. The analysis of the No. 6 fuel is given in Table 1 below. The procedure is to start the boiler on No. 2 diesel fuel with steam atomization and then switch to the No. 6 fuel or the blend, which has been kept heated to the temperature required for atomization. Fuel and atomization steam pressures are maintained at the appropriate levels for the internal mixing atomizer used. Once, the flame is stabilized, emission measurements are made at different excess air levels obtained by altering the air gate settings without changing the fuel flow rate. The steady state conditions are maintained with the boiler producing saturated steam, which is vented outside the lab.
Table 1
Parameter BNL Resid
Hydrogen, % 12.28 Carbon, % 87.09 Sulfur, % 0.284
Nitrogen, % 0.284 Oxygen, % 0.28 Btu/Pound 18545 Btu/gallon 146468
Btu/lb, LHV NA F Factor (Calculated) NA Sodium Total (mg/kg) NA Nickel Total (mg/kg) NA
Chlorine(mg/kg) Note 1 API Gravity at 600 F 17.7
Ash, % .088 Compatibility NA Flash point, 0F >200
Micro Carbon Residue NA Pour Point, 0F 27
Viscosity, SSF at 1220 F 31.5 Viscosity Kin at 1220 F 61.7
Viscosity, SSU at 1000 F 57.3 (Note 2)Viscosity Kin, at 1000 F 118.9 Water, % (by volume) NA
Water &Sed, % (by volume) 0.10 Btu/lb, LHV NA
Note 1: Chlorides, organic: 3 ppm, Chlorides, Total: 3 ppm. Note 2: A typo possibly, this number seems to be SSF. NA: Not Available.

15
The biodiesel bought from a supplier is made from soy oil and meets the ASTM D6751 specification as of that date. The specification has changed recently. This was blended, in the system described before, at two levels, 10% and 40%, for the combustion and emission as well as the PM tests.
Following the combustion tests, the PM2.5 measurement tests with the CTM-39 system in place as seen in Figure 6 above were carried out at one excess air level. As mentioned before, this requires a continuous running period of several hours, as three tests are required for gravimetric measurement and one for the carbon speciation measurement using the quartz filter. Typical runs for each of these tests lasted about an hour. The results from the combustion tests will be presented as summary graphs of the gaseous emissions as a function of excess air (represented by the oxygen concentration in the stack). The gas concentrations will be ‘corrected for dilution,’ by calculating an equivalent value at 3% oxygen in the stack, so that they can be compared. Figure 9 below compares graphically the NOx at 3% O2 for the three fuels. As has been noticed before [2], blending biodiesel reduces the NOx emission from this boiler and the effect increases with increase in the blending amount. Though not directly measured, this is not due to the slightly lower heating value of the biodiesel, as the contrary happens in diesel engines generally.
NOx at 3% O2 compared for # 6 Oil, RB 10 and RB 40 Blends
0
50
100
150
200
250
0 2 4 6 8 10
Stack O2, %
Stac
k N
Ox,
ppm
# 6 oilRB 10RB 40
Figure 9. NOx Emission from The Fuels Compared
Figure 10 below shows the SO2 data, again corrected for the dilution effects, for the base No. 6 fuel oil and the RB 40 blend (60% No. 6 and 40% biodiesel). The data for RB10 (90% No. 6 and 10% biodiesel) shows a lot of scatter for some unknown reason and is omitted here for clarity. The SO2 emission is a direct function of the sulfur content in the fuel and quite obviously, the absence of sulfur in the biodiesel transfers directly to reduction in the blend SO2 emission.
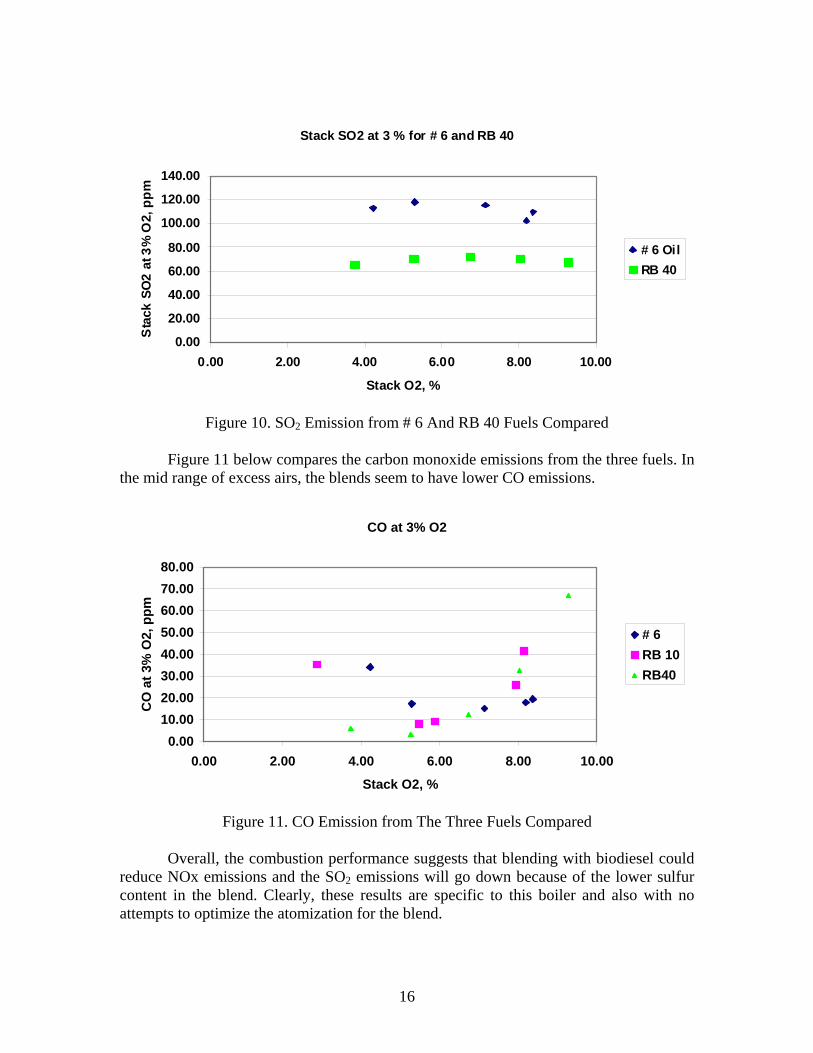
16
Stack SO2 at 3 % for # 6 and RB 40
0.00
20.00
40.00
60.00
80.00
100.00
120.00
140.00
0.00 2.00 4.00 6.00 8.00 10.00
Stack O2, %
Sta
ck S
O2
at 3
% O
2, p
pm
# 6 OilRB 40
Figure 10. SO2 Emission from # 6 And RB 40 Fuels Compared
Figure 11 below compares the carbon monoxide emissions from the three fuels. In the mid range of excess airs, the blends seem to have lower CO emissions.
CO at 3% O2
0.0010.0020.0030.0040.0050.0060.0070.0080.00
0.00 2.00 4.00 6.00 8.00 10.00
Stack O2, %
CO
at 3
% O
2, p
pm
# 6RB 10RB40
Figure 11. CO Emission from The Three Fuels Compared
Overall, the combustion performance suggests that blending with biodiesel could reduce NOx emissions and the SO2 emissions will go down because of the lower sulfur content in the blend. Clearly, these results are specific to this boiler and also with no attempts to optimize the atomization for the blend.
17
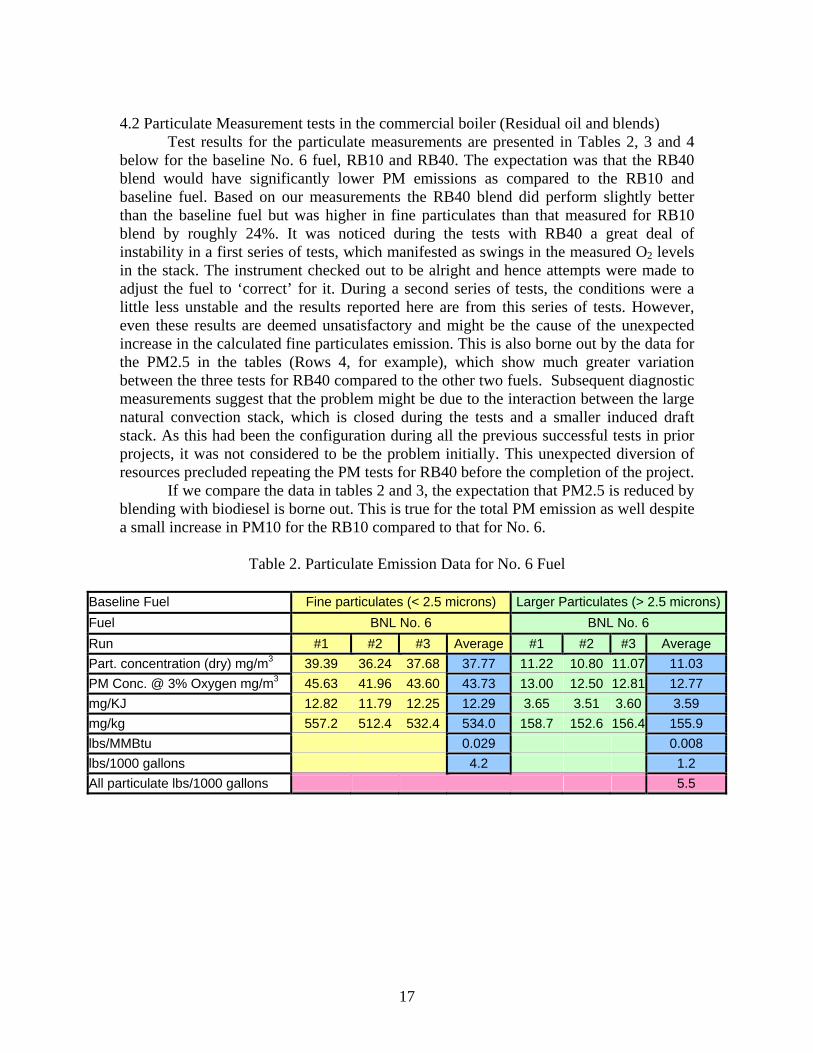
4.2 Particulate Measurement tests in the commercial boiler (Residual oil and blends) Test results for the particulate measurements are presented in Tables 2, 3 and 4 below for the baseline No. 6 fuel, RB10 and RB40. The expectation was that the RB40 blend would have significantly lower PM emissions as compared to the RB10 and baseline fuel. Based on our measurements the RB40 blend did perform slightly better than the baseline fuel but was higher in fine particulates than that measured for RB10 blend by roughly 24%. It was noticed during the tests with RB40 a great deal of instability in a first series of tests, which manifested as swings in the measured O2 levels in the stack. The instrument checked out to be alright and hence attempts were made to adjust the fuel to ‘correct’ for it. During a second series of tests, the conditions were a little less unstable and the results reported here are from this series of tests. However, even these results are deemed unsatisfactory and might be the cause of the unexpected increase in the calculated fine particulates emission. This is also borne out by the data for the PM2.5 in the tables (Rows 4, for example), which show much greater variation between the three tests for RB40 compared to the other two fuels. Subsequent diagnostic measurements suggest that the problem might be due to the interaction between the large natural convection stack, which is closed during the tests and a smaller induced draft stack. As this had been the configuration during all the previous successful tests in prior projects, it was not considered to be the problem initially. This unexpected diversion of resources precluded repeating the PM tests for RB40 before the completion of the project.
If we compare the data in tables 2 and 3, the expectation that PM2.5 is reduced by blending with biodiesel is borne out. This is true for the total PM emission as well despite a small increase in PM10 for the RB10 compared to that for No. 6.
Table 2. Particulate Emission Data for No. 6 Fuel
Baseline Fuel Fine particulates (< 2.5 microns) Larger Particulates (> 2.5 microns)Fuel BNL No. 6 BNL No. 6 Run #1 #2 #3 Average #1 #2 #3 Average Part. concentration (dry) mg/m3 39.39 36.24 37.68 37.77 11.22 10.80 11.07 11.03 PM Conc. @ 3% Oxygen mg/m3 45.63 41.96 43.60 43.73 13.00 12.50 12.81 12.77 mg/KJ 12.82 11.79 12.25 12.29 3.65 3.51 3.60 3.59 mg/kg 557.2 512.4 532.4 534.0 158.7 152.6 156.4 155.9 lbs/MMBtu 0.029 0.008 lbs/1000 gallons 4.2 1.2 All particulate lbs/1000 gallons 5.5

18
Table 3. Particulate Emission Data for RB10
Table 4. Particulate Emission Data for RB 40
B40 blend with baseline fuel Fine particulates (<2.5 microns) Larger Particulates (> 2.5 microns) Fuel RB40 No. 6 RB40 No. 6 Run #1 #2 #4 Average #1 #2 #4 Average Part. Concentration (dry) mg/m3 31.25 26.82 24.25 27.44 4.50 4.54 4.47 4.50 PM Conc. @ 3%Oxygen mg/m3 46.11 42.87 41.22 43.40 6.64 7.25 7.60 7.16 mg/KJ 12.95 12.04 11.57 12.18 1.86 2.04 2.13 2.01 mg/kg 546.5 508.1 488.4 514.3 78.7 86.0 90.0 84.9 lbs/MMBtu 0.028 0.005 lbs/1000 gallons 4.0 0.7 All particulate lbs/1000 gallons 4.6
4.3 Particulate Measurement tests in a residential boiler (Filter Temperature effect tests)
Tests were conducted to evaluate the effects that the temperature of the filter might have on the fine particulate measurement results. These were done using a residential sized boiler firing ASTM No. 2 oil as these effects are expected to be small and the accuracy possible with a distillate oil boiler is more likely to disclose any differences. The PM 2.5 apparatus was modified to evaluate any changes between measured PM 2.5 levels as a function of filter temperature. This required installing a new thermocouple just right behind the filter support frit to accurately determine the true filter temperature. The targets were a ‘low’ temperature of 250 C (77 F) and a high of 420 C (108 F). Several days were spent trying to achieve these temperatures prior to actual measurements. Given the EPA CTM-039 equipment we were not able to actually get the filter temperature all the way down to 770 F. The unit’s air chiller used to provide pre-conditioning of the air flow was set for maximum output and all air lines were heavily insulated. The lowest temperature achieved was about 800 F for short durations but this tended to increase over time. During the actual low temperature tests an average temperature of 880 F was achieved. It was also an effort to achieve the higher target of
B10 blend with baseline fuel Fine particulates (< 2.5 microns) Larger Particulates (> 2.5 microns)
Fuel RB10 No. 6 RB10 No. 6 Run #1 #2 #3 Average #1 #2 #3 Average Part. Concentration (dry) mg/m3 30.00 29.42 29.08 29.50 13.30 13.32 13.20 13.27 PM Conc. @ 3% Oxygen mg/m3 33.80 34.33 37.27 35.13 14.98 15.54 16.91 15.81 mg/KJ 9.40 9.55 10.37 9.77 4.17 4.32 4.70 4.40 mg/kg 409.7 416.1 451.7 425.8 181.6 188.4 205.0 191.7 Lbs/MMBtu 0.023 0.010 Lbs/1000 gallons 3.3 1.5 All particulate lbs/1000 gallons 4.8

19
1080 F, which was accomplished by the addition of a heater to preheat the air before it entered the HEPA filter.
Tables 5 and 6 below give the data on flue gas emissions and for the fine particulates for the ‘low’ temperature condition. Tables 7 and 8 give the corresponding data for the ‘high’ temperature measurements. The flue gas data are presented to indicate that the tests were conducted at similar combustion conditions. Samples for elemental and organic carbon analyses were also taken and sent to Sunset Laboratory for EC/OC determination. These results are presented in Table 9.
Table 5. Emissions Data - Residential Boiler ASTM No. 2 Fuel Baseline
Oil-fired residential boiler with ASTM No. 2 fuel – steady state data – low temperature filter
Reading Number 1 2 3 4 5 6 Avg. Avg. @ 3% O2 Stack Temp. Deg F 366 360 367 372 375 373 368.8 * * * * Oxygen % 6.25 6.23 6.49 6.46 6.61 6.41 6.41 * * * * CO2 % 11.02 11.03 10.84 10.86 10.74 10.9 10.90 * * * * CO ppm 0 0 0 0 0 0 0 0 NO ppm 93.3 93.1 94.7 95.6 98.7 98.9 95.7 118.2 NOx ppm 94.2 94.7 96.3 97 100.5 101.6 97.4 120.3 NO2 ppm 0.9 1.6 1.6 1.4 1.8 2.7 1.7 2.1 SO2 ppm 61 61 53 53 65 65 59.7 73.7 Efficiency 86.2 86.6 86 85.9 85.8 86.1 86.1 * * * * Excess Air 39.2 39 41.3 41.1 42.5 40.6 40.6 * * * *
Table 6 Fine Particulate 2.5 µm Emission - Low Filter Temperature
Fine Particulate 2.5 µm Emission Oil-fired Residential Boiler Run # 1 Run # 2 Run # 3 Average Fuel ASTM No. 2 ASTM No. 2 ASTM No. 2 Fuel Flow gph 0.702 0.721 0.723 0.715 Btu/Min 1623 1666 1670 1653 Kj / Min 1712 1758 1762 1744 Oxy % 6.25 6.43 6.51 6.40 PM (dry) mg/dscm 4.71 4.61 4.71 4.68 PM @ 3%Oxy 5.75 5.71 5.86 5.77 mg/MJ 1.62 1.61 1.65 1.62 mg/kg 72.3 71.8 73.6 72.6 lbs per mmBtu 0.0038 lbs. per 1000 gallons 0.524

20
Table 7 Emissions Data – Residential Boiler ASTM No. 2 Fuel, High Filter Temperature
Oil-fired residential boiler with ASTM No. 2 fuel – steady state data – high temperature filter
Reading Number 1 2 3 4 5 6 Avg. Avg. @ 3% O2 Stack Temp. Deg F 370.2 371.5 380.7 382.3 367.4 377.1 374.9 * * * *
Oxygen % 6.48 6.45 6.46 6.57 6.22 6.23 6.40 * * * * CO2 % 10.85 10.86 10.86 10.78 11.04 11.03 10.90 * * * * CO ppm 0.2 0.1 0 0.2 0 0 0 0 NO ppm 96.7 97 99 97.1 98.6 100.1 98.1 121.1 NOx ppm 99.5 99.9 102 100.3 102 102.8 101.1 124.8 NO2 ppm 2.8 2.8 3 3.2 3.4 2.7 3.0 3.7 SO2 ppm 72 73 73 74 72 77 73.5 90.7 Efficiency 86.4 86.3 86 86 86.4 86.2 86.2 * * * * Excess Air 41.3 41.1 41.1 42.1 39 39.1 40.6 * * * *
Table 8. Fine Particulate 2.5 µm Emission - High Filter Temperature
Fine Particulate 2.5 µm Oil-fired Residential Boiler
Run # 1 Run # 2 Run # 3 Average Fuel ASTM No. 2 ASTM No. 2 ASTM No. 2 Fuel flow gph 0.735 0.739 0.737 0.737 Btu/Min 1698 1707 1704 1703 kj / Min 1792 1801 1797 1797 Oxy % 6.48 6.56 6.18 6.41 Part Con (dry) 4.78 5.13 5.01 4.97 PM @ 3%Oxygen 5.93 6.40 6.09 6.14 mg/MJ 1.67 1.79 1.71 1.73 mg/kg 74.6 80.2 76.6 77.1 lbs per mmBtu 0.0040 lbs. per 1000 gallons 0.557
As can be seen from the average values, there appears to be a slight increase in the fine particulate emission level with the increased filter temperature. This can be observed from the average values for the low temperature of 1.62 mg/KJ with a standard deviation of 0.02 mg/KJ or 75.6 mg/kg with a standard deviation of 0.9 mg/kg as compared to the higher temperature case with 1.73 mg/KJ with a standard deviation 0.06 mg/KJ or 77.1 mg/kg with a standard deviation of 2.8 mg/kg. It is only a slight increase and would require a much more extensive study to see if this is really a trend. Somewhat similar results were obtained by Glen England as reported in Figure 2-28 and discussed on page 56 in NYSERDA Report 04-05, ‘Development of Fine Particulates Emission Factors and Speciation Profiles for Gas- and Oil-Fired Combustion Systems’. These results were in a gas-fired system. This effect is a very weak relationship and alternative
21
studies have actually indicated a decrease in particulate levels with increasing temperature in diesel engine exhausts. 4.4 Carbon content analysis
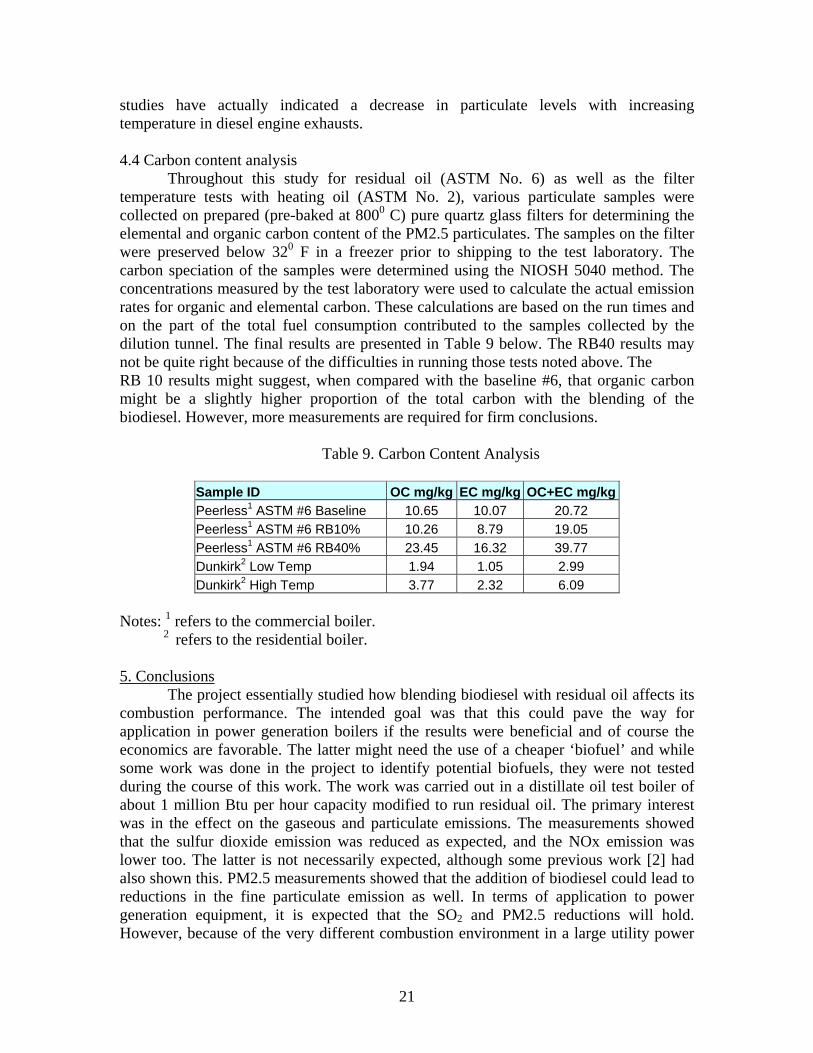
Throughout this study for residual oil (ASTM No. 6) as well as the filter temperature tests with heating oil (ASTM No. 2), various particulate samples were collected on prepared (pre-baked at 8000 C) pure quartz glass filters for determining the elemental and organic carbon content of the PM2.5 particulates. The samples on the filter were preserved below 320 F in a freezer prior to shipping to the test laboratory. The carbon speciation of the samples were determined using the NIOSH 5040 method. The concentrations measured by the test laboratory were used to calculate the actual emission rates for organic and elemental carbon. These calculations are based on the run times and on the part of the total fuel consumption contributed to the samples collected by the dilution tunnel. The final results are presented in Table 9 below. The RB40 results may not be quite right because of the difficulties in running those tests noted above. The RB 10 results might suggest, when compared with the baseline #6, that organic carbon might be a slightly higher proportion of the total carbon with the blending of the biodiesel. However, more measurements are required for firm conclusions.
Table 9. Carbon Content Analysis
Sample ID OC mg/kg EC mg/kg OC+EC mg/kg Peerless1 ASTM #6 Baseline 10.65 10.07 20.72 Peerless1 ASTM #6 RB10% 10.26 8.79 19.05 Peerless1 ASTM #6 RB40% 23.45 16.32 39.77 Dunkirk2 Low Temp 1.94 1.05 2.99 Dunkirk2 High Temp 3.77 2.32 6.09
Notes: 1 refers to the commercial boiler. 2 refers to the residential boiler. 5. Conclusions The project essentially studied how blending biodiesel with residual oil affects its combustion performance. The intended goal was that this could pave the way for application in power generation boilers if the results were beneficial and of course the economics are favorable. The latter might need the use of a cheaper ‘biofuel’ and while some work was done in the project to identify potential biofuels, they were not tested during the course of this work. The work was carried out in a distillate oil test boiler of about 1 million Btu per hour capacity modified to run residual oil. The primary interest was in the effect on the gaseous and particulate emissions. The measurements showed that the sulfur dioxide emission was reduced as expected, and the NOx emission was lower too. The latter is not necessarily expected, although some previous work [2] had also shown this. PM2.5 measurements showed that the addition of biodiesel could lead to reductions in the fine particulate emission as well. In terms of application to power generation equipment, it is expected that the SO2 and PM2.5 reductions will hold. However, because of the very different combustion environment in a large utility power
22
generation boiler, it is not obvious that the NOx reduction with addition of biodiesel will be obtained. This would have to be demonstrated by field tests, especially if a cheaper ‘biofuel’ is identified. Some tests were conducted in a residential boiler using distillate fuel (ASTM #2 home heating oil) to examine if the temperature of the filter used to collect the PM2.5 sample in the test apparatus had any bearing on the measured value. The limited number of tests suggests that, there is a small increase in weight of the fine particulates with the increase of filter temperature. A final conclusion would require more testing. 6. Acknowledgements We thank Yusuf Celebi and George Wei for considerable help in the performance of the tests and in acquiring data. Li Kou of NYPA was helpful in the discussions and coordinated NYPA’s participation. Barry Liebowitz, the Program Manager at NYSERDA, facilitated the funding and was very understanding of the practical problems encountered during the tests that led to unexpected expenditure of resources. 7. References 1. NYSERDA, Patterns and Trends New York State Energy Profiles 1993-2007, January 2009. 2. C.R. Krishna, Low Cost Bioheating Oil Application, BNL-71444-2003-IR, 2003. 3. S. Win Lee et al., Emission Reduction Potential From The Combustion Of Soy Methyl Ester Fuel Blended With Petroleum Distillate Fuel, Fuel 83 (2004) 1607–1613, 2004. 4. W. Louer, Project Manager, Biodiesel Co-Firing-Field Demonstration Results, EPRI Report 1014844, 2007. 5. Hildemann, L.M.; Cass, G.R.; Markowski, G.R. A Dilution Stack Sampler for Collection of Organic Aerosol Emissions: Design, Characterization And Field Tests. Aerosol Sci. Technol. 1989, 10, 193-204, 1989.