INVESTIGATION OF THE EFFECTIVENESS OF AN …
196
University of Kentucky University of Kentucky UKnowledge UKnowledge Theses and Dissertations--Mining Engineering Mining Engineering 2018 INVESTIGATION OF THE EFFECTIVENESS OF AN INTEGRATED INVESTIGATION OF THE EFFECTIVENESS OF AN INTEGRATED FLOODED-BED DUST SCRUBBER ON A LONGWALL SHEARER FLOODED-BED DUST SCRUBBER ON A LONGWALL SHEARER THROUGH LABORATORY TESTING AND CFD SIMULATION THROUGH LABORATORY TESTING AND CFD SIMULATION Sampurna N. Arya University of Kentucky, [email protected] Author ORCID Identifier: https://orcid.org/0000-0002-6796-3974 Digital Object Identifier: https://doi.org/10.13023/ETD.2018.074 Right click to open a feedback form in a new tab to let us know how this document benefits you. Right click to open a feedback form in a new tab to let us know how this document benefits you. Recommended Citation Recommended Citation Arya, Sampurna N., "INVESTIGATION OF THE EFFECTIVENESS OF AN INTEGRATED FLOODED-BED DUST SCRUBBER ON A LONGWALL SHEARER THROUGH LABORATORY TESTING AND CFD SIMULATION" (2018). Theses and Dissertations--Mining Engineering. 40. https://uknowledge.uky.edu/mng_etds/40 This Doctoral Dissertation is brought to you for free and open access by the Mining Engineering at UKnowledge. It has been accepted for inclusion in Theses and Dissertations--Mining Engineering by an authorized administrator of UKnowledge. For more information, please contact [email protected].
Transcript of INVESTIGATION OF THE EFFECTIVENESS OF AN …
University of Kentucky University of Kentucky
UKnowledge UKnowledge
Theses and Dissertations--Mining Engineering Mining Engineering
2018
INVESTIGATION OF THE EFFECTIVENESS OF AN INTEGRATED INVESTIGATION OF THE EFFECTIVENESS OF AN INTEGRATED
FLOODED-BED DUST SCRUBBER ON A LONGWALL SHEARER FLOODED-BED DUST SCRUBBER ON A LONGWALL SHEARER
THROUGH LABORATORY TESTING AND CFD SIMULATION THROUGH LABORATORY TESTING AND CFD SIMULATION
Sampurna N. Arya University of Kentucky, [email protected] Author ORCID Identifier:
https://orcid.org/0000-0002-6796-3974 Digital Object Identifier: https://doi.org/10.13023/ETD.2018.074
Right click to open a feedback form in a new tab to let us know how this document benefits you. Right click to open a feedback form in a new tab to let us know how this document benefits you.
Recommended Citation Recommended Citation Arya, Sampurna N., "INVESTIGATION OF THE EFFECTIVENESS OF AN INTEGRATED FLOODED-BED DUST SCRUBBER ON A LONGWALL SHEARER THROUGH LABORATORY TESTING AND CFD SIMULATION" (2018). Theses and Dissertations--Mining Engineering. 40. https://uknowledge.uky.edu/mng_etds/40
This Doctoral Dissertation is brought to you for free and open access by the Mining Engineering at UKnowledge. It has been accepted for inclusion in Theses and Dissertations--Mining Engineering by an authorized administrator of UKnowledge. For more information, please contact [email protected].

STUDENT AGREEMENT: STUDENT AGREEMENT:
I represent that my thesis or dissertation and abstract are my original work. Proper attribution
has been given to all outside sources. I understand that I am solely responsible for obtaining
any needed copyright permissions. I have obtained needed written permission statement(s)
from the owner(s) of each third-party copyrighted matter to be included in my work, allowing
electronic distribution (if such use is not permitted by the fair use doctrine) which will be
submitted to UKnowledge as Additional File.
I hereby grant to The University of Kentucky and its agents the irrevocable, non-exclusive, and
royalty-free license to archive and make accessible my work in whole or in part in all forms of
media, now or hereafter known. I agree that the document mentioned above may be made
available immediately for worldwide access unless an embargo applies.
I retain all other ownership rights to the copyright of my work. I also retain the right to use in
future works (such as articles or books) all or part of my work. I understand that I am free to
register the copyright to my work.
REVIEW, APPROVAL AND ACCEPTANCE REVIEW, APPROVAL AND ACCEPTANCE
The document mentioned above has been reviewed and accepted by the student’s advisor, on
behalf of the advisory committee, and by the Director of Graduate Studies (DGS), on behalf of
the program; we verify that this is the final, approved version of the student’s thesis including all
changes required by the advisory committee. The undersigned agree to abide by the statements
above.
Sampurna N. Arya, Student
Dr. Thomas Novak, Major Professor
Dr. Zach Agioutantis, Director of Graduate Studies
DISSERTATION
INVESTIGATION OF THE EFFECTIVENESS OF AN INTEGRATED FLOODED-BED
DUST SCRUBBER ON A LONGWALL SHEARER THROUGH LABORATORY
TESTING AND CFD SIMULATION
A dissertation submitted in partial fulfillment of the requirements for the degree of Doctor of Philosophy in the
College of Engineering at the University of Kentucky
Sampurna N. Arya
Lexington, Kentucky
By
Director: Dr. Thomas Novak, Professor of Mining Engineering
Lexington, Kentucky
2018
Copyright © Sampurna N. Arya 2018
ABSTRACT OF DISSERTATION
INVESTIGATION OF THE EFFECTIVENESS OF AN INTEGRATED FLOODED-
BED DUST SCRUBBER ON A LONGWALL SHEARER THROUGH
LABORATORY TESTING AND CFD SIMULATION
Dust generation at an underground coal mine working face continues to be a health and safety issue. Prolonged exposure to high concentrations of airborne respirable dust can cause a debilitating and often fatal respiratory disease called Black Lung. In addition, the deposition of float dust in mine return airways poses a serious safety hazard if not sufficiently diluted with inert rock dust. A localized methane explosion can transition into a self-propagating dust explosion. Since dust is a byproduct of various mining activities, such as cutting and loading, crushing, and transportation, the dust-related issues cannot be totally eliminated. However, the adverse health effects and safety concerns can be minimized if a significant amount of the generated dust is removed from the ventilation air by a mechanical device, such as a dust scrubber.
Over the last three decades, flooded-bed dust scrubbers integrated into continuous miners have been successfully applied for capturing and removing airborne dust generated at the working face. According to the National Institute for Occupational Safety and Health (NIOSH), a flooded-bed scrubber can achieve more than 90% capture and cleaning efficiencies under optimum conditions. Although flooded-bed scrubbers have proven useful in the vast majority of cases, they have not yet been successfully applied to a longwall face.
In the United States, numerous attempts have been made to reduce dust concentration at a longwall face through the application of a scrubber; but, none were successfully implemented. Encouraged by the successful use of a flooded-bed scrubber system at continuous miner faces, this research revisits the flooded-bed scrubber concept for a longwall shearer. For this investigation, a full-scale physical model of a Joy 7LS longwall shearer, modified with an integrated flooded-bed dust scrubber, was designed and

fabricated at the University of Kentucky. The scope of work for this research was limited to capturing and cleaning dust generated near the shearer headgate drum only. The mock-up was transported to, and assembled in, the full-scale longwall dust gallery at the NIOSH Pittsburgh Research Laboratory (PRL).
Tests were conducted to examine: (1) the effect of the scrubber on headgate-drum dust reduction and (2) the combined effect of the scrubber and splitter sprays on headgate drum dust reduction. Analysis of test results for the scrubber-alone condition indicates a significant dust reduction of up to 57% in the return airway and 85% in the test gallery walkway, whereas the combination of scrubber and splitter-arm sprays shows dust reduction of up to 61% and 96% in the return and walkway, respectively. These results indicate that a flooded-bed scrubber integrated into a longwall shearer can be used as a viable technique to reduce a large portion of airborne dust at a longwall face.
Subsequently, a Computational Fluid Dynamics (CFD) model of the longwall gallery and shearer was developed and validated using the results of the experimental study. The CFD simulation results are in good agreement with the experimental results with a maximum of 9.7% variation. This validated CFD model can be used in future research to predict the effects of modifications to the scrubber system, including modifications to the scrubber inlet, to optimize the scrubber design, and to evaluate the effectiveness of adding a tailgate drum dust scrubber.
Keywords: Underground Coal Mining, Dust, Longwall, Shearer, Scrubber, Computation Fluid Dynamics (CFD)
Sampurna N. Arya
April 16, 2018
INVESTIGATION OF THE EFFECTIVENESS OF AN INTEGRATED FLOODED-BED DUST SCRUBBER ON A LONGWALL SHEARER THROUGH
LABORATORY TESTING AND CFD SIMULATION
By
Sampurna N Arya
Director of Graduate Studies
Director of Dissertation Dr. Thomas Novak
Dr. Zach Agioutantis
April 16, 2018

DEDICATION
To my parents, teachers and wife

iii
ACKNOWLEDGEMENTS
There are many people without whose support this dissertation would not have been
possible. First, I would like to thank my advisor, Dr. Thomas Novak, for providing me
with the opportunity to work on this research and guiding me throughout my study at the
University of Kentucky. Next, I wish to express my appreciation to the other members of
my advisory committee, Dr. Joseph Sottile, Dr. Kozo Saito, and Dr. Steven Schafrik for
their suggestions and support in completing this dissertation. I would also like to thank
Dr. Chad Wedding for his guidance, advice, insight, and knowledge provided during his
tenure at the University of Kentucky.
I am grateful for the generous support from the National Institute for Occupational Safety
and Health (NIOSH) for the laboratory testing. Mr. James Rider and Mr. Jay Colinet’s
comments and assistance were invaluable. I would like to thank the Alpha Foundation for
funding this research (grant number AFC113-10). A note of appreciation is extended to
personnel from Joy Global, Inc (now Komatsu American Corp.). and the Tunnel Ridge
Longwall Mine (Alliance Coal, LLC) for their feedback and recommendations. The
discussions and input from Mr. Joe Defibaugh were very helpful. Furthermore, the expert
technical advice of the flooded-bed scrubber inventor Mr. Daniel Moynihan is greatly
appreciated.
Special thanks to Dr. Zach Agioutantis, Director of Graduate Studies in the Department
of Mining Engineering at the University of Kentucky, for his encouragement and help.
Thanks to the department staff Mrs. Kathy Kotora, Mrs. Megan Doyle, Mrs. Alycia
Tidrick, and Dr. Josh Calnan for their assistance.
I also want to thank the department laboratory supervisor, Mr. Edward Thompson, for his
help during the fabrication of the full-scale longwall shearer prototype.

iv
I would like to give my sincere thanks to my friends Ashish Kumar, Adam Levy, Bradley
Coleman, Kayla Mayfield, Alind Chandra, Oscar Velasquez, Ravi Ray, Anand Kumar
and other fellow students, who have all given me their support and encouragement along
the way. Last but not least, a very special appreciation goes to my wife Priyansh Singh,
who cheered me on and unconditionally kept my attention focused towards completion
and success.
v
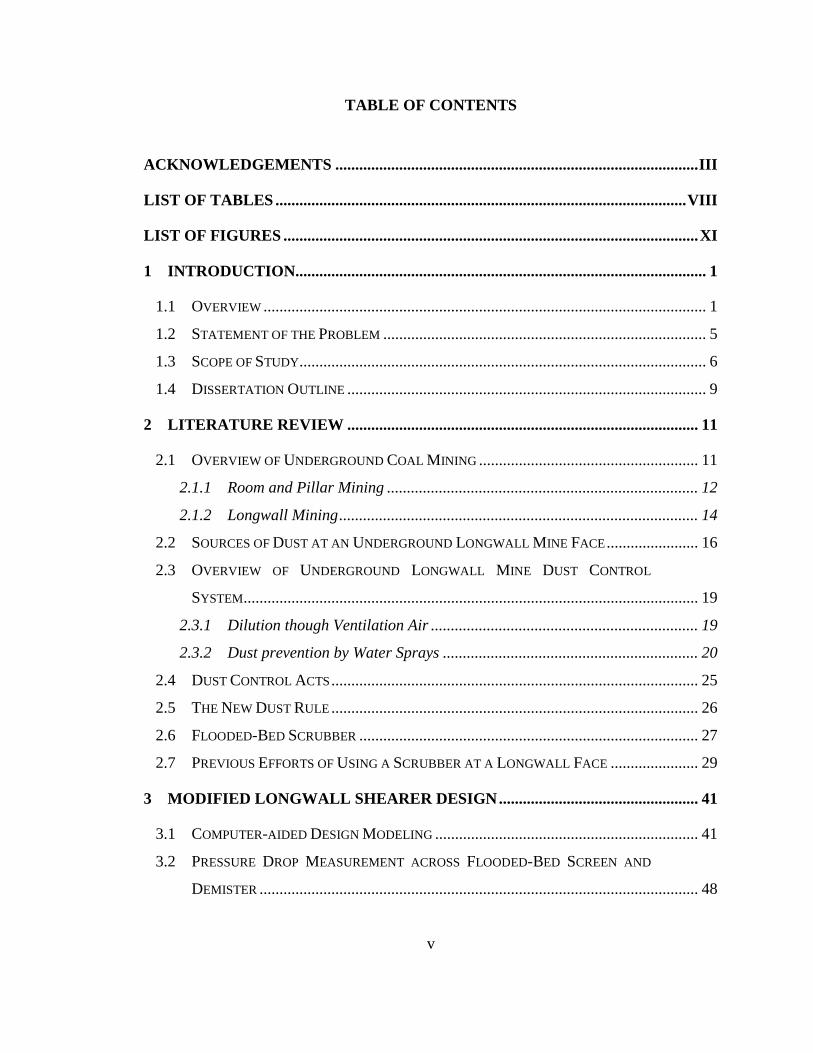
TABLE OF CONTENTS
ACKNOWLEDGEMENTS ........................................................................................... III
LIST OF TABLES ....................................................................................................... VIII
LIST OF FIGURES ........................................................................................................ XI
1 INTRODUCTION....................................................................................................... 1
1.1 OVERVIEW ............................................................................................................... 1
1.2 STATEMENT OF THE PROBLEM ................................................................................. 5
1.3 SCOPE OF STUDY ...................................................................................................... 6
1.4 DISSERTATION OUTLINE .......................................................................................... 9
2 LITERATURE REVIEW ........................................................................................ 11
2.1 OVERVIEW OF UNDERGROUND COAL MINING ....................................................... 11
2.1.1 Room and Pillar Mining .............................................................................. 12
2.1.2 Longwall Mining .......................................................................................... 14
2.2 SOURCES OF DUST AT AN UNDERGROUND LONGWALL MINE FACE ....................... 16
2.3 OVERVIEW OF UNDERGROUND LONGWALL MINE DUST CONTROL
SYSTEM .................................................................................................................. 19
2.3.1 Dilution though Ventilation Air ................................................................... 19
2.3.2 Dust prevention by Water Sprays ................................................................ 20
2.4 DUST CONTROL ACTS ............................................................................................ 25
2.5 THE NEW DUST RULE ............................................................................................ 26
2.6 FLOODED-BED SCRUBBER ..................................................................................... 27
2.7 PREVIOUS EFFORTS OF USING A SCRUBBER AT A LONGWALL FACE ...................... 29
3 MODIFIED LONGWALL SHEARER DESIGN .................................................. 41
3.1 COMPUTER-AIDED DESIGN MODELING .................................................................. 41
3.2 PRESSURE DROP MEASUREMENT ACROSS FLOODED-BED SCREEN AND
DEMISTER .............................................................................................................. 48
vi
3.2.1 Experimental Set-up ..................................................................................... 48
3.2.2 Experimental Procedure .............................................................................. 50
3.2.3 Results .......................................................................................................... 52
4 PROTOTYPE FABRICATION .............................................................................. 55
5 LABORATORY TESTING ..................................................................................... 77
5.1 LABORATORY SET-UP ............................................................................................ 77
5.2 EXPERIMENTAL DESIGN ......................................................................................... 83
5.3 EXPERIMENTAL PROCEDURE .................................................................................. 86
5.4 EXPERIMENTAL RESULTS ....................................................................................... 91
5.4.1 Analysis of Flooded-bed Scrubber Performance ....................................... 101
5.4.2 Combined Effect of Flooded-bed Scrubber and Splitter Sprays ................ 106
6 CFD MODELING ................................................................................................... 110
6.1 PRELIMINARY AIR QUANTITY SURVEY AND ITS CFD VALIDATION ..................... 111
6.1.1 Survey Procedure ....................................................................................... 112
6.1.2 CFD Simulation ......................................................................................... 117
6.1.3 Results and Discussion .............................................................................. 125
6.2 CFD VALIDATION OF DUST CAPTURE EXPERIMENT TEST RESULTS .................... 128
6.2.1 CFD Simulation ......................................................................................... 129
6.2.2 Results and Discussion .............................................................................. 135
7 SUMMARY AND CONCLUSION ....................................................................... 141
7.1 FUTURE WORK .................................................................................................... 143
APPENDICES ............................................................................................................... 145
APPENDIX A: RAW DATA FROM EXPERIMENT ............................................................... 145
APPENDIX B: REGRESSION MODEL PARAMETER ESTIMATES FOR SCRUBBER
PERFORMANCE. .................................................................................................... 153
APPENDIX C: REGRESSION MODEL PARAMETER ESTIMATES FOR COMBINED
SCRUBBER AND SPLITTER SPRAYS PERFORMANCE. ............................................. 161

vii
REFERENCES .............................................................................................................. 169
VITA............................................................................................................................... 175
viii
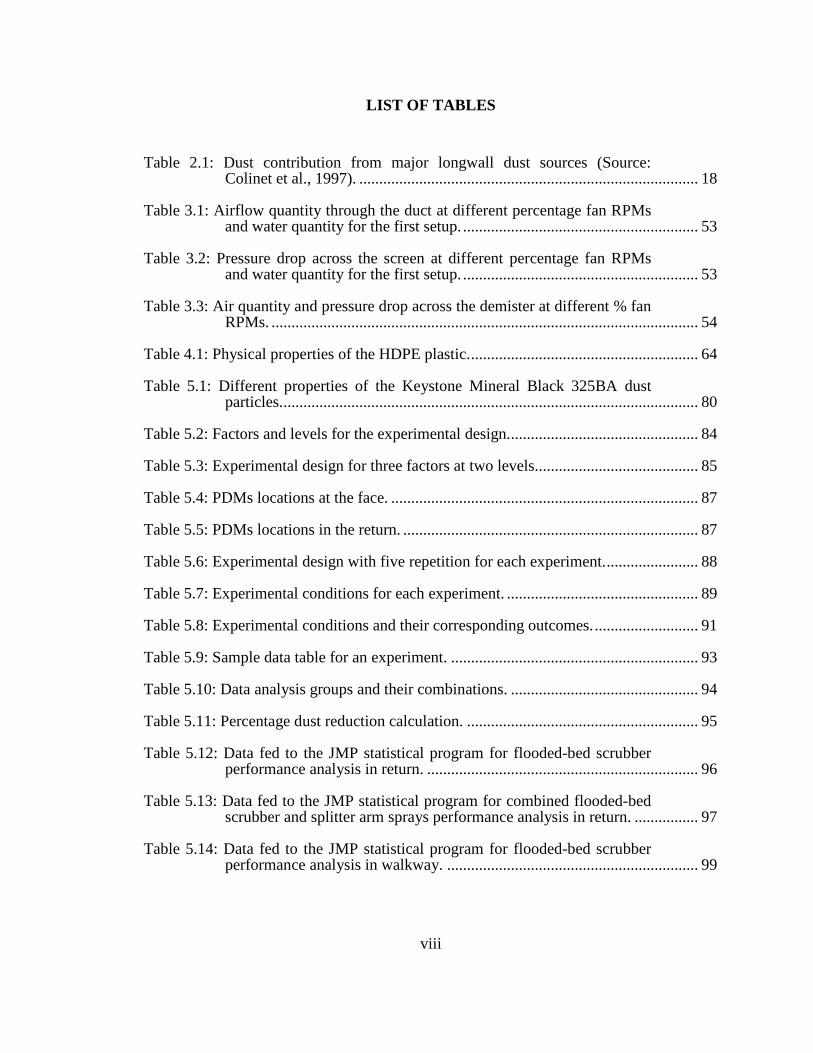
LIST OF TABLES
Table 2.1: Dust contribution from major longwall dust sources (Source: Colinet et al., 1997). ..................................................................................... 18
Table 3.1: Airflow quantity through the duct at different percentage fan RPMs and water quantity for the first setup. ........................................................... 53
Table 3.2: Pressure drop across the screen at different percentage fan RPMs and water quantity for the first setup. ........................................................... 53
Table 3.3: Air quantity and pressure drop across the demister at different % fan RPMs. ........................................................................................................... 54
Table 4.1: Physical properties of the HDPE plastic. ......................................................... 64
Table 5.1: Different properties of the Keystone Mineral Black 325BA dust particles. ........................................................................................................ 80
Table 5.2: Factors and levels for the experimental design. ............................................... 84
Table 5.3: Experimental design for three factors at two levels. ........................................ 85
Table 5.4: PDMs locations at the face. ............................................................................. 87
Table 5.5: PDMs locations in the return. .......................................................................... 87
Table 5.6: Experimental design with five repetition for each experiment. ....................... 88
Table 5.7: Experimental conditions for each experiment. ................................................ 89
Table 5.8: Experimental conditions and their corresponding outcomes. .......................... 91
Table 5.9: Sample data table for an experiment. .............................................................. 93
Table 5.10: Data analysis groups and their combinations. ............................................... 94
Table 5.11: Percentage dust reduction calculation. .......................................................... 95
Table 5.12: Data fed to the JMP statistical program for flooded-bed scrubber performance analysis in return. .................................................................... 96
Table 5.13: Data fed to the JMP statistical program for combined flooded-bed scrubber and splitter arm sprays performance analysis in return. ................ 97
Table 5.14: Data fed to the JMP statistical program for flooded-bed scrubber performance analysis in walkway. ............................................................... 99

ix
Table 5.15: Data fed to the JMP statistical program for combined flooded-bed scrubber and splitter arm sprays performance analysis in walkway. ......... 100
Table 5.16: Regression model parameter estimates for return. ...................................... 102
Table 5.17: Comparison of regression model results with experiment results for all treatments. ............................................................................................. 103
Table 5.18: Regression model parameter estimates for walkway (stations 2, 3, and 8) . ........................................................................................................ 104
Table 5.19: Comparison of regression model results with experiment results for all treatments. ............................................................................................. 105
Table 5.20: Regression model parameter estimates for return. ...................................... 106
Table 5.21: Comparison of regression model results with experiment results for all treatments. ............................................................................................. 107
Table 5.22: Regression model parameter estimates for walkway (stations 2, 3, and 8). ......................................................................................................... 108
Table 5.23: Comparison of regression model results with experiment results for all treatments. ............................................................................................. 109
Table 6.1: Quantity through scrubber at different fan RPMs. ........................................ 112
Table 6.2: Results of air quantity survey showing quantity through different cross-sections at different scrubber fan speeds. ......................................... 115
Table 6.3: Results of air velocity survey showing velocities at six points at each of four cross-sections at 100% scrubber fan capacity. ....................... 115
Table 6.4: Results of air velocity survey showing velocities at six points at each of four cross-sections at 50% scrubber fan capacity. ......................... 116
Table 6.5: Results of air velocity survey showing velocities at six points at each of four cross-sections at 0% scrubber fan capacity. ........................... 116
Table 6.6: Results of the CFD simulation for the quantity of air passing through each cross-section. ........................................................................ 123
Table 6.7: Results of the CFD simulation for velocity at six points at each cross-section at 100% of maximum fan speed. .......................................... 124
Table 6.8: Results of the CFD simulation for velocity at six points at each cross-section at 50% of maximum fan speed. ............................................ 124
Table 6.9: Results of the CFD simulation for velocity at six points at each cross-section at 0% of maximum fan speed. .............................................. 125
x
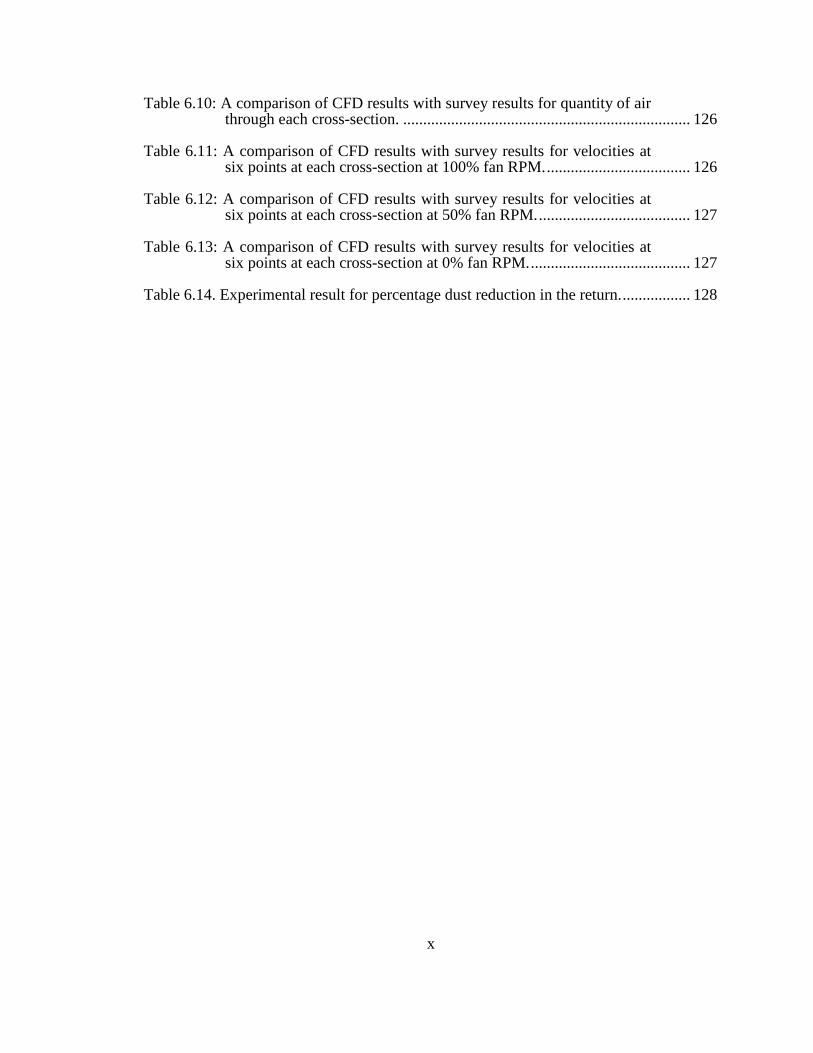
Table 6.10: A comparison of CFD results with survey results for quantity of air through each cross-section. ........................................................................ 126
Table 6.11: A comparison of CFD results with survey results for velocities at six points at each cross-section at 100% fan RPM. .................................... 126
Table 6.12: A comparison of CFD results with survey results for velocities at six points at each cross-section at 50% fan RPM. ...................................... 127
Table 6.13: A comparison of CFD results with survey results for velocities at six points at each cross-section at 0% fan RPM. ........................................ 127
Table 6.14. Experimental result for percentage dust reduction in the return. ................. 128

xi
LIST OF FIGURES
Figure 1.1: CWP prevalence among examinees employed at the U.S. underground coal mines [6]. ........................................................................... 3
Figure 2.1: A cross-sectional view of an underground room and pillar mine with mining equipment (Source: The WV Coal seam). ............................... 12
Figure 2.2: A Joy 12CN27 continuous miner (Source: Joy Global product details). ......................................................................................................... 13
Figure 2.3: A 3-D view of the longwall mining process (Source: Energy Information Administration). ....................................................................... 14
Figure 2.4: A longwall shearer in operation at a real longwall face (Source: West Virginia Public Broadcasting). ............................................................ 15
Figure 2.5: Six main sources of dust in an underground longwall mine (Source: Colinet et al., 1997). ..................................................................................... 18
Figure 2.6: Effect of water droplet size on dust suppression (Source: Dust Boss). ............................................................................................................ 21
Figure 2.7: Performance of different types of nozzles capturing airborne dust (Source: Kissell, 2003). ................................................................................ 22
Figure 2.8: Shearer operator dust exposure from the spray generated airflow carrying dust (Source: Kissell, 2003). .......................................................... 23
Figure 2.9: Drum sprays in operation at a longwall face (Source: KRUMMENAUER). .................................................................................... 24
Figure 2.10: General cross-section view of a flooded-bed scrubber. ............................... 28
Figure 2.11. Schematic of flooded-bed scrubber within the Eickhoff 340L double-drum longwall shearer showing inlets, air duct, and dust collector [47]. ............................................................................................... 30
Figure 2.12. Ventilated-drum scrubber schematic [50]. ................................................... 32
Figure 2.13. Schematic of ventilated-cowl scrubber [52]. ................................................ 33
Figure 2.14. Spot scrubber [53]. ....................................................................................... 34
Figure 2.15. Plan view schematic of spot scrubber mounted on face side of the shearer [53]. .................................................................................................. 35
Figure 2.16. Front view schematic of spot scrubber mounted on the face side of the shearer [53]. ............................................................................................ 35

xii
Figure 2.17: Foster-Millar’s shearer mounted scrubber design [53]. ............................... 36
Figure 2.18. Scrubber with twin fluid atomizer [55]. ....................................................... 37
Figure 2.19. Schematic of scrubber module attached to a longwall shearer [56]. ............ 38
Figure 2.20. Plan view of the scrubber module attached to a longwall shearer [56]. .............................................................................................................. 38
Figure 2.21. A 3-D drawing of scrubber installed on a longwall shearer. ........................ 40
Figure 3.1: Original shearer drawing obtained from Joy Global, Inc. .............................. 42
Figure 3.2: Simplified shearer drawing developed at the University of Kentucky. ...................................................................................................... 43
Figure 3.3: Shearer drawing with three newly added components. .................................. 44
Figure 3.4: Shearer drawing with inlet and outlet ducts. .................................................. 45
Figure 3.5: Modified Joy 7LS shearer with flooded-bed scrubber. .................................. 47
Figure 3.6: 3D drawing showing the screen and the water sprays in the duct. ................. 49
Figure 3.7: 3D drawing of the second setup (the screen was replaced with the demister). ...................................................................................................... 50
Figure 3.8: Locations of the measurement points on the cross-section upwind the screen. ..................................................................................................... 51
Figure 3.9: Relationship between multi-point traverse and single-point measurements. .............................................................................................. 52
Figure 4.1: 3-D model of the main body of the shearer and its corresponding framework model. ......................................................................................... 57
Figure 4.2: 3-D model of the head gate drive of the shearer and its corresponding framework model. ................................................................. 57
Figure 4.3: 3-D model of the ranging arm of the shearer and its corresponding framework model. ......................................................................................... 58
Figure 4.4: 3-D model of the main body of the shearer and its corresponding prototype model. ........................................................................................... 59
Figure 4.5: 3-D model of the head gate drive of the shearer and its corresponding prototype model. ................................................................... 59
Figure 4.6: 3-D model of the ranging arm of the shearer and its corresponding prototype model. ........................................................................................... 60
xiii
Figure 4.7: 3-D prototype model of the scrubber module. ............................................... 61
Figure 4.8: 3-D prototype model of the fan module. ........................................................ 61
Figure 4.9: 3-D prototype model of the connecting duct module. .................................... 62
Figure 4.10: 3-D prototype model of the inlet duct module. ............................................ 62
Figure 4.11: 3-D prototype model of the outlet duct module. .......................................... 63
Figure 4.12: From left to right: 80/20 extrusion, corner bracket, and joining plate. ............................................................................................................. 63
Figure 4.13: Different color HDPE plastics. ..................................................................... 64
Figure 4.14: Fabricated main body prototype (in orange) stored behind the headgate drive structure. ............................................................................... 65
Figure 4.15: Fabricated headgate drive prototype. ........................................................... 65
Figure 4.16: Fabricated headgate ranging arm prototype. ................................................ 66
Figure 4.17: An assembly of headgate ranging arm and headgate drive modules. ........................................................................................................ 66
Figure 4.18: An assembly of headgate ranging arm, headgate drive, and main body modules. ............................................................................................... 67
Figure 4.19: Fabrication of scrubber module prototype. .................................................. 68
Figure 4.20: Complete scrubber module prototype. ......................................................... 68
Figure 4.21: Inside view of the scrubber module. ............................................................ 69
Figure 4.22: Centrifugal fan for the flooded-bed scrubber system. .................................. 70
Figure 4.23: Headgate drum motor. .................................................................................. 70
Figure 4.24: Processes involved in creating the shearer drum.......................................... 71
Figure 4.25: Smoothening of the foam cylinder using a router jig. .................................. 72
Figure 4.26: Spiral scroll bolted and glued to the foam drum. ......................................... 72
Figure 4.27: Cutting bits fastened to the spiral scroll. ...................................................... 73
Figure 4.28: Final headgate drum prototype coated with Rhino Lining. .......................... 73
Figure 4.29: Control panel installed in the main body module......................................... 74
Figure 4.30: HMI display for PLC control. ...................................................................... 75
xiv
Figure 4.31: Front view of the modified Joy 7LS full-scale prototype. ........................... 76
Figure 4.32: Front view of the modified Joy 7LS full-scale prototype. ........................... 76
Figure 5.1: A cross-sectional view of the NIOSH-PRL longwall dust gallery. ................ 77
Figure 5.2: Longwall dust gallery at NIOSH-PRL. .......................................................... 78
Figure 5.3: Particle size distribution of the Keystone Mineral Black 325BA dust particles. ................................................................................................ 79
Figure 5.4: Dust injection locations in the longwall dust gallery. .................................... 80
Figure 5.5: A diagram of the dust injection system outside the longwall dust gallery. .......................................................................................................... 81
Figure 5.6: A diagram of the dust injection system inside the longwall dust gallery. .......................................................................................................... 81
Figure 5.7: Personal Dust Monitor (PDM). ...................................................................... 82
Figure 5.8: Schematic of the Thermo Scientific PDM 3700 [59]. .................................... 83
Figure 5.9: 3-D drawings of longwall shearer experimental setup with and without inlet duct extension. ......................................................................... 84
Figure 5.10: PDMs locations in the dust gallery............................................................... 86
Figure 5.11: Timeline for an example experiment considering starting time zero minute. .................................................................................................. 90
Figure 6.1: A 3-D CAD drawing of the PRL longwall dust gallery. .............................. 111
Figure 6.2: Quantity survey cross-section locations ....................................................... 114
Figure 6.3: Cross-section of the longwall panel with 0.6096 m x 0.6096 m grid and measurement points. ............................................................................ 114
Figure 6.4: Mesh in the computational domain showing tetrahedral volume mesh and prism boundary layers. ............................................................... 119
Figure 6.5: Cross-section of the longwall dust gallery (not to scale) showing the locations of point of average velocity measurement for the mesh independence test. ............................................................................. 120
Figure 6.6: . Comparison of average velocity distribution along the Line_1 for the four cases of mesh independence study. ............................................... 121
Figure 6.7: Comparison of average velocity distribution along the Line_2 for the four cases of mesh independence study. ............................................... 121

xv
Figure 6.8: Average velocity gradients at the four cross-section.................................... 123
Figure 6.9: Computational mesh showing tetrahedral volume mesh and prism boundary layers. ......................................................................................... 130
Figure 6.10: Locations of point of average velocity measurement for the mesh independence study. ................................................................................... 131
Figure 6.11: Comparison of average velocity at five points for mesh independence study along the line 1. .......................................................... 132
Figure 6.12: Comparison of average velocity at five points for mesh independence study along the line 2. .......................................................... 132
Figure 6.13: Comparison of average velocity at five points for different turbulence model along the line 1. ............................................................. 133
Figure 6.14: Comparison of average velocity at five points for four different turbulence model along the line 2. ............................................................. 134
Figure 6.15: Velocity gradient at seven cross-sections perpendicular to the length of the longwall panel (scrubber OFF). ............................................ 136
Figure 6.16: Velocity gradient at seven cross-section perpendicular to the length of the longwall panel (scrubber ON). .............................................. 136
Figure 6.17: Velocity gradient on a plane parallel to the floor and passing through the center of the inlet and outlet ducts (scrubber OFF). ................ 137
Figure 6.18: Velocity gradient on a plane parallel to the floor and passing through center of the inlet and outlet ducts (scrubber ON). ....................... 137
Figure 6.19: Dust pattern in the computational domain in saturation state (Scrubber fan OFF). .................................................................................... 138
Figure 6.20: Dust pattern in the computational domain in saturation state (Scrubber fan ON). ..................................................................................... 139
Figure 6.21: Comparison of experimental and CFD simulation results for the eight sets of experiments performed in the PRL longwall dust gallery. ........................................................................................................ 140
1
1 INTRODUCTION
1.1 Overview
Dust generation is one of the major environmental issues faced by an underground coal
mine operator in the United States. It is an unwanted result of various mining activities,
mainly cutting, crushing, and transportation [1]. Dust, by general definition, are finely-
divided solid particles ranging in size from below 1 µm up to around 100 µm, which may
be or become airborne, depending on their origin, physical characteristics and ambient
conditions [2]. In mining, coal dust, referred to as “mine size coal,” are particles that pass
through a U.S. Standard No. 20 sieve (850 µm) with 20% passing through a 200 mesh
sieve (75 µm) [3].
The effect of dust on the health of mining personnel has had a significant impact.
Prolonged exposure to airborne respirable dust (dust particles having an aerodynamic
diameter < 10 µm) can cause coal workers’ pneumoconiosis (CWP), silicosis,
emphysema, and chronic bronchitis, collectively known as black lung [4]. Black lung, an
incurable disease, results in a buildup of inhaled dust in the lungs that can neither be
destroyed nor removed from the body and causes lung damage, permanent disability, and
death [5]. The severity of the disease increases with the length of exposure, its intensity,
and size of inhaled particles. According to the National Institute for Occupational Safety
and Health (NIOSH), black lung killed more than 10,000 miners between 1995 and 2004
[6]. Another report by the Mine Safety and Health Administration (MSHA) states that
since 1968 black lung has caused or contributed to the deaths of 76,000 coal miners [7].
In addition to being a devastating health issue, coal dust is also a safety issue to the
underground coal miners. If the generated dust is not captured at the face, it is dispersed
into the mine atmosphere through the ventilating air and deposited downwind on the
return entries’ surfaces. In the event of a methane explosion, the propagating shock wave

2
traveling down the entry in the unburned zone, under a high turbulent condition,
disperses the coal dust in the mine airstream and makes the environment conducive to
combustion. Subsequently, the moving explosion flame meets the dispersed, combustible
coal dust particles, ignites them, and creates an explosive atmosphere [8]. If the entries
are insufficiently diluted with rock dust (usually pulverized limestone), which acts as a
heat sink and reduces heat transfer between coal dust particles, the less dangerous
localized methane explosion can trigger a catastrophic secondary coal dust explosion
resulting in more damage to life and property [9], [10]. The Jim Walters No. 5 Mine and
the Upper Big Branch Mine disasters, which together killed 42 people and resulted in
damage worth millions of dollars in property, are examples of coal dust explosions [11]–
[13]. The problem of dust in underground coal mines is so serious that “Reducing
respiratory diseases in mine workers by reducing exposure to airborne contaminants” has
become the top strategic goal of NIOSH’s mining research program [14].
The first major step taken against black lung was the enactment of the Federal Coal Mine
Health and Safety Act of 1969, also known as the Coal Act, in the aftermath of the
Farmington mine disaster. The act provided many protections for coal miners including
dust exposure limits and the workers’ health surveillance program. It required each
underground coal mine to maintain respirable dust limits at or below 2.0 mg/m3 in an
active working area and 1.0 mg/m3 in the intake entries. The enactment of this act
resulted in a decrease in the prevalence of CWP for underground coal miners. However,
after a continued period of decline from 1970 to 1995, a rising trend of CWP from 1995
to 2006 prompted the federal government to promulgate more stringent dust regulations
(Figure 1.1) [6]. Consequently, in 2009, MSHA launched the “End Black Lung - ACT
NOW” campaign to tackle black lung through rulemaking, enhanced enforcement,
collaborative outreach, education, and training [15]. Subsequently, in 2010, MSHA
proposed a new dust standard to improve underground miners’ health protection by
lowering their exposure to respirable coal dust [16]. The new dust standard was put into
effect on August 1, 2014, and fully implemented on August 1, 2016. It mandated the

3
reduction of the average dust level at the working face to 1.5 mg/m3 and in intake entries
to 0.5 mg/m3 [7].
Figure 1.1: CWP prevalence among examinees employed at U.S. underground coal
mines [6].
Since the implementation of the new stringent dust rule, it has become even more
challenging for underground coal mine operators to meet the permissible dust level
requirements using the traditional dust control techniques without interrupting
production. Longwall mines, in particular, have more trouble as they are historically
known to have difficulty maintaining even the old mandated dust standards, let alone new
standards [17]. The high production rate and the continuous operation make longwall
mines more vulnerable to high levels of dust generation and challenging dust related
issues. An analysis of dust samples collected from longwall designated occupation
personnel over a four year period (1995 to 1999) showed overexposure in 20% of all
cases [17]. Similar studies during the period of 2000 through 2004 and 2004 through
2008 showed 14% and 11% cases of overexposure, respectively [18]–[20]. Therefore,
there is a need to improve the existing dust control techniques or to bring new dust
control techniques to longwall mines.

4
The popular dust control techniques at an underground mine face include dilution through
ventilation air, suppression by water sprays, and dust capturing through a machine
mounted wet scrubber [21], [22]. Currently, a flooded-bed scrubber is used with a
continuous miner to capture and clean the dust generated at a continuous miner face. A
study conducted by NIOSH stated that a flooded-bed scrubber could achieve a cleaning
efficiency of 90% at a continuous miner face under its optimum condition [23]. A recent
study on the performance of a flooded-bed scrubber shows a reduction of respirable dust
concentration by 91%, 86%, and 40% in three different mines A, B, and C, respectively
[24]. A relatively lower reduction in the case of mine C was attributed to that mine’s
adverse geologic conditions, which resulted in a collection of fewer samples and a large
deviation in data.
Since the 1970s, many attempts have been made to integrate a scrubber system within a
longwall shearer, but none of them have been successfully implemented at an operating
longwall face. Encouraged by the successful use of the flooded-bed scrubber system at
continuous miner faces, the flooded-bed scrubber concept for a longwall shearer was
revisited. The Department of Mining Engineering at the University of Kentucky designed
a modified shearer that included a flooded-bed scrubber, and fabricated a full-scale
physical model of the modified design. The prototype was transported and assembled in
the longwall dust gallery in the Pittsburgh Research Laboratory (PRL) of NIOSH for
testing the dust capture efficiency of the proposed scrubber. A full-factorial experiment
with three factors, namely inlet extension, scrubber quantity, and face velocity, each at
low and high levels, was designed to test the effect of individual factors and their
interactions on scrubber capture efficiency. The experimental design for three factors at
two levels resulted in eight different test conditions. Tests performed on the eight test
conditions showed a dust reduction of up to 61% in the return entry and 96% in the
walkway of the longwall dust gallery.
5
A subsequent CFD study was performed to validate the CFD model of the test set-up
with the experimental results. The purpose was to use the validated CFD model to predict
the dust reduction results for additional factors at additional levels because laboratory
testing for additional test conditions was not possible due to constraints, such as time,
cost, and availability of the longwall dust gallery. The CFD simulation results were in
agreement with the experimental results with a maximum deviation of 9.7%.
1.2 Statement of the Problem
Dust control is one of the most difficult challenges for underground coal mine operators,
especially longwall mine operators. Elevated concentrations of dust, particularly fine
respirable dust, are potential health and safety hazards. The problem is more prominent at
a working face of a longwall mine, where coal is extracted. The coal cutting machine
(shearer) generates high concentrations of dust, accounting for over 50% of the total
respirable dust generated at the face [17], [20], [21].
The generated dust becomes airborne if not captured by water droplets from water sprays.
Airborne dust is inhaled by mine workers working at the face, and permeates downwind
in the return entries. Continuous overexposure to respirable dust is a major health risk for
underground miners. It causes chronic and irreversible respiratory lung disease, such as
Coal Workers Pneumoconiosis (CWP), also known as black lung. Another area of
concern is dust deposition on the return entries surfaces, which can also be very
dangerous if not diluted sufficiently with rock dust. It can cause a severe safety hazard if
a methane explosion triggers a subsequent coal dust explosion. The severity of the dust
issue can be measured through a MSHA report that states that black lung has caused or
contributed to the deaths of 76,000 coal miners since 1968 [7]. Furthermore, disasters,
such as the Upper Big Branch Mine, the Jim Walter Resources Mine, and many similar
mine incidents reported in the United States and across the globe are examples of
methane explosions transitioning to dust explosions.

6
Despite the fact that several successful efforts have been made to reduce the dust
concentration at the working face of an underground mine, it still presents a serious threat
to the personnel working underground. A study conducted by NIOSH has shown that
after a continued period of decline (1970–1995), the occurrences of CWP have been on
the rise in recent years (1995-2006) [6]. The rising trend of black lung in underground
coal workers and the Upper Big Branch Mine disaster forced U.S. lawmakers to enact a
new dust regulation for underground coal mines. Federal regulations currently require
limiting dust exposure to 1.5 mg/m3 at a longwall face.
The longwall mines in the U.S. were already finding it hard to maintain the previous dust
limits [17]. The advent of the new dust regulations has made it increasingly difficult and
has put the focus back on the development of new dust control technologies. Also,
reducing dust concentration is critical to improving underground miners’ satisfaction.
Hence, research needs to be done to develop a new dust control technique for application
to a longwall face.
1.3 Scope of Study
Over the years since the first introduction of the modern longwall mining method in the
United States mining industry, dust control methods and operating practices have
progressed with the advancement in longwall mining technology and rising production in
order to control the respirable dust generation and its exposure to underground longwall
mine personnel. A series of benchmark surveys conducted by NIOSH to identify
operating practices and the types of control being used in the U.S. longwall mines found
the utilization of a wide variety of dust control technologies across the longwall industry
[19], [20]. The variation was mainly due to different operating conditions and equipment.
However, dilution through ventilation air and suppression by water sprays were the most
common and effective technologies.

7
Unlike a longwall face, a continuous miner face has the advantage of using a machine-
mounted flooded-bed scrubber to capture the dust generated at the face. This technique
has been very effective and is currently being used with almost all continuous miners.
According to NIOSH, a flooded-bed scrubber integrated within a continuous miner can
achieve a maximum 91% capture and 90% cleaning efficiencies [24], [23]. Since a
shearer generates over 50% of the total respirable dust at the face, controlling shearer
generated dust would help in reducing dust concentration at a longwall face. Therefore,
the research focuses on the use of the flooded-bed scrubber system within a longwall
shearer to capture dust at its generation source before the dust disperses into the air and
becomes airborne.
The research performed includes the following tasks:
1. Representatives from the U.S. longwall industry, mining research institute,
machine manufacturing company, and continuous miner flooded-bed scrubber
inventors were collaborated to develop a flooded-bed scrubber for a longwall
shearer.
2. A design of a longwall shearer modified with an onboard flooded-bed scrubber
system was prepared from data gathered from the machine manufacturer, Joy
Global Ltd. (now Komatsu Ltd.). The design included components of a Joy 7LS
longwall shearer along with modules for a flooded-bed scrubber system.
3. The design was incorporated into the fabrication of a full-scale physical model of
the Joy 7LS shearer integrated with a flooded-bed scrubber system. However, to
build the flooded-bed scrubber system, it was necessary to determine the size of
the scrubber fan. Therefore, this research task was completed in two stages:
a. A wind tunnel study was performed to measure the pressure drop across a
flooded-bed screen and a demister, and results of the study were used to
select a centrifugal fan for the flooded-bed scrubber system.

8
b. A full-scale physical model of the modified Joy 7LS longwall shearer was
fabricated in the ventilation lab at the Department of Mining Engineering,
University of Kentucky mainly using 80/20 aluminum extrusion for the
body frame (skeleton) and HDPE plastic for the body skin.
4. Experiments were carried out in the longwall dust gallery at the PRL of NIOSH to
measure the capture efficiency of the flooded-bed scrubber system. The following
subtasks were performed under this task:
a. An air quantity survey was conducted to quantify airflow distribution in
the dust gallery.
b. Shakedown tests were performed to determine that the flooded-bed
scrubber was functioning as predicted, before developing an extensive test
protocol.
c. A full-factorial experiment with three factors at two levels was designed to
investigate the effects of the factors on dust capture.
d. Based on the experimental design, tests were conducted and results were
analyzed to examine the effects of different experimental factors and their
interactions on the dust capture efficiency.
5. A CFD study was performed to validate the CFD model with the experimental
results.
a. Steady-state simulations were carried out to establish the airflow in the
longwall dust gallery. The CFD model was validated with air quantity
survey data.
b. Transient-state simulations were performed to simulate dust in the
longwall dust gallery. The model was validated with experimental data.
9
c. The validated CFD model was used to test the dust capture on a half-scale
model.
6. Research recommendations for future work are made based on the findings of this
study and feedback obtained from industry and manufacturer.
1.4 Dissertation Outline
The first chapter in this dissertation introduces the dust-related issues that the U. S.
underground coal mining industry has been facing for decades. It highlights Black Lung
disease and the potential for a coal dust explosion as major consequences of high dust
concentration at a working face and provides supporting evidence, such as the trend of
CWP in recent years and recent cases of coal dust explosions. The chapter presents the
benefit of using a flooded-bed scrubber with a continuous miner and states that the
integration of a flooded-bed dust scrubber within a longwall shearer may achieve similar
success.
Chapter 2 presents a literature review of topics relevant to this research. It provides an
overview of underground coal mining methods, as well as dust sources and dust control
systems in underground longwall mines. It discusses federal underground coal mine dust
control acts, including the most recent amendment. Furthermore, it provides the technical
details of a flooded-bed scrubber followed by a discussion of previous attempts to use a
flooded-bed scrubber within a longwall shearer.
Chapter 3 provides the technical details of the flooded-bed integrated modified longwall
shearer design. It discusses the factors considered in designing the additional components
that were added to the JOY 7LS longwall shearer. It also discusses an experiment
performed to measure pressure drop across a flooded-bed screen and a demister to select
a fan for the shearer’s scrubber.
10
Chapter 4 discusses fabrication of the physical model of the modified longwall shearer at
the University of Kentucky. It presents the process involved and difficulties faced during
fabrication. It provides dimensions of the JOY 7LS shearer modules along with the
dimensions of additional modules added for the flooded-bed dust scrubber. The chapter
also highlights the control systems used for shearer operation.
Chapter 5 deals with laboratory testing of the modified shearer to measure the effect of
the flooded-bed scrubber on dust reduction at a longwall face. It describes the longwall
dust gallery used for modified shearer testing at the Pittsburgh Research Laboratory
(PRL). It also discusses the test set-up and different test facilities used to perform the
experiments. Furthermore, the chapter discusses the experimental design that explains the
factors considered for testing, followed by the procedure employed for the experiments.
Moreover, the experimental results and a detailed statistical analysis of the results are
presented.
Chapter 6 presents the CFD modeling of the dust gallery at PRL. It discusses the
boundary condition and assumptions made for the CFD study. The chapter presents the
results of a mesh independence study performed to minimize discretization error, as well
as to ensure that the results are independent of mesh resolution and insignificantly
sensitive to grid spacing in the computational domain. It also presents the results of a
study performed on four turbulence models to see the effects of the different turbulent
models on simulation results. In addition, the results of the CFD simulation are presented
and compared with the experimental results. Finally, the chapter discusses the use of the
validated CFD model to predict the effects of changes in the design of the scrubber
system.
Chapter 7 highlights a summary of the study and the resulting conclusions. It also
presents the author’s recommendations for future work in this area.
11
2 LITERATURE REVIEW
2.1 Overview of Underground Coal Mining
Coal mining is one of the major industries of the national economy in the U.S. It has
contributed enormously to the development and growth of the nation. According to a
report by the National Mining Association, the U.S. produced a total of $30.461 billion
worth of coal in 2015 [25]. The United States is the second largest coal producer after
China. It is also the second largest coal consumer, and approximately 33% of the
electricity consumed in the U.S. comes from coal [26]. In addition to energy, coal mining
also creates jobs that benefit the economy and communities.
Coal mining employs surface and underground methods to extract coal from the earth. If
the coal excavation occurs on the surface, the mining is termed surface mining, but if the
extraction is carried out beneath the earth’s surface, it is termed underground mining
[27]. In an underground coal mine, the mining operation is performed in an environment
bound by a geological medium. The coal seam is accessed through multiple openings
from the surface and networks of entries in the coal seam or surrounding rock. There are
many factors in choosing between underground and surface coal mining, such as the
depth of the coal seam, the stripping ratio of overburden to coal, the strength of the
supporting roof, and the technical-economic feasibility.
Underground coal mining accounts for about 60% of world coal production [28]. In 2015,
the U.S. produced around 897 million short tons (MST) of coal, out of which 307 MST
(35%) were from underground coal mines. There is a total of 853 coal mines in the U.S.,
of which 305 (36%) are underground [29].

12
Underground coal mining can be further classified into two major types: room and pillar
mining and longwall mining. These two methods account for almost 100% of
underground coal production in the U.S. [25].
2.1.1 Room and Pillar Mining
The room and pillar method of mining is used for a flat, tabular coal seam. In this
method, a grid-like network of orthogonal entries is developed within the coal seam,
creating square or rectangular coal pillars, as shown in Figure 2.1. It should be noted that
Figure 2.1 does not show any ventilation control devices. In room and pillar mining,
rooms are excavated, and pillars are left to support the overlying strata. Roof bolts are
installed in the rooms to aid in roof support. This process recovers between 40 and 60%
of coal from the coal seam [30]. In some mines, depending on the conditions, coal is also
recovered from the pillar, increasing the recovery percentage up to 80% [30].
Figure 2.1: A cross-sectional view of an underground room and pillar mine with
mining equipment (Source: The WV Coal seam).

13
The room and pillar method is further divided into conventional and continuous mining,
with conventional mining being extremely rare in modern coal mine practices. In
conventional mining, a sequence of operations (cut + drill + blast + load) is performed by
separate machines to break and load the coal. Alternatively, in continuous mining, a
single machine (continuous miner) breaks and loads the coal directly. The continuous
miner, as shown in Figure 2.2, extracts the coal from the coal seam and loads it onto a
rubber-tired haulage vehicle, called a shuttle car. The shuttle car transports the coal from
the working face to a centrally located feeder-breaker conveyor belt system, which finally
transports the coal to the surface.
Figure 2.2: A Joy 12CN27 continuous miner (Source: Joy Global product details).
The continuous mining method is more efficient as it saves time, thus increasing
productivity. From 1993-94, a survey was conducted on a total of 552 room and pillar
mines, finding that 26% of room and pillar mines used the conventional method, while
74% used continuous miners [31]. In 2015, less than 1% of underground coal was
produced by conventional mining whereas approximately 40% of underground coal was
produced by continuous mining [29].

14
2.1.2 Longwall Mining
Longwall mining is a caving method of underground coal mining. Presently, it is the most
automated and efficient underground coal mining method. In a retreat longwall system
(the only type allowed in the U.S.), a group of three or more parallel entries (gate entries)
are developed by a continuous miner on each side of a large block of coal. The
development (gate) entries are connected at the back end of the large block (Figure 2.3).
Mining occurs in a back-and-forth process between the gate entries along the width of the
coal block. The longwall panels are typically well over 305m (1000 feet) wide and 3050
m (10,000 feet) in length [32]. Unlike, room and pillar mining, in longwall mining, the
entire coal block is excavated and the overlying strata (roof) of the mined-out area is
allowed to collapse as the mining progresses. This process allows high-percentage coal
recovery from the coal seam.
Figure 2.3: A 3-D view of the longwall mining process (Source: Energy Information
Administration).

15
The longwall system consists of three main types of equipment: a coal cutting machine
(longwall shearer), a chain of self-advancing hydraulic roof supports along the entire
width of the coal face, and an armored face conveyor (AFC). The longwall shearer
consists of a main body, two ranging arms hinged on either side of the main body, and a
cutting drum attached to the end of each ranging arm (Figure 2.4). The main body of the
shearer contains electric motors and controls, gear boxes, hydraulic equipment, and
pumps. The ranging arms can be swung up or down using hydraulic rams, with their
range in motion depending upon the height of the coal seam. The cutting drums, having
40 to 60 cutting picks, are mounted on the face side of the ranging arms. During the
operation, the drum rotates at 20-50 revolutions/min in a plane parallel to the face.
The longwall shearer runs back and forth along the width of the panel (panel face) and
cuts a swath of coal in each pass using its two cutting heads. The depth of the cut depends
on mining conditions and is known as “webb”. The cut coal falls onto the AFC that runs
along the entire length of the face. The AFC transfers the coal onto a belt conveyor (main
haulage system) that ultimately transports the coal to the surface.
Figure 2.4: A longwall shearer in operation at a longwall face (Source: West Virginia
Public Broadcasting).
16
The entire roof of the mine over the AFC and shearer is upheld by hydraulic supports.
These supports, having protective steel canopies, are mounted side by side along the
length of the panel face. As the shearer passes each roof support, the support advances
towards the face to support the newly cut roof, and the old roof is allowed to fall behind
the support.
The longwall mining method was introduced into U.S. coal mining in the early 1960s
[33] and has grown significantly since 1975. It has become the most productive mining
method, on a tons-per-employee basis [34]. Its share of total underground coal production
had grown from less than 5% in 1975 to 27% in 1983. By 1993, the figure increased to
40%, and in 2015, the method accounted for 59% of U.S. underground coal production
[29].
2.2 Sources of Dust at an Underground Longwall Mine Face
In an underground operational mine, mineral dust is the undesired result of almost all
mining activities. It is generated whenever any rock is broken by impact, abrasion,
crushing, cutting, grinding or explosives [35]. A study by NIOSH highlights the
following six primary sources of dust in a longwall mine in the United States [36].
1. Shearer
2. Shield advance
3. Stage loader/Crusher
4. Face spalling/AFC dust
5. Intake dust concentration
6. Gob caving
17
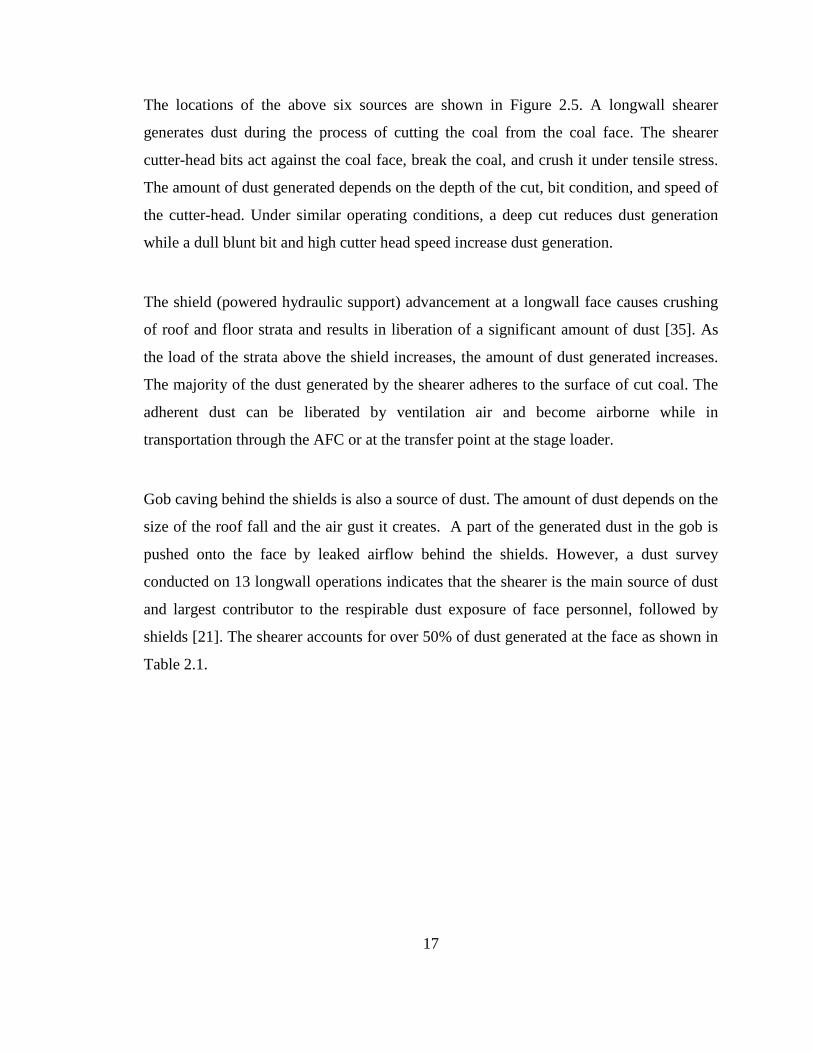
The locations of the above six sources are shown in Figure 2.5. A longwall shearer
generates dust during the process of cutting the coal from the coal face. The shearer
cutter-head bits act against the coal face, break the coal, and crush it under tensile stress.
The amount of dust generated depends on the depth of the cut, bit condition, and speed of
the cutter-head. Under similar operating conditions, a deep cut reduces dust generation
while a dull blunt bit and high cutter head speed increase dust generation.
The shield (powered hydraulic support) advancement at a longwall face causes crushing
of roof and floor strata and results in liberation of a significant amount of dust [35]. As
the load of the strata above the shield increases, the amount of dust generated increases.
The majority of the dust generated by the shearer adheres to the surface of cut coal. The
adherent dust can be liberated by ventilation air and become airborne while in
transportation through the AFC or at the transfer point at the stage loader.
Gob caving behind the shields is also a source of dust. The amount of dust depends on the
size of the roof fall and the air gust it creates. A part of the generated dust in the gob is
pushed onto the face by leaked airflow behind the shields. However, a dust survey
conducted on 13 longwall operations indicates that the shearer is the main source of dust
and largest contributor to the respirable dust exposure of face personnel, followed by
shields [21]. The shearer accounts for over 50% of dust generated at the face as shown in
Table 2.1.
18
Figure 2.5: Six main sources of dust in an underground longwall mine (Source: Colinet et
al., 1997).
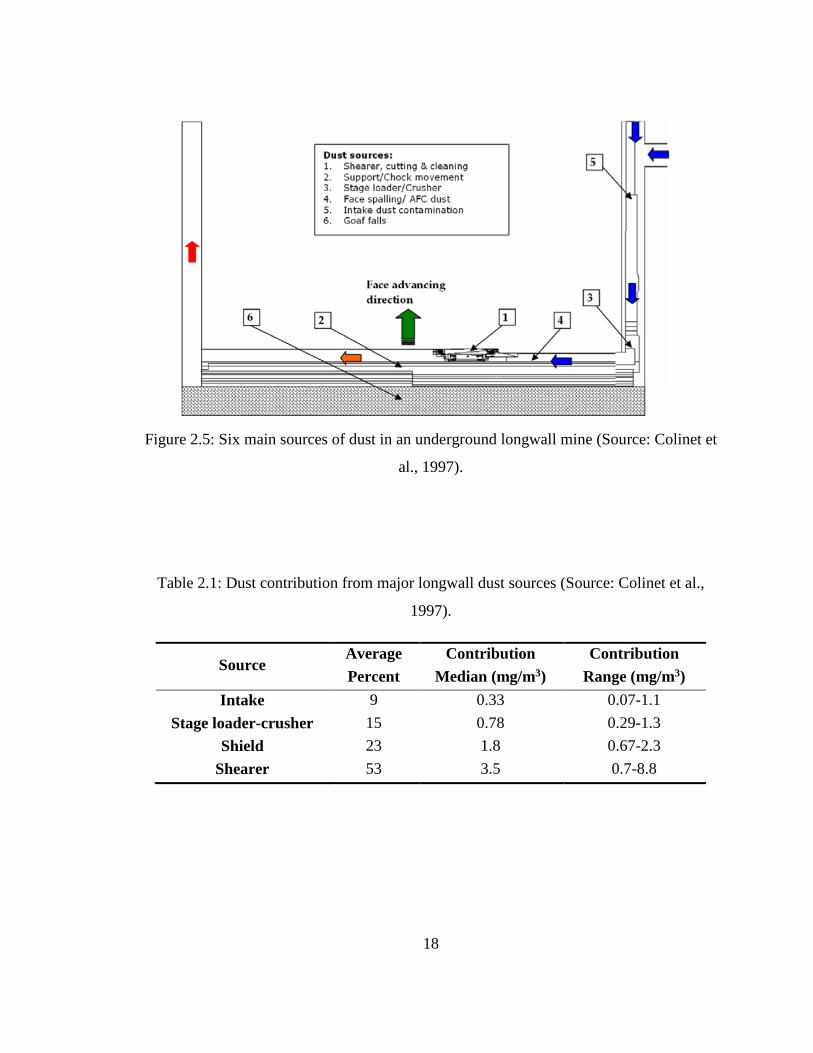
Table 2.1: Dust contribution from major longwall dust sources (Source: Colinet et al.,
1997).
Source Average Percent
Contribution Median (mg/m3)
Contribution Range (mg/m3)
Intake 9 0.33 0.07-1.1 Stage loader-crusher 15 0.78 0.29-1.3
Shield 23 1.8 0.67-2.3 Shearer 53 3.5 0.7-8.8

19
2.3 Overview of Underground Longwall Mine Dust Control System
Since the introduction of longwall mines in the United States, the percentage of
underground coal production from longwall systems has increased significantly. The
increase in production comes at the cost of an increase in dust generation, particularly
respirable dust [37]. To control respirable dust exposure to mine personnel, the dust
control methods and operating practices have also changed. The results of benchmarking
surveys at longwall operations across the U.S., conducted by NIOSH to identify
operating practices and the types of control being used, show that a wide variety of dust
control applications exist across the industry [19]. The differences were mainly due to
different operating conditions and equipment. Although dust control technologies vary
from mine to mine, the following are common technologies used in longwall mines in the
U.S. [22].
2.3.1 Dilution though Ventilation Air
Dilution of dust concentration with ventilation air is the primary method of dust control at
a longwall face. The fundamental principle is to provide sufficient air to dilute and carry
the airborne dust down the face and particularly away from the walkway, where the
longwall operators are located. Techniques such as gob curtains, wing curtains, and
shearer clearer systems are also used to enhance the dilution effect and to avoid dust
migration into the walkway.
Over the years, with increases in production and hence dust generation, longwall air
quantities have also increased [37]. A survey by NIOSH during a period of 2004 through
2008 showed that longwall mines in the United States had an average face air quantity of
31.6 m3/s (67,000 cfm), with a range between 24.3 to 39.1 m3/s (51,000 to 83,000 cfm)
[19]. The variation in air quantity depended on the longwall production, dust generation,
and methane dilution requirements. The average air quantity represented approximately a
20
65% increase when compared to a mid-1990 longwall study. The average face velocity
was found to be 3.4 m/s (665 fpm).
Raising airflow beyond a point can have a negative impact on dust concentration. High
face velocity can cause entrainment of respirable dust. It provides a benefit when the face
velocity is below 3 m/s (600 fpm) [38]. A laboratory study to evaluate shield dust
entrainment in high-velocity airstreams found a significant increase in both total and
respirable dust concentration with an increase in air velocity from 2.0 to 8.2 m/s (400 to
1,600 fpm) [39]. However, according to the survey by NIOSH, seven of the eight
longwalls having face air velocity exceeding 3 m/s (600 fpm) did not experience any
entrainment problems [19].
2.3.2 Dust prevention by Water Sprays
Use of water sprays for dust control has two primary purposes: (1) wetting of the broken
material and (2) capture of the airborne dust particles within the water droplets. Out of
the two, wetting is more efficient becasue the majority of the shearer generated dust
adheres to the surface of cut coal. This dust can contaminate a tremendous amount of air
if liberated by ventilation air and consequently becoming airborne during transportation
by the AFC or discharge at the transfer point at the stage loader [38]. The primary task is
to prevent the dust from becoming airborne. An investigation by NIOSH showed that
about 7.25 Kg (16 lbs.) of ordinary run-of-face broken bituminous coal had enough
respirable-size adhering dust to contaminate 28,316 m3 (1,000,000 ft3) of air up to a level
of 2 mg/m3, if the adhering dust had become airborne [40]. However, the best dust
control result is achieved when the surface of the cut coal is uniformly wetted by aiming
the nozzles at broken material during the breaking process. In addition, wetting agents
are often added to the spray water to improve coal wetting and assist with dust capture
[41]. The wetting agent lowers the surface tension of the water droplets and allows better
spread over the broken material [42].
21
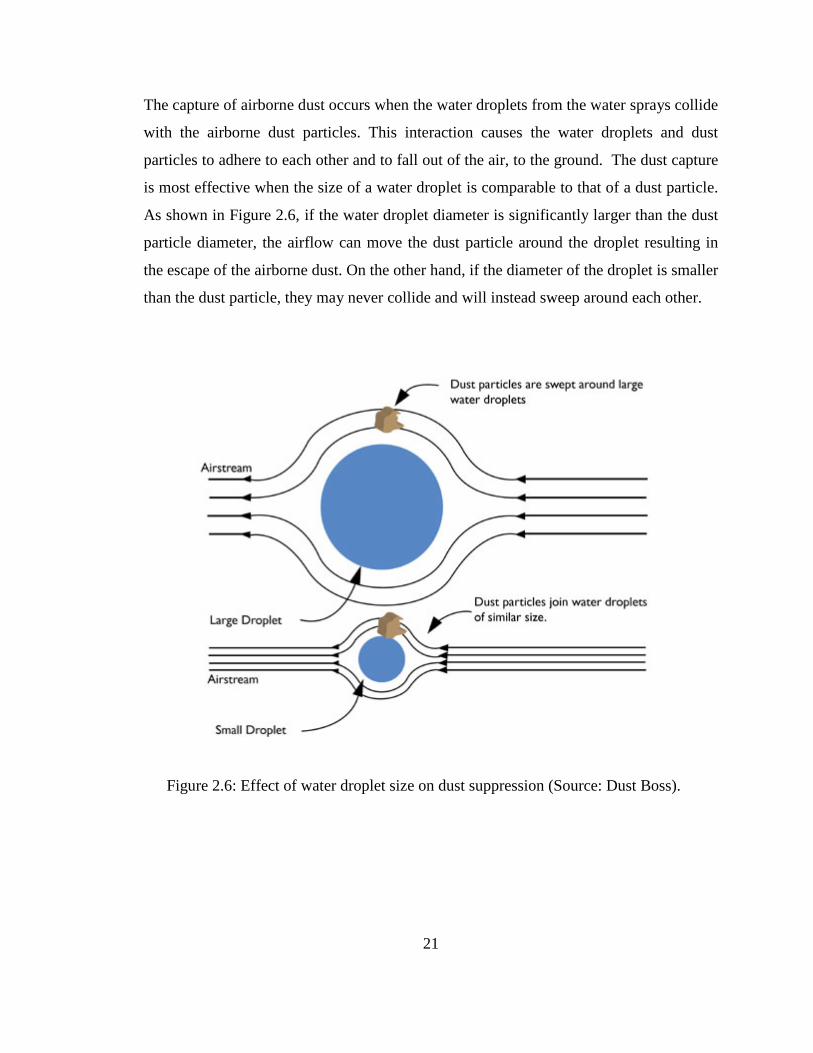
The capture of airborne dust occurs when the water droplets from the water sprays collide
with the airborne dust particles. This interaction causes the water droplets and dust
particles to adhere to each other and to fall out of the air, to the ground. The dust capture
is most effective when the size of a water droplet is comparable to that of a dust particle.
As shown in Figure 2.6, if the water droplet diameter is significantly larger than the dust
particle diameter, the airflow can move the dust particle around the droplet resulting in
the escape of the airborne dust. On the other hand, if the diameter of the droplet is smaller
than the dust particle, they may never collide and will instead sweep around each other.
Figure 2.6: Effect of water droplet size on dust suppression (Source: Dust Boss).
22
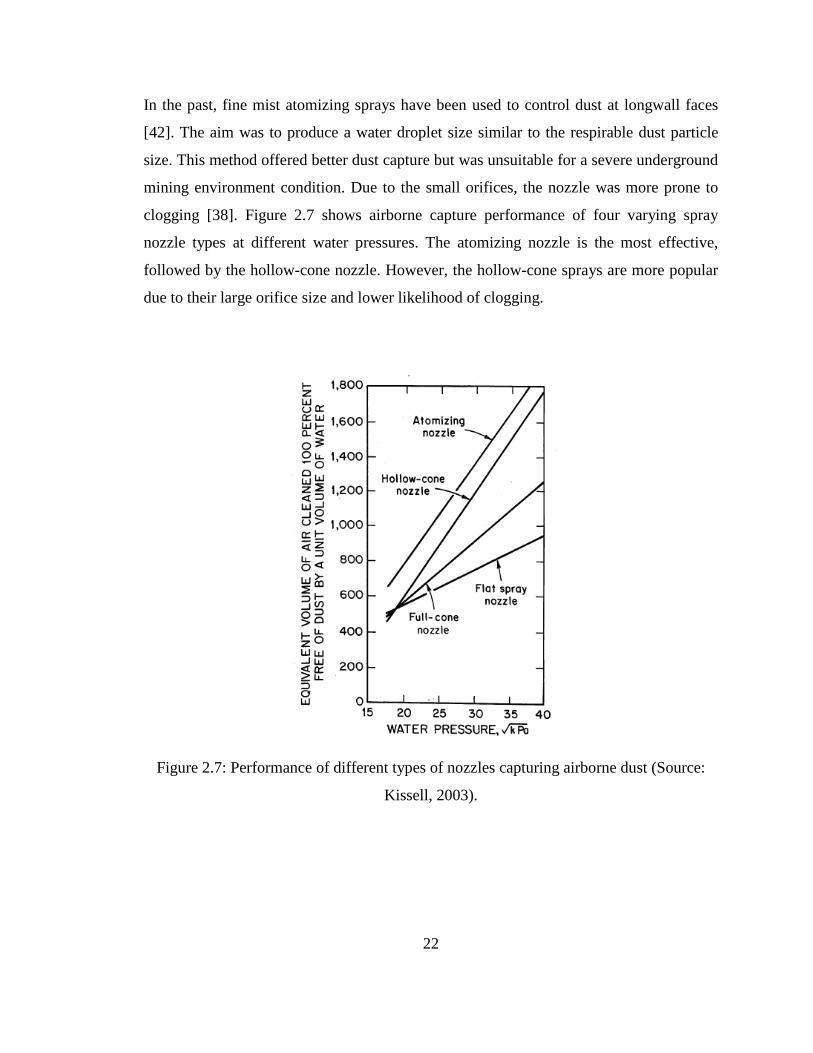
In the past, fine mist atomizing sprays have been used to control dust at longwall faces
[42]. The aim was to produce a water droplet size similar to the respirable dust particle
size. This method offered better dust capture but was unsuitable for a severe underground
mining environment condition. Due to the small orifices, the nozzle was more prone to
clogging [38]. Figure 2.7 shows airborne capture performance of four varying spray
nozzle types at different water pressures. The atomizing nozzle is the most effective,
followed by the hollow-cone nozzle. However, the hollow-cone sprays are more popular
due to their large orifice size and lower likelihood of clogging.
Figure 2.7: Performance of different types of nozzles capturing airborne dust (Source:
Kissell, 2003).
23
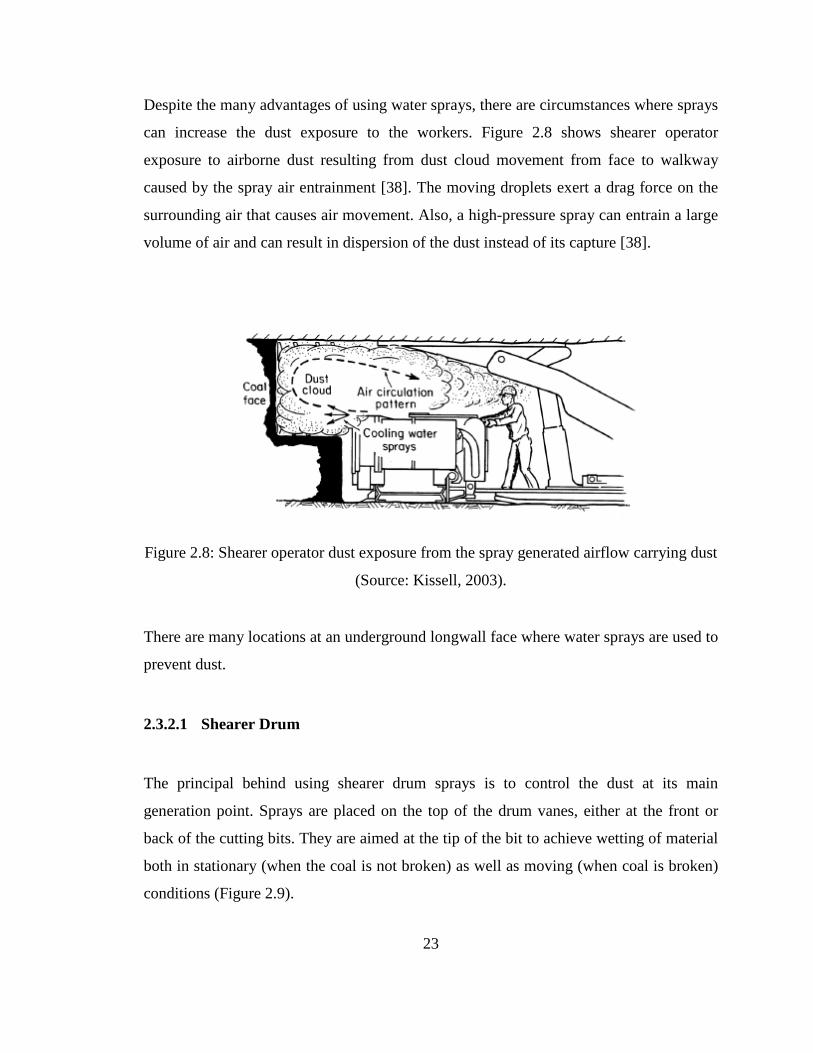
Despite the many advantages of using water sprays, there are circumstances where sprays
can increase the dust exposure to the workers. Figure 2.8 shows shearer operator
exposure to airborne dust resulting from dust cloud movement from face to walkway
caused by the spray air entrainment [38]. The moving droplets exert a drag force on the
surrounding air that causes air movement. Also, a high-pressure spray can entrain a large
volume of air and can result in dispersion of the dust instead of its capture [38].
Figure 2.8: Shearer operator dust exposure from the spray generated airflow carrying dust
(Source: Kissell, 2003).
There are many locations at an underground longwall face where water sprays are used to
prevent dust.
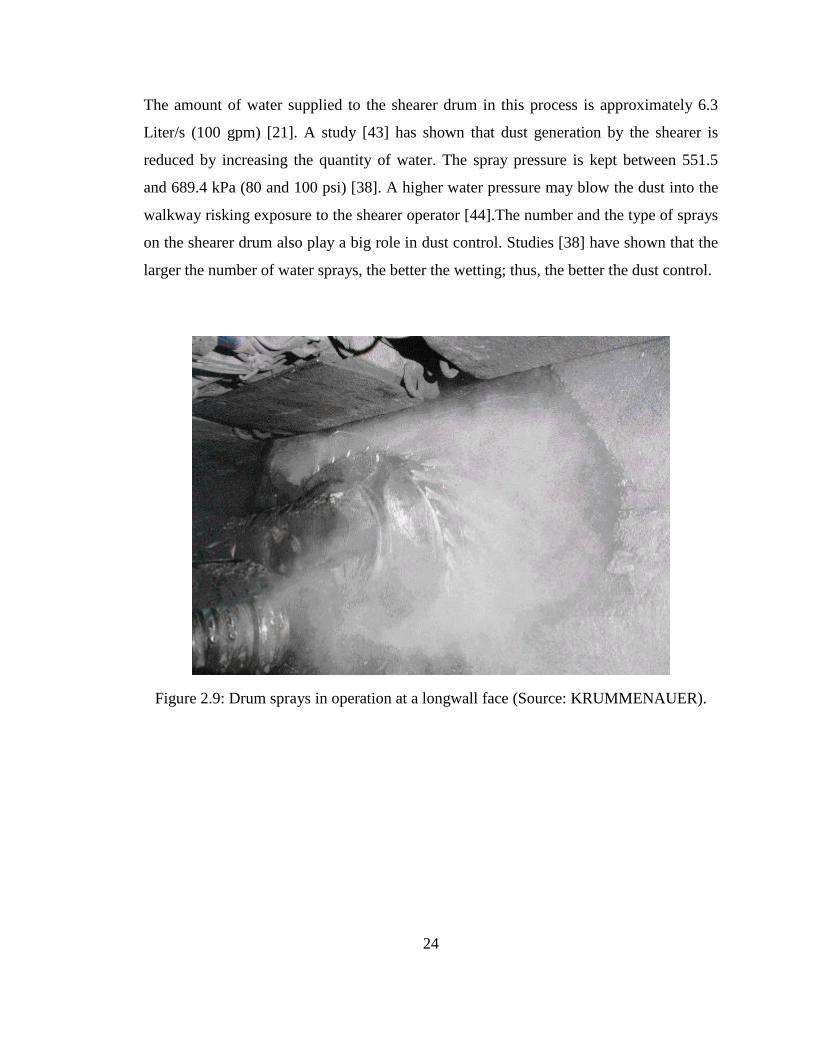
2.3.2.1 Shearer Drum
The principal behind using shearer drum sprays is to control the dust at its main
generation point. Sprays are placed on the top of the drum vanes, either at the front or
back of the cutting bits. They are aimed at the tip of the bit to achieve wetting of material
both in stationary (when the coal is not broken) as well as moving (when coal is broken)
conditions (Figure 2.9).
24
The amount of water supplied to the shearer drum in this process is approximately 6.3
Liter/s (100 gpm) [21]. A study [43] has shown that dust generation by the shearer is
reduced by increasing the quantity of water. The spray pressure is kept between 551.5
and 689.4 kPa (80 and 100 psi) [38]. A higher water pressure may blow the dust into the
walkway risking exposure to the shearer operator [44].The number and the type of sprays
on the shearer drum also play a big role in dust control. Studies [38] have shown that the
larger the number of water sprays, the better the wetting; thus, the better the dust control.
Figure 2.9: Drum sprays in operation at a longwall face (Source: KRUMMENAUER).

25
2.4 Dust Control Acts
The first major step taken for dust control in the underground mines was the enactment of
the Federal Coal Mine Health and Safety Act of 1969 (U.S. Public Law 91-173), also
known as the Coal Act, in the aftermath of the Farmington mine disaster. The act was
passed by the 91st United State Congressional session and enacted into law by the 37th
president of the United States, Richard Nixon, on December 30, 1969. It was designed to
establish health and safety standards for the coal mining industry. The Coal Act provided
many protections for coal miners including dust exposure limits and the workers’ health
surveillance program.
The act required four annual federal inspections in every underground coal mine in the
United States. It established respirable dust standards and imposed a strict limit on the
amount of respirable coal mine dust allowed in the air that miners breathe. The act
required the longwall mine operators to maintain a concentration below 2.0 mg/m3 and
1.0 mg/m3 at the working face and in the intake air, respectively, over an eight-hour shift.
When the quartz content in the respirable dust exceeded 5%, the required dust limit was
calculated by dividing the percentage of quartz by 10. The Act also required periodic
respirable dust sampling with a gravimetric sampler on each mechanized unit to
demonstrate compliance with the dust standards [24]. In addition, the act provided a
monthly cash benefit for the coal miners who were “totally disabled” because of
pneumoconiosis (black lung). Moreover, the Act set fines for all violations and criminal
penalties for knowing and willful violations.
The Coal Act was later amended to the Federal Mine Safety and Health Act of 1977
(Public law 95-164), also known as the Mine Act, after the Hurricane Creek mine
disaster. The Mine Act mandated miner training and required mine rescue teams for all
underground mines.

26
2.5 The New Dust Rule
In spite of the significant progress made in reducing miners’ exposure to respirable dust,
the rising cases of Coal Workers’ Pneumoconiosis (CWP) after 1995 put the dust issue in
coal mines in the spotlight. In a step forward in ending new cases of black lung and
adding increased safeguards for the nation’s coal miners, the MSHA, in 2010, proposed a
new dust standard for coal mines. The new dust rule, also referred to as the final rule,
went into effect on August 1, 2014. The key provisions of the rule for an underground
coal mine are as follows:
1. Lowers the existing exposure limits for respirable coal mine dust. The new dust
standard requires the mine operators to lower the dust limit from 2.0 mg/m3 at
working face and 1.0 mg/m3 in the intake to 1.5 mg/m3 at working face and 0.5
mg/m3 in the intake by August 1, 2016.
2. Establishes requirements for the use of the Continuous Personal Dust Monitor
(CPDM). The final rule mandated the underground coal mine operators to use the
CPDM to monitor the exposure of the underground miners in the occupations
exposed to the highest respirable coal mine dust concentration starting from
February 1, 2016. CPDM is a real-time dust sampler that measures the respirable
dust concentration continuously and provides cumulative dust concentration, as
well as a 30-minute average and the percentage of the permissible exposure limit.
3. Redefines the term “normal production shift” as the production shift which has at
least 80% of average production. It requires the underground coal mine operators
to take respirable dust samples when production in a shift is at least 80% of the
average production for 30 recent production shifts.
4. Requires collecting respirable dust samples for the full-shift that a miner works
regardless of the shift duration. Earlier, a maximum 8-hour sampling was
required.
27
5. Changes averaging method from the average of five operator samples to a single,
full-shift operator sample to determine compliance on operator samples. If the
sample meets or exceeds the concentration limit, a corrective action is required.
6. Guides MSHA inspector to use a single, full-shift sample to determine non-
compliance.
7. Includes spirometry testing, occupational history, and symptom assessment to the
periodic chest radiographic examinations to the pre-existing medical surveillance
requirements.
8. Adds requirements for certified persons to complete an MSHA course of
instruction to perform dust sampling as well as to maintain and calibrate the
sampling device.
9. Requires re-examination every three years for certified persons to maintain
certification.
10. Allows decertification of a certified person for not performing their duty properly.
2.6 Flooded-Bed Scrubber
A flooded-bed scrubber is a machine-mounted dust control system for underground coal
mining operations. It is commonly used as an integral part of a continuous miner unit to
capture and remove airborne dust generated at the face. In the United States, almost all
continuous miners utilize the flooded-bed scrubber system as it has been successful in
removing a significant amount of dust, particularly respirable dust from air. The flooded-
bed scrubber works on the principle in which water is sprayed on a screen to create a
large number of water droplets, and the dust-laden air is made to pass through it. In this
process, as the dust particles come in contact with water droplets, they get captured in the
water droplets and therefore get separated from the air.

28
The flooded-bed scrubber was first applied to a continuous miner by Dr. John Campbell
in 1983 [45]. It has six main components: (1) an inlet which is strategically placed
adjacent to the cutting drum to capture the maximum possible amount of dust from the
face, (2) a full cone water spray which typically sprays 0.41 l/s (6.5 gpm) water at 310
kPa (45 psi) on the flooded-bed screen, (3) a wire-mesh screen downwind of the spray,
(4) a demister downwind of the screen, (5) a water sump under the demister, and (6) a
vane axial exhaust fan at the outlet, as shown in Figure 2.10.
Figure 2.10: General cross-section view of a flooded-bed scrubber.
The exhaust fan creates a negative pressure which draws the dust-laden air from the
working face into the scrubber’s inlet. The dust-laden air then passes through the water-
saturated wire-mesh screen where the dust particles get entrained in the water droplets.
The dust-laden water droplets move downwind from the flooded-bed to the demister. The
demister, which consists of parallel sinuous layers of PVC, separates the dust-laden water
droplets from the air before the air reaches the fan. The dirty dust-laden water flows
down to the sump where it is pumped out and discharged at the continuous miner’s
discharge conveyor. The clean, moist air passes through the fan.
The flooded-bed is placed at an angle (approx. 450) from the duct floor to maximize the
surface area. It consists of different layers (mainly 10 to 30 layers) of woven, 88.9
microns (0.0035 inches), steel mesh screen. The more the number of layers, the better the
cleaning performance, but the higher the pressure drop across the flooded-bed. The fan

29
sizes typically range from 9.7 kW (13 hp) to 29.8 kW (40 hp), with an airflow range from
1.7 m3/s (3.5 kcfm) to 4.7 m3/s (10 kcfm) [11].
There are two terms through which the performance of a wet scrubber is determined,
namely capturing efficiency and cleaning efficiency. The capturing efficiency is the
percentage of the generated dust captured by the scrubber inlet; the cleaning efficiency is
the percentage of dust removed from the captured dust-laden air [46]. A study conducted
by NIOSH stated that a 30-layer flooded-bed scrubber could achieve a cleaning
efficiency of 90% under its optimum condition [23]. A recent study on the performance
of a flooded-bed scrubber shows a reduction of respirable dust concentration by 91%,
86%, and 40% in three different mines [24].
2.7 Previous Efforts of Using a Scrubber at a Longwall Face
The importance of a mechanical dust control system at a longwall face has not just newly
been recognized. The attempt of using a machine mounted scrubber within a shearer
started much earlier in Europe in the 1960s, but in the U.S. it started in 1970s by USBM.
In 1977, the U.S. Bureau of Mines (USBM) and Donaldson Company developed a
machine-mounted, fan-powered, flooded-bed dust scrubber for a longwall shearer [47].
The scrubber was retrofitted onto an Eickhoff EDW 340L double-drum shearer with
inlets located behind the cutting drums and at several locations on the face side between
the headgate and tailgate drums. A dust collector module consisting of water sprays, a
mini cyclone filter panel, and a fan of capacity 2.4 m3/s (5.0 kcfm) was attached on the
downwind end of the shearer. The ductwork connecting inlets to the dust collector was
installed under the shearer body after modifying the shearer underframe (Figure 2.11)
[46] [47].
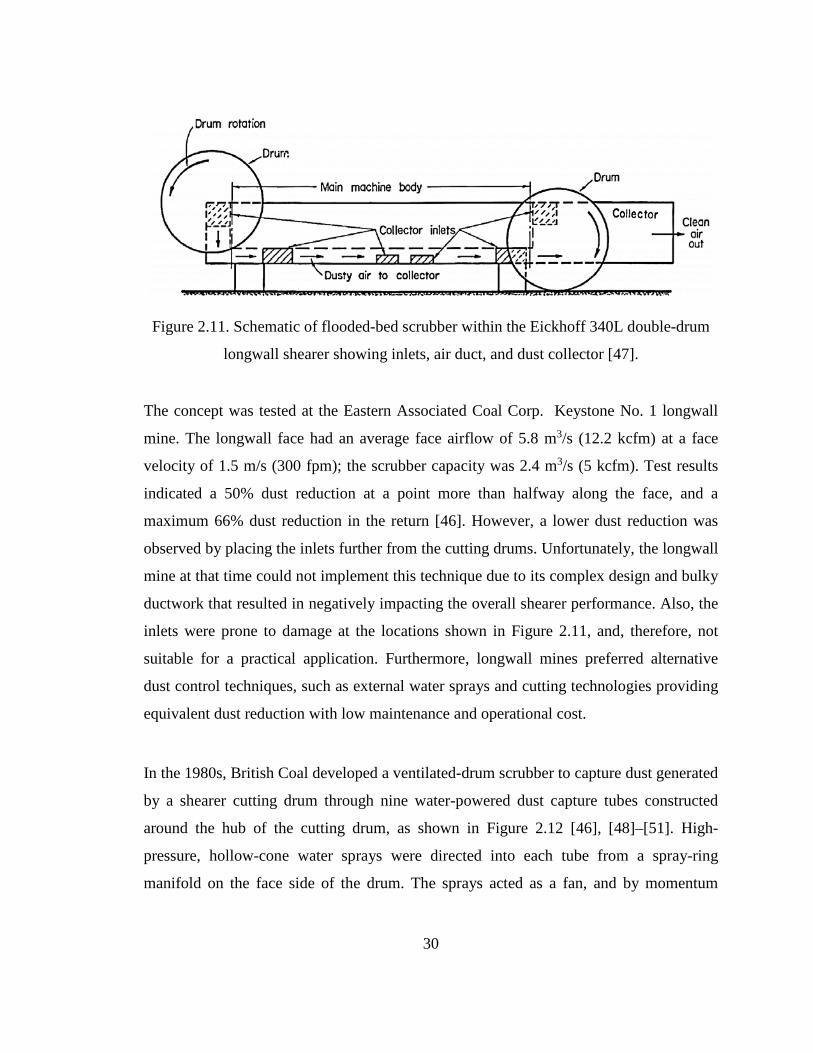
30
Figure 2.11. Schematic of flooded-bed scrubber within the Eickhoff 340L double-drum
longwall shearer showing inlets, air duct, and dust collector [47].
The concept was tested at the Eastern Associated Coal Corp. Keystone No. 1 longwall
mine. The longwall face had an average face airflow of 5.8 m3/s (12.2 kcfm) at a face
velocity of 1.5 m/s (300 fpm); the scrubber capacity was 2.4 m3/s (5 kcfm). Test results
indicated a 50% dust reduction at a point more than halfway along the face, and a
maximum 66% dust reduction in the return [46]. However, a lower dust reduction was
observed by placing the inlets further from the cutting drums. Unfortunately, the longwall
mine at that time could not implement this technique due to its complex design and bulky
ductwork that resulted in negatively impacting the overall shearer performance. Also, the
inlets were prone to damage at the locations shown in Figure 2.11, and, therefore, not
suitable for a practical application. Furthermore, longwall mines preferred alternative
dust control techniques, such as external water sprays and cutting technologies providing
equivalent dust reduction with low maintenance and operational cost.
In the 1980s, British Coal developed a ventilated-drum scrubber to capture dust generated
by a shearer cutting drum through nine water-powered dust capture tubes constructed
around the hub of the cutting drum, as shown in Figure 2.12 [46], [48]–[51]. High-
pressure, hollow-cone water sprays were directed into each tube from a spray-ring
manifold on the face side of the drum. The sprays acted as a fan, and by momentum

31
transfer, drew dust-laden air from the face into the tubes where it was cleaned. A circular
deflector plate, slightly larger than the drum hub, was attached to the cowl arm on the
walkway side of the drum to direct the water onto the coal being discharged from the
drum, and deflect the water away from the operator and into the cutting zone. The
deflector plate also helped by re-circulating some of the air, which increased capture and
cleaning efficiencies of the scrubber [46]. The concept was tested at an artificial coal face
with approximately 1.5 m3/s (3.1 kcfm) of air through the tubes and a water flow rate of
60 l/min (16 gpm) at 10.5 MPa (1520 psi). Results showed a respirable dust
concentration reduction of 95% in the air drawn through the tubes [48]. A field test
carried out on a fixed-height, single-drum shearer, showed an overall reduction of 60 to
80%, as compared with conventional wet cutting [51].
The work was followed by the USBM with twelve water-powered dust capture tubes
constructed around the hub of shearer drum. The first field study in the U.S. at the Cyprus
Plateau Star Point No 2 Mine in Utah showed a 50% dust reduction for a 1.6 m3/s (3,500
cfm) airflow through the tubes at a water flow rate of 225 to 320 l/min (60 to 85 gpm)
and a pressure of 10.3 MPa (1500 psi). The average face airflow was 13.2 m3/s (28 kcfm)
at a 1.8 m/s (350 fpm) face-air velocity. According to Wirch, the ventilated drum
technique was applicable on drums larger than 1.3 meters (52 inches) in diameter, and
required a reliable on-board, high-pressure pump [46]. The technique was found to be
very expensive and maintenance intensive, which prevented it from being implemented.

32
Figure 2.12. Ventilated-drum scrubber schematic
[50].
The concept of a cowl-like scrubber, also known as a ventilated cowl, was developed by
British Coal, and introduced in the U.S. in 1982 by Gary R. Gillingham [52]. The purpose
of this technique was the same as the ventilated drum, i.e., drawing dust-laden air from
the cutting zone through a water-powered scrubber. The scrubber was placed inside the
hollow cowl, and consisted of an inlet placed close to the cutter drum, an arrangement of
jet spray nozzles downwind of the inlet, and a mist eliminator downwind of the sprays
(Figure 2.13). The jet water sprays generated small, high-velocity droplets that induced
airflow through the scrubber, resulting in entrainment of dust particles within the water
droplets. The dust-laden droplets then traveled downwind to the mist eliminator, which
removed the dust-laden water from the air.
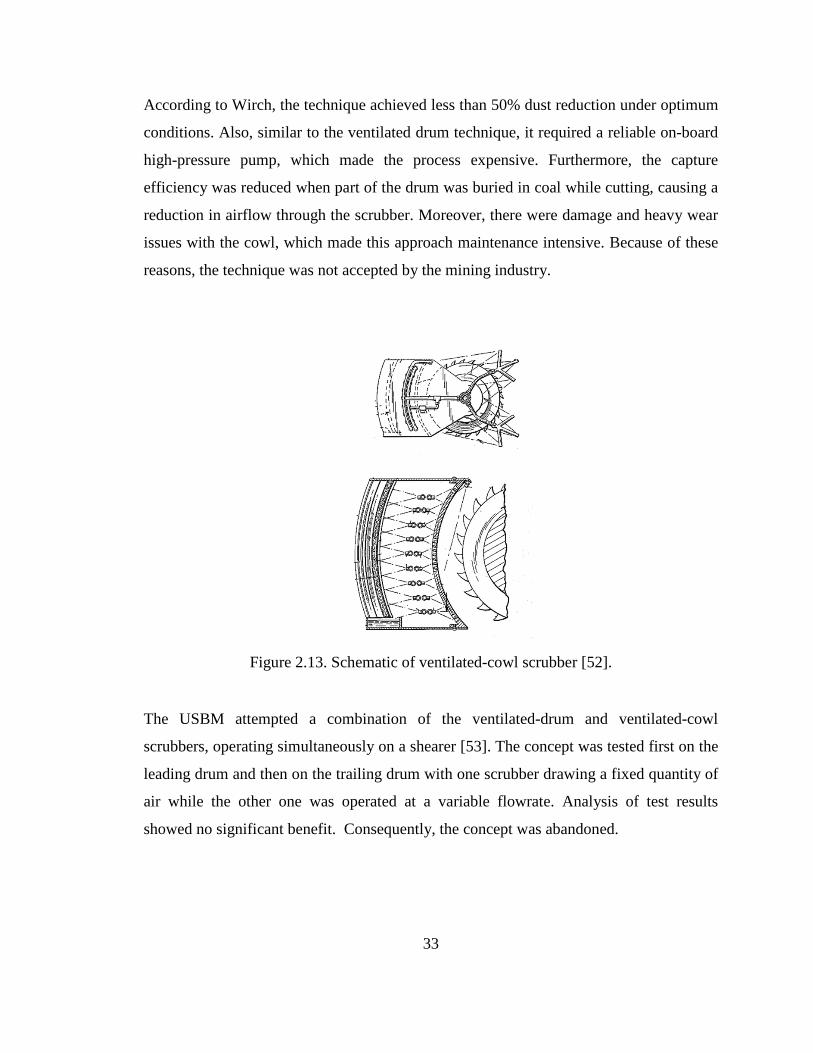
33
According to Wirch, the technique achieved less than 50% dust reduction under optimum
conditions. Also, similar to the ventilated drum technique, it required a reliable on-board
high-pressure pump, which made the process expensive. Furthermore, the capture
efficiency was reduced when part of the drum was buried in coal while cutting, causing a
reduction in airflow through the scrubber. Moreover, there were damage and heavy wear
issues with the cowl, which made this approach maintenance intensive. Because of these
reasons, the technique was not accepted by the mining industry.
Figure 2.13. Schematic of ventilated-cowl scrubber [52].
The USBM attempted a combination of the ventilated-drum and ventilated-cowl
scrubbers, operating simultaneously on a shearer [53]. The concept was tested first on the
leading drum and then on the trailing drum with one scrubber drawing a fixed quantity of
air while the other one was operated at a variable flowrate. Analysis of test results
showed no significant benefit. Consequently, the concept was abandoned.

34
In 1982, the USBM developed water-powered extractors (or spot scrubbers) for use on a
double-drum shearer [53]. The spot scrubber consisted of a rectangular box 63.50 cm x
60.96 cm x 15.24 cm (25” x 24” x 6”) and four equally spaced high-pressure water sprays
placed on the top of the box, as shown in Figure 2.14. Dust-laden air entered through two
open slots, located on each side on the top of the box, under the influence of the high-
pressure water sprays. The scrubber separated the dust from the air as it passed through
the scrubber, and discharged the wet dust onto the mine floor. The main advantage of
using the spot scrubber was its flexibility in mounting positions.
Figure 2.14. Spot scrubber [53].
According to Wirch, a number of different mounting positions and airflow levels were
tested in a laboratory setup [46]. Test results showed that the best mounting position was
on the face side of the shearer behind the leading drum with scrubber exhaust routed
under the shearer (Figures 2.15 and 2.16). Also, it was found that the scrubber airflow
should be at least 0.2 times the face air quantity for the scrubber to perform adequately.
Under this condition, the scrubber achieved over 80% capture efficiency with face and
scrubber airflow of 9.4 m3/s (20 kcfm) and 1.9 m3/s (4 kcfm), respectively. However, the
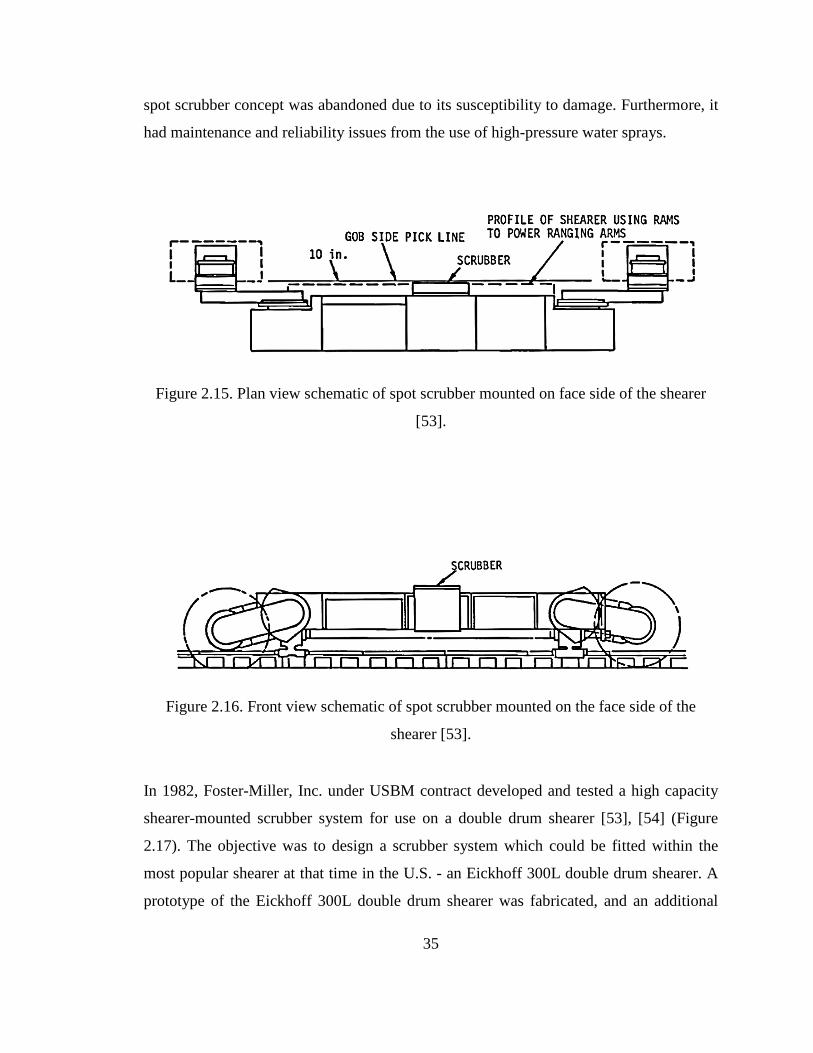
35
spot scrubber concept was abandoned due to its susceptibility to damage. Furthermore, it
had maintenance and reliability issues from the use of high-pressure water sprays.
Figure 2.15. Plan view schematic of spot scrubber mounted on face side of the shearer
[53].
Figure 2.16. Front view schematic of spot scrubber mounted on the face side of the
shearer [53].
In 1982, Foster-Miller, Inc. under USBM contract developed and tested a high capacity
shearer-mounted scrubber system for use on a double drum shearer [53], [54] (Figure
2.17). The objective was to design a scrubber system which could be fitted within the
most popular shearer at that time in the U.S. - an Eickhoff 300L double drum shearer. A
prototype of the Eickhoff 300L double drum shearer was fabricated, and an additional
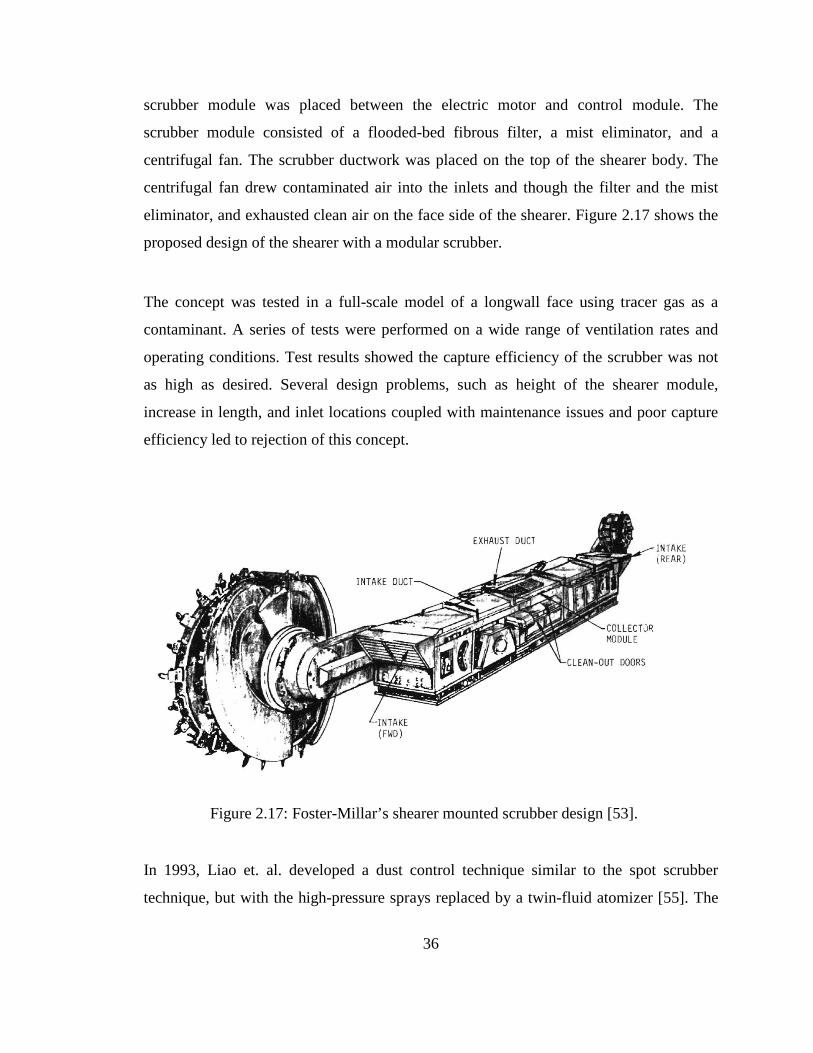
36
scrubber module was placed between the electric motor and control module. The
scrubber module consisted of a flooded-bed fibrous filter, a mist eliminator, and a
centrifugal fan. The scrubber ductwork was placed on the top of the shearer body. The
centrifugal fan drew contaminated air into the inlets and though the filter and the mist
eliminator, and exhausted clean air on the face side of the shearer. Figure 2.17 shows the
proposed design of the shearer with a modular scrubber.
The concept was tested in a full-scale model of a longwall face using tracer gas as a
contaminant. A series of tests were performed on a wide range of ventilation rates and
operating conditions. Test results showed the capture efficiency of the scrubber was not
as high as desired. Several design problems, such as height of the shearer module,
increase in length, and inlet locations coupled with maintenance issues and poor capture
efficiency led to rejection of this concept.
Figure 2.17: Foster-Millar’s shearer mounted scrubber design [53].
In 1993, Liao et. al. developed a dust control technique similar to the spot scrubber
technique, but with the high-pressure sprays replaced by a twin-fluid atomizer [55]. The
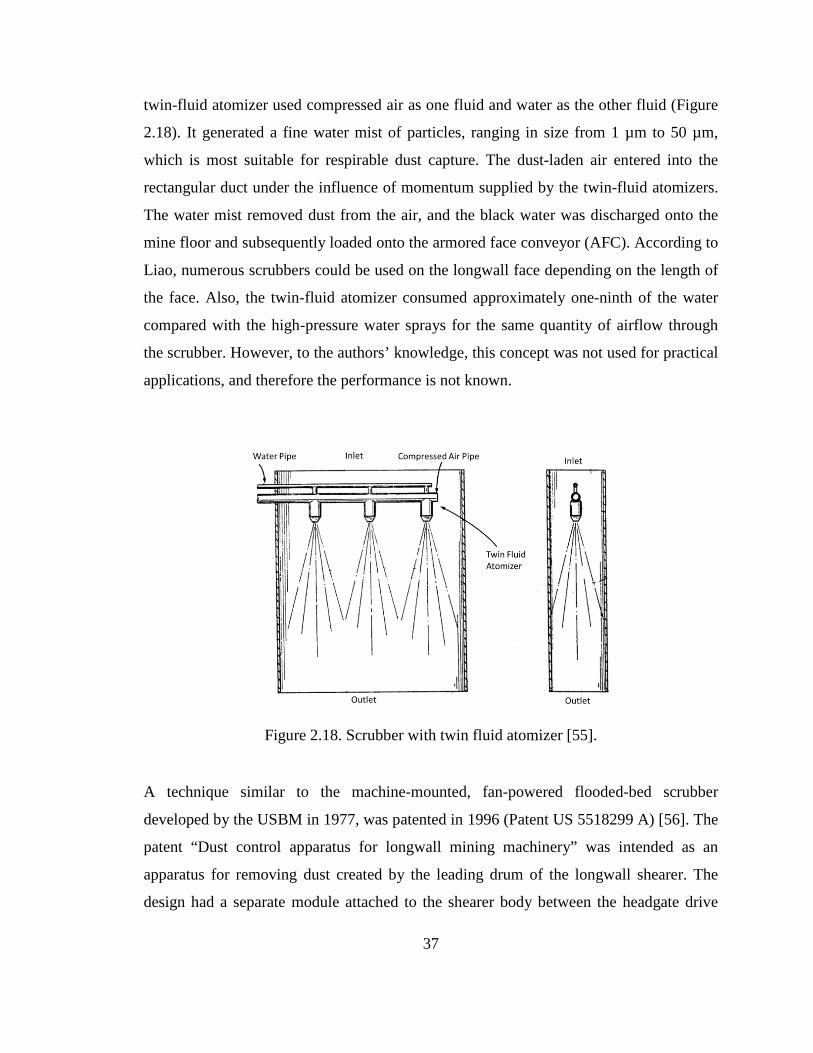
37
twin-fluid atomizer used compressed air as one fluid and water as the other fluid (Figure
2.18). It generated a fine water mist of particles, ranging in size from 1 µm to 50 µm,
which is most suitable for respirable dust capture. The dust-laden air entered into the
rectangular duct under the influence of momentum supplied by the twin-fluid atomizers.
The water mist removed dust from the air, and the black water was discharged onto the
mine floor and subsequently loaded onto the armored face conveyor (AFC). According to
Liao, numerous scrubbers could be used on the longwall face depending on the length of
the face. Also, the twin-fluid atomizer consumed approximately one-ninth of the water
compared with the high-pressure water sprays for the same quantity of airflow through
the scrubber. However, to the authors’ knowledge, this concept was not used for practical
applications, and therefore the performance is not known.
Figure 2.18. Scrubber with twin fluid atomizer [55].
A technique similar to the machine-mounted, fan-powered flooded-bed scrubber
developed by the USBM in 1977, was patented in 1996 (Patent US 5518299 A) [56]. The
patent “Dust control apparatus for longwall mining machinery” was intended as an
apparatus for removing dust created by the leading drum of the longwall shearer. The
design had a separate module attached to the shearer body between the headgate drive
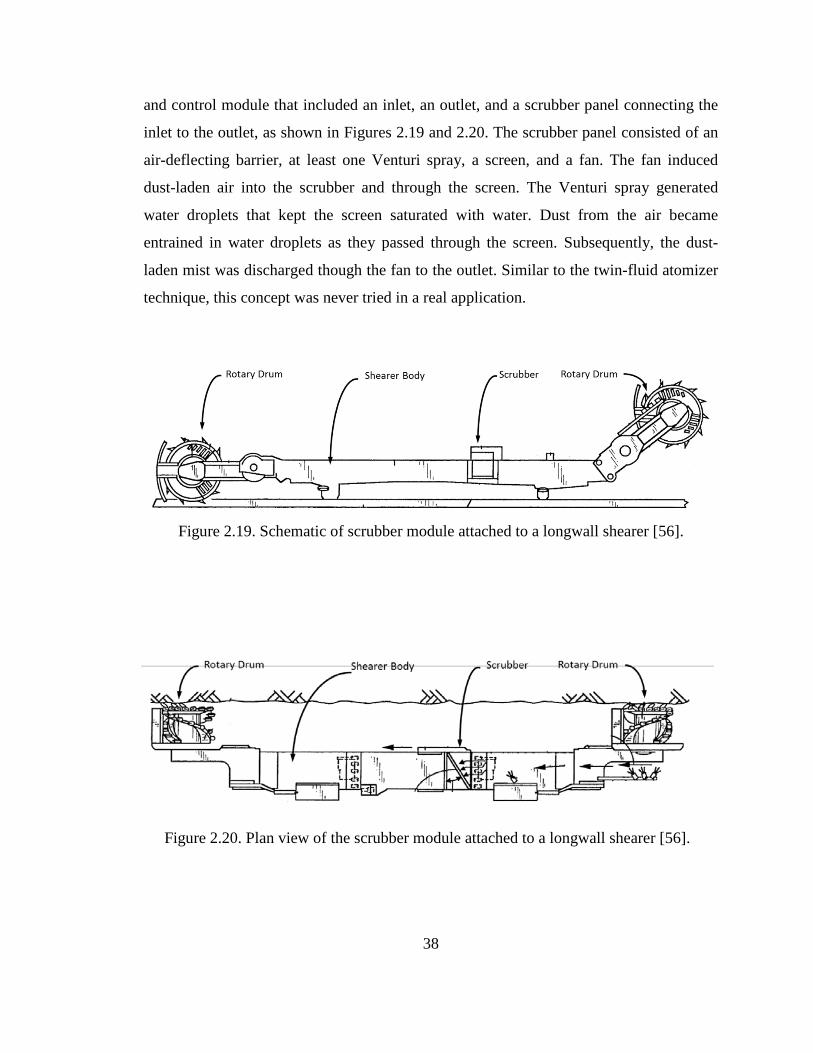
38
and control module that included an inlet, an outlet, and a scrubber panel connecting the
inlet to the outlet, as shown in Figures 2.19 and 2.20. The scrubber panel consisted of an
air-deflecting barrier, at least one Venturi spray, a screen, and a fan. The fan induced
dust-laden air into the scrubber and through the screen. The Venturi spray generated
water droplets that kept the screen saturated with water. Dust from the air became
entrained in water droplets as they passed through the screen. Subsequently, the dust-
laden mist was discharged though the fan to the outlet. Similar to the twin-fluid atomizer
technique, this concept was never tried in a real application.
Figure 2.19. Schematic of scrubber module attached to a longwall shearer [56].
Figure 2.20. Plan view of the scrubber module attached to a longwall shearer [56].
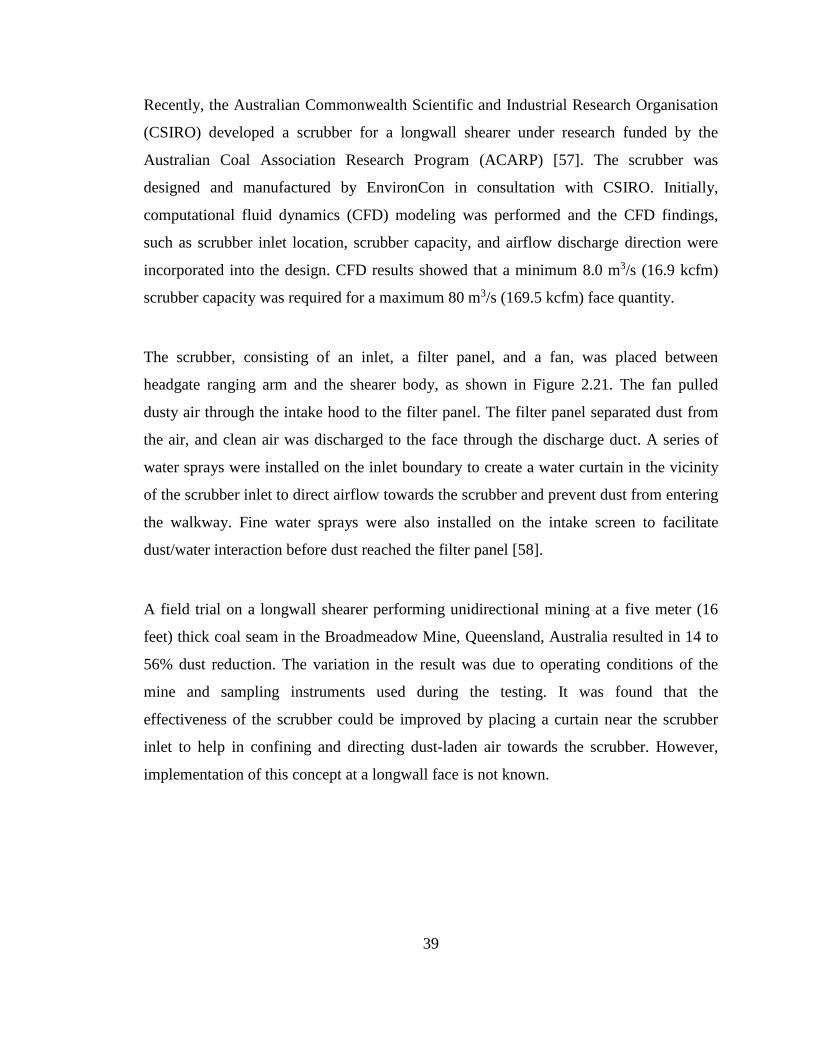
39
Recently, the Australian Commonwealth Scientific and Industrial Research Organisation
(CSIRO) developed a scrubber for a longwall shearer under research funded by the
Australian Coal Association Research Program (ACARP) [57]. The scrubber was
designed and manufactured by EnvironCon in consultation with CSIRO. Initially,
computational fluid dynamics (CFD) modeling was performed and the CFD findings,
such as scrubber inlet location, scrubber capacity, and airflow discharge direction were
incorporated into the design. CFD results showed that a minimum 8.0 m3/s (16.9 kcfm)
scrubber capacity was required for a maximum 80 m3/s (169.5 kcfm) face quantity.
The scrubber, consisting of an inlet, a filter panel, and a fan, was placed between
headgate ranging arm and the shearer body, as shown in Figure 2.21. The fan pulled
dusty air through the intake hood to the filter panel. The filter panel separated dust from
the air, and clean air was discharged to the face through the discharge duct. A series of
water sprays were installed on the inlet boundary to create a water curtain in the vicinity
of the scrubber inlet to direct airflow towards the scrubber and prevent dust from entering
the walkway. Fine water sprays were also installed on the intake screen to facilitate
dust/water interaction before dust reached the filter panel [58].
A field trial on a longwall shearer performing unidirectional mining at a five meter (16
feet) thick coal seam in the Broadmeadow Mine, Queensland, Australia resulted in 14 to
56% dust reduction. The variation in the result was due to operating conditions of the
mine and sampling instruments used during the testing. It was found that the
effectiveness of the scrubber could be improved by placing a curtain near the scrubber
inlet to help in confining and directing dust-laden air towards the scrubber. However,
implementation of this concept at a longwall face is not known.
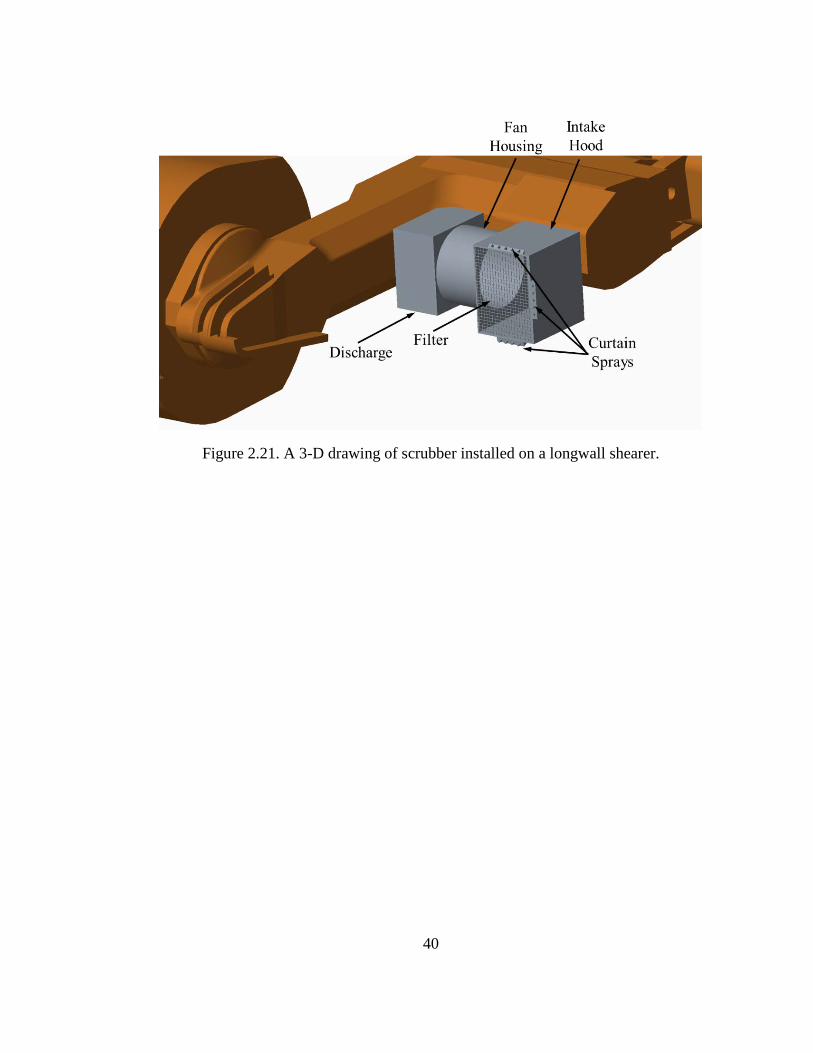
40
Figure 2.21. A 3-D drawing of scrubber installed on a longwall shearer.
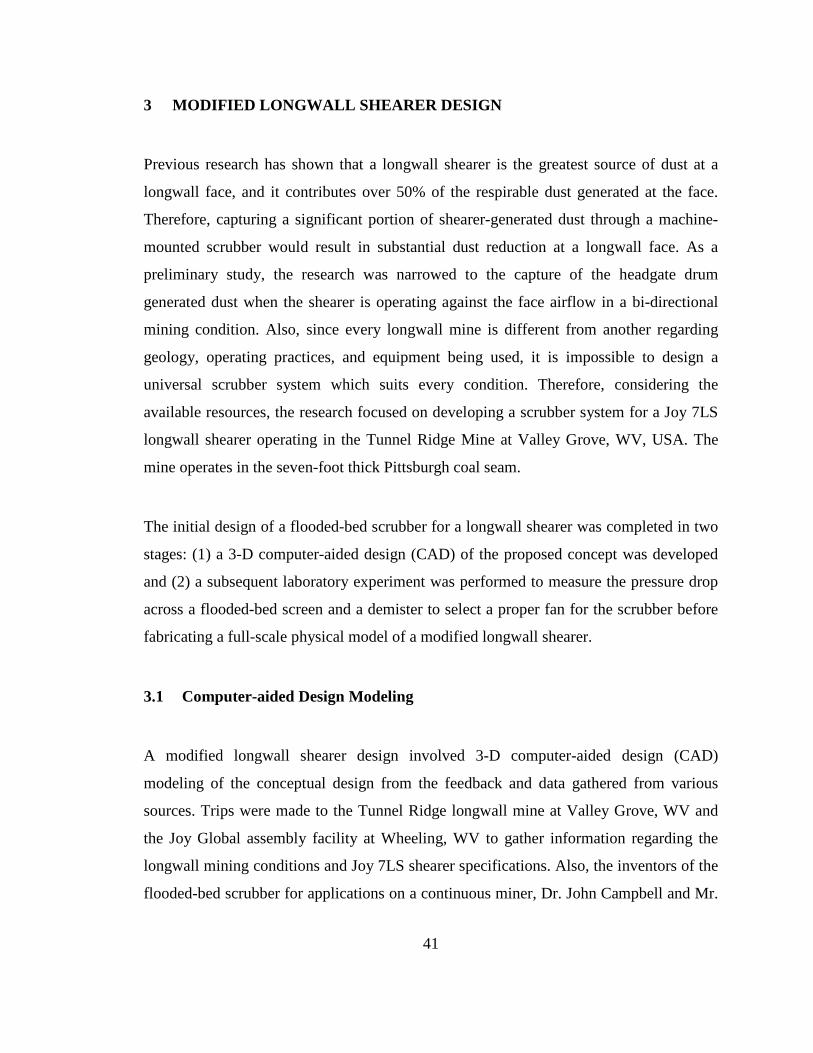
41
3 MODIFIED LONGWALL SHEARER DESIGN
Previous research has shown that a longwall shearer is the greatest source of dust at a
longwall face, and it contributes over 50% of the respirable dust generated at the face.
Therefore, capturing a significant portion of shearer-generated dust through a machine-
mounted scrubber would result in substantial dust reduction at a longwall face. As a
preliminary study, the research was narrowed to the capture of the headgate drum
generated dust when the shearer is operating against the face airflow in a bi-directional
mining condition. Also, since every longwall mine is different from another regarding
geology, operating practices, and equipment being used, it is impossible to design a
universal scrubber system which suits every condition. Therefore, considering the
available resources, the research focused on developing a scrubber system for a Joy 7LS
longwall shearer operating in the Tunnel Ridge Mine at Valley Grove, WV, USA. The
mine operates in the seven-foot thick Pittsburgh coal seam.
The initial design of a flooded-bed scrubber for a longwall shearer was completed in two
stages: (1) a 3-D computer-aided design (CAD) of the proposed concept was developed
and (2) a subsequent laboratory experiment was performed to measure the pressure drop
across a flooded-bed screen and a demister to select a proper fan for the scrubber before
fabricating a full-scale physical model of a modified longwall shearer.
3.1 Computer-aided Design Modeling
A modified longwall shearer design involved 3-D computer-aided design (CAD)
modeling of the conceptual design from the feedback and data gathered from various
sources. Trips were made to the Tunnel Ridge longwall mine at Valley Grove, WV and
the Joy Global assembly facility at Wheeling, WV to gather information regarding the
longwall mining conditions and Joy 7LS shearer specifications. Also, the inventors of the
flooded-bed scrubber for applications on a continuous miner, Dr. John Campbell and Mr.

42
Daniel Moynihan, who were consultants for this research, were frequently contacted for
their input on the design of the flooded-bed scrubber. Moreover, experts from NIOSH,
Mr. Jim Rider and Mr. Jay Colinet, were contacted on several occasions for their
feedback.
As a first step towards the modified shearer design, the author obtained 2-D and 3-D (.stl
file – non-editable) drawings of the original Joy 7LS shearer from Joy Global, Inc. The
double-drum Joy 7LS shearer is 15.7 m (51.5 feet) long, 1.65 m (65 inches) wide, and 1.2
m (47 inches) high, including the underframe. To create an editable 3-D model of the Joy
7LS shearer, the entire shearer was divided into seven parts: headgate drum, headgate
ranging arm, headgate drive, main body, tailgate drive, tailgate ranging arm, and tailgate
drum. Each part of the shearer was modeled separately, after removing minor details,
using the dimensions from the original drawings. The seven parts were then assembled to
create a complete shearer model. Figures 3.1 and 3.2 show the original and simplified
drawings of the shearer, respectively.
Figure 3.1: Original shearer drawing obtained from Joy Global, Inc.
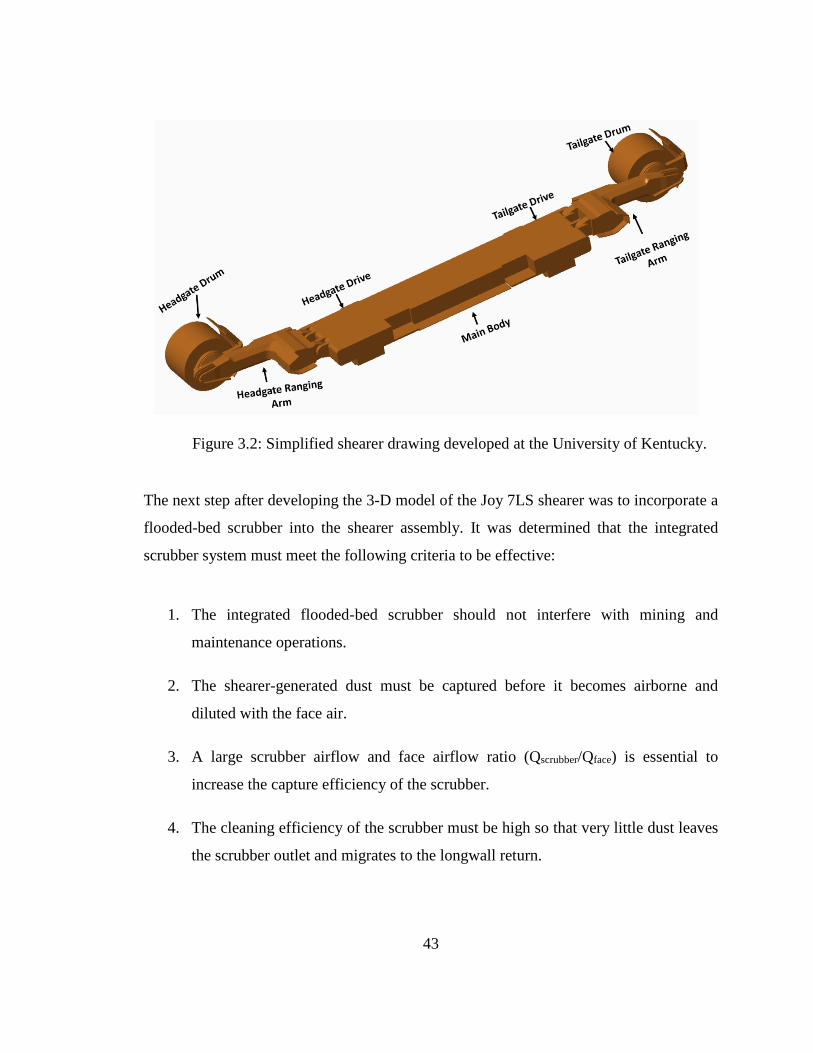
43
Figure 3.2: Simplified shearer drawing developed at the University of Kentucky.
The next step after developing the 3-D model of the Joy 7LS shearer was to incorporate a
flooded-bed scrubber into the shearer assembly. It was determined that the integrated
scrubber system must meet the following criteria to be effective:
1. The integrated flooded-bed scrubber should not interfere with mining and
maintenance operations.
2. The shearer-generated dust must be captured before it becomes airborne and
diluted with the face air.
3. A large scrubber airflow and face airflow ratio (Qscrubber/Qface) is essential to
increase the capture efficiency of the scrubber.
4. The cleaning efficiency of the scrubber must be high so that very little dust leaves
the scrubber outlet and migrates to the longwall return.
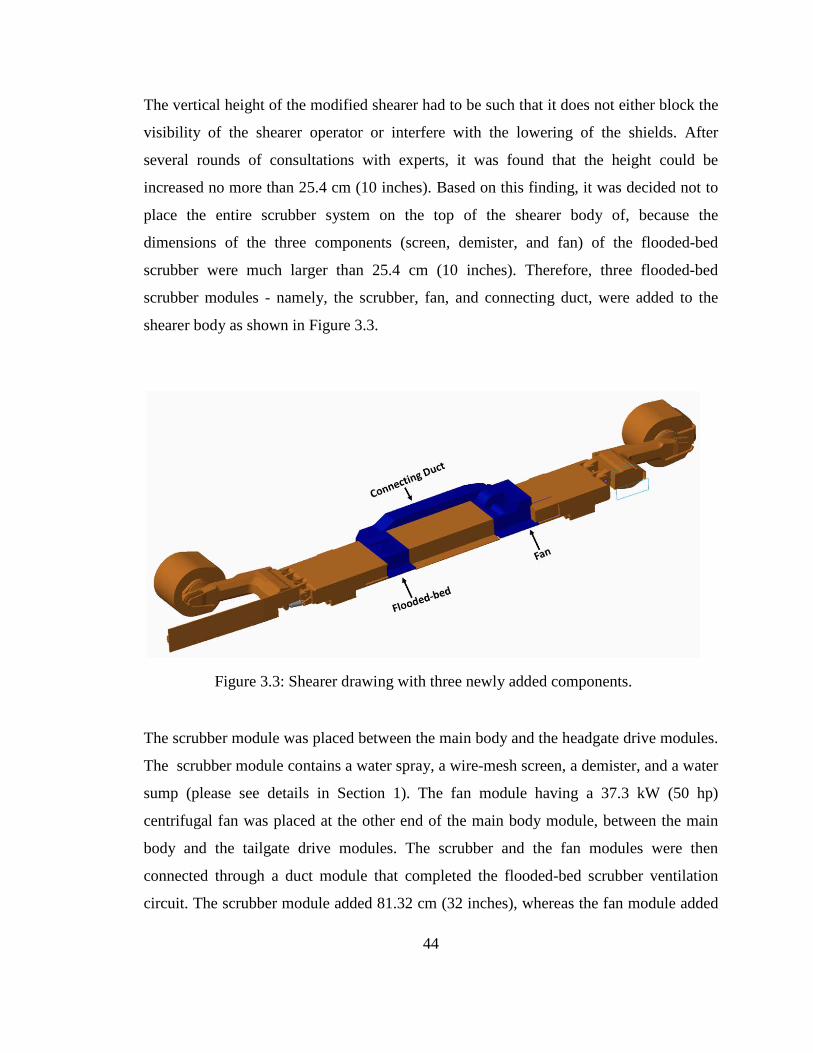
44
The vertical height of the modified shearer had to be such that it does not either block the
visibility of the shearer operator or interfere with the lowering of the shields. After
several rounds of consultations with experts, it was found that the height could be
increased no more than 25.4 cm (10 inches). Based on this finding, it was decided not to
place the entire scrubber system on the top of the shearer body of, because the
dimensions of the three components (screen, demister, and fan) of the flooded-bed
scrubber were much larger than 25.4 cm (10 inches). Therefore, three flooded-bed
scrubber modules - namely, the scrubber, fan, and connecting duct, were added to the
shearer body as shown in Figure 3.3.
Figure 3.3: Shearer drawing with three newly added components.
The scrubber module was placed between the main body and the headgate drive modules.
The scrubber module contains a water spray, a wire-mesh screen, a demister, and a water
sump (please see details in Section 1). The fan module having a 37.3 kW (50 hp)
centrifugal fan was placed at the other end of the main body module, between the main
body and the tailgate drive modules. The scrubber and the fan modules were then
connected through a duct module that completed the flooded-bed scrubber ventilation
circuit. The scrubber module added 81.32 cm (32 inches), whereas the fan module added
45
1.575 m (62 inches) to the original length of the shearer. The connecting duct increased
the shearer width by 43.18 cm (17 inch) towards the face. Inlet and outlet ducts, both
laying on the top of the headgate drive and tailgate drive, respectively, were connected to
the scrubber and fan modules (Figure 3.4).
Figure 3.4: Shearer drawing with inlet and outlet ducts.
The scrubber module consisted of a cuboid compartment with the following dimensions:
165.1 cm (65 inches) wide, 81.2 cm (32 inches) long, and 71.1 cm (28 inches) high. It
had a rectangular opening with a size equal to the narrow end of the rigid inlet duct. A
full-cone water spray of capacity 24.6 l/min (6.5 gpm) was mounted between the inlet
and scrubber mesh so that it wets the entire mesh. The 20-layer woven, 88.9-micron steel
mesh screen was mounted at an angle of approximately 45° to the scrubber inlet. The
demister was located downwind of the scrubber mesh, and a black-water sump was
placed under the demister to collect the dirty water flowing from the demister. The duct
module that connects the scrubber module to the fan module was rectangular with a
cross-section of 43.1 cm x 91.4 cm (17 x 36 inches) and a length of 4.57 m (180 inches).

46
The fan module consisted of two parts: a cuboid compartment that accommodated the
centrifugal fan and a cuboid compartment attached to the first compartment for a smooth
airflow transition from the fan to the outlet. The former was 165.1 cm (65 inches) wide,
99.0 cm (39 inches) long, and 101.6 cm (40 inches) high. The latter was 165.1 cm (65
inches) wide, 58.4 cm (23 inches) long, and 101.6 cm (40 inches) high. The 37.3 kW (50
hp), 3540 rpm centrifugal fan was capable of drawing 7.0 m3/s (15 kcfm) of airflow at 2
kPa (8 in. wg.).
The inlet duct, which had a cross-section of 165.1 cm x 25.4 cm (65 x 10 inches) and a
length of 2.76 m (109 inches), was placed on the top of the headgate drive. The
downwind end of the duct attached to the scrubber was narrowed to 119.3 cm (47 inches)
x 25.4 cm (10 inches), matching the scrubber inlet dimensions. The outlet module had a
cross-section of 165 cm (65 inches) x 25.4 cm (10 inches) and a length of 1.90 m (75
inches), and was placed on the top of the tailgate drive. Similar to the inlet duct, the
upwind end of the outlet module was narrowed to 121.9 cm (48 inches) x 25.4 cm (10
inches) to match the fan module outlet.
The primary function of the scrubber system was to capture the dust generated by the
headgate drum before the dust is diluted by ventilation air. Therefore, a hinged duct
extension was connected to the inlet duct to bring the scrubber inlet as close as possible
to the shearer drum, as shown in Figure 3.5. The inlet extension was 92.7 cm (36.5
inches) long and 165.1 cm (65 inches) wide. It was closed on two sides but open at the
bottom. It followed the motion of the headgate ranging arm, maintaining a fixed gap of
38.1 cm (15 inches) at the inlet. Furthermore, the outlet of the flooded-bed scrubber was
placed as far downwind of the fan as possible to divert the scrubbed air away from the
operator.
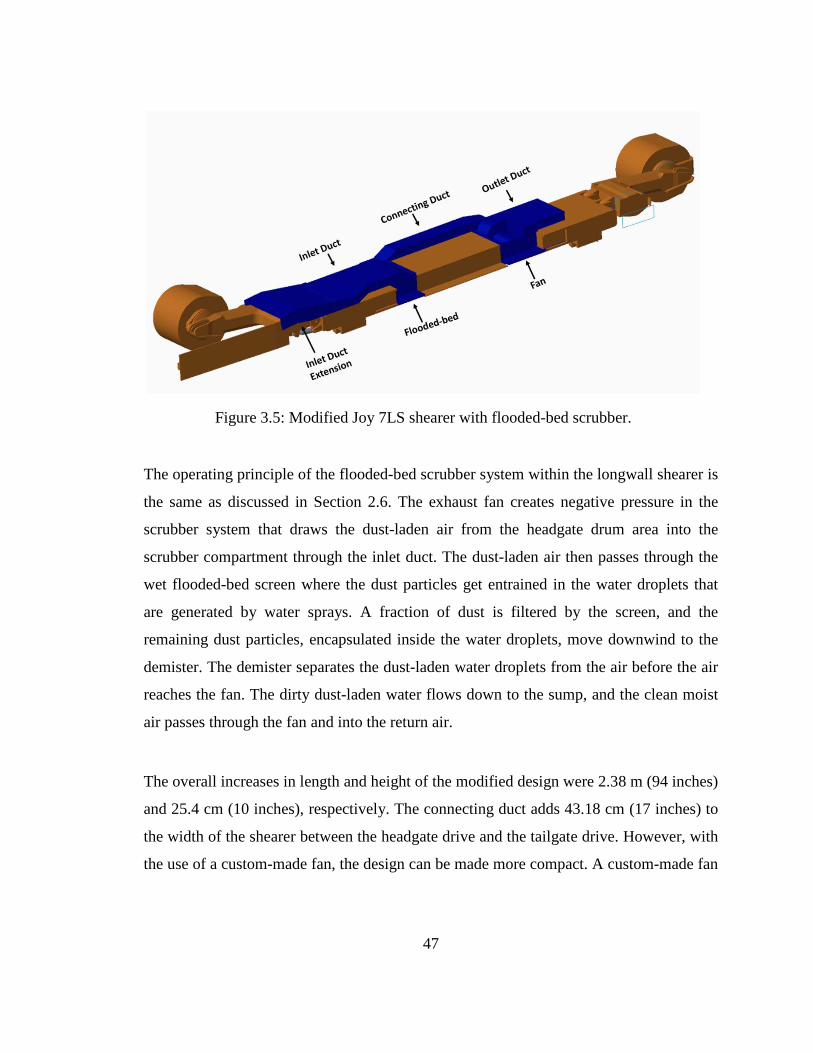
47
Figure 3.5: Modified Joy 7LS shearer with flooded-bed scrubber.
The operating principle of the flooded-bed scrubber system within the longwall shearer is
the same as discussed in Section 2.6. The exhaust fan creates negative pressure in the
scrubber system that draws the dust-laden air from the headgate drum area into the
scrubber compartment through the inlet duct. The dust-laden air then passes through the
wet flooded-bed screen where the dust particles get entrained in the water droplets that
are generated by water sprays. A fraction of dust is filtered by the screen, and the
remaining dust particles, encapsulated inside the water droplets, move downwind to the
demister. The demister separates the dust-laden water droplets from the air before the air
reaches the fan. The dirty dust-laden water flows down to the sump, and the clean moist
air passes through the fan and into the return air.
The overall increases in length and height of the modified design were 2.38 m (94 inches)
and 25.4 cm (10 inches), respectively. The connecting duct adds 43.18 cm (17 inches) to
the width of the shearer between the headgate drive and the tailgate drive. However, with
the use of a custom-made fan, the design can be made more compact. A custom-made fan
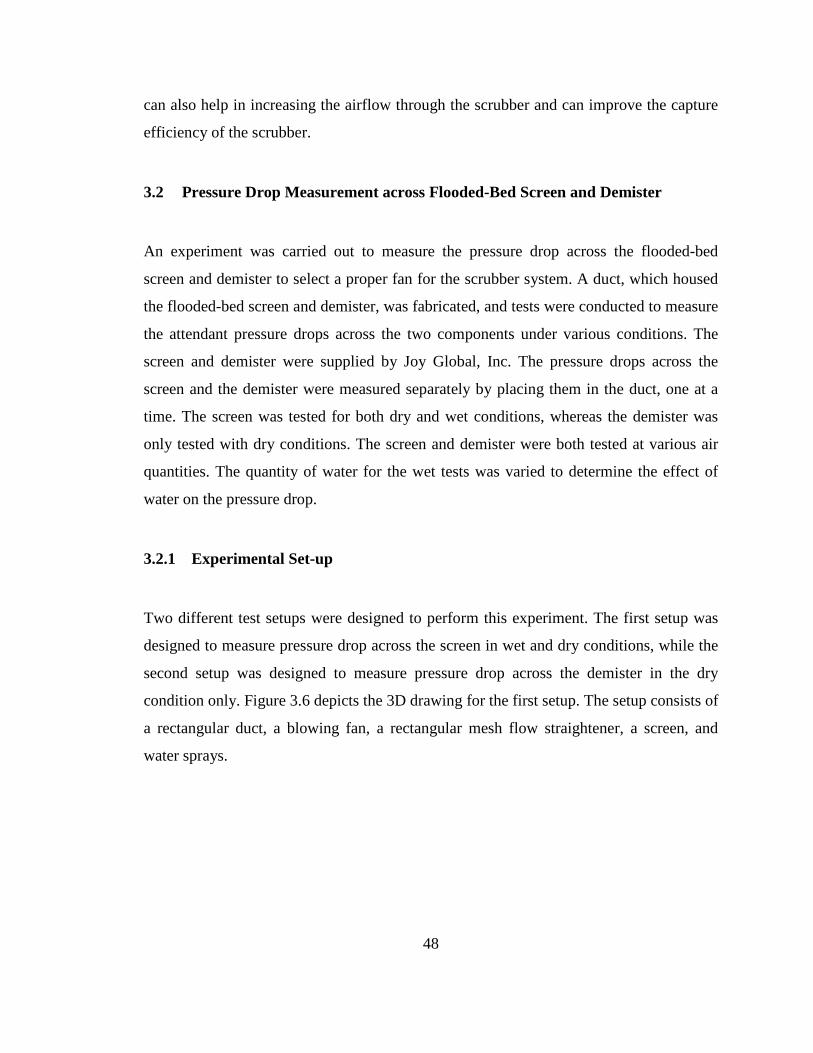
48
can also help in increasing the airflow through the scrubber and can improve the capture
efficiency of the scrubber.
3.2 Pressure Drop Measurement across Flooded-Bed Screen and Demister
An experiment was carried out to measure the pressure drop across the flooded-bed
screen and demister to select a proper fan for the scrubber system. A duct, which housed
the flooded-bed screen and demister, was fabricated, and tests were conducted to measure
the attendant pressure drops across the two components under various conditions. The
screen and demister were supplied by Joy Global, Inc. The pressure drops across the
screen and the demister were measured separately by placing them in the duct, one at a
time. The screen was tested for both dry and wet conditions, whereas the demister was
only tested with dry conditions. The screen and demister were both tested at various air
quantities. The quantity of water for the wet tests was varied to determine the effect of
water on the pressure drop.
3.2.1 Experimental Set-up
Two different test setups were designed to perform this experiment. The first setup was
designed to measure pressure drop across the screen in wet and dry conditions, while the
second setup was designed to measure pressure drop across the demister in the dry
condition only. Figure 3.6 depicts the 3D drawing for the first setup. The setup consists of
a rectangular duct, a blowing fan, a rectangular mesh flow straightener, a screen, and
water sprays.

49
Figure 3.6: 3D drawing showing the screen and the water sprays in the duct.
The rectangular duct, with cross-section 69.85 cm (27.50 inches) x 55.88 cm (22.00
inches) and length 7.3152 m (24.00 feet), was built to accommodate the flooded-bed
screen and demister, which have cross-sections 64.13 cm (22.25 inches) x 79.37 cm
(31.25 inches) and 62.23 cm (24.50 inches) x 54.61 cm (21.50 inches), respectively. The
top of the duct was made of transparent acrylic plastic sheet for clear visibility inside the
duct during testing. One end of the duct was connected to an axial blowing fan (Peabody
ABC Corp., 25 hp, 1770 RPM) and the other end was kept open in the atmosphere. The
rectangular mesh flow straightener of 2.54 cm (1 inch) thickness was placed downwind
immediately after the fan at the end of the duct to remove disturbances from the flow and
to achieve a fully developed velocity profile upwind of the screen. A 20-layer woven,
88.9-micron steel mesh screen was placed 3.96 m (13.00 feet) downwind of the flow
straightener at an approximately 500 angle. Four, full cone water sprays were strategically
placed upwind of the screen to make the screen fully wet for the wet condition
experiments. A water storage tank supplied water to the sprays at a rate ranging from
0.72 l/s (11.45 gpm) to 1.34 l/s (21.35 gpm), through a water pump. In the second setup,
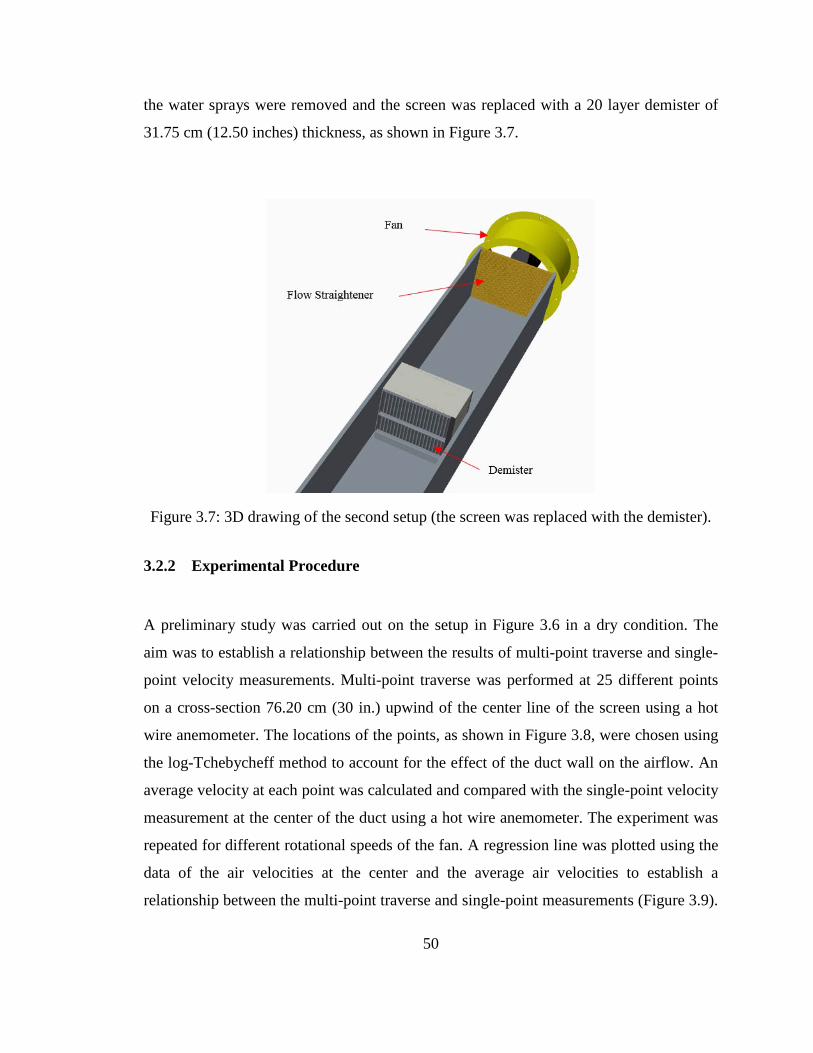
50
the water sprays were removed and the screen was replaced with a 20 layer demister of
31.75 cm (12.50 inches) thickness, as shown in Figure 3.7.
Figure 3.7: 3D drawing of the second setup (the screen was replaced with the demister).
3.2.2 Experimental Procedure
A preliminary study was carried out on the setup in Figure 3.6 in a dry condition. The
aim was to establish a relationship between the results of multi-point traverse and single-
point velocity measurements. Multi-point traverse was performed at 25 different points
on a cross-section 76.20 cm (30 in.) upwind of the center line of the screen using a hot
wire anemometer. The locations of the points, as shown in Figure 3.8, were chosen using
the log-Tchebycheff method to account for the effect of the duct wall on the airflow. An
average velocity at each point was calculated and compared with the single-point velocity
measurement at the center of the duct using a hot wire anemometer. The experiment was
repeated for different rotational speeds of the fan. A regression line was plotted using the
data of the air velocities at the center and the average air velocities to establish a
relationship between the multi-point traverse and single-point measurements (Figure 3.9).

51
During the main experiments, the air velocity was measured only at the center, and the
relationship from the chart was used to calculate the average velocity in the duct. The
pressure drop across the screen/demister was measured using two pitot-static tubes; first
was placed 76.20 cm (30 in.) upwind and the second was placed 76.20 m (30 in.)
downwind of the screen/demister. The wet and dry experiments were performed for
different fan speeds. In the wet condition, the quantity of the water through water sprays
was varied by changing the relief-valve pressure of the water pump. As expected, the
amount of water applied to the screen changed the resistance and therefore the airflow
rate through the screen. The result section includes further discussion on these changes.
Figure 3.8: Locations of the measurement points on the cross-section upwind the
screen.
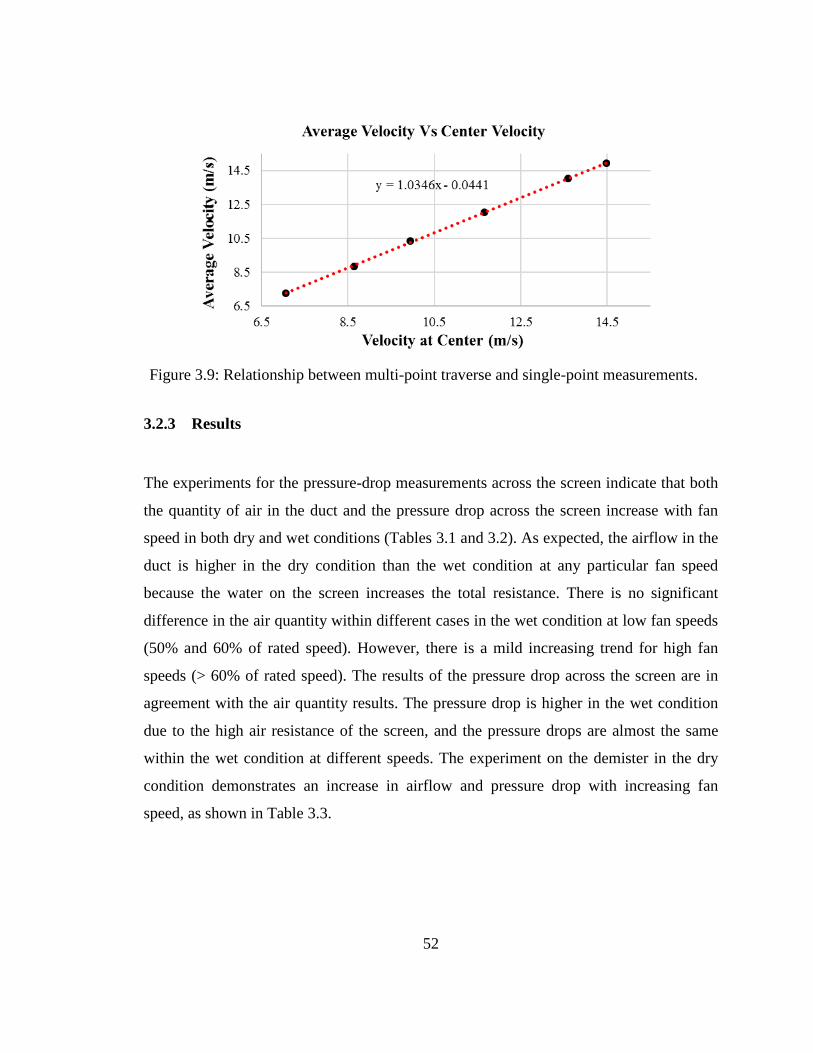
52
Figure 3.9: Relationship between multi-point traverse and single-point measurements.
3.2.3 Results
The experiments for the pressure-drop measurements across the screen indicate that both
the quantity of air in the duct and the pressure drop across the screen increase with fan
speed in both dry and wet conditions (Tables 3.1 and 3.2). As expected, the airflow in the
duct is higher in the dry condition than the wet condition at any particular fan speed
because the water on the screen increases the total resistance. There is no significant
difference in the air quantity within different cases in the wet condition at low fan speeds
(50% and 60% of rated speed). However, there is a mild increasing trend for high fan
speeds (> 60% of rated speed). The results of the pressure drop across the screen are in
agreement with the air quantity results. The pressure drop is higher in the wet condition
due to the high air resistance of the screen, and the pressure drops are almost the same
within the wet condition at different speeds. The experiment on the demister in the dry
condition demonstrates an increase in airflow and pressure drop with increasing fan
speed, as shown in Table 3.3.
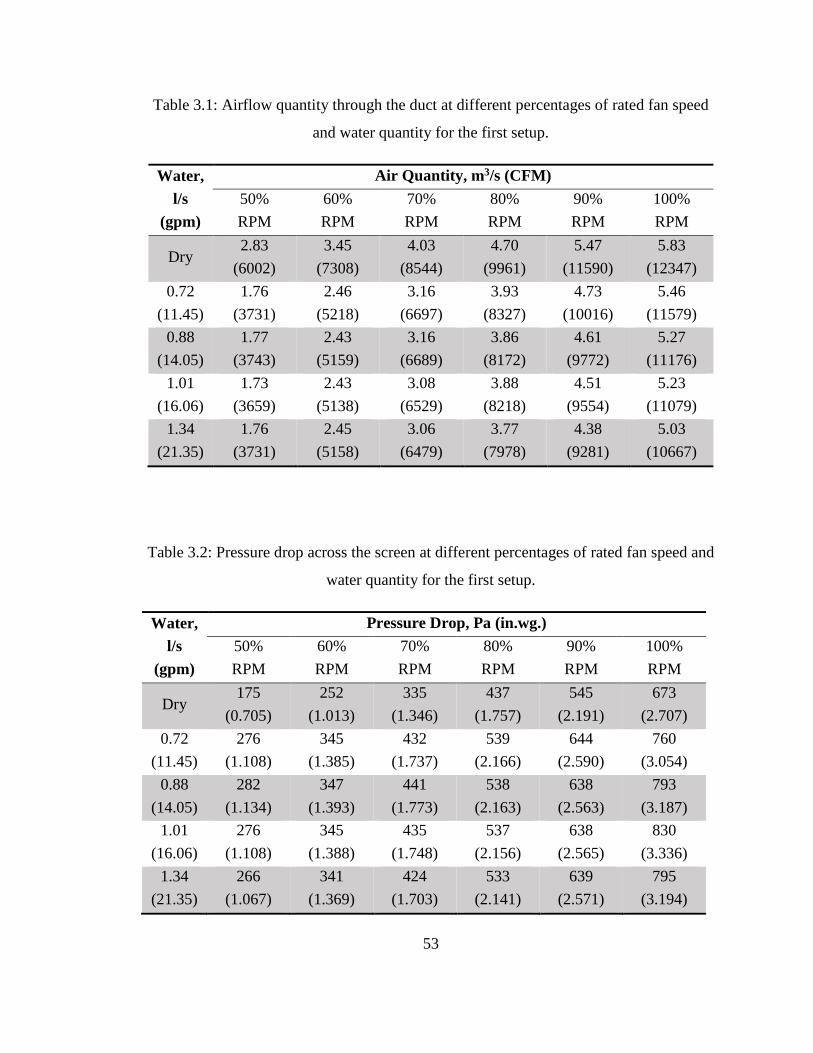
53
Table 3.1: Airflow quantity through the duct at different percentages of rated fan speed
and water quantity for the first setup.
Water, l/s
(gpm)
Air Quantity, m3/s (CFM) 50% RPM
60% RPM
70% RPM
80% RPM
90% RPM
100% RPM
Dry 2.83
(6002) 3.45
(7308) 4.03
(8544) 4.70
(9961) 5.47
(11590) 5.83
(12347) 0.72
(11.45) 1.76
(3731) 2.46
(5218) 3.16
(6697) 3.93
(8327) 4.73
(10016) 5.46
(11579) 0.88
(14.05) 1.77
(3743) 2.43
(5159) 3.16
(6689) 3.86
(8172) 4.61
(9772) 5.27
(11176) 1.01
(16.06) 1.73
(3659) 2.43
(5138) 3.08
(6529) 3.88
(8218) 4.51
(9554) 5.23
(11079) 1.34
(21.35) 1.76
(3731) 2.45
(5158) 3.06
(6479) 3.77
(7978) 4.38
(9281) 5.03
(10667)
Table 3.2: Pressure drop across the screen at different percentages of rated fan speed and
water quantity for the first setup.
Water, l/s
(gpm)
Pressure Drop, Pa (in.wg.) 50% RPM
60% RPM
70% RPM
80% RPM
90% RPM
100% RPM
Dry 175
(0.705) 252
(1.013) 335
(1.346) 437
(1.757) 545
(2.191) 673
(2.707) 0.72
(11.45) 276
(1.108) 345
(1.385) 432
(1.737) 539
(2.166) 644
(2.590) 760
(3.054) 0.88
(14.05) 282
(1.134) 347
(1.393) 441
(1.773) 538
(2.163) 638
(2.563) 793
(3.187) 1.01
(16.06) 276
(1.108) 345
(1.388) 435
(1.748) 537
(2.156) 638
(2.565) 830
(3.336) 1.34
(21.35) 266
(1.067) 341
(1.369) 424
(1.703) 533
(2.141) 639
(2.571) 795
(3.194)
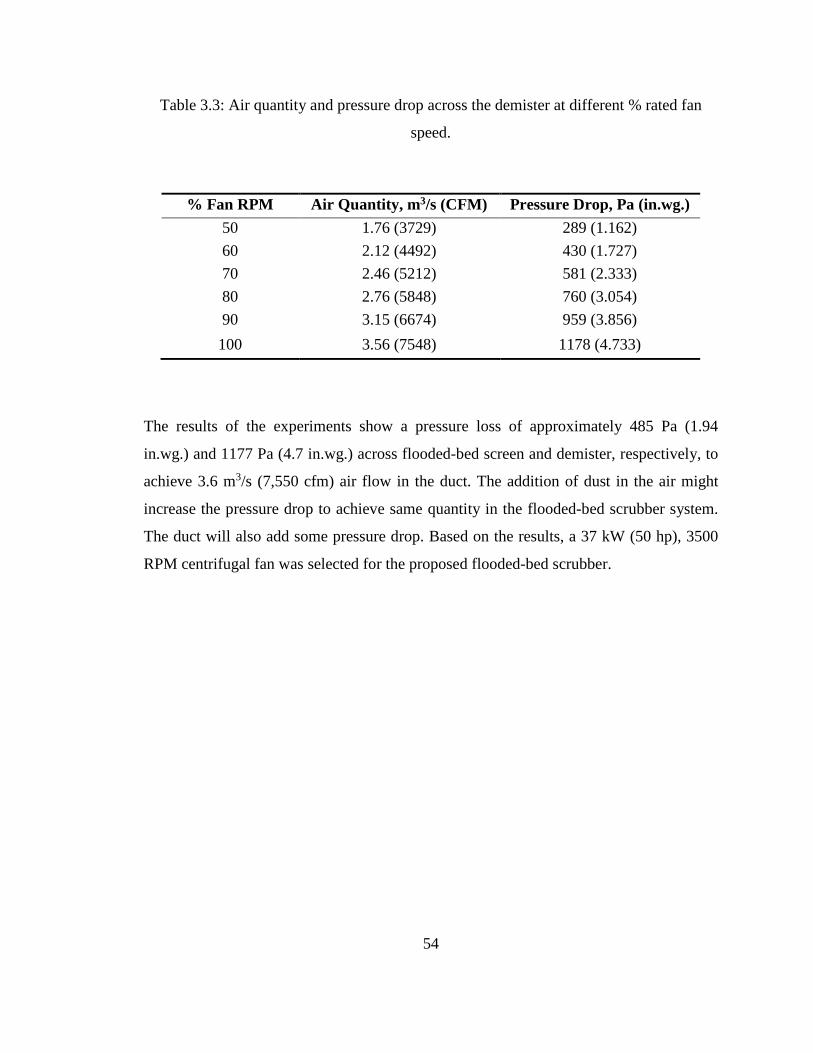
54
Table 3.3: Air quantity and pressure drop across the demister at different % rated fan
speed.
The results of the experiments show a pressure loss of approximately 485 Pa (1.94
in.wg.) and 1177 Pa (4.7 in.wg.) across flooded-bed screen and demister, respectively, to
achieve 3.6 m3/s (7,550 cfm) air flow in the duct. The addition of dust in the air might
increase the pressure drop to achieve same quantity in the flooded-bed scrubber system.
The duct will also add some pressure drop. Based on the results, a 37 kW (50 hp), 3500
RPM centrifugal fan was selected for the proposed flooded-bed scrubber.
% Fan RPM Air Quantity, m3/s (CFM) Pressure Drop, Pa (in.wg.) 50 1.76 (3729) 289 (1.162) 60 2.12 (4492) 430 (1.727) 70 2.46 (5212) 581 (2.333) 80 2.76 (5848) 760 (3.054) 90 3.15 (6674) 959 (3.856) 100 3.56 (7548) 1178 (4.733)
55
4 PROTOTYPE FABRICATION
A full-scale mock-up of the modified Joy 7LS double drum shearer was fabricated at the
Department of Mining Engineering, University of Kentucky. The purpose was to test the
effectiveness of the flooded-bed scrubber on the dust capture at a simulated longwall
face. As discussed in Chapter 3.1, the modified shearer was divided into a total of the
following twelve modules:
1. headgate drum,
2. headgate ranging arm,
3. headgate drive,
4. main body,
5. tailgate drive,
6. tailgate ranging arm,
7. tailgate drum,
8. scrubber,
9. fan,
10. connecting duct,
11. inlet, and
12. outlet.
Each module was fabricated separately in the following sequence, except the headgate
and tailgate drums:

56
1. 3-D framework and sheet metal modeling to build the structure (skeleton) and
skin, respectively, of a module,
2. Building the metal frame structure from the 3-D CAD framework model,
3. Covering the metal frame structure with plastic sheets, and
4. Assembling the different modules to build the complete modified full scale model
of Joy 7LS shearer.
Three-dimensional CAD models with all the specification information and manufacturing
components’ features for each module of the prototype were created before building the
physical model. The CAD models in this stage were different from the CAD models in
Chapter 3.1. They were comprised of framework and sheet metal modeling using the
same CAD software (PTC Creo Parametric 3.0) and dimensions of the editable 3-D
models in Chapter 3.1. The modeling was performed in three steps: (1) the structure
(skeleton) of each module was developed using the framework feature of the PTC Creo
Parametric 3.0, (2) the structures were covered with plastic sheets using the sheet metal
feature of the PTC Creo Parametric 3.0, (3) different components of a module were
placed inside using the assembly feature of the PTC Creo Parametric 3.0. Figures 4.1,
4.2, and 4.3 show the first step of the 3-D modeling that include 3-D models from
Chapter 3 and their corresponding framework for the main body, the head gate drive, and
the head gate ranging arm, respectively.
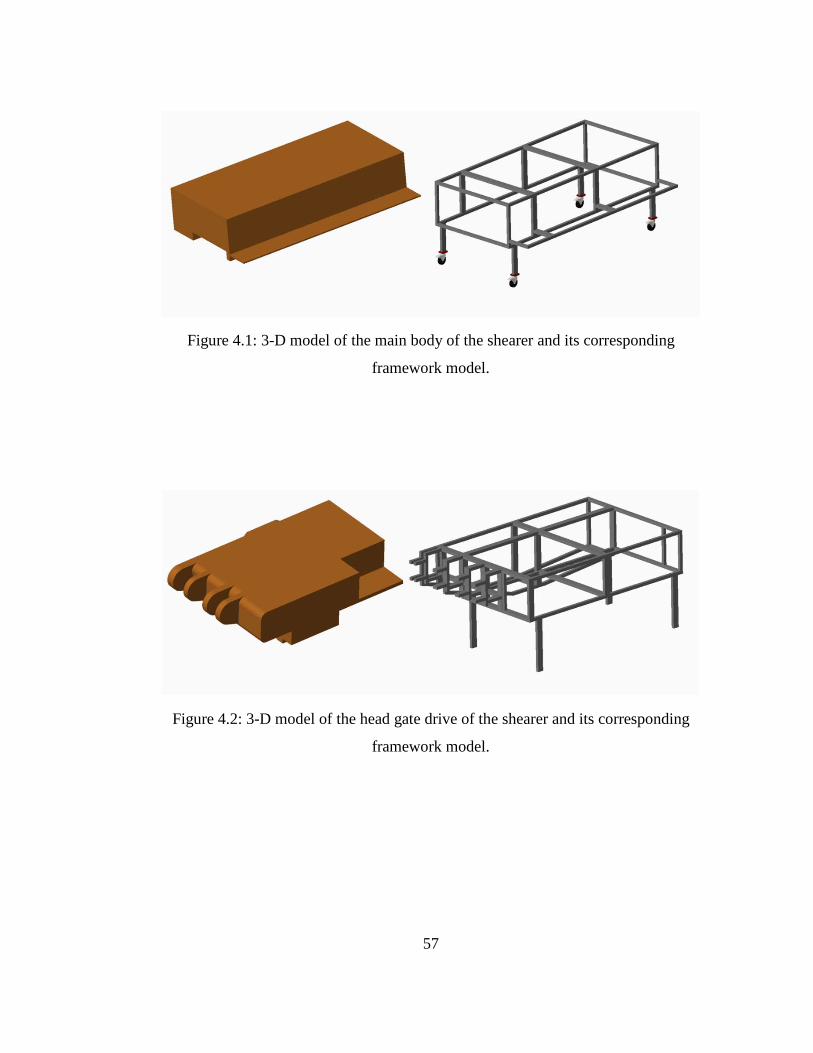
57
Figure 4.1: 3-D model of the main body of the shearer and its corresponding
framework model.
Figure 4.2: 3-D model of the head gate drive of the shearer and its corresponding
framework model.

58
Figure 4.3: 3-D model of the ranging arm of the shearer and its corresponding framework
model.
The primary objective of 3-D modeling at this stage was to have interactive visual
representation of each module and the final physical model. This process improves
accuracy and brings the advantage of scenario visualization. In addition, it offers
unprecedented insight and allows one to see the end result before it is built and hence,
helps to avoid costly mistakes. The 3-D model included all the fabrication details, such as
size and length of the extruded profile used for the framework, location and quantity of
different fasteners and brackets, dimensions of the plastic covering a specific area, and
locations of casters, motors, and different control devices. Figures 4.4, 4.5, and 4.6 show
the final step of the 3-D modeling that include 3-D models from Chapter 3 and their
corresponding prototype models for the main body, the head gate drive, and the head gate
ranging arm, respectively. For simplicity, all the round corners were replaced with sharp
corners and minor components, such as bolts, screws, and pins were not represented.

59
Figure 4.4: 3-D model of the main body of the shearer and its corresponding prototype
model.
Figure 4.5: 3-D model of the head gate drive of the shearer and its corresponding
prototype model.

60
Figure 4.6: 3-D model of the ranging arm of the shearer and its corresponding
prototype model.
The following five new flooded-bed scrubber modules (see Figures 4.7 through 4.11)
were added to accommodate the flooded-bed scrubber into the longwall shearer:
1. Scrubber: placed between the headgate drive and the body of the shearer,
2. Fan: placed between the body of the shearer and the tailgate drive,
3. Connecting duct: connects flooded-bed module to the fan housing module,
4. Inlet duct with extension: connected to the flooded-bed, and
5. Outlet duct: connected to the fan housing.

61
Figure 4.7: 3-D prototype model of the scrubber module.
Figure 4.8: 3-D prototype model of the fan module.
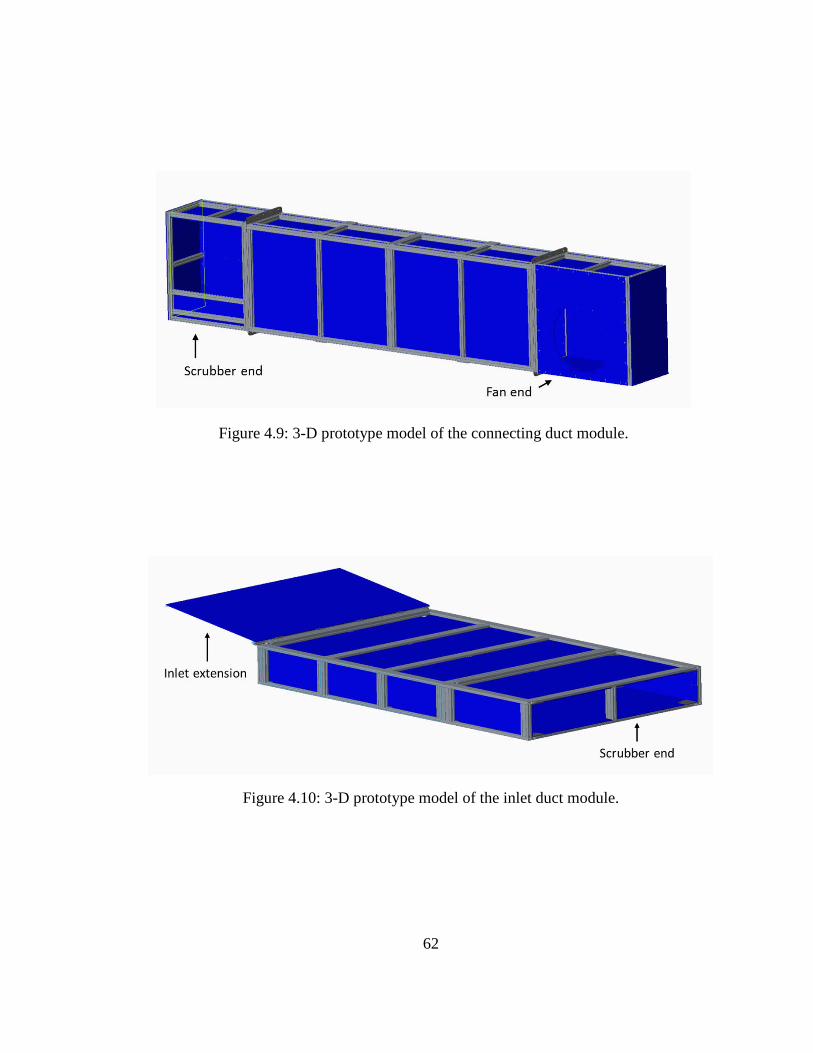
62
Figure 4.9: 3-D prototype model of the connecting duct module.
Figure 4.10: 3-D prototype model of the inlet duct module.

63
Figure 4.11: 3-D prototype model of the outlet duct module.
Similar to the CAD modeling, the first step towards building a prototype of each module
was to build the structure (skeleton) of each module. The 80/20 aluminum extruded
profiles, fasteners, and joining plates were selected for this purpose, considering their
high strength, high strength to weight ratio, resilience, and easily machined properties.
The 80/20 is a modular T-slotted framing system using extruded beams of 6105-T5
aluminum alloy manufactured by 80/20, Inc. Figure 4.12 shows the extruded profile,
fastener, and joining plate used for building the structures for different modules.
Figure 4.12: From left to right: 80/20 extrusion, corner bracket, and joining plate.
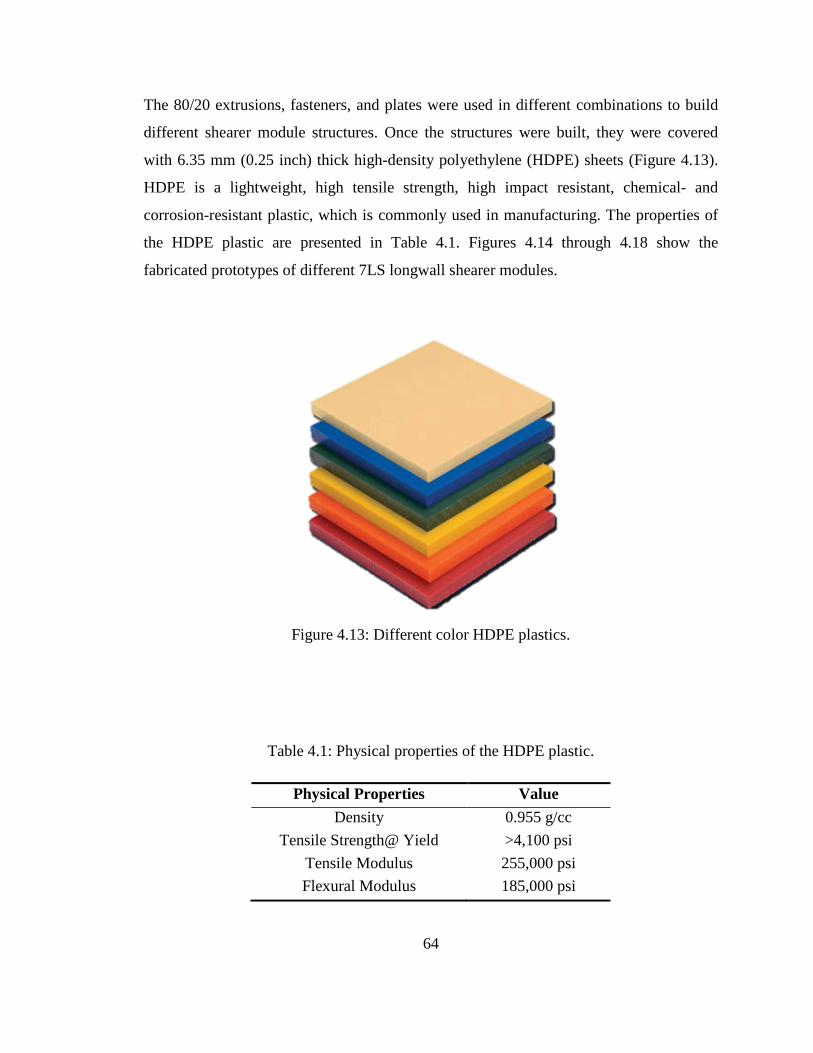
64
The 80/20 extrusions, fasteners, and plates were used in different combinations to build
different shearer module structures. Once the structures were built, they were covered
with 6.35 mm (0.25 inch) thick high-density polyethylene (HDPE) sheets (Figure 4.13).
HDPE is a lightweight, high tensile strength, high impact resistant, chemical- and
corrosion-resistant plastic, which is commonly used in manufacturing. The properties of
the HDPE plastic are presented in Table 4.1. Figures 4.14 through 4.18 show the
fabricated prototypes of different 7LS longwall shearer modules.
Figure 4.13: Different color HDPE plastics.
Table 4.1: Physical properties of the HDPE plastic.
Physical Properties Value Density 0.955 g/cc
Tensile Strength@ Yield >4,100 psi Tensile Modulus 255,000 psi Flexural Modulus 185,000 psi
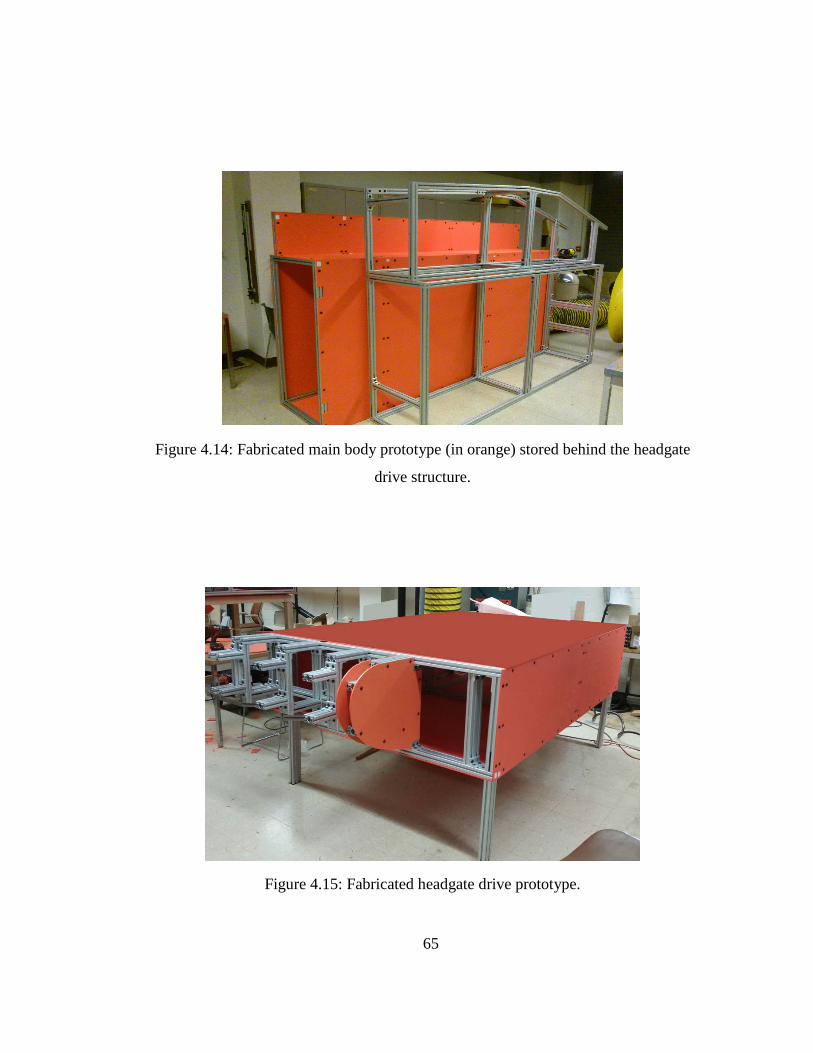
65
Figure 4.14: Fabricated main body prototype (in orange) stored behind the headgate
drive structure.
Figure 4.15: Fabricated headgate drive prototype.

66
Figure 4.16: Fabricated headgate ranging arm prototype.
Figure 4.17: An assembly of headgate ranging arm and headgate drive modules.
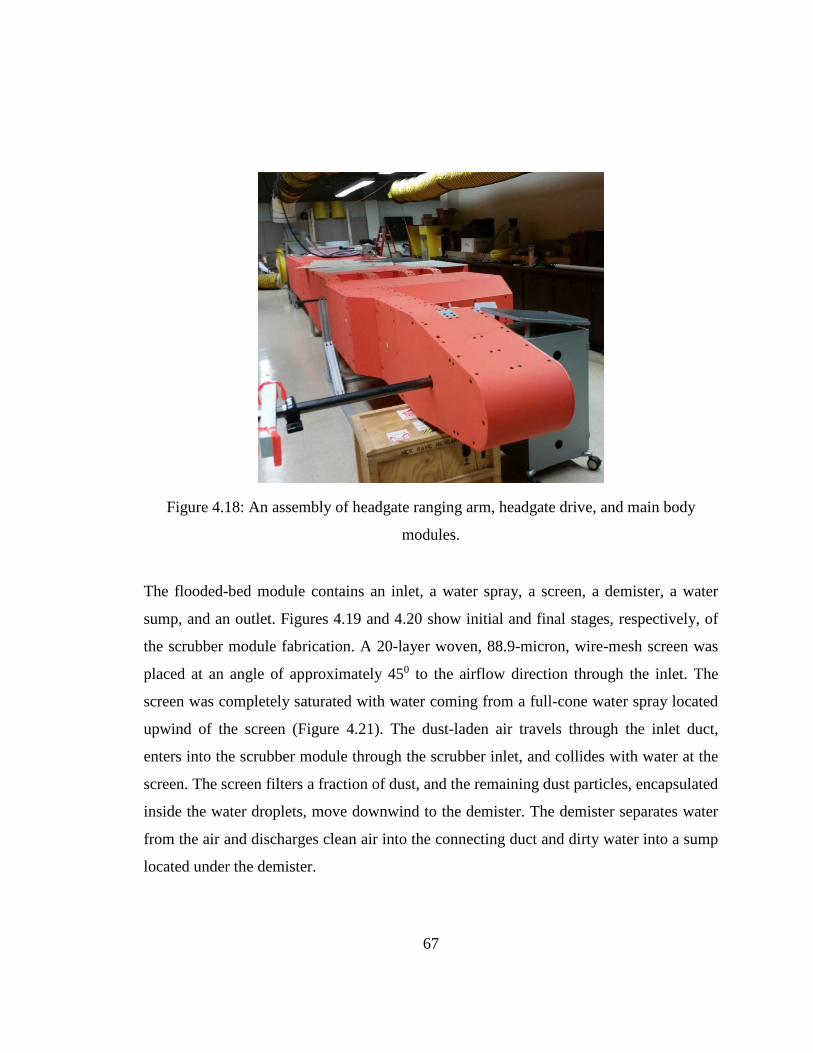
67
Figure 4.18: An assembly of headgate ranging arm, headgate drive, and main body
modules.
The flooded-bed module contains an inlet, a water spray, a screen, a demister, a water
sump, and an outlet. Figures 4.19 and 4.20 show initial and final stages, respectively, of
the scrubber module fabrication. A 20-layer woven, 88.9-micron, wire-mesh screen was
placed at an angle of approximately 450 to the airflow direction through the inlet. The
screen was completely saturated with water coming from a full-cone water spray located
upwind of the screen (Figure 4.21). The dust-laden air travels through the inlet duct,
enters into the scrubber module through the scrubber inlet, and collides with water at the
screen. The screen filters a fraction of dust, and the remaining dust particles, encapsulated
inside the water droplets, move downwind to the demister. The demister separates water
from the air and discharges clean air into the connecting duct and dirty water into a sump
located under the demister.

68
Figure 4.19: Fabrication of scrubber module prototype.
Figure 4.20: Complete scrubber module prototype.

69
Figure 4.21: Inside view of the scrubber module.
The fan module was comprised of an inlet, a centrifugal fan, and an outlet. A 37.285 kW
(50hp), 3540 rated RPM centrifugal fan (Figure 4.22) was used to pull air through the
scrubber system. A variable frequency drive (VFD) was used to control the fan motor
speed (RPM) and hence the amount of air through the scrubber system. The outlet of the
flooded-bed module was connected to the inlet of the fan module with the connecting
duct module. The inlet duct was placed on the top of the headgate drive and connected to
the scrubber module inlet. The outlet duct was placed on top of the tailgate drive and
connected to the outlet of the fan module. A 186.4 W (0.25 hp), 47 RPM gear motor
(Figure 4.23) was placed in the headgate ranging arm and used to drive the headgate
drum through a belt-pulley system.
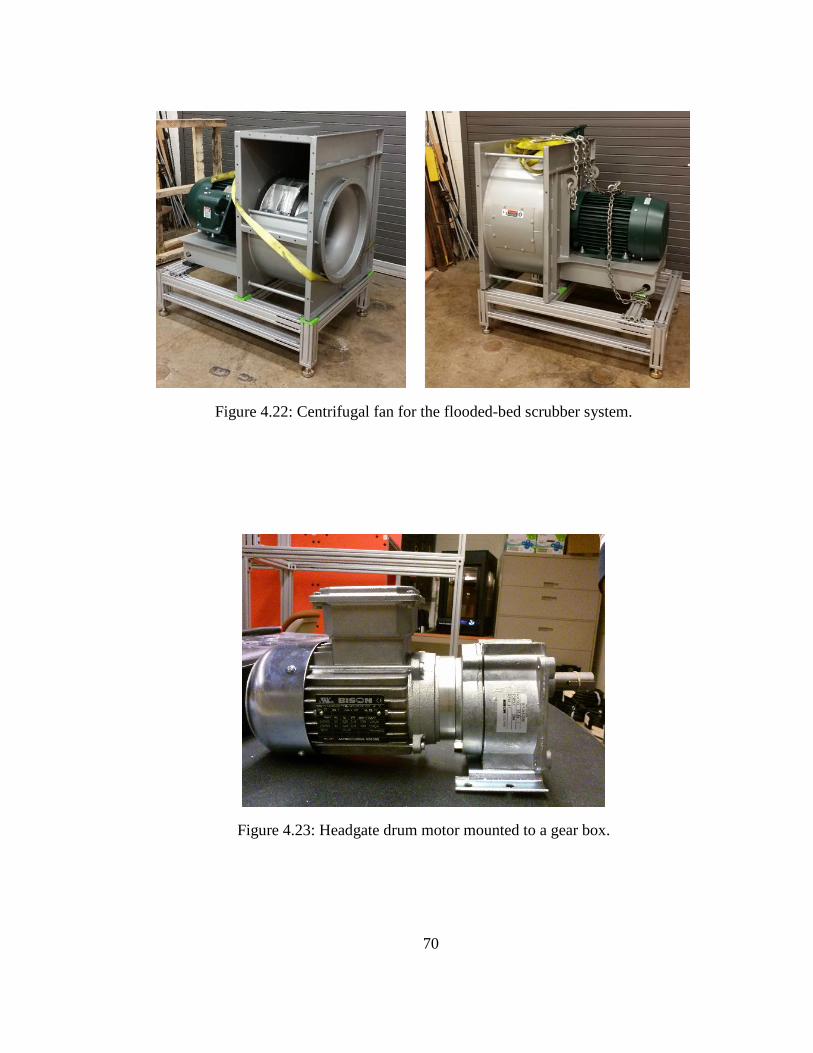
70
Figure 4.22: Centrifugal fan for the flooded-bed scrubber system.
Figure 4.23: Headgate drum motor mounted to a gear box.

71
The headgate drum was fabricated in four steps. Firstly, a hollow cylinder of inside and
outside diameters 55.88 cm (40 inches) and 101.6 cm (40 inches), respectively, with a
length of 106.68 cm (42 inches) was built using a 55.88 cm (22 inches) diameter plastic
barrel inscribed inside a 101.6 cm (40 inches) diameter cardboard cylinder. The space
between the two cylinders was filled with expanding urethane foam (Figure 4.24). The
cylinder was smoothed using a Bosch, 12 Amp, fixed-base, router and jig (Figure 4.25).
Subsequently, spiral scrolls were created using 5.08 cm (2 inches) thick, closed cell, rigid
foam boards (FOAMULAR 150) and fastened to the surface of the hollow cylinder
(Figure 4.26). A hot-wire foam cutter jig was used for this purpose. Successively, a 3-D
printed model of the shearer cutter bit was developed and a mold of the cutting bit was
created. Using the mold, cutting bits were casted using high-density expanding urethane
foam and attached to the spiral scrolls Figure 4.27. Finally, the cutter drum was coated
with Rhino Lining in an automotive paint booth (Figure 4.28). The headgate drum was
equipped with 42 cutting picks, each having a full-cone water spray aiming the pick of
the cutting bit. The tailgate drum was made of a cardboard cylinder coated with Rhino
Lining, but with no cutting pick and no sprays.
Figure 4.24: Processes involved in creating the shearer drum.
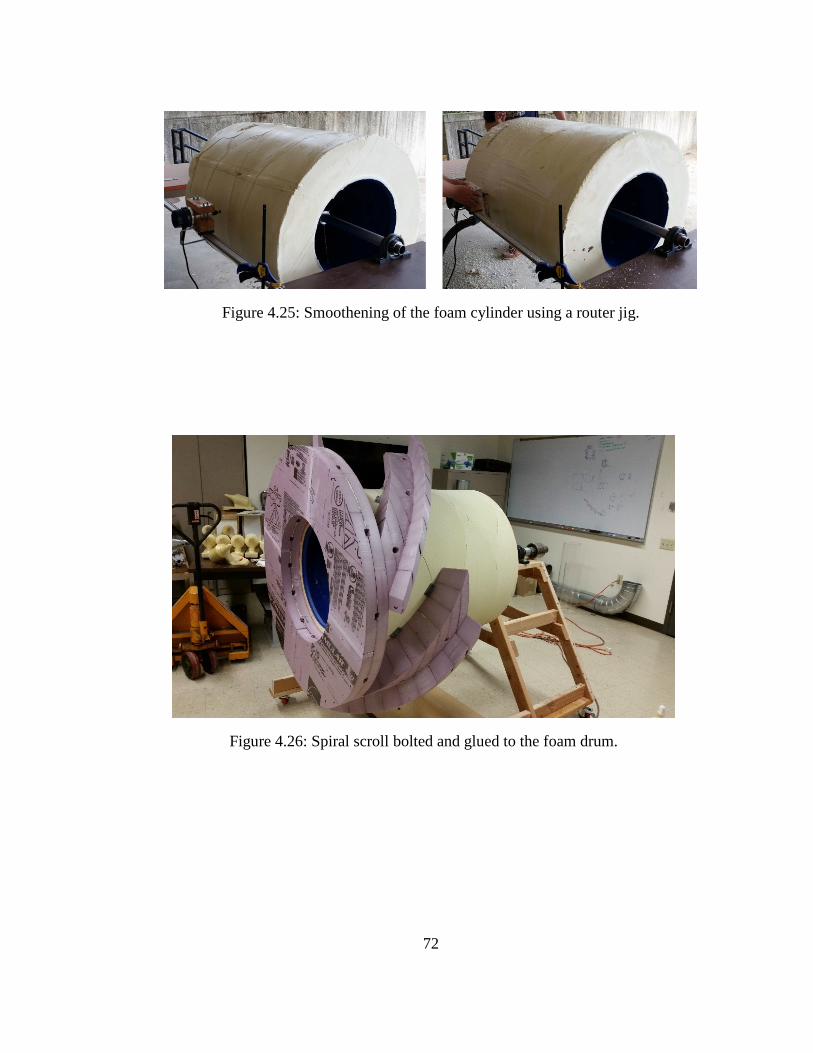
72
Figure 4.25: Smoothening of the foam cylinder using a router jig.
Figure 4.26: Spiral scroll bolted and glued to the foam drum.

73
Figure 4.27: Cutting bits fastened to the spiral scroll.
Figure 4.28: Final headgate drum prototype coated with Rhino Lining.
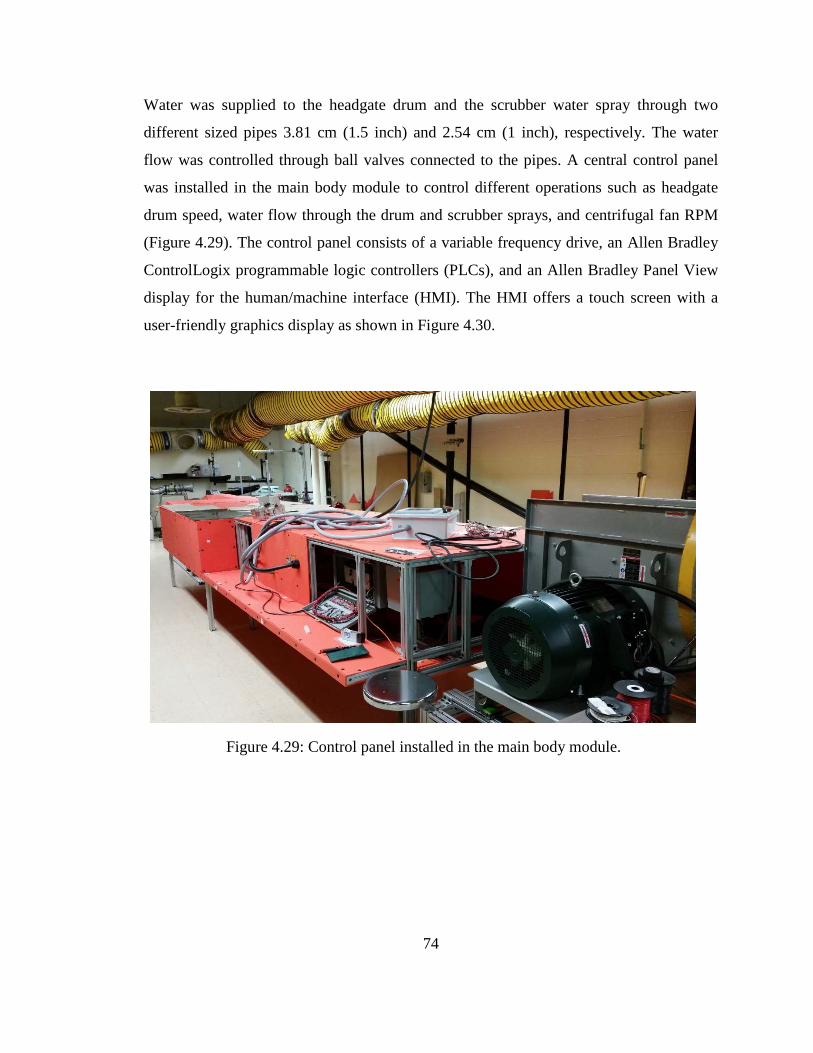
74
Water was supplied to the headgate drum and the scrubber water spray through two
different sized pipes 3.81 cm (1.5 inch) and 2.54 cm (1 inch), respectively. The water
flow was controlled through ball valves connected to the pipes. A central control panel
was installed in the main body module to control different operations such as headgate
drum speed, water flow through the drum and scrubber sprays, and centrifugal fan RPM
(Figure 4.29). The control panel consists of a variable frequency drive, an Allen Bradley
ControlLogix programmable logic controllers (PLCs), and an Allen Bradley Panel View
display for the human/machine interface (HMI). The HMI offers a touch screen with a
user-friendly graphics display as shown in Figure 4.30.
Figure 4.29: Control panel installed in the main body module.

75
Figure 4.30: HMI display for PLC control.
Finally, all the modules were assembled in the longwall dust gallery at the Pittsburgh
Research Laboratory (PRL) of NIOSH for testing. Figures 4.31 and 4.32 show back and
front views, respectively, of the assembled prototype placed outside the loading dock at
the Department of Mining Engineering, University of Kentucky for preliminary testing.
However, due to the space restriction, it was not possible to accommodate the full
assembly, therefore the tailgate ranging arm and the tailgate drum are missing in the
pictures. The orange color modules represent original Joy 7LS longwall shearer, whereas
the blue color modules represent flooded-bed scrubber components added to the shearer.
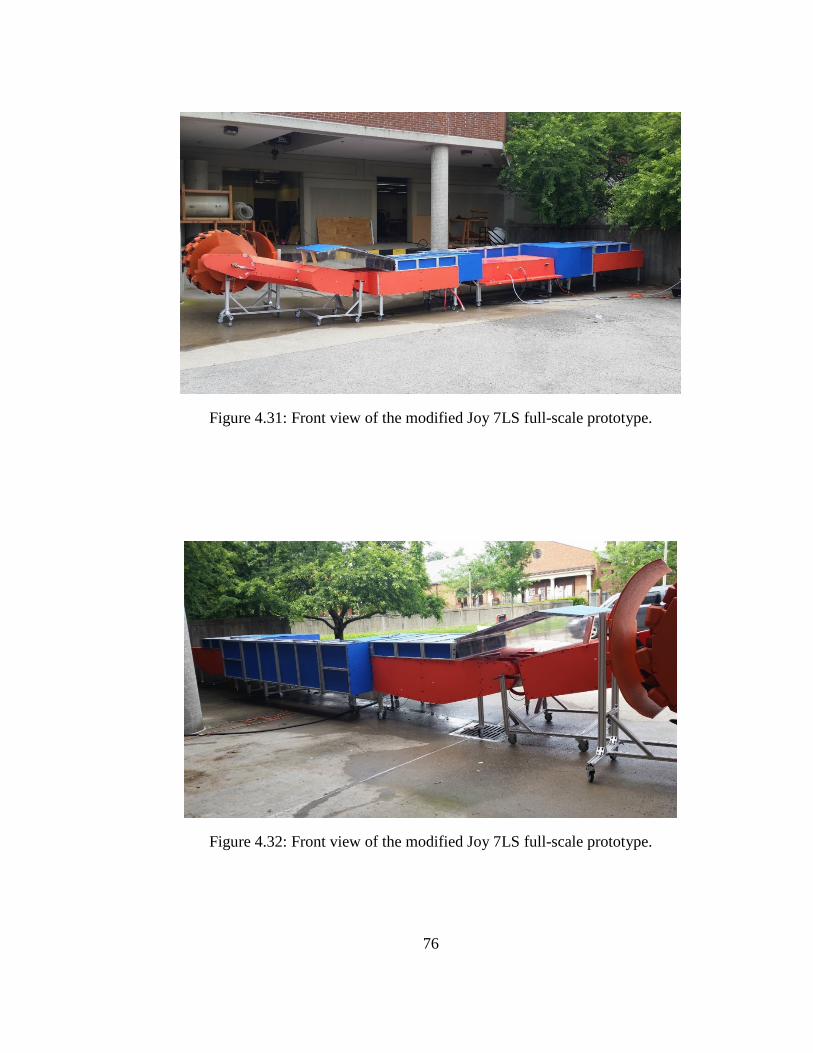
76
Figure 4.31: Front view of the modified Joy 7LS full-scale prototype.
Figure 4.32: Front view of the modified Joy 7LS full-scale prototype.

77
5 LABORATORY TESTING
5.1 Laboratory Set-up
The fabricated physical model of the modified Joy 7LS longwall shearer was transported
to Pittsburgh, Pennsylvania and was installed in the longwall test facility at the Pittsburgh
Research Laboratory (PRL) of the National Institute for Occupational Safety and Health
(NIOSH). The longwall dust gallery is 38.70 m (127 feet) long and it resembles a portion
of an active longwall face where a shearer is in operation as, shown in Figure 5.1. It has
an adjustable ceiling, which is secured at a height of 2.29 m (7.5 feet) to represent the
height of the Tunnel Ridge mine (the cooperating mine).
Figure 5.1: A cross-sectional view of the NIOSH-PRL longwall dust gallery.

78
There is a chain of 19 metal shield supports, each 2.03 m (80 inches) wide, employed
along the entire length of the face. The shearer prototype was positioned approximately
14.02 m (46 feet) from the inlet (headgate). A chain of wooden spill guards was placed
behind the physical model along the entire face of the dust gallery. Wooden boxes of
height 45.72 cm (18 inches) were placed between the simulated coal face and the shearer
to represent headgate drum uncut coal. Plywood and plastic tarps were used upwind of
the headgate drive to represent the profile of the broken coal falling off the headgate
drum and coal onto the Armoured Face Conveyor (AFC). Figure 5.2 shows the inside of
the longwall dust gallery.
Figure 5.2: Longwall dust gallery at NIOSH-PRL.
The ventilation of the longwall dust gallery is obtained from three exhaust axial fans,
connected in parallel, capable of supplying a maximum of 22.50 m3/s (47,675 cfm) of air
along the face. However, the centrifugal fan used for the flooded-bed scrubber draws air
only through the flooded-bed scrubber system and it does not influence the quantity
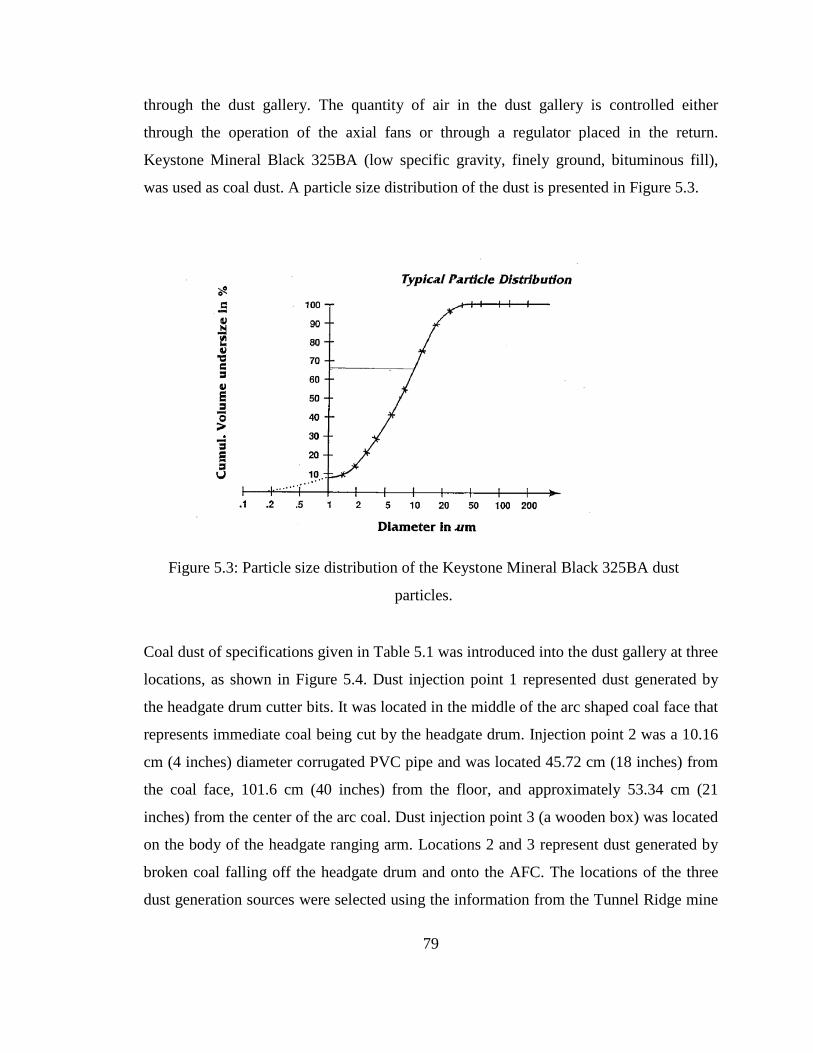
79
through the dust gallery. The quantity of air in the dust gallery is controlled either
through the operation of the axial fans or through a regulator placed in the return.
Keystone Mineral Black 325BA (low specific gravity, finely ground, bituminous fill),
was used as coal dust. A particle size distribution of the dust is presented in Figure 5.3.
Figure 5.3: Particle size distribution of the Keystone Mineral Black 325BA dust
particles.
Coal dust of specifications given in Table 5.1 was introduced into the dust gallery at three
locations, as shown in Figure 5.4. Dust injection point 1 represented dust generated by
the headgate drum cutter bits. It was located in the middle of the arc shaped coal face that
represents immediate coal being cut by the headgate drum. Injection point 2 was a 10.16
cm (4 inches) diameter corrugated PVC pipe and was located 45.72 cm (18 inches) from
the coal face, 101.6 cm (40 inches) from the floor, and approximately 53.34 cm (21
inches) from the center of the arc coal. Dust injection point 3 (a wooden box) was located
on the body of the headgate ranging arm. Locations 2 and 3 represent dust generated by
broken coal falling off the headgate drum and onto the AFC. The locations of the three
dust generation sources were selected using the information from the Tunnel Ridge mine

80
active longwall operations. The aim was to match the dust profile in the dust gallery with
an operational longwall face.
Table 5.1: Different properties of the Keystone Mineral Black 325BA dust particles.
Typical Properties Specific gravity 1.22
Color Black Moisture 1% Max
Total Sulfur 1.20% Free Sulfur <0.5%
Figure 5.4: Dust injection locations in the longwall dust gallery.
Diagrams of the dust injection system are shown in Figures 5.5 and 5.6. Dust was gravity
fed from a screw injector into a 19.05 mm (0.75 inch) hose transporting compressed air at
a pressure of 413.6 kPa (60 psi) into two ends of a six-port dust manifold that had ball
valves attached to each dust line. Three ports were open and carried the dust to the drum
area, wooden box and 10.16 cm (4 inches) diameter duct, respectively. The ball valve of
the dust line carrying dust to the wooden box was fully open (100%) while the ball valves
carrying dust to the other two areas were halfway open (50%).

81
Figure 5.5: A diagram of the dust injection system outside the longwall dust gallery.
Figure 5.6: A diagram of the dust injection system inside the longwall dust gallery.
Thermo Scientific Personal Dust Monitors (PDMs) 3600 and 3700 were used to measure
dust concentration in the dust gallery. A PDM is a real-time particulate monitor
developed by NIOSH and approved by MSHA for its use in underground coal mines’
respirable dust concentration measurement [36]. It meets MSHA intrinsic safety
requirements and performs mass measurement with an accuracy of ±25% with 95%
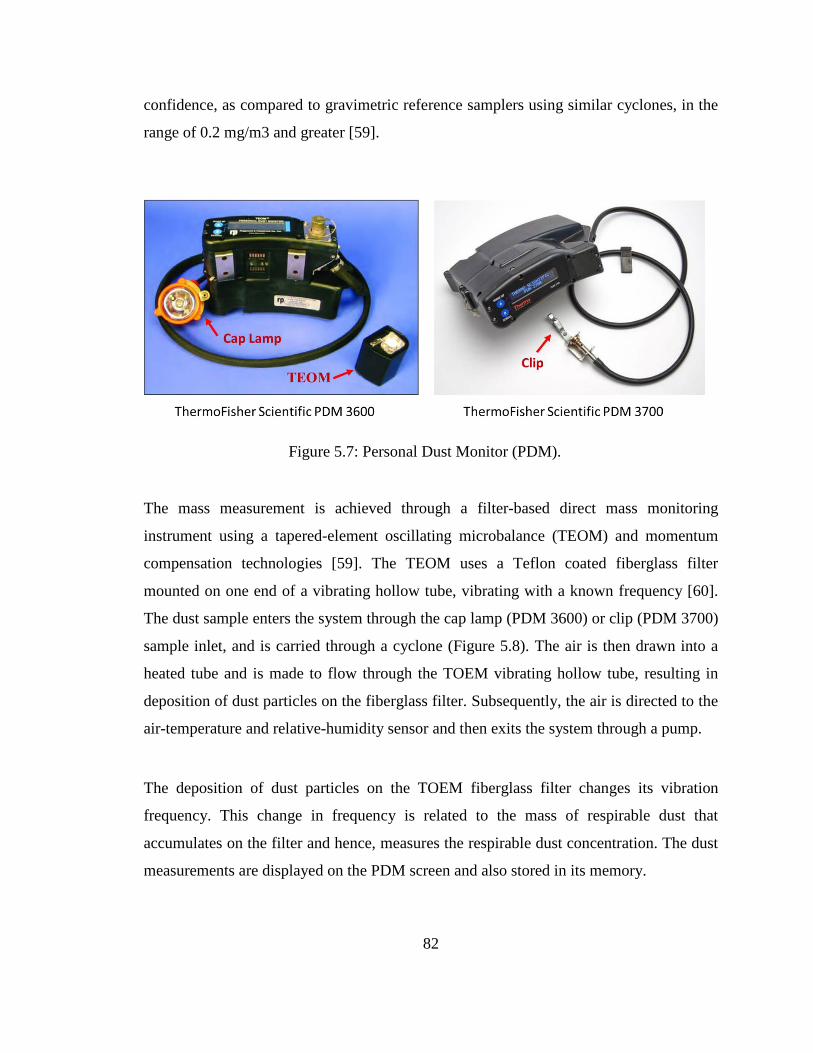
82
confidence, as compared to gravimetric reference samplers using similar cyclones, in the
range of 0.2 mg/m3 and greater [59].
Figure 5.7: Personal Dust Monitor (PDM).
The mass measurement is achieved through a filter-based direct mass monitoring
instrument using a tapered-element oscillating microbalance (TEOM) and momentum
compensation technologies [59]. The TEOM uses a Teflon coated fiberglass filter
mounted on one end of a vibrating hollow tube, vibrating with a known frequency [60].
The dust sample enters the system through the cap lamp (PDM 3600) or clip (PDM 3700)
sample inlet, and is carried through a cyclone (Figure 5.8). The air is then drawn into a
heated tube and is made to flow through the TOEM vibrating hollow tube, resulting in
deposition of dust particles on the fiberglass filter. Subsequently, the air is directed to the
air-temperature and relative-humidity sensor and then exits the system through a pump.
The deposition of dust particles on the TOEM fiberglass filter changes its vibration
frequency. This change in frequency is related to the mass of respirable dust that
accumulates on the filter and hence, measures the respirable dust concentration. The dust
measurements are displayed on the PDM screen and also stored in its memory.
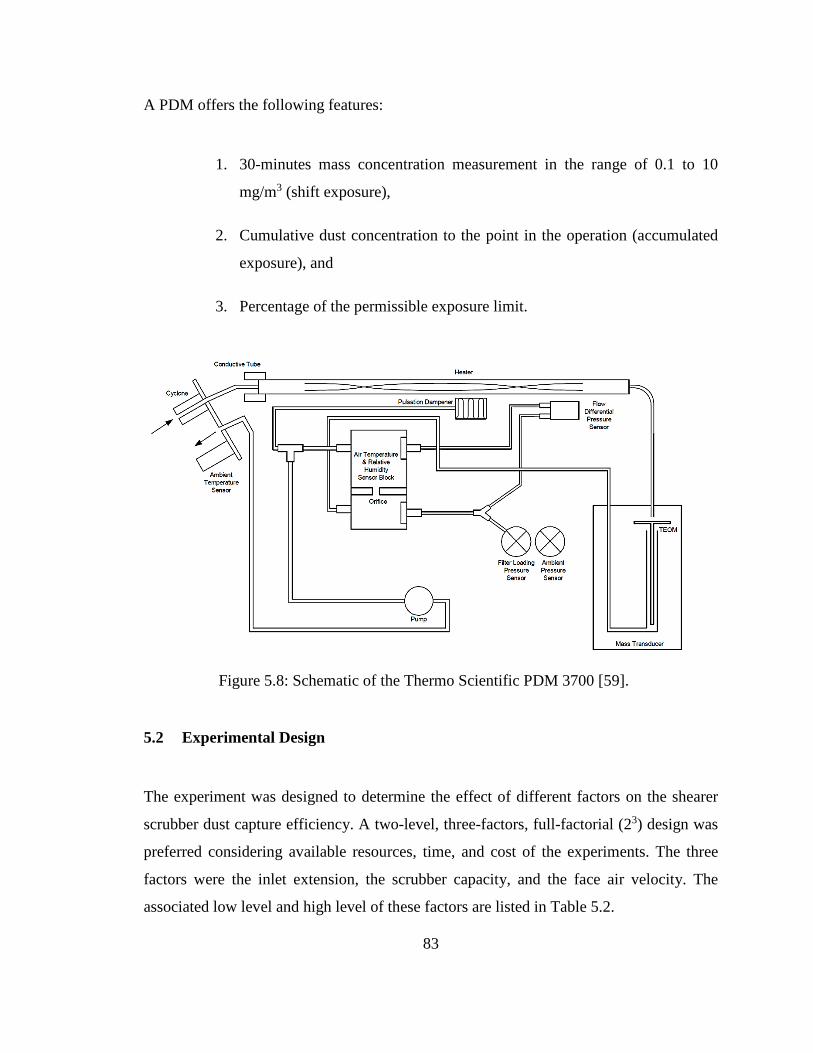
83
A PDM offers the following features:
1. 30-minutes mass concentration measurement in the range of 0.1 to 10
mg/m3 (shift exposure),
2. Cumulative dust concentration to the point in the operation (accumulated
exposure), and
3. Percentage of the permissible exposure limit.
Figure 5.8: Schematic of the Thermo Scientific PDM 3700 [59].
5.2 Experimental Design
The experiment was designed to determine the effect of different factors on the shearer
scrubber dust capture efficiency. A two-level, three-factors, full-factorial (23) design was
preferred considering available resources, time, and cost of the experiments. The three
factors were the inlet extension, the scrubber capacity, and the face air velocity. The
associated low level and high level of these factors are listed in Table 5.2.
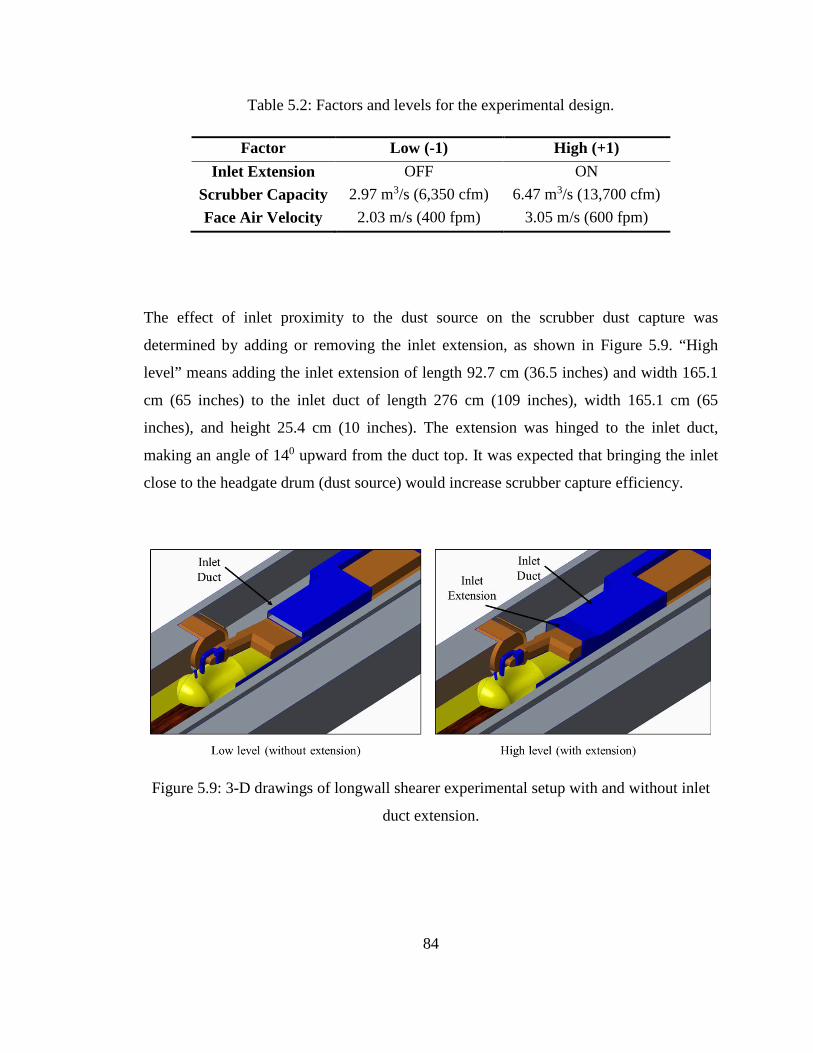
84
Table 5.2: Factors and levels for the experimental design.
Factor Low (-1) High (+1) Inlet Extension OFF ON
Scrubber Capacity 2.97 m3/s (6,350 cfm) 6.47 m3/s (13,700 cfm) Face Air Velocity 2.03 m/s (400 fpm) 3.05 m/s (600 fpm)
The effect of inlet proximity to the dust source on the scrubber dust capture was
determined by adding or removing the inlet extension, as shown in Figure 5.9. “High
level” means adding the inlet extension of length 92.7 cm (36.5 inches) and width 165.1
cm (65 inches) to the inlet duct of length 276 cm (109 inches), width 165.1 cm (65
inches), and height 25.4 cm (10 inches). The extension was hinged to the inlet duct,
making an angle of 140 upward from the duct top. It was expected that bringing the inlet
close to the headgate drum (dust source) would increase scrubber capture efficiency.
Figure 5.9: 3-D drawings of longwall shearer experimental setup with and without inlet
duct extension.

85
The scrubber capacity was the amount of air drawn by the scrubber fan through the
flooded-bed scrubber system. The variation in the scrubber capacity was achieved
through a variable frequency drive (VFD) control that allowed the centrifugal fan to
induce the maximum of 6.47 m3/s (13,700 cfm) airflow at 60 Hz. The low level airflow
of 2.97 m3/s (6350 cfm) was achieved at 30 Hz.
The face air velocity was the average velocity of the air, pulled by the three main exhaust
fans, at the inlet of the longwall dust gallery. The amount of air through the dust gallery
was controlled though a regulator in the return. A high level face velocity of 3.05 m/s
(600 fpm) was achieved when the regulator was open, whereas the low level face velocity
of 2.03 m/s (400 fpm) was achieved with the regulator in its closed position.
The full factorial experimental design for three factors at two levels resulted in a total of
eight (23 = 8) experiments (treatments), as shown in Table 5.3. Each experiment was
repeated five times, resulting a total sum of 40 (8 x 5) experiments (observations). The
result (output response) of each experiment, which was the respective scrubber dust
capture efficiency, is presented in Section 5.4.
Table 5.3: Experimental design for three factors at two levels.
S.No. Treatment Inlet
Extension Scrubber Air (cfm)
Face Air (fpm)
1 - - - OFF 6,350 400 2 - - + OFF 6,350 600 3 - + - OFF 13,700 400 4 - + + OFF 13,700 600 5 + - - ON 6,350 400 6 + - + ON 6,350 600 7 + + - ON 13,700 400 8 + + + ON 13,700 600

86
5.3 Experimental Procedure
A total 16 PDMs were placed in the dust gallery at the locations shown in Figure 5.10.
Out of 16 PDMs, there were 12 PDMs at the dust gallery face and four in the return. The
exact location of each PDM at the face is presented in Table 5.4. All the measurements
along the length of the gallery were taken from a reference vertical plane passing through
the center of the drum. The locations of the four PDMs placed in the return are presented
in Table 5.5. The PDMs were placed on a vertical plane approximately 38 feet downwind
of the ninety-degree turn from the dust gallery face to the return.
The PDMs were turned ON at the start of every test day and kept ON for the entire day
till the end of the last experiment. Therefore, the PDMs recorded dust concentration
throughout the day, including the experiment period and idle hours. Data from the PDMs
were downloaded on a computer and only the dust concentration data during the test
period were used for analysis and the rest were discarded.
Figure 5.10: PDMs locations in the dust gallery.

87
Table 5.4: PDMs locations at the face.
PDM No.
Name Distance from Face (inches)
Distance from Headgate Drum
Axis (inches)
Distance from Floor
(inches)
1 Splitter 125 47 61 2 Inlet 125 109 61 3 Scrubber Walkway 125 252 74 4 Scrubber Mid-walkway 100 252 74 5 Scrubber Mid-shearer 75 252 74 6 Scrubber Mid-face 50 252 74 7 Scrubber Face 25 252 74 8 Tailgate Walkway 125 474 74 9 Tailgate Mid-walkway 100 474 74 10 Tailgate Mid-shearer 75 474 74 11 Tailgate Mid-face 50 474 74 12 Tailgate Face 25 474 74
Table 5.5: PDMs locations in the return.
PDM
No. Name
Distance from
Left-wall
(inches)
Distance from
900 turn
(inches)
Distance from
floor (inches)
13 Return Top-left 30 456 60
14 Return Top-right 60 456 60
15 Return Bottom-left 30 456 30
16 Return Bottom-right 60 456 30
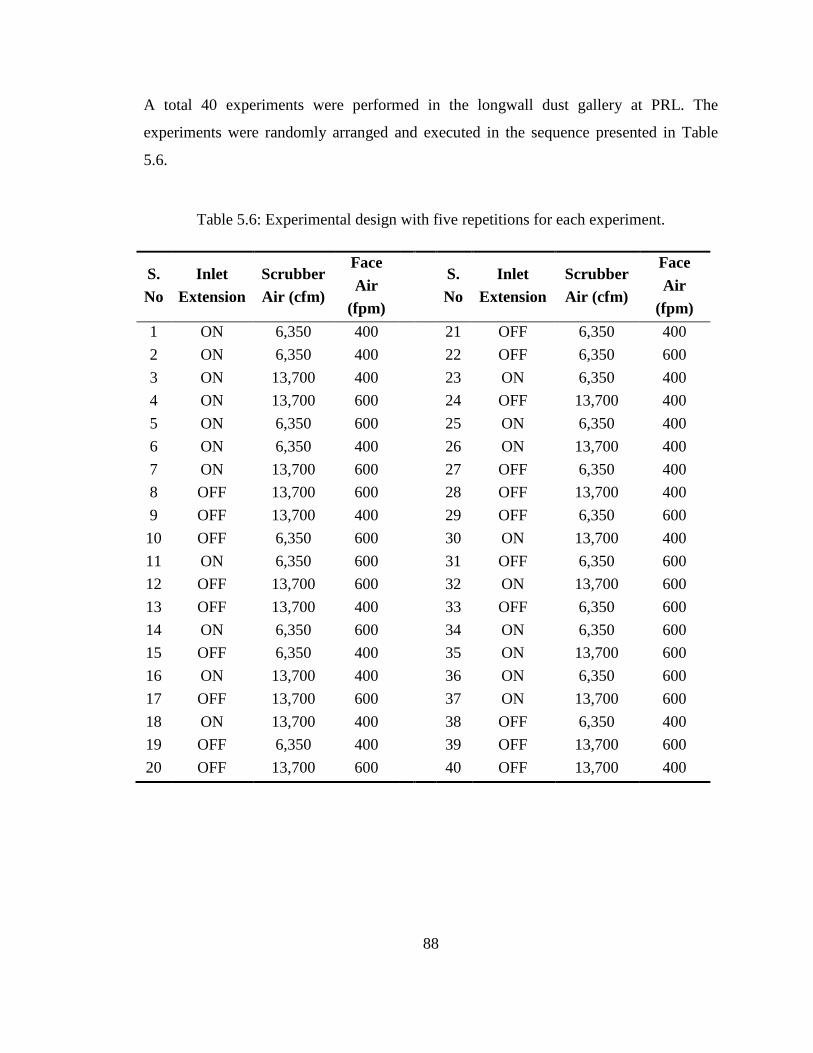
88
A total 40 experiments were performed in the longwall dust gallery at PRL. The
experiments were randomly arranged and executed in the sequence presented in Table
5.6.
Table 5.6: Experimental design with five repetitions for each experiment.
S. No
Inlet Extension
Scrubber Air (cfm)
Face Air
(fpm)
S. No
Inlet Extension
Scrubber Air (cfm)
Face Air
(fpm) 1 ON 6,350 400
21 OFF 6,350 400
2 ON 6,350 400
22 OFF 6,350 600 3 ON 13,700 400
23 ON 6,350 400
4 ON 13,700 600
24 OFF 13,700 400 5 ON 6,350 600
25 ON 6,350 400
6 ON 6,350 400
26 ON 13,700 400 7 ON 13,700 600
27 OFF 6,350 400
8 OFF 13,700 600
28 OFF 13,700 400 9 OFF 13,700 400
29 OFF 6,350 600
10 OFF 6,350 600
30 ON 13,700 400 11 ON 6,350 600
31 OFF 6,350 600
12 OFF 13,700 600
32 ON 13,700 600 13 OFF 13,700 400
33 OFF 6,350 600
14 ON 6,350 600
34 ON 6,350 600 15 OFF 6,350 400
35 ON 13,700 600
16 ON 13,700 400
36 ON 6,350 600 17 OFF 13,700 600
37 ON 13,700 600
18 ON 13,700 400
38 OFF 6,350 400 19 OFF 6,350 400
39 OFF 13,700 600
20 OFF 13,700 600
40 OFF 13,700 400
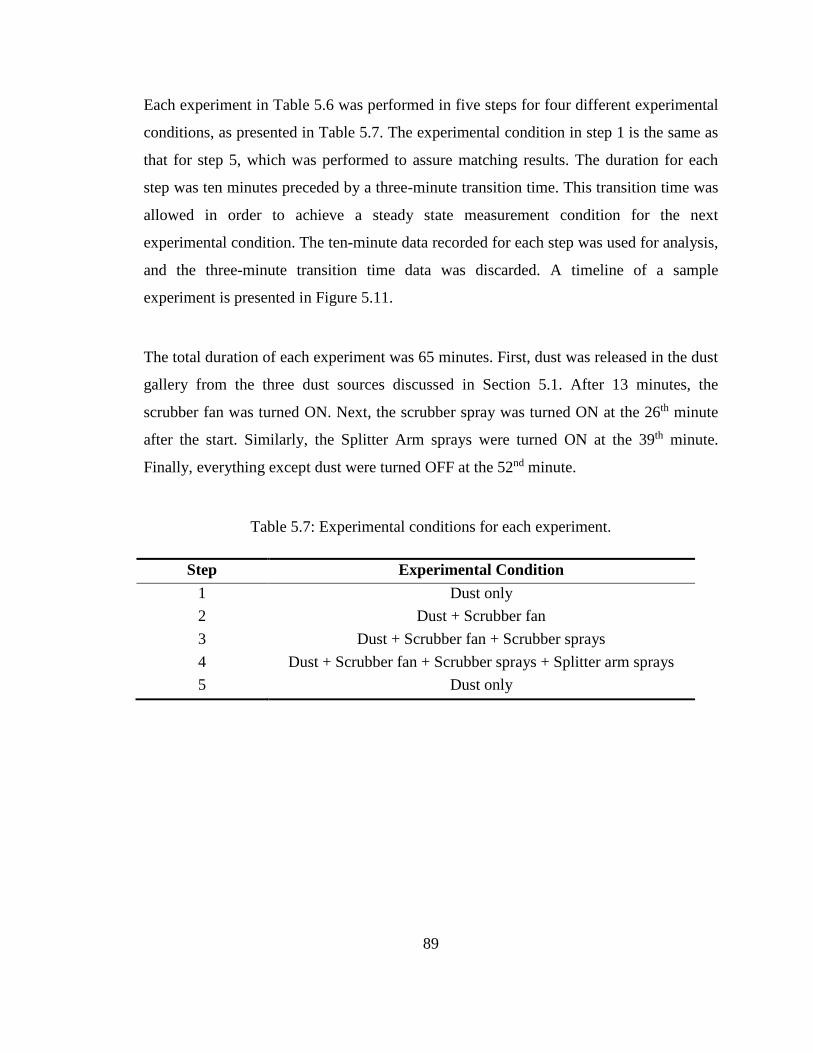
89
Each experiment in Table 5.6 was performed in five steps for four different experimental
conditions, as presented in Table 5.7. The experimental condition in step 1 is the same as
that for step 5, which was performed to assure matching results. The duration for each
step was ten minutes preceded by a three-minute transition time. This transition time was
allowed in order to achieve a steady state measurement condition for the next
experimental condition. The ten-minute data recorded for each step was used for analysis,
and the three-minute transition time data was discarded. A timeline of a sample
experiment is presented in Figure 5.11.
The total duration of each experiment was 65 minutes. First, dust was released in the dust
gallery from the three dust sources discussed in Section 5.1. After 13 minutes, the
scrubber fan was turned ON. Next, the scrubber spray was turned ON at the 26th minute
after the start. Similarly, the Splitter Arm sprays were turned ON at the 39th minute.
Finally, everything except dust were turned OFF at the 52nd minute.
Table 5.7: Experimental conditions for each experiment.
Step Experimental Condition 1 Dust only 2 Dust + Scrubber fan 3 Dust + Scrubber fan + Scrubber sprays 4 Dust + Scrubber fan + Scrubber sprays + Splitter arm sprays 5 Dust only
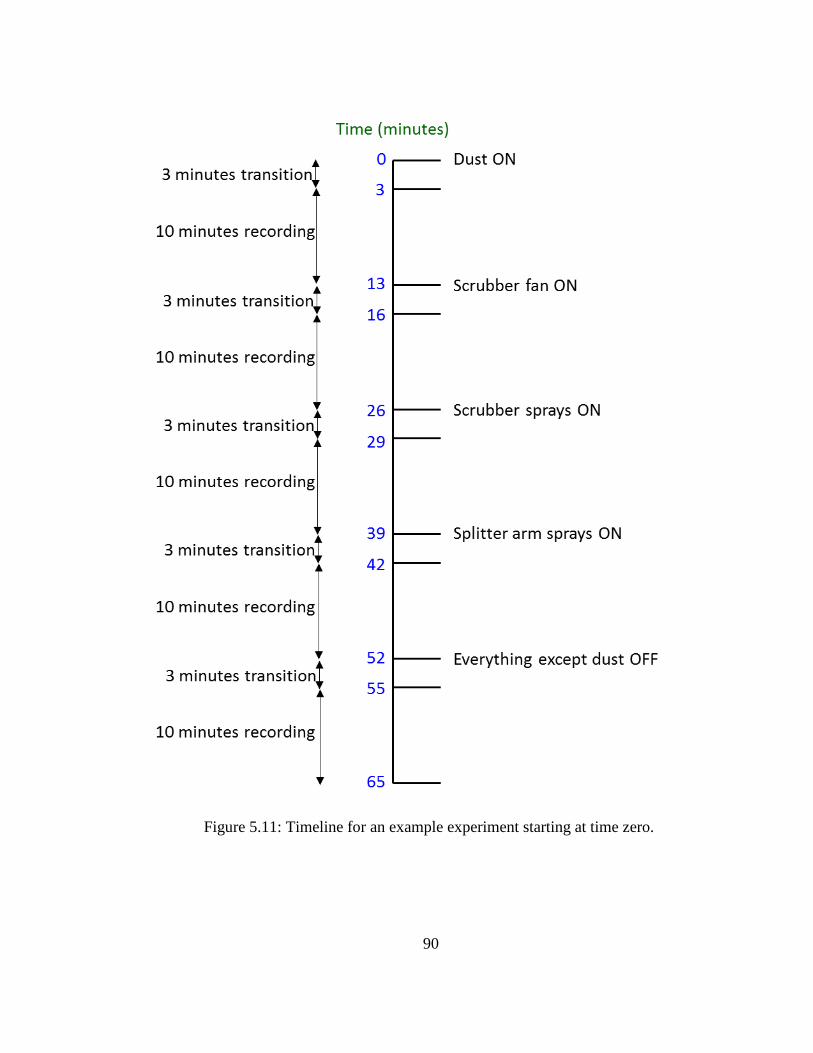
90
Figure 5.11: Timeline for an example experiment starting at time zero.

91
The dust concentrations recorded for different experimental conditions can be used to
determine the effects of different conditions on dust reduction, as presented in Table 5.8.
Table 5.8: Experimental conditions and their corresponding outcomes.
Step Recording Period
(Minute) Results
1 3 to 13 Dust concentration when no scrubber or splitter arm is operating
2 16 to 26 Effect to scrubber fan on dust reduction
3 29 to 39 Effect of flooded-bed scrubber system on dust reduction
4 42 to 52
Combined effect of flooded-bed scrubber system and splitter arm sprays on dust reduction
5 55 to 65 Dust concentration when no scrubber or splitter arm is operating
5.4 Experimental Results
The analysis of data obtained from the 40 experiments discussed in Section 5.3 was
performed using Microsoft Excel and JMP statistical software. The objective was to
study the main effects and interactions of the three experimental factors (inlet extension,
scrubber capacity, and face air velocity), and to select the combination which achieved
maximum flooded-bed scrubber dust-capture efficiency for industrial applications. The
main effect of a factor is the difference in the mean response between two levels of that

92
factor averaged over all levels of the other factors, whereas the interaction measures
differences in the effect of one factor changing as another factor changes. The full-
factorial experiment with three factors at two levels resulted in three different main
effects and four different interactions. For simplicity, the experimental factors inlet
extension, scrubber capacity, and face air velocity are denoted by A, B, and C,
respectively, in this section.
Analysis of variance (ANOVA) was used to determine the level of significance for main
effects and interactions. It was conducted under the null hypothesis H0: the flooded-bed
scrubber has no effect on dust reduction in the longwall dust gallery. If the null
hypothesis was rejected, the alternative hypothesis H1: the flooded-bed scrubber has a
significant effect on dust reduction in the longwall dust gallery, would be accepted. The
level of confidence to reject the null hypothesis (probability of Type I error) was set at or
below 0.01 (P-value = 0.01).
As discussed in the Section 5.3, there were a total of sixteen PDMs (sampling station)
placed in the longwall dust gallery: twelve positioned at the face, and four in the return
(Figure 5.10). Since, the PDMs in the return entry were placed on a cross-section
perpendicular to airflow, they were considered as a single sampling station and mean
value of dust concentrations from four PDMs was used for analysis. This reduced the
number of total sampling stations to thirteen. Each station recorded dust concentration for
the five experimental conditions presented in Table 5.7; meaning each station produced
five sets of data for each experiment. An example of dust concentration data obtained
from the thirteen stations for an experiment is presented in Table 5.9.

93
Table 5.9: Data table for a sample experiment (dust concentration is presented in
(mg/m3).
Station No.
Station Name Experimental Condition
Dust Fan Scrubber Splitter Dust 1 Splitter 1.67 0.91 1.20 0.31 2.13 2 Inlet 7.18 2.89 3.44 0.63 7.51 3 Scrubber Walkway 7.14 1.79 2.40 0.30 8.50 4 Scrubber Mid-walkway 14.81 9.31 10.99 3.44 17.18 5 Scrubber Mid-shearer 9.63 5.46 6.17 9.94 10.80 6 Scrubber Mid-face 7.11 4.48 4.97 9.79 7.53 7 Scrubber Face 11.13 9.20 10.11 5.77 12.22 8 Tailgate Walkway 2.56 0.67 0.82 0.24 3.03 9 Tailgate Mid-walkway 4.78 1.68 2.26 0.58 5.98 10 Tailgate Mid-shearer 10.04 4.49 5.42 2.64 11.93 11 Tailgate Mid-face 11.69 6.86 7.97 6.89 13.13 12 Tailgate Face 8.68 5.72 6.41 9.02 9.81 13 Return 4.65 4.37 3.38 2.97 5.24
Prior to the statistical analysis, the average dust concentration of experimental conditions
1 and 5, at each sampling station, was calculated. The average value represented dust
concentration when neither flooded-bed scrubber nor splitter arm sprays were in
operation, and it was considered as the reference value that was used to calculated dust
reduction as a result of experimental conditions 2, 3, and 4. The dust reduction for an
experimental condition was calculated using the formula in Equation 5.1.
Dust Reduction = �1- �C2 or C3 or C4
Average of C1 & C5�� 100 % (5.1)
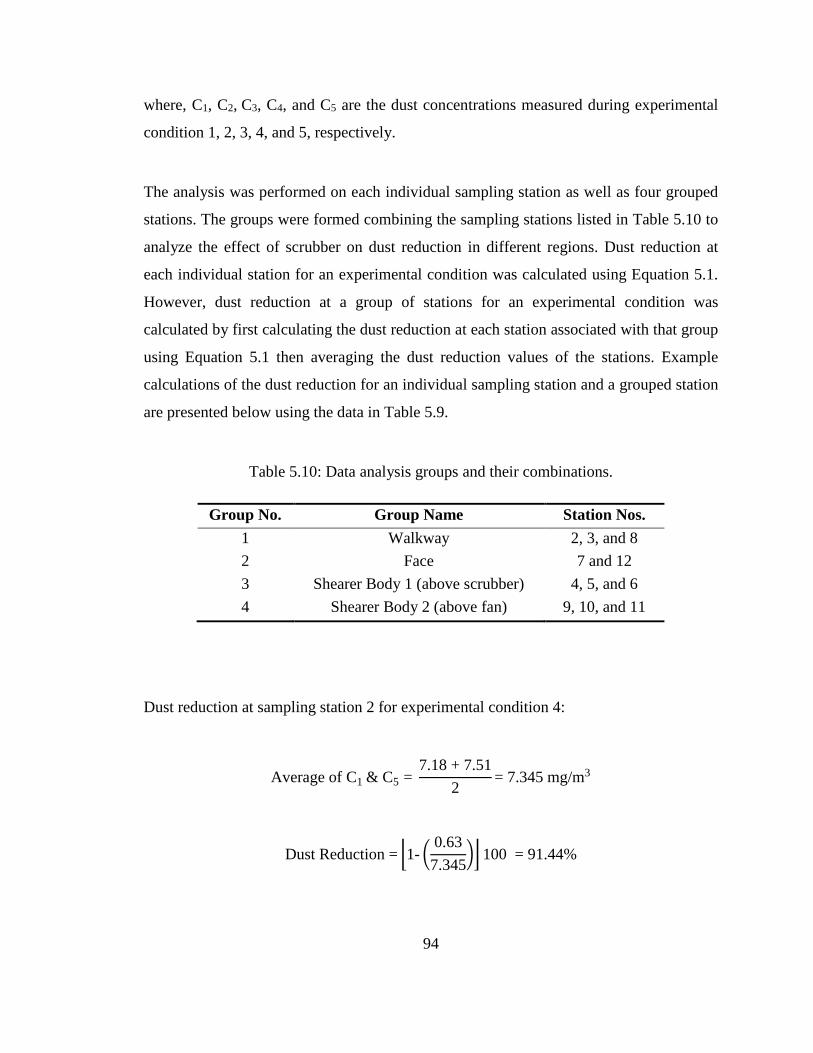
94
where, C1, C2, C3, C4, and C5 are the dust concentrations measured during experimental
condition 1, 2, 3, 4, and 5, respectively.
The analysis was performed on each individual sampling station as well as four grouped
stations. The groups were formed combining the sampling stations listed in Table 5.10 to
analyze the effect of scrubber on dust reduction in different regions. Dust reduction at
each individual station for an experimental condition was calculated using Equation 5.1.
However, dust reduction at a group of stations for an experimental condition was
calculated by first calculating the dust reduction at each station associated with that group
using Equation 5.1 then averaging the dust reduction values of the stations. Example
calculations of the dust reduction for an individual sampling station and a grouped station
are presented below using the data in Table 5.9.
Table 5.10: Data analysis groups and their combinations.
Group No. Group Name Station Nos. 1 Walkway 2, 3, and 8 2 Face 7 and 12 3 Shearer Body 1 (above scrubber) 4, 5, and 6 4 Shearer Body 2 (above fan) 9, 10, and 11
Dust reduction at sampling station 2 for experimental condition 4:
Average of C1 & C5 = 7.18 + 7.51
2= 7.345 mg/m3
Dust Reduction = �1- �0.637.345
�� 100 = 91.44%
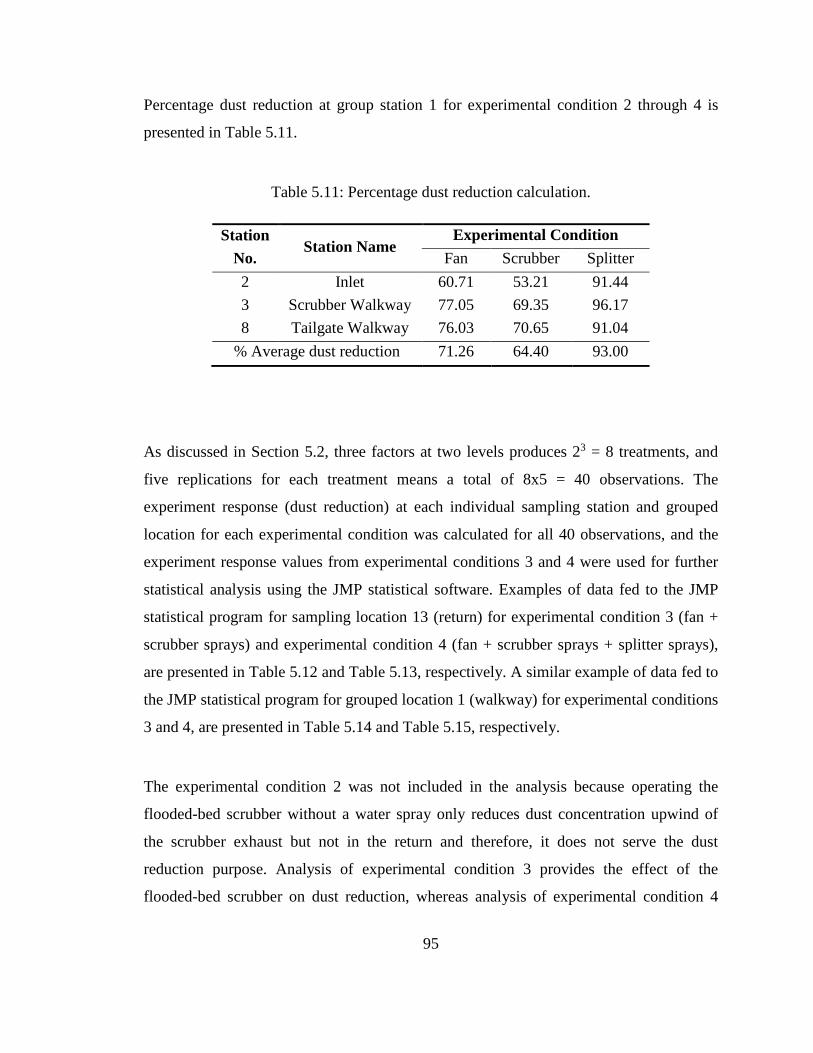
95
Percentage dust reduction at group station 1 for experimental condition 2 through 4 is
presented in Table 5.11.
Table 5.11: Percentage dust reduction calculation.
Station No.
Station Name Experimental Condition
Fan Scrubber Splitter 2 Inlet 60.71 53.21 91.44 3 Scrubber Walkway 77.05 69.35 96.17 8 Tailgate Walkway 76.03 70.65 91.04
% Average dust reduction 71.26 64.40 93.00
As discussed in Section 5.2, three factors at two levels produces 23 = 8 treatments, and
five replications for each treatment means a total of 8x5 = 40 observations. The
experiment response (dust reduction) at each individual sampling station and grouped
location for each experimental condition was calculated for all 40 observations, and the
experiment response values from experimental conditions 3 and 4 were used for further
statistical analysis using the JMP statistical software. Examples of data fed to the JMP
statistical program for sampling location 13 (return) for experimental condition 3 (fan +
scrubber sprays) and experimental condition 4 (fan + scrubber sprays + splitter sprays),
are presented in Table 5.12 and Table 5.13, respectively. A similar example of data fed to
the JMP statistical program for grouped location 1 (walkway) for experimental conditions
3 and 4, are presented in Table 5.14 and Table 5.15, respectively.
The experimental condition 2 was not included in the analysis because operating the
flooded-bed scrubber without a water spray only reduces dust concentration upwind of
the scrubber exhaust but not in the return and therefore, it does not serve the dust
reduction purpose. Analysis of experimental condition 3 provides the effect of the
flooded-bed scrubber on dust reduction, whereas analysis of experimental condition 4

96
provides the combined effect of the flooded-bed scrubber and splitter arm sprays on dust
reduction. They are further discussed in the following Sub-sections in detail.
Table 5.12: Data fed to the JMP statistical program for flooded-bed scrubber performance
analysis in return.
S. No.
Treatment Inlet
Extension Scrubber Capacity
Face Air
Dust Reduction
(%) 1 − − − OFF 6,350 400 17.84 2 − − − OFF 6,350 400 27.05 3 − − − OFF 6,350 400 19.27 4 − − − OFF 6,350 400 22.07 5 − − − OFF 6,350 400 19.60 6 − − + OFF 6,350 600 21.54 7 − − + OFF 6,350 600 24.46 8 − − + OFF 6,350 600 27.67 9 − − + OFF 6,350 600 24.82 10 − − + OFF 6,350 600 19.35 11 − + − OFF 13,700 400 42.41 12 − + − OFF 13,700 400 45.36 13 − + − OFF 13,700 400 37.62 14 − + − OFF 13,700 400 40.64 15 − + − OFF 13,700 400 48.96 16 − + + OFF 13,700 600 50.95 17 − + + OFF 13,700 600 51.05 18 − + + OFF 13,700 600 47.05 19 − + + OFF 13,700 600 45.78 20 − + + OFF 13,700 600 53.29 21 + − − ON 6,350 400 17.53 22 + − − ON 6,350 400 19.86 23 + − − ON 6,350 400 18.91 24 + − − ON 6,350 400 31.34 25 + − − ON 6,350 400 21.73

97
26 + − + ON 6,350 600 31.70 27 + − + ON 6,350 600 32.39 28 + − + ON 6,350 600 33.88 29 + − + ON 6,350 600 35.45 30 + − + ON 6,350 600 32.56 31 + + − ON 13,700 400 52.53 32 + + − ON 13,700 400 47.11 33 + + − ON 13,700 400 48.87 34 + + − ON 13,700 400 54.49 35 + + − ON 13,700 400 46.16 36 + + + ON 13,700 600 56.31 37 + + + ON 13,700 600 60.43 38 + + + ON 13,700 600 56.02 39 + + + ON 13,700 600 54.76 40 + + + ON 13,700 600 57.41
Table 5.13: Data fed to the JMP statistical program for combined flooded-bed scrubber
and splitter arm sprays performance analysis in return.
S. No.
Treatment Inlet
Extension Scrubber Capacity
Face Air
Dust Reduction
(%) 1 − − − OFF 6,350 400 33.40 2 − − − OFF 6,350 400 34.97 3 − − − OFF 6,350 400 28.56 4 − − − OFF 6,350 400 30.88 5 − − − OFF 6,350 400 27.94 6 − − + OFF 6,350 600 23.13 7 − − + OFF 6,350 600 22.62 8 − − + OFF 6,350 600 27.61 9 − − + OFF 6,350 600 25.15 10 − − + OFF 6,350 600 20.84 11 − + − OFF 13,700 400 52.85
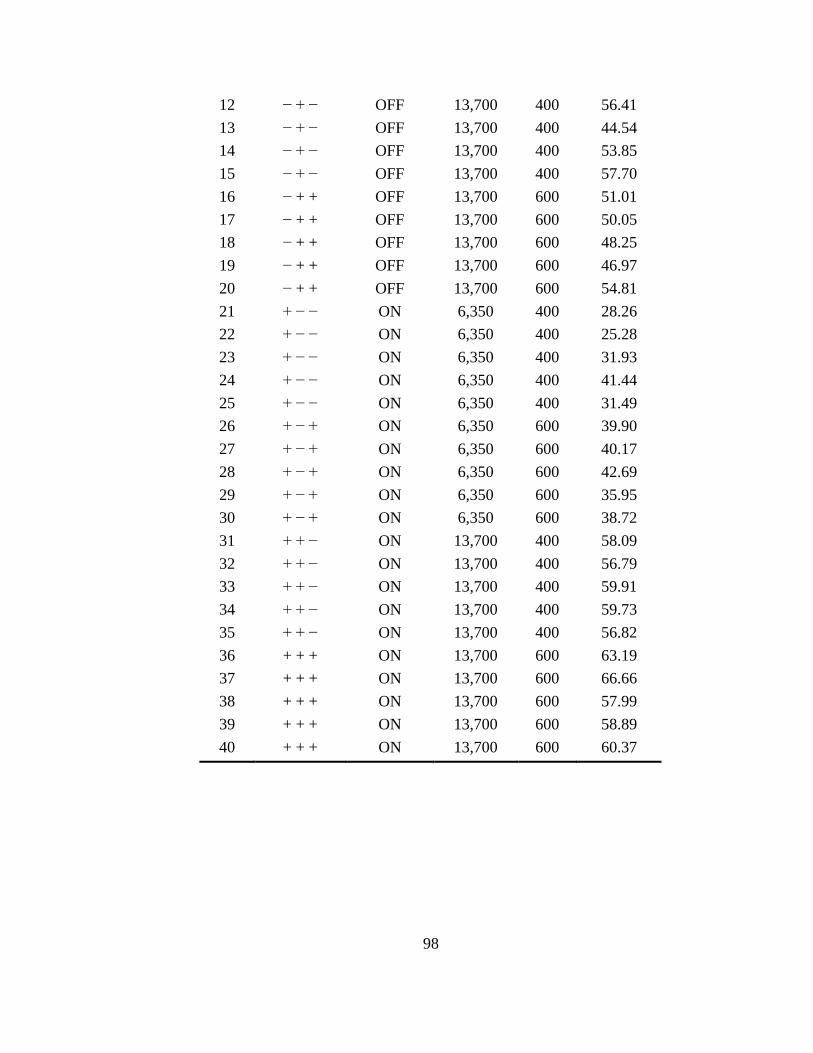
98
12 − + − OFF 13,700 400 56.41 13 − + − OFF 13,700 400 44.54 14 − + − OFF 13,700 400 53.85 15 − + − OFF 13,700 400 57.70 16 − + + OFF 13,700 600 51.01 17 − + + OFF 13,700 600 50.05 18 − + + OFF 13,700 600 48.25 19 − + + OFF 13,700 600 46.97 20 − + + OFF 13,700 600 54.81 21 + − − ON 6,350 400 28.26 22 + − − ON 6,350 400 25.28 23 + − − ON 6,350 400 31.93 24 + − − ON 6,350 400 41.44 25 + − − ON 6,350 400 31.49 26 + − + ON 6,350 600 39.90 27 + − + ON 6,350 600 40.17 28 + − + ON 6,350 600 42.69 29 + − + ON 6,350 600 35.95 30 + − + ON 6,350 600 38.72 31 + + − ON 13,700 400 58.09 32 + + − ON 13,700 400 56.79 33 + + − ON 13,700 400 59.91 34 + + − ON 13,700 400 59.73 35 + + − ON 13,700 400 56.82 36 + + + ON 13,700 600 63.19 37 + + + ON 13,700 600 66.66 38 + + + ON 13,700 600 57.99 39 + + + ON 13,700 600 58.89 40 + + + ON 13,700 600 60.37
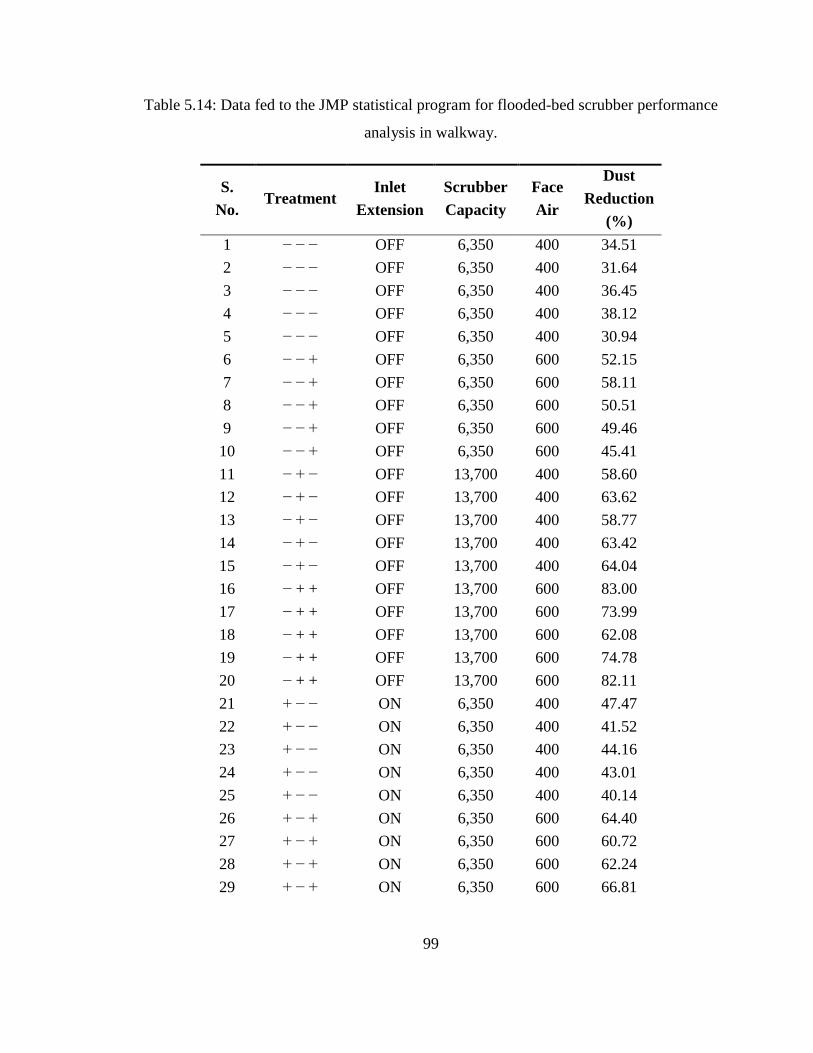
99
Table 5.14: Data fed to the JMP statistical program for flooded-bed scrubber performance
analysis in walkway.
S. No.
Treatment Inlet
Extension Scrubber Capacity
Face Air
Dust Reduction
(%) 1 − − − OFF 6,350 400 34.51 2 − − − OFF 6,350 400 31.64 3 − − − OFF 6,350 400 36.45 4 − − − OFF 6,350 400 38.12 5 − − − OFF 6,350 400 30.94 6 − − + OFF 6,350 600 52.15 7 − − + OFF 6,350 600 58.11 8 − − + OFF 6,350 600 50.51 9 − − + OFF 6,350 600 49.46 10 − − + OFF 6,350 600 45.41 11 − + − OFF 13,700 400 58.60 12 − + − OFF 13,700 400 63.62 13 − + − OFF 13,700 400 58.77 14 − + − OFF 13,700 400 63.42 15 − + − OFF 13,700 400 64.04 16 − + + OFF 13,700 600 83.00 17 − + + OFF 13,700 600 73.99 18 − + + OFF 13,700 600 62.08 19 − + + OFF 13,700 600 74.78 20 − + + OFF 13,700 600 82.11 21 + − − ON 6,350 400 47.47 22 + − − ON 6,350 400 41.52 23 + − − ON 6,350 400 44.16 24 + − − ON 6,350 400 43.01 25 + − − ON 6,350 400 40.14 26 + − + ON 6,350 600 64.40 27 + − + ON 6,350 600 60.72 28 + − + ON 6,350 600 62.24 29 + − + ON 6,350 600 66.81
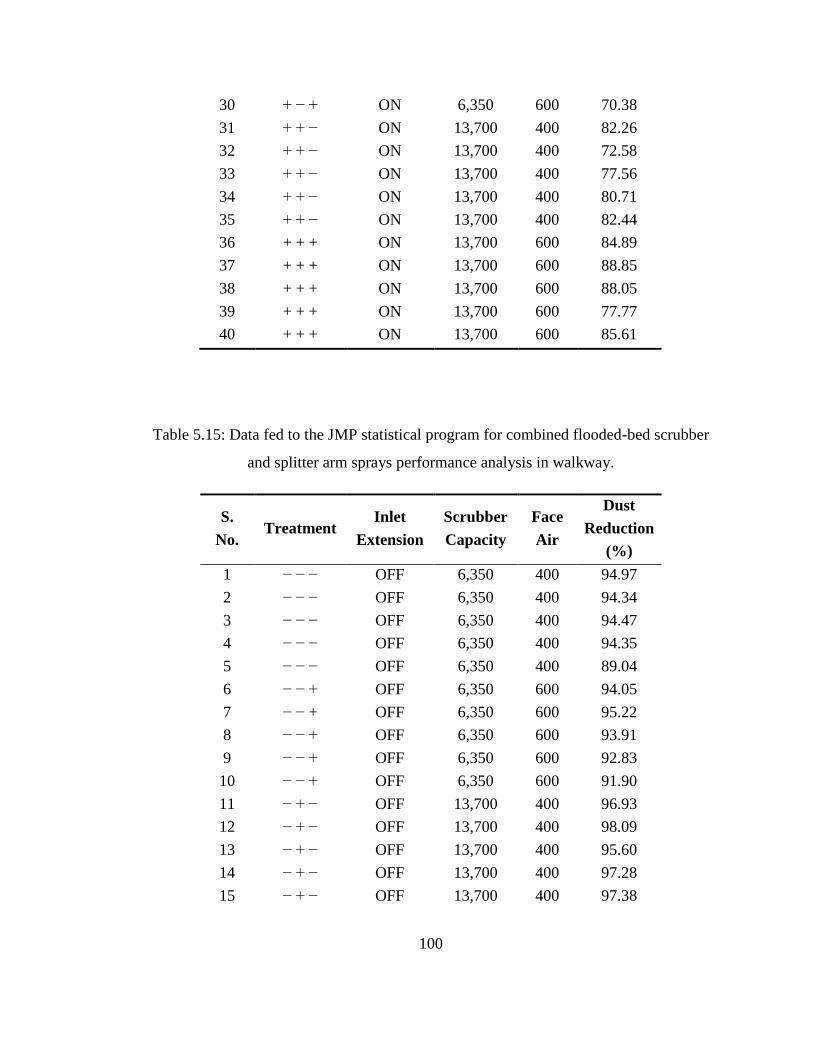
100
30 + − + ON 6,350 600 70.38 31 + + − ON 13,700 400 82.26 32 + + − ON 13,700 400 72.58 33 + + − ON 13,700 400 77.56 34 + + − ON 13,700 400 80.71 35 + + − ON 13,700 400 82.44 36 + + + ON 13,700 600 84.89 37 + + + ON 13,700 600 88.85 38 + + + ON 13,700 600 88.05 39 + + + ON 13,700 600 77.77 40 + + + ON 13,700 600 85.61
Table 5.15: Data fed to the JMP statistical program for combined flooded-bed scrubber
and splitter arm sprays performance analysis in walkway.
S. No.
Treatment Inlet
Extension Scrubber Capacity
Face Air
Dust Reduction
(%) 1 − − − OFF 6,350 400 94.97 2 − − − OFF 6,350 400 94.34 3 − − − OFF 6,350 400 94.47 4 − − − OFF 6,350 400 94.35 5 − − − OFF 6,350 400 89.04 6 − − + OFF 6,350 600 94.05 7 − − + OFF 6,350 600 95.22 8 − − + OFF 6,350 600 93.91 9 − − + OFF 6,350 600 92.83 10 − − + OFF 6,350 600 91.90 11 − + − OFF 13,700 400 96.93 12 − + − OFF 13,700 400 98.09 13 − + − OFF 13,700 400 95.60 14 − + − OFF 13,700 400 97.28 15 − + − OFF 13,700 400 97.38

101
16 − + + OFF 13,700 600 97.17 17 − + + OFF 13,700 600 95.09 18 − + + OFF 13,700 600 86.23 19 − + + OFF 13,700 600 96.59 20 − + + OFF 13,700 600 96.86 21 + − − ON 6,350 400 87.25 22 + − − ON 6,350 400 83.63 23 + − − ON 6,350 400 84.12 24 + − − ON 6,350 400 94.98 25 + − − ON 6,350 400 89.11 26 + − + ON 6,350 600 93.00 27 + − + ON 6,350 600 92.93 28 + − + ON 6,350 600 94.36 29 + − + ON 6,350 600 91.43 30 + − + ON 6,350 600 93.87 31 + + − ON 13,700 400 98.05 32 + + − ON 13,700 400 97.96 33 + + − ON 13,700 400 99.62 34 + + − ON 13,700 400 98.67 35 + + − ON 13,700 400 97.22 36 + + + ON 13,700 600 95.01 37 + + + ON 13,700 600 97.38 38 + + + ON 13,700 600 98.22 39 + + + ON 13,700 600 94.59 40 + + + ON 13,700 600 96.51
5.4.1 Analysis of Flooded-bed Scrubber Performance
Since the aim of the research was to reduce dust concentration in the walkway and in the
return, the analysis for two areas: (1) dust gallery return (sampling station 13), (2) dust
gallery walkway (group station 1) are discussed in this sub-section. Results of analysis
for individual station and for group stations 2 through 4 are presented in Appendix B.
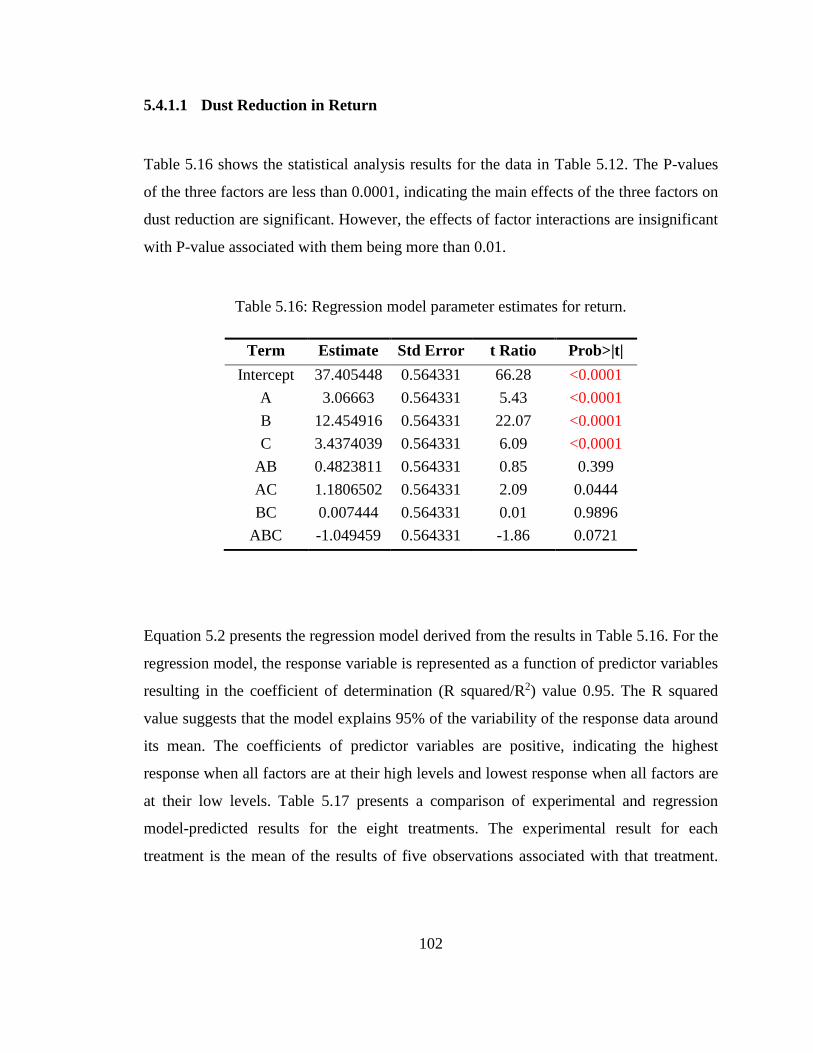
102
5.4.1.1 Dust Reduction in Return
Table 5.16 shows the statistical analysis results for the data in Table 5.12. The P-values
of the three factors are less than 0.0001, indicating the main effects of the three factors on
dust reduction are significant. However, the effects of factor interactions are insignificant
with P-value associated with them being more than 0.01.
Table 5.16: Regression model parameter estimates for return.
Term Estimate Std Error t Ratio Prob>|t| Intercept 37.405448 0.564331 66.28 <0.0001
A 3.06663 0.564331 5.43 <0.0001 B 12.454916 0.564331 22.07 <0.0001 C 3.4374039 0.564331 6.09 <0.0001
AB 0.4823811 0.564331 0.85 0.399 AC 1.1806502 0.564331 2.09 0.0444 BC 0.007444 0.564331 0.01 0.9896
ABC -1.049459 0.564331 -1.86 0.0721
Equation 5.2 presents the regression model derived from the results in Table 5.16. For the
regression model, the response variable is represented as a function of predictor variables
resulting in the coefficient of determination (R squared/R2) value 0.95. The R squared
value suggests that the model explains 95% of the variability of the response data around
its mean. The coefficients of predictor variables are positive, indicating the highest
response when all factors are at their high levels and lowest response when all factors are
at their low levels. Table 5.17 presents a comparison of experimental and regression
model-predicted results for the eight treatments. The experimental result for each
treatment is the mean of the results of five observations associated with that treatment.

103
The percentage difference was calculated by dividing the difference of the experimental
and model results by the experimental result.
y� = 37.405 + 3.067A + 12.455B + 3.437C (5.2)
The highest coefficient of scrubber capacity factor among the three factors shows a high
rate of change of response corresponding to a change in scrubber capacity factor. This
means the scrubber capacity is the most significant factor, followed by face air and inlet
extension. The coefficients of inlet extension and face air are very close, suggesting that
they are equally significant. This contradicts the general perception that a higher scrubber
capacity to face air ratio increases dust capture efficiency of the scrubber. In this case, the
high face air directs the air towards the scrubber inlet and prevents it from going into the
walkway, hence helping to reduce dust concentration in the return.
Table 5.17: Comparison of regression model results with experiment results for all
treatments.
Treatment Model Result
Experiment Result
% Difference
− − − 18.753 21.166 11.40 − − + 25.613 23.566 -8.69 − + − 43.063 42.998 -0.15 − + + 49.923 49.625 -0.60 + − − 24.887 21.875 -13.77 + − + 31.747 33.195 4.36 + + − 49.197 49.833 1.28 + + + 56.057 56.985 1.63

104
5.4.1.2 Dust Reduction in Walkway
Table 5.18 shows the statistical analysis results for the data in Table 5.14. The P-values
of the three factors are less than 0.0001, indicating the main effects of the three factors on
dust reduction are significant. The effect of only the scrubber capacity and face air
factors’ interaction is significant with a P-value more than 0.01. However, unlike the
main effects, the interaction has a negative effect on the response variable.
Table 5.18: Regression model parameter estimates for walkway (stations 2, 3, and 8) .
Term Estimate Std Error t Ratio Prob>|t| Intercept 61.832 0.724124 85.39 <.0001
A 6.2465 0.724124 8.63 <.0001 B 13.4245 0.724124 18.54 <.0001 C 7.234 0.724124 9.99 <.0001
AB 0.569 0.724124 0.79 0.4378 AC -0.3405 0.724124 -0.47 0.6414 BC -2.3775 0.724124 -3.28 0.0025
ABC -1.554 0.724124 -2.15 0.0396
Equation 5.3 presents the regression model derived from the results in Table 5.18. The R
squared value suggests that the model explains 94% of the variability of the response data
around its mean. The coefficients of the main factors and the interaction indicate a
highest response when all factors are at their high levels and lowest response when all
factors are at their low levels. The negative coefficient of the scrubber capacity and face
air factors’ interaction does not affect the final response because of its relatively small
numerical value. Table 5.19 presents a comparison of experimental and regression
model-predicted results for the eight treatments. The experimental result for each
treatment is the mean of the results of five observations associated with that treatment.

105
The percentage difference was calculated by dividing the difference of the experimental
and model results by the experimental result.
y� = 61.832 + 6.247A + 13.425B + 7.234C - 2.378BC (5.3)
The highest coefficient of scrubber capacity factor among the three factors shows that the
scrubber capacity is the most significant factor, followed by face air and inlet extension.
The coefficients of inlet extension and face air are very close, suggesting that they are
equally significant. Similar to the result in Section 5.4.1.1, identical sign of the scrubber
capacity and face air main factors contradicts the general perception that a higher
scrubber capacity to the face air ratio increases dust capture efficiency of the scrubber. In
this case, the high face air directs the air towards the scrubber inlet and prevents it from
going into the walkway, hence helping to reduce dust concentration in the return.
Table 5.19: Comparison of regression model results with experiment results for all
treatments.
Treatment Model Result
Experiment Result
% Difference
− − − 32.548 34.330 5.19 − − + 51.772 51.127 -1.26 − + − 64.154 61.690 -3.99 − + + 73.866 75.192 1.76 + − − 45.042 43.260 -4.12 + − + 64.266 64.909 0.99 + + − 76.648 79.111 3.11 + + + 86.36 85.037 -1.56
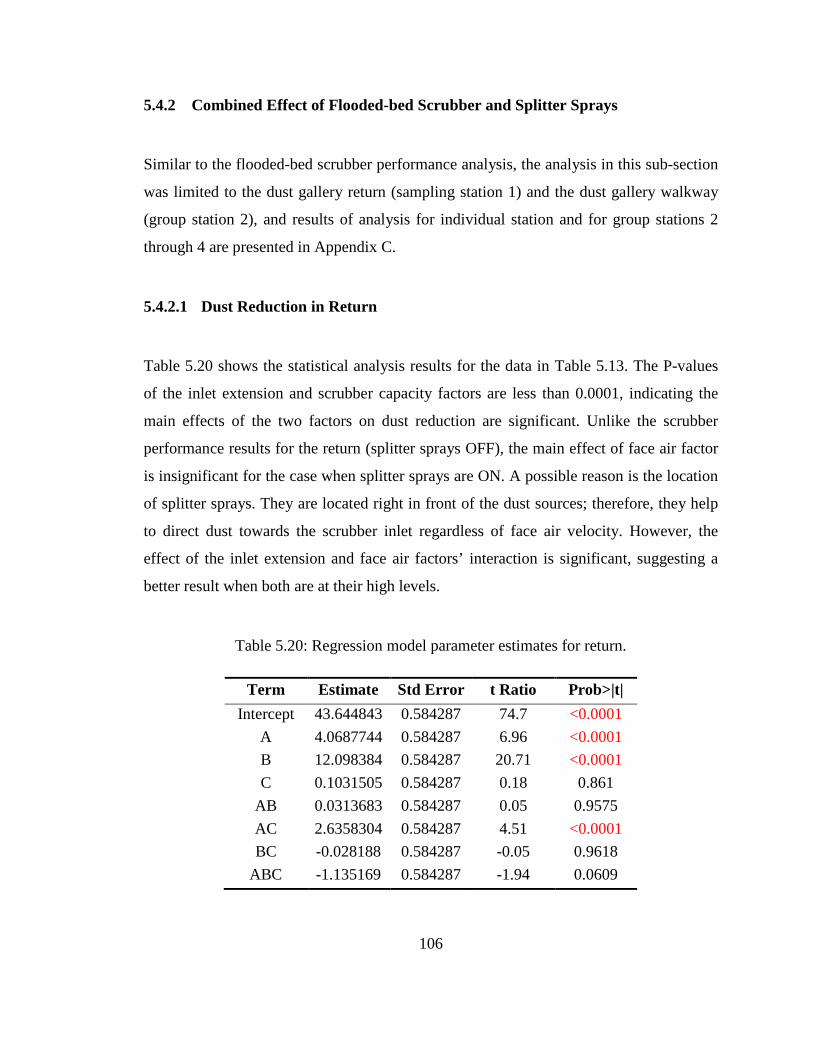
106
5.4.2 Combined Effect of Flooded-bed Scrubber and Splitter Sprays
Similar to the flooded-bed scrubber performance analysis, the analysis in this sub-section
was limited to the dust gallery return (sampling station 1) and the dust gallery walkway
(group station 2), and results of analysis for individual station and for group stations 2
through 4 are presented in Appendix C.
5.4.2.1 Dust Reduction in Return
Table 5.20 shows the statistical analysis results for the data in Table 5.13. The P-values
of the inlet extension and scrubber capacity factors are less than 0.0001, indicating the
main effects of the two factors on dust reduction are significant. Unlike the scrubber
performance results for the return (splitter sprays OFF), the main effect of face air factor
is insignificant for the case when splitter sprays are ON. A possible reason is the location
of splitter sprays. They are located right in front of the dust sources; therefore, they help
to direct dust towards the scrubber inlet regardless of face air velocity. However, the
effect of the inlet extension and face air factors’ interaction is significant, suggesting a
better result when both are at their high levels.
Table 5.20: Regression model parameter estimates for return.
Term Estimate Std Error t Ratio Prob>|t| Intercept 43.644843 0.584287 74.7 <0.0001
A 4.0687744 0.584287 6.96 <0.0001 B 12.098384 0.584287 20.71 <0.0001 C 0.1031505 0.584287 0.18 0.861
AB 0.0313683 0.584287 0.05 0.9575 AC 2.6358304 0.584287 4.51 <0.0001 BC -0.028188 0.584287 -0.05 0.9618
ABC -1.135169 0.584287 -1.94 0.0609
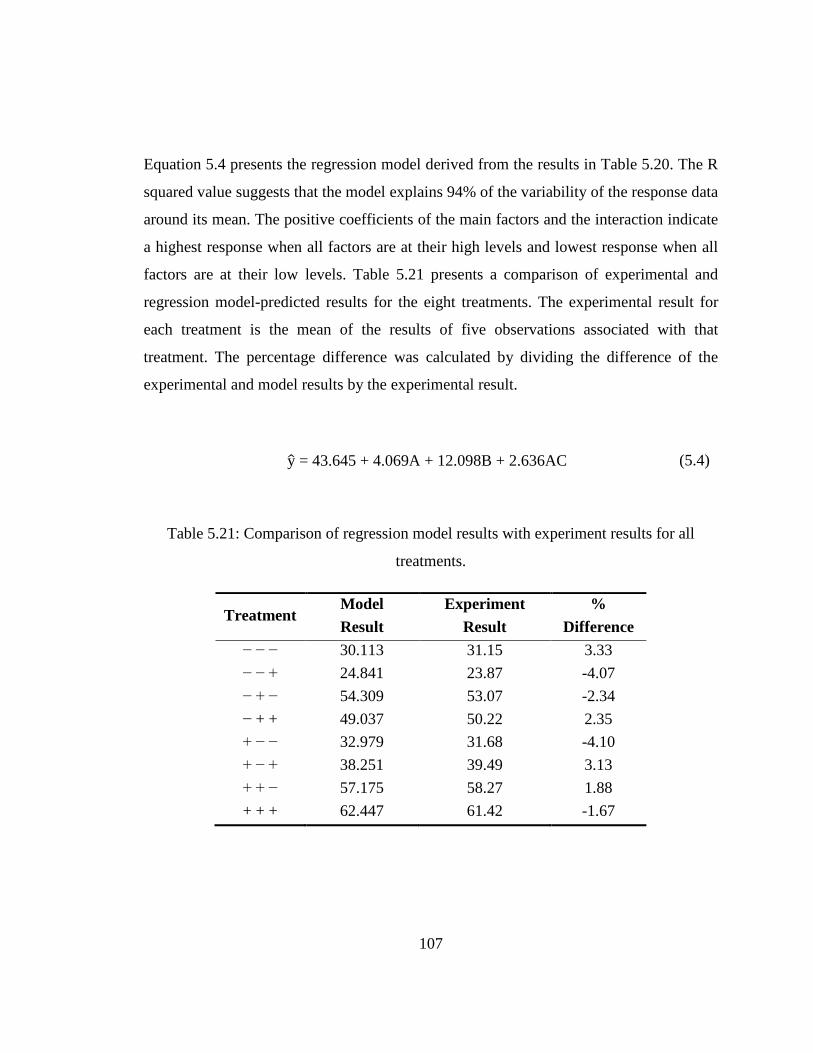
107
Equation 5.4 presents the regression model derived from the results in Table 5.20. The R
squared value suggests that the model explains 94% of the variability of the response data
around its mean. The positive coefficients of the main factors and the interaction indicate
a highest response when all factors are at their high levels and lowest response when all
factors are at their low levels. Table 5.21 presents a comparison of experimental and
regression model-predicted results for the eight treatments. The experimental result for
each treatment is the mean of the results of five observations associated with that
treatment. The percentage difference was calculated by dividing the difference of the
experimental and model results by the experimental result.
y� = 43.645 + 4.069A + 12.098B + 2.636AC (5.4)
Table 5.21: Comparison of regression model results with experiment results for all
treatments.
Treatment Model Result
Experiment Result
% Difference
− − − 30.113 31.15 3.33 − − + 24.841 23.87 -4.07 − + − 54.309 53.07 -2.34 − + + 49.037 50.22 2.35 + − − 32.979 31.68 -4.10 + − + 38.251 39.49 3.13 + + − 57.175 58.27 1.88 + + + 62.447 61.42 -1.67

108
5.4.2.2 Dust Reduction in Walkway
Table 5.22 shows the statistical analysis results for the data in Table 5.15. The main
effect of only one experimental factor (scrubber capacity) is significant with a positive
coefficient. The interactions of inlet extension/scrubber capacity and scrubber
capacity/face air are significant, but the latter is with a negative coefficient.
Table 5.22: Regression model parameter estimates for walkway (stations 2, 3, and 8).
Term Estimate Std Error t Ratio Prob>|t| Intercept 94.25525 0.416567 226.27 <.0001
A -0.35975 0.416567 -0.86 0.3942 B 2.26725 0.416567 5.44 <.0001 C 0.10225 0.416567 0.25 0.8077
AB 1.16025 0.416567 2.79 0.0089 AC 0.73225 0.416567 1.76 0.0883 BC -1.25975 0.416567 -3.02 0.0049
ABC -0.55575 0.416567 -1.33 0.1916
Equation 5.5 presents the regression model derived from the results in Table 5.16. The
low R squared value (61%) of the regression model suggests that the model explains a
low variability of the response data around its mean. The coefficients of main effect and
interactions are very low in comparison to the intercept. This shows the high effect of the
splitter sprays which are not included in the analysis as a factor. As explained in the
previous result, the splitter sprays are placed in front of the dust sources. They direct dust
towards the scrubber inlet and away from the walkway, preventing dust from entering
into the walkway.
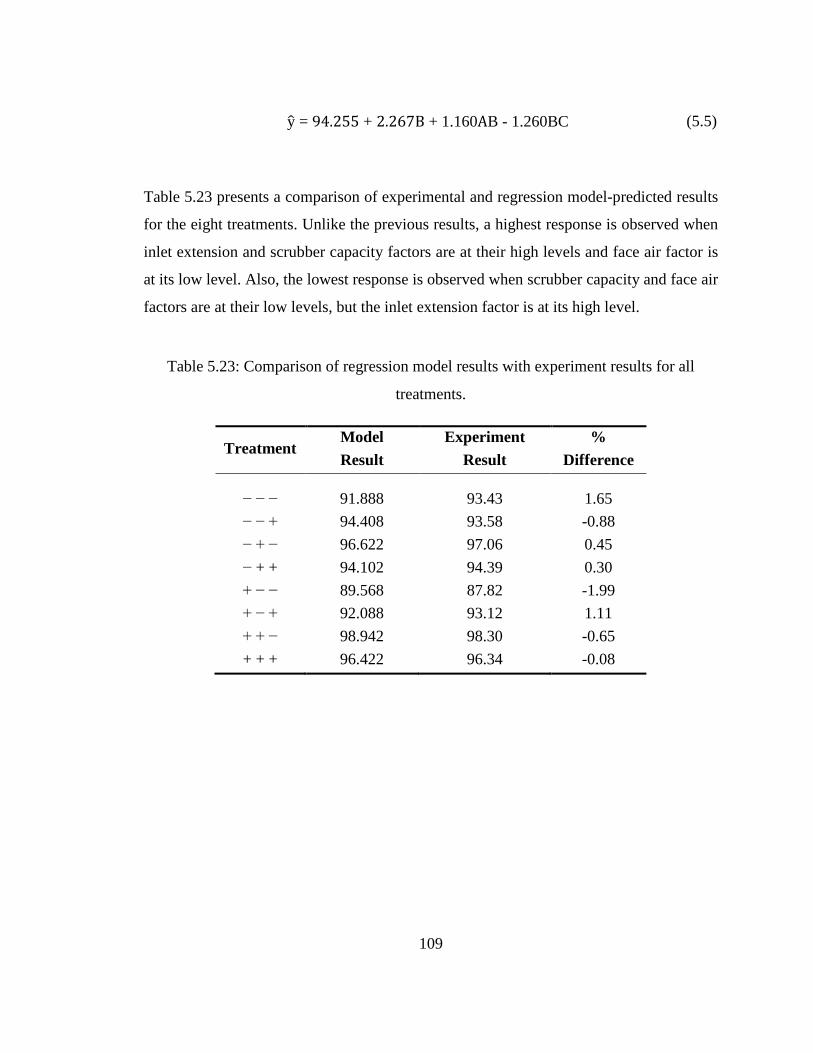
109
y� = 94.255 + 2.267B + 1.160AB - 1.260BC (5.5)
Table 5.23 presents a comparison of experimental and regression model-predicted results
for the eight treatments. Unlike the previous results, a highest response is observed when
inlet extension and scrubber capacity factors are at their high levels and face air factor is
at its low level. Also, the lowest response is observed when scrubber capacity and face air
factors are at their low levels, but the inlet extension factor is at its high level.
Table 5.23: Comparison of regression model results with experiment results for all
treatments.
Treatment Model Result
Experiment Result
% Difference
− − − 91.888 93.43 1.65 − − + 94.408 93.58 -0.88 − + − 96.622 97.06 0.45 − + + 94.102 94.39 0.30 + − − 89.568 87.82 -1.99 + − + 92.088 93.12 1.11 + + − 98.942 98.30 -0.65 + + + 96.422 96.34 -0.08
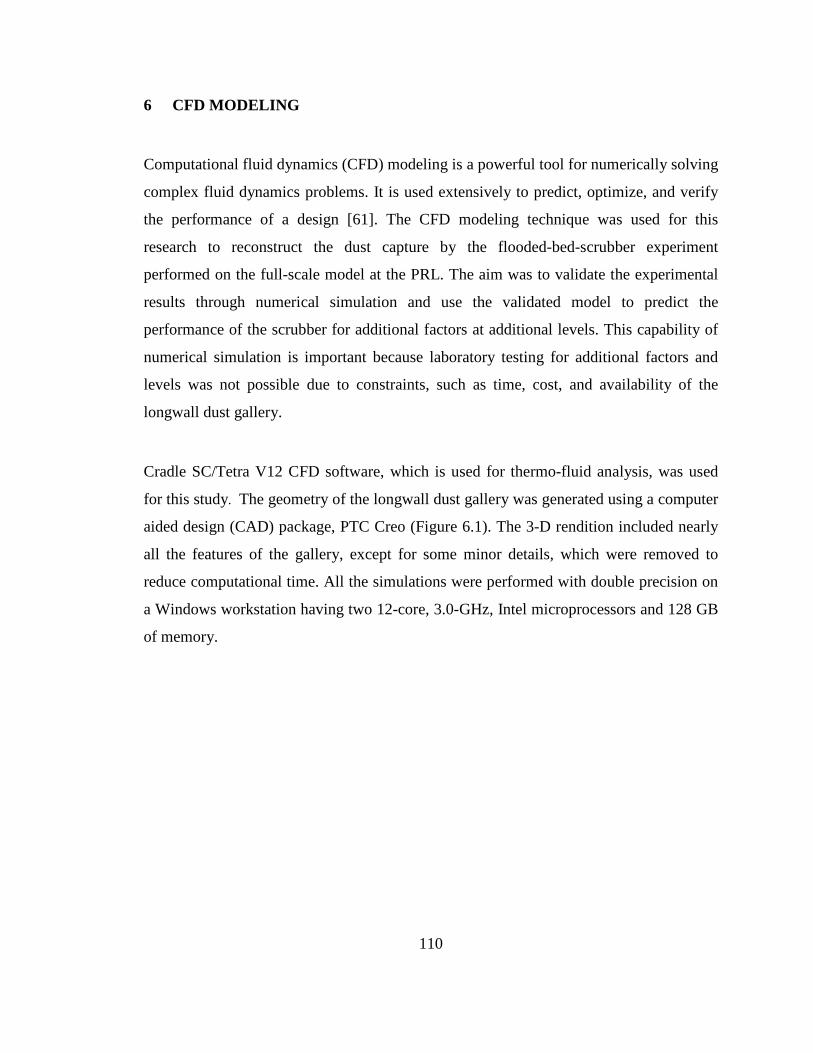
110
6 CFD MODELING
Computational fluid dynamics (CFD) modeling is a powerful tool for numerically solving
complex fluid dynamics problems. It is used extensively to predict, optimize, and verify
the performance of a design [61]. The CFD modeling technique was used for this
research to reconstruct the dust capture by the flooded-bed-scrubber experiment
performed on the full-scale model at the PRL. The aim was to validate the experimental
results through numerical simulation and use the validated model to predict the
performance of the scrubber for additional factors at additional levels. This capability of
numerical simulation is important because laboratory testing for additional factors and
levels was not possible due to constraints, such as time, cost, and availability of the
longwall dust gallery.
Cradle SC/Tetra V12 CFD software, which is used for thermo-fluid analysis, was used
for this study. The geometry of the longwall dust gallery was generated using a computer
aided design (CAD) package, PTC Creo (Figure 6.1). The 3-D rendition included nearly
all the features of the gallery, except for some minor details, which were removed to
reduce computational time. All the simulations were performed with double precision on
a Windows workstation having two 12-core, 3.0-GHz, Intel microprocessors and 128 GB
of memory.
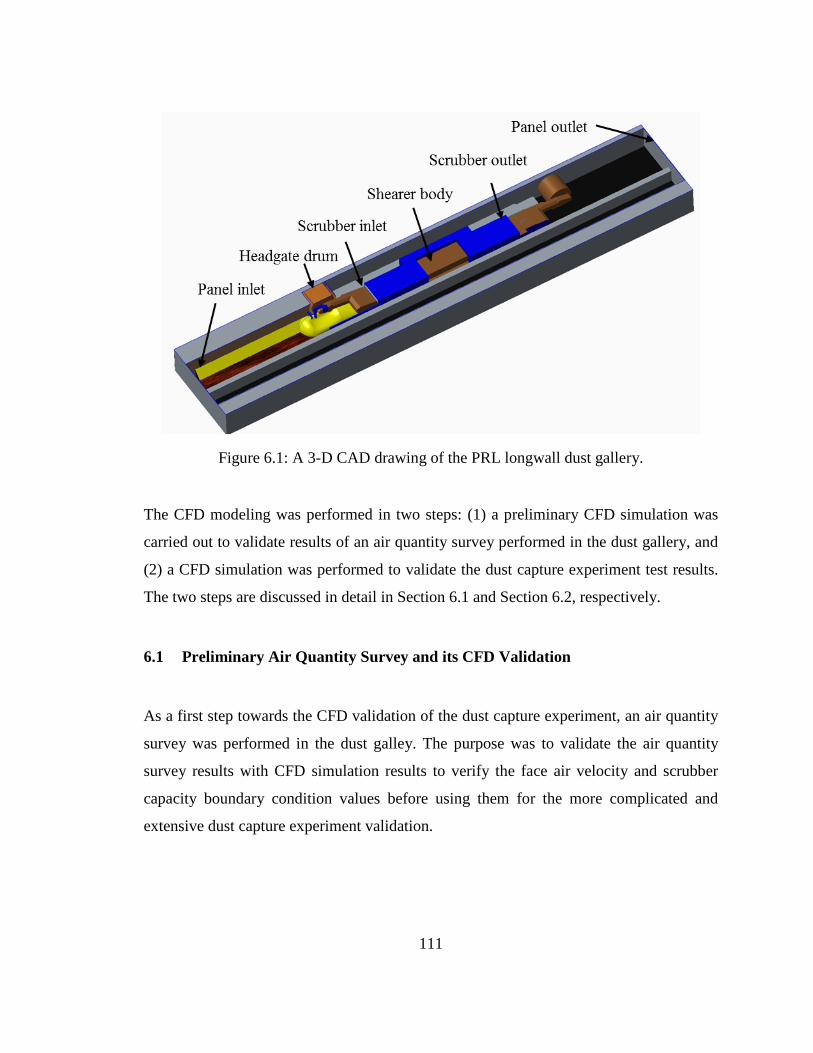
111
Figure 6.1: A 3-D CAD drawing of the PRL longwall dust gallery.
The CFD modeling was performed in two steps: (1) a preliminary CFD simulation was
carried out to validate results of an air quantity survey performed in the dust gallery, and
(2) a CFD simulation was performed to validate the dust capture experiment test results.
The two steps are discussed in detail in Section 6.1 and Section 6.2, respectively.
6.1 Preliminary Air Quantity Survey and its CFD Validation
As a first step towards the CFD validation of the dust capture experiment, an air quantity
survey was performed in the dust galley. The purpose was to validate the air quantity
survey results with CFD simulation results to verify the face air velocity and scrubber
capacity boundary condition values before using them for the more complicated and
extensive dust capture experiment validation.
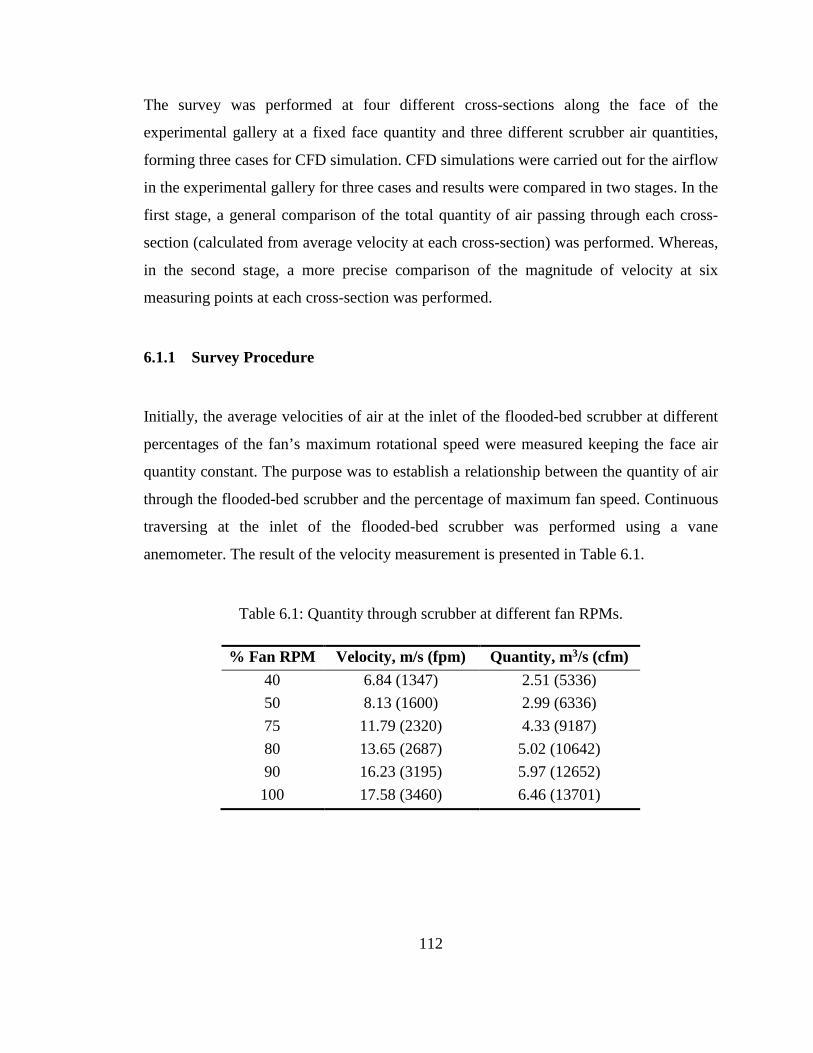
112
The survey was performed at four different cross-sections along the face of the
experimental gallery at a fixed face quantity and three different scrubber air quantities,
forming three cases for CFD simulation. CFD simulations were carried out for the airflow
in the experimental gallery for three cases and results were compared in two stages. In the
first stage, a general comparison of the total quantity of air passing through each cross-
section (calculated from average velocity at each cross-section) was performed. Whereas,
in the second stage, a more precise comparison of the magnitude of velocity at six
measuring points at each cross-section was performed.
6.1.1 Survey Procedure
Initially, the average velocities of air at the inlet of the flooded-bed scrubber at different
percentages of the fan’s maximum rotational speed were measured keeping the face air
quantity constant. The purpose was to establish a relationship between the quantity of air
through the flooded-bed scrubber and the percentage of maximum fan speed. Continuous
traversing at the inlet of the flooded-bed scrubber was performed using a vane
anemometer. The result of the velocity measurement is presented in Table 6.1.
Table 6.1: Quantity through scrubber at different fan RPMs.
% Fan RPM Velocity, m/s (fpm) Quantity, m3/s (cfm) 40 6.84 (1347) 2.51 (5336) 50 8.13 (1600) 2.99 (6336) 75 11.79 (2320) 4.33 (9187) 80 13.65 (2687) 5.02 (10642) 90 16.23 (3195) 5.97 (12652) 100 17.58 (3460) 6.46 (13701)
113
The quantity survey was performed at four different cross-sections along the length of the
panel face. The locations of each cross-section from the inlet were 11.97 m (39.27 feet),
14.71 m (48.27 feet), 17.22 m (56.50 feet), and 22.64 m (74.29 feet), respectively (Figure
6.2). Each cross-section was divided into a 60.96 cm x 60.96 cm (2 feet x 2 feet) square
grid, and air velocity measurements were taken using a hot wire anemometer at points
shown as blue circles in Figure 6.3.
The quantity of air passing through each cross-section was calculated from the product of
area-weighted average velocity and the total area of the cross-section for the first stage
comparison. Six points from each cross-section were picked for the second stage
comparison. The points were located inside a blue dashed-line rectangle at the center of
each cross-section as shown in Figure 6.3. The experiment was repeated for all four
cross-sections with three different percentages of maximum fan speeds: 0% (scrubber fan
turned off), 50%, and 100%. The face air quantity was kept constant. See Table 6.2 for
the results of the air quantity through different cross-sections at different scrubber
quantities. Tables 6.3 through 6.5 present the velocities at six points for each of the four
cross-sections at 100%, 50% and 0% scrubber capacity, respectively.

114
Figure 6.2: Quantity survey cross-section locations
Figure 6.3: Cross-section of the longwall panel with 0.6096 m x 0.6096 m grid and
measurement points.
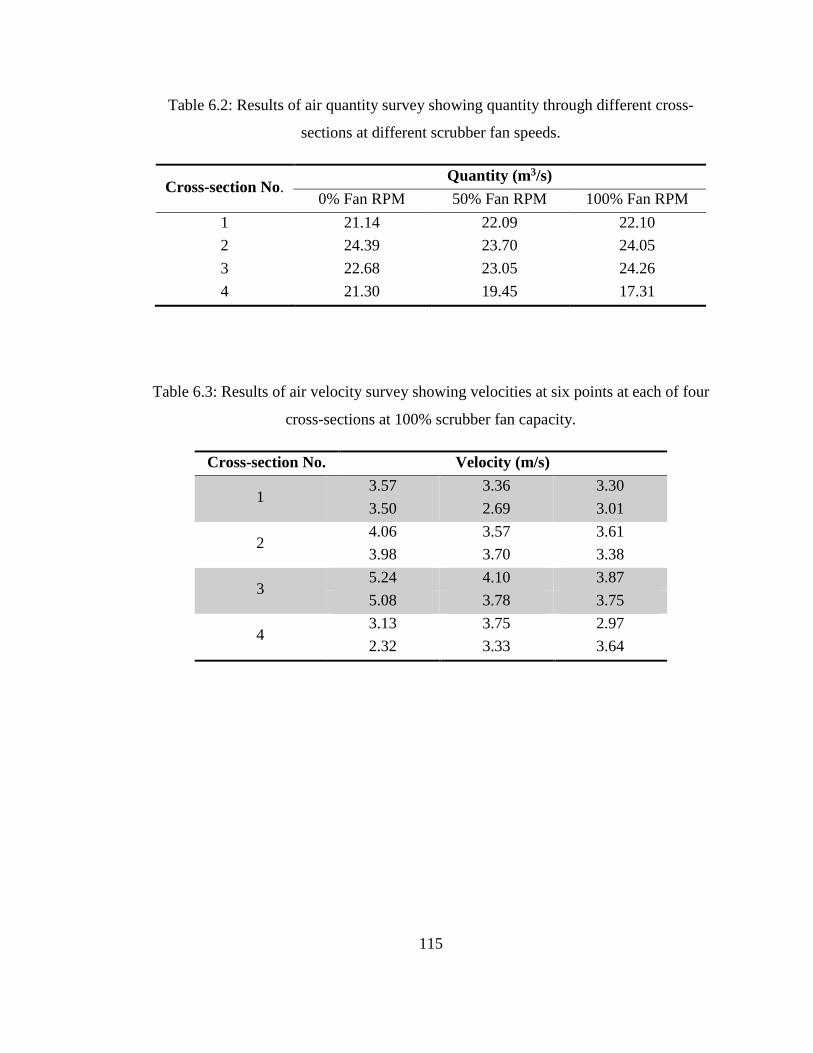
115
Table 6.2: Results of air quantity survey showing quantity through different cross-
sections at different scrubber fan speeds.
Cross-section No. Quantity (m3/s)
0% Fan RPM 50% Fan RPM 100% Fan RPM 1 21.14 22.09 22.10 2 24.39 23.70 24.05 3 22.68 23.05 24.26 4 21.30 19.45 17.31
Table 6.3: Results of air velocity survey showing velocities at six points at each of four
cross-sections at 100% scrubber fan capacity.
Cross-section No. Velocity (m/s)
1 3.57 3.36 3.30 3.50 2.69 3.01
2 4.06 3.57 3.61 3.98 3.70 3.38
3 5.24 4.10 3.87 5.08 3.78 3.75
4 3.13 3.75 2.97 2.32 3.33 3.64

116
Table 6.4: Results of air velocity survey showing velocities at six points at each of four
cross-sections at 50% scrubber fan capacity.
Cross-section No. Velocity (m/s)
1 3.50 3.37 3.30 3.44 2.92 3.16
2 4.17 3.43 3.90 3.69 3.67 3.64
3 4.39 4.26 3.90 4.36 3.86 3.76
4 3.12 3.37 3.22 2.75 3.78 3.75
Table 6.5: Results of air velocity survey showing velocities at six points at each of four
cross-sections at 0% scrubber fan capacity.
Cross-section No. Velocity (m/s)
1 3.29 3.34 3.18 3.43 2.97 3.06
2 4.27 3.41 3.85 3.89 3.68 3.63
3 3.23 3.72 3.94 3.99 3.75 3.82
4 3.30 3.64 3.96 1.89 4.11 4.11

117
6.1.2 CFD Simulation
In this study, the steady-state simulations were performed using Reynolds averaged
Navier-Stokes equations (RANS) with Standard K-ε turbulence model. The fluid (air)
was assumed to be incompressible. The numerical simulations to reproduce physical
phenomena were performed using the following governing equations:
Mass conservation equation
𝜕𝜕𝜕𝜕𝑖𝑖𝜕𝜕𝜕𝜕𝑖𝑖
= 0 (6.1)
Momentum conservation equation (i direction)
𝜕𝜕𝜕𝜕𝜕𝜕𝑖𝑖𝜕𝜕𝜕𝜕
+𝜕𝜕𝜕𝜕𝑗𝑗𝜕𝜕𝜕𝜕𝑖𝑖𝜕𝜕𝜕𝜕𝑗𝑗
= −𝜕𝜕𝜕𝜕𝜕𝜕𝜕𝜕𝑖𝑖
+𝜕𝜕𝜕𝜕𝜕𝜕𝑗𝑗
𝜇𝜇 �𝜕𝜕𝜕𝜕𝑖𝑖𝜕𝜕𝜕𝜕𝑗𝑗
+𝜕𝜕𝜕𝜕𝑗𝑗𝜕𝜕𝜕𝜕𝑖𝑖
� − 𝜕𝜕𝑔𝑔𝑖𝑖𝛽𝛽(𝑇𝑇 − 𝑇𝑇0) (6.2)
Energy conservation equation
𝜕𝜕𝜕𝜕𝜕𝜕𝑃𝑃𝑇𝑇𝜕𝜕𝜕𝜕
+𝜕𝜕𝜕𝜕𝑗𝑗𝜕𝜕𝜕𝜕𝑃𝑃𝑇𝑇𝜕𝜕𝜕𝜕𝑗𝑗
=𝜕𝜕𝜕𝜕𝜕𝜕𝑗𝑗
𝐾𝐾𝜕𝜕𝑇𝑇𝜕𝜕𝜕𝜕𝑗𝑗
+ �̇�𝑞 (6.3)
Equation of turbulent energy and turbulent dissipation rate
K equation
𝜕𝜕𝜕𝜕𝜕𝜕𝜕𝜕𝜕𝜕
+𝜕𝜕𝜕𝜕𝑖𝑖𝜕𝜕𝜕𝜕𝜕𝜕𝜕𝜕𝑖𝑖
=𝜕𝜕𝜕𝜕𝜕𝜕𝑖𝑖
�𝜇𝜇𝑡𝑡𝜎𝜎𝑘𝑘
𝜕𝜕𝜕𝜕𝜕𝜕𝜕𝜕𝑖𝑖
� + 𝐺𝐺𝑆𝑆 + 𝐺𝐺𝑇𝑇 − 𝜕𝜕𝜌𝜌 (6.4)

118
ε equation
𝜕𝜕𝜕𝜕𝜌𝜌𝜕𝜕𝜕𝜕
+𝜕𝜕𝜕𝜕𝑖𝑖𝜕𝜕𝜌𝜌𝜕𝜕𝜕𝜕𝑖𝑖
=𝜕𝜕𝜕𝜕𝜕𝜕𝑖𝑖
�𝜇𝜇𝑡𝑡𝜎𝜎𝜀𝜀
𝜕𝜕𝜌𝜌𝜕𝜕𝜕𝜕𝑖𝑖
� + 𝜕𝜕1𝜌𝜌𝜕𝜕
(𝐺𝐺𝑆𝑆 + 𝐺𝐺𝑇𝑇)�1 + 𝜕𝜕3𝑅𝑅𝑓𝑓� − 𝜕𝜕2𝜕𝜕𝜌𝜌2
𝜕𝜕 (6.5)
where ui is the flow velocity in m/s in xi direction, t is time in second, ρ is density in m3/s,
p is fluid pressure in Pa, μ is viscosity in Pa.s, μl is molecular viscosity, μt is eddy
viscosity, gi is gravity in m/s2, β is coefficient of volume expansion in K-1, T is fluid
temperature in K, T0 is reference fluid temperature K, CP is specific heat at constant
pressure in J/(kg.K), K is thermal conductivity in W/(m.K), q is heat source in W/m2, k is
turbulent energy in m2/s2, ε is turbulent dissipation rate in m2/s3, C is concentration of a
diffusive species, and R is gas constant in J/(kg.K).
The flow enters the computational domain at the inlet, at a constant air quantity,
perpendicular to the inlet surface. The outlet was assigned a relative static pressure of 0
Pa. Boundary walls were considered to be smooth and stationary. A solution was
assumed to converge when the average residuals of all the variables were less than 10-5
within a cycle, and mass flow was balanced.
An unstructured tetrahedral computational mesh was generated in the computational
domain using the finite volume method (Figure 6.4). Prism layers were used on wall
boundaries to ensure high numerical accuracy [61]. Computational zones with highly
skewed, low aspect ratio elements were refined to minimize numerical error. In addition,
high gradient zones and narrow passages, such as scrubber inlet and outlet, were also
refined.
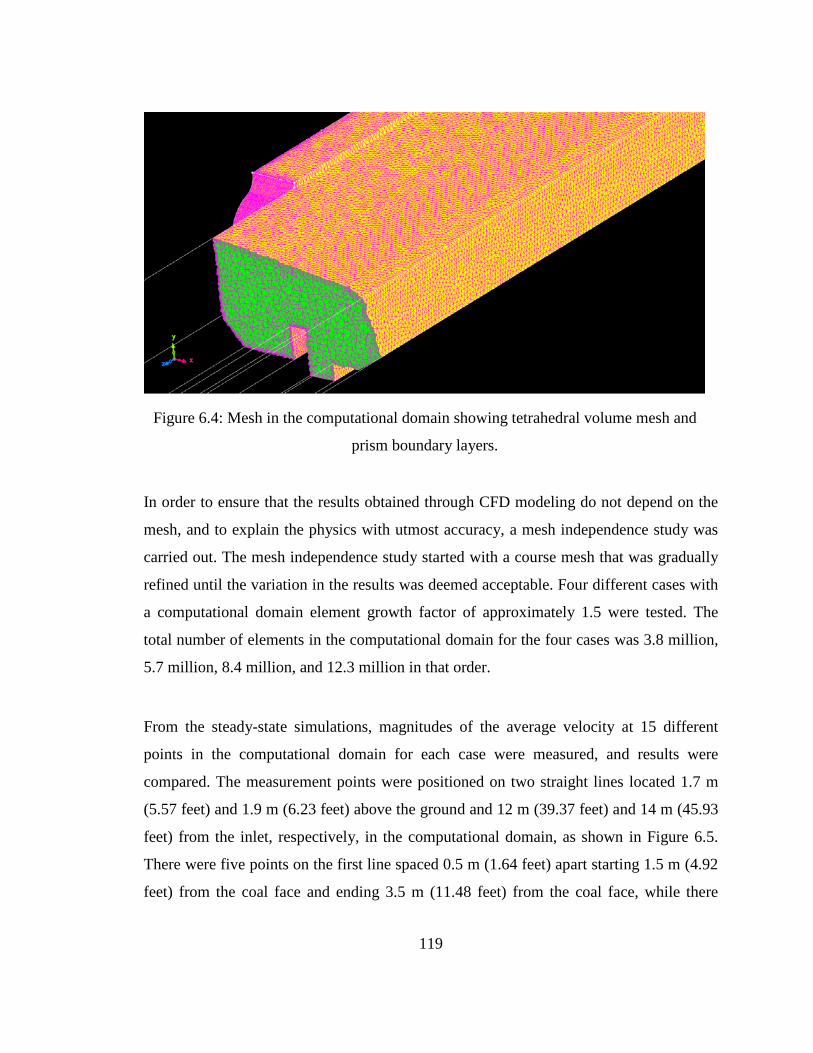
119
Figure 6.4: Mesh in the computational domain showing tetrahedral volume mesh and
prism boundary layers.
In order to ensure that the results obtained through CFD modeling do not depend on the
mesh, and to explain the physics with utmost accuracy, a mesh independence study was
carried out. The mesh independence study started with a course mesh that was gradually
refined until the variation in the results was deemed acceptable. Four different cases with
a computational domain element growth factor of approximately 1.5 were tested. The
total number of elements in the computational domain for the four cases was 3.8 million,
5.7 million, 8.4 million, and 12.3 million in that order.
From the steady-state simulations, magnitudes of the average velocity at 15 different
points in the computational domain for each case were measured, and results were
compared. The measurement points were positioned on two straight lines located 1.7 m
(5.57 feet) and 1.9 m (6.23 feet) above the ground and 12 m (39.37 feet) and 14 m (45.93
feet) from the inlet, respectively, in the computational domain, as shown in Figure 6.5.
There were five points on the first line spaced 0.5 m (1.64 feet) apart starting 1.5 m (4.92
feet) from the coal face and ending 3.5 m (11.48 feet) from the coal face, while there

120
were ten points on the second line spaced 0.5 m (1.64 feet) apart starting 0.3 m (0.98 feet)
from the coal face and ending 4.8 m (15.74) from the coal face. The first line was chosen
in the high turbulence zone (in front of the scrubber inlet), whereas the second line was
chosen in the low turbulence zone (in the middle of the modified shearer). Figures 6.6
and 6.7 show the mesh independence study results for average velocity at the points on
the first and second lines, respectively, marked in Figure 6.5. The mesh independence
study indicated that results became independent of the grid size at 5.7 million elements.
Figure 6.5: Cross-section of the longwall dust gallery (not to scale) showing the
locations of point of average velocity measurements for the mesh independence test.
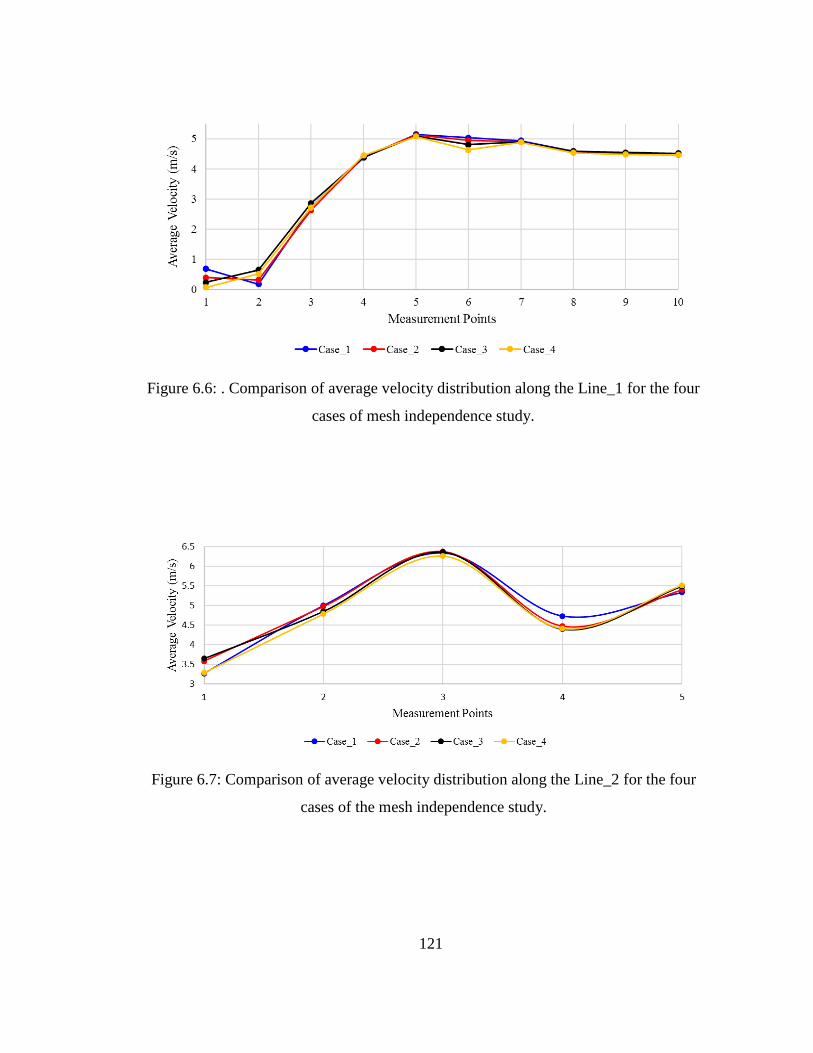
121
Figure 6.6: . Comparison of average velocity distribution along the Line_1 for the four
cases of mesh independence study.
Figure 6.7: Comparison of average velocity distribution along the Line_2 for the four
cases of the mesh independence study.

122
Based on the results obtained from the mesh independence study, the CFD validation of
air quantity survey was performed at 5.7 million elements in the computational domain.
Steady-state simulations were run for three different scrubber air quantities while keeping
the inlet quantity constant. The value for the inlet flow rate for the CFD simulations was
taken from the air quantity survey at the first cross-section. As the inlet of the scrubber
was withdrawing air from the computational domain, it was given fixed flow quantities of
-6.46 m3/s (13,700 cfm), -2.99 m3/s (6,336 cfm), and -0.00 m3/s (0.00 cfm) for the three
fan speeds: 100%, 50%, and 0%, respectively. The same values with opposite signs were
assigned to the outlet of the scrubber.
For the first stage comparison, the scaler integration of magnitudes of velocity at each
cross-section was performed to calculate the average velocity at each cross-section shown
in Figure 6.8. However, for the second stage comparison, vector integration of magnitude
of velocity in each of the six 60.96 cm x 60.96 cm (2 feet x 2 feet) square grids at each
cross-section were performed to calculate velocity perpendicular to a cross-section in
each grid. The values of the airflow quantities at different cross-sections and at different
percentages of maximum fan speed are presented in Table 6.6. Table 6.7 shows the
velocities at six points at each cross-section at 100% scrubber capacity.
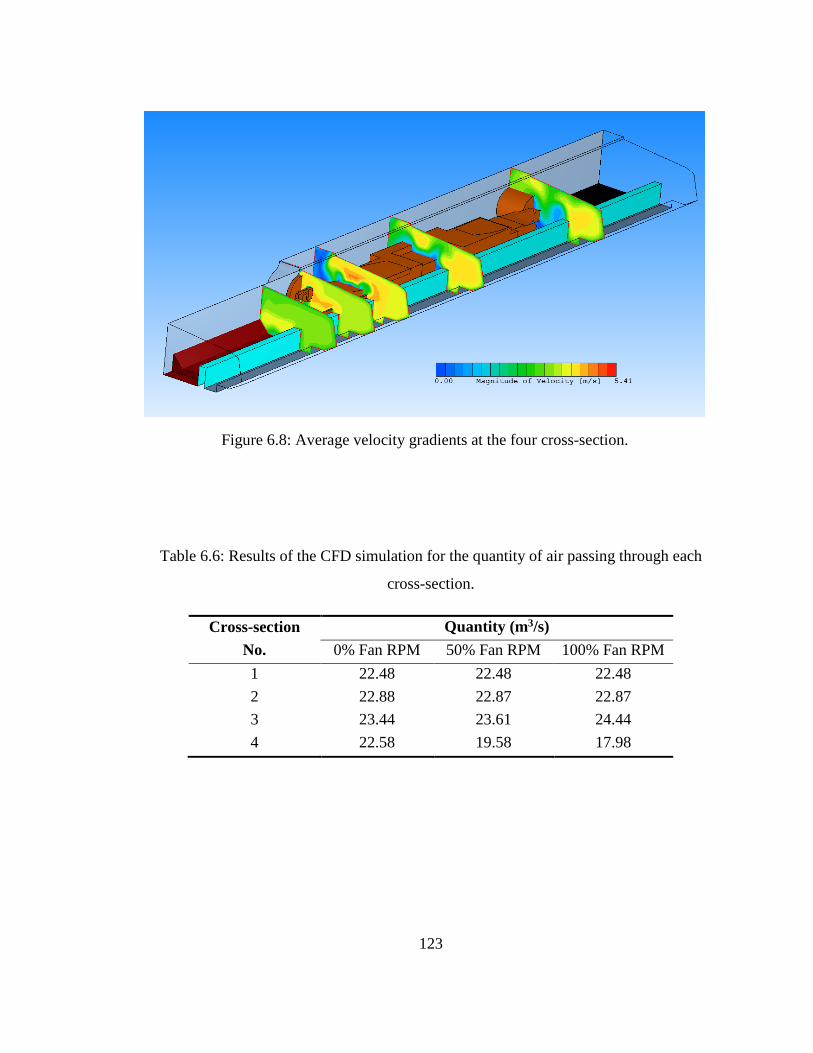
123
Figure 6.8: Average velocity gradients at the four cross-section.
Table 6.6: Results of the CFD simulation for the quantity of air passing through each
cross-section.
Cross-section No.
Quantity (m3/s) 0% Fan RPM 50% Fan RPM 100% Fan RPM
1 22.48 22.48 22.48 2 22.88 22.87 22.87 3 23.44 23.61 24.44 4 22.58 19.58 17.98
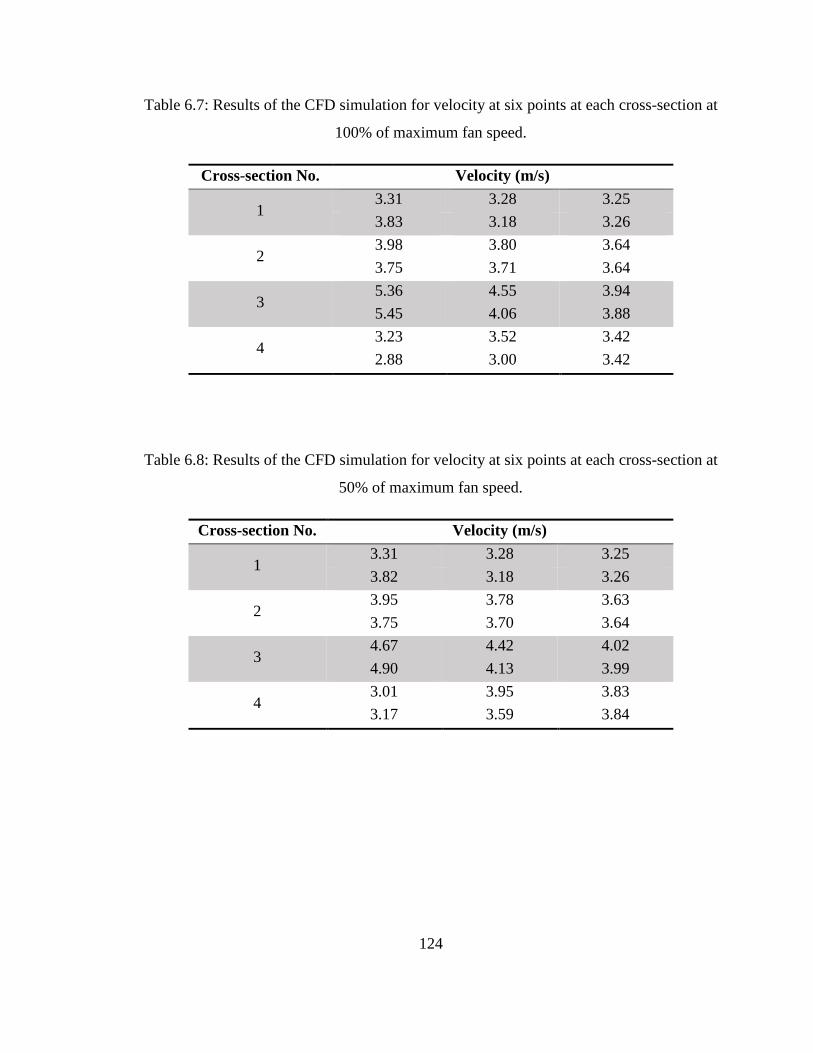
124
Table 6.7: Results of the CFD simulation for velocity at six points at each cross-section at
100% of maximum fan speed.
Cross-section No. Velocity (m/s)
1 3.31 3.28 3.25 3.83 3.18 3.26
2 3.98 3.80 3.64 3.75 3.71 3.64
3 5.36 4.55 3.94 5.45 4.06 3.88
4 3.23 3.52 3.42 2.88 3.00 3.42
Table 6.8: Results of the CFD simulation for velocity at six points at each cross-section at
50% of maximum fan speed.
Cross-section No. Velocity (m/s)
1 3.31 3.28 3.25 3.82 3.18 3.26
2 3.95 3.78 3.63 3.75 3.70 3.64
3 4.67 4.42 4.02 4.90 4.13 3.99
4 3.01 3.95 3.83 3.17 3.59 3.84
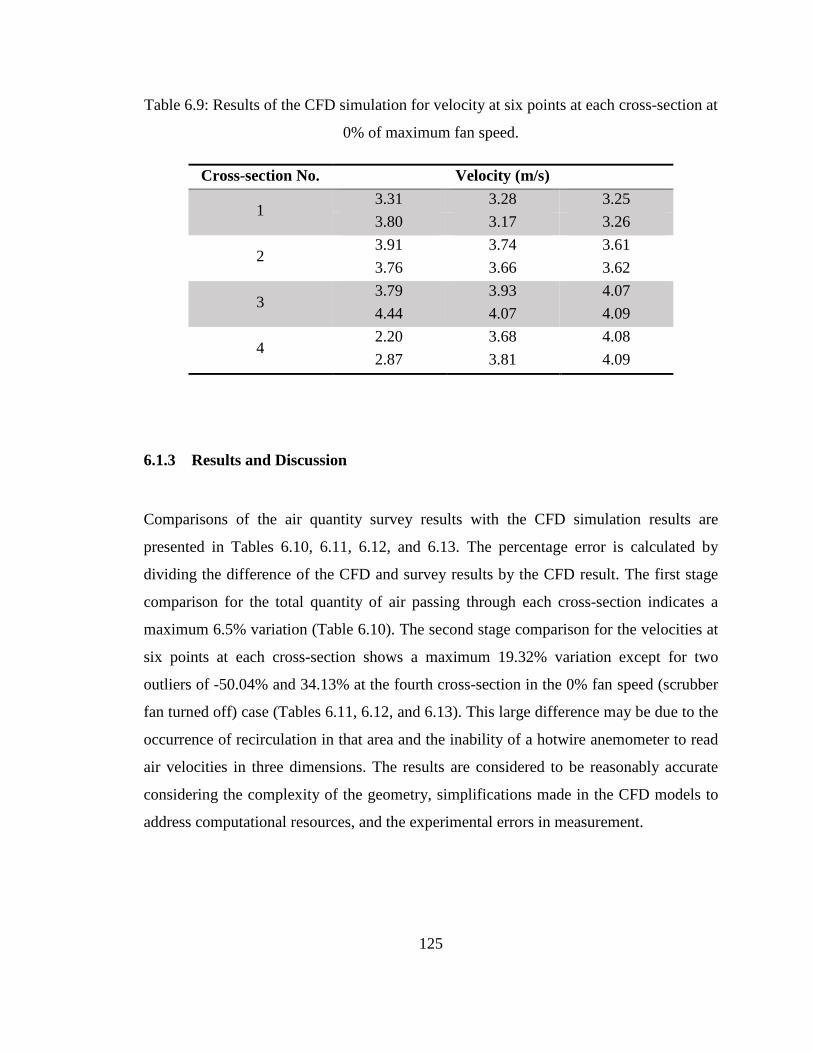
125
Table 6.9: Results of the CFD simulation for velocity at six points at each cross-section at
0% of maximum fan speed.
Cross-section No. Velocity (m/s)
1 3.31 3.28 3.25 3.80 3.17 3.26
2 3.91 3.74 3.61 3.76 3.66 3.62
3 3.79 3.93 4.07 4.44 4.07 4.09
4 2.20 3.68 4.08 2.87 3.81 4.09
6.1.3 Results and Discussion
Comparisons of the air quantity survey results with the CFD simulation results are
presented in Tables 6.10, 6.11, 6.12, and 6.13. The percentage error is calculated by
dividing the difference of the CFD and survey results by the CFD result. The first stage
comparison for the total quantity of air passing through each cross-section indicates a
maximum 6.5% variation (Table 6.10). The second stage comparison for the velocities at
six points at each cross-section shows a maximum 19.32% variation except for two
outliers of -50.04% and 34.13% at the fourth cross-section in the 0% fan speed (scrubber
fan turned off) case (Tables 6.11, 6.12, and 6.13). This large difference may be due to the
occurrence of recirculation in that area and the inability of a hotwire anemometer to read
air velocities in three dimensions. The results are considered to be reasonably accurate
considering the complexity of the geometry, simplifications made in the CFD models to
address computational resources, and the experimental errors in measurement.

126
Table 6.10: A comparison of CFD results with survey results for quantity of air through
each cross-section.
Cross-section No. % Quantity Difference
0% Fan RPM 50% Fan RPM 100% Fan RPM 1 5.94 1.73 1.67 2 -6.57 -3.63 -5.18 3 3.25 2.33 0.72 4 5.68 0.67 3.77
Table 6.11: A comparison of CFD results with survey results for velocities at six points at
each cross-section at 100% fan RPM.
Cross-section No. Velocity (m/s)
1 -7.61 -2.59 -1.47 8.78 15.39 7.67
2 -2.10 6.18 0.76 -6.21 0.38 7.23
3 2.27 9.95 1.90 6.84 6.89 3.34
4 3.12 -6.74 13.11 19.32 -10.97 -6.64

127
Table 6.12: A comparison of CFD results with survey results for velocities at six points at
each cross-section at 50% fan RPM.
Cross-section No. Velocity (m/s)
1 -5.77 -2.77 -1.60 9.85 8.01 3.02
2 -5.52 9.36 -7.30 1.67 0.83 0.01
3 6.00 3.57 2.99 10.86 6.55 5.67
4 -3.46 14.54 16.10 13.25 -5.12 2.38
Table 6.13: A comparison of CFD results with survey results for velocities at six points at
each cross-section at 0% fan RPM.
Cross-section No. Velocity (m/s)
1 0.56 -2.05 2.09 9.90 6.41 6.07
2 9.03 8.85 -6.75 -3.43 -0.47 -0.28
3 14.93 5.32 3.15 10.12 7.92 6.62
4 -50.04 1.04 2.78 34.13 -7.84 0.29

128
6.2 CFD Validation of Dust Capture Experiment Test Results
CFD validation of dust capture experimental results were performed using the CFD
validated boundary condition values from Section 6.1. The purpose was to use the
validated CFD model to predict the dust capture results for additional factors at additional
levels, and to select the most effective combination for future industrial testing. This is
because the laboratory testing of additional tests conditions was not possible due to
constraints, such as time, cost, and availability of the longwall dust gallery.
Since the main purpose of this research was to examine the effect of a flooded-bed
scrubber on dust reduction, this CFD study was focused on the validation of results for
experimental condition 3 (see Table 5.7) at sampling station 13 (return). Table 6.14
shows the experimental results for the percentage of dust reduction for the eight
treatments in the return. The percentage dust reduction value for each treatment is the
mean of the results of five observations associated with that treatment. It is noted that the
percentage dust reduction in the return can also be termed the flooded-bed scrubber dust
capture efficiency as they both give the same values.
Table 6.14. Experimental result for percentage dust reduction in the return.
Test Conditions
A(-1)
B(-1)
C(-1)
A(-1)
B(+1)
C(-1)
A(-1)
B(-1)
C(+1)
A(-1)
B(+1)
C(+1)
A(+1)
B(-1)
C(-1)
A(+1)
B(+1)
C(-1)
A(+1)
B(-1)
C(+1)
A(+1)
B(+1)
C(+1)
% Dust Reduction 21.17 43.00 23.57 49.63 21.87 49.83 33.19 56.99
A= Inlet extension, B = Scrubber capacity, C = Face air

129
6.2.1 CFD Simulation
Each simulation was performed in two steps: first, a single-phase, steady-state simulation
was conducted to establish airflow in the computational domain that represents
conditions before dust release; then, a transient-state simulation was performed for the
dust capture by the flooded-bed scrubber, representing the state after dust release.
Reynolds Averaged Navier-Stokes equations (RANS) with the Standard K-ε turbulence
model was used to predict flow in the computational domain. The standard wall function
based on the logarithmic law was applied to predict fluid velocity close to the walls of the
computational domain. The working fluid (air) was assumed to be incompressible with
density and dynamic viscosity values 1.206 kg/m3 and 1.83e-5 Pa-s, respectively, at an
ambient temperature of 20oC. Boundary conditions for all CFD simulations included:
fixed air velocity at the panel inlet, fixed air velocity at the three dust sources, fixed
negative volumetric flow at the scrubber inlet, fixed positive volumetric flow at the fan
outlet, and zero static pressure at the dust gallery outlet. The remaining boundary walls
were treated as smooth and stationary, except the headgate drum that was assigned a
rotating wall condition to mimic the experimental condition. During the laboratory
experiments, the headgate drum was given a circular motion to represent the rotating
drum during the real shearer operation. All values were assigned from the measurements
taken during the experimental study.
An unstructured hybrid mesh was generated in the computational domain to achieve a
model shape with high accuracy (Figure 6.9). The tetrahedral element mesh was created
in the computational domain volume using the Advancing Front method. Four layers of
prism elements were inserted on wall boundaries to capture the effect of walls of the fluid
with high numerical accuracy. The Y+ value at all walls was maintained between 30 and
1000 to permit correct application of logarithmic law wall function, except some
extremely low velocity zones, between the simulated coal face and shearer body. Mesh
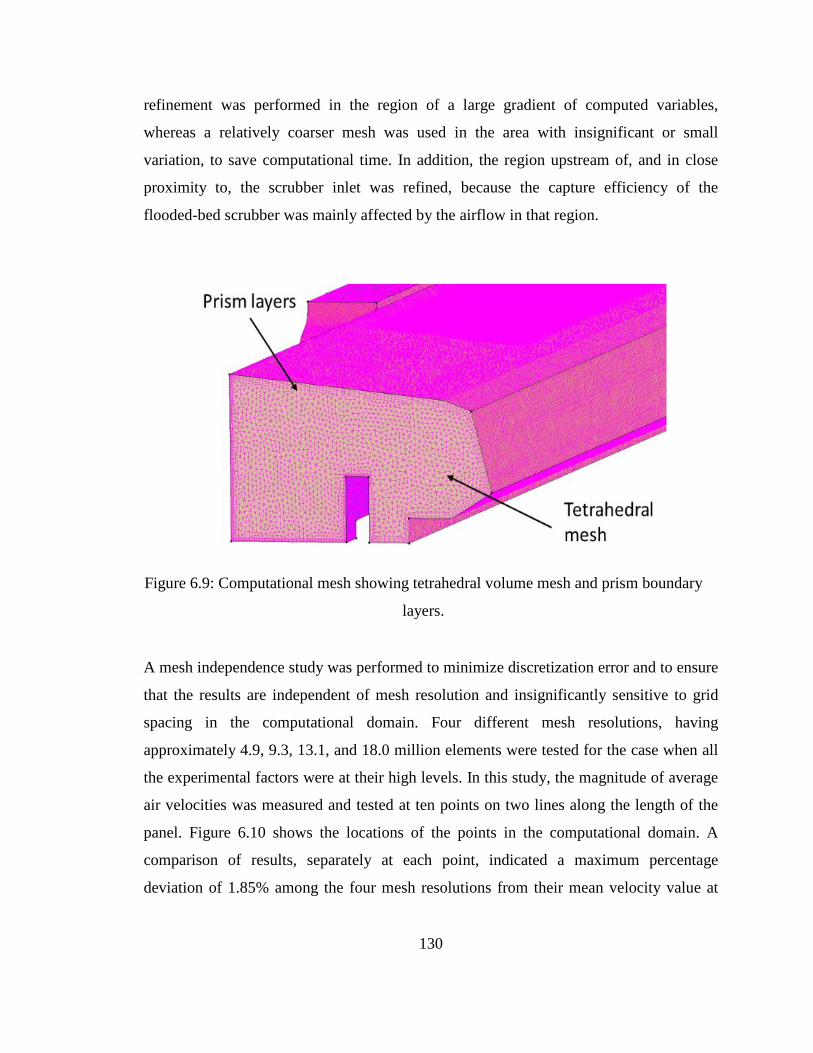
130
refinement was performed in the region of a large gradient of computed variables,
whereas a relatively coarser mesh was used in the area with insignificant or small
variation, to save computational time. In addition, the region upstream of, and in close
proximity to, the scrubber inlet was refined, because the capture efficiency of the
flooded-bed scrubber was mainly affected by the airflow in that region.
Figure 6.9: Computational mesh showing tetrahedral volume mesh and prism boundary
layers.
A mesh independence study was performed to minimize discretization error and to ensure
that the results are independent of mesh resolution and insignificantly sensitive to grid
spacing in the computational domain. Four different mesh resolutions, having
approximately 4.9, 9.3, 13.1, and 18.0 million elements were tested for the case when all
the experimental factors were at their high levels. In this study, the magnitude of average
air velocities was measured and tested at ten points on two lines along the length of the
panel. Figure 6.10 shows the locations of the points in the computational domain. A
comparison of results, separately at each point, indicated a maximum percentage
deviation of 1.85% among the four mesh resolutions from their mean velocity value at
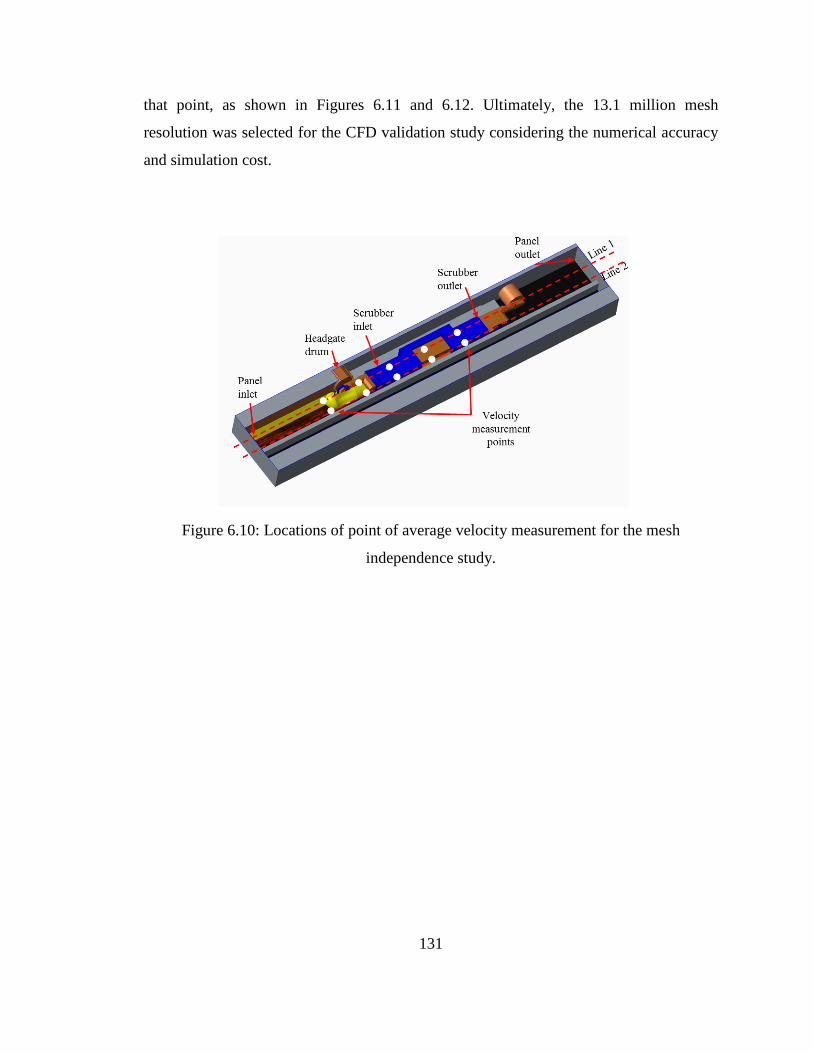
131
that point, as shown in Figures 6.11 and 6.12. Ultimately, the 13.1 million mesh
resolution was selected for the CFD validation study considering the numerical accuracy
and simulation cost.
Figure 6.10: Locations of point of average velocity measurement for the mesh
independence study.
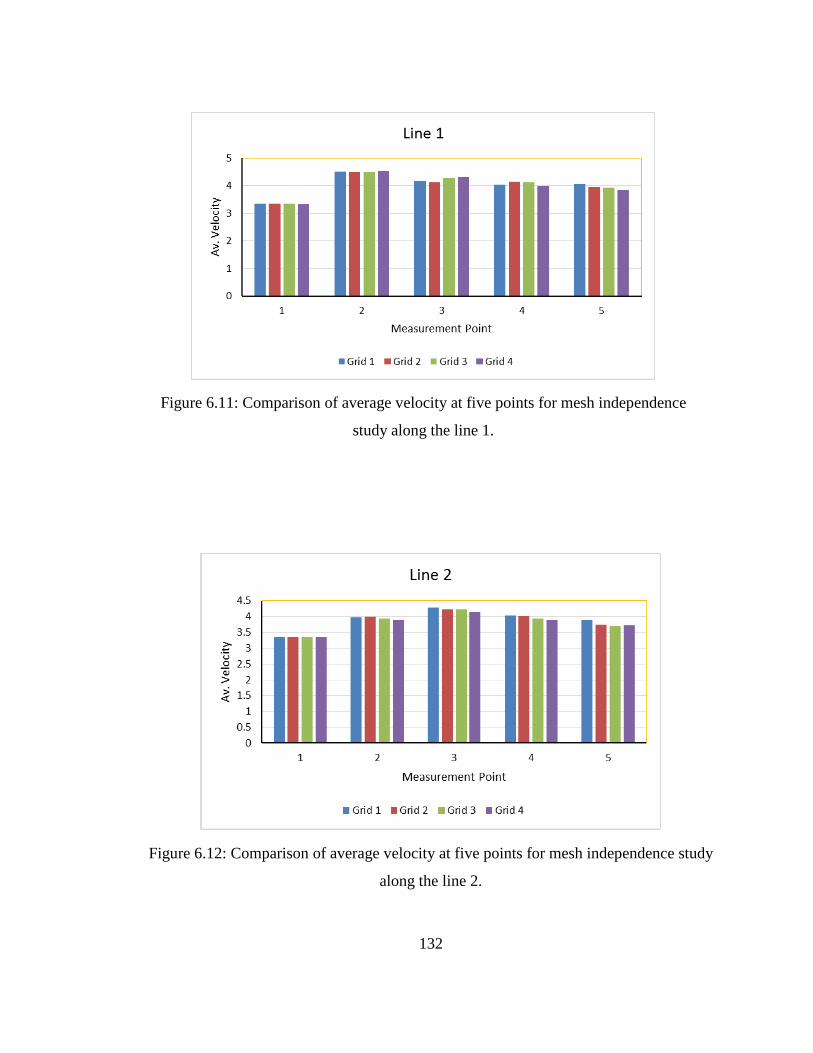
132
Figure 6.11: Comparison of average velocity at five points for mesh independence
study along the line 1.
Figure 6.12: Comparison of average velocity at five points for mesh independence study
along the line 2.

133
Similar to the mesh independence study, a separate study was performed on four
turbulence models (Standard k-ε, RNG k-ε, MP k-ε, and Realizable k-ε) to see the effects
of the different turbulent models on simulation results. The magnitude of average air
velocities was measured and compared at the same ten points shown in Figure 6.10. An
analysis of steady-state results indicated a maximum deviation of 2.0% among the four
turbulence models from their mean velocity, as shown in Figures 6.13 and 6.14.
Figure 6.13: Comparison of average velocity at five points for different turbulence
model along the line 1.
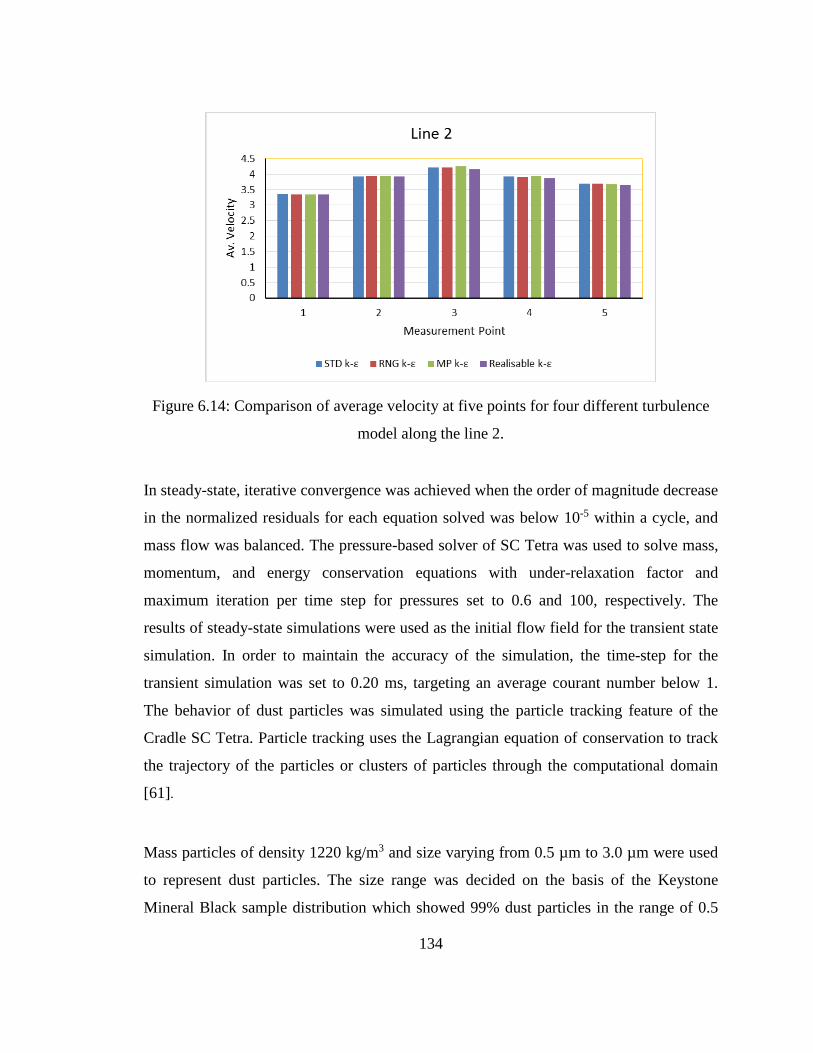
134
Figure 6.14: Comparison of average velocity at five points for four different turbulence
model along the line 2.
In steady-state, iterative convergence was achieved when the order of magnitude decrease
in the normalized residuals for each equation solved was below 10-5 within a cycle, and
mass flow was balanced. The pressure-based solver of SC Tetra was used to solve mass,
momentum, and energy conservation equations with under-relaxation factor and
maximum iteration per time step for pressures set to 0.6 and 100, respectively. The
results of steady-state simulations were used as the initial flow field for the transient state
simulation. In order to maintain the accuracy of the simulation, the time-step for the
transient simulation was set to 0.20 ms, targeting an average courant number below 1.
The behavior of dust particles was simulated using the particle tracking feature of the
Cradle SC Tetra. Particle tracking uses the Lagrangian equation of conservation to track
the trajectory of the particles or clusters of particles through the computational domain
[61].
Mass particles of density 1220 kg/m3 and size varying from 0.5 µm to 3.0 µm were used
to represent dust particles. The size range was decided on the basis of the Keystone
Mineral Black sample distribution which showed 99% dust particles in the range of 0.5
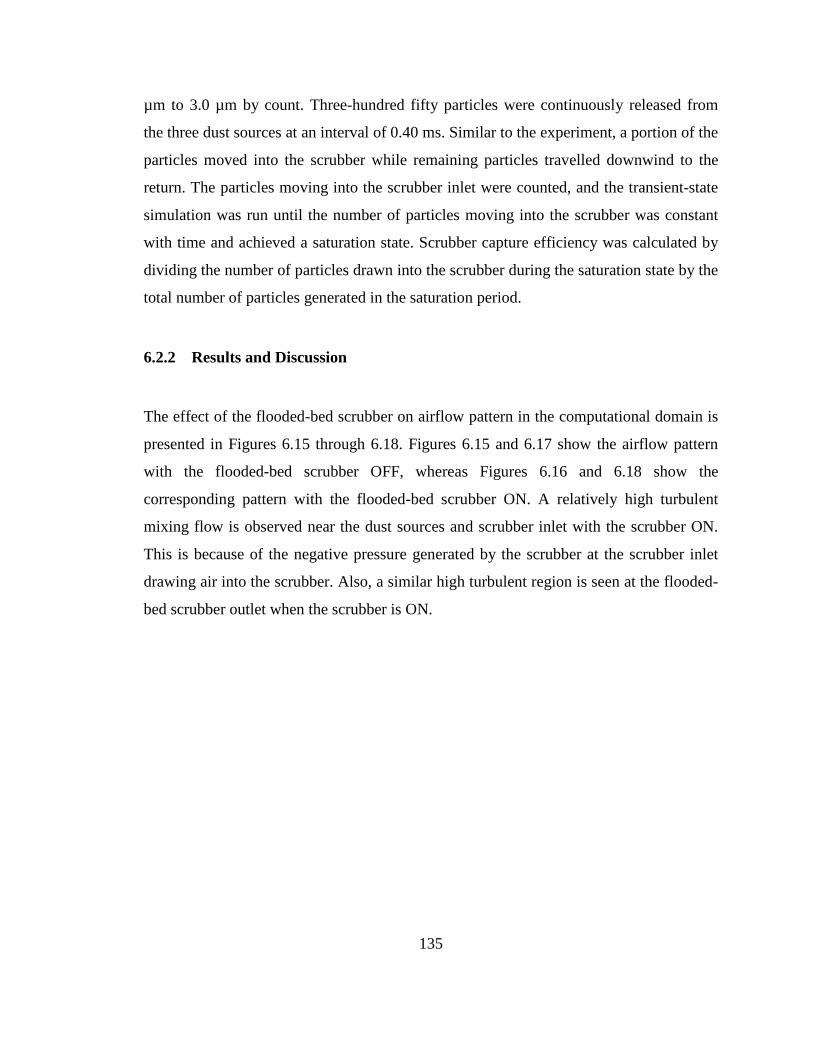
135
µm to 3.0 µm by count. Three-hundred fifty particles were continuously released from
the three dust sources at an interval of 0.40 ms. Similar to the experiment, a portion of the
particles moved into the scrubber while remaining particles travelled downwind to the
return. The particles moving into the scrubber inlet were counted, and the transient-state
simulation was run until the number of particles moving into the scrubber was constant
with time and achieved a saturation state. Scrubber capture efficiency was calculated by
dividing the number of particles drawn into the scrubber during the saturation state by the
total number of particles generated in the saturation period.
6.2.2 Results and Discussion
The effect of the flooded-bed scrubber on airflow pattern in the computational domain is
presented in Figures 6.15 through 6.18. Figures 6.15 and 6.17 show the airflow pattern
with the flooded-bed scrubber OFF, whereas Figures 6.16 and 6.18 show the
corresponding pattern with the flooded-bed scrubber ON. A relatively high turbulent
mixing flow is observed near the dust sources and scrubber inlet with the scrubber ON.
This is because of the negative pressure generated by the scrubber at the scrubber inlet
drawing air into the scrubber. Also, a similar high turbulent region is seen at the flooded-
bed scrubber outlet when the scrubber is ON.

136
Figure 6.15: Velocity gradient at seven cross-sections perpendicular to the length of the
longwall panel (scrubber OFF).
Figure 6.16: Velocity gradient at seven cross-section perpendicular to the length of the
longwall panel (scrubber ON).

137
Figure 6.17: Velocity gradient on a plane parallel to the floor and passing through the
center of the inlet and outlet ducts (scrubber OFF).
Figure 6.18: Velocity gradient on a plane parallel to the floor and passing through
center of the inlet and outlet ducts (scrubber ON).

138
The scrubber also influences the airflow in the walkway. The airflow is relatively less
turbulent and uniform when the scrubber is OFF, but with the scrubber ON the airflow
quantity decreases downwind of the scrubber inlet. The high velocity of air through the
scrubber outlet creates a low pressure zone which influences airflow from the walkway
towards the outlet. Airflow in the space between the simulated coal face and shearer body
is low and recirculating as compared to the case with scrubber OFF.
Figures 6.19 and 6.20 illustrate the trajectories of dust particles in the computational
domain with scrubber OFF and scrubber ON conditions, respectively. The dust reduction
in the computational domain due to the presence of the scrubber is quite obvious. The
scrubber fan creates negative pressure and draws dust-laden air towards the inlet of the
scrubber. A part of the generated dust is captured by the scrubber while the other part
either penetrates to the walkway or permeates downwind to the dust gallery return. A
comparison of Figure 6.19 with Figure 6.20 clearly shows that there are fewer particles in
the dust gallery and almost no particles in the walkway with the scrubber ON as
compared to the scrubber OFF condition.
Figure 6.19: Dust pattern in the computational domain in saturation state (Scrubber fan
OFF).

139
Figure 6.20: Dust pattern in the computational domain in saturation state (Scrubber fan
ON).
The CFD study carried out for the flooded-bed scrubber capture efficiency test in the
longwall dust gallery at PRL shows the capture efficiency varying from 21.55% to
53.63%, depending on the factor levels. The maximum and minimum efficiencies were
found for the cases when all experimental factors were at their high levels and low levels,
respectively. A comparison of numerical simulation results with experimental results of
the scrubber dust capture efficiency at the eight different experimental cases is presented
in Figure 6.21. The percentage difference was calculated by dividing the difference
between the experimental and numerical results by the experimental result. The
numerical results are in good agreement with experimental results, with a maximum
variation of 9.7% in the case when the inlet extension and scrubber quantity factors are at
low levels and the face air velocity is at the high level. With this level of accuracy, the
model can be utilized further to predict the scrubber performance under additional
operating conditions. Also, the model will be very helpful in optimizing the design of the
scrubber to achieve a higher capture efficiency. Moreover, the model can be used to

140
design a new scrubber system, which is capable of capturing dust generated from both
headgate and tailgate drums.
Figure 6.21: Comparison of experimental and CFD simulation results for the eight sets
of experiments performed in the PRL longwall dust gallery.
141
7 SUMMARY AND CONCLUSION
Efficient removal of dust from the ventilation air at a dust generation point (dust source)
in an underground coal mine greatly reduces workers’ exposure to high dust
concentrations. In the United States, most continuous miners use machine-mounted
flooded-bed scrubbers to capture and remove dust generated during coal cutting
operations. The flooded-bed scrubber is a fan powered dust separator that pulls dust-
laden air from the dust sources into the scrubber duct, separates the dust from the air, and
discharges clean air back into the mine environment. According to the National Institute
for Occupational Health and Safety (NIOSH), a flooded-bed scrubber can achieve a
maximum of up to 90% capture and cleaning efficiencies. However, the use of a flooded-
bed scrubber is currently limited only to a continuous miner, and is not used with
longwall shearer.
The research in this dissertation was focused on the development of a flooded-bed dust
scrubber for a longwall shearer to help reduce dust concentration at a longwall face. A
full-scale physical model of the Joy 7LS longwall shearer, integrated with a flooded-bed
scrubber, was designed and fabricated at the Department of Mining Engineering,
University of Kentucky. The aim was to test the effectiveness of the modified design on
dust reduction at a longwall face. The physical model was installed in the longwall dust
gallery at the Pittsburgh Research Laboratory (PRL) of the NIOSH, and tests were
performed for three experimental factors (inlet extension, scrubber capacity, and face air
velocity) at two levels, producing eight treatments. Each treatment was repeated five
times resulting in a total of forty experiments. Since the use of the splitter sprays is very
common in the U.S. longwall mines, each experiment was conducted in a sequence so
that both the effect of scrubber and the combined effect of scrubber and splitter sprays
could be measured separately. Dust was generated through three dust sources, located in
the proximity of the headgate drum, and dust concentrations in the dust gallery were
142
measured using sixteen Personal Dust Monitors (PDMs) placed at different location in
the dust gallery.
Analysis of test results shows an excellent flooded-bed scrubber capture efficiency. With
an integrated flooded-bed scrubber, the modified shearer is able to reduce a maximum of
up to 57% dust in the return airway and 85% dust in the walkway of the PRL dust
gallery. The combined effect of scrubber and splitter sprays is more significant with dust
reduction of up to 61% and 96% in the return and walkway of the PRL dust gallery,
respectively. The splitter sprays direct dust towards the face and prevent it from going
into the walkway, hence helping to reduce dust concentration in the walkway. Further
analysis of the regression model generated from the scrubber capture efficiency results
suggests the scrubber capacity as a major contributor to the dust reduction, both in the
return and walkway of the dust gallery. This implies that a high capacity fan can provide
even better results.
In a subsequent study, computational fluid dynamics (CFD) simulations were performed
to validate the experimental results through CFD results. The purpose was to use the
validated CFD model to predict the dust reduction results for additional factors at
additional levels because laboratory testing for additional test conditions was not possible
due to constraints, such as time, cost, and availability of the longwall dust gallery. Eight
CFD simulations were carried out for eight corresponding experimental treatments, and
results were compared. The simulation results are found to be in agreement with the
experimental results with a maximum deviation of 9.7%.
The dissertation establishes that a flooded-bed scrubber system integrated into a longwall
shearer will be very effective in aiding to reduce a significant amount of dust
concentration, both in the walkway and return of a longwall mine. The application of the
scrubber concept will lead to a safer and healthier work environment at a longwall section
and will help save thousands of lives across the world. In addition, the study delivers a
143
full-scale physical model of a modified shearer as a tool that will be very useful for future
studies to further improve the underground coal mine environment. The CFD model of
the test setup will help researchers to optimize the design of the scrubber and to predict
effects of changes made in the longwall system.
7.1 Future Work
To improve the dust reduction capacity of the flooded-bed dust scrubber, the research
results indicate the need for future study in the following areas:
1. Dust clogging of the flooded-bed wire-mesh screen due to scrubber captured dust
entrainment is one of the major issues. This issue is experienced with present-day
continuous miner scrubbers, but it would be much worse with a longwall
installation because of its higher coal production rates. According to a NIOSH
study, the continuous miner flooded-bed scrubber loses one-third of its airflow
after every cut, and the clogged screen must be replaced with a clean screen [62]
frequently. The clogged screen is back-flushed with water and dried. The dry
screen is then shaken to remove remaining dirt before reusing. The process
requires ceasing the continuous miner operation, causing a decrease in the
productivity of the mine.
The recommended solution for this problem is the use of an automatic back-flush
mechanism to remove dust particles from the flooded-bed scrubber screen. Also,
as a pre-cleaning process, placement of a coarse wire-mesh inside the inlet duct to
separate large dust particles from the captured dust can prevent large dust
particles from clogging the flooded-bed screen. Furthermore, replacement of the
flooded-bed screen with a maintenance free system, such as a vortecone scrubber,
can also be an option. The vortecone scrubber is a tried and tested technology that
has proven its usefulness in industrial settings with 99.8% cleaning efficiency for
144
coal combustion fly ash in a coal-fired power plant and 99.6% efficiency for over-
sprayed paint particles in an automobile manufacturing paint booth [63]–[65].
2. The design of the scrubber needs to be refined to achieve a higher dust capture
efficiency. A CFD study can be performed to optimization the design using the
validated CFD model.
3. As a preliminary study, this research was narrowed to the capture of the headgate
drum generated dust when the shearer is operating against the face airflow in a bi-
directional mining condition. Therefore, a modification in the scrubber design is
required so that the scrubber can capture dust generated from both headgate and
tailgate drums during a complete pass.
4. Since the result indicates scrubber capacity as the most significant factor in dust
reduction in the return and the walkway of the dust gallery, a CFD study needs to
be conducted to verify the claim that further increase in scrubber capacity will
increase dust capture.
5. As discussed in the previous chapter, the design should be modified for, and
tested in, a high coal seam as it is predicted to perform better with a larger size
duct.

145
APPENDICES
Appendix a: Raw Data from Experiment
Table A. 1: Data from the first treatment (Extension - OFF; Scrubber Capacity – 6,350 cfm, Face Air – 400 fpm).
Test#start time Walkway
Mid-walkway
Mid-shearer Mid-face Face Walkway
Mid-walkway
Mid-shearer Mid-face Face Top left
Bottom left Top right
Bottom right
dust 0506 2070 2056 0507 1881 00301495/
008 009A 0001 0021 0054 009B 07510814/ 1380
1380/ 056 1355
26 Dust 25.28 30.25 27.76 20.74 16.76 15.94 16.05 10.21 15.27 17.36 18.71 20.72 9.07 4.88 8.46 7.371:00 Fan 22.24 26.13 14.01 18.75 16.75 14.88 11.83 3.43 6.46 11.31 14.25 18.58 8.13 5.16 7.01 9.172.71 Scrubber 22.91 27.41 16.58 17.95 11.80 15.22 11.91 4.01 7.67 11.61 14.94 19.14 7.17 4.10 6.15 7.31
Splitter 2.47 2.30 0.60 4.07 12.44 18.11 19.46 0.49 1.44 3.95 7.96 16.31 5.66 3.46 4.94 5.98Dust 26.49 27.43 26.28 21.56 17.01 16.17 16.01 9.81 14.69 16.56 18.26 21.26 9.26 5.10 8.38 7.68
36 Dust 24.40 35.88 23.43 19.98 20.29 16.63 16.93 8.32 9.70 17.28 19.18 18.87 10.94 8.52 4.93 7.551:00 Fan 21.20 35.14 11.56 21.94 17.03 15.39 13.49 3.35 4.26 10.99 15.85 18.12 9.09 7.29 5.14 10.222.66 Scrubber 21.44 34.64 14.67 21.39 16.64 14.45 12.99 4.01 5.12 12.62 16.64 18.05 7.38 5.21 3.96 6.64
Splitter 2.99 3.98 0.58 3.13 12.04 18.63 24.59 0.29 0.72 2.73 7.17 15.53 6.09 4.87 3.36 6.35Dust 25.78 34.50 24.19 20.02 18.26 16.99 16.94 9.48 10.30 18.16 19.30 19.15 11.09 7.59 5.22 7.75
38 Dust 23.60 29.66 19.50 17.85 13.46 15.75 14.91 9.21 14.92 17.09 18.33 16.10 9.02 7.63 5.00 4.8910:00 Fan 18.98 30.09 10.65 19.21 12.33 14.84 12.15 2.66 6.26 11.71 15.86 15.95 8.31 8.12 4.84 7.762.57 Scrubber 17.75 30.51 10.88 18.44 11.87 13.85 11.53 2.98 6.86 12.21 15.98 15.65 6.76 6.11 3.84 5.55
Splitter 2.02 2.69 0.65 2.72 9.26 18.90 23.66 0.38 0.85 3.12 6.89 13.20 5.67 5.39 3.32 5.33Dust 21.26 31.27 18.97 18.67 13.20 14.73 15.31 8.33 14.60 17.70 19.37 16.41 9.17 7.92 5.68 5.83
45 Dust 20.12 39.00 28.05 19.16 17.46 16.14 13.72 7.52 14.08 16.87 16.76 17.23 9.13 8.59 5.67 5.8510:00 Fan 17.34 35.89 10.81 22.01 18.78 15.22 11.99 2.73 5.74 10.56 13.48 16.90 7.25 7.84 4.84 7.17
2.9 Scrubber 16.99 35.71 12.41 21.81 18.58 15.45 12.17 3.12 6.08 11.04 13.61 16.93 6.19 6.23 4.39 5.56Splitter 2.29 3.39 0.42 2.16 11.13 17.83 23.61 0.45 1.46 2.46 5.60 15.79 5.57 5.45 3.94 4.89
Dust 21.02 34.53 26.44 18.12 19.55 16.49 13.75 6.98 12.55 16.35 15.48 16.52 8.84 8.34 5.39 5.6161 Dust 23.02 44.69 26.09 23.38 16.57 12.04 16.97 8.58 14.99 17.73 17.77 19.84 7.57 7.16 4.82 6.52
10:00 Fan 17.92 42.35 17.27 25.20 21.50 10.56 16.90 3.01 7.17 12.17 15.89 20.48 6.97 7.78 4.67 7.142.3 Scrubber 19.81 40.66 18.24 23.16 20.89 10.45 17.62 3.96 7.87 12.43 14.68 19.51 5.94 6.21 3.90 5.91
Splitter 1.10 3.72 5.39 3.00 12.81 22.06 22.43 0.39 1.08 2.86 7.69 17.84 4.98 5.63 3.49 5.57Dust 27.15 40.67 28.37 24.81 18.78 13.87 19.76 9.06 15.69 18.56 19.32 22.10 8.25 7.99 5.32 6.98
Operating condition
Splitter Inlet
Scrubber Filter - The Hub + 252" Tailgate - The Hub + 474" Return

146
Table A. 2: Data from the second treatment (Extension - OFF; Scrubber Capacity – 6,350 cfm, Face Air – 600 fpm).
Test#start time Walkway
Mid-walkway
Mid-shearer Mid-face Face Walkway
Mid-walkway
Mid-shearer Mid-face Face Top left
Bottom left Top right
Bottom right
dust 0506 2070 2056 0507 1881 00301495/
008 009A 0001 0021 0054 009B 07510814/ 1380
1380/ 056 1355
15 Dust 0.48 14.23 3.53 12.72 13.52 6.16 8.40 1.57 3.53 8.29 11.47 8.59 4.86 3.56 5.35 4.958:00 Fan 0.26 9.34 1.22 12.01 10.43 5.22 7.14 0.23 1.68 4.73 9.32 7.75 4.39 3.98 5.26 5.402.08 Scrubber 0.43 10.20 1.45 12.97 11.40 5.16 7.10 0.59 1.84 5.32 10.08 8.18 3.75 3.15 4.35 4.20
Splitter 0.12 0.81 0.18 6.42 17.85 14.07 4.89 0.13 0.68 3.59 10.93 13.11 3.68 3.08 4.29 4.07Dust 0.49 15.27 4.11 13.07 13.63 8.53 9.53 1.67 4.20 9.14 12.77 9.67 5.10 4.19 5.52 5.83
40 Dust 0.69 22.21 4.01 16.76 16.12 6.54 8.82 1.21 3.65 11.40 14.03 9.09 3.80 4.07 4.22 3.558:00 Fan 0.86 12.51 1.64 13.10 13.39 6.13 7.86 0.42 1.81 6.47 11.43 8.56 4.20 4.16 4.30 3.872.4 Scrubber 0.95 15.00 1.88 14.78 14.86 6.15 8.28 0.62 1.85 7.24 12.59 9.05 3.54 3.66 3.56 3.24
Splitter 0.12 1.27 0.01 4.49 16.97 18.02 6.96 0.16 0.52 3.94 11.11 14.29 3.61 3.80 3.67 3.27Dust 1.40 32.80 7.36 21.13 18.49 7.04 10.67 2.04 5.89 15.15 18.10 12.14 5.33 5.58 5.92 4.61
47 Dust 1.56 32.87 9.00 19.56 21.97 7.24 10.05 2.24 6.21 13.67 17.82 11.89 5.40 5.53 6.10 4.641:00 Fan 1.58 20.99 3.64 16.03 17.00 5.72 7.70 0.80 2.66 7.23 13.43 10.55 5.05 5.69 5.43 4.552.26 Scrubber 1.43 20.82 3.61 15.84 16.92 5.82 7.57 0.90 2.76 7.45 13.42 10.53 3.93 4.11 4.12 3.56
Splitter 0.62 2.63 0.24 3.80 17.91 16.74 11.09 0.15 0.73 2.97 9.75 14.34 3.88 4.11 4.08 3.66Dust 1.54 31.55 8.50 18.61 21.68 6.80 9.05 1.97 5.61 13.23 17.75 11.87 5.36 5.59 6.19 4.65
50 Dust 1.83 34.36 2.07 19.94 20.10 8.95 9.45 9.68 6.82 14.31 18.28 12.14 4.93 4.98 4.54 6.318:00 Fan 1.77 21.85 0.80 17.17 17.18 6.05 8.12 4.31 2.83 8.92 14.79 12.06 4.92 5.19 4.18 6.342.61 Scrubber 1.71 23.90 0.88 17.77 16.81 5.60 6.74 4.50 3.15 9.64 14.85 11.63 3.95 3.79 3.43 4.68
Splitter 1.16 1.73 0.23 5.79 16.17 18.29 8.87 0.64 0.79 4.71 11.51 15.07 3.92 3.77 3.27 4.84Dust 1.90 36.00 2.47 18.78 18.36 8.24 9.44 10.39 7.05 15.08 17.33 11.33 5.12 5.21 4.69 6.41
52 Dust 2.36 29.44 8.96 18.88 18.93 7.98 10.76 2.31 6.88 13.91 16.99 11.53 4.95 5.50 6.33 5.598:00 Fan 2.32 18.74 3.86 17.75 16.63 5.90 7.87 1.08 3.30 10.31 15.34 11.58 4.97 6.02 5.97 5.352.43 Scrubber 2.55 20.75 4.35 18.71 16.65 5.77 7.84 1.25 3.72 10.90 15.89 11.59 4.18 4.54 4.91 4.72
Splitter 1.07 2.14 0.52 8.05 15.68 18.62 8.73 0.29 1.08 5.99 14.52 16.57 4.06 4.30 4.97 4.68Dust 2.06 31.92 9.69 18.27 19.37 8.08 9.43 2.73 6.71 14.77 17.44 11.84 5.24 5.59 6.32 5.98
Tailgate - The Hub + 474"
Operating condition
Splitter Inlet
Scrubber Filter - The Hub + 252" Return

147
Table A. 3: Data from the third treatment (Extension - OFF; Scrubber Capacity – 13,500 cfm, Face Air – 400 fpm).
Test#start time Walkway
Mid-walkway
Mid-shearer Mid-face Face Walkway
Mid-walkway
Mid-shearer Mid-face Face Top left
Bottom left Top right
Bottom right
dust 0506 2070 2056 0507 1881 00301495/
008 009A 0001 0021 0054 009B 07510814/ 1380
1380/ 056 1355
11 Dust 23.09 19.09 21.93 20.45 21.67 14.53 13.09 9.27 13.22 15.04 18.26 13.34 7.79 7.12 7.51 4.461:00 Fan 13.39 19.06 2.53 10.80 22.25 16.37 16.13 0.34 0.74 2.21 5.63 8.91 7.50 7.49 6.76 6.582.67 Scrubber 17.83 20.42 3.12 11.84 23.75 17.48 16.80 0.62 1.09 3.23 6.75 9.91 4.22 4.04 4.12 3.62
Splitter 2.66 1.11 0.24 0.56 2.43 10.89 17.51 0.24 0.52 1.00 2.52 4.83 3.43 3.39 3.19 3.09Dust 24.90 20.24 23.08 19.75 21.39 14.69 13.41 9.59 13.53 15.10 18.03 13.73 7.88 7.46 8.03 5.27
24 Dust 16.06 31.17 22.08 18.49 13.35 11.56 11.91 6.88 12.46 15.08 16.94 15.77 7.11 6.10 5.45 5.688:00 Fan 9.89 26.82 2.05 11.10 16.62 15.55 11.46 0.50 0.99 3.48 7.46 13.23 7.25 6.10 6.14 7.182.59 Scrubber 12.10 28.82 2.64 12.79 17.48 15.36 11.77 0.49 1.40 4.37 8.60 15.42 3.80 3.13 3.33 3.64
Splitter 1.09 0.98 -0.25 0.52 5.90 12.63 16.30 0.27 0.40 1.45 3.60 15.26 3.18 2.53 2.93 2.45Dust 21.04 31.87 25.10 19.61 11.39 14.56 na 8.05 13.65 16.51 18.62 13.24 7.95 6.10 6.53 5.96
42 Dust 22.42 35.81 22.86 17.96 15.92 13.08 12.12 8.65 13.79 10.82 17.00 14.65 7.22 5.51 4.73 4.098:00 Fan 14.18 33.81 2.78 12.71 20.93 16.56 14.59 0.95 0.87 4.50 7.66 11.10 7.28 6.30 5.35 5.772.56 Scrubber 15.59 37.41 3.41 14.79 23.61 18.46 16.67 1.35 1.18 3.94 8.94 12.50 4.69 3.73 3.46 3.48
Splitter 2.80 2.69 0.23 0.68 5.92 11.34 22.56 0.54 0.43 1.35 3.25 7.41 4.10 3.33 3.05 3.18Dust 28.03 41.33 28.48 20.90 20.81 17.53 15.21 11.47 15.88 18.11 20.19 17.97 9.10 6.63 7.02 4.94
46 Dust 23.17 39.60 31.23 21.91 11.48 15.56 12.84 7.83 14.93 19.43 19.97 17.98 7.98 8.49 4.82 4.6410:00 Fan 11.57 32.69 2.89 12.58 37.54 15.45 14.98 0.39 0.92 3.17 7.49 11.07 6.83 7.39 4.80 5.88
2.4 Scrubber 12.27 33.71 3.60 14.20 23.59 15.63 15.56 0.54 1.08 3.54 8.30 12.07 4.17 4.50 2.87 3.51Splitter 1.47 1.74 0.22 0.35 4.28 9.08 16.27 0.21 0.54 0.99 2.38 5.50 3.19 3.58 2.15 2.77
Dust 21.45 34.66 29.45 19.69 18.72 14.92 12.05 7.52 14.53 17.76 19.43 16.34 7.51 7.92 4.86 4.4564 Dust 18.98 41.32 26.18 23.93 26.52 16.28 15.62 8.89 15.38 15.99 23.89 22.17 9.91 9.08 10.23 9.21
10:00 Fan 11.17 35.62 3.22 15.40 25.58 18.52 18.24 0.12 1.05 5.78 10.11 13.96 8.74 8.73 8.78 8.642.95 Scrubber 9.78 36.06 4.15 19.20 25.03 16.97 17.50 0.57 1.31 5.25 11.18 15.00 4.80 5.05 4.91 5.05
Splitter 1.41 1.84 0.12 0.58 6.84 15.32 24.18 0.28 0.22 1.12 3.23 8.01 3.97 4.06 4.34 4.05Dust 17.65 42.02 28.68 22.35 25.00 16.10 16.79 9.54 15.96 17.16 23.43 21.76 9.87 9.55 10.32 9.48
Operating condition
Splitter Inlet
Scrubber Filter - The Hub + 252" Tailgate - The Hub + 474" Return
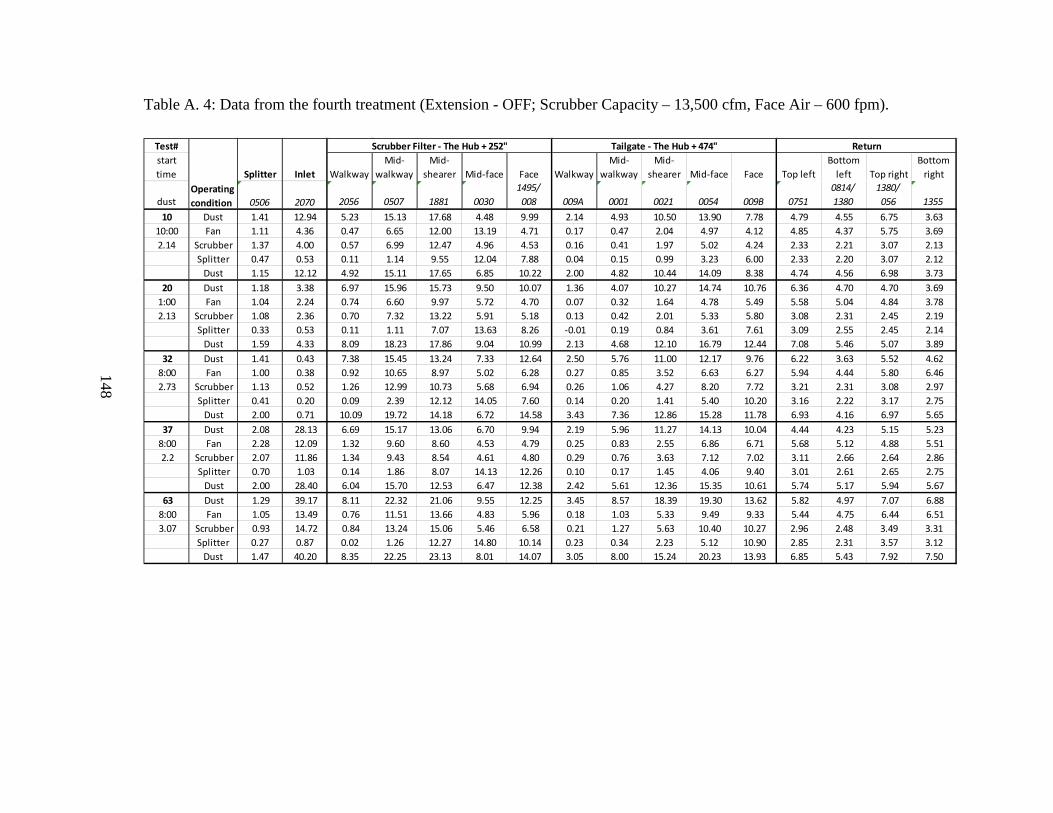
148
Table A. 4: Data from the fourth treatment (Extension - OFF; Scrubber Capacity – 13,500 cfm, Face Air – 600 fpm).
Test#start time Walkway
Mid-walkway
Mid-shearer Mid-face Face Walkway
Mid-walkway
Mid-shearer Mid-face Face Top left
Bottom left Top right
Bottom right
dust 0506 2070 2056 0507 1881 00301495/
008 009A 0001 0021 0054 009B 07510814/ 1380
1380/ 056 1355
10 Dust 1.41 12.94 5.23 15.13 17.68 4.48 9.99 2.14 4.93 10.50 13.90 7.78 4.79 4.55 6.75 3.6310:00 Fan 1.11 4.36 0.47 6.65 12.00 13.19 4.71 0.17 0.47 2.04 4.97 4.12 4.85 4.37 5.75 3.692.14 Scrubber 1.37 4.00 0.57 6.99 12.47 4.96 4.53 0.16 0.41 1.97 5.02 4.24 2.33 2.21 3.07 2.13
Splitter 0.47 0.53 0.11 1.14 9.55 12.04 7.88 0.04 0.15 0.99 3.23 6.00 2.33 2.20 3.07 2.12Dust 1.15 12.12 4.92 15.11 17.65 6.85 10.22 2.00 4.82 10.44 14.09 8.38 4.74 4.56 6.98 3.73
20 Dust 1.18 3.38 6.97 15.96 15.73 9.50 10.07 1.36 4.07 10.27 14.74 10.76 6.36 4.70 4.70 3.691:00 Fan 1.04 2.24 0.74 6.60 9.97 5.72 4.70 0.07 0.32 1.64 4.78 5.49 5.58 5.04 4.84 3.782.13 Scrubber 1.08 2.36 0.70 7.32 13.22 5.91 5.18 0.13 0.42 2.01 5.33 5.80 3.08 2.31 2.45 2.19
Splitter 0.33 0.53 0.11 1.11 7.07 13.63 8.26 -0.01 0.19 0.84 3.61 7.61 3.09 2.55 2.45 2.14Dust 1.59 4.33 8.09 18.23 17.86 9.04 10.99 2.13 4.68 12.10 16.79 12.44 7.08 5.46 5.07 3.89
32 Dust 1.41 0.43 7.38 15.45 13.24 7.33 12.64 2.50 5.76 11.00 12.17 9.76 6.22 3.63 5.52 4.628:00 Fan 1.00 0.38 0.92 10.65 8.97 5.02 6.28 0.27 0.85 3.52 6.63 6.27 5.94 4.44 5.80 6.462.73 Scrubber 1.13 0.52 1.26 12.99 10.73 5.68 6.94 0.26 1.06 4.27 8.20 7.72 3.21 2.31 3.08 2.97
Splitter 0.41 0.20 0.09 2.39 12.12 14.05 7.60 0.14 0.20 1.41 5.40 10.20 3.16 2.22 3.17 2.75Dust 2.00 0.71 10.09 19.72 14.18 6.72 14.58 3.43 7.36 12.86 15.28 11.78 6.93 4.16 6.97 5.65
37 Dust 2.08 28.13 6.69 15.17 13.06 6.70 9.94 2.19 5.96 11.27 14.13 10.04 4.44 4.23 5.15 5.238:00 Fan 2.28 12.09 1.32 9.60 8.60 4.53 4.79 0.25 0.83 2.55 6.86 6.71 5.68 5.12 4.88 5.512.2 Scrubber 2.07 11.86 1.34 9.43 8.54 4.61 4.80 0.29 0.76 3.63 7.12 7.02 3.11 2.66 2.64 2.86
Splitter 0.70 1.03 0.14 1.86 8.07 14.13 12.26 0.10 0.17 1.45 4.06 9.40 3.01 2.61 2.65 2.75Dust 2.00 28.40 6.04 15.70 12.53 6.47 12.38 2.42 5.61 12.36 15.35 10.61 5.74 5.17 5.94 5.67
63 Dust 1.29 39.17 8.11 22.32 21.06 9.55 12.25 3.45 8.57 18.39 19.30 13.62 5.82 4.97 7.07 6.888:00 Fan 1.05 13.49 0.76 11.51 13.66 4.83 5.96 0.18 1.03 5.33 9.49 9.33 5.44 4.75 6.44 6.513.07 Scrubber 0.93 14.72 0.84 13.24 15.06 5.46 6.58 0.21 1.27 5.63 10.40 10.27 2.96 2.48 3.49 3.31
Splitter 0.27 0.87 0.02 1.26 12.27 14.80 10.14 0.23 0.34 2.23 5.12 10.90 2.85 2.31 3.57 3.12Dust 1.47 40.20 8.35 22.25 23.13 8.01 14.07 3.05 8.00 15.24 20.23 13.93 6.85 5.43 7.92 7.50
Operating condition
Splitter Inlet
Scrubber Filter - The Hub + 252" Tailgate - The Hub + 474" Return

149
Table A. 5: Data from the fifth treatment (Extension - ON; Scrubber Capacity – 6,350 cfm, Face Air – 400 fpm).
Test#
start time WalkwayMid-
walkwayMid-
shearer Mid-face Face WalkwayMid-
walkwayMid-
shearer Mid-face Face Top leftBottom
left Top rightBottom
right
dust 0506 2070 2056 0507 1881 00301495/
008 009A 0001 0021 0054 009B 07510814/ 1380
1380/ 056 1355
2 Dust 25.55 45.01 22.90 23.96 22.94 13.52 11.34 8.77 8.71 17.24 18.59 9.24 6.58 4.67 6.081:00 Fan 21.16 35.40 14.66 14.75 16.84 12.28 9.99 3.12 4.05 10.53 14.75 8.87 6.98 4.60 8.732.87 Scrubber 22.46 35.94 8.21 15.08 17.21 12.02 9.10 3.43 4.24 11.07 14.04 6.80 5.15 3.63 5.77
Splitter 7.20 11.56 0.00 7.82 17.24 21.57 14.68 1.03 1.68 8.59 17.13 5.77 4.42 3.33 5.05Dust 26.50 43.64 22.93 21.80 20.09 13.21 11.33 8.09 7.84 15.88 17.82 9.00 6.20 4.19 5.80
3 Dust 20.30 36.81 19.49 24.12 17.42 10.18 7.26 7.00 12.68 16.93 20.76 16.39 6.54 6.34 5.30 3.788:00 Fan 12.21 26.67 8.68 12.94 12.29 7.87 4.98 1.87 4.68 7.88 11.43 11.94 5.26 5.52 4.81 4.142.46 Scrubber 16.70 33.11 11.42 15.90 15.77 10.34 7.53 2.62 6.21 10.08 14.25 14.62 5.24 4.99 4.56 3.89
Splitter 5.89 10.57 1.98 7.99 17.79 23.30 11.85 0.93 2.54 5.86 12.33 16.99 4.81 4.61 4.27 3.72Dust 24.38 41.01 21.78 24.75 14.05 12.73 9.34 7.97 13.76 17.64 22.66 18.60 7.86 7.07 5.60 4.13
8 Dust 32.84 43.29 27.25 25.40 25.58 16.77 12.76 11.04 14.42 17.82 21.87 19.61 8.35 7.04 7.56 5.951:00 Fan 20.89 29.76 13.92 17.27 24.80 14.77 11.38 3.37 5.86 9.41 12.84 15.06 8.18 7.52 6.80 7.512.79 Scrubber 21.92 30.56 14.87 17.82 17.05 14.79 11.20 3.84 6.35 9.76 12.97 15.15 6.44 5.60 5.19 5.41
Splitter 3.45 3.80 8.13 4.87 11.27 19.24 24.58 0.72 1.89 4.19 7.67 14.73 5.10 4.63 4.36 4.90Dust 32.49 40.10 23.81 23.11 22.54 16.61 12.06 10.28 13.20 16.10 19.50 18.47 7.83 6.67 6.94 5.50
41 Dust 25.42 40.44 24.83 19.31 19.64 13.55 12.90 8.48 13.38 16.92 19.64 16.90 8.91 7.36 4.13 6.651:00 Fan 19.37 34.37 13.95 18.34 17.69 12.10 10.28 2.88 5.58 9.84 14.96 15.71 7.88 7.23 5.33 6.102.01 Scrubber 18.40 33.74 14.52 17.21 17.33 11.68 9.94 3.28 5.96 10.26 14.65 15.22 6.00 5.21 3.75 4.53
Splitter 2.42 3.07 0.87 3.91 12.71 18.24 19.90 0.41 1.28 3.66 8.50 13.71 4.76 4.46 3.60 3.80Dust 30.72 45.73 27.49 20.00 20.18 14.72 14.28 9.19 13.84 17.39 20.51 18.38 9.66 8.13 4.69 7.26
43 Dust 33.87 54.53 26.03 21.46 26.43 16.42 14.00 12.45 14.86 19.22 21.56 17.98 9.09 6.77 7.23 5.1710:00 Fan 24.61 40.58 12.92 18.12 22.10 14.68 11.78 4.51 6.20 10.74 15.07 15.48 7.60 7.00 6.30 6.242.69 Scrubber 26.24 43.23 14.98 19.02 23.02 14.64 11.94 4.57 7.05 12.99 16.04 16.53 6.59 5.63 5.18 4.87
Splitter 4.52 5.55 1.53 6.96 21.42 23.50 27.10 1.98 2.00 5.50 12.20 18.58 5.46 4.85 4.78 4.41Dust 31.80 47.69 25.31 20.63 23.12 17.41 14.23 12.51 14.80 18.65 21.11 18.19 9.18 6.89 7.46 5.13
Tailgate - The Hub + 474"
Operating condition
Splitter Inlet
Scrubber Filter - The Hub +252" Return
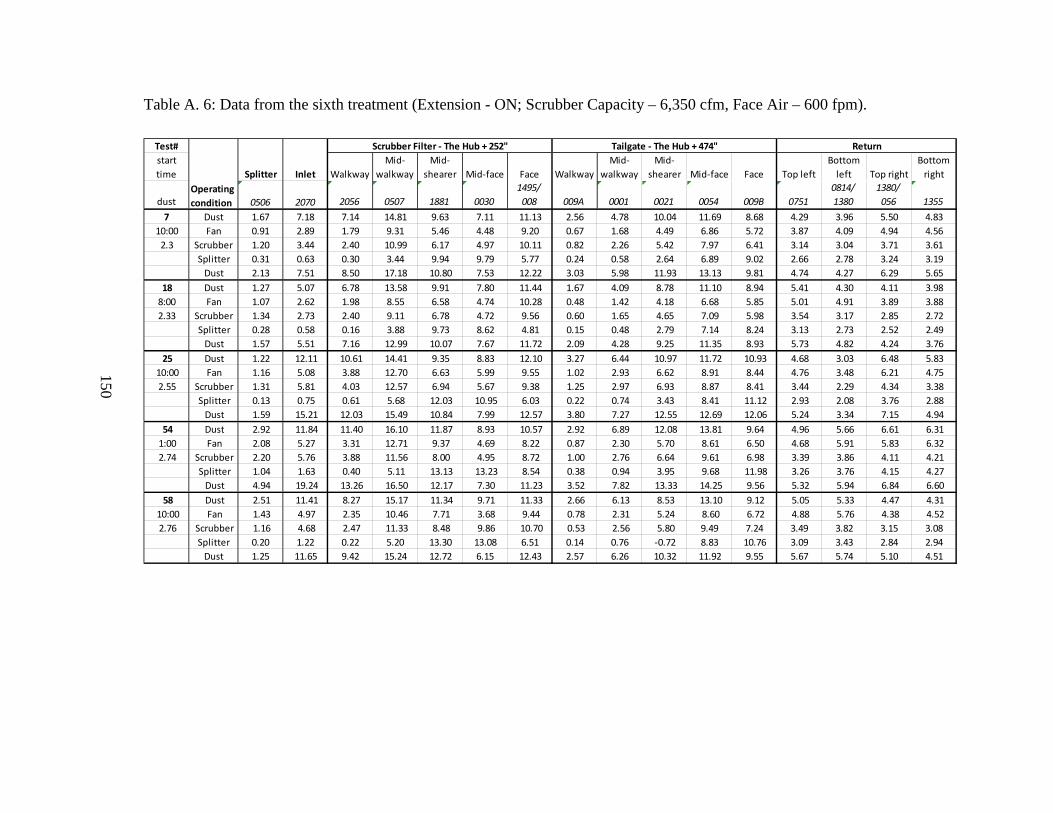
150
Table A. 6: Data from the sixth treatment (Extension - ON; Scrubber Capacity – 6,350 cfm, Face Air – 600 fpm).
Test#start time Walkway
Mid-walkway
Mid-shearer Mid-face Face Walkway
Mid-walkway
Mid-shearer Mid-face Face Top left
Bottom left Top right
Bottom right
dust 0506 2070 2056 0507 1881 00301495/
008 009A 0001 0021 0054 009B 07510814/ 1380
1380/ 056 1355
7 Dust 1.67 7.18 7.14 14.81 9.63 7.11 11.13 2.56 4.78 10.04 11.69 8.68 4.29 3.96 5.50 4.8310:00 Fan 0.91 2.89 1.79 9.31 5.46 4.48 9.20 0.67 1.68 4.49 6.86 5.72 3.87 4.09 4.94 4.56
2.3 Scrubber 1.20 3.44 2.40 10.99 6.17 4.97 10.11 0.82 2.26 5.42 7.97 6.41 3.14 3.04 3.71 3.61Splitter 0.31 0.63 0.30 3.44 9.94 9.79 5.77 0.24 0.58 2.64 6.89 9.02 2.66 2.78 3.24 3.19
Dust 2.13 7.51 8.50 17.18 10.80 7.53 12.22 3.03 5.98 11.93 13.13 9.81 4.74 4.27 6.29 5.6518 Dust 1.27 5.07 6.78 13.58 9.91 7.80 11.44 1.67 4.09 8.78 11.10 8.94 5.41 4.30 4.11 3.98
8:00 Fan 1.07 2.62 1.98 8.55 6.58 4.74 10.28 0.48 1.42 4.18 6.68 5.85 5.01 4.91 3.89 3.882.33 Scrubber 1.34 2.73 2.40 9.11 6.78 4.72 9.56 0.60 1.65 4.65 7.09 5.98 3.54 3.17 2.85 2.72
Splitter 0.28 0.58 0.16 3.88 9.73 8.62 4.81 0.15 0.48 2.79 7.14 8.24 3.13 2.73 2.52 2.49Dust 1.57 5.51 7.16 12.99 10.07 7.67 11.72 2.09 4.28 9.25 11.35 8.93 5.73 4.82 4.24 3.76
25 Dust 1.22 12.11 10.61 14.41 9.35 8.83 12.10 3.27 6.44 10.97 11.72 10.93 4.68 3.03 6.48 5.8310:00 Fan 1.16 5.08 3.88 12.70 6.63 5.99 9.55 1.02 2.93 6.62 8.91 8.44 4.76 3.48 6.21 4.752.55 Scrubber 1.31 5.81 4.03 12.57 6.94 5.67 9.38 1.25 2.97 6.93 8.87 8.41 3.44 2.29 4.34 3.38
Splitter 0.13 0.75 0.61 5.68 12.03 10.95 6.03 0.22 0.74 3.43 8.41 11.12 2.93 2.08 3.76 2.88Dust 1.59 15.21 12.03 15.49 10.84 7.99 12.57 3.80 7.27 12.55 12.69 12.06 5.24 3.34 7.15 4.94
54 Dust 2.92 11.84 11.40 16.10 11.87 8.93 10.57 2.92 6.89 12.08 13.81 9.64 4.96 5.66 6.61 6.311:00 Fan 2.08 5.27 3.31 12.71 9.37 4.69 8.22 0.87 2.30 5.70 8.61 6.50 4.68 5.91 5.83 6.322.74 Scrubber 2.20 5.76 3.88 11.56 8.00 4.95 8.72 1.00 2.76 6.64 9.61 6.98 3.39 3.86 4.11 4.21
Splitter 1.04 1.63 0.40 5.11 13.13 13.23 8.54 0.38 0.94 3.95 9.68 11.98 3.26 3.76 4.15 4.27Dust 4.94 19.24 13.26 16.50 12.17 7.30 11.23 3.52 7.82 13.33 14.25 9.56 5.32 5.94 6.84 6.60
58 Dust 2.51 11.41 8.27 15.17 11.34 9.71 11.33 2.66 6.13 8.53 13.10 9.12 5.05 5.33 4.47 4.3110:00 Fan 1.43 4.97 2.35 10.46 7.71 3.68 9.44 0.78 2.31 5.24 8.60 6.72 4.88 5.76 4.38 4.522.76 Scrubber 1.16 4.68 2.47 11.33 8.48 9.86 10.70 0.53 2.56 5.80 9.49 7.24 3.49 3.82 3.15 3.08
Splitter 0.20 1.22 0.22 5.20 13.30 13.08 6.51 0.14 0.76 -0.72 8.83 10.76 3.09 3.43 2.84 2.94Dust 1.25 11.65 9.42 15.24 12.72 6.15 12.43 2.57 6.26 10.32 11.92 9.55 5.67 5.74 5.10 4.51
Tailgate - The Hub + 474"
Operating condition
Splitter Inlet
Scrubber Filter - The Hub + 252" Return

151
Table A. 7: Data from the seventh treatment (Extension - ON; Scrubber Capacity – 13,500 cfm, Face Air – 400 fpm).
Test#start time Walkway
Mid-walkway
Mid-shearer Mid-face Face Walkway
Mid-walkway
Mid-shearer Mid-face Face Top left
Bottom left Top right
Bottom right
dust 0506 2070 2056 0507 1881 00301495/
008 009A 0001 0021 0054 009B 07510814/ 1380
1380/ 056 1355
4 Dust 23.60 42.39 18.52 26.71 21.55 12.62 9.14 8.73 14.13 18.59 23.80 19.06 7.90 7.31 6.76 4.3310:00 Fan 7.67 15.12 1.26 7.52 11.99 11.85 8.72 0.26 0.63 1.87 4.38 6.80 7.12 6.71 6.03 5.65
2.3 Scrubber 7.96 15.53 1.93 7.94 11.51 11.54 8.98 0.41 0.61 1.94 4.81 6.67 3.38 3.07 2.93 2.72Splitter 1.49 1.60 0.00 0.43 3.49 10.52 12.90 0.16 0.60 1.04 2.02 3.96 2.95 2.75 2.51 2.46
Dust 24.98 39.15 19.33 18.11 19.37 13.77 9.59 7.95 12.19 15.43 20.87 17.79 7.33 6.70 6.71 3.9028 Dust 30.16 34.84 26.80 22.40 25.05 12.42 10.69 8.43 14.81 17.76 19.01 16.39 7.14 6.83 4.19 5.98
8:00 Fan 10.71 21.64 2.85 12.70 20.59 9.28 6.78 0.56 1.20 4.06 8.16 9.94 7.37 7.66 4.91 7.87Scrubber 12.36 25.08 3.67 14.64 22.21 10.14 7.68 0.51 1.62 4.76 9.25 11.04 3.44 3.76 2.45 3.90Splitter 1.70 1.22 0.14 0.63 7.82 13.68 13.17 0.25 0.50 1.86 4.00 7.11 2.86 3.05 1.96 3.21
Dust 32.10 42.83 31.70 24.10 29.24 14.61 12.35 11.59 17.30 20.06 21.35 19.01 7.61 7.99 5.01 6.4935 Dust 32.78 55.64 24.04 20.76 21.98 15.43 15.16 7.74 9.82 18.10 19.89 18.36 10.29 7.58 4.13 6.78
10:00 Fan 11.35 24.76 1.60 8.94 14.90 12.55 10.88 0.41 0.74 2.53 5.67 8.40 8.59 6.76 4.47 8.652.79 Scrubber 12.48 29.58 2.15 11.11 16.83 13.97 11.96 0.45 0.75 3.71 6.89 10.09 4.52 3.49 2.27 4.47
Splitter 1.94 1.99 0.14 0.78 5.14 9.85 15.36 -0.25 0.47 1.26 2.57 5.31 3.53 2.73 1.78 3.52Dust 37.30 56.31 23.85 21.61 23.01 15.77 15.69 8.62 10.07 na 20.60 19.42 10.36 7.13 4.45 6.96
44 Dust 26.12 41.73 24.51 18.80 19.55 13.06 9.53 6.70 12.57 17.39 16.40 15.22 9.87 8.07 5.41 5.328:35 Fan 10.06 19.71 1.76 9.12 32.11 12.26 10.07 0.20 0.91 2.64 5.00 8.81 7.98 8.03 4.78 7.302.43 Scrubber 9.59 19.00 2.10 9.09 17.25 11.42 9.82 0.47 0.82 2.65 4.84 8.65 3.79 3.77 2.27 3.11
Splitter 1.35 1.33 0.01 0.31 4.64 10.59 15.02 0.07 0.74 0.90 2.02 4.90 3.36 3.25 2.08 2.77Dust 28.61 46.61 26.84 19.05 25.06 14.67 11.34 7.38 12.68 17.34 17.27 17.42 8.53 8.43 5.58 5.67
48 Dust 22.35 34.96 18.66 18.41 17.93 10.50 8.75 6.23 11.02 17.16 17.57 13.25 6.49 6.22 5.26 6.3710:00 Fan 8.93 14.26 1.89 8.79 14.95 11.23 7.26 0.46 1.26 3.84 6.96 8.77 7.78 6.77 5.56 6.412.54 Scrubber 8.74 13.92 1.98 11.05 14.99 9.82 7.34 0.42 1.21 4.28 8.07 9.49 4.05 3.75 3.01 3.34
Splitter 1.65 1.59 0.17 0.86 5.66 13.03 14.00 0.22 0.53 1.87 3.78 6.68 3.33 2.97 2.45 2.60Dust 27.15 41.07 21.96 20.63 19.33 11.95 10.84 7.05 13.12 18.44 20.91 15.92 7.59 7.41 6.18 7.04
Operating condition
Splitter Inlet
Scrubber Filter - The Hub + 252" Tailgate - The Hub + 474" Return
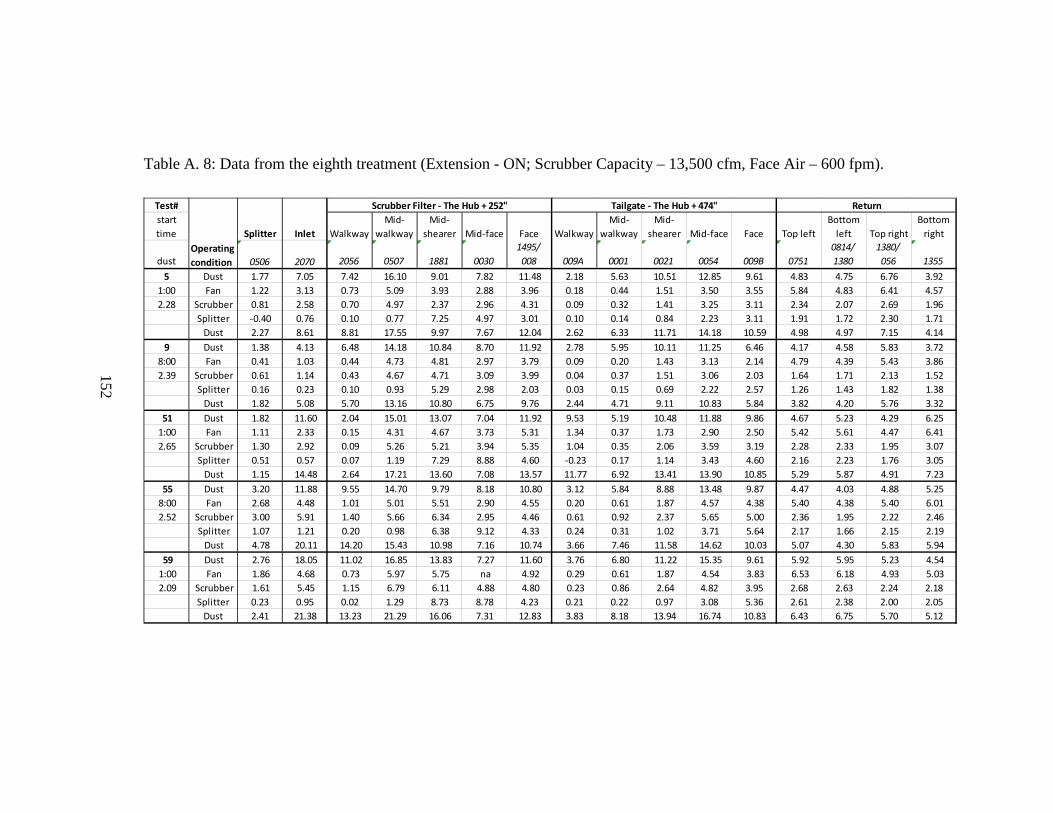
152
Table A. 8: Data from the eighth treatment (Extension - ON; Scrubber Capacity – 13,500 cfm, Face Air – 600 fpm).
Test#start time Walkway
Mid-walkway
Mid-shearer Mid-face Face Walkway
Mid-walkway
Mid-shearer Mid-face Face Top left
Bottom left Top right
Bottom right
dust 0506 2070 2056 0507 1881 00301495/
008 009A 0001 0021 0054 009B 07510814/ 1380
1380/ 056 1355
5 Dust 1.77 7.05 7.42 16.10 9.01 7.82 11.48 2.18 5.63 10.51 12.85 9.61 4.83 4.75 6.76 3.921:00 Fan 1.22 3.13 0.73 5.09 3.93 2.88 3.96 0.18 0.44 1.51 3.50 3.55 5.84 4.83 6.41 4.572.28 Scrubber 0.81 2.58 0.70 4.97 2.37 2.96 4.31 0.09 0.32 1.41 3.25 3.11 2.34 2.07 2.69 1.96
Splitter -0.40 0.76 0.10 0.77 7.25 4.97 3.01 0.10 0.14 0.84 2.23 3.11 1.91 1.72 2.30 1.71Dust 2.27 8.61 8.81 17.55 9.97 7.67 12.04 2.62 6.33 11.71 14.18 10.59 4.98 4.97 7.15 4.14
9 Dust 1.38 4.13 6.48 14.18 10.84 8.70 11.92 2.78 5.95 10.11 11.25 6.46 4.17 4.58 5.83 3.728:00 Fan 0.41 1.03 0.44 4.73 4.81 2.97 3.79 0.09 0.20 1.43 3.13 2.14 4.79 4.39 5.43 3.862.39 Scrubber 0.61 1.14 0.43 4.67 4.71 3.09 3.99 0.04 0.37 1.51 3.06 2.03 1.64 1.71 2.13 1.52
Splitter 0.16 0.23 0.10 0.93 5.29 2.98 2.03 0.03 0.15 0.69 2.22 2.57 1.26 1.43 1.82 1.38Dust 1.82 5.08 5.70 13.16 10.80 6.75 9.76 2.44 4.71 9.11 10.83 5.84 3.82 4.20 5.76 3.32
51 Dust 1.82 11.60 2.04 15.01 13.07 7.04 11.92 9.53 5.19 10.48 11.88 9.86 4.67 5.23 4.29 6.251:00 Fan 1.11 2.33 0.15 4.31 4.67 3.73 5.31 1.34 0.37 1.73 2.90 2.50 5.42 5.61 4.47 6.412.65 Scrubber 1.30 2.92 0.09 5.26 5.21 3.94 5.35 1.04 0.35 2.06 3.59 3.19 2.28 2.33 1.95 3.07
Splitter 0.51 0.57 0.07 1.19 7.29 8.88 4.60 -0.23 0.17 1.14 3.43 4.60 2.16 2.23 1.76 3.05Dust 1.15 14.48 2.64 17.21 13.60 7.08 13.57 11.77 6.92 13.41 13.90 10.85 5.29 5.87 4.91 7.23
55 Dust 3.20 11.88 9.55 14.70 9.79 8.18 10.80 3.12 5.84 8.88 13.48 9.87 4.47 4.03 4.88 5.258:00 Fan 2.68 4.48 1.01 5.01 5.51 2.90 4.55 0.20 0.61 1.87 4.57 4.38 5.40 4.38 5.40 6.012.52 Scrubber 3.00 5.91 1.40 5.66 6.34 2.95 4.46 0.61 0.92 2.37 5.65 5.00 2.36 1.95 2.22 2.46
Splitter 1.07 1.21 0.20 0.98 6.38 9.12 4.33 0.24 0.31 1.02 3.71 5.64 2.17 1.66 2.15 2.19Dust 4.78 20.11 14.20 15.43 10.98 7.16 10.74 3.66 7.46 11.58 14.62 10.03 5.07 4.30 5.83 5.94
59 Dust 2.76 18.05 11.02 16.85 13.83 7.27 11.60 3.76 6.80 11.22 15.35 9.61 5.92 5.95 5.23 4.541:00 Fan 1.86 4.68 0.73 5.97 5.75 na 4.92 0.29 0.61 1.87 4.54 3.83 6.53 6.18 4.93 5.032.09 Scrubber 1.61 5.45 1.15 6.79 6.11 4.88 4.80 0.23 0.86 2.64 4.82 3.95 2.68 2.63 2.24 2.18
Splitter 0.23 0.95 0.02 1.29 8.73 8.78 4.23 0.21 0.22 0.97 3.08 5.36 2.61 2.38 2.00 2.05Dust 2.41 21.38 13.23 21.29 16.06 7.31 12.83 3.83 8.18 13.94 16.74 10.83 6.43 6.75 5.70 5.12
Tailgate - The Hub + 474" Return
Operating condition
Splitter Inlet
Scrubber Filter - The Hub + 252"
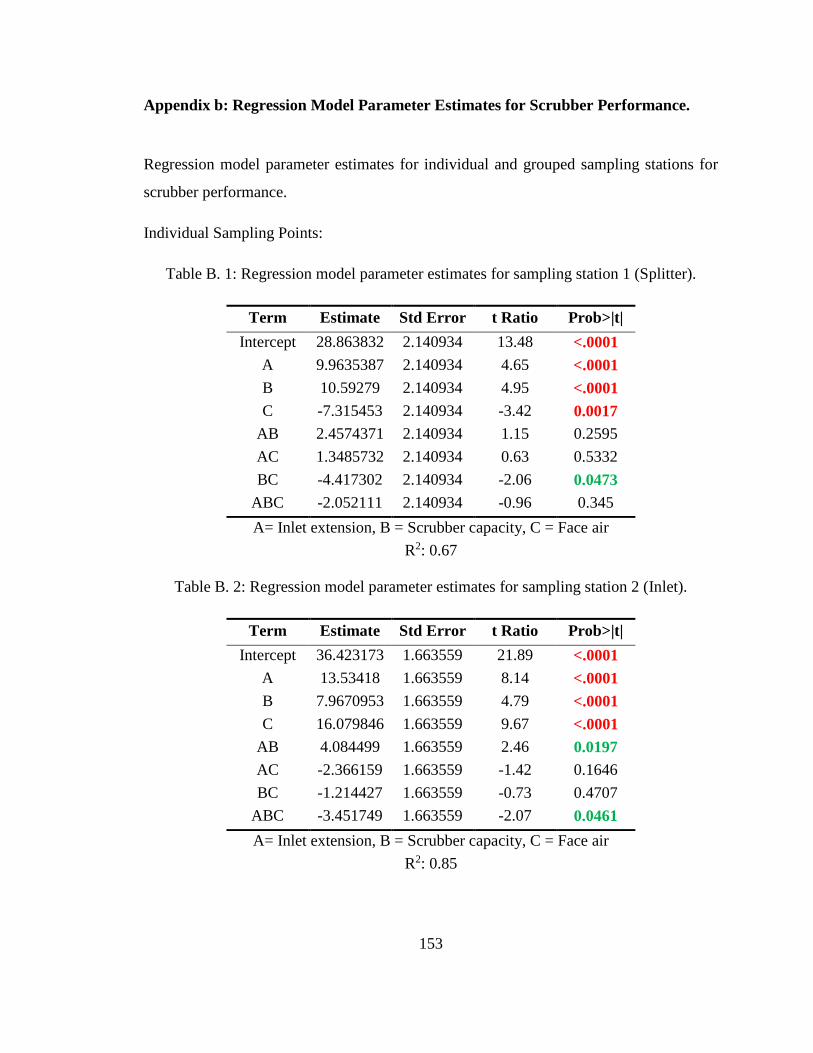
153
Appendix b: Regression Model Parameter Estimates for Scrubber Performance.
Regression model parameter estimates for individual and grouped sampling stations for
scrubber performance.
Individual Sampling Points:
Table B. 1: Regression model parameter estimates for sampling station 1 (Splitter).
Term Estimate Std Error t Ratio Prob>|t| Intercept 28.863832 2.140934 13.48 <.0001
A 9.9635387 2.140934 4.65 <.0001 B 10.59279 2.140934 4.95 <.0001 C -7.315453 2.140934 -3.42 0.0017
AB 2.4574371 2.140934 1.15 0.2595 AC 1.3485732 2.140934 0.63 0.5332 BC -4.417302 2.140934 -2.06 0.0473
ABC -2.052111 2.140934 -0.96 0.345 A= Inlet extension, B = Scrubber capacity, C = Face air
R2: 0.67
Table B. 2: Regression model parameter estimates for sampling station 2 (Inlet).
Term Estimate Std Error t Ratio Prob>|t| Intercept 36.423173 1.663559 21.89 <.0001
A 13.53418 1.663559 8.14 <.0001 B 7.9670953 1.663559 4.79 <.0001 C 16.079846 1.663559 9.67 <.0001
AB 4.084499 1.663559 2.46 0.0197 AC -2.366159 1.663559 -1.42 0.1646 BC -1.214427 1.663559 -0.73 0.4707
ABC -3.451749 1.663559 -2.07 0.0461 A= Inlet extension, B = Scrubber capacity, C = Face air
R2: 0.85
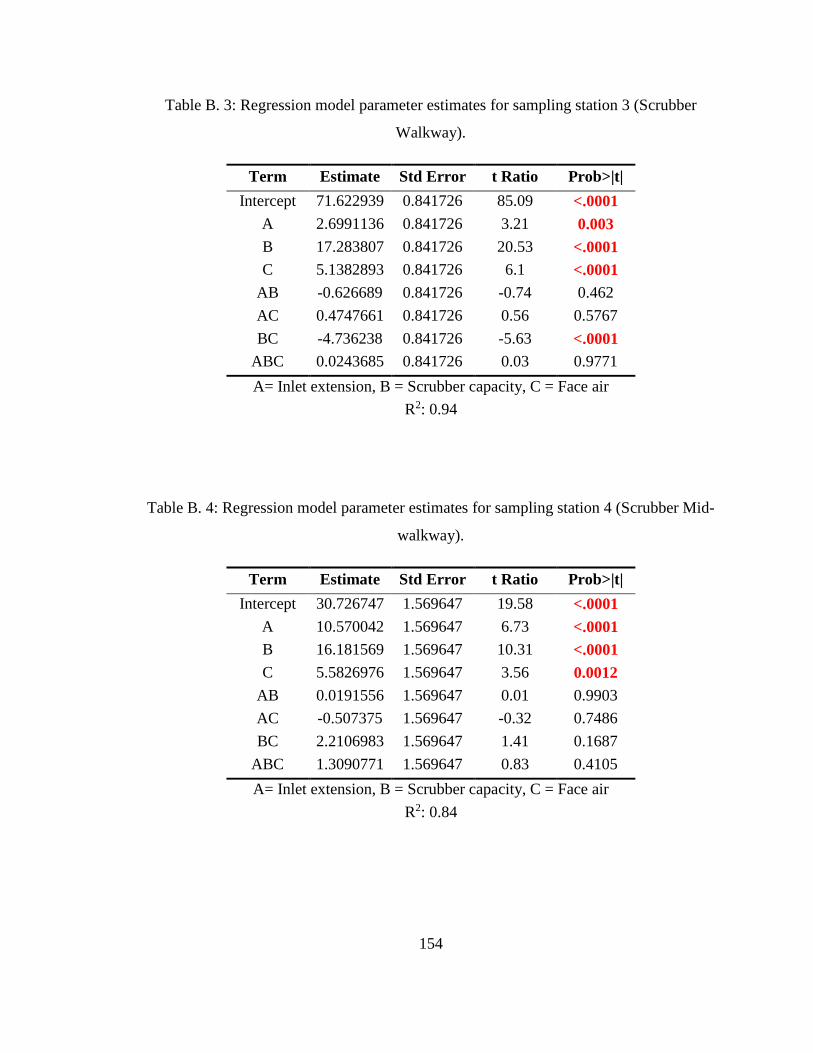
154
Table B. 3: Regression model parameter estimates for sampling station 3 (Scrubber
Walkway).
Term Estimate Std Error t Ratio Prob>|t| Intercept 71.622939 0.841726 85.09 <.0001
A 2.6991136 0.841726 3.21 0.003 B 17.283807 0.841726 20.53 <.0001 C 5.1382893 0.841726 6.1 <.0001
AB -0.626689 0.841726 -0.74 0.462 AC 0.4747661 0.841726 0.56 0.5767 BC -4.736238 0.841726 -5.63 <.0001
ABC 0.0243685 0.841726 0.03 0.9771 A= Inlet extension, B = Scrubber capacity, C = Face air
R2: 0.94
Table B. 4: Regression model parameter estimates for sampling station 4 (Scrubber Mid-
walkway).
Term Estimate Std Error t Ratio Prob>|t| Intercept 30.726747 1.569647 19.58 <.0001
A 10.570042 1.569647 6.73 <.0001 B 16.181569 1.569647 10.31 <.0001 C 5.5826976 1.569647 3.56 0.0012
AB 0.0191556 1.569647 0.01 0.9903 AC -0.507375 1.569647 -0.32 0.7486 BC 2.2106983 1.569647 1.41 0.1687
ABC 1.3090771 1.569647 0.83 0.4105 A= Inlet extension, B = Scrubber capacity, C = Face air
R2: 0.84
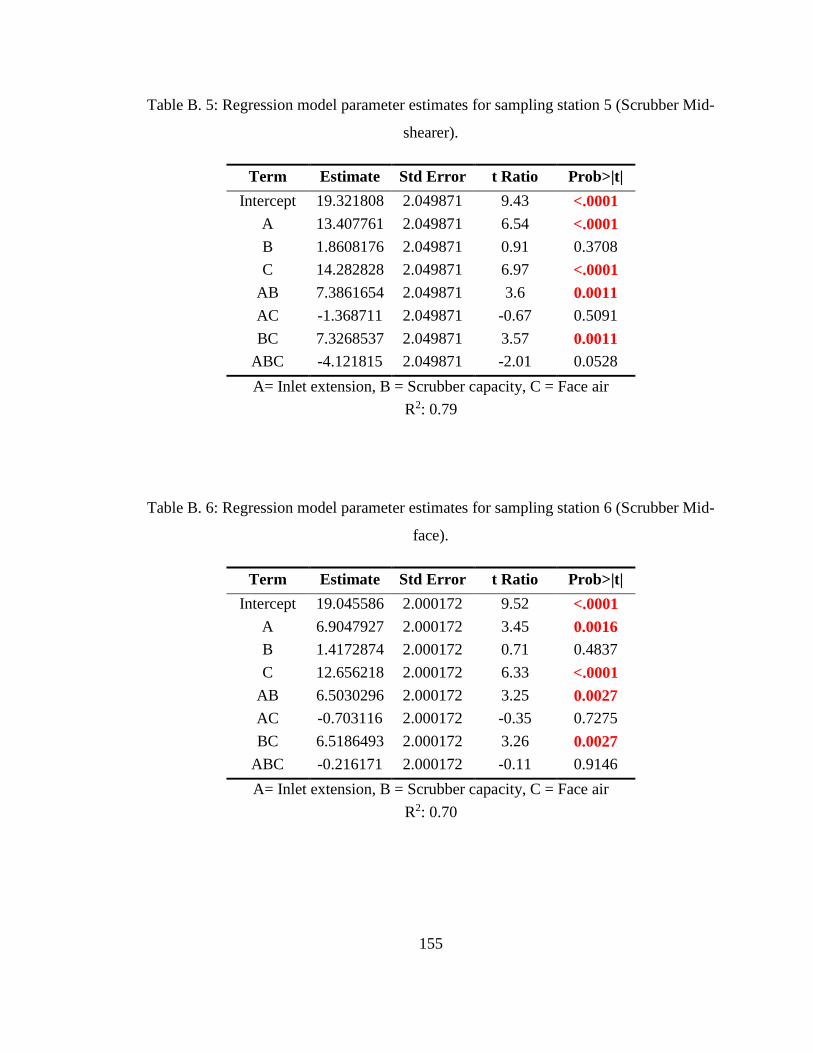
155
Table B. 5: Regression model parameter estimates for sampling station 5 (Scrubber Mid-
shearer).
Term Estimate Std Error t Ratio Prob>|t| Intercept 19.321808 2.049871 9.43 <.0001
A 13.407761 2.049871 6.54 <.0001 B 1.8608176 2.049871 0.91 0.3708 C 14.282828 2.049871 6.97 <.0001
AB 7.3861654 2.049871 3.6 0.0011 AC -1.368711 2.049871 -0.67 0.5091 BC 7.3268537 2.049871 3.57 0.0011
ABC -4.121815 2.049871 -2.01 0.0528 A= Inlet extension, B = Scrubber capacity, C = Face air
R2: 0.79
Table B. 6: Regression model parameter estimates for sampling station 6 (Scrubber Mid-
face).
Term Estimate Std Error t Ratio Prob>|t| Intercept 19.045586 2.000172 9.52 <.0001
A 6.9047927 2.000172 3.45 0.0016 B 1.4172874 2.000172 0.71 0.4837 C 12.656218 2.000172 6.33 <.0001
AB 6.5030296 2.000172 3.25 0.0027 AC -0.703116 2.000172 -0.35 0.7275 BC 6.5186493 2.000172 3.26 0.0027
ABC -0.216171 2.000172 -0.11 0.9146 A= Inlet extension, B = Scrubber capacity, C = Face air
R2: 0.70

156
Table B. 7: Regression model parameter estimates for sampling station 7 (Scrubber
Face).
Term Estimate Std Error t Ratio Prob>|t| Intercept 23.434112 1.280806 18.3 <.0001
A 4.5909924 1.280806 3.58 0.0011 B 5.3666192 1.280806 4.19 0.0002 C 14.475406 1.280806 11.3 <.0001
AB 6.0911116 1.280806 4.76 <.0001 AC -3.624665 1.280806 -2.83 0.008 BC 13.310512 1.280806 10.39 <.0001
ABC -2.84787 1.280806 -2.22 0.0334 A= Inlet extension, B = Scrubber capacity, C = Face air
R2: 0.90
Table B. 8: Regression model parameter estimates for sampling station 8 (Tailgate
Walkway).
Term Estimate Std Error t Ratio Prob>|t| Intercept 77.449979 0.666739 116.16 <.0001
A 2.5085683 0.666739 3.76 0.0007 B 15.025514 0.666739 22.54 <.0001 C 0.4848695 0.666739 0.73 0.4724
AB -1.750247 0.666739 -2.63 0.0132 AC 0.8699438 0.666739 1.3 0.2013 BC -1.180612 0.666739 -1.77 0.0861
ABC -1.23297 0.666739 -1.85 0.0737 A= Inlet extension, B = Scrubber capacity, C = Face air
R2: 0.94
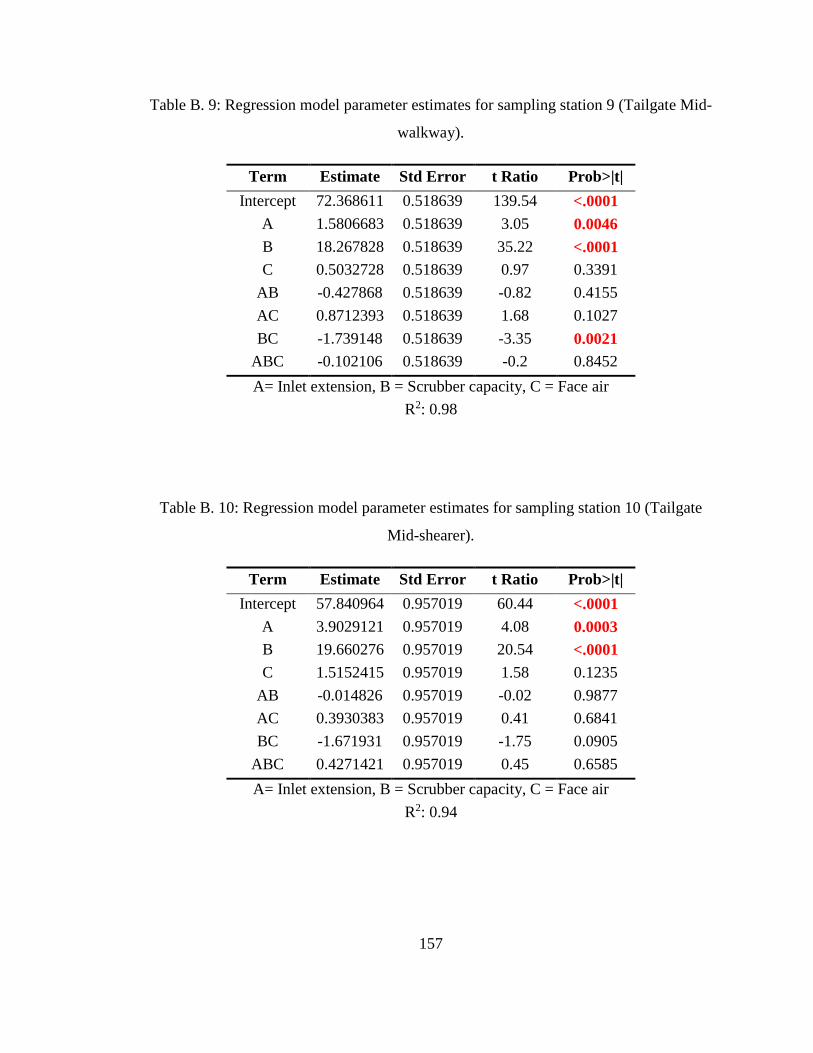
157
Table B. 9: Regression model parameter estimates for sampling station 9 (Tailgate Mid-
walkway).
Term Estimate Std Error t Ratio Prob>|t| Intercept 72.368611 0.518639 139.54 <.0001
A 1.5806683 0.518639 3.05 0.0046 B 18.267828 0.518639 35.22 <.0001 C 0.5032728 0.518639 0.97 0.3391
AB -0.427868 0.518639 -0.82 0.4155 AC 0.8712393 0.518639 1.68 0.1027 BC -1.739148 0.518639 -3.35 0.0021
ABC -0.102106 0.518639 -0.2 0.8452 A= Inlet extension, B = Scrubber capacity, C = Face air
R2: 0.98
Table B. 10: Regression model parameter estimates for sampling station 10 (Tailgate
Mid-shearer).
Term Estimate Std Error t Ratio Prob>|t| Intercept 57.840964 0.957019 60.44 <.0001
A 3.9029121 0.957019 4.08 0.0003 B 19.660276 0.957019 20.54 <.0001 C 1.5152415 0.957019 1.58 0.1235
AB -0.014826 0.957019 -0.02 0.9877 AC 0.3930383 0.957019 0.41 0.6841 BC -1.671931 0.957019 -1.75 0.0905
ABC 0.4271421 0.957019 0.45 0.6585 A= Inlet extension, B = Scrubber capacity, C = Face air
R2: 0.94
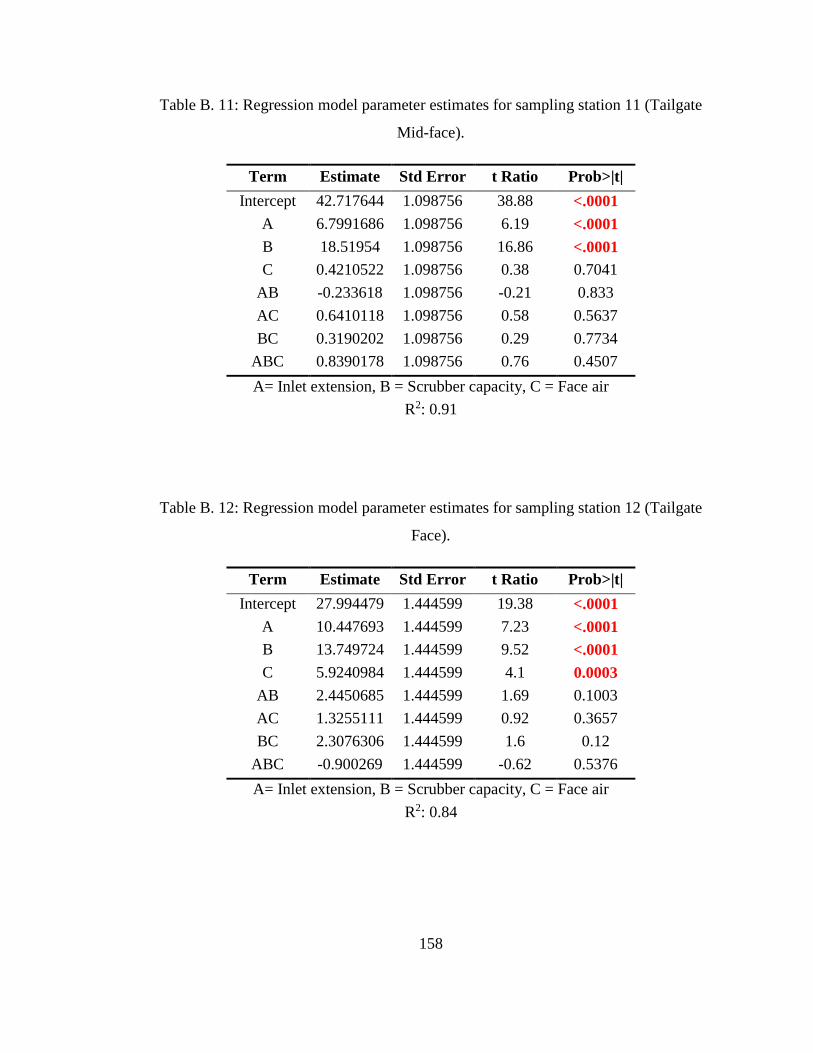
158
Table B. 11: Regression model parameter estimates for sampling station 11 (Tailgate
Mid-face).
Term Estimate Std Error t Ratio Prob>|t| Intercept 42.717644 1.098756 38.88 <.0001
A 6.7991686 1.098756 6.19 <.0001 B 18.51954 1.098756 16.86 <.0001 C 0.4210522 1.098756 0.38 0.7041
AB -0.233618 1.098756 -0.21 0.833 AC 0.6410118 1.098756 0.58 0.5637 BC 0.3190202 1.098756 0.29 0.7734
ABC 0.8390178 1.098756 0.76 0.4507 A= Inlet extension, B = Scrubber capacity, C = Face air
R2: 0.91
Table B. 12: Regression model parameter estimates for sampling station 12 (Tailgate
Face).
Term Estimate Std Error t Ratio Prob>|t| Intercept 27.994479 1.444599 19.38 <.0001
A 10.447693 1.444599 7.23 <.0001 B 13.749724 1.444599 9.52 <.0001 C 5.9240984 1.444599 4.1 0.0003
AB 2.4450685 1.444599 1.69 0.1003 AC 1.3255111 1.444599 0.92 0.3657 BC 2.3076306 1.444599 1.6 0.12
ABC -0.900269 1.444599 -0.62 0.5376 A= Inlet extension, B = Scrubber capacity, C = Face air
R2: 0.84
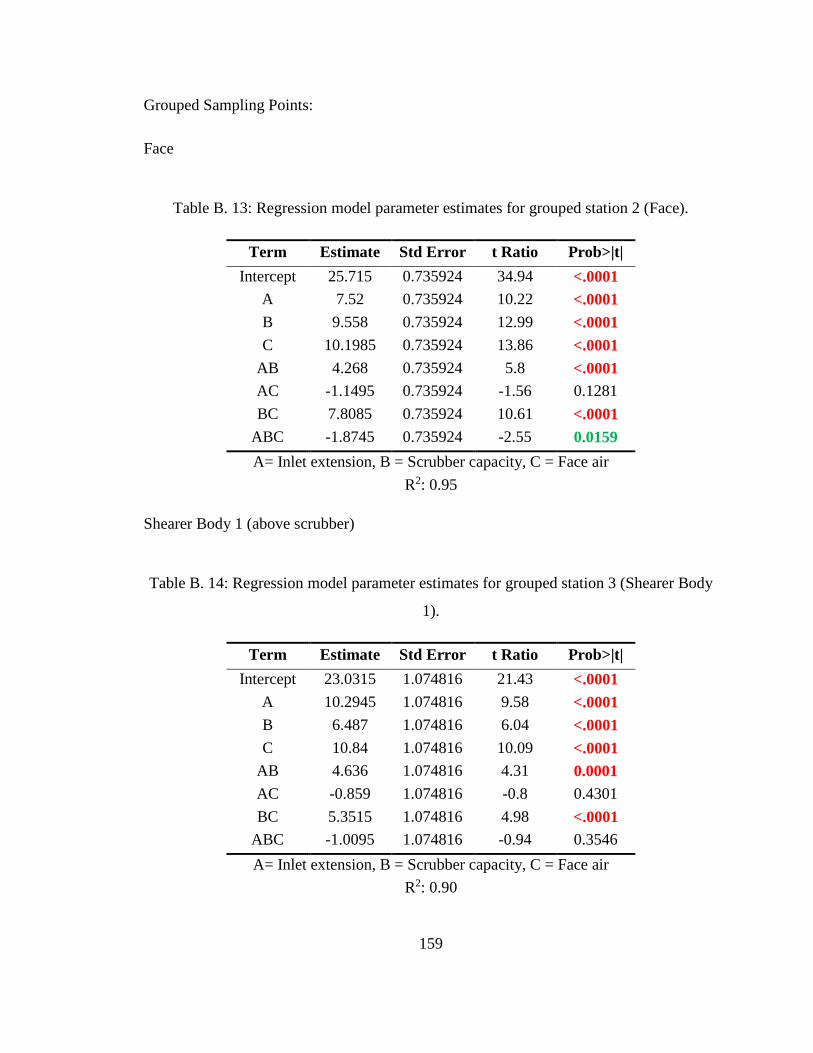
159
Grouped Sampling Points:
Face
Table B. 13: Regression model parameter estimates for grouped station 2 (Face).
Term Estimate Std Error t Ratio Prob>|t| Intercept 25.715 0.735924 34.94 <.0001
A 7.52 0.735924 10.22 <.0001 B 9.558 0.735924 12.99 <.0001 C 10.1985 0.735924 13.86 <.0001
AB 4.268 0.735924 5.8 <.0001 AC -1.1495 0.735924 -1.56 0.1281 BC 7.8085 0.735924 10.61 <.0001
ABC -1.8745 0.735924 -2.55 0.0159 A= Inlet extension, B = Scrubber capacity, C = Face air
R2: 0.95
Shearer Body 1 (above scrubber)
Table B. 14: Regression model parameter estimates for grouped station 3 (Shearer Body
1).
Term Estimate Std Error t Ratio Prob>|t| Intercept 23.0315 1.074816 21.43 <.0001
A 10.2945 1.074816 9.58 <.0001 B 6.487 1.074816 6.04 <.0001 C 10.84 1.074816 10.09 <.0001
AB 4.636 1.074816 4.31 0.0001 AC -0.859 1.074816 -0.8 0.4301 BC 5.3515 1.074816 4.98 <.0001
ABC -1.0095 1.074816 -0.94 0.3546 A= Inlet extension, B = Scrubber capacity, C = Face air
R2: 0.90

160
Shearer Body 2 (above fan)
Table B. 15: Regression model parameter estimates for grouped station 4 (Shearer Body
2).
Term Estimate Std Error t Ratio Prob>|t| Intercept 57.66725 0.8082 71.35 <.0001
A 4.11875 0.8082 5.1 <.0001 B 18.79125 0.8082 23.25 <.0001 C 0.78925 0.8082 0.98 0.3364
AB -0.24925 0.8082 -0.31 0.7598 AC 0.61075 0.8082 0.76 0.4555 BC -1.00675 0.8082 -1.25 0.2222
ABC 0.41275 0.8082 0.51 0.6132 A= Inlet extension, B = Scrubber capacity, C = Face air
R2: 0.95

161
Appendix c: Regression Model Parameter Estimates for Combined Scrubber and
Splitter Sprays Performance.
Regression model parameter estimates for individual and grouped sampling stations for
combined scrubber and splitter sprays performance.
Individual Sampling Points:
Table C. 1: Regression model parameter estimates for sampling station 1 (Splitter).
Term Estimate Std Error t Ratio Prob>|t| Intercept 83.204363 1.804948 46.1 <.0001
A 3.8459073 1.804948 2.13 0.0409 B 3.2947396 1.804948 1.83 0.0773 C -6.591636 1.804948 -3.65 0.0009
AB 0.7158286 1.804948 0.4 0.6943 AC 5.2146517 1.804948 2.89 0.0069 BC 0.2033144 1.804948 0.11 0.911
ABC -2.013379 1.804948 -1.12 0.273 A= Inlet extension, B = Scrubber capacity, C = Face air
R2: 0.49
Table C. 2: Regression model parameter estimates for sampling station 2 (Inlet).
Term Estimate Std Error t Ratio Prob>|t| Intercept 91.594523 0.982344 93.24 <.0001
A -0.386129 0.982344 -0.39 0.6969 B 1.7292565 0.982344 1.76 0.0879 C 0.0433087 0.982344 0.04 0.9651
AB 2.1298338 0.982344 2.17 0.0377 AC 0.9777801 0.982344 1 0.327 BC -2.458551 0.982344 -2.5 0.0176
ABC 0.0689548 0.982344 0.07 0.9445 A= Inlet extension, B = Scrubber capacity, C = Face air
R2: 0.32
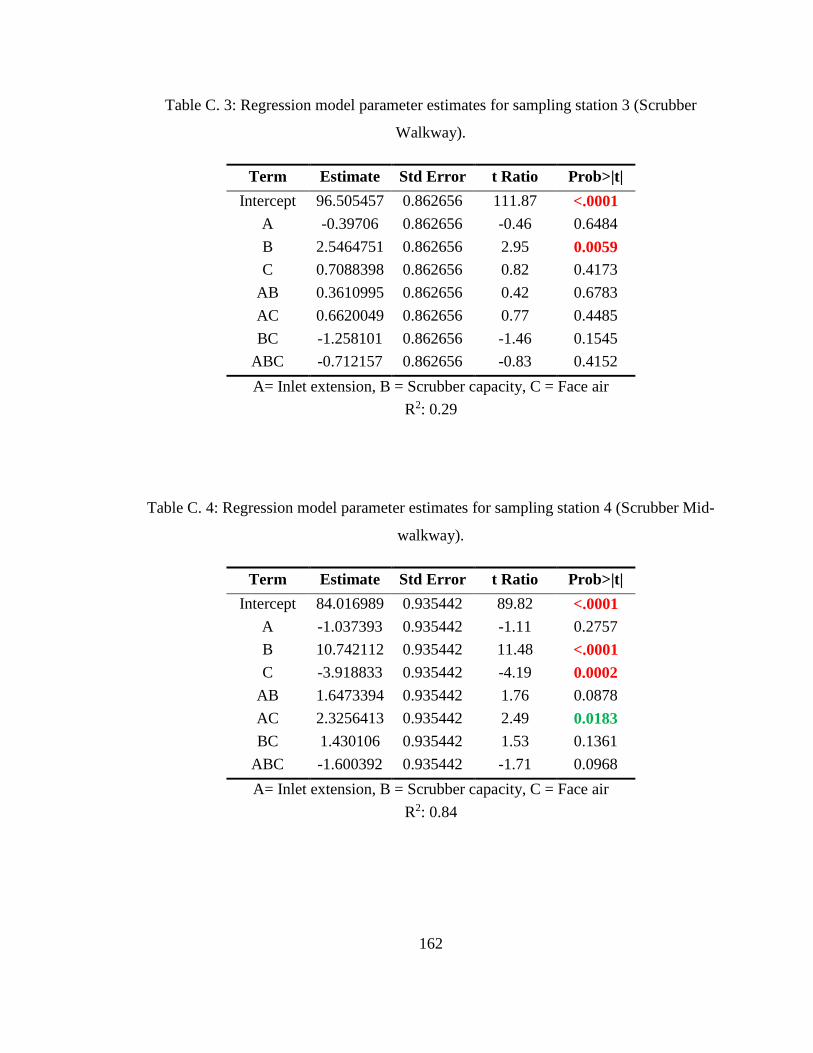
162
Table C. 3: Regression model parameter estimates for sampling station 3 (Scrubber
Walkway).
Term Estimate Std Error t Ratio Prob>|t| Intercept 96.505457 0.862656 111.87 <.0001
A -0.39706 0.862656 -0.46 0.6484 B 2.5464751 0.862656 2.95 0.0059 C 0.7088398 0.862656 0.82 0.4173
AB 0.3610995 0.862656 0.42 0.6783 AC 0.6620049 0.862656 0.77 0.4485 BC -1.258101 0.862656 -1.46 0.1545
ABC -0.712157 0.862656 -0.83 0.4152 A= Inlet extension, B = Scrubber capacity, C = Face air
R2: 0.29
Table C. 4: Regression model parameter estimates for sampling station 4 (Scrubber Mid-
walkway).
Term Estimate Std Error t Ratio Prob>|t| Intercept 84.016989 0.935442 89.82 <.0001
A -1.037393 0.935442 -1.11 0.2757 B 10.742112 0.935442 11.48 <.0001 C -3.918833 0.935442 -4.19 0.0002
AB 1.6473394 0.935442 1.76 0.0878 AC 2.3256413 0.935442 2.49 0.0183 BC 1.430106 0.935442 1.53 0.1361
ABC -1.600392 0.935442 -1.71 0.0968 A= Inlet extension, B = Scrubber capacity, C = Face air
R2: 0.84

163
Table C. 5: Regression model parameter estimates for sampling station 5 (Scrubber Mid-
shearer).
Term Estimate Std Error t Ratio Prob>|t| Intercept 34.777144 2.370371 14.67 <.0001
A -1.967962 2.370371 -0.83 0.4126 B 21.769046 2.370371 9.18 <.0001 C -15.49588 2.370371 -6.54 <.0001
AB 3.4392751 2.370371 1.45 0.1565 AC -0.67637 2.370371 -0.29 0.7772 BC -1.35861 2.370371 -0.57 0.5705
ABC -0.475305 2.370371 -0.2 0.8423 A= Inlet extension, B = Scrubber capacity, C = Face air
R2: 0.80
Table C. 6: Regression model parameter estimates for sampling station 6 (Scrubber Mid-
face).
Term Estimate Std Error t Ratio Prob>|t| Intercept -36.63072 4.430168 -8.27 <.0001
A 18.843395 4.430168 4.25 0.0002 B 24.30916 4.430168 5.49 <.0001 C -26.06353 4.430168 -5.88 <.0001
AB 3.0463892 4.430168 0.69 0.4966 AC 26.736172 4.430168 6.04 <.0001 BC -2.653837 4.430168 -0.6 0.5534
ABC -1.141809 4.430168 -0.26 0.7983 A= Inlet extension, B = Scrubber capacity, C = Face air
R2: 0.79
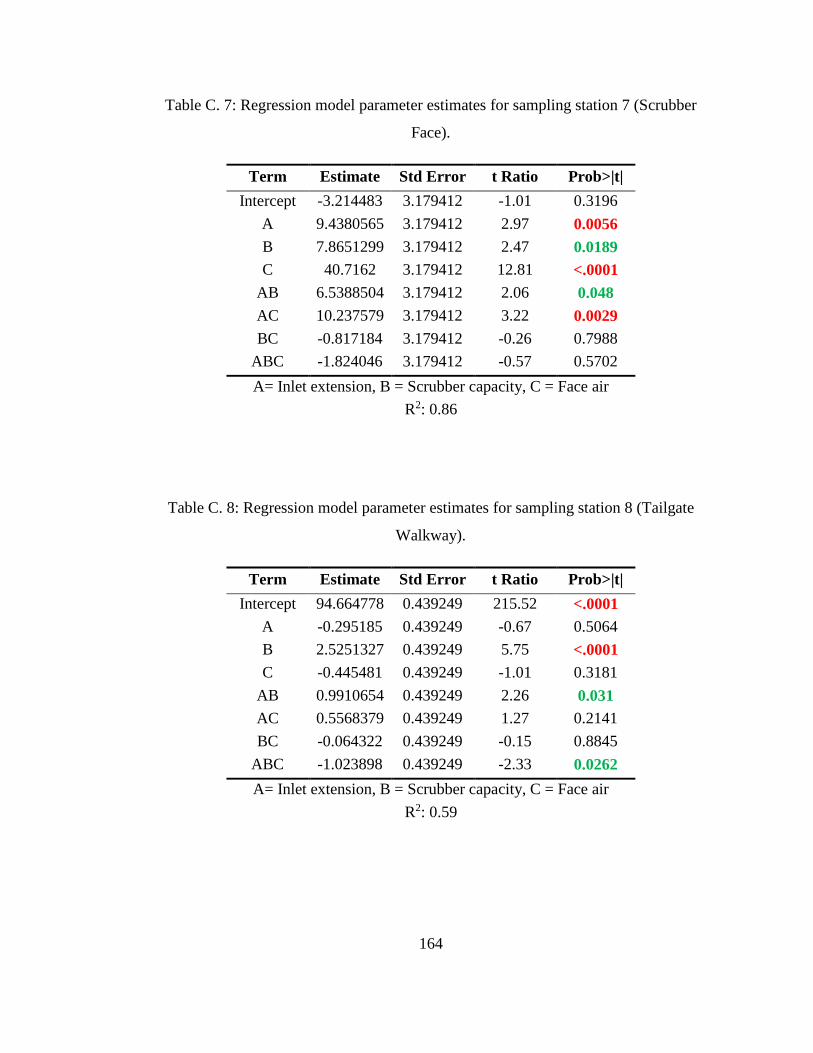
164
Table C. 7: Regression model parameter estimates for sampling station 7 (Scrubber
Face).
Term Estimate Std Error t Ratio Prob>|t| Intercept -3.214483 3.179412 -1.01 0.3196
A 9.4380565 3.179412 2.97 0.0056 B 7.8651299 3.179412 2.47 0.0189 C 40.7162 3.179412 12.81 <.0001
AB 6.5388504 3.179412 2.06 0.048 AC 10.237579 3.179412 3.22 0.0029 BC -0.817184 3.179412 -0.26 0.7988
ABC -1.824046 3.179412 -0.57 0.5702 A= Inlet extension, B = Scrubber capacity, C = Face air
R2: 0.86
Table C. 8: Regression model parameter estimates for sampling station 8 (Tailgate
Walkway).
Term Estimate Std Error t Ratio Prob>|t| Intercept 94.664778 0.439249 215.52 <.0001
A -0.295185 0.439249 -0.67 0.5064 B 2.5251327 0.439249 5.75 <.0001 C -0.445481 0.439249 -1.01 0.3181
AB 0.9910654 0.439249 2.26 0.031 AC 0.5568379 0.439249 1.27 0.2141 BC -0.064322 0.439249 -0.15 0.8845
ABC -1.023898 0.439249 -2.33 0.0262 A= Inlet extension, B = Scrubber capacity, C = Face air
R2: 0.59

165
Table C. 9: Regression model parameter estimates for sampling station 9 (Tailgate Mid-
walkway).
Term Estimate Std Error t Ratio Prob>|t| Intercept 92.155334 0.341296 270.02 <.0001
A -0.782803 0.341296 -2.29 0.0285 B 4.2960811 0.341296 12.59 <.0001 C -0.124233 0.341296 -0.36 0.7182
AB 0.4939952 0.341296 1.45 0.1575 AC 1.382116 0.341296 4.05 0.0003 BC 0.3438942 0.341296 1.01 0.3212
ABC -0.88723 0.341296 -2.6 0.014 A= Inlet extension, B = Scrubber capacity, C = Face air
R2: 0.86
Table C. 10: Regression model parameter estimates for sampling station 10 (Tailgate
Mid-shearer).
Term Estimate Std Error t Ratio Prob>|t| Intercept 83.22982 1.10749 75.15 <.0001
A 0.5114822 1.10749 0.46 0.6473 B 8.1539141 1.10749 7.36 <.0001 C -1.760018 1.10749 -1.59 0.1218
AB 0.0405252 1.10749 0.04 0.971 AC 3.0695178 1.10749 2.77 0.0092 BC 0.7364649 1.10749 0.66 0.5108
ABC -2.381617 1.10749 -2.15 0.0392 A= Inlet extension, B = Scrubber capacity, C = Face air
R2: 0.69

166
Table C. 11: Regression model parameter estimates for sampling station 11 (Tailgate
Mid-face).
Term Estimate Std Error t Ratio Prob>|t| Intercept 61.81564 1.174999 52.61 <.0001
A 0.4403453 1.174999 0.37 0.7103 B 18.26873 1.174999 15.55 <.0001 C -8.730708 1.174999 -7.43 <.0001
AB 1.2716118 1.174999 1.08 0.2872 AC 2.8413633 1.174999 2.42 0.0215 BC 3.879921 1.174999 3.3 0.0024
ABC -1.543595 1.174999 -1.31 0.1983 A= Inlet extension, B = Scrubber capacity, C = Face air
R2: 0.91
Table C. 12: Regression model parameter estimates for sampling station 12 (Tailgate
Face).
Term Estimate Std Error t Ratio Prob>|t| Intercept 22.121825 2.332008 9.49 <.0001
A 9.5155458 2.332008 4.08 0.0003 B 25.322434 2.332008 10.86 <.0001 C -13.4484 2.332008 -5.77 <.0001
AB 3.8719821 2.332008 1.66 0.1066 AC 6.5534852 2.332008 2.81 0.0084 BC 2.9302217 2.332008 1.26 0.218
ABC -2.081801 2.332008 -0.89 0.3787 A= Inlet extension, B = Scrubber capacity, C = Face air
R2: 0.85

167
Grouped Sampling Points:
Face
Table C. 13: Regression model parameter estimates for grouped station 2 (Face).
Term Estimate Std Error t Ratio Prob>|t| Intercept 9.4535 2.006072 4.71 <.0001
A 9.4765 2.006072 4.72 <.0001 B 16.594 2.006072 8.27 <.0001 C 13.634 2.006072 6.8 <.0001
AB 5.205 2.006072 2.59 0.0142 AC 8.395 2.006072 4.18 0.0002 BC 1.0565 2.006072 0.53 0.6021
ABC -1.9525 2.006072 -0.97 0.3377 A= Inlet extension, B = Scrubber capacity, C = Face air
R2: 0.84
Body 1
Table C. 14: Regression model parameter estimates for grouped station 3 (Shearer Body
1).
Term Estimate Std Error t Ratio Prob>|t| Intercept 27.38775 1.994445 13.73 <.0001
A 5.27975 1.994445 2.65 0.0125 B 18.94075 1.994445 9.5 <.0001 C -15.15975 1.994445 -7.6 <.0001
AB 2.70975 1.994445 1.36 0.1838 AC 9.46125 1.994445 4.74 <.0001 BC -0.86075 1.994445 -0.43 0.6689
ABC -1.07275 1.994445 -0.54 0.5944 A= Inlet extension, B = Scrubber capacity, C = Face air
R2: 0.85

168
Body 2
Table C. 15: Regression model parameter estimates for grouped station 4 (Shearer Body
2).
Term Estimate Std Error t Ratio Prob>|t| Intercept 79.154625 0.701788 112.79 <.0001
A 0.145125 0.701788 0.21 0.8375 B 10.151375 0.701788 14.47 <.0001 C -3.626625 0.701788 -5.17 <.0001
AB 0.512875 0.701788 0.73 0.4704 AC 2.342875 0.701788 3.34 0.0022 BC 1.741625 0.701788 2.48 0.0187
ABC -1.515875 0.701788 -2.16 0.0386 A= Inlet extension, B = Scrubber capacity, C = Face air
R2: 0.89

169
REFERENCES
[1] F. F. Peng and W. G. Wang, “Respirable Dust Concentration Distribution Model on Longwall Faces—Multiple Dust Source Approach,” Powder Technol., vol. 79, no. 2, pp. 121–133, 1994.
[2] World Health Organization, “Hazard prevention and control in the work environment: Airborne dust - WHO,” 2016. [Online]. Available: http://www.who.int/occupational_health/publications/en/oehairbornedust3.pdf. [Accessed: 11-Oct-2016].
[3] M. L. Harris, K. L. Cashdollar, C. Man, and E. Thimons, “Mitigating Coal Dust Explosions in Modern Underground Coal Mines,” in Proceedings of the 9th International Mine Ventilation Congress, 2009, vol. 8, pp. 10–13.
[4] U.S. Department of Labor, “Lowering Miners’ Exposure to Respirable Coal Mine Dust, Including Continuous Personal Dust Monitors,” Federal Register Volume 79, Number 84, 2014. [Online]. Available: http://arlweb.msha.gov/regs/fedreg/final/2014finl/2014-09084.asp. [Accessed: 01-May-2014].
[5] J. Sinclair, Environmental Conditions in Coal Mines: Including Fires, Explosions, Rescue and Recovery Work. Pitman, 1958.
[6] NIOSH, “Work-Related Lung Disease Surveillance Report 2007, Volume1,” Dep. Heal. Hum. Serv. Centers Dis. Control Prev. Natl. Inst. Occup. Saf. Heal. Div. Respir. Dis. Stud. DHHS, no. 2008–143a, 2008.
[7] U.S. Department of Labor, “Final Rule,” 2014. [Online]. Available: http://arlweb.msha.gov/regs/fedreg/final/2014finl/2014-09084.asp.
[8] K. L. Cashdollar and M. J. Sapko, “Explosion Hazards of Coal Dust in the Presence of Methane,” in Handbook for Methane Control in Mining, 2006, pp. 147–150.
[9] M. J. Sapko, K. L. Cashdollar, G. M. Green, and H. C. Verakis, “Coal Dust Particle Size Survey of U . S . Mines,” J. Loss Prev. Process Ind., vol. 20, no. 4, pp. 616–620, 2007.
[10] C. K. Man and K. A. Teacoach, “How Does Limestone Rock Dust Prevent Coal Dust Explosions in Coal Mines?,” Min. Eng., vol. 61, no. September, pp. 69–73, 2009.
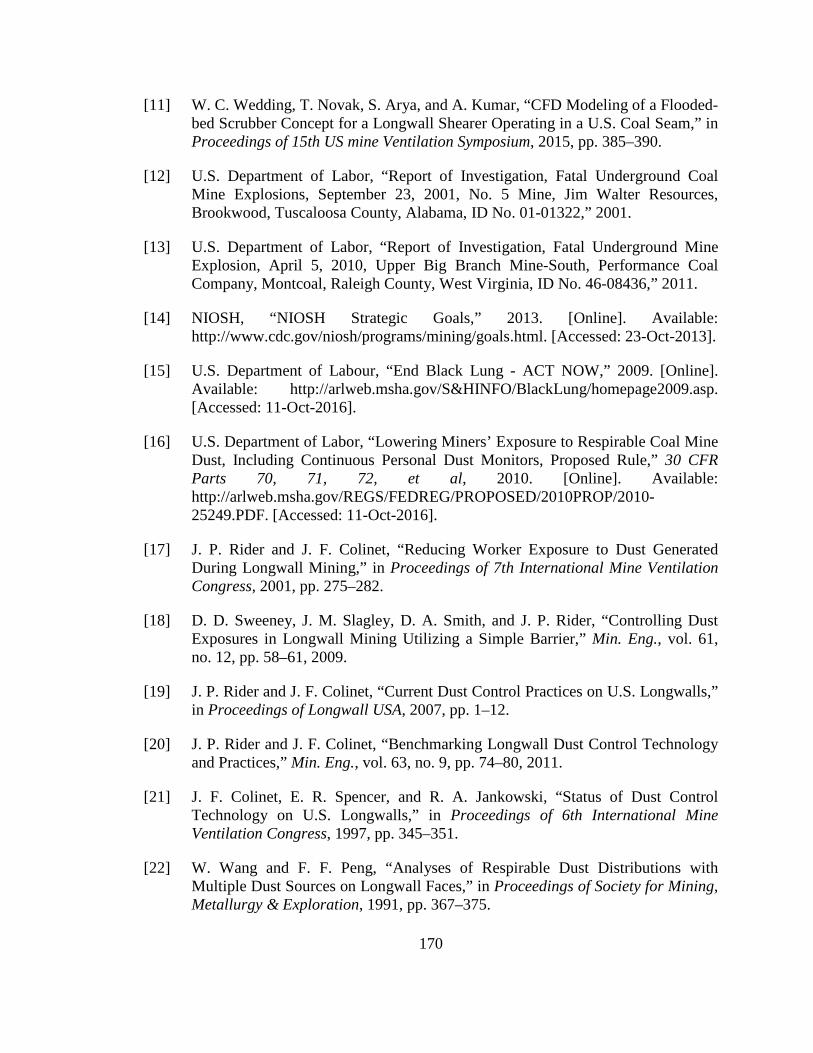
170
[11] W. C. Wedding, T. Novak, S. Arya, and A. Kumar, “CFD Modeling of a Flooded-bed Scrubber Concept for a Longwall Shearer Operating in a U.S. Coal Seam,” in Proceedings of 15th US mine Ventilation Symposium, 2015, pp. 385–390.
[12] U.S. Department of Labor, “Report of Investigation, Fatal Underground Coal Mine Explosions, September 23, 2001, No. 5 Mine, Jim Walter Resources, Brookwood, Tuscaloosa County, Alabama, ID No. 01-01322,” 2001.
[13] U.S. Department of Labor, “Report of Investigation, Fatal Underground Mine Explosion, April 5, 2010, Upper Big Branch Mine-South, Performance Coal Company, Montcoal, Raleigh County, West Virginia, ID No. 46-08436,” 2011.
[14] NIOSH, “NIOSH Strategic Goals,” 2013. [Online]. Available: http://www.cdc.gov/niosh/programs/mining/goals.html. [Accessed: 23-Oct-2013].
[15] U.S. Department of Labour, “End Black Lung - ACT NOW,” 2009. [Online]. Available: http://arlweb.msha.gov/S&HINFO/BlackLung/homepage2009.asp. [Accessed: 11-Oct-2016].
[16] U.S. Department of Labor, “Lowering Miners’ Exposure to Respirable Coal Mine Dust, Including Continuous Personal Dust Monitors, Proposed Rule,” 30 CFR Parts 70, 71, 72, et al, 2010. [Online]. Available: http://arlweb.msha.gov/REGS/FEDREG/PROPOSED/2010PROP/2010-25249.PDF. [Accessed: 11-Oct-2016].
[17] J. P. Rider and J. F. Colinet, “Reducing Worker Exposure to Dust Generated During Longwall Mining,” in Proceedings of 7th International Mine Ventilation Congress, 2001, pp. 275–282.
[18] D. D. Sweeney, J. M. Slagley, D. A. Smith, and J. P. Rider, “Controlling Dust Exposures in Longwall Mining Utilizing a Simple Barrier,” Min. Eng., vol. 61, no. 12, pp. 58–61, 2009.
[19] J. P. Rider and J. F. Colinet, “Current Dust Control Practices on U.S. Longwalls,” in Proceedings of Longwall USA, 2007, pp. 1–12.
[20] J. P. Rider and J. F. Colinet, “Benchmarking Longwall Dust Control Technology and Practices,” Min. Eng., vol. 63, no. 9, pp. 74–80, 2011.
[21] J. F. Colinet, E. R. Spencer, and R. A. Jankowski, “Status of Dust Control Technology on U.S. Longwalls,” in Proceedings of 6th International Mine Ventilation Congress, 1997, pp. 345–351.
[22] W. Wang and F. F. Peng, “Analyses of Respirable Dust Distributions with Multiple Dust Sources on Longwall Faces,” in Proceedings of Society for Mining, Metallurgy & Exploration, 1991, pp. 367–375.

171
[23] NIOSH, “Hazard Identification 1: Exposure to Silica Dust on Continuous Mining Operations using Flooded-bed Scrubbers,” U.S. Department of Health and Human Services, Public Health Service, Centers for Disease Control and Prevention, National Institute for Occupational Safety and Health, DHHS (NIOSH), No. 97-147, 1997.
[24] J. F. Colinet, W. R. Reed, and J. D. Potts, “Continuous Mining Dust Levels in 20-foot Cuts with and without a Scrubber Operating,” in Proceedings of Society for Mining, Metallurgy & Exploration, 2014, p. Preprint 14-033.
[25] National Mining Association, “Most Requested Statistics - U.S. Coal Industry,” 2015. [Online]. Available: http://nma.org/wp-content/uploads/2016/09/Statistics-Most-Requested-Statistics-on-Coal.pdf.
[26] U.S. Energy Information Administration, “Electric Power Monthly,” 2015. [Online]. Available: http://www.eia.gov/electricity/monthly/epm_table_grapher.cfm?t=epmt_1_01. [Accessed: 25-Oct-2016].
[27] H. L. Hartman and jan M. Mutmansky, Introductory Mining Engineering, Second. John Wiley & Sons, 2002.
[28] World Coal Association, “Coal Mining,” 2016. [Online]. Available: http://www.worldcoal.org/coal/coal-mining. [Accessed: 01-Jan-2016].
[29] U.S. Energy Information Administration, “Annual Coal Report,” 2015. [Online]. Available: http://www.eia.gov/coal/annual/. [Accessed: 03-Nov-2016].
[30] Mining Global, “Underground v.s. Surface Coal Mines: Is Deep Drilling Worth the Cost?,” 2014. [Online]. Available: http://www.miningglobal.com/machinery/579/Underground-vs-Surface-Coal-Mines:-Is-Deep-Drilling-Worth-the-Cost. [Accessed: 01-Jan-2016].
[31] P. Tsang, S. S. Peng, and K. Biswas, “Current practice of pillar design in US coal mines,” Min. Eng., vol. 48, no. 12, pp. 55–60, 1996.
[32] C. Ö. Karacan, G. S. Esterhuizen, S. J. Schatzel, and W. P. Diamond, “Numerical Analysis of the Impact of Longwall Panel Width on Methane Emissions and Performance of Gob Gas Ventholes,” Int. J. Coal Geol., vol. 71, no. 2–3, pp. 225–245, 2007.
[33] G. V Weisdack and J. F. Kvitkovich, “Importance of Longwall Mining to the Coal Industry,” in Proceedings of Society for Mining, Metallurgy & Exploration, 2006, pp. 21–26.
[34] H. L. Hartman, Ed., SME Mining Engineering Handbook. 1992.
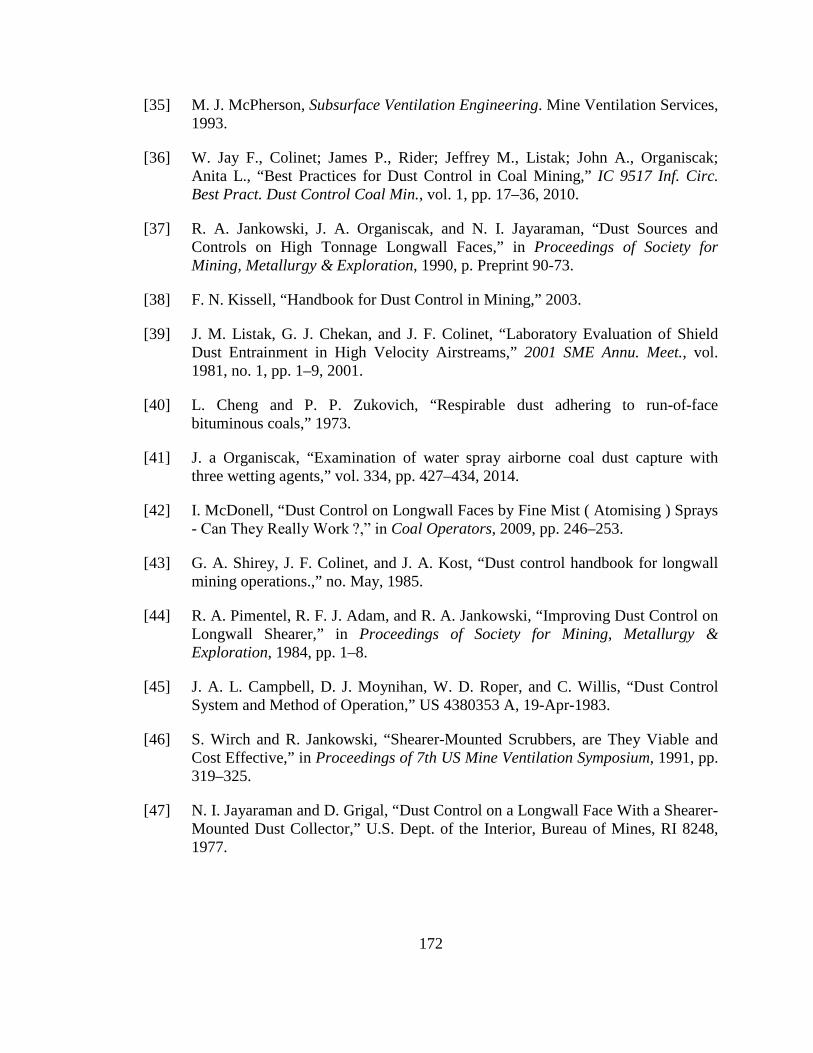
172
[35] M. J. McPherson, Subsurface Ventilation Engineering. Mine Ventilation Services, 1993.
[36] W. Jay F., Colinet; James P., Rider; Jeffrey M., Listak; John A., Organiscak; Anita L., “Best Practices for Dust Control in Coal Mining,” IC 9517 Inf. Circ. Best Pract. Dust Control Coal Min., vol. 1, pp. 17–36, 2010.
[37] R. A. Jankowski, J. A. Organiscak, and N. I. Jayaraman, “Dust Sources and Controls on High Tonnage Longwall Faces,” in Proceedings of Society for Mining, Metallurgy & Exploration, 1990, p. Preprint 90-73.
[38] F. N. Kissell, “Handbook for Dust Control in Mining,” 2003.
[39] J. M. Listak, G. J. Chekan, and J. F. Colinet, “Laboratory Evaluation of Shield Dust Entrainment in High Velocity Airstreams,” 2001 SME Annu. Meet., vol. 1981, no. 1, pp. 1–9, 2001.
[40] L. Cheng and P. P. Zukovich, “Respirable dust adhering to run-of-face bituminous coals,” 1973.
[41] J. a Organiscak, “Examination of water spray airborne coal dust capture with three wetting agents,” vol. 334, pp. 427–434, 2014.
[42] I. McDonell, “Dust Control on Longwall Faces by Fine Mist ( Atomising ) Sprays - Can They Really Work ?,” in Coal Operators, 2009, pp. 246–253.
[43] G. A. Shirey, J. F. Colinet, and J. A. Kost, “Dust control handbook for longwall mining operations.,” no. May, 1985.
[44] R. A. Pimentel, R. F. J. Adam, and R. A. Jankowski, “Improving Dust Control on Longwall Shearer,” in Proceedings of Society for Mining, Metallurgy & Exploration, 1984, pp. 1–8.
[45] J. A. L. Campbell, D. J. Moynihan, W. D. Roper, and C. Willis, “Dust Control System and Method of Operation,” US 4380353 A, 19-Apr-1983.
[46] S. Wirch and R. Jankowski, “Shearer-Mounted Scrubbers, are They Viable and Cost Effective,” in Proceedings of 7th US Mine Ventilation Symposium, 1991, pp. 319–325.
[47] N. I. Jayaraman and D. Grigal, “Dust Control on a Longwall Face With a Shearer-Mounted Dust Collector,” U.S. Dept. of the Interior, Bureau of Mines, RI 8248, 1977.

173
[48] A. G. French, “The Extraction of Respirable Dust from Machines Working on Longwall Faces,” in Proceedings of International Conference on Health in Mines, 1983, pp. 57–93.
[49] R. J. Hamilton and A. G. French, “Dust Control by Exhaust Ventilation Methods on Longwall Machines,” European Coal and Steel Community, RI 7256, 1984.
[50] J. P. Rider and J. F. Colinet, “Controlling Respirable Dust on Longwall Mining Operations,” in Best Practices for Dust control in Coal Mining, 2010, pp. 17–39.
[51] E. F. Divers, R. A. Jankowski, and J. Kelly, “Ventilated Drum Controls Longwall Dust and Methane,” in Proceedings of 3rd U.S. Mine Ventilation Symposium, 1987, pp. 85–89.
[52] G. R. Gillingham, “Cowl-like scrubber for a long-wall shearer,” US 4351567 A, 28-Sep-1982.
[53] J. Kelly, T. Muldoon, and W. Schroeder, “Shearer Mounted Dust Collector Laboratory Testing,” U.S. Dept. of the Interior, Bureau of Mines, BM-7850, 1982.
[54] J. Kelly and T. Muldoon, “Shearer Mounted Dust Collector; Evaluation of Ventilated Cutting Drunls,” 1987.
[55] C. F. Liao and G. W. Graham, “Scrubber for Dispersing Dust Generated by Longwall Shearers,” US 5219208 A, 15-Jun-1993.
[56] M. S. Adamczyk, J. D. Armburger, and R. P. Aaron, “Dust Control Apparatus for Longwall Mining Machinery,” US 5518299 A, 21-May-1996.
[57] T. Ren, R. Balusu, and B. Plush, “Dust Control Technology for Longwall Faces - Shearer Scrubber Development and Field Traials,” The Australian Coal Industry’s Research Program (ACRAP), C14036, 2009.
[58] T. X. Ren, B. Plush, and N. Aziz, “Dust Controls and Monitoring Practices on Australian Longwalls,” Procedia Eng., vol. 26, pp. 1417–1429, 2011.
[59] Thermo Scientific, “Thermo Scientific PDM 3700 Manual,” 2016.
[60] S. J. Page et al., “Equivalency of a personal dust monitor to the current United States coal mine respirable dust sampler.,” J. Environ. Monit., vol. 10, no. 1, pp. 96–101, 2008.
[61] Software Cradle Co., “User’s Guide Basics of CFD Analysis,” .

174
[62] J. M. Listak, “Chapter 4 - Controlling Respirable Dust on Continuous Mining Operations,” in Best Practices for Dust control in Coal Mining, 2010, pp. 41–64.
[63] T. Li, A. J. Salarzar, and K. Saito, “Experimental and Numerical Feasibility Study of Modifying Automotive Wet Scrubber for Capturing Particulate in Coal-Fired Power Plants,” in Proceedings of 6th International Symphosium on Scale Modeling, 2009, pp. 1–10.
[64] A. J. Salazar, K. Saito, R. P. Alloo, and N. Tanaka, “Wet scrubber and paint spray booth including the wet scrubber,” US 6024796 A, 15-Feb-2000.
[65] K. Saito, Progress in Scale Modeling: Summary of the First International Symposium on Scale Modeling (ISSM I in 1988) and Selected Papers from Subsequent Symposia (ISSM II in 1997 through ISSM V in 2006). Springer Netherlands, 2008.
175
VITA
SAMPURNA ARYA
EDUCATION M.S. in Mining Engineering University of Kentucky May 2013
B.S. in Mining Engineering Indian School of Mines May 2006
PROFESSIONAL EXPERIENCE Research Assistant University of Kentucky Aug 2014 to Mar 2018
Research Assistant University of Kentucky Jan 2010 to May 2013
Junior Manager Steel Authority of India Ltd. (SAIL), India
Aug 2006 to Dec 2009
TEACHING EXPERIENCE Instructor Mine Ventilation (MNG-341) University of Kentucky Fall 2017
Mine Surveying (MNG-211) University of Kentucky Summer 2013
Teaching Assistant Mine Ventilation (MNG-341) University of Kentucky Fall 2012, & 15
HONORS AND AWARDS • Outstanding Graduate Student Award, Department of Mining
Engineering, University of Kentucky 2018
• Graduate Student Research Poster Contest, SME, Secured 1st Place 2018 • Environmental Division Poster Contest, SME, Secured 3rd Place 2018 • Graduate Student Research Poster Contest, SME, Secured 2nd Place 2017 • WAAIME Scholarship Award, SME 2014, & 15 • Society of Explosive Engineers Education Foundation Scholarship
Award, ISEE 2015
• Outstanding Performer Award for all-time best production, SAIL, India 2007
SELECTED PUBLICATIONS 1. Arya, S., Sottile, J., and Novak, T., (2018), Development of a flooded-bed scrubber
for removing coal dust at a longwall mining section, Accepted: Safety Science. 2. Arya, S., Wedding, W.C., Saito, K., Novak, T., and Levy, A., (2017), Scale
modeling of dust capture through a flooded-bed dust scrubber integrated within a longwall shearer," Proc. of the 8th International Symposium on Scale Modeling.
3. Arya, S., Wedding, W.C., Novak, T., Kumar, A., and Levy, A., (2017), "Pressure drop measurement across flooded-bed scrubber screen and demister in a laboratory setup for its use in a longwall shearer," Proc. of the 16th North American Mine Ventilation Symposium, Chapter 15, pp. 1-7.
176
4.
Kumar, A., Arya, S., Wedding, W.C., and Novak, T., (2017), "Examination of capture efficacy of shearer mounted flooded-bed dust scrubber using experiments and computer fluid dynamics (CFD) modeling on a reduced scale model," Proc. of the 16th North American Mine Ventilation Symposium, Chapter 20, pp. 1-8.
5. Arya, S., Wedding, W.C., and Kumar, A., (2016), CFD modeling of a novel wet scrubber for capture of respirable dust in an underground coal mine, SME Annual Conference & Expo, SME preprint 16-161.
6. Kumar, A., Wedding, W.C., Jolly, A., Arya, S., and Novak, T., (2016), Modeling capture efficiency for a flooded-bed dust scrubber incorporated into a longwall shearer using a small physical model and CFD, SME Annual Conference & Expo, SME preprint 16-118.
7. Wedding, W.C., Novak, T., Arya, S., and Kumar, A., (2015), CFD modeling of a flooded-bed scrubber concept for a longwall shearer operating in a U.S. coal seam, Proc. of the 15th North American Mine Ventilation Symposium, pp. 385-390.
MANUSCRIPTS UNDER REVIEW 1. Arya, S., Novak, T., Saito, K., Levy, A., and Sottile, J., (2018), Empirical formulas
for determining pressure drop across a flooded-bed scrubber, Journal of Loss and Prevention in the Process Industries.
2. Arya, S., Sottile, J., Rider, J.P., Colinet, J.F., and Novak, T., (2018), Design and experimental evaluation of a flooded-bed dust scrubber integrated into a longwall shearer, Powder Technology.
3. Arya, S., Novak, T., Kumar, A., and Novak, T., (2018), Numerical modeling of airflow along a coal mine longwall face, Tunneling and Underground Space Technology.
4. Arya, S., Sottile, J., and Novak, T., (2018), Validation of a CFD model for a flooded-bed scrubber integrated into a longwall shearer, International Journal of Mining Science and Technology.
SELECTED TALKS 1. Scale modeling of dust capture through a flooded-bed dust scrubber integrated
within a longwall shearer, 8th International Symposium on Scale Modeling, Portland, Oregon, September 11-14, 2017.
2. Pressure drop measurement across flooded-bed scrubber screen and demister in a laboratory setup for its use in a shearer, 16th North American Mine Ventilation Symposium, Golden, CO, June 17-22, 2017.
3. Controlling dust concentration at a longwall face through application of a flooded-bed scrubber to a longwall shearer, Longwall USA Conference, Pittsburgh, PA, June. 13-14, 2017.
4. Laboratory testing of a full-scale physical model of a longwall shearer for investigating the effectiveness of the application of a flooded-bed dust scrubber on the shearer, SME Annual Conference & Expo, Denver, CO, Feb. 19-22, 2017.
5. CFD modeling of a novel wet scrubber for capture of respirable dust in an underground coal mine, SME Annual Conference & Expo, Phoenix, AZ, Feb. 21-24, 2016.