INVESTIGATION OF REDUCED (Sr ,Ba )Nb2O6 AS A · 2017-12-07 · Chair, Intercollege Graduate Degree...
198
The Pennsylvania State University The Graduate School Department of Materials Science and Engineering INVESTIGATION OF REDUCED (Sr x ,Ba 1-x )Nb 2 O 6 AS A FERROELECTRIC-BASED THERMOELECTRIC A Dissertation in Material Science and Engineering by Jonathan A. Bock 2016 Jonathan A. Bock Submitted in Partial Fulfillment of the Requirements for the Degree of Doctor of Philosophy August 2016
Transcript of INVESTIGATION OF REDUCED (Sr ,Ba )Nb2O6 AS A · 2017-12-07 · Chair, Intercollege Graduate Degree...

The Pennsylvania State University
The Graduate School
Department of Materials Science and Engineering
INVESTIGATION OF REDUCED (Srx,Ba1-x)Nb2O6 AS A
FERROELECTRIC-BASED THERMOELECTRIC
A Dissertation in
Material Science and Engineering
by
Jonathan A. Bock
2016 Jonathan A. Bock
Submitted in Partial Fulfillment
of the Requirements
for the Degree of
Doctor of Philosophy
August 2016

The dissertation of Jonathan Anton Bock was reviewed and approved* by the following:
Clive A. Randall
Professor of Materials Science and Engineering
Dissertation Co-Advisor
Co-Chair of Committee
Susan Trolier-McKinstry
Professor of Ceramic Science and Engineering
Dissertation Co-Advisor
Co-Chair of Committee
Gerald D. Mahan
Distinguished Professor of Physics
Roman Engel-Herbert
Assistant Professor of Material Science and Engineering
Venkatraman Gopalan
Professor of Material Science and Engineering
Suzanne Mohney
Professor of Materials Science and Engineering and Electrical Engineering
Chair, Intercollege Graduate Degree Program in Materials Science and
Engineering
*Signatures are on file in the Graduate School

iii
ABSTRACT
A comprehensive study of a novel type of thermoelectric – a heavily doped material from
a ferroelectric base composition – is presented. Due to the low-lying optic modes and scattering
of phonons at domain walls, ferroelectrics make interesting candidates for thermoelectrics. The
example of (Srx,Ba1-x)Nb2O6-δ (SBN) is explored in detail due to a report of an impressive
thermoelectric figure of merit in single crystals. The goal of this research is to understand the
source of the large figure of merit in SBN. In attempts to do this, the electron transport
mechanism, the coupling between electron transport and ferroelectricity, the phase equilibria, and
the single crystalline thermoelectric properties were investigated under various reduction
conditions.
It was found that the electron transport properties of a normal ferroelectric SBN can be
well explained by activation of electrons into the conduction band from a localized impurity
band. SBN can be shifted between a normal and relaxor ferroelectric by changing the Sr:Ba ratio.
This property of SBN was utilized to study the effect of relaxor ferroelectricity on electron
transport. Within the relaxor ferroelectric regime, a change in the activation energy for
electronic conduction and an abnormal temperature dependence of the Seebeck coefficient were
found. These properties are attributed to Anderson localization caused by the relaxor
ferroelectricity. This is not thought to be the cause of the large thermoelectric figure of merit.
The electron transport-ferroelectric coupling was also studied in oxygen deficient
(Bax,Sr1-x)TiO3-δ (BST). A metallic-like to nonmetallic transition occurs at the ferroelectric
transition, and the temperature of the metallic-like to nonmetallic transition can be shifted via Sr
doping. The temperature shift on Sr doping is equivalent to the shift in the paraelectric-

iv
ferroelectric transition temperature in unreduced samples, showing that the ferroelectric transition
is the cause of the metallic-like to nonmetallic transition.
The presence of an impurity band in SBN points toward a large carrier concentration
which is difficult to justify with oxygen vacancies alone, and this large carrier concentration is
thought to provide the enhanced thermoelectric properties. To investigate the cause of the
enhanced carrier concentration in reduced SBN, the defect chemistry and phase equilibria of the
system under low oxygen partial pressure conditions was studied. A secondary phase of NbO2
was identified upon reduction, and was found to correlate with an increase in the (Sr+Ba):Nb
ratio of the SBN matrix. It will be shown that if the assumption is made that the excess Sr and Ba
remain in the SBN lattice, then the (Sr+Ba):Nb ratio of the SBN matrix can accurately predict the
amount of NbO2 which forms. Additionally, the amount of NbO2 secondary phase decreases on
increasing the Sr and Ba concentration of samples. Eventually a phase pure composition is
formed when the (Sr+Ba):Nb ratio corresponds to a Sr and Ba site occupancy of 1,
(Sr0.6,Ba0.4)1.2Nb2O6. Above this, a tertiary phase forms. These findings are consistent with the Sr
and Ba sites being filled as a function of reduction. This A-site filling process is thought to be the
source of the large thermoelectric figure of merit. To investigate the air-stability,
thermogravimetric analysis was used to measure the oxygen absorption upon heating in air. The
amount of oxygen which is absorbed was equivalent to the necessary amount to fully compensate
the excess Sr and Ba. The resulting samples are insulating.
The thermoelectric properties of and the NbO2 formation in reduced SBN single crystals
were also investigated. The formation of NbO2 was hindered due to the lack of grain boundaries
which act as heterogeneous nucleation sites. The homogeneous nucleation energy prevented bulk
NbO2 formation until 10-15
atm pO2 at 1300°C, two orders of magnitude below the oxygen partial
pressure necessary in ceramics. This was overcome using a pre-anneal at 10-16
atm pO2 followed
by a re-equilibration at lower pO2. The highest power factor measured at 600°C was 8.5

v
µW/cmK2 resulting in a zT of 0.38 if polycrystalline values of the thermal conductivity are
assumed. The previously mentioned low-temperature Seebeck anomaly caused by Anderson
localization was found to exist along the polar c-axis, but not the non-polar a-axis. This further
strengthens the idea that perturbations to the electron transport are caused by the ferroelectric
polarization.
These results show that the thermoelectric properties found in SBN upon reduction are
due to a change from (Srx,Ba1-x)Nb2O6-δ toward (Srx,Ba1-x)1.2Nb2O6-δ and the resulting carrier
concentration associated with the additional Sr2+
and Ba2+
cations on the A-site. Relaxor
ferroelectricity perturbs the electron transport, but is not a cause of enhanced thermoelectric
properties. This points toward A-site doped tungsten bronze materials in general as interesting
thermoelectric materials. Future work revolving around decreasing the octahedral tilt angle,
increasing the d-orbital overlap, and determining the necessity of ferroelectric-thermoelectric
coupling in relation to thermal conductivity could result in further optimization within this new
interesting family of thermoelectric oxides.

vi
TABLE OF CONTENTS
List of Figures .......................................................................................................................... viii
List of Tables ........................................................................................................................... xiv
Acknowledgements .................................................................................................................. xv
Chapter 1 Introduction and Motivation .................................................................................... 1
Chapter 2 Background Information ......................................................................................... 3
2.1 Electron Transport ...................................................................................................... 3 2.1.1 Band Structures in d-electron Systems ............................................................ 3 2.1.2 Anderson Localization and Mobility Edges .................................................... 8 2.1.3 Impurity Bands and the Transition to Metallic Conductivity .......................... 11 2.1.4 Polaronic Hopping ........................................................................................... 18
2.2 Thermal Conductivity ................................................................................................ 24 2.2.1 Electronic Thermal Conductivity .................................................................... 27 2.2.2 Lattice Thermal Conductivity ......................................................................... 29 2.2.3 Effects of Ferroelectricity on Lattice Thermal Conductivity .......................... 34
2.3 Ferroelectricity ........................................................................................................... 38 2.3.1 Relaxor Ferroelectrics ..................................................................................... 39
2.4 Thermoelectrics .......................................................................................................... 40 2.4.1 Thermoelectric Effects and Devices ................................................................ 40 2.4.2 Material Physics of Thermopower .................................................................. 46 2.4.3 Oxide Thermoelectrics .................................................................................... 53
2.5 Strontium Barium Niobate ......................................................................................... 56
Chapter 3 Metallic-like to Nonmetallic Transitions in a Variety of Heavily Oxygen
Deficient Ferroelectrics .................................................................................................... 59
3.1 Background ................................................................................................................ 60 3.2 Experimental Procedure ............................................................................................. 62 3.3 Results and Discussion ............................................................................................... 64 3.4 Conclusions ................................................................................................................ 69
Chapter 4 Electron Transport in (Srx,Ba1-x)Nb2O6-δ and the Effect of Relaxor
Ferroelectricity ................................................................................................................. 71
4.1 Background ................................................................................................................ 71 4.2 Experimental Procedure ............................................................................................. 73
4.2.1 Sample Sintering and Preparation ................................................................... 73 4.2.2 Electron Transport Measurements................................................................... 75 4.2.3 Temperature Dependent X-ray Diffraction Measurements ............................. 77
4.3 Results and Discussion ............................................................................................... 78 4.3.1 Electron Transport as a Function of Reduction ............................................... 78 4.3.2 Effect of Relaxor Ferroelectricity on Electron Transport in SBN ................... 83
4.4 Conclusions ................................................................................................................ 96
vii
Chapter 5 The Effects of Low Oxygen Partial Pressures on the Phase Equilibria and
Cation Occupancy of Strontium Barium Niobate ............................................................ 97
5.1 Introduction ................................................................................................................ 98 5.2 Experimental Procedure ............................................................................................. 100 5.3 Results and Discussion ............................................................................................... 102
5.3.1 Formation of NbO2 as a Function of pO2 and Temperature ............................ 102 5.3.2 Change in A-site Occupancy of the SBN Matrix During NbO2 Formation .... 104 5.3.3 Phase Equilibrium of (Sr0.6,Ba0.4)1+yNb2O6-δ at Low Oxygen Activities .......... 109 5.3.4 Reoxidation of (Sr0.6,Ba0.4)1+yNb2O6-δ .............................................................. 113
5.4 Conclusions ................................................................................................................ 118
Chapter 6 Thermoelectric Properties of (Sr,Ba)Nb2O6-δ Single Crystals: zT’s and
Anisotropy ........................................................................................................................ 120
6.1 Introduction ................................................................................................................ 120 6.2 Experimental Procedure ............................................................................................. 122 6.3 Results and Discussion ............................................................................................... 123
6.3.1 Formation of NbO2 in Single Crystal SBN ..................................................... 123 6.3.2 Electron Transport Properties .......................................................................... 127
6.4 Summary .................................................................................................................... 133
Chapter 7 Conclusions and Future Work ................................................................................. 135
7.1 Conclusions ................................................................................................................ 135 7.1.1 Coupling Between Ferroelectricity and Electron Transport ............................ 135 7.1.2 Electron Transport in (Srx,Ba1-x)Nb2O6-δ ......................................................... 136 7.1.3 Formation of the NbO2 Secondary Phase and Resulting Changes in the
SBN Matrix ...................................................................................................... 136 7.1.4 Phase Equilibrium Analysis of A-site filling in Oxygen Deficient SBN ........ 137 7.1.5 Defect Chemistry of the Low Temperature Reoxidation of A-site Filled
Strontium Barium Niobate ............................................................................... 137 7.1.6 Thermoelectric Properties of Strontium Barium Niobate Single Crystals ...... 138 7.1.7 Effect of Current Results on the Design of Relaxor-Ferroelectric Based
Thermoelectrics ................................................................................................ 139 7.2 Future Work ............................................................................................................... 140
7.2.1 Investigation of Changes to the Ferroelectric Properties as a Function of
A-site Filling and Oxygen Content ................................................................... 140 7.2.2 Determination of Thermal Conductivity in a Variety of Normal and
Relaxor Ferroelectric Tungsten Bronzes .......................................................... 144 7.2.3 Increasing Stability of (Srx,Ba1-x)1+yNb2O6 in Air ........................................... 146
Appendix A: Control of Oxygen Partial Pressure .................................................................... 148
Appendix B: Seebeck Coefficient Measurements ................................................................... 152
References ................................................................................................................................ 159

viii
LIST OF FIGURES
Figure 2-1. A depiction of molecular orbital theory for two hydrogen atoms bonding to
form one hydrogen molecule. The molecular orbital which is a sum of the
individual wavefuctions is at a lower energy than the individual wavefunctions.
(Redrawn from 16
) ............................................................................................................ 4
Figure 2-2. A depiction of band formation from a molecular orbital perspective. The
number of atoms participating in bonding is shown on the bottom. The extreme case
is shown on the right where a very large number of atoms participate in bonding and
enough molecular orbitals are formed that a band of states develops. Redrawn from 17
....................................................................................................................................... 5
Figure 2-3. Different d-orbital electron clouds placed inside of an octahedral coordination
of negative ligands. From Reference 17
........................................................................... 6
Figure 2-4. Crystal field splitting for octahedral coordination. Redrawn from 17
.................... 7
Figure 2-5. Depiction of Anderson localization. (a) Energy wells in an ordered material
hybridize to give a parabolic density of states. (b) Energy wells in a disordered
material where Anderson localization produces localized states at the edge of the
band. Electrons in localized states move via hopping between localized sites, while
electrons in extended states are delocalized. These states are separated by the
mobility edge. Modified from Ref. 19
.............................................................................. 9
Figure 2-6. Depiction of the transition from insulator to metal as a function of carrier
concentration. (a)-(e) are described in the text. Inspired by Ref. 19
................................. 13
Figure 2-7. (a) Conductivity vs. temperature data and (b) activation energy for La1-
xSrxVO3. The activation energy at x~0.2 goes to zero, indicating metallic behavior. 36
....................................................................................................................................... 16
Figure 2-8. The effective Bohr radius and the critical carrier concentration for metallic
conduction plotted for a variety of materials. The solid line represents the Mott
Criterion, and is shown to fit well for many materials. WO3-δ38
; SrTiO3-δ39, 40
;
YBa2Cu3O7 and La2-xSrxCuO441
; all other points from Ref. 37
......................................... 17
Figure 2-9. Polaronic potential wells (a) before hopping (b) during adiabatic hopping (c)
during non-adiabatic hopping and (d) after hopping. After Reference 44
. ........................ 21
Figure 2-10. Schematic representation of different phonon absorptions leading to
electronic hopping, including multiphonon absorption processes. From Ref. 47
........... 23
Figure 2-11. Schematic representation of Variable Range Hopping (VRH) compared to
nearest neighbor hopping (EHop). All states below the mobility edge, Em, are
localized, as depicted by shading. After Ref. 49
............................................................... 24

ix
Figure 2-12. Schematic dispersion relation for optical and acoustic phonon branches for
a diatomic linear lattice. The lattice parameter is a. The number of branches will
increase for 3D materials and for materials with increased number of ions per
primitive basis. See Ref 58
for more. ................................................................................ 29
Figure 2-13. Thermal conductivity of Si-Ge solid solutions as a percentage of Si. The
thermal conductivity of solid solutions is reduced compared to the pure end
members due to impurity scattering. From Ref. 62
. ......................................................... 31
Figure 2-15. Heat Capacity of some ceramics as a function of temperature. From Ref 67
. ..... 34
Figure 2-16. Schematic representation of the softening of the transverse optic phonon
mode responsible for ferroelectricity in displacive ferroelectrics. Adapted from Ref. 32
. ...................................................................................................................................... 35
Figure 2-17. Thermal conductivity of multiple relaxor ferroelectrics compared to
amorphous SiO2. Figure taken from Ref. 32
...................................................................... 37
Figure 2-18. A ferroelectric hysteresis loop (left) and the associated domain structures at
different locations on the loop (right). From Reference 78
. ............................................ 38
Figure 2-19. Comparison of the temperature dependence of the spontaneous polarization
for a normal (left) and relaxor (right) ferroelectric. Note that many normal
ferroelectrics such as BaTiO3 may have residual ferroelectricity above the Curie
temperature....................................................................................................................... 40
Figure 2-20. A basic thermoelectric circuit ............................................................................. 41
Figure 2-21. Changes in electrical conductivity, thermal conductivity, Seebeck
coefficient, power factor, and figure of merit as a function of carrier concentration.
The Seebeck coefficient decreases with increasing carrier concentration while the
thermal and electrical conductivity increase. This creates a maximum power factor
and figure of merit as a function of carrier concentration. Redrawn from Ref. 91
........... 45
Figure 2-22. Electrical and lattice thermal conductivity as a function of carrier
concentration. ................................................................................................................... 46
Figure 2-23. Thermoelectric Figure of Merit for some state of the art oxide
thermoelectrics. Higher zT values are found for p-type materials than n-type
materials, showing the need for new n-type oxide thermoelectrics with higher zT
values. Values from 6, 109–114
............................................................................................. 54
Figure 2-24. Crystal structure of strontium barium niobate shown along [001]. ..................... 57
Figure 3-1. Electrical conductivity of multiple ferroelectrics which show metallic-like
conduction at high temperatures. Confirmed Tc and TBurns values are marked. .............. 64
Figure 3-2. Electrical conductivity for (Ba1-xSrx)TiO3-δ ceramics annealed at 1300°C
under 10-17
atm pO2. As Sr% increases the electrical conductivity increases, the

x
MLNM transition moves to lower temperatures, and a resurgence of metallic-like
conduction is seen at low temperatures. The insert shows both the change in both
the maximum conductivity and the inflection point, marked as Tc, as a function of
the amount of Sr, x. .......................................................................................................... 66
Figure 4-1. Electrical conductivity of (Sr0.6,Ba0.4)Nb2O6-δ annealed under partial pressures
of oxygen ranging from 10-7
to 10-16
atm. ......................................................................... 78
Figure 4-2. (a) Seebeck coefficient vs. temperature and (b) values of Seebeck coefficient
at 500K for different reduction conditions of SBN0.6. The magnitude of the
Seebeck coefficient is roughly temperature independent. It is noted that the Heike
formula (Equation (2.57)) for temperature independent Seebeck coefficients is not
valid here, as explained in 3.3.2. Error bars on (b) are a +-10% systematic error
based on the loading and reloading of a sample multiple times into the MMR
system. ............................................................................................................................. 81
Figure 4-3. Optical conductivity of (Sr0.6,Ba0.4)Nb2O6-δ from 10-10
atm pO2 to 10-16
atm
pO2 measured via combination of FTIR and ellipsometry. The peak should be
located near 4EHop. Low energy tails are an artifact of data analysis due to the FTIR
dataset ending in the middle of an absorption peak. ........................................................ 82
Figure 4-4. Electrical conductivities of (Srx,Ba1-x)Nb2O6-δ for SBN0.4-0.7 from 150K to
1000K. Measurements at temperatures greater than ~450K were performed under a
reducing atmosphere consistent with the pO2 used during sample annealing. Maxima
for SBN0.4-0.6 are located near TBurns, while SBN0.7 has a maxima shift to higher
temperatures. .................................................................................................................... 84
Figure 4-5. The c/a ratio of a SBN0.6 sample from 375K to 660K. A linear dependence
is seen >~625K, suggesting paraelectric behavior. A decrease in c/a ratio is due to
the short-range-order polarization between 450K and 625K, and an increase is found
<450K associated with the freezing in of mesoscale polar nano-regions. ....................... 85
Figure 4-6. T-1/4
behavior of the conductivity is found below ~270K for all samples.
Emin47
suggests this may be due to loss of multiphonon hopping processes below
~1/2TDebye. The value for 1/2TDebye for SBN0.6 found by Henning188
is plotted and
agrees with the onset of T-1/4
behavior. ............................................................................ 86
Figure 4-7. Natural log of electrical conductivity-temperature product plotted against
reciprocal thermal energy. A linear dependence is expected for small polaron
controlled conduction. Areas of SBN0.7 and SBN0.6 samples are linear, suggesting
this mechanism within a small temperature window, but high and low temperatures
deviate from this dependence. .......................................................................................... 88
Figure 4-8. Temperature dependent activation energies calculated from electrical
conductivity data. Changes in slope are found at 450K and 625K associated with the
changes in polarization in the sample, as discussed in the text. ....................................... 89
Figure 4-9. Proposed density of states for oxygen deficient strontium barium niobate.
The donors create an impurity band which splits into upper (UHB) and lower (LHB)

xi
Hubbard sub-bands. The Fermi energy is located between the upper and lower sub-
bands within localized states which are separated from delocalized states via
mobility edges as shown. Comparison to Figure 2-6d is useful. ...................................... 91
Figure 4-10. 3-point moving average of measured Seebeck coefficients of (Srx,Ba1-
x)Nb2O6-δ from 200K to 600K and an SBN0.6 sample measured from room
temperature to 750K. The Seebeck coefficients of all samples coincide at the Burns
temperature, and the SBN0.6 sample continues the trend of the normal ferroelectric
SBN0.4 and SBN0.5 samples above the Burns temperature. This suggests that the
nonlinearity found in the SBN0.6 and SBN0.7 samples is due to the relaxor
ferroelectric polarization. ................................................................................................. 93
Figure 5-1. Tetragonal tungsten bronze crystal structure of strontium barium niobate.
Corner-shared NbO6 octahedra connect in-plane to form multiple cation sites labeled
as A1, A2, and C-sites. 1/6th of the A1 and A2 sites are empty in stoichiometric
(Srx,Ba1-x)Nb2O6. .............................................................................................................. 98
Figure 5-2. Phase diagram of SBN at various annealing temperatures and partial
pressures of oxygen. Black squares are phase-pure SBN within XRD detection
limits, red circles correspond to a detectable amount of NbO2. The dotted line shows
a constant oxygen vacancy concentration assuming an oxygen vacancy formation
enthalpy of 4.25 eV. ......................................................................................................... 102
Figure 5-3. Offset XRD patterns of (Sr0.6,Ba0.4)Nb2O6-δ annealed at 1300°C under
multiple partial pressures of oxygen. An NbO2 phase forms starting at 10-13
atm pO2
and increases in volume fraction for decreasing pO2. The NbO2-containing sample
annealed at 10-16
atm pO2 was reannealed in air at 1300°C for 30 hours, and shows
only phase pure SBN. ....................................................................................................... 105
Figure 5-4. (a) The (Sr+Ba):Nb ratio in the SBN matrix of SBN+NbO2 composites
increases alongside the electrical conductivity. (b) Equation (5.5) correctly
calculates the amount of NbO2 formed by using the (Sr+Ba):Nb ratio of the SBN
matrix. .............................................................................................................................. 106
Figure 5-5. Phase composition of different SBN samples batched with different A:B
ratios and annealed at 1300°C under various pO2 conditions. Moving to the right on
the plot corresponds to an increase in the Sr and Ba chemical potentials. Note that
decreasing pO2 is plotted along the positive y direction. Samples with NbO2 as a
secondary phase are marked with red circles, phase pure samples are black squares,
and samples with 𝐴2Nb2O7 are blue triangles. The SBN phase region is limited by
the solid solution limits of either oxygen vacancies or partial Schottky defects. ............ 110
Figure 5-6. Phase composition of SBN samples batched with a (Sr+Ba):Nb ratio of (a)
0.50 (b) 0.55 and (c) 0.60 annealed at 1300°C at varying pO2 conditions. The
amount of 𝐴2Nb2O7 drops below that of air-fired samples at pO2 values as low as 10-
9 atm, showing that A-site filling is occurring at higher pO2 values in samples with
increased (Sr+Ba):Nb ratios. ............................................................................................ 113

xii
Figure 5-7. Thermogravimetric analysis in air of various (Sr0.6,Ba0.4) Nb2O6 powders
annealed at 1300°C for different partial pressures of oxygen (in atm). The weight
gain is a combination of an NbO2 to Nb2O5 transition and the changing oxygen
content of the matrix. The weight gain increases with decreasing partial pressure of
oxygen during annealing. ................................................................................................. 115
Figure 6-1. Backscatter SEM images of polished cross sections of SBN single crystals
annealed at (from left to right) 10-11
(a,b), 10-14
(c,d), 10-15
(e,f), and 10-16
(g,h) atm.
Cross sections are either of the (100) (top row; a,c,e,g) or (001) (bottom row; b,d,f,h)
planes. .............................................................................................................................. 123
Figure 6-2. Backscatter SEM images of the (a) (100) and (b) (001) surfaces of an SBN
single crystal annealed at 1300°C for 30 hours under 10-14
atm pO2. In Figure 6-2b,
an area is presented where the surface NbO2 has spalled off, revealing an underlying
layer of a porous SBN phase. Similar surface phases are found for crystals annealed
under 10-15
and 10-16
atm pO2. .......................................................................................... 124
Figure 6-3. The electrical conductivities for c-axis oriented SBN crystals as a function of
annealing time at 10-14
atm pO2 after first annealing in different annealing conditions
to either allow or disallow bulk NbO2 nucleation. ........................................................... 126
Figure 6-4. Seebeck coefficients (a), electrical conductivities (b), and power factors (c) of
SBN single crystals annealed at 1300°C for 30 hours under various oxygen partial
pressures. .......................................................................................................................... 127
Figure 6-5. Comparison of Seebeck coefficients, electrical conductivities, and power
factors of 10-14
and 10-16
atm pO2 single crystals; Current work (closed symbols) and
Lee et al. (open symbols)9. ............................................................................................... 131
Figure 6-6. zT of a 10-16
atm pO2 annealed c-axis and a-axis single crystals of
Sr0.6Ba0.4Nb2O6 using polycrystalline values of the thermal conductivity from Ref 185
.
zT values of other n-type oxide thermoelectrics are from References 6, 110, 114, 217
........... 132
Figure A-1. pO2 values obtainable from a 50sccm H2 and 500sccm N2 mass flow
controller through a room temperature water bubbler (green area) and flow of N2
through a H2O bubbler only (yellow area). ...................................................................... 149
Figure A-2. Schematic of the four point probe Seebeck coefficient measurement
technique. The sample is held between block electrodes which supply current for
resistivity measurements and two thermocouples are pushed onto the sample surface
to measure both the Seebeck voltage and temperature gradient. The background
temperature of the furnace is controlled by a global heater, and the temperature
gradient on the sample is controlled via a secondary gradient heater. Voltages Vac,
Vab, and Vcd are necessary for the calculation of the Seebeck coefficient. ...................... 153
Figure A-3. Temperature difference vs. Seebeck voltage plot. The Seebeck coefficient is
given by the slope. ........................................................................................................... 154

xiii
Figure A-4. Seebeck coefficient measured in a Four point probe system under Nitrogen
(Green) and Helium (Blue) at different total gas pressures. Filled lines were samples
measured with graphite foil placed in between the thermocouple and sample to
decrease the thermal barrier resistance. Placing the graphite foil decreased the error
from low gas pressures. 215
............................................................................................... 156
Figure A-5. Values of the ΔT uncertainty at various furnace temperatures and
temperature gradients modeled via finite element analysis. The model was
performed for a thermal contact conductance of 33,000 W/mK2 and thermocouple
emissivity of 0.7. The large errors at high temperatures and temperature gradients
occur primarily due to the cold finger effect. 244
.............................................................. 157
xiv
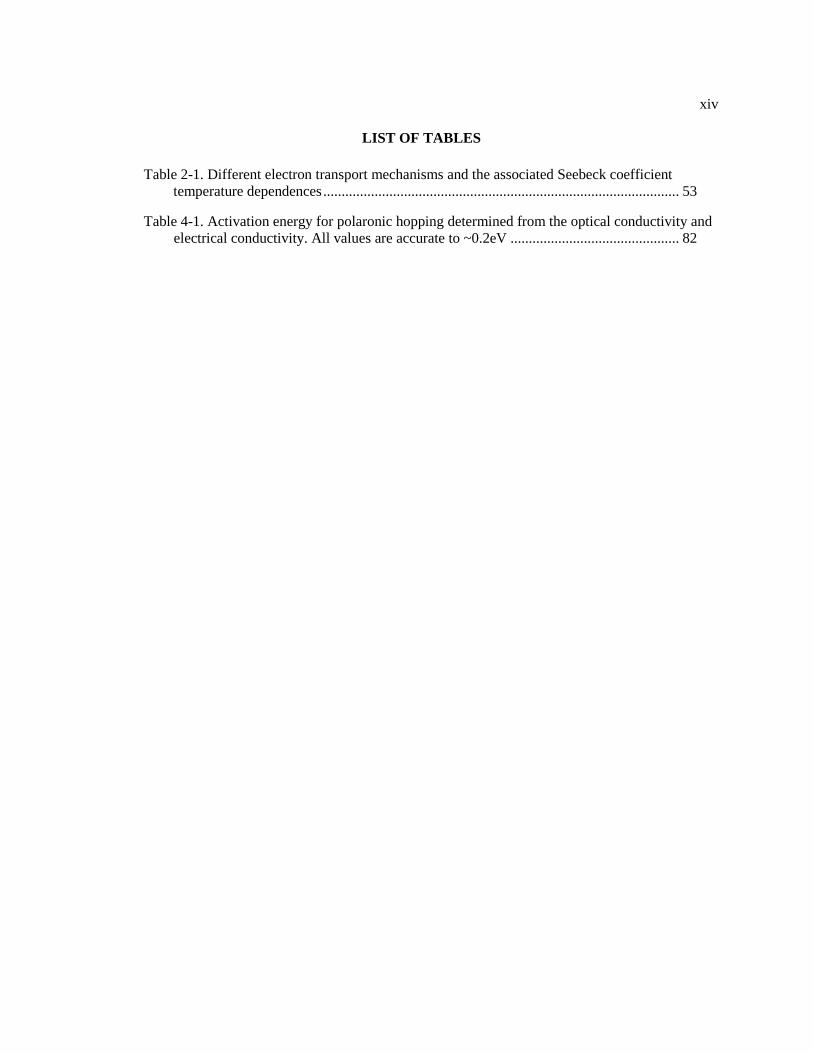
LIST OF TABLES
Table 2-1. Different electron transport mechanisms and the associated Seebeck coefficient
temperature dependences ................................................................................................. 53
Table 4-1. Activation energy for polaronic hopping determined from the optical conductivity and
electrical conductivity. All values are accurate to ~0.2eV .............................................. 82

xv
ACKNOWLEDGEMENTS
First, I would like to thank my advisors, Clive Randall and Susan Trolier-McKinstry.
Without your help and advice I wouldn’t have been able to obtain this degree. I would also like
to thank all of the members of the STM and Randall groups for your prolonged help over the
years. I would also like to acknowledge the staff members who have helped me and taught me
much – Jeff Long, Steve Perini, Nichole Wondering, Tim Klinger, Maria Dicola, and the rest of
the MRI staff.
On a personal level I would like to especially thank Ryan Keech, Lauren Garten, and
Charley Yeager for their deep friendship and helping me through difficult times.
I would also like to thank my immediate family. Mom, Dad, David – the environment
you provided, the help you have given, the lessons I have learned from you, and the opportunities
you have provided me have gotten me to where I am today. I am truly thankful.
This material is based upon work supported by the National Science Foundation, as part
of the Center for Dielectrics and Piezoelectrics under Grant Nos. IIP-1361571 and 1361503.
Financial support for this research was also provided by the United States-Israel Binational
Science Foundation (BSF-Energy) grant number 2011510, and the National Science Foundation
grant number DMR-1206518.

1
Chapter 1 Introduction and Motivation
Thermoelectrics provide the ability to convert heat into electrical power. Whether this
heat be in the form of radiative heat of a car exhaust, the heat transfer to and from the ground
during the day-night cycle, or from an aluminum smelter, the heat may be converted into
electrical power to increase the efficiency of the system or bleed off power for other uses.
Optimizing thermoelectrics in the form of increasing the Figure of Merit, zT, has been a long-
fought struggle against the physics of electron/hole and thermal transport. This struggle has made
many strides from developing techniques to nanostructure materials resulting in lower thermal
conductivities to the utilization of band engineering to optimize the thermoelectric power. These
strides have opened up applications for thermoelectrics in the spaces of solid state cooling,
automotive waste heat recovery, and extraterrestrial energy supply.1–3
Increased optimization of
thermoelectrics will open up further applications in waste energy recovery. This optimization is
not limited to increasing the nominal thermoelectric figure of merit, but includes also
optimization of the cost per watt-hour and maximum usable temperature. Oxide thermoelectrics
aim toward this with the goal of highly stable and low cost materials; key challenges include
overcoming the limitation of low figures of merit. Despite the ability of many oxides to make
adequate amounts of power from waste heat, the efficiency of oxides has been hindered by their
high thermal conductivity. Strategies to overcome the high thermal conductivity of oxides include
solid solution formation, introduction of ‘rattler’ ions, interface creation via spinodal
decomposition, and more which all have had varying level of success.4–6
A strategy presented
here is the use of ferroelectric oxides. The low-lying optic modes found in many ferroelectric

2
oxides and the scattering of phonons by domain walls may act as an adequate scattering
mechanism for decreasing the thermal conductivity for oxides.7, 8
Although the role of domain
walls and optic modes in thermal conductivity has been studied, little is known about the effect of
ferroelectricity on the transport of electrons. This is partially a consequence of the large majority
of applications for ferroelectrics requiring minimization of the electrical conductivity, or
‘leakage’ as it is pejoratively named. The opposite is clearly required for thermoelectric
applications, and here the study of ferroelectrics bathed in a veritable sea of electrons is
undertaken. With optimization and ingenuity, ferroelectricity eventually may supply an oxide
which allows the flow electrons like a crystal and scatters phonons like a glass. Through this
dissertation, this concept will be explored in detail for the example of strontium barium niobate.
A material which, along one direction, has reasonable power factors combined with the phonon
scattering power of a glass.9, 10
This combination makes for a formidable combination of
properties which is worthy of the in-depth study allowed by an academic dissertation. As this
dissertation will show, the physics, phase equilibria, and optimization of strontium barium
niobate are nontrivial. The struggle against the physics of electron and thermal transport is
accompanied by the clash between ferroelectric coherence and electrostatic screening, the
dichotomous need for simultaneous order and disorder, and the difficulties of playing on the edge
of stability. If you are entertaining this text, I presume you too are soon to be entwined in these
dilemmas. Welcome.

3
Chapter 2 Background Information
2.1 Electron Transport
Knowledge of the band structure of materials is important for understanding the
movement of electrons through a material, and hence it's transport properties. The band structure
will help predict the electrical conductivity and Seebeck coefficient of materials and is the
backbone of the field of thermoelectrics. In this section, the necessary information to understand
electron transport models in d-orbital systems such as BaTiO3-δ and (Sr,Ba)Nb2O6-δ will be
discussed.
2.1.1 Band Structures in d-electron Systems
The first successful approaches toward understanding the electronic properties of solids
came from the free electron model which assumes electrons do not interact with each other11, 12
.
The free electron model predicts many important aspects of materials such as the Wiedemann-
Franz law (see 2.2.1), the temperature dependence of the heat capacity, the shape of the electronic
density of states, and Ohm’s law. The free electron model fails in many aspects13
, but the most
important here is its failure to predict the presence of band gaps or insulating materials. This is
corrected by introducing perturbations which take into account the interactions between the
electrons and the periodic potential of the lattice – the nearly-free electron model14
. This works
well for ‘simple’ metals (non-correlated metals) and a wide range of other compounds containing
non-transition elements (e.g. silicon, as an important example), but fails in many transition metals
and transition metal oxides because the nearly free electron model does not take into account all

4
aspects of electron-electron correlations15
. A clear way to understand band structures in these
correlated electron systems is through the extension of molecular orbital theory.
Molecular orbital theory describes the formation of molecular orbitals from hybridized
atomic orbitals. That is, the atomic orbitals of individual atoms hybridize when forming a
molecule, and the resulting filled hybridized orbitals, the molecular orbitals, are lower in energy
than the individual atomic orbitals. The molecular orbitals can be determined via linear
combinations of the atomic orbital wavefunctions. This is shown schematically in Figure 2-1 for
a two hydrogen atoms forming an H2 molecule.
Figure 2-1. A depiction of molecular orbital theory for two hydrogen atoms bonding to form one
hydrogen molecule. The molecular orbital which is a sum of the individual wavefuctions is at a
lower energy than the individual wavefunctions. (Redrawn from 16
)

5
This idea can be extended to larger molecules, and in this way one can think of a solid as
essentially a giant molecule. The evolution from one individual atom with a singular orbital
energy toward a bulk solid with increasing numbers of molecular orbitals and, eventually, a band
of electronic states is shown in Figure 2-2.
Figure 2-2. A depiction of band formation from a molecular orbital perspective. The number of
atoms participating in bonding is shown on the bottom. The extreme case is shown on the right
where a very large number of atoms participate in bonding and enough molecular orbitals are
formed that a band of states develops. Redrawn from 17
A given band will be mainly derived from the formation of molecular orbitals from
specific atomic orbitals. In other words, a band will have a character of the atomic orbitals it is
made out of, such as the 3d band or 2p band. Only orbitals which are close in proximity will
hybridize, meaning that orbitals buried within the core of the atom will not hybridize, and so will
not participate in bonding.
The bandwidth, W, defined as the energy difference between the highest energy state and
lowest energy state in a band, increases with increasing orbital overlap. Because of the relatively
small radius of the wavefunction, d-electron systems in general have smaller overlap and
narrower bandwidths.18
6
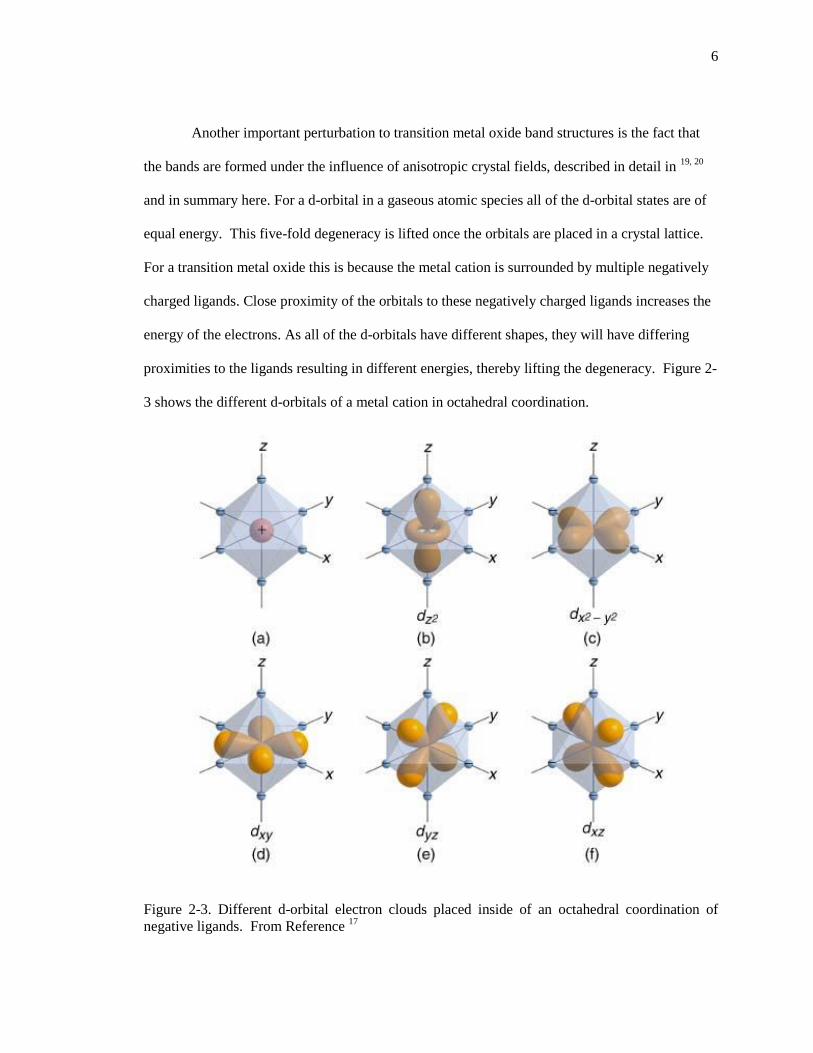
Another important perturbation to transition metal oxide band structures is the fact that
the bands are formed under the influence of anisotropic crystal fields, described in detail in 19, 20
and in summary here. For a d-orbital in a gaseous atomic species all of the d-orbital states are of
equal energy. This five-fold degeneracy is lifted once the orbitals are placed in a crystal lattice.
For a transition metal oxide this is because the metal cation is surrounded by multiple negatively
charged ligands. Close proximity of the orbitals to these negatively charged ligands increases the
energy of the electrons. As all of the d-orbitals have different shapes, they will have differing
proximities to the ligands resulting in different energies, thereby lifting the degeneracy. Figure 2-
3 shows the different d-orbitals of a metal cation in octahedral coordination.
Figure 2-3. Different d-orbital electron clouds placed inside of an octahedral coordination of
negative ligands. From Reference 17

7
For octahedral coordination, the orbitals with high electron density near the ligands are the 𝑑𝑧2
and 𝑑𝑥2−𝑦2 orbitals (Figure 2-3b and c), while the dxy, dyz and dxz orbitals (Figure 2-3d-f) point in-
between the negative ligands, resulting in lower energies. This causes an energy difference
between the orbitals of Δ as depicted in Figure 2-4. The value of Δ depends on the ligands, the
interatomic separation distances, and the geometry.
Figure 2-4. Crystal field splitting for octahedral coordination. Redrawn from 17
This energy splitting manifests itself in the band structure and can split the bands into multiple
sections, often labeled by their symmetric similarities, e.g. the – eg and t2g states in the case of
octahedral coordination.
Another affect that becomes important in transition metal oxide systems, and especially
systems with narrow bandwidths, are correlated electrons. Correlated electrons are electrons
which must alter their motion so as to avoid each other due to their mutual Coulombic repulsion.
For most purposes it is appropriate to use an approximation which neglects the repulsion of
electrons unless they are on the same atom. That is, the Coulombic repulsion of interest here is
between two electrons which occupy the same orbital. This repulsion manifests as an additional
energy required to place an electron in an orbital that is already occupied – similar to the idea of
Hund’s rule of maximum multiplicity. From a band structure perspective this takes a range of

8
electronic states made via an orbital and splits that density of states into two sections separated by
an energy U, referred to as the Hubbard U. Normally an electronic band has 2n electronic states
where n is the number of orbitals participating in the band formation, but in the case of a Hubbard
band only n electronic states are available and a nominally half-filled band will split into a lower
filled band and an upper unfilled band, referred to as the Lower Hubbard Band (LHB) and Upper
Hubbard Band (UHB), respectively. This means that a normally metallic conductor will become
an insulator with an activation energy equal to the gap between the LHB and UHB.15
2.1.2 Anderson Localization and Mobility Edges
Anderson localization, named after P. W. Anderson who first explained the
phenomenon21
, is associated with the localization of electrons in materials due to disorder. The
phenomenon has been shown to be quite general for wave physics and has been identified for
many disordered systems22, 23
, this discussion will be limited to the application of Anderson
localization to electronic band structures. This discussion is a combination of the discussions
from References 24–27
.
Consider a set of cations in an ionic solid with no disorder. This ordering means that all
of the cations have identical local structure and therefore their associated orbitals have identical
energies, including identical crystal field splitting. The cations are close enough in energy and
proximity so that the outermost orbitals slightly overlap and hybridize as described in 2.1.1 to
form a narrow band as shown in Figure 2-5.

9
Figure 2-5. Depiction of Anderson localization. (a) Energy wells in an ordered material hybridize
to give a parabolic density of states. (b) Energy wells in a disordered material where Anderson
localization produces localized states at the edge of the band. Electrons in localized states move
via hopping between localized sites, while electrons in extended states are delocalized. These
states are separated by the mobility edge. Modified from Ref. 19
If impurities are introduced into this perfectly ordered crystal, then the size and charge of
the impurity will have to be accommodated by the crystal. This occurs via strain and dielectric
displacement in the lattice. The cations around the impurity will have a local structure which
deviates from the perfect lattice and therefore the orbitals on these cations will have slightly
different energies and crystal field splittings. At large impurity concentrations, individual cations
may feel the influence from multiple impurities, and the energies of the orbitals will depend on
the summation of these multiple perturbations. As impurity density increases, the energy
landscape for these orbitals becomes more disordered with larger and sharper peaks and valleys.
Hybridization of orbitals can only occur when orbitals are close in proximity and in energy.
Orbitals which are heavily perturbed with no surrounding orbitals with similar energies cannot
hybridize to form a band, and therefore become localized. That is, once the peaks and valleys of
10
the energy landscape become too different in energy compared to their surroundings they will
have no surrounding cations to form bands with and will localize. The density of states is simply
the integration of this energy landscape over energy, and from this density of states perspective
the increasing disorder results in the broadening of the density of states as depicted in Figure 2-5.
The localized orbitals are located near the band edges and their localization is depicted by
shading in the density of states.
There exists an energy at which states switch from localized to delocalized. This is called
the mobility edge and is a sharp transition at an energy 𝐸𝑚. At low amounts of disorder,
localization will occur only at the band tails, but as disorder increases the mobility edge will
move inward toward the center of the band.
Electrons below the mobility edge will conduct via hopping conduction between the
localized states as described in 2.1.4. Electrons in energy states above the mobility edge will
conduct via band conduction and therefore will have much higher mobilities. If the Fermi
energy, 𝐸𝑓, is located below the mobility edge, Em, either in localized states or within a band gap,
electronic conduction is often controlled via activation of electrons to the mobility edge by28
:
𝜎 = 𝜎𝑚𝑖𝑛𝑒𝑥𝑝 (
−(𝐸𝑚 − 𝐸𝑓)
𝑘𝑏𝑇) (2.1)
where 𝜎𝑚𝑖𝑛 is the minimum metallic conductivity and depends on many factors including the
distance between impurities and the critical disorder needed for localization. A detailed
discussion of 𝜎𝑚𝑖𝑛 can be found in reference 28
. Often the Fermi energy may be pinned to the
location of the band edge, as in the case of impurity bands (discussed in 2.1.3). If this is the case,
then the activation energy will depend on the temperature dependence of the band gap, and 29
:
𝐸𝑚 − 𝐸𝑓 = 𝐸(0) − 𝛾𝑇 (2.2)
where

11
𝛾 =
𝑑𝐸𝑔
𝑑𝑇 (2.3)
and 𝐸𝑔 is the energy of the relevant band gap. An example of this behavior will be shown in
Chapter 4 (4.3).
2.1.3 Impurity Bands and the Transition to Metallic Conductivity
The same principal of overlapping orbitals leading to band formation discussed in 2.1.1
can be applied to donor or acceptor dopants. In heavily doped materials, the dopants can be close
enough in the lattice so their orbitals overlap and form an electronic band. This may seem odd as
2.1.1-3 discusses effects of decreased bandwidth due to the poor overlap of orbitals on ions only
a couple lattice sites apart. Unlike electrons in d-orbitals where the majority of the electron
density is relatively localized around the ion, the valence electrons of donors can often have large
effective radii because the electron of a donor can be screened from the donor ion via the
surrounding lattice.30
The radius of a spherical donor orbital is called the effective Bohr radius,
and is given by30
:
𝑎𝑒𝑓𝑓 = 𝑎𝑜
𝜀𝑟
𝑚∗ (2.4)
where 𝑎𝑒𝑓𝑓 is the effective Bohr radius, 𝑎𝑜 is the Bohr radius of hydrogen (53pm), 𝜀𝑟 is the
relative permittivity of the host, and 𝑚∗ is the effective mass of the electrons in the host.
Essentially, the effective Bohr radius corrects for the screening and changes to the electron
effective mass provided by the lattice.
The permittivity and effective mass in Equation (2.4) should be discussed in more detail
for ferroelectrics. The static dielectric constant is normally used for 𝜀𝑟 in Equation (2.4), but the
equation is most commonly used for materials where the static permittivity is synonymous with
the sum of the ionic and electronic portions.31
This may not true in ferroelectrics as the ‘static’

12
dielectric constant in a ferroelectric would include a contribution from dipolar rotation. The static
permittivity is, however, used to accurately calculate the effective Bohr radii in SrTiO3-δ 32
,
suggesting that the large ionic permittivity of ferroelectrics is the parameter of interest. This can
be obtained for ferroelectrics by using broadband dielectric spectroscopy to measure the
permittivity once the dipolar contribution has relaxed at high frequencies, e.g. Ref. 33
.
For a better understanding of how impurity bands affect electronic conduction, consider
the transition from an insulating material to a metallic conductor via an impurity band as a
function of carrier concentration, as depicted in Figure 2-6. This will be done for an n-type
material with an impurity which provides one ionizable electron.

13
Figure 2-6. Depiction of the transition from insulator to metal as a function of carrier
concentration. (a)-(e) are described in the text. Inspired by Ref. 19

14
At very dilute impurity concentrations, the impurities are far enough apart that interaction
between the different impurities can be ignored. Each impurity will behave independently and
will have a very sharp donor energy level (Figure 2-6a). As the impurity concentration increases,
the overlap of the donor valence electrons will lead to the formation of an impurity band below
the conduction band. Nominally this would be thought of as a half-filled band with the band
centered at the donor ionization energy (Figure 2-6b); however, Coulombic interaction between
the electrons leads to a Hubbard gap as discussed in 2.1.2. This results in one fully occupied LHB
and one unoccupied UHB with a separation of U (Figure 2-6c).
The magnitude of U is difficult to ascertain from first principals for electrons in d-
orbitals, although the ‘screened’ U can be calculated if under certain assumptions 34
. For
hydrogenetic orbitals, U can be estimated as 28
:
𝑈 =
5
8
𝑒2
𝜀 ∗ 𝑎𝑒𝑓𝑓 (2.5)
or
𝑈 = 𝜑 − 𝜉 (2.6)
where 𝜑 is the ionization potential and 𝜉 is the electron affinity. For donors 𝑎𝑒𝑓𝑓 is 30
𝑎𝑒𝑓𝑓 =
𝑒2
2𝜀𝐸𝑑 (2.7)
where Ed is the donor ionization energy. Comparing Equation (2.7) to Equation (2.5) shows that,
for hydrogenetic donor orbitals, the Hubbard U for impurity bands should be on the order of the
donor ionization energy. Since the center of the Hubbard bands is located at the donor ionization
energy and the UHB is located at roughly U/2 above this energy, the UHB should lay close to the
bottom of the conduction band as depicted in Figure 2-6c.
In Figure 2-6c the LHB is completely filled while the UHB is empty, resulting in a Fermi
energy lying between the two and, therefore, an insulating state. In this case electrical conduction

15
is thermally activated with an activation energy equal to the difference between the bottom of the
UHB and the top of the LHB. If Anderson localization is present, the activation energy would be
between the mobility edge and the top of the LHB.
As impurity concentration increases further, the density of states in both the UHB and
LHB increase and spread out. The band gap thereby shrinks and the activation energy for
electronic conduction decreases. Eventually the UHB and LHB overlap and the Fermi energy is
therefore located within electronic states. When the overlap first occurs the states are localized
via Anderson localization and therefore the activation energy for conduction continues to be the
difference between the mobility edge and the Fermi energy. Since the Fermi energy lies in
Anderson localized states, at low temperatures electrical conductivity will be via variable range
hopping and at intermediate temperatures conductivity will proceed via polaronic hopping.35
As
impurity concentration increases further again, the mobility edges will move toward the Fermi
energy and eventually the Fermi energy will be located in delocalized states as depicted in
Figure2-6e. Once this occurs, the material is a metal.
The insulator-to-metal transition is not abrupt, but is manifested as a decreasing
activation energy with increasing carrier concentration until the activation energy becomes zero.
For example, Figure 2-7 shows the transition from semiconducting to metallic behavior in
La1-xSrxVO3. As the strontium concentration increases, the activation energy drops until metallic
behavior occurs at x~0.2. 36

16
Figure 2-7. (a) Conductivity vs. temperature data and (b) activation energy for La1-xSrxVO3.
The activation energy at x~0.2 goes to zero, indicating metallic behavior. 36
The semiconducting to metallic transition, from (d) to (e) in Figure 2-6, can be predicted.
In theory, the transition should occur when the donor orbitals overlap a specified amount; this can
be estimated by comparing the effective Bohr radius, Equation (2.4), and the distance between
donors. Given a three dimensional lattice, the distance between impurities is proportional to the
cube root of the concentration37
:
𝑑 ∝ 𝑛1
3⁄ (2.8)
where 𝑑 is the distance between the donor ions, and 𝑛 is the concentration of donors per volume.
The necessary amount of orbital overlap was determined empirically and is denoted the ‘Mott
criterion’ for metallic conduction. It is given by28
:
0.26 ~ 𝑎𝑒𝑓𝑓𝑛1
3⁄ (2.9)
The universality of this law was shown by Edwards and Sienko 37
and their compiled dataset
along with a few additions from recent years is shown below:

17
Figure 2-8. The effective Bohr radius and the critical carrier concentration for metallic conduction
plotted for a variety of materials. The solid line represents the Mott Criterion, and is shown to fit
well for many materials. WO3-δ38
; SrTiO3-δ39, 40
; YBa2Cu3O7 and La2-xSrxCuO441
; all other points
from Ref. 37
Difficulties in putting more data points on Figure 2-8 are mainly associated with accurate
determination of the effective Bohr radii. For ferroelectric materials specifically, the
measurement of the correct relative permittivity can be a problem. That is, the correct relative
permittivity will not be the normally measured low frequency relative permittivity, but is more
likely the sum of the electronic and ionic contributions. This sum can be measured at high
frequencies where the dipolar rotation contribution to the permittivity has relaxed, but must be
below the relaxation frequency for phonons. This is sometimes possible with THz spectroscopy,
e.g. see Ref. 42

18
2.1.4 Polaronic Hopping
In ionic materials, electrons will often be localized by deformation of the surrounding
lattice caused by the charge carrier. Although materials with large carrier concentrations and
small band gaps are often controlled by band conduction as discussed in previous sections, at low
temperatures and at low carrier concentrations polaronic hopping may be of importance. This
section explains how polaron formation and hopping occur, along with ways to identify polaronic
hopping and its impact on electronic transport in oxides.
Consider an ionic material in which all of the ions are on their proper lattice sites but are
pinned so they may not move. Now consider the introduction of an ‘impurity’ electron placed
into the material. This electron is not necessarily associated with an ion as is commonly
portrayed (e.g. Ti3+
on a Ti4+
site), but is a free electron. In the surrounding area the neighboring
ions will feel a Coulombic force from this negatively charged impurity electron, but will not
move due to this force because they are pinned to their perfect lattice sites. If a test charge is
placed at a radius of distance 𝑟 away from the negatively charged ion, the potential energy, V,
which acts on the test charge would be31
:
𝑉(𝑟) =
𝑒2
𝜀∞𝑟 (2.10)
where 𝜀∞ is the high-frequency relative permittivity of the material. Only the electronic
polarizability is included in 𝜀∞ as ionic motion is frozen. Now if the ions are allowed to relax,
then the positive ions will move toward the negatively charged impurity electron and negative
ions will move away. A series of dipoles aligned radially around the impurity electron form.
Stabilization of the system in this way lowers the electron into a potential well, thereby stabilizing
this state. If Equation (2.10) is re-evaluated given the relaxed lattice then 𝜀𝑠, the static relative
permittivity, must be used instead of the high-frequency relative permittivity. The electron
therefore forms a potential well for itself given by:

19
𝑉(𝑟) =
𝑒2
𝑟(
1
𝜀∞−
1
𝜀𝑠) (2.11)
where 𝜀𝑠 is the static relative permittivity. Normal theory assumes 𝜀𝑠 includes only the
electronic and ionic portions of the permittivity, but, as discussed previously, this may be
modified for ferroelectrics. The presence of this potential well means that if the impurity electron
tries to move away from its current position, it will have to overcome the potential barrier
described by Equation (2.11). In materials with low ionicity, the dipoles formed during lattice
relaxation are small, the potential barrier is therefore small, and this scenario is best described by
an increased effective mass of the impurity electron. The impurity electron combined with the
resulting lattice deformation is known as a ‘polaron’. In the case presented where the potential
barrier is small, it is known as a ‘large polaron’31
. ‘Large’ here refers to spatial extent, since the
small ionicity requires a large distance to completely screen the negative impurity charge. If the
iconicity is large, then the potential well is large and the electron becomes trapped on the site. As
the electron itself is what causes the formation of the surrounding dipoles in the ionic lattice, it
has in essence ‘dug its own hole’ to form this trap. Since the electron is trapped to a single site
and the lattice deformation is small in spatial extent, this is known as a ‘small polaron’. Small
polaron formation is facilitated in materials with highly polarizable lattices and narrow
bandwidths. These trends can be understood as follows. In a small polaron, the localized
electron is stabilized by the ionic polarization by roughly the depth of the potential well of
Equation (2.11) which increases with increasing ionic permittivity. The stabilization energy
gained by an electron entering a band is the energy difference between the atomic orbital energy
and the energy of the electron at the bottom of the conduction band – roughly W/2, where W is
the bandwidth. Out of these two scenarios the one which lowers the energy of the electron the
most will occur. Therefore, highly ionizable lattices will push toward polaronic formation via the
increase in magnitude of Equation (2.11), and narrowing the bandwidth will push toward small

20
polaron formation as W/2 decreases.43
As ferroelectricity tends to occur in some highly
polarizable oxides, all references to polarons from here on in this thesis will refer to small
polarons. For more information on large polarons, an interested reader can refer to Ref. 44
.
Both the electron and the corresponding lattice deformation must move for movement of
the small polaron to occur. To better understand this, it is key to consider the timescale at which
electrons and lattices move. Electrons move at much faster speeds than ions, as is easily seen in
the different relaxation times for the electronic and ionic portions of the permittivity, for example.
From the perspective of timescales important to electron motion, the lattice is a static object (and
therefore the trapping potential, Equation (2.11), is static). From the perspective of timescales
important to lattice motion, the time-averaged position of the electron will be at the center of the
potential well. Movement of the small polaron is therefore not often facilitated by the electron
itself, but by deformations in the local lattice due to phonons or by excitement of the electron via
optical means.
The polaronic potential well can be perturbed by phonons in the material, some of which
will decrease the potential well to a degree where the electron can escape via thermal excitation.
This process is shown schematically in Figure 2-8, adapted from Ref. 44
.

21
Figure 2-9. Polaronic potential wells (a) before hopping (b) during adiabatic hopping (c) during
non-adiabatic hopping and (d) after hopping. After Reference 44
.
Figure 2-9a shows a schematic representation of an electron trapped in the polaronic
potential well. A transient phonon can perturb the lattice, thereby decreasing the polaronic
potential well and often creating a potential well on a neighboring site as depicted in Figure2-9bc.
The electron can therefore hop from one site to the other via thermal activation or tunneling. If
the length of time the transient phonon is located near the small polaron is long compared to the
length of time it takes for the electron to thermally activate into the neighboring potential well,
then the electron will hop between its current position and the neighboring site multiple times
before the transient phonon leaves, as depicted in Figure 2-9b.45
This condition is called the
adiabatic condition. If the activation energy between the two neighboring sites is large and the
electron only has time to hop into the neighboring potential well, but not back and forth multiple
times, then a nonadiabatic state is reached as is depicted in Figure 2-9c.45
If once the transient

22
phonon leaves the electron is located on a different lattice site, the full polaronic potential well
will reform around the electron as depicted in Figure 2-9d and electrical conduction has occurred.
The thermally activated electron mobility is a defining feature of small polaronic
conduction. Thus, the experimental procedures used to determine if small polaronic conduction
dominates (as opposed to band conduction) are aimed at determining if thermal activation in the
electrical conductivity is due to thermal activation of new electronic carriers or due to the thermal
activation of the mobility of those carriers.
The mobility of a small polaron is thermally activated and given by31
:
𝜇 =
𝐴
𝑇𝑛𝑒𝑥𝑝 (
−𝐸𝐻𝑜𝑝
𝑘𝑏𝑇) (2.12)
where n=1 or 3/2 for the adiabatic and non-adiabatic conditions, respectively. Wide band gap
materials, such as many oxides, have a temperature independent carrier concentration and
therefore the temperature dependence for electrical conductivity will follow the form of
Equations (2.12) or (2.13). In these cases, polaronic conduction can be determined via the
linearity of ln(𝜎𝑇) vs (𝑘𝑏𝑇)-1
plots. This temperature independent carrier concentration is also the
cause for the temperature-independent Seebeck coefficient as will be discussed in 2.4.2. In
materials with temperature dependent carrier concentrations, the identification of polaron
formation is more difficult. However, it can often be done by comparing the Seebeck coefficient
and electrical conductivity of a material. The activation energy for electronic conductivity, 𝐸𝜎, is
the summation of the activation energy for carrier creation and the activation energy polaron
mobility46
:
𝐸𝜎 = 𝐸𝑛 + 𝐸𝐻𝑜𝑝 (2.13)
where 𝐸𝜎 is the activation energy for electronic conductivity, 𝐸𝑛 is the activation energy for new
carriers (often the activation energy for donors or the band gap), and 𝐸𝐻𝑜𝑝 is the activation energy
for polaron mobility from Equation (2.12) . 𝐸𝑛 can be obtained from Equation (2.54) and
23
𝐸𝜎 from Equation (2.12), and any difference between the two is therefore associated with a finite
𝐸𝐻𝑜𝑝 and indicates small polaron formation.
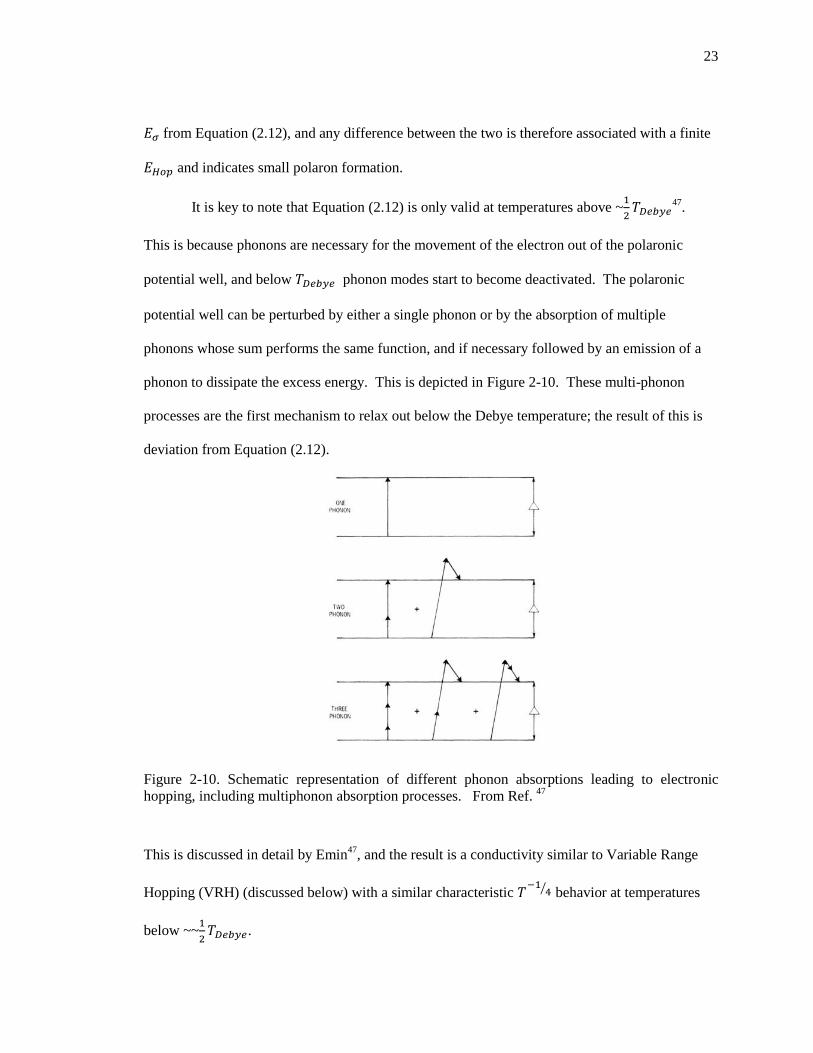
It is key to note that Equation (2.12) is only valid at temperatures above ~1
2𝑇𝐷𝑒𝑏𝑦𝑒
47.
This is because phonons are necessary for the movement of the electron out of the polaronic
potential well, and below 𝑇𝐷𝑒𝑏𝑦𝑒 phonon modes start to become deactivated. The polaronic
potential well can be perturbed by either a single phonon or by the absorption of multiple
phonons whose sum performs the same function, and if necessary followed by an emission of a
phonon to dissipate the excess energy. This is depicted in Figure 2-10. These multi-phonon
processes are the first mechanism to relax out below the Debye temperature; the result of this is
deviation from Equation (2.12).
Figure 2-10. Schematic representation of different phonon absorptions leading to electronic
hopping, including multiphonon absorption processes. From Ref. 47
This is discussed in detail by Emin47
, and the result is a conductivity similar to Variable Range
Hopping (VRH) (discussed below) with a similar characteristic 𝑇−1
4⁄ behavior at temperatures
below ~~1
2𝑇𝐷𝑒𝑏𝑦𝑒.

24
Variable Range Hopping (VRH) is another important mechanism via which localized
electron transport occurs. As opposed to traditional hopping conduction, where an electron will
hop to the nearest neighbor site, hopping will occur over a variety of ranges in VRH. The
envelope of the wavefunction for an electron in disordered states decays over some distance.
Within that distance multiple sites may be available for hopping, but sites closer in distance and
closer in energy are more favorable.48
In a disordered material, the sites which are spatially close
are not necessarily energetically similar, and therefore electrons may hop to a site that is further
away but energetically similar, as depicted in Figure 2-11.
Figure 2-11. Schematic representation of Variable Range Hopping (VRH) compared to nearest
neighbor hopping (EHop). All states below the mobility edge, Em, are localized, as depicted by
shading. After Ref. 49
Due to the temperature dependence of the average hopping distance, the temperature dependence
for this type of behavior follows50
:
𝜎 = 𝐴𝑒𝑥𝑝 (−𝑇𝑜𝑇−1
4⁄ ) (2.14)
where A and To are constants.
2.2 Thermal Conductivity
The main mechanisms of thermal transport in dense materials are transport via electrons,
phonons, or photons. Thermoelectrics are necessarily electrical conductors, typically making

25
them opaque, which limits the mean free path of photons. The total thermal conductivity can
therefore be broken down as:
𝜅 = 𝜅𝑙 + 𝜅𝑒 (2.15)
where 𝜅 is the thermal conductivity, 𝜅𝑙 is the lattice thermal conductivity (phononic transport),
and 𝜅𝑒 is electronic portion of the thermal conductivity. When designing a thermoelectric, it is
imperative to have enough electronic carriers to sustain a large power factor and therefore the
electronic portion of thermal conductivity is necessary, but the lattice portion of thermal
conductivity should be minimized.
To better understand thermal conductivity, it is instructive to derive the equation for
thermal transport due to a set of particles and then consider the different cases for particles –
electrons and phonons. The derivation presented here is taken from reference 51
. First, consider a
gas where the temperature is a function of distance x so that T=T(x). Now consider a plane in this
volume at a constant 𝑥𝑝. The mechanism of heat transport will be via the movement of molecules
across this plane. If 𝑑𝑇
𝑑𝑥> 0 at this plane, then heat will travel in the direction of x, because the
net energy of molecules crossing x in the positive direction is larger than the net energy of
molecules crossing x in the negative direction. If a volume contains 𝜂 molecules per unit volume
(𝜂 is used so as not to confuse the value here with the electronic carrier concentration, 𝑛, although
these will be an equivalent quantity when electronic thermal conductivity is discussed), then
roughly one third of the molecules will have a velocity in the x direction as opposed to z or y.
Roughly half of those will have a velocity in the +x direction as opposed to the –x direction.
Therefore 1/6th of the molecules will be crossing the plane in the +x direction at any time.
Quantitatively, the number crossing the plane at 𝑥𝑝 will be 1
6𝜂𝑣 where 𝑣 is the mean speed of the
molecules. Since the temperature is a function of 𝑥, the energy of the molecule last equilibrated
at 𝑥 will have an energy 𝐸 = 𝐸(𝑥). The energy of a molecule crossing this plane will therefore be

26
determined by the location 𝑥 of the previous collision of the molecule. Molecules crossing the
plane have had a previous collision within one mean free path of the plane, and this means that
molecules crossing the plane at 𝑥𝑝 will have an energy 𝐸 = 𝐸(𝑥𝑝 ± 𝑙) where 𝑙 is the mean free
path of the molecules. The net flux of energy over the plane at 𝑥𝑝, 𝐽𝑥, is therefore
𝐽𝑥 =1
6𝜂𝑣(𝐸(𝑥𝑝 − 𝑙) + 𝐸(𝑥𝑝 + 𝑙))=(𝐸(𝑥𝑝 − 𝑙) + 𝐸(𝑥𝑝 + 𝑙)) =
1
6𝜂𝑣((𝐸(𝑥) − 𝑙
𝑑𝐸
𝑑𝑥) − (𝐸(𝑥) − 𝑙
𝑑𝐸
𝑑𝑥))
(2.16)
and
𝐽𝑥 =
1
6𝜂𝑣 (−2𝑙
𝑑𝐸
𝑑𝑥) = −
1
3𝜂𝑣𝑙
𝑑𝐸
𝑑𝑇
𝑑𝑇
𝑑𝑥 (2.17)
since 𝐶𝜂 = 𝑑𝐸
𝑑𝑇 where 𝐶𝜂 is the specific heat per molecule. Equation (2.17) can be compared to
the definition of thermal conductivity:
𝐽𝑥 = −𝜅
𝑑𝑇
𝑑𝑥 (2.18)
from which the thermal conductivity of a dilute gas is:
𝜅 =
1
3𝐶𝜂𝜂𝑣𝑙 (2.19)
This formalism works well not only for thermal conductivity of gases but other particles
or quasi-particles such as electrons and phonons. One simply has to switch out the heat capacity,
number density, speed, and mean free path of the gas molecules with the equivalent values for
electrons or phonons. Working through this formalism, it is also easy to grasp the different ways
to control thermal conductivity, namely by engineering the different variables in Equation (2.19).

27
2.2.1 Electronic Thermal Conductivity
Electronic thermal conductivity is the portion of thermal conductivity which is
transported via electrons. To determine the magnitude of heat transported via electrons, Equation
(2.19) can be evaluated assuming the free electron model. In this case52
:
𝑣 = 𝑣𝑓 (2.20)
ʆ = 𝑣𝑓 ∗ 𝜏 (2.21)
and
𝐶𝜂 ∗ 𝜂 = 𝜋2𝑁𝑒𝑘𝑏
2𝑇
𝑚∗𝑣𝑓2 (2.22)
where 𝑣𝑓 is the Fermi velocity, ʆ is the mean free path of electrons, 𝜏 is the mean free time
between scattering events, and Ne is the density of states.
Plugging the above equations into (2.19), the electronic portion of the thermal
conductivity, 𝜅𝑒, is found to be53
:
𝜅𝑒 =
1
2𝑣𝑓
2𝜏𝜋2𝑁𝑒𝑘𝑏2
𝑇
𝑚∗𝑣𝑓2
= 𝜋2
3𝑘𝑏
2𝜏𝑛𝑇
𝑚∗ (2.23)
Using the Drude formula54
𝜎 =
𝑛𝜏𝑒2
𝑚∗ (2.24)
to substitute the electrical conductivity into Equation (2.23), yields:
𝑘𝑒
𝜎𝑇=
𝜋2
3
𝑘𝑏2
𝑒2≡ 𝐿 (2.25)
where L is the Lorenz Number, 2.44x10⁻⁸
𝑉2
𝐾2. This relation between the electrical conductivity
and thermal conductivity is called the Weidmann-Franz Law and works well for a wide variety of
metals.

28
The Wiedemann-Franz law is very useful for metals, but breaks down if the free electron
model is not applicable, as in the case in correlated metals or in nondegenerate electron gasses.
Additionally, the Wiedemann-Franz law assumes that the relaxation times 𝜏 in (2.23) and (2.24)
are identical, which is only true if electrons undergo elastic scattering events, and at low
temperatures, inelastic scattering will occur and the Wiedemann-Franz law will be inapplicable.55
Modification of the Wiedemann-Franz law has been determined for many cases, such as the
previously mentioned nondegenerate gas example. The modification comes in the form of a
modified Lorenz Number. Given parabolic bands, equalization of relaxation time for electrons
and holes, and an energy dependent relaxation time proportional to 𝐸𝛼 where 𝛼 is a constant, it
can be found that 56
:
𝑘𝑒
𝜎𝑇=
𝑘𝑏2
𝑒2((
5
2+ 𝛼) + (5 + 2𝛼 +
𝐸𝑔
𝑘𝑏𝑇)
2 𝑛𝑒𝜇𝑒𝑛ℎ𝜇ℎ
(𝑛𝑒𝜇𝑒 + 𝑛ℎ𝜇ℎ)2) (2.26)
where 𝑛𝑒,𝑝 and 𝜇𝑒,ℎ are the carrier concentration and mobilities for electrons (e) and holes (p),
respectively. Obviously, different modifications to L are necessary given different assumptions.
For thermoelectric materials, it is important to note that a deviation from this treatment exists due
to the Seebeck effect. Electrons will flow due to the thermal gradient and modify the Lorenz
number. Using the Boltzmann transport equation it can be found 56
that:
𝐿′ = 𝐿 − 𝑆2 (2.27)
where 𝐿’ is the modified Lorenz number, 𝐿 is the Lorenz number from Equation (2.25), and 𝑆 is
the Seebeck coefficient. In metals this is often inconsequential, since the Seebeck coefficient in
metals is often only a few 𝜇V/K57
making the square of the Seebeck coefficient roughly three
orders of magnitude smaller than the Lorenz number (e.g. for Ag at 300K; 𝑆2 = 3.8𝑥10−12 𝑉2
𝐾2 ≪
2.44x10⁻⁸ 𝑉2
𝐾2 = 𝐿), but for thermoelectric materials with larger Seebeck coefficients, the
modification can become significant.

29
2.2.2 Lattice Thermal Conductivity
Thermal energy can be transported via quantized lattice vibrations known as phonons.
Similar to the electronic thermal conductivity, the phonon thermal conductivity can be
determined by using the thermal conductivity for a dilute gas and inserting the relevant equations
for the individual variables.
To begin, a basic overview of the necessary phonon physics is helpful. The relevant
derivations for the dispersion relation can be found in solid state physics texts such as those by
Kittel 30
or Ashcroft and Mermin 12
. A schematic dispersion relation for a one dimensional solid
with two masses per primitive basis is in Figure 2-12, where the vertical axis is the angular
frequency 𝜔 and the horizontal axis is the wavevector:
Figure 2-12. Schematic dispersion relation for optical and acoustic phonon branches for a
diatomic linear lattice. The lattice parameter is a. The number of branches will increase for 3D
materials and for materials with increased number of ions per primitive basis. See Ref 58
for more.
It can be seen that multiple solutions for the dispersion relation are found, each associated
with a different type of vibration of the lattice. These different solutions, called ‘branches’ of the

30
dispersion relation, are subdivided into acoustic and optic types as well as transverse and
longitudinal types. Acoustic phonons are phonons where all ions vibrate in phase with each
other, while optical phonons occur when cations and anions vibrate out of phase with one
another. Transverse phonons vibrate transverse to the propagation direction, while longitudinal
phonons vibrate along the propagation axis. All materials have 3 acoustic branches – one
associated with vibration along the propagation axis and two for the two orthogonal directions –
and 3𝑛 − 3 optical branches exist where 𝑛 is the number of ions per primitive unit cell58
.
The important velocity parameter for thermal conductivity is the group velocity of a
phonon, defined as59
:
𝑣𝑔 ≡
𝜕𝜔
𝜕𝐾 (2.28)
Comparison with Figure 2-12 shows that 𝑣𝑔 is the slope of the dispersion relation. From a
perspective of engineering thermal conductivity, the phonon dispersion relation is determined via
the ionic masses and bond strengths. This means the group velocity is not easily changed within a
given composition. Large ions and weak bond strengths tend to lower 𝑣𝑔 while small ions with
strong bond strengths tend to raise 𝑣𝑔. It is clear from Figure 2-12 that 𝑣𝑔 can vary drastically as
a function of phonon branch and K. In general, acoustic phonons have a much larger group
velocity than optical phonons due to the relatively dispersionless nature of the optical phonons,
which results in a low group velocity. This is not to say that optical phonons do not affect the
thermal conductivity. The group velocity for optical phonons is finite and therefore they
contribute to the thermal conductivity, but to a smaller degree. Optical phonons also may also
attenuate the heat flux of acoustic phonons under certain circumstances. For example, materials
such as the skutterudies and clathrates often have optical phonon branches with energies similar
to acoustic branches. 60, 61
The similarity in energy between the branches causes scattering of the
acoustic branches by the optical phonons, thereby decreasing the mean free path of the acoustic
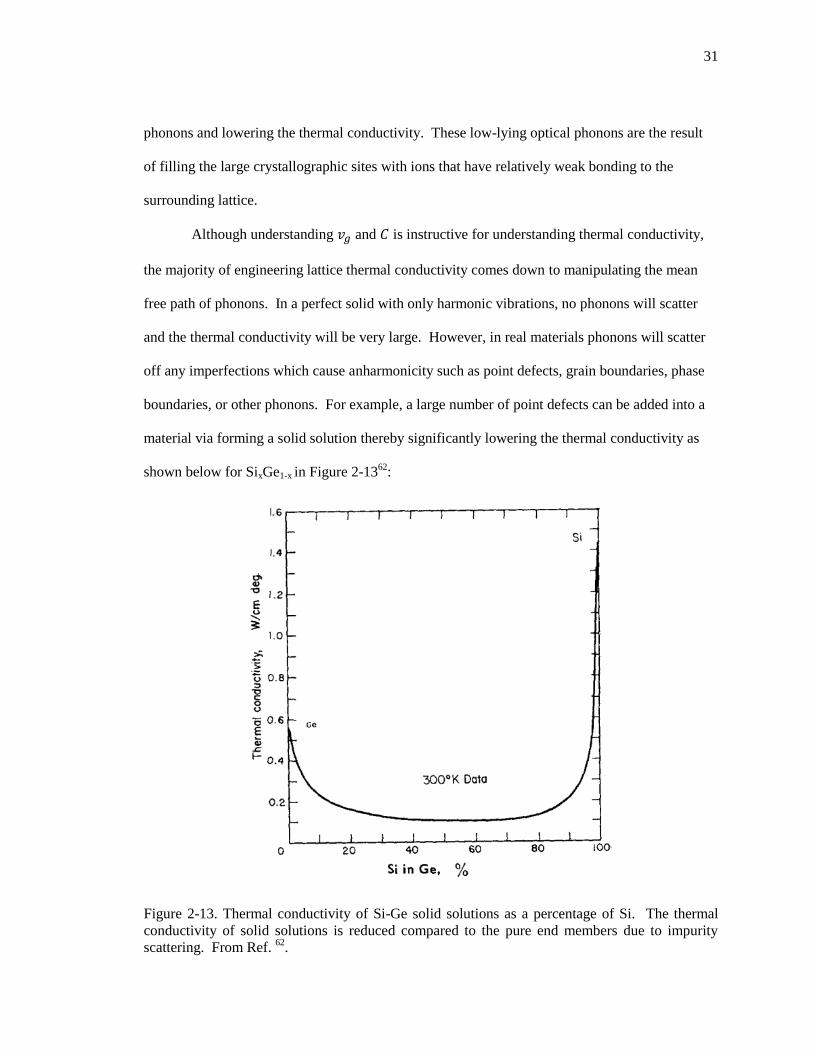
31
phonons and lowering the thermal conductivity. These low-lying optical phonons are the result
of filling the large crystallographic sites with ions that have relatively weak bonding to the
surrounding lattice.
Although understanding 𝑣𝑔 and 𝐶 is instructive for understanding thermal conductivity,
the majority of engineering lattice thermal conductivity comes down to manipulating the mean
free path of phonons. In a perfect solid with only harmonic vibrations, no phonons will scatter
and the thermal conductivity will be very large. However, in real materials phonons will scatter
off any imperfections which cause anharmonicity such as point defects, grain boundaries, phase
boundaries, or other phonons. For example, a large number of point defects can be added into a
material via forming a solid solution thereby significantly lowering the thermal conductivity as
shown below for SixGe1-x in Figure 2-1362
:
Figure 2-13. Thermal conductivity of Si-Ge solid solutions as a percentage of Si. The thermal
conductivity of solid solutions is reduced compared to the pure end members due to impurity
scattering. From Ref. 62
.

32
Solid solution creation is a very common technique used to lower the lattice thermal conductivity
in thermoelectrics. Other ways to lower the mean free path are by using grain boundaries (e.g.
nanograined materials), making amorphous materials, or lowering the mean free path via
boundary scattering as is done in nanowires or thin film thermoelectrics. Examples are shown in
Figure 2-14 which presents the thermal conductivity of various types of bulk and nanostructured
silicon 63
.
Figure 2-14. Thermal conductivity of various types of bulk and nanostructured silicon.
From Ref. 63
.
Structural defects tend to dominate thermal conductivity at low temperatures, but as
temperatures increase, higher energy phonons become activated and this results in an increase in
phonon-phonon scattering. This increasing phonon-phonon scattering acts to decrease the mean

33
free path of phonons as temperature increases, thereby decreasing the thermal conductivity. This
results in the ‘1/T law’ which states that the thermal conductivity of materials in the temperature
regime where phonon-phonon scattering is dominant will show 𝑘 ∝ 1𝑇⁄ 64
. Most relatively pure
materials will show this dependence. Exceptions include glasses, where the mean free path is
limited by the structure and not by phonon-phonon scattering (For example, see the ‘Amorphous’
and ‘Si-Ge’ data in Figure 2-14).
The final values for inserting into the dilute gas formula are the heat capacity of the
phonon gas, 𝐶𝜂 ∗ 𝜂. The heat capacity of the lattice is given by the Debye and Einstein relations,
as discussed in many basic solid state physics and thermodynamics texts. 30, 65
The Einstein model
gives that the heat capacity, 𝐶𝑣, for a system of 𝑁 oscillators oscillating at frequency 𝜔 is given
by66
:
𝐶𝑣 = 3𝑁𝑘𝑏 (
ℏ𝜔
𝑘𝑏𝑇)
2 exp (ℏ𝜔 𝑘𝑏𝑇)⁄
(exp (ℏ𝜔 𝑘𝑏𝑇)⁄ − 1)2
(2.29)
At high temperatures this function extends to a limit of 3𝑁𝑘𝑏 - known as the Dulong-Petit value.
This holds true for compounds as long as N is the number of oscillators per formula unit. A plot
of heat capacity for multiple oxides is given in Figure 2-15. Note the heat capacity is in units of
J g-atom-1
°C-1.

34
Figure 2-15. Heat Capacity of some ceramics as a function of temperature. From Ref 67
.
Most of the heat capacity increase happens before the Debye temperature, θD, which is
material dependent and depends on the bond strength, elastic constants, and melting point of the
material67
. The heat capacity can also change abruptly at phase transitions, e.g. in BaTiO368
,
although changes to the structure above and below the transition do not tend to matter a great deal
as the number of atoms per formula unit remains constant.
2.2.3 Effects of Ferroelectricity on Lattice Thermal Conductivity
Again it is helpful to start with the phonon dispersion relation. This is because displacive
phase transitions occur via the softening of phonon branches.69
This means that a phonon branch
decreases in frequency as temperature decreases until the frequency reaches zero, at which time
the structure of that phonon is frozen into the lattice. Ferroelectricity specifically is the softening
of an optical phonon branch near the Brillouin zone center where the cations and anions are
vibrating with an infinite wavelength. This means that when the optical branch reaches zero

35
frequency, the cations and anions associated with the phonon will freeze with displacements
relative to each other, resulting in a dipole. This is shown schematically in Figure 2-16.
Figure 2-16. Schematic representation of the softening of the transverse optic phonon mode
responsible for ferroelectricity in displacive ferroelectrics. Adapted from Ref. 32
.
During this process, the optical phonon branch increases in slope, and therefore the group
velocity is increased. This introduces an additional branch with a significant group velocity on
top of the three acoustic phonon branches. Additionally, the now low-lying optic phonon branch
should interact with the acoustic phonon branches, although little research has been done on
consequences of this interaction with respect to thermal conductivity. However, acoustic
measurements show interactions between the low-lying optic mode and the acoustic modes via
changes in the sound velocity near the transition temperature70
.
These two competing processes, the interaction with the acoustic phonon branch and the
introduction of an additional branch with a large group velocity act in opposite ways - the former
to decrease the thermal conductivity and the latter to increase it. The net result is that changes in
36
the thermal conductivity are found at the transition temperature in multiple ferroelectrics, but the
changes are typically ~30% of the thermal conductivity or less in materials investigated so far 71
.
The thermal conductivity can also be modified via changes to the mean free path of
phonons by the introduction of scattering interfaces. Ferroelectric domain walls can act as
scattering interfaces. This was beautifully shown by Weilert et al. using phonon focusing
experiments8. The phonon focusing experiments were qualitatively consistent with the expected
results calculated via acoustic mismatch theory (see Ref. 72
). This shows that scattering depends
on the phonon mode, polarization, and direction of propagation as well as the symmetry change at
the domain wall. Additionally, Ihlefeld et al. measured the thermal conductivity of a
ferroelectric thin film while using an electric field to tune the density of domain walls.7 It was
shown that the thermal conductivity could be modulated via the application of the electric field;
the effect was small, with only a change of ~15%. It may be that the larger domain wall
mobilities in bulk materials would show a larger effect, but this is yet to be determined. These
studies suggest that a large number of domain walls as well as a variety of different orientations
of domain walls are necessary to lower the thermal conductivity.
A large number of boundaries around polar clusters occur in relaxor ferroelectric
materials, and in fact many relaxor ferroelectrics show low and glasslike thermal conductivities,
as seen in Figure 2-1732
.

37
Figure 2-17. Thermal conductivity of multiple relaxor ferroelectrics compared to amorphous
SiO2. Figure taken from Ref. 32
The detailed mechanism of scattering of phonons off of nanosized polar regions is up for debate,
but possibilities include scattering by localized phonon modes 73–75
, and scattering due to a
boundaries related to the polarization similar to Ref. 7, 8
.
One of the key goals of this research is to try to utilize the fact that relaxor ferroelectrics
have low thermal conductivities to engineer thermoelectrics. A glasslike thermal conductivity is
a good starting point in the design of a thermoelectric, as long as adequate doping can be
achieved to reach desirable electrical carrier concentrations and the mobility of the carriers is high
enough so that the power factor can be adequately large.
The route of increasing thermoelectric figure of merit by decreasing the thermal
conductivity via ferroelectric boundaries does have one major downside - it can only be done in
ferroelectrics. Ferroelectrics tend to be insulators with d0 electron configurations
76. Additionally,
ferroelectricity tends to occur in highly polarizable lattices, and this means that the mobility of

38
any created charge carriers will be relatively low, and the power factor will therefore suffer.
Some materials related to ferroelectrics, however, show high mobilities, including Nd:SrTiO377
,
suggesting that high-mobility materials can be made despite the large polarizability of the host
lattices.
2.3 Ferroelectricity
The most common definition of a ferroelectric is a material which has a spontaneous
electric polarization that is switchable between multiple symmetrically equivalent sites using an
external electric field.78
Ferroelectrics contain a ‘spontaneous polarization’, or a polarization which forms without
an applied electric field. From a symmetry perspective, 10 out of 32 possible point groups have a
polar axis (a spontaneous polarization). All ferroelectric materials fit within these 10 polar point
groups, but to classify as a ferroelectric, the spontaneous polarization must be switchable by an
external electric field.
Figure 2-18. A ferroelectric hysteresis loop (left) and the associated domain structures at different
locations on the loop (right). From Reference 78
.

39
Inside of a crystal or grain, regions where the polarization of all unit cells is oriented
along the same direction, form. These volumes are called domains. The walls between domains
are coherent interfaces and therefore stress or charge can build up at domain walls. The strain
and charge at domain walls is important to the following work for a few reasons. First, mismatch
in the acoustic properties over domain walls can act as a scattering mechanism for phonons7, 8
.
Secondly, charged domain walls tend to be unstable in insulating ferroelectrics due to the
required buildup of opposing electric fields79
, but in conducting ferroelectrics, the inability to
easily form charged domain walls may be lifted due to screening. For thoroughness it should be
noted that charged domain walls can exist in insulating ferroelectrics 80, 81
, and interesting
properties have been found associated with them – but that is outside of the scope of this thesis.
2.3.1 Relaxor Ferroelectrics
Relaxor ferroelectrics are a subset of ferroelectrics. Relaxor ferroelectrics have nanoscale
polar regions as opposed to the more macroscopic domain sizes of normal ferroelectrics82
. The
precise nature of these polar nanoregions (PNR) is debated, and the answer is likely different for
different materials, but chemical inhomogeneity, chemical disorder, and phononic breather modes
have all been proposed83, 84
. The important point to this work is that the PNR are much smaller
and, therefore, higher in number density, compared to macroscopic domains.
Relaxor ferroelectrics do not exhibit a sharp paraelectric-ferroelectric phase transition.
Instead, the net polarization slowly increases on cooling. The permittivity is highly frequency
dependent.

40
Figure 2-19. Comparison of the temperature dependence of the spontaneous polarization for a
normal (left) and relaxor (right) ferroelectric. Note that many normal ferroelectrics such as
BaTiO3 may have residual ferroelectricity above the Curie temperature.
Figure 2-19 schematically shows the polarization as a function of temperature for normal and
relaxor ferroelectrics. Unlike the abrupt development of a spontaneous polarization directly below
the Curie temperature in normal ferroelectrics, the polarization in relaxors forms over a wide
temperature range (sometimes multiple hundreds of degrees). The polarization exists well above
the temperature of the maximum dielectric constant and is present up until the Burns temperature,
TBurns, above which the polarization is zero82
.
2.4 Thermoelectrics
2.4.1 Thermoelectric Effects and Devices
A basic thermoelectric circuit is shown in Figure 2-20. It consists of two conductors, a
and b, which make two junctions, A and B. In practice a is a sample under measurement while b
is the material of the lead wires.

41
Figure 2-20. A basic thermoelectric circuit
.
The behavior of this circuit will depend on the thermoelectric characteristics of a and b, namely
due to the Seebeck effect, Peltier effect, and Thompson effect85
. The magnitude of these effects
are understood through the Seebeck coefficient (or thermopower), 𝑆, the Peltier coefficient, 𝛱,
and the Thompson coefficient, 𝜏, respectively. The result of each effect on the circuit in Figure 2-
20 will be discussed below. A materials physics description of the different effects will be given
in 2.4.2, but the discussion here will focus mainly on the basics of thermoelectricity and
definitions. The discussion follows those of Ref. 85–88
If a temperature difference is created between A and B then a voltage difference, V, will
be generated between the two segments of b. This voltage is called the Seebeck voltage and its
magnitude is determined by the Seebeck coefficient for the circuit, 𝑆𝑎𝑏. The size of the Seebeck
voltage given a set temperature gradient is:
𝑆𝑎𝑏 = 𝑆𝑎 − 𝑆𝑏 =
𝑉
∆𝑇 (2.30)
where 𝑆𝑎 and 𝑆𝑏 are the absolute Seebeck coefficients for materials a and b, respectively. The
sign for 𝑆𝑎𝑏 is positive if current flows along the temperature gradient. That is, if A is at a higher

42
temperature than B, then current would flow from A to B. In semiconductors, the sign of the
majority carrier’s charge is the sign of the Seebeck coefficient. To obtain the absolute Seebeck
coefficient of the sample, 𝑆𝑎, the contribution from the lead wires must be subtracted out from the
complete circuit measurement (𝑆𝑎 = 𝑆𝑏 − 𝑆𝑎𝑏). The Seebeck coefficient is useful in
understanding electron transport in materials and an in depth discussion is given in 2.4.2.
If focus is now given to a junction, say junction A, it is clear the current over the junction
must be continuous, but the heat carried per electron in materials a and b may be dissimilar. If so,
when current flows through the junction, heat must be dissipated or absorbed as a consequence.
This is known as the Peltier Effect. In reference to the circuit in Figure 2-20, if a clockwise
current, i, is imposed and heat is output at A and absorbed at B, then the junctions have a positive
Peltier coefficient. The power exchanged at the junction A is:
𝑃 = 𝛱𝑎𝑏𝑖 = (𝛱𝑎 − 𝛱𝑏)𝑖 (2.31)
where 𝑃 is the heat exchanged per unit time, i is the current over the junction (from a to b), 𝛱𝑎
and 𝛱𝑏 are the absolute Peltier coefficients for materials a and b, respectively, and 𝛱𝑎𝑏 is the
Peltier coefficient of the junction. The absolute Peltier coefficient of a material can be
understood as the heat carried per electron in that material.
The final thermoelectric effect, the Thompson effect, occurs when current flows through
a single conductor which is subject to a temperature gradient. The power generated is then
generated equal to:
𝑃 = 𝛽𝑖∆𝑇 (2.32)
where 𝛽 is the Thompson coefficient. A heat is generated from the current flow due to the
temperature dependence of the Seebeck coefficient. This can be thought of as a continuous
version of the Peltier effect. Although the Thompson coefficient is not pertinent to most
thermoelectric devices, it should not be ignored in rigorous calculations.

43
The three thermoelectric effects are quite similar to one another in that they deal with the
thermoelectric values of the electronic carriers in materials. Thermodynamics relates the three
coefficients via the Thompson relations. The first and second Thompson relations are, in order:
𝛽𝑎 − 𝛽𝑏 = 𝑇
𝑑𝑆𝑎𝑏
𝑑𝑇 (2.33)
and
𝛱𝑎𝑏 = 𝑆𝑎𝑏𝑇 (2.34)
The second Thompson relation shows the link between thermoelectric cooling (Πab) and
thermoelectric power generation (Sab).
Important to this work is the Figure of Merit for thermoelectric power generation. A
derivation of this figure of merit based on the device efficiency of thermoelectric power
generators follows, after Ref. 89, 90
. The device efficiency, 𝜑, of a thermoelectric generator is
given by the energy supplied to the electrical load over the heat energy absorbed at the hot
junction:
𝜑 =
𝐸𝑛𝑒𝑟𝑔𝑦 𝑠𝑢𝑝𝑝𝑙𝑖𝑒𝑑 𝑡𝑜 𝑡ℎ𝑒 𝑙𝑜𝑎𝑑
𝐻𝑒𝑎𝑡 𝑒𝑛𝑒𝑟𝑔𝑦 𝑎𝑏𝑠𝑜𝑟𝑏𝑒𝑑 𝑎𝑡 𝑡ℎ𝑒 ℎ𝑜𝑡 𝑗𝑢𝑛𝑐𝑡𝑖𝑜𝑛
(2.35)
If the Seebeck coefficient, Peltier coefficient, and the thermal conductivity, κ, are temperature
independent (since 𝑑𝑆𝑎𝑏
𝑑𝑇=0 the Thompson coefficient will be zero), and the contact resistances at
the junctions are negligible compared to the resistances of the thermoelectric legs, then to
determine the heat absorbed at the hot junction three effects must be considered. First, the Peltier
heat absorbed at the hot junction, secondly, part of the Joule heat generated in the elements will
be created at the hot junction, and finally heat will be conducted away from the hot junction via
thermal conduction. Equation (2.35) can be then expressed as:
44
𝜑 =
𝑖2𝑅𝐿𝑜𝑎𝑑
𝑆𝑎𝑏𝑖𝑇𝐻 + 𝐾(𝑇𝐻 − 𝑇𝑐) −12
𝑖2𝑅 (2.36)
where 𝑅𝐿𝑜𝑎𝑑 is the resistance of the load, R is the resistance of the thermocouple legs, K is the
thermal conductance of the legs, and the Peltier coefficient has been expressed as 𝑆𝑎𝑏𝑇𝐻.
Equation (2.36) can be maximized with respect to R and K by changing the dimensions of the
thermoelectric elements, and the maximum efficiency becomes:
𝜑𝑚𝑎𝑥 =
𝑇𝐻 − 𝑇𝑐
𝑇𝐻
√1 + 𝑧𝑐�̅� − 1
√1 + 𝑧𝑐�̅� +𝑇𝐶𝑇𝐻
(2.37)
where �̅� is the mean average between 𝑇𝐶 and 𝑇𝐻 and 𝑧𝑐 is the figure of merit of the couple given
by:
𝑧𝑐 =
𝑆𝑎𝑏2
[(𝜅𝑎𝜎𝑎
)
12
+ (𝜅𝑏𝜎𝑏
)
12
]
2 (2.38)
If the thermoelectric properties of the n-type and p-type materials are similar in magnitude, then
the couple figure of merit becomes roughly the average of the two material’s figures of merit. In
this case, it becomes practical to optimize their properties using the figure of merit for a single
material:
𝑧𝑇 =
𝑆2𝜎
𝜅𝑇 (2.39)
where 𝑆2𝜎 is referred to as the power factor. The figure of merit, z, has units of inverse Kelvin so
Equation (2.39) uses the more common dimensionless figure of merit, zT.
In order to maximize thermoelectric performance, the figure of merit should be
maximized. From the aspect of the three parameters in Equation (2.39) this can be formulated as a
function of carrier concentration. With increasing carrier concentration, the electrical and thermal
conductivity increase and the Seebeck coefficient tends to decrease, resulting in a set of

45
conflicting optimization parameters and a maximum zT as a function of n, as shown in Figure 2-
2191
.
Figure 2-21. Changes in electrical conductivity, thermal conductivity, Seebeck coefficient, power
factor, and figure of merit as a function of carrier concentration. The Seebeck coefficient
decreases with increasing carrier concentration while the thermal and electrical conductivity
increase. This creates a maximum power factor and figure of merit as a function of carrier
concentration. Redrawn from Ref. 91
The best thermoelectrics tend to have carrier concentrations ~1019
-1021
cm-3
.91
Due to low
electron mobilities, oxide thermoelectrics often have a maximum 𝑧 at higher electron
concentrations. The thermal conductivity can be split into the electronic and lattice portions of
thermal conductivity, 𝜅𝑒 and 𝜅𝑙 as shown in Figure 2-22.

46
Figure 2-22. Electrical and lattice thermal conductivity as a function of carrier concentration.
The lattice portion of the thermal conductivity is normally assumed to be dopant concentration
independent, but dopants which are used to change the carrier concentration can act as scattering
sites, so this isn’t necessarily always the case.63
Using the Wiedemann-Franz law (Equation
(2.25)), the figure of merit can be written as:
𝑧𝑇 =
𝑆2
𝐿 (1 +𝜅𝑙𝜅𝑒
) (2.40)
where L is the Lorenz number. Equation (2.40) clearly shows that minimizing the lattice thermal
conductivity is important for optimizing zT.
2.4.2 Material Physics of Thermopower
When a temperature gradient is applied to a material, the electron distribution as a
function of energy spreads out. The total electron density remains essentially uniform, but the hot
end of the material has a higher density of high-energy electrons and the cold end has a higher
density of low-energy electrons. The high-energy electrons therefore diffuse toward the cold end

47
and the low-energy electrons diffuse toward the hot end. A net current results from the energy-
dependent diffusion rate of the electrons.85
This current causes an opposing voltage, and the total
current eventually becomes zero. This opposing voltage is the Seebeck voltage. The magnitude
of the Seebeck voltage will depend on the magnitude of the temperature gradient and the details
of the electronic structure which determine the energy-dependent diffusion rate for electrons.
Empirically, the Seebeck voltage can be determined via the application of a temperature gradient
to a sample and the simultaneous measurement of the resulting voltage. The relation between the
applied temperature gradient and the Seebeck voltage is given by
𝑉𝑆𝑒𝑒𝑏𝑒𝑐𝑘 = 𝑆(𝑇)∆𝑇 (2.41)
where 𝑉𝑆𝑒𝑒𝑏𝑒𝑐𝑘 is the Seebeck voltage, 𝑆 is the Seebeck coefficient (or thermopower), and ∆𝑇 is
the applied temperature gradient detected between the probes used to measure the voltage. As the
Seebeck coefficient is temperature dependent, the above holds only for small ∆𝑇. The
aforementioned details of the energy-dependent diffusion rate for electrons is buried within the
Seebeck coefficient and the derivation of the Seebeck coefficient depends heavily on the details
of the band structure and electron transport in materials.
The Seebeck coefficient is a useful tool for determining the dominant electron transport
mechanism in a material, and understanding the Seebeck coefficient is key to engineering new
thermoelectric materials. For both of these reasons, the goal of this section will be to give the
reader an intuitive sense for the relation between the band structure and the Seebeck coefficient
magnitude and temperature dependence.
Ioffe in 1957 gave a simple instructional explanation to calculate the Seebeck
coefficient based on thermodynamics92, 93
, which will be laid out here. First, consider a junction
between two conductors, a and b, at a constant temperature T where the two materials at the
junction have been allowed to relax to equilibrium. As the two conductors are in equilibrium,

48
their chemical potentials are in equilibrium such that their Fermi energies are equal and the
internal energy of each of the conductors can be written as:
𝑈(𝑎,𝑏) = 𝑇𝑠(𝑎,𝑏) + 𝐸𝑓 (2.42)
where
𝐸𝑓 = 𝐸𝑓𝑎= 𝐸𝑓𝑏
(2.43)
The average energy 𝑈 and entropy 𝑠 of the two conductors are different, but their Fermi energies
are the same, so:
𝑈𝑎 − 𝑇𝑠𝑎 = 𝑈𝑏 − 𝑇𝑠𝑏 (2.44)
When an electron passes through the junction, the average energy of the electron changes by
𝑈𝑎 − 𝑈𝑏, and this creates the Peltier heat 𝛱𝑎−𝑏 where:
𝑈𝑎 − 𝑈𝑏 = 𝛱𝑎−𝑏 (2.45)
From Equations (2.44) and (2.45) the Seebeck coefficient can be obtained using the second
Thompson relation, Equation (2.34):
𝑆 =
𝛱𝑎−𝑏
𝑇=
𝑈𝑎 − 𝑈𝑏
𝑇= 𝑆𝑎 − 𝑆𝑏 (2.46)
Comparison of (2.46) and (2.44) shows that the Seebeck coefficient is a measure of the entropy
change of an electron over the junction. That is the Peltier and Seebeck coefficients are measures
of the energy and entropy moved along with the charge carriers, respectively.
Equation (2.46) is useful for understanding the meaning of the Seebeck coefficient, but it
is not useful in designing thermoelectrics, as the value is not related to manipulatable materials
properties. An equation for the Seebeck coefficient in the non-interacting electron picture is as
follows, as shown in 94
. The heat transport of a current 𝑑𝑖 from an electron at energy E is given
by:
−(𝐸 − 𝐸𝑓)
𝑒𝑑𝑖 (2.47)

49
The current 𝑑𝑖 due to electrons between E and dE is given by:
𝑑𝑖 = −𝜎(𝐸)
𝑑𝑓
𝑑𝐸𝐹𝑑𝐸 (2.48)
where 𝜎(𝐸) is the energy-dependent conductivity at E, f is the Fermi function, F is the applied
electric field, and E is energy. Plugging (2.48) into (2.47) the total electronic heat transport can
be related to the Peltier coefficient as follows:
𝛱𝑖 =
𝐹
𝑒∫ 𝜎(𝐸)(𝐸 − 𝐸𝑓)
𝑑𝑓
𝑑𝐸𝑑𝐸 (2.49)
Using the Second Thompson Relation and rearranging some variables, the Seebeck coefficient
follows:
𝑆𝜎 = −
𝑘𝑏
𝑒∫ 𝜎𝐸 (
𝐸 − 𝐸𝑓
𝑘𝑏𝑇)
𝑑𝑓
𝑑𝐸𝑑𝐸 (2.50)
where 𝜎𝐸 is the electrical conductivity at energy E, 𝑒 is the charge of an electron, E is the energy
of the electron, 𝐸𝑓 is the Fermi energy, and 𝑓 is the Fermi Dirac function. A more rigorous
derivation using a Green’s Function formalism 95
finds this equation to be exact. From Equation
(2.50) it can be seen that the Seebeck coefficient is determined mainly by the band structure of
the material (buried within 𝜎𝐸) and the energy of the electrons in comparison to the Fermi energy.
Increasing the Seebeck coefficient therefore becomes an exercise in modifying the band structure
such that conduction of electrons occurs at high energies compared to the Fermi energy. It should
be reiterated that the above equation is for the free electron model and does not hold for strongly
correlated electrons.95
As a rule of thumb, since the Wiedemann-Franz law can also be exactly
derived using the non-interacting electron picture, in materials for which the Wiedemann-Franz
law fails, Equation (2.50) also fails.
From an engineering perspective, it is instructive to look at specific cases of (2.50) where
the formula can find practical use in identifying conduction mechanisms and engineering
thermoelectrics. For a metallic system, where the Fermi energy lies within a series of delocalized

50
electronic states, electrical conduction occurs by electrons within the vicinity of the Fermi
energy52
. For metals, Equation (2.50) simplifies to:
𝑆 =
𝜋2
3
𝑘𝑏2𝑇
𝑒
𝑑𝑙𝑛𝜎(𝐸)
𝑑𝐸|
𝐸𝑓
(2.51)
where 𝜎(𝐸) is the electronic conductivity as a function of band filling. If the electronic scattering
is independent of energy, then 𝜎(𝐸) is proportional to the density of states at E. This means that
the Seebeck coefficient of a metal is linearly dependent on temperature with a slope that is
determined via the derivative of the density of states with respect to energy at the Fermi energy,
𝑑𝑙𝑛𝜎(𝐸)
𝑑𝐸|
𝐸𝑓
. Recall that the Seebeck coefficient comes from the energy-dependent diffusion rate of
electrons and Equation (2.51) shows this nicely. Optimization of the Mott formula depends on
the details of the band structure; a good review is available from Ref. 96
.
For semiconducting systems, the Seebeck coefficient can be derived via the Boltzmann
transport equation, and is given by97
:
𝑆 = −
𝑘𝑏
𝑒(
5
2− 𝑟 − 𝑙𝑛 (
𝑛
𝑁𝑐)) (2.52)
where r is a constant that depends on scattering, and Nc is the density of states of the conduction
band. For a non-degenerate semiconductor, Maxwell statistics can be used and therefore98
:
𝑛 = 𝑁𝑐𝑒𝑥𝑝 (
𝐸𝑓 − 𝐸𝑐
𝑘𝑏𝑇) (2.53)
Plugging in Equation (2.53), Equation (2.52) becomes
𝑆 =
𝑘𝑏
𝑒(
5
2−
𝐸𝑓 − 𝐸𝑐
𝑘𝑏𝑇) (2.54)
It is seen from Equation (2.54) that for a nondegenerate semiconductor, the Seebeck coefficient
will have an inverse relationship with temperature. This will continue until minority carriers

51
become a significantly large portion of the electrical conductivity, in which case ambipolar
conduction will cause the Seebeck coefficient to decrease.99
It should be noted that Equation (2.54) is derived for the intrinsic regime. Many
materials will go through a saturation where further ionization of impurities is no longer
occurring and therefore the carrier concentration remains constant. If the carrier concentration is
instead temperature independent, Equation (2.54) will no longer hold. Instead, 𝑛 will be set as
constant and a value of 𝑁𝑐 will be calculated for a parabolic band as98, 100
:
𝑁𝑐 = 2 (𝑚𝑒𝑘𝑏𝑇
2𝜋 ℏ2)
32⁄
(2.55)
where ℏ is the reduced Planck’s constant and 𝑚𝑒 is the electron effective mass. Inserting
(2.55) into (2.52) results in101:
𝑆 =
𝑘𝑏
𝑒
3
2ln(𝑇) + 𝑐𝑜𝑛𝑠𝑡. (2.56)
The important aspect of this equation is the logarithmic dependence of Seebeck coefficient on
temperature. The prefactor of 𝑘𝑏
𝑒
3
2 will be different if the conduction band is not parabolic, as is
often the case in narrow band materials or other complex band structures such as for materials
with impurity bands. The prefactor will also deviate from the normal value if the effective mass
is not constant with temperature101
. Nevertheless, a logarithmic dependence of the Seebeck
coefficient is often indicative of a constant carrier concentration with a temperature dependent 𝑁𝑐
and is found in, for example, even the earliest measurements on Bi2Te3102
and will be important in
discussion of electron transport in Chapter 4 (4.3.2).
If the thermal energy of the system, 𝑘𝑏𝑇, is greater than the bandwidth, W, then all of the
states in the band will be available for electrons to occupy. As discussed previously, the Seebeck
coefficient can be thought of as the entropy transported per electron. In the case where 𝑘𝑏𝑇 ≫
𝑊, Boltzmann’s entropy formula can be utilized. This gives the following relation103
:

52
𝑆 =
𝑘𝑏𝑙𝑛(𝛺)
𝑒=
𝑘𝑏
𝑒ln (
𝑐
1 − 𝑐) (2.57)
where 𝛺 is the number of microstates possible and c is the ratio of the number of electrons to the
number of sites in the band. Equation (2.57) is called the Heike formula and is commonly
applicable to narrow band materials104–106
. As these narrow bands facilitate polaronic formation
as discussed in 2.1.4, the Heike formula is often applicable for materials where polaronic
conduction occurs. An easy way to understand the Heike formula is to think of the thermopower
as the entropy of mixing between electrons and empty states within the band. Given this, the
Heike formula resembles the thermodynamic entropies of mixing of solid solutions, as the basic
derivation for both is the same. This analogy breaks down when degeneracies are taken into
account, as shown by Doumerc 107
and later expanded by Koshibae et al.108
. These groups
showed that the Heike formula must be modified for spin and orbital degeneracies of the two
valence states participating in hopping, resulting in:
𝑆 =
𝑘𝑏
𝑒ln (
𝑔1
𝑔2
𝑐
1 − 𝑐) (2.58)
where 𝑔1and 𝑔2 are the sum of the spin and orbital degeneracies associated with the two cations
responsible for hopping conduction. This becomes important for many oxides, especially
cobaltites where 𝑔1 is 6 and 𝑔2 is 1, resulting in an additional contribution to S of 154µV/K
independent of c. This is the source for the abnormally large thermoelectric figure of merit in
cobaltites108
. Care must be taken in understanding what values of 𝑔1 and 𝑔2 are appropriate when
calculating 𝑐 from 𝑆, as is sometimes done to determine the carrier concentration from Seebeck
coefficient measurements.
The electron transport mechanism can often be revealed by the temperature dependence
of the thermopower. Table 2-1 gives the electron transport mechanism and the associated
temperature dependence.

53
Table 2-1 Different electron transport mechanisms and the associated Seebeck coefficient
temperature dependences.
Electron Transport Mechanism Temperature Dependence of S
Metallic Conduction 𝑆 ∝ 𝑇
Hopping Conduction (or 𝑘𝑏𝑇>>W) Temperature Independent S
Activation of electrons over a gap 𝑆 ∝
1
𝑇
Constant 𝑛 with changing Nc 𝑆 ∝ ln (𝑇)
2.4.3 Oxide Thermoelectrics
In this section a few key oxide thermoelectrics will be discussed for later comparison
with strontium barium niobate. Due to the toxicity, low melting point, and/or low oxidation
resistance of many conventional thermoelectrics such as Be2Te3, PbTe, Clathrates (Group IV
compounds), and skutterudites (Group V compounds) the goal of a thermoelectric which can
operate at high temperatures under oxidizing atmospheres is best routed through oxide-based
thermoelectrics. Despite this need, oxide thermoelectrics received little attention due to their high
phononic thermal conductivity and low electron mobility until the discovery of large figures of
merit in NaxCoO2.109
The zT of NaxCoO2 single crystals and polycrystalline ceramics are shown
in Figure 2-23 alongside other oxide thermoelectrics, and show much higher values than their n-
type counterparts.

54
Figure 2-23. Thermoelectric Figure of Merit for some state of the art oxide thermoelectrics.
Higher zT values are found for p-type materials than n-type materials, showing the need for new
n-type oxide thermoelectrics with higher zT values. Values from 6, 109–114
This large figure of merit is due to the spin and orbital degeneracy terms in the modified
Heike formula (see 2.4.2) of 𝑔1
𝑔2⁄ of 6 which increase the value of the Seebeck coefficient by
154µV/K.108
This increased Seebeck coefficient allows for a larger carrier concentration to offset
the low electron mobility, resulting in high power factors. NaxCoO2 additionally crystallizes in a
layered crystal structure which scatters phonons, although this scattering is anisotropic and
therefore single crystals show a thermal conductivity of ~20 W/mK at 300K which reduces to ~ 5
W/mK at 800K. This value is reduced in polycrystalline samples to ~2 W/mK between 300K and
800K. 109, 111
High values of zT have also been found in other layered cobaltite systems 113, 115
.
As a similar strategy of increasing the Seebeck coefficient cannot be realized in n-type materials,
the figures of merit of n-type oxide thermoelectrics are lower than the respective p-type materials.

55
A search for a compatible n-type leg to make oxide thermoelectric devices has resulted in some
possible candidates.
Research on SrTiO3 has identified a large power factor due to the high band degeneracy,
and high electron effective mass of SrTiO3, despite the low electron mobility (although SrTiO3
shows high electron motilities if high quality materials are measured, such as those grown by
molecular beam epitaxy 116
). Unfortunately, SrTiO3 has a high thermal conductivity at room
temperature of ~8 W/mK117
, limiting the zT value. Reduction of the thermal conductivity has
been attempted via solid solution formation, although reduction in the power factor accompanies
reduction in the thermal conductivity.77
The best zT found via solid solution formation is
Sr0.9Dy0.1TiO3 with a maximum zT of 0.22, shown in Figure 2-23 110
.
ZnO has shown promising thermoelectric properties at high temperatures. The low
electronegativity of Zn results in a partially covalent material with a low effective electron mass
and relatively high electron mobilities (~100cm2/Vs)
118. Doping of ZnO with Al to increase the
electrical conductivity results in a measured power factor of 15 µW/cmK2 112
, however the room
temperature thermal conductivity is very large at ~40 W/mK. The thermal conductivity decreases
following the 1/T law until a zT of ~0.3 is reached at 1273K. Attempts to decrease the low
temperature thermal conductivity were made by changing the Al dopant for cations with a larger
mass difference to Zn, such as Ga and In 5. Unfortunately, decreases in thermal conductivities are
accompanied by decreases in the power factor, resulting in lower zT values. Other dopants such
as MgO and NiO have been attempted due to their closer electronegativity to ZnO, but again
decreases in thermal conductivity were accompanied by decrease in power factor resulting in
decreasing zT.119
However, recent studies of Zn0.96Al0.02Ga0.02O have resulted in increased zT
values up to 0.65 at 1273K, and this increase is prescribed to the Ga addition allowing for
increased solubility of Al.114
Unidentified secondary phases are found in Zn0.96Al0.02Ga0.02O,

56
suggesting that either the solubility of Al or Ga is reached. Perhaps further work to increase the
solubility of Al could result in even larger zT values.
High zT values have also been obtained via the conversion of transparent conducting
oxides into the thermoelectrics space. In2O3 doped Ge has shown large power factors, up to ~8
µW/cmK2. Ge doping of In2O3 causes a reduction of the thermal conductivity from 10 to 3.5
W/mK, partially due to the formation of In2Ge2O7 inclusions which appear above the solid
solubility limit for Ge.6 zT values as high as 0.46 have been obtained in In2.8Ge0.2O3 at 1273K in
which these In2Ge2O7 inclusions are present.
Despite the strides of n-type thermoelectric oxides resulting in large zT values at high
temperatures, no compatible material for NaxCoO2 has been found. As discussed in 2.2.3, relaxor
ferroelectricity may be an interesting route for lowering the thermal conductivity of oxide
materials. The use of oxides with rattler-like ions similar to clathrates or skutterudies may also be
of interest. By either method, finding a material with relaxor ferroelectricity/rattler ions with
large power factors is of interest to better engineer n-type oxide thermoelectrics to match their
larger zT p-type brethren.
2.5 Strontium Barium Niobate
Strontium Barium Niobate (SBN) has the tetragonal tungsten bronze crystal structure as
first determined by P.B. Jamieson et al 120
. At room temperature SBN has a space group of P4bm
with the structure depicted in Figure 2-24.

57
Figure 2-24. Crystal structure of strontium barium niobate shown along [001].
The chemical formula of SBN is (Srx,Ba1-x)Nb2O6 and can be written as
(A1)2(A2)4(C)4(B)2(B’)8O30 where Sr sits on the A1 site, Sr and Ba sit on the A2 site, the C sites
are empty, and Nb sits on the B and B’ sites, and 5 different oxygen sites exist. The structure
consists of c-axis chains of corner-shared NbO6 octahedra which are connected in the a-b plane to
form different shapes of channels aligned parallel to the chains along the c-axis. The sites within
these channels are denoted the A1, A2, and C sites and have coordination numbers of 15, 12, and
3, respectively. In SBN, the A2 site contains Sr and Ba ions in a disordered mixture, but the A1
site has been shown only to be occupied by Sr120, 121
. SBN is a uniaxial ferroelectric where the
spontaneous polarization is due to the displacement of Nb along the c-axis. The nature of the
ferroelectric properties depends heavily on composition and is related to the amount of disorder
found on the A2 site. In (Sr0.33,Ba0.66)Nb2O6 the A2 site contains only Ba, while at higher Sr
concentrations the A2 site starts to incorporate the extra Sr. As a result, a transition occurs from
normal to relaxor ferroelectric properties where x=0.4 is a normal ferroelectric and x=0.7 is a

58
relaxor ferroelectric.122
The Burns temperature for relaxor ferroelectric SBN (x=0.61) is 350°C
and the freezing temperature is 39°C123
. A change in the octahedral tilt angle along the c-axis
NbO6 chains occurs as a function of Sr and Ba concentrations, from 4.5° in x=0.25 to 7.5° in
x=0.75124
.

59
Chapter 3 Metallic-like to Nonmetallic Transitions in a Variety of Heavily Oxygen
Deficient Ferroelectrics
In this chapter the coupling between ferroelectric distortions and electrical conductivity is
discussed for a small variety of ferroelectric compounds. The coupling between the electron
transport and ferroelectricity is important to understand if ferroelectric-thermoelectrics are to be
utilized. This knowledge is also useful for the study of ferroelectric/noncentrosymmetric metals.
Here, multiple d0 ferroelectrics with a variety of crystal structures were doped via oxygen
deficiency. Metallic-like conduction was identified at high temperatures within these
compounds, and non-metallic/semiconducting behavior was found at low temperatures. The idea
of the metallic-like to nonmetallic transition being linked to the paraelectric-ferroelectric
transition is explored. It is shown that in (Ba1-xSrx)TiO3-δ the metallic-like to nonmetallic
transition temperature can be shifted using mechanisms that shift the paraelectric-ferroelectric
transition temperature. The magnitude of the shift as a function of Sr doping is shown to be equal
to the expected shift in the paraelectric-ferroelectric transition temperature. Other evidence for
this coupling will be discussed. One probable mechanism for this ferroelectric-electron transport
coupling is determined to be Anderson localization (see section 2.1.3). The relaxor ferroelecric
polarization, being of short-range order, may cause disorder and thereby localize the itinerate
electrons. As a note, specific aspects of the electron transport of (Sr0.6,Ba0.4)Nb2O6-δ are
summarized here, but detailed discussion is reserved for chapters 4-6.

60
3.1 Background
The study of semiconducting ferroelectrics has shown that coupling between the
ferroelectric polarization and electronic carriers exists, and a review of early literature is available
in Ref. 125
. Phase transitions in ferroelectrics are affected by high concentrations of electronic
carriers. 126
It is well known that increasing the carrier concentration leads to a lowering of the
Curie temperature (Tc), a decreasing spontaneous polarization, and a decreasing latent heat of the
transition.
Conversely, ferroelectricity is known to perturb electron transport both across grain
boundaries and within the bulk of a grain or crystal.127
For example, to minimize the
depolarization energy, any spatial gradients of the spontaneous polarization are compensated by
changes in the distribution of charge carriers (i. e. Gauss’s Law). This effect can be strong, and
can, for example, compensate the large change in the spontaneous polarization at a head-to-head
and tail-to-tail domain configuration. Carrier concentrations at these boundaries are high enough
to support metallic conductivity.81, 128
Additionally, as ferroelectricity changes the bonding
between the oxygen p-orbitals and the transition metal d-orbitals, changes in the electron density
of states may occur. 76
Although these effects are well-studied in semiconducting ferroelectrics, comparatively
little work has been reported on ferroelectric compounds which have carrier concentrations near
or above the crossover into metallic conduction, as determined by the Mott Criterion (see section
2.1.3).32
One reason for this is that many scientists consider a metallic ferroelectric to be a
contradiction. The delocalized electronic carriers are thought to screen long range dipole-dipole
interactions, and thereby limit the cooperative alignment of dipoles that is the basis of
ferroelectricity itself. In addition, high electrical conductivity limits any use of ferroelectrics in
switching, transducer, or capacitive applications. However, highly conductive ferroelectric-base

61
compositions are of potential interest for their optical responses129, 130
, magnetoelectricity 130
, and
ferroelectric-based thermoelectrics. 9, 32
The latter of these is pertinent due to the low thermal
conductivity of ferroelectrics that have nanoscale and frustrated polarization, as is the case with
relaxor ferroelectrics71
.
A brief summary of ferroelectric metals research will be presented here. Ferroelectric
metals were first theorized by Anderson and Blount 131
in the 1960’s. Ferroelectric metals have
been elusive, as the electronic carriers destabilize the ferroelectric phase by lowering Tc, the
spontaneous polarization, and the latent heat of transformation. Nevertheless, Bennet et al.
predicted metallic conduction in some ferroelectric compounds 132
and density functional theory
calculations on a series of ABX family compounds have found potential metallic ferroelectrics
132. Experimentally, structural phase transitions comparable to paraelectric-ferroelectric
transitions have recently been found in two metallic oxides: Cd2Re2O7133
, and LiOsO3134
. Density
functional theory calculations on LiOsO3 by Giovannetti and Capone show the ferroelectric
distortion in the unit cell is primarily due to Li-O atomic displacement while the Os-O
displacement is relatively small.135
Hybridization of the Os e2g orbitals and O p orbitals does
occur in LiOsO3 as in other ferroelectrics, but the half-filled t2g states responsible for metallic
conduction are relatively unperturbed. Puggioni and Rondinelli suggest that
ferroelectric/noncentrosymmetric metals rely on this weak coupling between the ferroelectric soft
mode and electrons at the Fermi energy.136
Separation of metallic conduction and the atomic displacements responsible for
ferroelectricity onto two different cation sublattices is a promising route toward making these two
phenomena compatible in a single material. Unfortunately, this strategy is possible in only a small
subset of ferroelectrics. The lack of an adequate design space for the crystal chemistry raises the
difficulty of engineering the large polar cluster density necessary for the low thermal conductivity
of ferroelectric-based thermoelectrics. If the interactions between the ferroelectric polarization

62
and the electron transport can be understood within a broader subset of ferroelectric materials,
then the design space may be widened to allow for simultaneous engineering of the electron and
thermal transport. In this chapter, coupling between the ferroelectric distortion and electrical
conductivity is examined in a variety of d0 ferroelectrics with various crystal structures and
paraelectric-ferroelectric transition temperatures.
3.2 Experimental Procedure
A number of octahedrally coordinated ferroelectric compositions with different crystal
structures and paraelectric-ferroelectric transition temperatures were doped with donors to induce
high electronic carrier concentrations: (Ba1-xSrx)TiO3 x=0, 0.1, 0.2, 0.3, and 1 (BSTx),
(Sr0.61Ba0.39)Nb2O6 (SBN) and Sr2(W0.2Nb0.8)2O7. (Ba1-xSrx)TiO3 has a perovskite structure,
(Sr0.61Ba0.39)Nb2O6 has a tungsten bronze structure137
, and Sr2(W0.2Nb0.8)2O7 has a perovskite-like
layered structure.138
The paraelectric-ferroelectric transitions for these materials range from <0K
for the incipient ferroelectric SrTiO3 to 1600 K for Sr2Nb2O7138, 139
.
Samples were fabricated via conventional solid-state reaction and sintering. Precursor
powders for the samples include SrCO3, BaCO3, Nb2O5, WO3, and TiO2; all powders had >99.8%
purity. Precursor powders were weighed in the required stoichiometric ratios and mixed via ball
milling in ethanol with ZrO2 media for 12 hours. The dried powders of BSTx and
Sr2(W0.2Nb0.8)2O7 were calcined at 1000 °C for 6 hours, while SBN was calcined at 1200 °C for 6
hours. The high calcination temperature for SBN is needed to homogenize the cation distribution
and prevent Nb-rich or Ba-poor regions which cause abnormal grain growth, as discussed by Lee
and Freer 140
. The calcined powders were ball milled for 24 hours using ZrO2 media in ethanol
and then sieved using a No. 80 mesh size. The milled powders were uniaxially pressed at 15 MPa

63
and subsequently isostatically pressed at 210 MPa. BSTx was sintered at 1350°C, and
Sr2(W0.2Nb0.8)2O7 was sintered at 1500°C for four hours. Further precautions against abnormal
grain growth were taken for SBN by using a two-step sintering process. SBN pellets were first
held at 1250 °C for 6 hours to homogenize and then ramped to 1325 °C for 6 hours to sinter. All
samples were phase pure by X-ray diffraction and showed relative densities >95%.
Samples were annealed under low partial pressures of oxygen, controlled via gas
mixtures of H2 and H2O (see Appendix A), to induce oxygen deficiency. This oxygen deficiency
was increased until samples showed metallic-like conduction (decreasing conductivity with
increasing temperature). Annealing was performed at 1573 K under an oxygen partial pressure of
10-14
atm for (Sr0.61Ba0.39)Nb2O6 and Sr2(W0.2Nb0.8)2O7 and 10-17
atm for BST samples. Only
estimates of δ are available, but BST samples have δ~0.01 calculated from carrier
concentrations141
. SBN samples have δ<0.002 calculated via TGA (see section 5.3.4) but show
much higher carrier concentrations, on the order of 1021
cm-3
, due to A-site donors which form
upon reduction. This gives a final stoichiometry of the matrix phase of roughly
(Sr0.61Ba0.39)1.1Nb2O6 (see chapter 4). Where possible, paraelectric-ferroelectric phase transitions
were identified by DSC or temperature dependent X-ray diffraction.141, 142
Electrical conductivities were measured on samples cut into rectangular bars of roughly
10 x 2 x 2 mm. Contacts consisted of silver lead wires attached to sputtered platinum electrodes
bonded with silver epoxy in a 4-point probe geometry. Below 520 K electrical conductivity was
measured in a Delta 9023 environmental chamber using an HP 4284A precision LCR meter.
Above 520 K, samples were measured within a tube furnace with partial pressure of oxygen
control, and resistance was measured via a Keithley Integra Series 2700 Digital Multimeter.

64
3.3 Results and Discussion
The electrical conductivities of SrTiO3-δ, BaTiO3-δ, (Sr0.61Ba0.39)Nb2O6-δ, and
Sr2(W0.2Nb0.8)2O7-δ are shown in Figure 3-1, and confirmed paraelectric-ferroelectric phase
transition temperatures are marked. Note the magnitude of the conductivity varies significantly
between samples, necessitating multiple conductivity scales.
Figure 3-1. Electrical conductivity of multiple ferroelectrics which show metallic-like conduction
at high temperatures. Confirmed Tc and TBurns values are marked.
A transition from semiconducting (𝑑𝜎𝑑𝑇⁄ > 0) to metallic-like behavior (𝑑𝜎
𝑑𝑇⁄ < 0), hereafter
referred to as a metallic-like to nonmetallic (MLNM) transition, is seen in samples with
ferroelectricity present in the insulating host compounds. The following discussion will go
through each of these individually. It should be noted that metallic-like as used here means that
the electrical conductivity is decreasing with increasing temperature. The true definition of a
metal is the presence of a Fermi-surface, but there is no evidence here for such behavior.

65
Metallic-like conduction may also occur when the number of electronic carriers in constant or
nearly constant but the electronic mobility is decreasing with increasing temperature, such as in
the saturation regime of a semiconductor. The MLNM transitions shown here should not be
confused with metal-to-insulator transitions.
The MLNM transition in BaTiO3-δ occurs at ~370 K, and an additional anomaly is seen
roughly 70 K below the MLNM transition. Tc of stoichiometric BaTiO3 is 393 K. This suggests,
at first, a correlation with the MLNM transition temperature (TMLNM), but the Tc is known to
decrease with increasing carrier concentration.126
Lee et al. 141
found Tc to be ~315 K via DSC,
correlating well to the low-temperature anomaly at ~300 K. It would seem then that the low-
temperature anomaly is due to the paraelectric-ferroelectric transition temperature.
It is key to note that the appearance of a ferroelectric polarization does not occur exactly
at Tc in BaTiO3. Evidence for a finite amount of polarization has been identified in BaTiO3 above
Tc by finite birefringence, showing that polarization exists at least up to 50 K above Tc in BaTiO3
143. Evidence for polar ordering was also found 180 K above Tc using Brillouin light scattering
144.
The identified polarization above Tc has aspects of relaxor ferroelectric-like83
polarization,
including its short-range order.144
It is possible that the appearance of this relaxor-like
polarization is the cause for the MLNM transition in BaTiO3-δ at 370 K. The mechanism would
then be Anderson localization due to the disorder created by short-range ordered polarization.
That is, the electric fields and strain fields around the nanosized relaxor-like domains would be a
likely source for Anderson localization which may cause the MLNM transition.
If the MLNM Transition occurs slightly above Tc, than shifts in Tc should cause shifts in
the MLNM transition. Confirmation of the correlation between the MLNM Transition and Tc
requires determination of Tc. Unfortunately, this is a difficult task due to the electronic carriers
both lowering the latent heat of transformation and making samples too conductive for dielectric

66
measurements. DSC measurements were performed, but were ultimately unsuccessful in
measuring a precise Tc due to the small latent heat of transformation. XRD is additionally
difficult simply due to the lack of proper cold stages. Fortunately, indirect confirmation of the
role of Tc is still possible by utilizing the linear trend of Tc upon the substitution of Sr for Ba in
BaTiO3.139, 145, 146
Electrical conductivity data for BST samples is shown in Fig. 2.
Figure 3-2. Electrical conductivity for (Ba1-xSrx)TiO3-δ ceramics annealed at 1300°C under 10-17
atm pO2. As Sr% increases the electrical conductivity increases, the MLNM transition moves to
lower temperatures, and a resurgence of metallic-like conduction is seen at low temperatures.
The insert shows both the change in both the maximum conductivity and the inflection point,
marked as Tc, as a function of the amount of Sr, x.
With the substitution of Sr for Ba, the MLNM transition decreases in temperature, and
this is attributed to a decrease in Tc. The MLNM transition temperature and the anomaly
associated with Tc, recorded as the inflection point, are plotted as a function of Sr substitution in
the inset of Fig. 2. Tc and TMLNM both follow a linear trend with slopes of 2.9°C/mol%Sr and

67
3.4°C/mol%Sr, respectively. These values are comparable to the expected 2.9-3.2°C/mol%Sr 139,
145, 146, and this supports the attribution of the conductivity anomalies to the onset of polarization.
The increasing Sr content also causes an increase in the electrical conductivity which is attributed
to the increase in electron mobility reported by Yamamoto et al. 77
Also, it is found that the
conductivity anomaly is broader for BST compounds compared to BaTiO3-δ. This could be a
consequence of heterogeneity in the local Ba and Sr concentrations or movement toward a second
order phase transition. The end-member case of SrTiO3-δ was also investigated, and shows
metallic conduction over the entire temperature range, consistent with a nonexistent Tc.
BaTiO3-δ remains semiconducting well below Tc, but a resurgence of metallic-like
conduction is found in (Ba1-xSrx)TiO3-δ with x=0.1, 0.2, and 0.3 below Tc. The reason for this is
currently unknown. However, possible mechanisms can be thought through. For example, it is
speculated that Anderson localization from the relaxor-like polarization above Tc is the cause for
the conductivity anomaly between Tc and TMLNM. If this is the case, then coalescence of the
polarization into long-range macroscopic domains would eliminate the conductivity anomaly.
This coalescence occurs in insulating (Ba1-xSrx)TiO3 below Tc, and, if this is transferable to
heavily reduced samples, the removal of the relaxor-like polarization could eliminate the
Anderson localization that acts to suppress metallic-like conduction. Another possibility comes
from the work of Jeong et al. 147
who used neutron diffraction to determine that cubic and
tetragonal phases exist simultaneously below Tc in BaTiO3-δ. This coexistence allows for the
possibility that metallic conduction occurs via cubic regions, and semiconduction through
tetragonal regions. It may be that the resurgence of metallic-like conduction is due to the
stabilization of these cubic metallic regions by Sr. This model is strengthened by the result from
Levin et al. that the displacement of the individual Ti ions decrease with an increased number of
Sr next-nearest neighbors.148
If the cubic regions remain metallically conducting below Tc, then

68
percolation of these regions could result in bulk metallic-like conductivity. The resurgence of
metallic-like conductivity would then require both of these mechanisms – first, the stabilization of
metallic-like cubic regions and then the removal of Anderson localization due to the coalescence
of the relaxor-like polarization into macroscopic domains. Further research would be needed to
confirm this model. Despite the unknown behavior of the low temperature metallic-like
conductivity, it is clear that the Tc and TMLNM are linked in (Ba1-xSrx)TiO3-δ and therefore the
conductivity anomalies are associated with the ferroelectric polarization.
The properties of SBN are laid out in detail in chapter 4-6. A summary of the important
points to this chapter are given here. SBN is a relaxor ferroelectric, and therefore the onset of
polarization occurs at the Burns temperature, TBurns. In insulating samples TBurns was measured by
Bhalla et al. and Huiqing et al. to be 570-625 K and ~625 K, respectively122, 149
. As the normal
dielectric and optical measurements for determining TBurns are not possible in conducting samples,
temperature dependent X-ray diffraction was used to measure the electrostrictive strain associated
with the polar nanoregions as shown in Figure 4-5. In contrast to Tc in normal ferroelectrics,
TBurns was not affected by electronic carriers and remained at 625±25K. The reason why Tc
changes as a function of carrier concentration while TBurns remains constant is currently unknown,
and further research within this area is an interesting avenue for future work (see Chapter 4 for
more detail). These values correlate well with the ~650K MLNM transition in SBN found in this
work, but a link between the MLNM transition and TBurns is not universal. Samples of
(Sr0.40Ba0.60)1+yNb2O6 and (Sr0.50Ba0.50)1+yNb2O6, which are normal ferroelectric in nature, show
the same MLNM transition temperature in their reduced state. This suggests that the MLNM
transition temperature is independent of the polarization. Additionally, Dandeneau et al. show
that the MLNM transition temperature of (Ca0.18,Ba0.82)Nb2O6-δ is ~560K while TBurns is
~1200K150
. Although the link between TBurns and the MLNM transition temperature does not hold

69
under scrutiny, the polarization was still found to have an effect on conduction. It is thought that
polar nanodomains act as a source of disorder for Anderson localization which causes movement
of mobility edges. In do oxides, this effect is pronounced as the conduction electrons lie near a
band edge. In contrast, in an oxide with increased filling of the d-band, such as LiOsO3, this
effect would become less severe since Anderson localization of the band edges would not affect a
Fermi edge located well within the band. 19
The host compound Sr2Nb2O7 has a perovskite-like layered structure and the highest Tc
measured in this study, 1600 K138
. Additions of W were needed to enhance the carrier
concentration for metallic-like conduction. As the Tc is known to decrease with the introduction
of electronic carriers, the MLNM transition was hypothesized to be below 1600 K. As expected, a
MLNM transition was found in Sr2(W0.2Nb1.8)O7 at 1160 K (Fig. 1). Further research must be
done to confirm the correlation between the MLNM transition and Tc. Nevertheless, the expected
MLNM transition was found at very high temperatures, where the only likely explanation is the
introduction of polarization. Therefore, this phenomenon seems to be common over a broad
temperature window across multiple ferroelectric oxides.
3.4 Conclusions
Oxygen deficient d0 ferroelectrics with a variety of structures and paraelectric-
ferroelectric transition temperatures show a metallic-like to nonmetallic transition seemingly
concurrent with the onset of polarization formation. The generality of this phenomenon within
different structured d0 ferroelectrics with transition temperatures ranging over 1000 K is
consistent with the model put forward by Puggioni and Rodinelli.136
In BST samples this occurs
via a MLNM transition which tracks with changes in the Curie temperature. In SBN, the link

70
between the MLNM transition temperature and the Burns temperature is indirect, in that the
polarization causes an increased localization of electrons which provides a driving force toward a
semiconducting state. Additional ferroelectric-electron transport coupling mechanisms should
not be overlooked; possible effects such as changes in the band structure and spatial redistribution
of electronic carriers may be identified with further study.

71
Chapter 4 Electron Transport in (Srx,Ba1-x)Nb2O6-δ and the Effect of Relaxor
Ferroelectricity
SBN has been identified as a promising ferroelectric-based thermoelectric9, but
optimization of SBN has not been undertaken. Optimization of SBN requires a clear
understanding of the electron transport mechanism, which has not been previously elucidated.
With the goal of understanding the electron transport mechanism in SBN, the electrical
conductivity, Seebeck coefficient, and optical response were studied as a function of reduction
condition. It will be shown that an odd combination of electron transport properties is found and
that unclear trends as a function of reduction condition exist. These include a sharp jump in
electrical conductivity as the pO2 during annealing reaches a specific value, and the combination
of an electrical conductivity which identifies band conduction and a Seebeck coefficient which
seems to show hopping conduction. The former of these two oddities will be shown in this
chapter as being due to a change in electron transport due to relaxor ferroelectricity.
4.1 Background
Ferroelectric materials have been of interest for multiple decades due to high
electromechanical coupling coefficients, high permittivity, and high electro-optical coefficients,
amongst others. These properties make them useful for high performance capacitors,
piezoelectric sensors and actuators, pyroelectric detectors, electro-optic switches, electrocaloric
coolers, polarization based non-volatile memories, and multiferroic sensors and switches. 151–156
A commonality of these applications is that they require the application of a sizable electric field,
and this necessitates that the ferroelectric materials be insulating. Consequently, much less
attention has been paid to the application possibilities for ferroelectric materials that are
72
electrically conducting. Some applications have been found, for example, PTCR thermistors
which work via changes to the electrical conductivity due to a polarization-controlled
modification of the Schottky barrier at grain boundaries157
. Recently, renewed interest in
conducting ferroelectrics has revolved around polarization-aided photovoltaics 158–160
and
thermoelectrics 9, 32, 141, 161
, conducting domain walls 80, 81, 128, 162–164
and possibly metallic
ferroelectricity 133, 134, 141, 147, 165, 166
.
Investigations into metallic ferroelectrics, a topic which has been comparatively ignored
since early ideas by Anderson and Blout131
and Matthias167
, have reopened due to recent work by
Kolodiazhnyi et al. 165, 166
, Lee et al.141
, and Jeong et al.147
on heavily doped BaTiO3; Sergienko et
al. on Cd2Re2O7133
; and Shi et al.134
on LiOsO3. Metallically conducting samples with structural
distortions similar to a ferroelectric have been reported 165134
, but the most heavily studied of
these, BaTiO3-δ, was later found to be inhomogeneous in nature147
. Jeong et al. suggest that the
Ti-O bond distortion (the polarization) and metallic conductivity originate from different volume
fractions of the material. The polarization may locally be causing a transition into a
semiconducting state. A full understanding of polarization/conduction interactions needs
extensive work; however, it is possible that polarization may act as a local field to shift electron
concentrations, change the degeneracy of the conduction band, or act as sources of disorder for
Anderson localization.
In terms of thermoelectricity, ferroelectrics are interesting due to phonon scattering at
domain walls71168
, the interaction of soft optic phonon modes with heat-carrying acoustic phonons
169, 170, and the glasslike properties in relaxor ferroelectrics
71 (see 2.2.3). All of these phenomena
act to lower the thermal conductivity and should lead to higher thermoelectric figure of merits.
Although relaxor ferroelectricity is beneficial for low thermal conductivity, the lack of research
on conducting ferroelectrics means that its effect on the Seebeck coefficient and electrical
conductivity is little explored.

73
Here the ability to transform SBN between relaxor and normal ferroelectricity is used to
investigate the role of different types of polarization on electrical conduction. SBN is a tetragonal
tungsten-bronze structured ferroelectric material (see 2.5). The Sr/Ba ratio controls the
temperature of the P4mmP4/mmm transition and if the material is a normal or relaxor
ferroelectric121
. The distinctions between normal and relaxor ferroelectrics have been extensively
reviewed over the past two decades (see 2.3.1).83171
This change from normal to relaxor
ferroelectric with Sr/Ba ratio permits the exploration of trends in the Seebeck coefficient and
conductivity with respect to the polarization’s nature. As an extension of Chapter 3, the in-depth
study of the conduction behavior of SBN may clarify how polarization plays a role in the
electrical transport in both SBN and conducting ferroelectrics in general.
4.2 Experimental Procedure
4.2.1 Sample Sintering and Preparation
Powders of (Srx,Ba1-x)Nb2O6 (SBNx) were fabricated using solid-state reaction of SrCO3
(>99.9%, Alfa Aesar), BaCO3 (99.8%, Alfa Aesar), and Nb2O5 (99.9%, Alfa Aesar) precursor
powders. These powders were weighed in the required stoichiometric ratios and mixed via ball
milling in ethanol with ZrO2 media for 12 hours. The dried powders were calcined at 1200°C
for 6 hours. The high calcination temperatures and long calcination times are needed to
homogenize the cation distribution and prevent Nb-rich or Ba-poor regions which result in
abnormal grain growth, as discussed by Lee and Freer140
. The calcined powders were ball milled
for 24 hours using ZrO2 media in ethanol and then sieved using a No. 80 mesh size. The milled
powders were uniaxially pressed at 15 MPa and subsequently isostatically pressed at 210 MPa.
Further precautions against abnormal grain growth were taken by using a 2-step sintering

74
process. That is, pellets were first held at 1250°C for 6 hours to further homogenize and then
ramped to 1325°C for 6 hours to sinter. All samples were phase pure by X-ray diffraction and
>95% dense after sintering.
Dense pellets were made electrically conducting via annealing in low partial pressures of
oxygen. The annealing atmosphere was controlled using H2-H2O gas mixtures with a nitrogen
carrier gas. To investigate the properties as a function of annealing pO2, samples of SBN0.6 were
annealed under partial pressures of oxygen ranging from 10-10
to 10-16
atm at 1300°C for 30
hours. To investigate the properties as a function of relaxor ferroelectric character, samples of
SBN0.4-0.7 were annealed under a partial pressure of oxygen of 10-14
atm at 1300°C for 30 hours.
Cooling was performed under a constant pH2-pH2O mixture at 15°C/min. Phase compositions of
annealed samples were investigated using x-ray diffraction on a PANalytical Empyrean using
scan conditions of 20-60° 2θ, a 0.02° step size, and a scan speed of 109 sec/°. All samples
annealed below 10-12
atm pO2 formed an NbO2 second phase. Nb2O5 which was converted into
NbO2 via annealing at 1300°C under 10-14
atm was found to have a conductivity on the order of
10 S/cm at 700K, in rough agreement with previous reports172
. The low conductivity of the NbO2
phase and the lack of percolation in the microstructure suggests that the phase should not
contribute heavily to electronic conduction. It was found that the NbO2 phase indicates changes
in the chemistry of the SBN matrix which increases electrical conduction. This will be discussed
in detail in Chapter 5. Annealed samples were cut using a diamond saw into bars of 10 x 1.5 x
1.5mm and 6x1x1mm dimensions for electrical conductivity and Seebeck coefficient
measurements, respectively. The surfaces of bars were prepared via polishing with SiC
sandpaper starting with 400 Grit working down to 1200 Grit.

75
4.2.2 Electron Transport Measurements
Electrical conductivity measurements were performed via a four terminal technique with
Ti/Pt electrodes deposited as films via sputtering using a shadow mask. Ag wires were then
attached with Ag epoxy and cured at 120°C for 2 hours. Electrical conductivity at temperatures
below 520 K was measured in a Delta Design 9023 environmental test chamber, using an HP
4284A precision LCR meter. Higher temperature measurements were performed using a
Keithley 2700 Integra series digital multimeter with leads fed into a tube furnace equipped with
pH2-pH2O atmosphere control. Samples were measured under the same H2 and N2/H2O flow
rates that were used for their annealing to minimize oxidation during measurement. It was found
that the electrical conductivity magnitudes were consistent on both heating and cooling over
multiple measurements, suggesting that any minor changes in oxidation do not play a significant
role in the measurements.
The Seebeck coefficients, 𝑆, of samples were measured primarily on a SB100 Seebeck
coefficient measurement system by MMR Technologies from 200 to 600 K. The SB100 uses the
integral method for determining the Seebeck coefficient. Samples had Ti/Pt electrodes sputtered
on the ends to assure ohmic contacts, and then were connected to the stage using silver epoxy
which was cured at 120°C for two hours. A heater was used to simultaneously apply a
temperature gradient onto both the sample under test and a reference sample. The Seebeck
voltage is measured from both the reference sample and the sample under test. The voltage from
the reference sample is used to determine the temperature gradient over the reference sample.
This temperature gradient is assumed to be the temperature gradient over the sample under test.
To assure this assumption was valid, great care was used in determining that the sample under
test and the reference sample were symmetrically placed in relation to the heater. The Seebeck

76
coefficient is calculated from the Seebeck voltage from two different applied temperature
gradients.
One 5×5×20mm sample of SBN0.6 was measured using a ZEM-3 thermoelectric
measurement system at NASA Glenn Research Center. The ZEM-3 system uses the differential
method for measurement of Seebeck coefficient. In this method, thermocouples are used as
voltage leads so that the temperature gradient can be measured directly at the voltage
measurement position. An internal heater sweeps the temperature gradient and the Seebeck
coefficient is calculated using the slope of the ΔV vs ΔT plot. Good correlation exists between
the MMR and ZEM-3 measurement systems; the ZEM-3 system has a lower noise floor, as well
as the capability for higher temperature measurements and atmosphere control. The SBN0.6
sample was measured under a 0.1atm He atmosphere up to 750K, above which sample
reoxidation became problematic.
Optical conductivity was determined for ceramic SBN0.6 pellets annealed at partial
pressures of oxygen ranging from 10-10
atm to 10-16
atm at 1300°C for 30 hours. The pellets were
polished down to a 0.25 µm finish. Ellipsometry data were collected at three different incidence
angles (55°, 65°, 75°) using a J. A. Wollam Co. (Lincoln, NE) M-2000 rotating compensator
spectroscopic ellipsometer. Specular reflectance measurements were performed using a Bruker
Vertex 70 with a Hyperion 3000 FT-IR microscope attachment. The optical conductivity was
determined from the ellipsometry and reflectivity data via a Kramers-Kronig constrained
variation analysis as explained in Ref. 173
. The analysis was performed using RefFIT software.

77
4.2.3 Temperature Dependent X-ray Diffraction Measurements
Lattice parameters as a function of temperature were measured on (Sr0.61,Ba0.39)Nb2O6
annealed at 1300°C under 10-14
atm and then crushed into powder form. The powder was mixed
with NIST standard reference material 674a alumina and placed into a 1 mm diameter quartz
capillary. A vacuum was pulled on the capillary, which was then backfilled with 1% H2/N2
forming gas. The cycle of evacuation and backfilling with forming gas was repeated >10 times.
While under an atmosphere of forming gas, wax was melted in the quartz capillary to seal it.
Temperature dependent lattice parameters were then measured using a custom-built furnace on
APS beamline 6-ID-D. The alumina powder was used as an internal standard to correct for
temperature by using the thermal expansion data measured by Brown et al.174
Lattice parameters
were used to calculate the c/a ratio in the SBN material. The Burns’ temperature (TBurns) was
found by identifying the deviation of the c/a ratio on cooling from the high-temperature linear
trend. This deviation is expected for relaxor ferroelectrics due to the polarization fluctuation’s
contribution to strain. The magnitude is given by 𝑥𝑖 = 𝑄𝑖𝑗𝑃𝑗2̅̅̅̅ where 𝑥𝑖 is strain, 𝑄𝑖𝑗 is the
electrostrictive coefficient, and 𝑃𝑗2̅̅̅̅ is the average magnitude of the short-range order polarization
in the system149
. Only 𝑄𝑖𝑗 values for SBN0.75 are available, and are 𝑄31 = 0.71𝑥10−2 𝑚4
𝐶2⁄
and 𝑄33 = 3𝑥10−2 𝑚4
𝐶2⁄ 175.
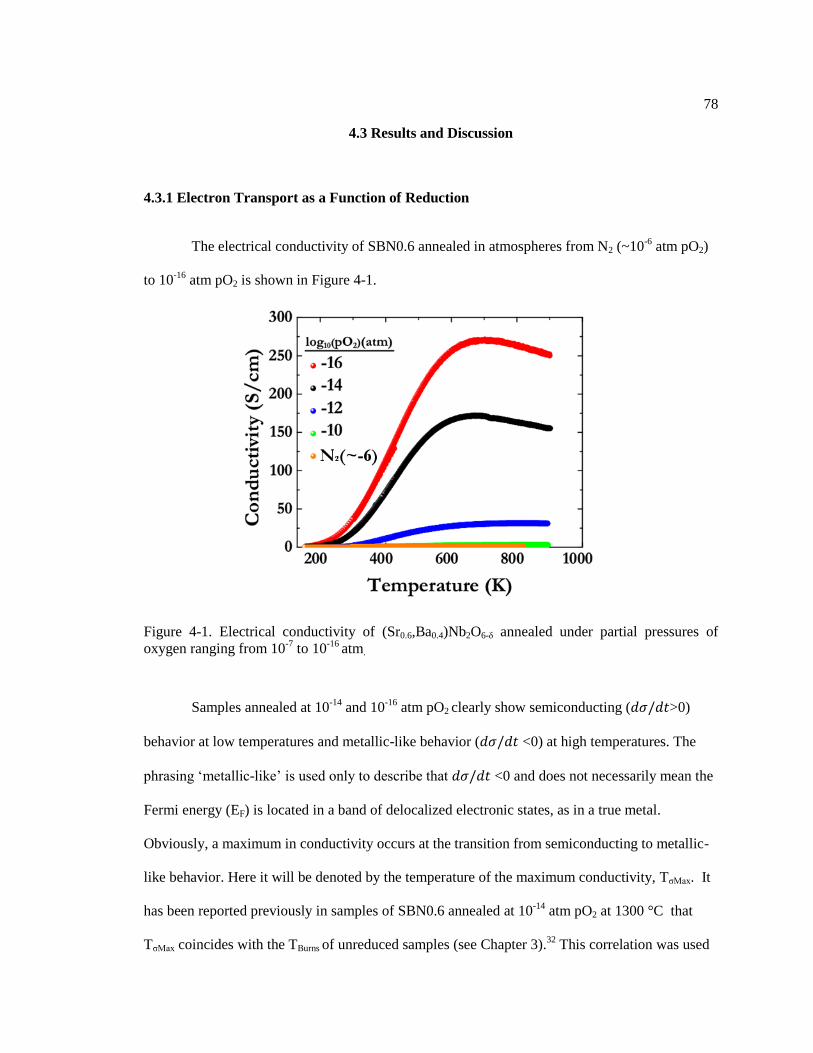
78
4.3 Results and Discussion
4.3.1 Electron Transport as a Function of Reduction
The electrical conductivity of SBN0.6 annealed in atmospheres from N2 (~10-6
atm pO2)
to 10-16
atm pO2 is shown in Figure 4-1.
Figure 4-1. Electrical conductivity of (Sr0.6,Ba0.4)Nb2O6-δ annealed under partial pressures of
oxygen ranging from 10-7
to 10-16
atm.
Samples annealed at 10-14
and 10-16
atm pO2 clearly show semiconducting (𝑑𝜎/𝑑𝑡>0)
behavior at low temperatures and metallic-like behavior (𝑑𝜎/𝑑𝑡 <0) at high temperatures. The
phrasing ‘metallic-like’ is used only to describe that 𝑑𝜎/𝑑𝑡 <0 and does not necessarily mean the
Fermi energy (EF) is located in a band of delocalized electronic states, as in a true metal.
Obviously, a maximum in conductivity occurs at the transition from semiconducting to metallic-
like behavior. Here it will be denoted by the temperature of the maximum conductivity, TσMax. It
has been reported previously in samples of SBN0.6 annealed at 10-14
atm pO2 at 1300 °C that
TσMax coincides with the TBurns of unreduced samples (see Chapter 3).32
This correlation was used

79
to hypothesize that the polarization could suppress metallic conduction. A possible mechanism
involved a spatially heterogeneous mixture of paraelectric metallic and ferroelectric
semiconducting phases, similar to ideas Jeong et al. put forward for BaTiO3-δ 147
-
An alternate explanation for the maximum in conductivity could be that the
semiconducting nature is due to incomplete ionization of donors. In this scenario the
semiconducting to metallic-like transition would be simply the saturation temperature for donor
ionization. The saturation temperature, Ts, is carrier-concentration dependent. That is30
,
𝑇𝑠 =𝐸𝑑
𝑘𝑙𝑛(𝑁𝑐𝑁𝑑
)
(4.1)
where 𝑁𝑐 is the density of states at the bottom of the conduction band, 𝑁𝑑 is the donor
concentration, and 𝐸𝑑 is the donor ionization energy. Therefore, in this model TσMax would be
reduction-dependent via changes to 𝑁𝑑 and 𝐸𝑑. The 𝑁𝑑 increases with reduction whereas 𝐸𝑑
should decrease with reduction. The decrease of 𝐸𝑑 with reduction occurs due to the spreading
out of the impurity band with increasing carrier concentration (see section 2.1.3). These
dependences on reduction push the saturation temperature in opposite directions. Changes in Ts
therefore depend on the specifics of how 𝑁𝑑 and 𝐸𝑑 change with carrier concentration. The key
first step was to determine either if the carrier concentration dependence exists, or if TσMax is
pinned at TBurns.
Samples of SBNx annealed under different reduction conditions have been measured in
the current study, by Dandeneau et al.176
, and by Li et al.177
. As is seen in Figure 4-1, samples
annealed at 1300°C under pO2=10-14
atm and 10-16
atm show TσMax at ~680K. In chapter 6 it will
also be shown that the TσMax is invariant in single crystals annealed at 1300°C under 10-14
, 10-15
,
and 10-16
atm. However, for samples annealed under pO2=10-12
atm, TσMax is at ~820K and,
although hard to see in Figure 4-1, the pO2 ~10-6
-10-10
atm samples have not yet reached TσMax
within the measured temperature range. This suggests that at low carrier concentrations TσMax

80
varies substantially while at higher carrier concentrations TσMax becomes pinned near TBurns. In
the current dataset, the switch from a carrier concentration dependent TσMax to an invariant TσMax
coincides with NbO2 formation.
Direct comparisons to literature samples are impossible without carrier concentration
data, but inferences can be useful if annealing conditions and electrical conductivities are used as
substitutes for comparison. Dandeneau et al. annealed SBN0.5 under forming gas at various
annealing temperatures ranging from 1000°C to 1150°C.176
A later study by Dandeneau showed
that the sample annealed at 1000°C showed an NbO2 secondary phase 178
The peak electrical
conductivities ranged from ~55S/cm to 125S/cm, and TσMax was ~600-700K for all samples.
Therefore, a ~2.3x change in the maximum electrical conductivity occurs with no discernable
change in TσMax. However, in the work of Li Ye et al. 177
it is shown that a change in TσMax occurs
between SBN0.61 samples annealed in pure Argon at 1100°C (phase pure) and a sample annealed
in forming gas at 1250°C (NbO2 present) . Given the sum of these results, it is likely that TσMax
becomes pinned once NbO2 forms, but a systematic study over a larger range of pO2 values is
necessary for confirmation. The pinning of TσMax occurs near TBurns determined from
stoichiometric compositions, but it is unclear given the current data if this is correlation or
causation. Clarity on this question requires further study of the electron transport mechanism in
SBNx. This discussion will be continued in the next section.
The Seebeck coefficients of SBN0.6 as a function of reduction are shown in Figure 4-2a.
The Seebeck coefficient decreases with increasing reduction, as expected due to increasing carrier
concentrations. More specifically, in samples annealed above 10-12
atm pO2, the Seebeck
coefficient decreases linearly with logarithmically decreasing values of pO2 during annealing
(Figure 4-2b). Samples annealed below 10-12
atm pO2 show a deviation from this linear behavior,
presumably due to the formation of NbO2. The Seebeck coefficient seems to be roughly
temperature independent, which is indicative of small polaron hopping.107
Specifically, linear fits

81
of S vs T for these samples result in slopes in the range of -0.08 µV/K2 to 0.05 µV/K
2.
Temperature invariant Seebeck coefficients were also reported in studies by Lee et al. on textured
SBN0.6 ceramics.161
However, the temperature independence of the Seebeck coefficient is not
generalizable to all samples, as pointed out by Lee et al. in studies on SBN single crystals 9.
Additionally, the seemingly polaronic dependence of the Seebeck coefficient is unlikely due to
the carrier concentration measurements presented in 5.3.4. The next section discusses how this
temperature independent nature is not due to the Heike formula (see 2.4.2), but due to the role
relaxor ferroelectricity plays in modifying the electron transport.
Figure 4-2. (a) Seebeck coefficient vs. temperature and (b) values of Seebeck coefficient at 500K
for different reduction conditions of SBN0.6. The magnitude of the Seebeck coefficient is
roughly temperature independent. It is noted that the Heike formula (Equation (2.57)) for
temperature independent Seebeck coefficients is not valid here, as explained in 3.3.2. Error bars
on (b) are a +-10% systematic error based on the loading and reloading of a sample multiple
times into the MMR system.
The optical conductivity of SBN0.6 as a function of reduction was also measured in an
attempt to investigate possible polaronic hopping behavior. At T=0K, absorption due to a small
polaron exists as an absorption band peaked at four times the hopping energy, 𝐸𝐻𝑜𝑝 from
Equation (2.12).179
The optical conductivity of SBN is shown in Figure 4-3.

82
Figure 4-3. Optical conductivity of (Sr0.6,Ba0.4)Nb2O6-δ from 10-10
atm pO2 to 10-16
atm pO2
measured via combination of FTIR and ellipsometry. The peak should be located near 4EHop.
Low energy tails are an artifact of data analysis due to the FTIR dataset ending in the middle of
an absorption peak.
The activation energy for hopping can be estimated from Figure 4-3 using the peak
conductivity. Table 4-1 compares the hopping energy from Figure 4-3 and from fits of
ln(𝜎𝑇) 𝑣𝑠. (𝑘𝑏𝑇)−1 for the data in Figure 4-1.
Table 4-1.
Annealing Atmosphere
(atm)
EHop(eV)
Optical Conductivity
Electrical Conductivity
10-10 0.26 0.18
10-12 0.21 0.16
10-14 0.16 0.14
10-16 0.14 0.12
Unfortunately only qualitative comparisons can be made. This is because the peak
energy is quantitatively equal to four times the hopping energy only at T=0K and for sufficiently

83
strong electron-phonon coupling strengths179
. As the data in Figure 4-3 were taken at room
temperature, the activation energies given from optical methods in Table 4-1 are estimates.
These estimates do, however, sit within the correct regime when compared to the activation
energy found from DC electrical conductivity. Caution should be stressed in the above
interpretation. Similar mid-IR absorption bands have been seen in La2-xSrxCuO4180
, Nd:SrTiO3181
,
and BaTiO3-δ182
, but interpretation of their cause is scattered. Interpretations range from
absorption due to small polaron hopping 183
, to absorption arising from oxygen vacancy related
defects 184
, to incoherent electron-phonon coupling causing spectral weight transfer from the
Drude peak via phonons 181
. Unfortunately little can be said without an underlying theory of the
mechanism behind the mid-IR band. Further work is clearly necessary.
4.3.2 Effect of Relaxor Ferroelectricity on Electron Transport in SBN
The electrical conductivities as a function of temperature for SBN0.4 through SBN0.7 are
plotted in Figure 4-4. The TσMax for SBN0.4, SBN0.5, and SBN0.6 occur around 680K, while
TσMax for SBN0.7 was outside the measurement range, >900K. Although the maximum
conductivity in SBN0.4-0.6 occurs near TBurns as measured in stoichiometric compositions of
SBN0.6 123
, the maximum conductivity of SBN0.7 is at much higher temperatures. This is
inconsistent with the idea that the conductivity maxima are fundamentally linked to TBurns.
However, the high temperature conductivity maxima of SBN0.7 presented here has been brought
into question due to later work conducted by Li et al. 185
. Li et al. show that SBN0.7 samples
have a TσMax at ~650K which is consistent with TBurns. This inconsistency between the two results
is troubling, but if the work of Li et al. is taken as correct, it brings SBN0.7 into line with
SBN0.4-0.6. It is unclear why the SBN0.7 samples in this current dataset show different
properties than those of Li et al., but it should be noted that the data in this thesis were confirmed

84
on three independently annealed samples from two independent powder batches of SBN0.7.
Therefore, although a link between TσMax and TBurns may be possible in SBN, it is unlikely to be
general. The lack of generality is in agreement with the result of Dandeneau et al., which shows
that the TσMax of (Ca0.18,Ba0.82)Nb2O6-δ is ~560K while TBurns is ~1200K150
. The lack of a link
between TσMax and TBurns does not mean electrical conductivity is unaffected by relaxor
ferroelectricity. It only means that the effects may be more subtle than a simple correlation
between TσMax and TBurns. Before further study into the subtleties of the conduction mechanism in
SBN, it is important to determine the effect of the reduction procedure on TBurns.
Figure 4-4. Electrical conductivities of (Srx,Ba1-x)Nb2O6-δ for SBN0.4-0.7 from 150K to 1000K.
Measurements at temperatures greater than ~450K were performed under a reducing atmosphere
consistent with the pO2 used during sample annealing. Maxima for SBN0.4-0.6 are located near
TBurns, while SBN0.7 has a maxima shift to higher temperatures.
Any line of thinking that tries to link relaxor ferroelectric polarization and electrical
conductivity must start with an understanding of TBurns in reduced samples. To check how the
TBurns is modified by reduction in SBN, temperature dependent lattice parameters were taken on

85
beamline 6-ID-D at the Advanced Photon Source, Argonne National Laboratories. The trend is
clearest when plotted as c/a ratio, which is shown for SBN0.6 in Figure 4-5.
Figure 4-5. The c/a ratio of a SBN0.6 sample from 375K to 660K. A linear dependence is seen
>~625K, suggesting paraelectric behavior. A decrease in c/a ratio is due to the short-range-order
polarization between 450K and 625K, and an increase is found <450K associated with the
freezing in of mesoscale polar nano-regions.
At temperatures above TBurns, the c/a ratio remains roughly constant. There is a decrease
in the c/a ratio on cooling at ~625K. This decrease is associated with the electrostrictive coupling
of polarization to lattice strain. As the nanopolar regions are formed, the polarization along the c-
axis causes both the c and a-axis lattice parameters to increase due to electrostriction175
.
Although the electrostrictive coefficient Q33 is larger than the Q13 coefficient, the larger a-axis
lattice parameter (a=12.44 Å vs. c=3.96 Å at room temperature) makes the c/a ratio decrease on
cooling, as can be seen in Figure 4-5 below ~625K. As the temperature is lowered below 450K,
an increase in the c/a ratio occurs. This is associated with the immobilization of mesoscale polar
nanoregions, as described elsewhere.186
Thus, TBurns for this oxygen deficient SBN is 625 ± 25K,
which is comparable to the TBurns in stoichiometric samples of 600K ± 25K175
and therefore

86
appears to be essentially invariant to the reduction condition. Therefore, the TBurns does not seem
to be heavily dependent on carrier concentration and the TBurns from stoichiometric compositions
was utilized in further analysis. This is in contrast to the Curie temperature in normal
ferroelectrics, which has been shown to be dependent on carrier concentration 187141
.
The model of electron transport in SBN also needs to be clarified. Clearly the high
temperature and low temperature regimes of SBN show different behaviors; therefore, the two
temperature regimes were investigated. To elucidate the conduction mechanism in SBN at low
temperatures, the natural logarithm of conductivity is plotted versus 𝑇−1/4 in Figure 4-6.
Figure 4-6. T-1/4
behavior of the conductivity is found below ~270K for all samples. Emin47
suggests this may be due to loss of multiphonon hopping processes below ~1/2TDebye. The value
for 1/2TDebye for SBN0.6 found by Henning188
is plotted and agrees with the onset of T-1/4
behavior.
A linear ln(𝜎) 𝑣𝑠. 𝑇−14⁄ behavior is found for temperatures below ~270K, with the onset
being slightly dependent on Sr/Ba ratio. There are two different possibilities for this behavior.

87
First, at temperatures below ~1
2TDebye a 𝑇−1
4⁄ behavior is indicative of small polaron hopping.
That is, since small polaron hopping requires interaction with phonons189
, the lack of high-energy
phonon modes below ~1/2TDebye results in T-1/4
behavior, as discussed by Emin47
. The Debye
temperature in SBN was found to be 460K by Henning et al.188, 190
. 1/2TDebye is marked on Figure
4-6 and is shown to correlate with the onset of T-1/4
behavior. Secondly, variable range hopping,
as described in 2.1.4, would be expected if the Fermi energy sits within a finite density of
localized states. Dandeandu et al. go through an analysis of variable range hopping behavior for
SBN.191
Using conductivity data augmented with the density of states at the Fermi level measured
by XPS, it was shown that the expected electron wave decay length was 5.5Å, close to the Nb-O-
Nb distance. This agreement of VRH analysis with a believable localization length for electrons
suggests that VRH may be occurring, but further research is needed to resolve whether variable
range hopping or short range hopping dominates in this temperature range.
At sufficiently high temperatures, small polaron conduction follows the well-known
equation 𝜎 =𝜎𝑜
𝑇𝑒𝑥𝑝 (
−𝐸𝐻𝑜𝑝
𝑘𝑇), where EHop is the activation energy for hopping. Therefore, at
higher temperatures the conduction should show a linear relationship between ln (𝜎𝑇) and 1 𝑘𝑇⁄
with a slope equal to EHop. A plot of 𝑙𝑛(𝜎𝑇) 𝑣𝑠 1𝑘𝑇⁄ is shown in Figure 4-7.

88
Figure 4-7. Natural log of electrical conductivity-temperature product plotted against reciprocal
thermal energy. A linear dependence is expected for small polaron controlled conduction. Areas
of SBN0.7 and SBN0.6 samples are linear, suggesting this mechanism within a small temperature
window, but high and low temperatures deviate from this dependence.
A line can be fit for a small region between ~300K and 450K for SBN0.7 and SBN0.6,
but the plot clearly becomes nonlinear at higher temperatures. No linear fits can be made for
SBN0.5 and SBN0.4 in any temperature regime. It would seem then that a small polaron picture
of conduction may be confined to the low temperature regime and cannot explain the high-
temperature properties.
The change from hopping conduction at low temperatures toward metallic-like
conduction as temperatures increase is suggestive of movement from conduction via donor states
to conduction via band states. That is, the ionization of donor states into the conduction band
may be occurring. To better understand this process, it is helpful to look at the activation energy
for donor ionization. This is usually done via fitting a line to a ln(σ) vs (𝑘𝑇)−1 plot assuming a
temperature-independent activation energy. Figure 4-7 suggests that the activation energy in the

89
high temperature regime is temperature dependent and therefore the temperature-dependent
activation energy must be obtained via differentiation of the ln(σ) vs (𝑘𝑇)−1 plot. Assuming a
conductivity dependence of 𝜎 = 𝜎𝑜𝑒𝑥𝑝 (−𝐸𝜎
𝑘𝑇), the differential activation energy is 𝐸𝑎(𝑇) =
𝑑𝑙𝑛(𝜎)
𝑑(1𝑘𝑇⁄ )
. This calculation was done numerically using the data from Figure 4-8 and is re-plotted in
this differentiated form in Figure 4-8.
Figure 4-8. Temperature dependent activation energies calculated from electrical conductivity
data. Changes in slope are found at 450K and 625K associated with the changes in polarization
in the sample, as discussed in the text.
Multiple regions exist with different values of the slope, 𝑑𝐸𝑎
𝑑𝑇. As discussed in 2.1.2, a
linear change in the activation energy can be due to the temperature dependence of the
conduction band edge. The values of 𝑑𝐸𝑎
𝑑𝑇 range from 2.5x10
-4 eV/K to 5x10
-4 eV/K and
are
comparable in magnitude to the change in band gap with temperature for SBN, ~10x10-4
eV/K192
.
The activation energies of <0.2eV are roughly consistent with donor ionization energies

90
assuming a hydrogen-like model 98
. This suggests activation from donor states or, if the carrier
concentration is large enough, an impurity band. As shown in Chapter 5, the carrier
concentration of these samples is roughly ~1021
/cc and therefore an impurity band is expected.
The 𝑑𝐸𝑎
𝑑𝑇 is dependent on the temperature regime. Low temperatures show a positive
slope, as is expected for ln (𝜎) ∝ 𝑇−1/4 behavior. For SBN0.4 a transition from positive to
negative slope is found near 270K and is attributed to the transition from hopping conduction to
electron activation into bands. This transition from T-1/4
behavior to activation into delocalized
states seems to skip over the regime where small polaron hopping follows Equation (2.12). The
broader transition from positive to negative 𝑑𝐸𝑎
𝑑𝑇 for SBN0.7 may be associated with a constant
Ea(T) which follows from Equation (2.12). This would explain why a small region in Figure 4-7
fits a line well.
Changes in 𝑑𝐸𝑎
𝑑𝑇 are found near both 450K and 630K, which correlate well to Tf and TBurns,
respectively. For example, in the SBN0.7 sample, there is, on cooling, an increase in 𝑑𝐸𝑎
𝑑𝑇 around
630K from 2.2x10⁻⁴
eV/K to 5x10⁻⁴
eV/K, and then a decrease to 0.3x10⁻⁴
eV/K below 450K.
SBN0.4-0.6 samples, whose maximum conductivity is near the TBurns, show the appearance of a
finite Ea(T) value at this point. SBN0.4 and SBN0.5 show no change in 𝑑𝐸𝑎
𝑑𝑇 at Tf, likely due to
their normal ferroelectric nature and therefore lack of the dynamic short-range order polarization
as observed in SBN0.6 and SBN0.7. The increase of 𝑑𝐸𝑎
𝑑𝑇 at TBurns suggests that
𝑑𝐸𝑎
𝑑𝑇 has two
contributions – one due to the temperature dependence of the conduction band edge and one due
to the relaxor ferroelectric polarization. SBN0.4 shows only the contribution of 𝑑𝐸𝑎
𝑑𝑇 due to the
temperature dependence of the conduction band edge. As the Sr concentration increases the
relaxor ferroelectric nature increases, and increased 𝑑𝐸𝑎
𝑑𝑇 causes the increased values of Ea shown
in Figure 4-8.
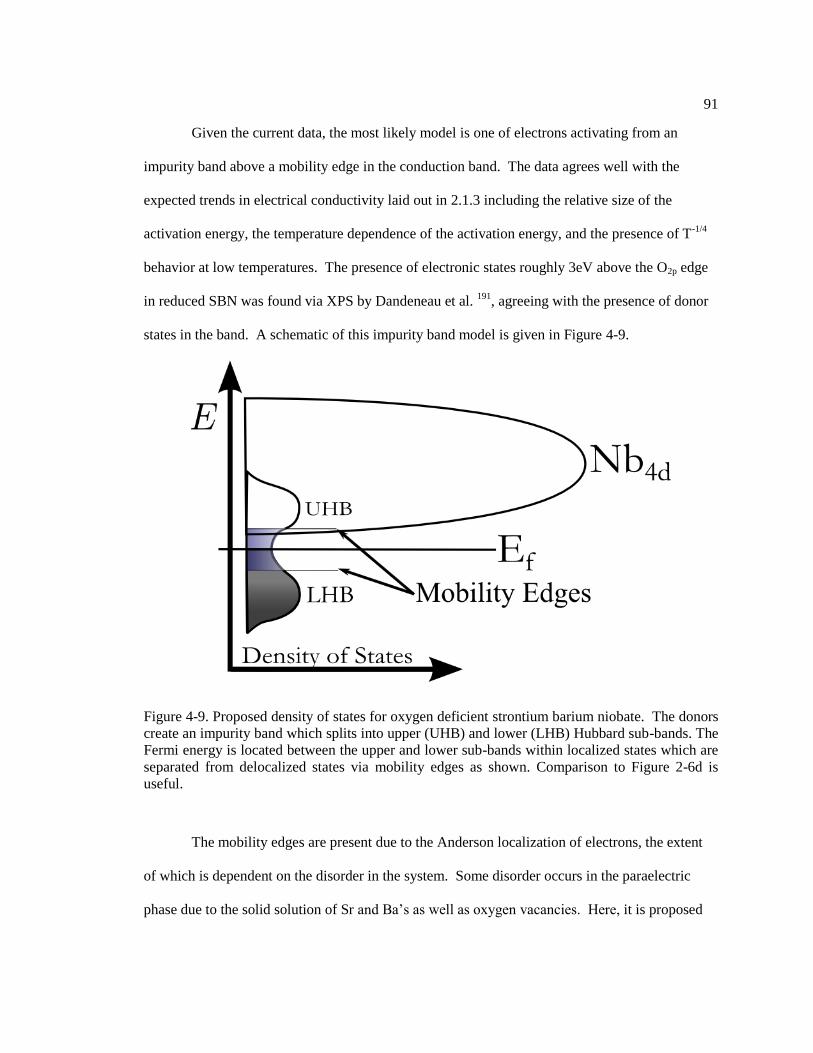
91
Given the current data, the most likely model is one of electrons activating from an
impurity band above a mobility edge in the conduction band. The data agrees well with the
expected trends in electrical conductivity laid out in 2.1.3 including the relative size of the
activation energy, the temperature dependence of the activation energy, and the presence of T-1/4
behavior at low temperatures. The presence of electronic states roughly 3eV above the O2p edge
in reduced SBN was found via XPS by Dandeneau et al. 191
, agreeing with the presence of donor
states in the band. A schematic of this impurity band model is given in Figure 4-9.
Figure 4-9. Proposed density of states for oxygen deficient strontium barium niobate. The donors
create an impurity band which splits into upper (UHB) and lower (LHB) Hubbard sub-bands. The
Fermi energy is located between the upper and lower sub-bands within localized states which are
separated from delocalized states via mobility edges as shown. Comparison to Figure 2-6d is
useful.
The mobility edges are present due to the Anderson localization of electrons, the extent
of which is dependent on the disorder in the system. Some disorder occurs in the paraelectric
phase due to the solid solution of Sr and Ba’s as well as oxygen vacancies. Here, it is proposed

92
that the nanopolar regions act as an additional source of disorder. As such, the increase in 𝑑𝐸𝑎
𝑑𝑇
below the TBurns is attributed to the disorder from the nanosized domains which grow in number
and size as temperature decreases below TBurns. The increased disorder would move the mobility
edge away from the EF and result in a decrease in the electrical conduction due to the increased
localization of electrons. Once the Tf is reached the polarization would stop influencing the
activation energy further, and changes in the activation energy would again be controlled by the
temperature dependence of the band. This transition occurs and is associated, for example, with a
decrease in 𝑑𝐸𝑎
𝑑𝑇 from 5x10
-4 eV/K to 2.5x10
-4 eV/K in SBN0.6 at 450K. In this model, no changes
to 𝑑𝐸𝑎
𝑑𝑇 occur in SBN0.4 and SBN0.5 because of the lack of relaxor ferroelectric polarization. The
long-range order of the polarization should not cause the Anderson localization necessary to
move the mobility edge away from Ef.
Further insight can be gained through looking at the Seebeck coefficient as shown in
Figure 4-10. It is clear that the temperature invariant Seebeck coefficient shown in Figure 4-2
does not appear in samples of all Sr/Ba ratios. In fact, a trend exists from a negative 𝑑𝑆
𝑑𝑇 for
SBN0.4 to a positive 𝑑𝑆
𝑑𝑇 for SBN0.7, and the temperature invariance of the Seebeck coefficient of
SBN0.6 simply seems to exist at the crossover between these two extrema. It is clear then that
the Heike formula is not applicable to SBN0.6.

93
Figure 4-10. 3-point moving average of measured Seebeck coefficients of (Srx,Ba1-x)Nb2O6-δ
from 200K to 600K and an SBN0.6 sample measured from room temperature to 750K. The
Seebeck coefficients of all samples coincide at the Burns temperature, and the SBN0.6 sample
continues the trend of the normal ferroelectric SBN0.4 and SBN0.5 samples above the Burns
temperature. This suggests that the nonlinearity found in the SBN0.6 and SBN0.7 samples is due
to the relaxor ferroelectric polarization.
To understand the data in Figure 4-10, comparisons were made to Ce3-xS4, which also
shows an Anderson localized band. Cutler and Mott explained the Seebeck coefficients data in
detail 193
for the low temperature range based on the idea that when 𝑘𝑏𝑇 ≪ 𝐸𝑚 − 𝐸𝑓 the
conduction electrons are located within a band centered on 𝐸𝑓 with a width of 𝑘𝑏𝑇. This is similar
to a metal, and it was shown that the Seebeck coefficient reduced to the Mott formula, Equation
(2.51), where the Seebeck coefficient is linearly dependent on temperature. It should be noted
that this only holds true when conductive electrons are only those from localized states.
Therefore, transport is dominated by hopping behavior between states around Ef. As temperature
increases, electrons will be activated above the mobility edge and will quickly dominate
conduction due to their higher mobility. If a gap exists between the impurity band and the
conduction band then the scenario should be similar to Equation (2.54) where electrons are

94
activated over a gap, and then 𝑆 ∝ 1
𝑇 (Table 1-1). If instead no gap is present an 𝑆 ∝ ln (𝑇)
dependence is expected (see 2.4.2). It is clear for SBN0.4 and 0.5 that no 𝑆 ∝ 1
𝑇 dependence is
present, but differentiating between a linear dependence and a logarithmic dependence of
Seebeck coefficient requires a larger measurement temperature range than performed in this
study. It is noted that the linear and logarithmic dependences both paint a similar picture in this
case – an impurity band localized via Anderson localization. This is in agreement with the
conductivity data and the model proposed via Figure 4-9.
As the Sr% increases from SBN0.4 to SBN0.7, differences in the Seebeck coefficients are
observed at low temperatures, but the Seebeck coefficients converge at higher temperatures. The
convergence point is near TBurns. This suggests that when local polarization is zero, the samples
all show similar behavior in Seebeck coefficients. The MMR Seebeck coefficient system
unfortunately measures only to 600K, so a SBN0.6 sample was measured using the Ulvac-Riko
ZEM-3 system at NASA Glenn Research Center. The measured values are plotted on top of data
from the MMR system on Figure 4-10. The Seebeck coefficients of SBN0.6 at temperatures
above TBurns seem to be an extension of the behavior found in the normal ferroelectric SBN0.4
sample. This fits with the idea that the increase in 𝑑𝐸𝑎
𝑑𝑇 at TBurns is caused by disorder due to the
relaxor ferroelectric polarization. Above TBurns SBN0.6 has no polarization and therefore follows
a similar trend to SBN0.4. Once SBN0.6 is cooled below TBurns, the disorder from the polarization
causes the mobility edge to move away from EF. This should decrease the band carrier
concentration and result in an increase in the magnitude of the Seebeck coefficient. The trends
are consistent within the series from SBN0.4 to SBN0.7. Normal ferroelectric SBN0.4 shows a
linear/logarithmic temperature dependence of the Seebeck coefficient as the long-range order of
the polarization plays little role, but as relaxor character is increased, the deviation from the
linear/logarithmic trend becomes larger. The convergence of all samples near TBurns and the

95
reemergence of linear/logarithmic behavior at T>TBurns suggests that the relaxor-based
polarization is strongly correlated to the phenomenon.
Although the proposed model fits most of the data, there are a few concerns to point out.
First, although the expected logarithmic dependence of Seebeck coefficient is found at high
temperatures, the derivation of this equation for a parabolic band results in a slope of 𝑆 𝑣𝑠 𝑙𝑛(𝑇)
of -298 µV/K2. The slope of the measured SBN0.4 sample is notably different: -170 ± 8 µV/K
2.
This discrepancy could be due to any mechanism that makes the band non-parabolic, such as
overlap between the impurity band and conduction band near Ef or due to the Hubbard band
splitting of the impurity band. Another complication arises from possible changes to the structure
or ferroelectric behavior due to the A-site filling discussed in Chapter 5. The presence of an
NbO2 second phase with no Ba or Sr-rich tertiary phases suggests that Ba and Sr are entering the
naturally present metal vacancies on the A-site. The filling of the A-site may thus play an
important role in octahedral bonding angles as well as the disorder of those angles. This would
perturb d-orbital overlap and subsequently the conduction. These details require further
examination, yet are not points which are inconsistent with the current model as a first order
approximation. It is therefore proposed that conduction in SBN is via electronic states in an
impurity band impurity band where the Fermi energy (EF) lies within localized states in this band.
The relaxor ferroelectric polarization in SBN seems to be a source of disorder. This affects the
location of the mobility edge and therefore the activation energy of electrons into delocalized
states, as shown via electronic conduction and Seebeck coefficient measurements. These results
do not suggest ferroelectric polarization completely suppresses metallic conduction, but only that
it can act as a source of disorder which may localize carriers.

96
4.4 Conclusions
Electrical conductivity and Seebeck coefficient measurements of SBN at different
reduction conditions and different Sr/Ba ratios were used to study the conduction mechanism.
Proposed here is a model where the EF is surrounded by a finite number of localized electronic
states that are separated from delocalized states via a mobility edge. This mechanism results in
hopping conduction at low temperatures, consistent with the observed 𝑇−1
4⁄ behavior. At high
temperatures the electrons activate from the impurity band over a mobility edge, consistent with
the temperature-dependent activation energy. Changes to the electron transport properties were
studied as samples were varied from normal ferroelectric to relaxor ferroelectric compositions.
Changes in the activation energy for electronic conduction and the Seebeck coefficient suggest
that the relaxor ferroelectric polarization acts as a source of disorder, thereby increasing the
extent of Anderson localization.

Chapter 5 The Effects of Low Oxygen Partial Pressures on the Phase Equilibria and
Cation Occupancy of Strontium Barium Niobate
Strontium barium niobate (SBN) is a tungsten bronze family ferroelectric which shows
promising thermoelectric properties under heavily reducing conditions. It is found here that the
enhanced electrical conductivity of oxygen deficient SBN correlates with the formation of a
NbO2 secondary phase. The effects of the reducing environment and the NbO2 phase formation
are studied via a detailed defect chemistry analysis. As harsher reduction treatments are used, the
amount of the NbO2 phase increases and is accompanied by an increase in the (Sr+Ba):Nb ratio of
the SBN matrix. This is facilitated by an interesting mechanism where the A-site occupancy of
the SBN matrix increases. The resulting donor defects cause the large carrier concentrations
which are the source of the enhanced electrical conductivity necessary for thermoelectric
performance. To better understand this A-site filling, the phase equilibria are examined in
compositions with increased strontium and barium concentrations. It is found that a solid solution
between (Sr0.6,Ba0.4)Nb2O6 and (Sr0.6,Ba0.4)1.2Nb2O6 exists, and that A-site filling occurs at much
more modest reduction conditions in Sr and Ba rich compositions. Finally, thermogravimetric
analysis of the reoxidation process is performed, and the results suggest that the A-site filling is
compensated ionically, possibly by the formation of oxygen interstitials. Not only do the
presented results explain the enhanced electrical conductivity of oxygen deficient strontium
barium niobate and point toward simplified processing routes for SBN thermoelectrics, but the
modification of the site occupancies by reduction and reoxidation may widen the design space for
property modification in tungsten bronze structured materials in general.

98
5.1 Introduction
Strontium Barium Niobate (SBN) is a ferroelectric material used in single crystal form
for electro-optic and photorefractive non-linear optic applications194, 195
; it has recently been
identified as a potential thermoelectric in its oxygen deficient state9, 32, 161
. SBN has a tetragonal
tungsten bronze structure with space group P4bm at room temperature120
and the unit cell shown
in Figure 5-1.
Figure 5-1. Tetragonal tungsten bronze crystal structure of strontium barium niobate. Corner-
shared NbO6 octahedra connect in-plane to form multiple cation sites labeled as A1, A2, and C-
sites. 1/6th of the A1 and A2 sites are empty in stoichiometric (Srx,Ba1-x)Nb2O6.
The formula unit can be represented as (A1)4(A2)2C4B10O30 where both the A1 and A2
sites host strontium ions, barium ions sit exclusively on the A1 site, the C-site is empty, and Nb
fills the B-sites inside the oxygen octahedra. Only 5/6th of the A1 and A2 sites are filled,
resulting in an A-site vacancy solid solution which is thought to contribute to the relaxor
ferroelectric properties of SBN.120, 121, 124, 196
Other tetragonal tungsten bronze materials show
different cation site occupancies including, for example, in the ‘stuffed’ bronzes like

99
K6Li4Nb10O30 where all of the A1, A2 and C-sites are completely filled197
, and the ‘filled’ bronzes
like Ba4Na2Nb10O30 where the A1 and A2 sites are filled but the C-sites remain empty.198
These
differences in cation occupancy can be important to functional properties. For example, cation
site occupancy influences the ferroelectric properties of tungsten bronzes, although research is
ongoing as to the mechanism 124, 199
. A recent survey of the field shows that the ordering of tilts
may be a key parameter199
, and changes in cation occupancy may affect these tilts.
Additionally, oxygen deficient strontium barium niobate has been gaining interest as a
potential thermoelectric material due to its low thermal conductivity and large thermoelectric
power factor 9, 32, 142, 176–178, 200, 201
. Research has focused on both benchmarking the thermoelectric
performance9, 161, 176, 177
and understanding how the ferroelectric nature of SBN affects thermal
conductivity185, 201
and electron transport32, 142, 191
. Multiple researchers have noted the formation
of an NbO2 secondary phase in reduced SBN 32, 178
and although the defect chemistry associated
with oxygen loss in the SBN matrix is often considered9, 178
, other changes to the SBN matrix
upon the formation of NbO2 are not. As the electrical conductivity of NbO2 is small compared to
oxygen deficient SBN172
it is unlikely this phase itself significantly enhances the thermoelectric
performance. Despite this, samples with large electrical conductivities nearly always show the
formation of a NbO2 phase142, 178
.
Understanding correlations between enhanced thermoelectric properties, the presence of
NbO2, and changes to the SBN matrix may give insights toward optimization of the
thermoelectric performance of SBN. Here the formation of the NbO2 phase is studied as a
function of annealing conditions with emphasis on changes to the A-site occupancy of the SBN
matrix. The results show an increase of the A-site occupancy in SBN which explains the
previously identified enhanced thermoelectric performance. The phase equilibria are then
expanded into Sr/Ba-rich compositions. Finally, the ramifications of these findings on the

100
oxidation resistance of SBN are discussed, and thermogravimetric analysis is used to study the
reoxidation.
5.2 Experimental Procedure
Phase pure (Sr0.6Ba0.4)Nb2O6 powders were fabricated via solid state reaction of SrCO3,
BaCO3, and Nb2O5 powder precursors weighed out to the correct stoichiometric ratios and then
heated to 1200°C for 6 hours. The high temperatures and long dwell times for calcination are
required to eliminate Nb-rich and Ba-poor regions which lead to abnormal grain growth via the
creation of a liquid phase at 1240°C140
. After ball milling and drying of the reacted powder,
pellets were uniaxially pressed at 15MPa, cold isostatically pressed at 200MPa, homogenized at
1200°C for 2 hours, and sintered at 1325°C for 6 hours to obtain >95% relative density142
. Dense
pellets were annealed at temperatures ranging from 950°C to 1300°C under oxygen partial
pressures ranging from 10-9
to 10-19
atm. The phase compositions of samples were detected with
powder X-ray diffraction (XRD) (PANalytical Empyrean).
An in-depth investigation was undertaken on a series of samples annealed at 1300°C and
partial pressures of oxygen ranging from 10-9
to 10-16
atm. In these samples, changes in the
chemistry of the SBN matrix were identified by using quantitative energy dispersive X-ray
spectrometry (EDS) (FEI Quanta 200 Environmental SEM with an Oxford Instruments X-act
10mm2 silicon drift detector) to measure the (Sr+Ba):Nb ratio and Rietveld refinements were
conducted to quantify the weight percentage of second phases in these samples. The refinements
were conducted using PDF#04-0072133, #01-073-0487, and #04-002-9010 using JadeXRD
analysis software. Samples for this investigation had compositions of (Sr0.6Ba0.4)Nb2O6,
(Sr0.6Ba0.4)1.1Nb2O6, and (Sr0.6Ba0.4)1.2Nb2O6 (SBN1.0, SBN1.1, and SBN1.2, respectively) and

101
were fabricated using the same starting powders, calcining, and sintering conditions previously
mentioned. Samples for EDS were polished down to 0.1µm diamond slurry and samples were
measured under a background pressure of 30Pa to avoid charging of the sample surface. Electron
beam intensity quantification was performed using copper foil and standardization of the EDS
signal was performed using a phase pure oxygen deficient SBN1.0 pellet, which was annealed
under 10-10
atm at 1300°C. Backscattered electron images were used to ensure that the EDS
signal was only from the SBN matrix and to confirm the phase purity of XRD results.
Thermogravimetric analysis was performed on SBN1.0 samples which were annealed at
1300°C under 10-10
to 10-16
atm pO2 using a TA Instruments TA2050. Samples were heated in
flowing air up to 800°C at 10°C/min using ~100mg of powder. Sample pans were cleaned before
each run by heating with an MAPP gas blowtorch.
Electrical conductivity tests were performed via a 4-pt probe measurement on rectangular
samples of roughly 1.5 x 1.5 x 10 mm using a Keithley Integra 2700 multimeter. Sample leads
were fabricated by sputtering platinum films through a shadow mask followed by attachment of
silver wires by high-temperature silver epoxy. During measurement, samples were held under
low oxygen partial pressure conditions to prevent reoxidation. Hall measurements on one
SBN1.2 sample annealed at 10-16
atm were performed at 300.00 K using a Quantum Design®
PPMS system. A Hall-bar geometry with Ga-In electrodes and silver wire leads were used. The
Hall resistance was measured as a function of magnetic field from 80000 Oe to -80000 Oe while
a current of 5 mA AC source and a vacuum of 5 mTorr were maintained. The misalignment
voltage was subtracted via use of magnetic field reversal.

102
5.3 Results and Discussion
5.3.1 Formation of NbO2 as a Function of pO2 and Temperature
Previous studies have identified the presence of the NbO2 phase in oxygen deficient SBN,
but no studies have been conducted to precisely determine the annealing conditions necessary for
NbO2 formation. Therefore, the phase diagram of (Sr0.6Ba0.4)Nb2O6-δ as a function of annealing
temperature and oxygen partial pressure was investigated and is presented in Figure 5-2.
Figure 5-2. Phase diagram of SBN at various annealing temperatures and partial pressures of
oxygen. Black squares are phase-pure SBN within XRD detection limits, red circles correspond
to a detectable amount of NbO2. The dotted line shows a constant oxygen vacancy concentration
assuming an oxygen vacancy formation enthalpy of 4.25 eV.
The NbO2 phase forms when SBN is annealed at high temperatures under low oxygen
partial pressures. As the annealing temperature is increased, the critical oxygen partial pressure
for NbO2 formation increases. This suggests that NbO2 forms once SBN reaches a critical
oxygen vacancy concentration. If so, then the one and two phase regions should be separable by

103
a line of constant oxygen vacancy concentration in the SBN phase. The pO2-temperature
conditions that control the thermodynamically stable concentration of oxygen vacancies can be
calculated using the law of mass action assuming the defect reaction:
𝑂𝑜𝑥 ↔ 𝑉𝑜
∙∙ + 2𝑒− +1
2𝑂2(𝑔) (5.59)
with an equilibrium constant of
𝐾𝑒𝑞 =[𝑉𝑜
∙∙]𝑛2𝑝𝑂21
2⁄
[𝑂𝑜𝑥]
(5.60)
where [𝑉𝑜∙∙] is the oxygen vacancy concentration per oxygen lattice site, 𝑛 is the electron
concentration, [𝑂𝑜𝑥] is the concentration of oxygens per oxygen lattice site, and 𝑝𝑂2 is the partial
pressure of oxygen used as a measure of the oxygen activity. When the following Brouwer
approximation can be employed:
𝑛 ≅ 2[𝑉𝑜∙∙] (5.61)
the pO2-temperature conditions are:
ln(𝑝𝑂2) = 2∆𝐻
𝑅𝑇+
2𝑆𝑐𝑜𝑛𝑓
𝑅+ 2𝑙𝑛 (
[𝑂𝑜𝑥]
4[𝑉𝑜∙∙]3) (5.62)
where: ∆𝐻 is the enthalpy of formation for an oxygen vacancy and 𝑆𝑐𝑜𝑛𝑓 is the configurational
entropy. The vibrational entropy is assumed to be negligible as a first order approximation. A
line that separates the one and two phase regions is obtained with a ∆𝐻 of 4.25 eV and [𝑉𝑜∙∙] of
0.002. These values are compatible with previous studies in SBN202
and the TGA data in Figure
5-7, discussed later. This condition is plotted as a dotted line in Figure 5-2. The good agreement
between Equation (5.4) and the onset of NbO2 formation suggests that the formation of NbO2 is
likely a result of the SBN reaching the solid solubility limit for oxygen vacancies. The result is
that under low partial pressures of oxygen SBN leaves the solid solubility regime and enters a
two-phase region resulting in the formation of NbO2.

104
5.3.2 Change in A-site Occupancy of the SBN Matrix During NbO2 Formation
Although a likely mechanism which determines the onset of NbO2 formation has been
identified, the mechanism by which enhanced thermoelectric properties occur must be
established. Toward this goal, the changes to the chemistry of samples were studied. To
understand the effect of NbO2, it is important to note that the NbO2 is the only secondary phase.
That is, samples above the critical oxygen vacancy concentration threshold are mixtures of SBN
and NbO2 with no strontium-rich or barium-rich tertiary phases, as confirmed by XRD (e.g.
Figure 5-3) and scanning electron microscopy (SEM). The conservation of mass dictates that the
total amounts of Sr, Ba, and Nb in the system must be kept constant before and after NbO2
formation. There are two possible ways for this to occur without a Sr/Ba-rich tertiary phase.
First, the excess Sr and Ba may either remain as defects in the SBN (and/or NbO2) matrix or,
secondly, the excess Sr and Ba may evaporate into the atmosphere as volatile species. The
second possibility was eliminated by the following experiment: SBN+NbO2 composites made by
annealing at 1300°C under a pO2 of 10-16
atm were re-annealed in air at 1300°C for 6 hours. The
XRD pattern after the air anneal shows only a phase-pure SBN (Figure 5-3) confirming the
reversibility of the reaction. Similar results were verified for multiple SBN+NbO2 composites. If
extensive cation volatility occurred, then the Sr and Ba would not be present to reform phase pure
SBN. Extensive cation volatility is therefore ruled out, and the accommodation of the excess Sr
and Ba is likely dominated by internal changes of the composition. A finite solubility of Nb
(perhaps as Nb2+
) on the A site is also possible. Clearly, however, this mechanism does not
dominate the response, given the observation of NbO2 second phase particles.

105
Figure 5-3. Offset XRD patterns of (Sr0.6,Ba0.4)Nb2O6-δ annealed at 1300°C under multiple partial
pressures of oxygen. An NbO2 phase forms starting at 10-13
atm pO2 and increases in volume
fraction for decreasing pO2. The NbO2-containing sample annealed at 10-16
atm pO2 was
reannealed in air at 1300°C for 30 hours, and shows only phase pure SBN.
To investigate the changes in composition of the SBN matrix, quantitative EDS spectra
were measured on the SBN matrix of SBN+NbO2 composites formed at 1300°C under multiple
pO2 conditions. Due to charging under the electron beam, an unreduced insulating sample could
not be used as a compositional standard. Quantification was instead achieved by presuming a
phase pure SBN sample annealed at 1300°C under 10-10
atm pO2 to have a (Sr+Ba):Nb ratio of
0.5. The (Sr+Ba):Nb ratio of 0.5 was found to be maintained in phase pure samples annealed at
pO2 values of 10-11
and 10-12
atm. As the partial pressure of oxygen during annealing is lowered,
the (Sr+Ba):Nb ratio increases toward a value of 0.593±0.015 (Figure 5-4(a)).

106
Figure 5-4. (a) The (Sr+Ba):Nb ratio in the SBN matrix of SBN+NbO2 composites increases
alongside the electrical conductivity. (b) Equation (5.5) correctly calculates the amount of NbO2
formed by using the (Sr+Ba):Nb ratio of the SBN matrix.
The onset of NbO2 formation occurs at 10-13
atm, the same sample in which the
(Sr+Ba):Nb ratio first increases above 0.5. Both the (Sr+Ba):Nb ratio and the Wt.% of NbO2
increase linearly as the partial pressure of oxygen decreases logarithmically below 10-12
atm pO2
(Figure 5-3 and 5-4b). It therefore seems that the (Sr+Ba):Nb ratio and the NbO2 phase formation
are linked.
The link between NbO2 concentration and the (Sr+Ba):Nb ratio could, in principle, be
explained either by an increase in Nb vacancies or via an increase in the Sr and Ba concentration
of the SBN matrix. The possibility of Nb vacancies can be ruled out based on the observation
that the electrical conductivity rises as the (Sr+Ba):Nb ratio increases. As SBN is an n-type
conductor142
, acceptor defects such as Nb vacancies (which would promote p-type conductivity)
are therefore unlikely. Thus, the exsolution of SBN into an SBN+NbO2 composite must be

107
accommodated by an increase in the Sr and Ba content in the SBN matrix. An increased A-site
occupancy is a likely mechanism for this to occur.
In air-fired (Srx,Ba1-x)Nb2O6 only 5 of the 6 A1 and A2 sites (where Sr and Ba occupy)
are filled, making SBN a vacancy solid solution with an A-site occupancy of 0.83. It is likely that
the increase of the (Sr+Ba):Nb ratio is a result of the filling of these vacancies toward a limiting
A-site occupancy of 1 and an end-member composition of (SrxBa1-x)1.2Nb2O6. The formation of
NbO2 would therefore be a consequence of this process. As phase equilibria investigations of Sr-
Ba-Nb-O systems show a finite solubility of excess Nb in SBN 203, 204
, one contingency is that
some of the excess Nb may remain in solution in the SBN matrix. The NbO2 would therefore only
form once the solubility limit for excess Nb in SBN is reached. The defect chemistry associated
with the Nb excess is uncertain, but possibilities include Nb sitting on the A-site similar to
materials such as Nb16W18O94205, 206
or possibly NbO-layer intergrowths as are found in multiple
reduced niobates 207–209
. In the absence of any Nb excess in solution, the reaction for NbO2
formation from an increasing A-site occupancy would be:
(1 + 𝑦)(𝑆𝑟𝑥𝐵𝑎1−𝑥)𝑁𝑏2𝑂6 →
(𝑆𝑟𝑥𝐵𝑎1−𝑥)1+𝑦𝑁𝑏2𝑂6 + 2𝑦𝑁𝑏𝑂2 + 𝑦𝑂2(𝑔) (5.63)
If Equation (5.5) is accurate, the Wt.% of NbO2 in the final composite could be calculated once y
is known; the value of y can be obtained using the (Sr+Ba):Nb ratio of the SBN matrix measured
via EDS:
(𝑆𝑟 + 𝐵𝑎)
𝑁𝑏 =
(1 + 𝑦)
2 (5.6)
This calculated Wt.% of NbO2 is compared to the values measured via Rietveld refinements in
Figure 5-4b and shows good agreement. This suggests that Equation (5.5) is appropriate,

108
meaning that the NbO2 formation is a response of the increased A-site occupancy and that Nb
solubility is negligible, within the error of the current measurements. Additionally, a sample
annealed under 5% H2/Ar forming gas at 1400°C was found to have an SrNb8O14-structured
tertiary phase and an SBN matrix with a (Sr+Ba):Nb ratio of 0.597±0.005. This agrees with a
prediction of the A-site filling hypothesis that the maximum (Sr+Ba):Nb ratio should be 0.6,
corresponding to an A-site occupancy of 1 with no excess Nb. After an A-site occupancy of 1 is
reached, any additional decrease in the oxygen activity is accommodated by an additional phase.
More accurate determination of the site occupancies could be achieved via Rietveld refinements
as has been done previously for air-fired SBN120, 121, 196
, but unlike previous studies the A-site
vacancy concentration must be refined in the current work. This additional degree of freedom
renders refinements of the system unconstrained if only XRD and compositional analysis are
used. Analysis of site-occupancies using simultaneous refinement of x-ray and neutron
diffraction data constrained via precise compositional analysis of the SBN matrix is an interesting
avenue for future work.
From the perspective of oxygen deficient SBN as a thermoelectric, the above finding
suggests that engineering the carrier concentration for maximum thermoelectric performance is
not a function of the concentration of oxygen vacancies only. The increased A-site occupancy
can be treated as the filling of neutral A-site vacancies with 2+ cations or, in Kröger-Vink
notation, 𝐴𝑉𝐴𝑥
∙∙ . These defects must be taken into account when engineering the carrier
concentration. For a filled SBN sample the expected carrier concentration, n, can be calculated
using the number of defects per unit cell, 6y, and the volume of the unit cell from the lattice
parameters. For y=0.2, the completely filled condition, and a unit cell volume of 615Å3 the carrier
concentration is calculated to be 4*1021
/cc. Such high carrier concentrations are near the
degenerate regime, consistent with proposed impurity band models for electron transport in

109
oxygen deficient SBN.142
Although previous studies assumed oxygen vacancies to be the major
donor defect 9, 32
, the difference of electrical conductivity before and after A-site filling starts to
occur (2.8 S/cm in 10-10
atm samples compared to 275 S/cm in 10-16
atm samples, Figure 5-4a)
suggests that the oxygen vacancies play a minor role. The low partial pressures of oxygen during
annealing seem to play the major role not by modifying the concentration of oxygen vacancies,
but instead by moving the equilibrium into a phase region where A-site filling is favorable. It
therefore seems that the correlation between the NbO2 phase and enhanced thermoelectric
properties occurs because the presence of NbO2 is a marker for the onset of A-site filling. In this
model the NbO2 is an unnecessary phase. Formulating compositions with various A-site
occupancies without excess Nb may result in phase pure samples with similarly enhanced
thermoelectric properties
5.3.3 Phase Equilibrium of (Sr0.6,Ba0.4)1+yNb2O6-δ at Low Oxygen Activities
To clarify the process of making phase pure A-site filled samples, the phase equilibria
of (Sr,Ba)1+yNb2O6-δ under low oxygen partial pressures is investigated. Two additional powders
were batched with compositions equivalent to (Sr0.6,Ba0.4)1.1Nb2O6 and (Sr0.6,Ba0.4)1.2Nb2O6, or
SBN1.1 and SBN1.2, respectively. Air-fired pellets of SBN1.1 and SBN1.2 were found to be
mixtures of SBN and (Srx,Ba1-x)2Nb2O7. The (Sr1-x,Bax)2Nb2O7 in these pellets all were measured
to be x≈0.17 via EDS, well within the solid solubility limits for (Sr1-x,Bax)2Nb2O7 of 0<x<0.35.210
For simplicity the notation “𝑨” will be used to refer to cations that are either Sr2+
or Ba2+
. These
air-fired pellets were annealed at 1300°C for 30 hours at pO2 values ranging from 10-9
to 10-16
atm, and the phase compositions were measured via XRD and Rietveld refinements.
The results are presented in Figure 5-5.

110
Figure 5-5. Phase composition of different SBN samples batched with different A:B ratios and
annealed at 1300°C under various pO2 conditions. Moving to the right on the plot corresponds to
an increase in the Sr and Ba chemical potentials. Note that decreasing pO2 is plotted along the
positive y direction. Samples with NbO2 as a secondary phase are marked with red circles, phase
pure samples are black squares, and samples with 𝐴2Nb2O7 are blue triangles. The SBN phase
region is limited by the solid solution limits of either oxygen vacancies or partial Schottky
defects.
Three regions are found, one with only phase pure SBN, one which shows the NbO2
secondary phase, and another which shows an A2Nb2O7 secondary phase. The dotted line which
separates the phase pure and SBN+A2Nb2O7 region extends down to SBN1.0 in air. Given the
results shown in Figure 5-2, the boundary between the phase pure SBN and SBN+NbO2 regions
is thought to be the solid solution limit for oxygen vacancies. The dotted line from Figure 5-2
would therefore be the extension of this boundary into the temperature axis. From Gibbs’ phase
rule for this 4 component system, the number of degrees of freedom in the single phase solid
solution regime is 5. The volumetric phase field in the quaternary diagram allows for independent

111
changes in temperature, pO2, and the other three individual component chemical potentials. Once
the solid solution limit of any component is reached, the system loses one degree of freedom and
the chemical potentials can no longer be changed independently. This results in the two-phase
regions in Figure 5-5. For the SBN+NbO2 phase region, both the amount of NbO2 which forms
and the composition of the SBN matrix would then be determined by the tie-line between this
phase boundary and the NbO2 phase field on the Sr-Ba-Nb-O quaternary molar phase diagram.
Similarly, the lower dotted line is thought to be the solid solution limit for partial Schottky
defects; the phase composition would be determined by the tie line between this limit and the
A2Nb2O7 phase field boundary.
When the SBN phase is in equilibrium with a secondary phase, the chemical potentials of
the different components are equal in both phases. This can be used to predict how the
boundaries between the one and two phase regions react to changes in the component chemical
potentials. For SBN-NbO2 composites this equilibrium results in:
2𝑁𝑏𝑂2 +1
2𝑂2 + 𝐴𝑉𝐴
𝑥∙∙ ↔ 2𝑁𝑏𝑁𝑏
𝑥 + 𝐴𝐴𝑥 + 5𝑂𝑜
𝑥 + 𝑉𝑜∙∙ (5.7)
This means, in terms of chemical potentials, that at the SBN-NbO2 equilibrium:
1
2𝜇(𝑂2) + 𝜇 (𝐴𝑉𝐴
𝑥∙∙ ) = 𝑐𝑜𝑛𝑠𝑡. +𝜇(𝑉𝑜
∙∙) (5.8)
As the oxygen vacancy solid solution limit has been reached, a decrease in the pO2 cannot be
accompanied with an increase in the 𝜇(𝑉𝑜∙∙). Hence, the result is an increased chemical potential
for 𝐴𝑉𝐴𝑥
∙∙ . The increased chemical potential of Sr and Ba in SBN1.1 and 1.2 increases the 𝜇 (𝐴𝑉𝐴𝑥
∙∙ )
and therefore decreases the 𝜇(𝑂2), explaining the positive slope of the upper phase boundary in
Figure 5-5.

112
For SBN- 𝐴2Nb2O7 composites at equilibrium:
𝐴2𝑁𝑏2𝑂7 ↔ 2𝑁𝑏𝑁𝑏𝑥 + 𝐴𝐴
𝑥 + 6𝑂𝑜𝑥 +
1
2𝑂2 + 𝐴𝑉𝐴
𝑥∙∙ (5.9)
and
𝑐𝑜𝑛𝑠𝑡. =1
2𝜇(𝑂2) + 𝜇(𝐴𝑉𝐴
𝑥∙∙ )
(5.10)
Therefore, decreasing the oxygen partial pressure results in an increase in 𝜇 (𝐴𝑉𝐴𝑥
∙∙ ) as confirmed
by the positive slope of the lower phase boundary in Figure 5-5. In both scenarios an increase in
the total (Sr+Ba):Nb ratio lowers the necessary oxygen activity for A-site filling.
The phase compositions of the samples are shown in Figure 5-6 alongside the
(Sr+Ba):Nb ratio of the SBN matrix measured via EDS. The amount of 𝐴2Nb2O7 phase present in
SBN1.1 and 1.2 is decreased compared to that of air-fired samples. This is corroborated by EDS
data which shows the SBN matrix in SBN1.1 and 1.2 pellets possess a (Sr+Ba):Nb ratio above
0.5 for all samples. Therefore, SBN1.1 and 1.2 have increased A-site occupancy even at 10-9
atm
pO2. This stands in stark contrast to SBN1.0, where changes to the A-site occupancy do not
occur until 10-13
atm pO2. It does, however, agree with the predicted equilibrium between SBN
and 𝐴2Nb2O7 outlined in Equation (5.10). Within the phase purity region of SBN1.1, the
(Sr+Ba):Nb ratio of the SBN matrix remains constant near the expected value of 0.55. Changes in
oxygen activity within these samples are accommodated by changes in the oxygen vacancy and
quasi-free electron concentrations according to Equation (5.2). This increased A-site filling in
samples with increased strontium and barium contents point toward easier processing routes for
thermoelectric SBN, as higher oxygen partial pressures may be used during annealing. The

113
electron transport properties of these phase-pure filled SBN ceramics are similar to those of
SBN+NbO2 composites.211
Figure 5-6. Phase composition of SBN samples batched with a (Sr+Ba):Nb ratio of (a) 0.50 (b)
0.55 and (c) 0.60 annealed at 1300°C at varying pO2 conditions. The amount of 𝐴2Nb2O7 drops
below that of air-fired samples at pO2 values as low as 10-9
atm, showing that A-site filling is
occurring at higher pO2 values in samples with increased (Sr+Ba):Nb ratios.
5.3.4 Reoxidation of (Sr0.6,Ba0.4)1+yNb2O6-δ
From a device standpoint, the equilibrium conditions are important for processing, but
more important is the stability of SBN under working conditions. Although filled SBN shows
promise as a thermoelectric, the lack of oxidation resistance is a major hurdle which needs to be

114
solved. The only quantitative numbers currently published show oxidation at temperatures as low
as 700°C202
, but changes in properties start to occur at much lower temperatures. It is widely
mentioned in experimental procedures that high temperature measurements of SBN are
performed under inert atmospheres142, 176, 212
, and polycrystalline SBN samples measured in 0.1
atm He above 480°C were reported to show degradation of the electrical properties142
.
Given the current results on A-site filling, the sensitivity of the electrical properties of
SBN to oxygen environments is peculiar. As discussed previously, a vast majority of the carrier
concentration is thought to occur due to the A-site donors rather than the compensation of oxygen
vacancies. While the oxygen vacancies may be filled via annealing in air, then the A-site donors
remain, and therefore require a negative compensating defects such as electrons. However,
oxygen deficient SBN annealed under 10-16
atm was annealed in air at 700°C for 3 hours and
resulted in a white powder of SBN and γ-Nb2O5. The white color of the powder points toward a
lack of electronic carriers, suggesting the A-site donors must be ionically compensated. The
defect chemistry for the ionic compensation scenario is puzzling, as the possible compensating
defects are either cation vacancies or some form of superoxidation. Both of these are unlikely.
Under the equilibrium condition in air the A-site donors would either react with NbO2 to form
SBN (for SBN1.0) or form an A2Nb2O7 phase (for higher Sr and Ba concentrations). However,
for the kinetically constrained condition of annealing at 700°C it is unlikely that cations could
migrate long distances. If the required 1021
/cc cation vacancies did form, then the aforementioned
secondary phases would be detectable via SEM or XRD (either as a crystalline phase or an
amorphous hump), and no evidence of such a secondary phase is found. Therefore migration of
the A-site donors out of the lattice is unlikely.
The sluggish cation motion means that compensation occurs via the anion lattice.
However, the formation of oxygen interstitials is unlikely due to their large size. The largest
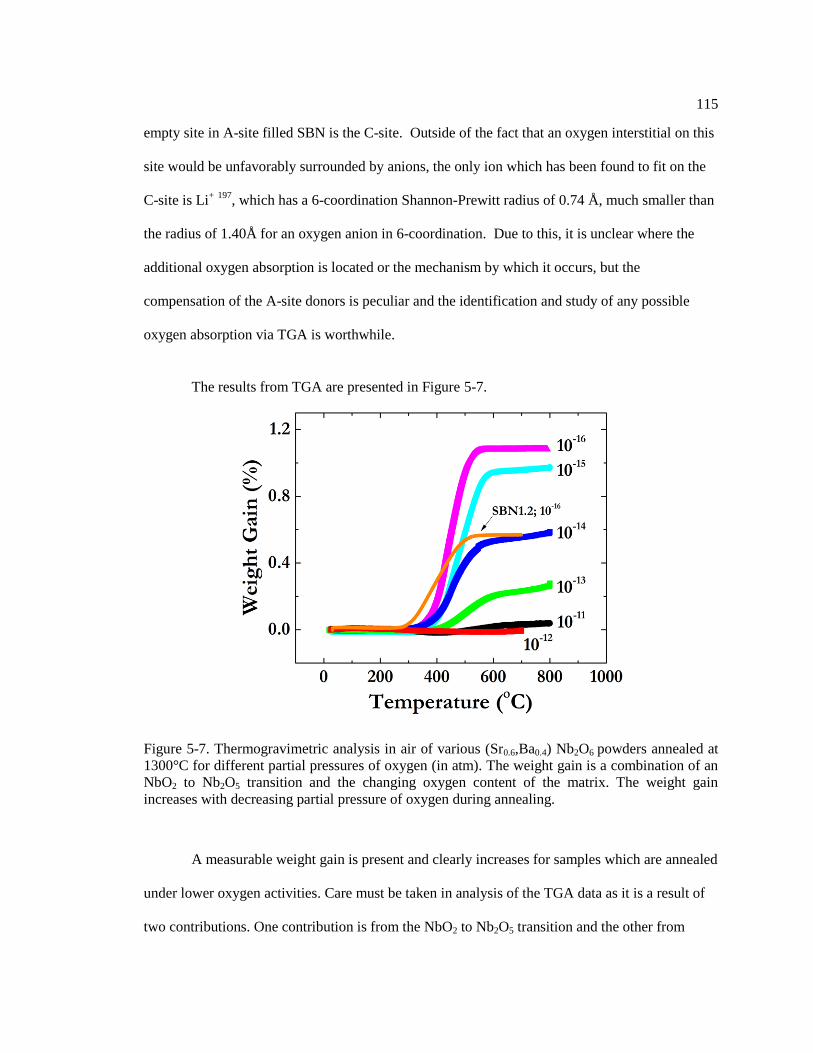
115
empty site in A-site filled SBN is the C-site. Outside of the fact that an oxygen interstitial on this
site would be unfavorably surrounded by anions, the only ion which has been found to fit on the
C-site is Li+ 197
, which has a 6-coordination Shannon-Prewitt radius of 0.74 Å, much smaller than
the radius of 1.40Å for an oxygen anion in 6-coordination. Due to this, it is unclear where the
additional oxygen absorption is located or the mechanism by which it occurs, but the
compensation of the A-site donors is peculiar and the identification and study of any possible
oxygen absorption via TGA is worthwhile.
The results from TGA are presented in Figure 5-7.
Figure 5-7. Thermogravimetric analysis in air of various (Sr0.6,Ba0.4) Nb2O6 powders annealed at
1300°C for different partial pressures of oxygen (in atm). The weight gain is a combination of an
NbO2 to Nb2O5 transition and the changing oxygen content of the matrix. The weight gain
increases with decreasing partial pressure of oxygen during annealing.
A measurable weight gain is present and clearly increases for samples which are annealed
under lower oxygen activities. Care must be taken in analysis of the TGA data as it is a result of
two contributions. One contribution is from the NbO2 to Nb2O5 transition and the other from

116
absorption of oxygen by the SBN matrix. However, these may be deconvoluted to a degree. This
is because the amount of NbO2 in the samples is known from the Rietveld refinements discussed
previously. Unfortunately, a combination of errors from both the Wt.% of NbO2 from Rietveld
refinements and the baseline drift in the TGA signal prevents precise deconvolution of the two
contributions, but rough estimates are possible. The calculated weight gain from the NbO2 to
Nb2O5 transition is 128𝑚𝑔
𝑔𝑁𝑏𝑂2, giving an expected weight gain of 0.6±0.1% for SBN1.0 annealed
under 10-16
atm pO2. This accounts for only roughly half of the measured weight gained. The
remainder must be due to absorption of oxygen by the SBN matrix.
The oxygen absorption by the SBN matrix could be from either filling of oxygen
vacancies and/or superoxidation. The samples annealed under 10-11
and 10-12
atm pO2, samples
with neither A-site filling nor NbO2, show no measureable weight gain discernable from the
baseline drift of the TGA. The 10-12
atm sample is near the solid solubility limit for oxygen
vacancies, and therefore its weight gain should estimate the maximum weight gain from oxygen
vacancies possible in any sample. As this weight gain is <0.1% (i.e., lower than TGA can
measure), it is thought that the contribution to the weight gain from the filling of oxygen
vacancies is minimal. The additional absorption of oxygen in the SBN lattice must therefore be
due to some form of superoxidation. The location of the excess oxygen is unknown, but for
simplicity an absorbed oxygen with a 2- charge will be denoted as an oxygen interstitial, [𝑂𝑖
′′].
The electroneutrality equation for SBN during low temperature reoxidation is then:
2 [𝐴𝑉𝐴𝑥
∙∙ ] + 2[𝑉𝑂∙∙] = 𝑛 + 2[𝑂𝑖
′′] (5.64)
Under the fully oxidized condition, [𝑉𝑂∙∙] is negligible and samples are insulating and white,
suggesting 𝑛 is negligible as well. Therefore, for oxidized samples we may write:

117
2 [𝐴𝑉𝐴𝑥
∙∙ ] ≅ 2[𝑂𝑖′′] (5.65)
Thus, under these conditions the weight gain of the SBN matrix during reoxidation is entirely due
to the superoxidation, [𝑂𝑖′′]. As the amount of superoxidation can be determined via the weight
gain measured via TGA, the [𝐴𝑉𝐴𝑥
∙∙ ] can be determined via equation (5.12). For the TGA data in
Figure 5-7 the concentrations lay in the range of ~1021
/cc. This result can be used to measure the
carrier concentration of oxygen deficient samples, because in oxygen deficient samples it can be
assumed [𝑂𝑖′′]=0 and [𝐴𝑉𝐴
𝑥∙∙ ] ≫ [𝑉𝑂
∙∙] resulting in Equation (5.11) simplifying to:
2 [𝐴𝑉𝐴𝑥
∙∙ ] ≅ 𝑛 (5.66)
Precise determination of n is hindered by the previously mentioned errors from TGA and
Rietveld associated with the NbO2 phase. A more accurate determination of n is possible if the
same analysis is performed on a phase-pure SBN1.2 sample annealed at 1300°C under forming
gas. The value of n in this sample was determined by two methods. The first method assumed that
the weight gain during TGA was due to superoxidation; 𝑛 was then calculated using Equations
(5.12) and (5.13). Secondly, carrier concentrations were determined on reduced samples by Hall
measurements. The TGA data for the SBN1.2 sample is presented alongside the TGA data for
SBN1.0 in Figure 5-7. The value of n calculated from TGA was found to be (2.6±0.3)*1021
/cc.
Hall measurements on this sample before reoxidation were performed by Chan et al.211
, and gave
a value for n of (2.3±0.3)*1021
/cc. The equivalence of these numbers suggests that the analysis of
Equations (5.11-13) is correct. From these results it seems that the lack of oxidation resistance is
not due to the filling of oxygen vacancies, but instead to the absorption of additional oxygen.
Additional research is necessary to identify the specific location of this oxygen in the lattice,
118
which should be possible via combinations of refinements of X-ray diffraction and Neutron
diffraction profiles. Knowledge of the oxygen interstitial position could help in identifying a
strategy for increasing the oxidation resistance of SBN thermoelectrics. As a final point, the lack
of an NbO2 phase in the SBN1.2 sample meant that the sample did not powderize due to the NbO2
to Nb2O5 transition upon reoxidation. The dielectric properties of reoxidized ceramic samples
were therefore measureable and were found to have a lower magnitude of the maximum
permittivity and a decreased temperature of maximum permittivity as is discussed elsewhere.211
Effects of the increased A-site occupancy and superoxidation on the structure-property relations
of tetragonal tungsten bronze dielectrics is an interesting avenue for future work.
5.4 Conclusions
Formation of NbO2 occurs in oxygen deficient SBN at high temperatures and low partial
pressures of oxygen once a critical oxygen vacancy concentration is reached. As the oxygen
activity decreases at a constant temperature, the amount of NbO2 increases and is accompanied by
an increase in the (Sr+Ba):Nb ratio of the SBN matrix. It is shown that the defect mechanism for
this change is the filling of the naturally occurring A-site vacancies in SBN, a mechanism which
results in donor defects. Using the chemical potential equivalence of cations between the matrix
and secondary phase, it is shown that increasing the (Sr+Ba):Nb in the starting batch results in an
increased chemical potential for A-site stuffing and affects the critical oxygen activity for second
phase formation. This provides an interesting route toward control of the carrier concentration in
thermoelectric SBN via the A-site filling. The lack of oxidation resistance of SBN under this
model is due to compensation of 𝐴𝑉𝐴𝑥
∙∙ by some form of superoxidation. All in all, the current
results show an interesting crystal-chemical modification of SBN due to processing in low partial
pressures of oxygen. The tungsten bronze structure possesses a large number of degrees of

119
freedom which allows for property design, and this new processing route widens the design
space. This helps not only to increase the utility of oxygen deficient SBN as a thermoelectric, but
should also be a useful tool in building a set of structure-property relations of tungsten bronzed
structured materials

Chapter 6
Thermoelectric Properties of (Sr,Ba)Nb2O6-δ Single Crystals: zT’s and
Anisotropy
In this chapter, the thermoelectric properties of SBN single crystals are revisited under an
expanded range of measurement temperatures and annealing conditions. The power factor of the
SBN single crystals measured here are lower than previously reported, 4.2µW/cmK2 rather than
19µW/cmK2 at 250°C for the 10
-14 atm pO2 annealing condition. Presuming polycrystalline
values of the thermal conductivity, zT values of 0.38 at 600°C are obtained. The formation of the
NbO2 secondary phase upon reduction is studied, and is found to deviate from that of the
polycrystalline samples of chapter 5 due to the lack of heterogeneous nucleation sites. The
Seebeck coefficient along the polar axis of the crystals shows similar behavior to relaxor
ferroelectric samples, while the nonpolar axis shows behavior similar to the normal
ferroelectric/paraelectric samples, providing evidence that the ferroelectricity is perturbing the
electron transport.
6.1 Introduction
Strontium Barium Niobate has been reported to have thermoelectric power factors as
large as 19µW/cmK2
along the c-axis of oxygen deficient single crystals. 9 These power factors
are similar in magnitude to other potential oxide thermoelectrics6, 110, 112, 114, 117
, but SBN possesses
the added advantage of a low thermal conductivity, <2 W/mK10
. The reported power factors in
conjunction with steady state thermal conductivity measurements resulted in a zT value of 0.75 at
250°C 32
. The power factors were shown to increase as a function of temperature and annealing
pO2, suggesting additional increases in zT are possible 9 .

121
The largest zT values reported for polycrystalline samples of SBN are ~0.2 at 830°C185
compared to ~ 0.75 at 250°C for single crystals. A decreased zT in polycrystalline samples is
expected as power factors along the c-axis were reported to be over ten times larger than the a-
axis.9 By multiplying the numerical averages of the reported thermoelectric property tensor
components, a power factor value of 5µW/cmK2 at 250°C is expected for polycrystalline
samples; however, no values >2.2µW/cmK2 at 250°C have been reported
176, 212–214 While
texturing increases the power factor 161
, the improvement was minor and an anisotropy of only
𝑃𝐹𝑐
𝑃𝐹𝑎~1.8 was found at a Lotgering factor of 82-90%. Given this, a reexamination of the
thermoelectric properties of single crystal SBN was deemed to be of interest.
One possible difference between single crystals and ceramics may be in the formation of
NbO2 during annealing. In chapter 5 it was shown that the NbO2 phase formation is concurrent
with an increase in the Sr/Ba-site occupancy under low oxygen activity conditions. The increased
A-site occupancy is thought to act as a donor source, thereby causing the large carrier
concentrations found in oxygen deficient SBN. The appearance of NbO2 therefore acts as an
important marker for enhanced thermoelectric properties. In polycrystalline materials, NbO2
nucleates heterogeneously at the grain boundaries; therefore the lack of grain boundaries in single
crystals may hinder NbO2 formation. As previous reports of SBN single crystals did not
investigate NbO2 development, a study of NbO2 in single crystals is conducted here.
The thermoelectric properties of single crystals over an extended range of temperature
and annealing conditions are reported. Values in line with reported polycrystalline data are
found, suggesting that previous reports are single crystals were anomalous. It was found that the
NbO2 formation conditions in single crystals differ from those of polycrystalline samples, but
adjusting for this difference via seeding NbO2 particles using a pre-anneal shows that this is not

122
the cause for the anomalous power factors of previous crystals. The anisotropy of the properties
is discussed, as is the role of ferroelectricity.
6.2 Experimental Procedure
Single crystals of strontium barium niobate were obtained from Altechna Co. (Vilnius,
Lithuania). Substrates of 10x10x1mm were aligned and cut into samples of 10x1x1mm in length
using a ADT ProVectus 7100 dicing saw. The single crystals were reduced using thermal anneals
in atmospheres with low partial pressures of oxygen. Anneals were completed in an alumina tube
furnace with temperatures measured via a sheathed thermocouple sitting directly next to the
sample. Annealing temperatures and times were kept constant at 1300°C and 30 hours. The
annealing atmosphere was varied to 10-11
, 10-14
, 10-15
, and 10-16
atm pO2. Control of the pO2 was
achieved using gas mixtures of H2 and H2O(g). H2O(g) was delivered via argon flowed through a
bubbler, and additional argon was used as a carrier gas.
Seebeck coefficients and electrical conductivities were measured on a Linseis LSR-3/800
Seebeck coefficient and electrical resistivity unit. Data were taken using the steady state
differential technique. 215
Measured temperature gradients were spaced ~1-2°C apart and were
limited to <15°C. The temperature reported is the average temperature over the Seebeck
coefficient measurement. The conductivity was measured by the four point probe technique
using the thermocouples as the inner leads. The conductivity was measured at each ΔT point, and
is reported as the average conductivity over the Seebeck measurement. Measurements were
made in an atmosphere of 1atm of 1%H2/He forming gas. The microstructure of SBN crystals
was determined via backscatter scanning electron microscopy (BSEM) using an FEI Quanta 200
Environmental SEM.

123
6.3 Results and Discussion
6.3.1 Formation of NbO2 in Single Crystal SBN
The main goal of this chapter is to elucidate the power factor values of single crystalline
SBN at different reduction conditions. However, within the study of these crystals the formation
of NbO2 was found to be different than polycrystalline samples. As the NbO2 is a marker for A-
site filling and therefore the donor concentration, a discussion of these findings is necessary to
understand the electron transport results. In Figure 6-1, BSEM images of polished cross sections
of SBN single crystals show the microstructure evolution for annealing at 10-11
, 10-14
, 10-15
, and
10-16
atm pO2 at 1300°C. NbO2 is identified as the darker grey regions, due to the Z-contrast.
This was confirmed via EDS.
Figure 6-1. Backscatter SEM images of polished cross sections of SBN single crystals annealed at
(from left to right) 10-11
(a,b), 10-14
(c,d), 10-15
(e,f), and 10-16
(g,h) atm. Cross sections are either
of the (100) (top row; a,c,e,g) or (001) (bottom row; b,d,f,h) planes.
For reference: NbO2 formation in polycrystalline samples annealed at 1300°C begins between
10-12
and 10-13
atm pO2 (see Figure 5-2). No NbO2 is found in the bulk of 10-14
atm pO2 crystals

124
(Figure 6-1c and 6-1d); however, NbO2 does form on the surfaces of single crystals annealed
under this condition (See Figure 6-2).
Figure 6-2. Backscatter SEM images of the (a) (100) and (b) (001) surfaces of an SBN single
crystal annealed at 1300°C for 30 hours under 10-14
atm pO2. In Figure 6-2b, an area is presented
where the surface NbO2 has spalled off, revealing an underlying layer of a porous SBN phase.
Similar surface phases are found for crystals annealed under 10-15
and 10-16
atm pO2.
The formation of NbO2 on the surface of crystals, but not in the bulk, suggests that the
homogeneous nucleation energy for NbO2 formation has not been overcome under the 10-14
atm
pO2 annealing condition. In contrast, when annealing pO2 is decreased to 10-15
atm or 10-16
atm
NbO2 nucleates in the bulk. This is likely due to an increased change in the Gibbs free energy
during NbO2 formation under lower pO2 anneals. Porosity located adjacent to NbO2 nuclei
(Figures 6-1e through 6-1h) presumably forms as a result of the volume change during the
transition.
An unexpected result is the presence of high aspect ratio porosity (~1-30µm long by
~100nm wide), a universal feature which is best seen in Figures 6-1c and 6-1d.Within the 10-11

125
and 10-14
atm pO2 samples these pores are homogeneously distributed, while in the 10-15
and 10-16
atm pO2 samples their distribution is heterogeneous. The heterogeneous spatial distribution of the
pores in the lower pO2 samples seems to be in relation to the formation of NbO2, as no pores are
found directly above or below the NbO2 particles along the c-axis of crystals (the c-axis is aligned
vertically for the SEM images of the (100) surfaces, Figures 6-1e and 6-1g). This interplay
between the NbO2 and the high aspect ratio porosity is currently not well understood. It is clear
that the formation of the elongated porosity requires the formation of new surfaces, and therefore
must overcome the energy barrier to provide the additional surface energy required, but it is
unclear what the source of this energy is. Under these annealing conditions, SBN is near the
phase boundary for NbO2 formation (See Figure 5-2). Perhaps the energy comes from a Gibbs
free energy change due SBN entering a new phase region, but within the current dataset this is
simply a conjecture.
The A-site filling is thought to be the cause for the large carrier concentrations of
polycrystalline oxygen deficient SBN, and it may be that the electrical conductivity is severely
reduced without homogeneous NbO2 formation.(see section 5.3.2) To test the differences
between the scenarios where NbO2 does and does not form, crystals equilibrated at 10-14
atm pO2
were compared with and without homogenous NbO2 formation. This was performed by first
annealing crystals under reduction conditions which lead to formation of NbO2, and then re-
annealing at 10-14
atm pO2. The electrical conductivities of the crystal were recorded after the
initial anneal and after each of multiple 30 hour anneals at 10-14
atm pO2. The results are shown
in Figure 6-3.

126
Figure 6-3. The electrical conductivities for c-axis oriented SBN crystals as a function of
annealing time at 10-14
atm pO2 after first annealing in different annealing conditions to either
allow or disallow bulk NbO2 nucleation.
The initial electrical conductivities show large differences. This is expected as the
crystals are equilibrated to different annealing conditions. Subsequent anneals at 10-14
atm pO2
show a convergence of both the 10-15→10
-14 and 10
-16→10-14
atm pO2 crystals. The electrical
conductivities did not change heavily after subsequent anneals, suggesting equilibrium was
reached on the first 30 hour anneal. The 10-14→10
-14 atm pO2 crystal shows only a small increase
in electrical conductivity after the additional 30 hours of annealing, and this trend continues up to
120 hours of total annealing time.
The presence of NbO2 in crystals is not discussed by Lee et al. 9. However, it is clear
that NbO2 formation does not occur in the bulk of crystals annealed under 10-14
atm pO2, and that
this affects the electrical conductivity. As the 10-14
atm pO2 condition is on the border of forming
NbO2, slight variations in temperature, annealing pO2, or crystal quality may affect the formation
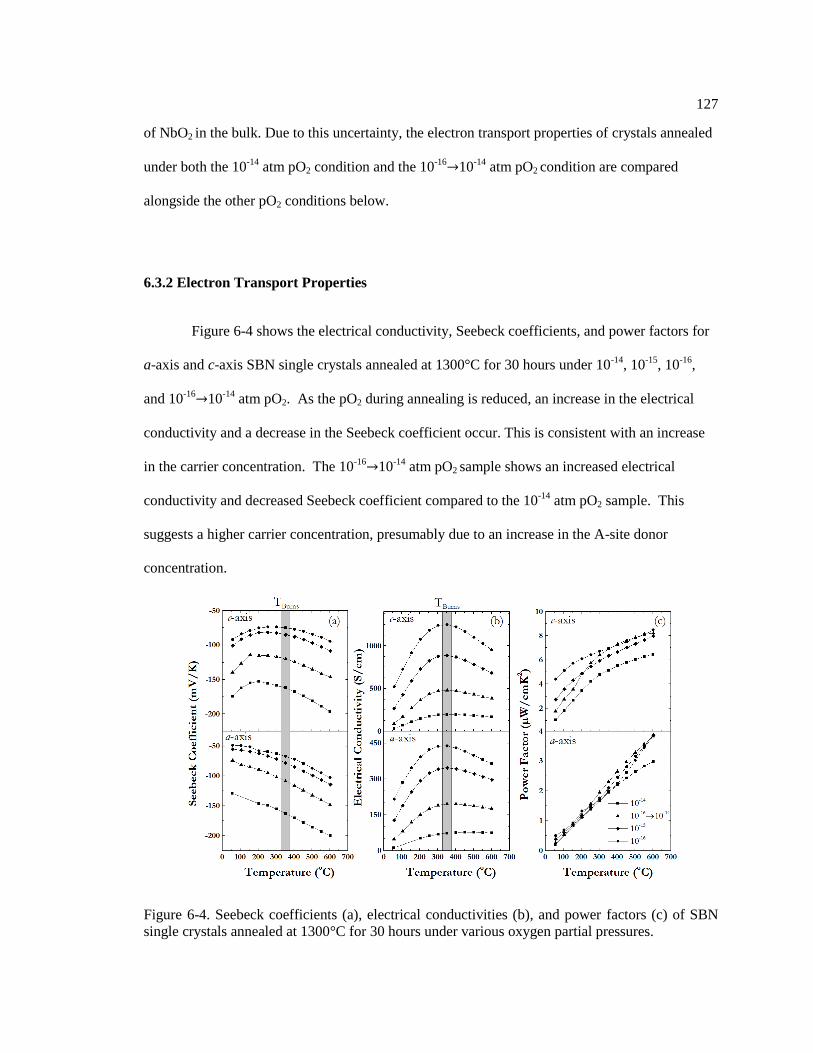
127
of NbO2 in the bulk. Due to this uncertainty, the electron transport properties of crystals annealed
under both the 10-14
atm pO2 condition and the 10-16→10
-14 atm pO2 condition are compared
alongside the other pO2 conditions below.
6.3.2 Electron Transport Properties
Figure 6-4 shows the electrical conductivity, Seebeck coefficients, and power factors for
a-axis and c-axis SBN single crystals annealed at 1300°C for 30 hours under 10-14
, 10-15
, 10-16
,
and 10-16→10
-14 atm pO2. As the pO2 during annealing is reduced, an increase in the electrical
conductivity and a decrease in the Seebeck coefficient occur. This is consistent with an increase
in the carrier concentration. The 10-16→10
-14 atm pO2 sample shows an increased electrical
conductivity and decreased Seebeck coefficient compared to the 10-14
atm pO2 sample. This
suggests a higher carrier concentration, presumably due to an increase in the A-site donor
concentration.
Figure 6-4. Seebeck coefficients (a), electrical conductivities (b), and power factors (c) of SBN
single crystals annealed at 1300°C for 30 hours under various oxygen partial pressures.

128
The Seebeck coefficients show different temperature dependencies in the a and c-axis
crystals. The c-axis crystals show a decreasing Seebeck coefficient at low temperatures, while at
high temperature the Seebeck coefficient increases with temperature. Note the y-axis scale of
Figure 6-4a, where the magnitude of the Seebeck coefficient decreases moving away from the
origin along the y-axis. In contrast to the c-axis, the Seebeck coefficient of a-axis crystals
increases over the entire temperature range. These two behaviors mimic the temperature
dependencies of relaxor ferroelectric and normal ferroelectric compositions of SBN,
respectively.142
In chapter 4 it was explained that the increased Seebeck coefficient below the
Burns temperature was a result of the relaxor ferroelectric polarization. As the c-axis is the polar
axis of the structure, it may be that the ferroelectric polarization is responsible for the anisotropy
in the temperature dependence. Above the Burns temperature, both the a-axis and c-axis show
nearly identical temperature trends and magnitudes of the Seebeck coefficient. Below the Burns
temperature, where ferroelectric polarization is finite, the c-axis deviates from the a-axis. The
change from roughly isotropic behavior to anisotropic behavior correlates well with the Burns
temperature, suggesting that the polarization along the c-axis is the cause. However, further work
on additional samples is necessary to confirm this. Specifically, if the ferroelectric polarization is
the cause of the anisotropic behavior, than this anisotropy should not exist in non-ferroelectric
tungsten bronze single crystals. Study of this behavior in other tungsten bronze crystals is an
interesting avenue for future work.
A transition in the electrical conductivity from semiconducting behavior at low
temperatures to metallic-like behavior at high temperatures occurs for all samples measured in the
current study. The location of this transition is quantified by the temperature of maximum
conductivity, TσMax. Identical transitions in SBN have been discussed previously by multiple

129
authors 142, 176, 177, 191, 216
. It has been hypothesized that this transition occurs due to the onset of
relaxor ferroelectricity 32
because the TσMax and TBurns in SBN correlate well 32, 142, 216
. Moreover,
similar phenomenon have been seen in other oxygen deficient ferroelectrics 216
. However,
analysis of the literature points to this being a coincidental correlation. First, although the
correlation between TσMax and TBurns holds for the relatively narrow set of reduction conditions
investigated in the current study, other studies have shown that TσMax will shift when a wider set
of reduction conditions are considered. For example, Li et al. 212
reports a TσMax of 550°C for
(Sr0.6,Ba0.4)Nb2O6-δ annealed at 1100°C under Argon compared to the TσMax of 350°C reported
here. Secondly, (Ca0.18,Ba0.82)Nb2O6-δ, which is isostructural to SBN, when reduced under
forming gas for 25hrs at 1000°C shows a TσMax of 260°C191
while the unreduced samples shows a
TBurns of 930°C150
. Finally, reduced samples of non-relaxor ferroelectric compositions of SBN,
which should not have any relaxor ferroelectric polarization, still show a TσMax of 350°C142
.
Nevertheless, changes in the conduction mechanism were found at the Burns temperature of
relaxor ferroelectric samples142, 191
suggesting that ferroelectricity does play a role in coupling to
electron transport. However, the connection between ferroelectricity and electron transport does
not seem to be as simple as equating TBurns and TσMax as has been previously hypothesized. The
reason for the reduction independent TσMax in the current work is unclear, but may be due to the
competing influence of the donor ionization energy, Ed, and the donor concentration, Nd, on TσMax.
If TσMax is equivalent to the carrier saturation temperature, then TσMax would be given by:
𝑇σMax =𝐸𝑑
𝑘𝑙𝑛 (𝑁𝑐𝑁𝑑
) (6.1)
As lower pO2 anneals are used, the Nd would increase thus pushing TσMax upward.
Simultaneously, as Nd increases, Ed decreases, pushing the TσMax downward. These competing

130
forces may be the cause of the carrier concentration independent TσMax found in this and other
studies176
.
The a-axis power factors are roughly independent of reduction condition, suggesting that
the 10-16→10
-14 atm pO2 to the 10
-16 atm pO2 conditions result in carrier concentrations near the
optimum carrier concentration for thermoelectric performance. The 10-14
atm pO2 condition
shows slightly lower power factors above 450°C, implying that it is somewhat below the
optimum carrier concentration. An identical trend is found for c-axis crystals at high
temperatures, with the 10-16→10
-14 atm pO2 to the 10
-16 atm pO2 conditions showing similar power
factors, while the 10-14
atm pO2 shows slightly reduced power factors. However, the c-axis power
factors show a clear pO2-dependence at low temperatures for all samples. The cause for this is
the larger c-axis Seebeck coefficient which is roughly ~50µV/K larger than the a-axis Seebeck
coefficient, independent of pO2. This additive contribution to the Seebeck coefficient increases
the optimum carrier concentration for maximization of the power factor, resulting in the
increasing trend from the 10-14
atm pO2 to the 10-16
atm pO2 annealing condition.
The maximum power factor measured in the current work is 8.4 µW/cmK2 at 650°C in
the c-axis 10-16
atm pO2 crystal. This falls below the previous report of 19µW/cmK2 at 250°C
9. To
compare these results, the electron transport properties of crystals from literature 9 are plotted
alongside data from the current manuscript in Figure 6-5.

131
Figure 6-5. Comparison of Seebeck coefficients, electrical conductivities, and power factors of
10-14
and 10-16
atm pO2 single crystals; Current work (closed symbols) and Lee et al. (open
symbols)9.
A majority of the Seebeck coefficient values for crystals measured in the current dataset
and from Ref 9 are similar in magnitude. The primary exception is that the Seebeck coefficients
of the two 10-14
atm pO2 c-axis SBN crystals differ by ~40µV/K at 250°C. However, the
temperature dependencies of the Seebeck coefficients seem to be roughly consistent between the
two datasets.
Near room temperature the electrical conductivities from Ref 9 and the current work agree
well. However, starting at 150°C the 10-14
atm pO2 crystal from Lee et al. deviates toward higher
electrical conductivities, resulting in a difference of roughly 2.7x at 250°C. The temperature
dependence of the two 10-14
atm pO2 samples also differs. The electrical conductivity of sample
measured by Lee et al. increases roughly exponentially, while the sample measured in this work,

132
as well as all other samples of this work and from Lee et al., go through an inflection point and
eventually a maximum. The difference between the currently measured power factor at 250°C
for a 10-14
atm pO2 crystal, 4.2µW/cmK2, and the value reported by Lee et al, 19µW/cmK
2, is
ascribed to differences in both the reported Seebeck coefficients and electrical conductivities.
As the 10-14
atm pO2 annealing condition sits near the edge of homogenous NbO2
nucleation, slight changes in annealing conditions may cause drastic differences in properties.
However, both samples with and without NbO2 nucleation (the 10-16→10
-14 and the 10
-14 atm pO2
samples, respectively) show lower power factors than the sample from Ref 9; therefore,
processing differences are not thought to be the cause of the discrepancy between the work of Lee
et al. and the current work. Currently, the cause of the discrepancy is unknown. As the entirety of
the current dataset agrees with the work of Lee et al. bar the c-axis 10-14
atm pO2 samples and the
currently measured 10-14
atm pO2 sample shows systematic behavior within the dataset, the 10-14
atm pO2 sample from Lee et al. is thought to be anomalous.
Figure 6-6. zT of a 10-16
atm pO2 annealed c-axis and a-axis single crystals of Sr0.6Ba0.4Nb2O6
using polycrystalline values of the thermal conductivity from Ref 185
. zT values of other n-type
oxide thermoelectrics are from References 6, 110, 114, 217

133
The zT values for the 10-16
atm pO2 crystal are plotted alongside other promising n-type
oxide thermoelectrics in Figure 6-6. As thermal conductivity measurements are difficult on the
small size of samples measured here, thermal conductivity values from polycrystalline samples
are substituted185
. A caution should be advised for this substitution, as the polycrystalline
samples likely did not show significant amounts of porosity and the thermal conductivity is likely
anisotropic, but the substitution does allow for a rough estimate of zT. With this stated, the
calculated zT value for c-axis SBN annealed under 10-16
atm pO2 is ~0.38 at 600°C. This value is
on par with other state-of-the-art oxide thermoelectrics, as shown in Figure 6-6. The a-axis
shows a lower zT but still reaches a value of roughly 0.17 at 600°C. These values suggests that
the tungsten bronze structured materials are an interesting avenue for future oxide
thermoelectrics.
6.4 Summary
The NbO2 formation in and thermoelectric properties of reduced (Sr0.6,Ba0.4)Nb2O6 single
crystals were investigated. The NbO2 formation of single crystals show similar pO2 dependencies
to that of polycrystalline samples in literature, although the lack of grain boundaries for
heterogeneous nucleation of NbO2 limits the formation of NbO2 in the bulk of crystals at 10-14
atm pO2 at 1300°C. A successful route for overcoming this limitation was to pre-anneal crystals
at harsher reduction conditions to seed the crystals with NbO2 nucleates followed by re-
equilibration at 10-14
atm pO2. The Seebeck coefficient along the c-axis and a-axis of samples
show dependencies reminiscent of relaxor ferroelectric and normal/non-ferroelectric samples,
respectively. This suggests that the polarization along the c-axis is the cause for the increase in
the Seebeck coefficient below the Burns temperature in relaxor ferroelectric SBN. The

134
maximum power factor for an SBN single crystal measured in this study was 8.5 µW/cmK2. This
value falls below the previously measured values of 19µW/cmK2 at 250°C
9, but still results in a
zT of ~0.38 at 600°C if polycrystalline values of the thermal conductivity are assumed. This
value falls below the previously measured values of 0.75 at 250°C, but are still large for an n-type
oxide in this temperature range.
135
Chapter 7 Conclusions and Future Work
These sections will overview the major findings of this thesis. Possible avenues of future
work are detailed in light of these results.
7.1 Conclusions
7.1.1 Coupling Between Ferroelectricity and Electron Transport
The electrical conductivity of a variety of oxygen deficient ferroelectric materials was
measured as a function of temperature and it was shown that in (Ba1-xSrx)TiO3-δ the metallic-like
to nonmetallic transition temperature can be shifted via Sr doping; furthermore, the temperature
shift is equivalent to the shift in the paraelectric-ferroelectric transition temperature in non-
reduced samples. This points toward a connection between the ferroelectric nature of materials
and the stifling of metallic conduction. However, it has been shown that the metal-to-insulator
transition does not always lay near the Burns temperature of (Sr1-x,Bax)Nb2O6-δ samples, as was
previously hypothesized. The metal-to-insulator transition may instead be a saturation of
electronic carriers from an impurity band. The Burns temperature does mark a change in the
activation energy of electronic conduction in SBN samples and the onset of an increasing
Seebeck coefficient on cooling.
These results do not eliminate the possibility of metallic conduction in the ferroelectric
state. In fact, a metallic ferroelectric has been identified by other authors in LiOsO3.134
These
results instead suggest that materials in which ferroelectric distortions and the conduction band
primarily originate from the same cationic sublattice – here the d0 cations – a cross-coupling
effect between ferroelectricity and the electronic conduction suppresses metallic conduction.

136
Anderson localization is a likely mechanism for this coupling, although additional coupling
mechanisms may exist such as changes in the band structure and spatial redistribution of
electronic carriers. Further research is needed to fully understand the extent of ferroelectricity on
electronic conduction.
7.1.2 Electron Transport in (Srx,Ba1-x)Nb2O6-δ
The electrical conductivity, Seebeck coefficient, and polarization-induced lattice strain of
(Srx,Ba1-x)Nb2O6-δ were investigated for 0.4<x<0.7. At low temperatures conduction occurs by
hopping of electrons via these localized states, resulting in characteristic T-1/4
behavior. As
temperature rises, electronic conduction is well modeled by activation of electrons over a
temperature-dependent gap. Within this high temperature region the electronic mobility is well
above the Bosman & van Dall218
limit for polaron mobility (µ<< 0.1cm2/Vs), necessitating band
conduction. Given the low temperature hopping behavior, high temperature band conduction, and
large carrier concentration (~1021
/cc), an electron transport model is proposed where the Fermi
energy lies within an impurity band of localized electronic states located below a the delocalized
d-orbital band. As relaxor ferroelectricity is introduced via compositional modification of the A-
site, an increase in the activation energy for electronic conduction is found, but only below the
Burns temperature. The effect of relaxor ferroelectricity is thought to be due to the introduction
of short-range order polarization which acts as a source of Anderson localization.
7.1.3 Formation of the NbO2 Secondary Phase and Resulting Changes in the SBN Matrix
It was found that enhanced electrical conductivity in oxygen deficient SBN correlates
with the appearance of an NbO2 secondary phase. NbO2 forms at different pO2 conditions as a

137
function of temperature. It is found that the NbO2 develops once a critical oxygen vacancy
concentration is reached. Past the oxygen vacancy solubility limit, harsher reduction treatments
result in increased amounts of NbO2 accompanied by an increase in the (Sr+Ba):Nb ratio of the
SBN matrix. The increased (Sr+Ba):Nb ratio is facilitated by a concomitant rise in the A-site
occupancy of the SBN matrix. The additional A-site cations act as donor defects, and cause the
large carrier concentrations which are the source of the enhanced electrical conductivity
necessary for the high thermoelectric performance of oxygen deficient SBN.
7.1.4 Phase Equilibrium Analysis of A-site filling in Oxygen Deficient SBN
To better understand the A-site filling, the phase equilibria of (Sr0.6,Ba0.4)1+yNb2O6-δ y=0-
0.2 was examined as a function of pO2 at 1300°C. It is found that a solid solution exists between
(Sr0.6,Ba0.4)Nb2O6-δ and (Sr0.6,Ba0.4)1.2Nb2O6-δ; EDS measurements found that increasing the initial
Sr and Ba concentration resulted in the occurrence of A-site filling at more modest reduction
conditions. The solid solution is bounded by the oxygen vacancy solid solution limit at low pO2
and the partial Schottky solid solution limit at high pO2. It was shown that increasing the
(Sr+Ba):Nb in the starting batch results in an increased chemical potential for A-site stuffing and
affects the critical oxygen activity for second phase formation. This provides an interesting route
toward control of the carrier concentration in thermoelectric SBN via the A-site filling.
7.1.5 Defect Chemistry of the Low Temperature Reoxidation of A-site Filled Strontium
Barium Niobate
Thermogravimetric analysis of the reoxidation process shows that oxygen absorption
starts to occur at ~250°C, and this poor oxidation resistance is a problem that must be solved for
use of SBN thermoelectric elements in air. The amount of oxygen absorbed, as measured by

138
TGA, was found to be the correct amount to completely compensate the A-site donors, and this
was confirmed using Hall measurements. The lack of oxidation resistance is detrimental to the
application of SBN as a thermoelectric, but insulating samples of A-site filled SBN were
obtained. These ‘superoxidized’ SBN samples have shown shifts in the permittivity to lower
temperatures and decreased permittivity magnitudes and may be interesting for future study in
tungsten-bronze structure-property relations.
7.1.6 Thermoelectric Properties of Strontium Barium Niobate Single Crystals
The NbO2 formation in and thermoelectric properties of reduced (Sr0.6,Ba0.4)Nb2O6 single
crystals were investigated. The NbO2 formation of single crystals follows a similar pO2
dependence to that of polycrystalline samples, although the lack of grain boundaries limits the
nucleation of NbO2 in the bulk of the crystals. Pre-annealing crystals at harsher reduction
conditions to seed the crystals with NbO2 nuclei followed by re-equilibration at 10-14
atm pO2
successfully overcame the kinetic limitation. The Seebeck coefficient along the c-axis and a-axis
of samples show dependencies reminiscent of relaxor ferroelectric and normal/non-ferroelectric
samples, respectively. This suggests that the polarization along the c-axis is the cause for the
increase in the Seebeck coefficient below the Burns temperature in relaxor ferroelectric SBN.
The maximum power factor for an SBN single crystal measured in this study was 8.5 µW/cmK2.
This value falls below the previously measured values of 19µW/cmK2 at 250°C
9, but still results
in a figure of merit ZT of 0.38 at 600°C if polycrystalline values of the thermal conductivity are
assumed. Polycrystalline values of the power factor calculated from the c-axis and a-axis values
agree with the literature on polycrystalline samples. Within the paraelectric regime, the power
factor changes little as a function of reduction between 10-14
and 10-16
atm pO2, suggesting these
reduction conditions are near the power factor maximum as a function of carrier concentration.
139
At temperatures below ~200°C, however, the additional Seebeck coefficient contribution along
the c-axis moves this maximum toward larger carrier concentrations and the 10-16
atm pO2
sample results in the largest room temperature power factor.
7.1.7 Effect of Current Results on the Design of Relaxor-Ferroelectric Based
Thermoelectrics
The final set of conclusions necessary is to discuss this work in its totality as to how it
relates to the design of relaxor-ferroelectric based thermoelectrics. The driving idea behind the
use of relaxor-ferroelectric based thermoelectrics is the decrease of the thermal conductivity due
to the scattering of phonons by nanosized polar regions. The thermal conductivity is not the only
necessary design parameter, however. All the thermoelectric properties must be optimized to
increase the figure of merit. The work of Chapters 3 and 4 show that relaxor ferroelectricity most
likely increases Anderson localization. This increased Anderson localization converts many of
the highly mobile band-conducting electron to localized electrons. The effect of this can be
thought of as an effective decrease in the carrier concentration. Therefore, although relaxor
ferroelectricity lowers the thermal conductivity, a higher electrical carrier concentration is
necessary to offset the increased localization. This can be seen, for example, in Figure 6-4c. All
samples in the paraelectric phase show carrier concentrations independent power factors, but,
within the relaxor ferroelectric regime, the power factor has a clear carrier concentration
dependence. This suggests that the peak carrier concentration (Figure 2-21) for these samples
shifts to higher values within the relaxor ferroelectric regime.
Although on the surface this is as simple as increasing the donor concentration,
increasing the donor concentrations in oxides may be difficult to achieve due to solid solubility
limits. 114
The solid solubility limit here has been circumvented via A-site doping during

140
reduction. Different doping techniques will be necessary in the future to overcome the limitation
of oxidation resistance at the temperature of applicaiton.
7.2 Future Work
The current work within this dissertation has been focused on a singular material –
strontium barium niobate. Power factors along the c-axis have been shown to have values similar
to other state-of-the-art n-type oxides and, in conjunction with the low thermal conductivity, have
shown figure of merits on-par with the best n-type oxide thermoelectrics to date. This is an
impressive proof of concept for ferroelectric-based thermoelectrics. However, moving
thermoelectric-ferroelectrics forward should not necessarily continue this focus on optimizing a
single material. Instead, future work should focus on identifying trends within these material
systems and optimizing the thermoelectric properties based on these trends. The future work laid
out here mainly focuses on projects based on this premise.
7.2.1 Investigation of Changes to the Ferroelectric Properties as a Function of A-site Filling
and Oxygen Content
Doping for tungsten bronze thermoelectrics will depend heavily on the substitution of A-
site cations. Understanding how both the ferroelectricity and crystal structure are affected by A-
site substitution is important for optimization of the thermoelectric properties. Work to ascertain
the structure-property relations of tungsten bronze ceramics is currently underway by many
groups, with a good summary given in Ref 199
. Proposed here is a study specifically designed to
elucidate a missing piece of that literature.

141
As discussed in section 5.1, many types of tungsten bronzes exist. The ferroelectric
properties are of tungsten bronzes are dependent on the crystal structure in multiple ways. For
example, an analysis of many tungsten bronzes has shown that relaxor ferroelectricity occurs in
samples with incommensurate structures.219
These structures are enabled by a high A1-site
tolerance factor and small average A-site cation radii.199
This model has explained previous
results which show that A-site cation radii play a role in the normal vs. relaxor ferroelectric
transition in unfilled bronzes. 220
However, little is known about how cation vacancies affect
these trends. These include the filled, unfilled, and empty varieties which are distinguished by the
structure of A-site cation vacancies. Opening up the design space for tungsten bronze
ferroelectric-thermoelectrics requires understanding of how the A-site vacancies affect
thermoelectric and ferroelectric properties. It was hypothesized by Zhu et al. that cation
vacancies permit a relaxation of the frustrated tilt network that gives rise to the incommensurate
modulation, thereby allowing for commensurate modulations to take place.199
In other words,
cation vacancies should push samples toward normal ferroelectric behavior. Normally, cation
vacancy concentration is modified by doping the A-site with aliovalent cations. This convolutes
two variables – cation size and vacancy concentration. SBN, however, is an interesting system to
investigate, as the A-site occupancy is easily modifiable without addition of separate cation
species. Phase pure samples of SBN with different A-site occupancies can be fabricated
following the phase diagram in Figure 4-5, resulting in (Srx,Ba1-x)5+y□1-yNb10O30. This is not a
perfect solution, however, as the carrier concentration will change with A-site filling. However,
given that it has been suggested that steric phenomena are an underlying cause of the changes to
tilting, the carrier concentrationshould be of smaller consequence than the cation size.
As for practical experimental details, (Srx,Ba1-x)5+y□1-yNb10O30of x=0.4 and y=0, 0.2, 0.4,
0.6, 0.8, and 1 may be investigated. A Sr concentration of 40% is suggested to insure that the

142
y=0 compositional end member is a normal ferroelectric, as the test is to see if filling of the
vacancies converts the sample to a relaxor ferroelectric. The theory laid out in Ref 199
shows that
the structural changes which determine normal vs relaxor ferroelectricity are the incommensurate
vs. commensurate tilting of the octahedral. The tilting structure of the different samples may be
investigated via electron diffraction patterns via transmission electron microscopy, and the
ferroelectric nature of samples can be determined via temperature dependent XRD as discussed in
section 3.3.2.
During measurement, samples must not be allowed to oxidize as the additional oxygen
absorbed by the lattice may affect the tilt structure, as discussed in section 4.3.4. The strategy for
mitigating high-temperature oxidation is to use capillaries similar to section 3.3.2. The Advanced
Photon Source beamline 11-BM allows for temperature-dependent XRD measurement of
capillary samples up to 1000°C. The greater accuracy of lattice parameters obtainable from 11-
BM compared to beamline 6-ID-D, the beamline used for the current thesis, would enable
qualitative determination of the magnitude of the polarization as a function of temperature. The
data would be qualitative only because the values of the electrostrictive coefficients Q33 and Q31
are necessary for data quantification, and even if these were available or measured on unreduced
samples, the change in Q33 and Q31 as a function of filling cannot be determined easily in
conducting samples. The combination of TEM and XRD data would allow for correlation of the
tilting structure and ferroelectric behavior in SBN over the filling transition. Over the filling
transition the electronic carrier concentration will change. This has been known to affect the
stability of the ferroelectric phase via screening of the ferroelectric polarization32
, but the
screening may be of less importance here as octahedral tilting should be less sensitive to
electronic carriers than the ferroelectric transition. Despite this complication, the nature of the
ferroelectricity (normal vs relaxor) is the key parameter to be measured and not the phase
transition temperature.

143
Additionally, the A-site filled SBN structure can be perturbed via the use of ‘super-
oxidized’ (Srx,Ba1-x)6Nb10O30+δ. Filled SBN can be oxidized in air below ~600°C and retain phase
purity while absorbing enough oxygen to electronically compensate the A-site donors (see section
4.3.4). The location of the oxygen in these super-oxidized samples is unknown, but clearly
should act to perturb the tungsten bronze structure and therefore should affect the dielectric
properties. Preliminary dielectric properties of these insulating samples have been measured 211
and have been found to shift the TMax to lower temperatures compared to stoichiometric SBN.
Understanding these changes within a crystal chemical framework requires knowledge of the
position of the extra oxygen in the crystal structure. The location of these oxygens should be
determinable via structure refinement of neutron diffraction patterns. Once the location of the
additional oxygen is well understood, a link between the filling of these super-oxidative sites and
the ordering of the oxygen octahedral tilts can be determined. Capacitance measurements as a
function of frequency and temperature can be used to discern between relaxor and normal
ferroelectric behavior.
An additional benefit of this research is investigation into any octahedral tilting which
may occur simultaneously. Octahedral tilting is important to the electronic conduction of
tungsten bronze thermoelectrics as the d-orbital bandwidth decreases with increasing oxygen
octahedral tilt angle221, 222
with the largest bandwidth at an O-Nb-O angle of 180°. Control of the
oxygen octahedral tilt angle is currently difficult from a crystal chemistry point of view as the
knowledge of the tungsten bronze structure is not as robust as those of perovskites. However,
some information has been gleamed from previous research. Zhu et al. proposed that the oxygen
octahedral tilt angle is dependent on the radius ratio between the A1 and A2 sites 223
. This is
based on the example of (Srx,Ba1-x)Nb2O6 where the Nb-O-Nb angle changes from 175.5° to
174.4° to 172.5° for x=0.25, 0.50, and 0.75 respectively124
, suggesting that moving the radius
ratio toward 1 will increase the oxygen octahedral tilting angle. However, in Ca0.28Ba0.72Nb2O6,

144
where Ca shows a strong preference for the A1 site, a Nb-O-Nb angle of 169° is found,
supporting the opposite trend224
. It has been shown that increases in tetragonality have been
linked to stabilization of the ferroelectric phase, and these increases in tetragonality correlate with
increases in ionic radii in both the B-site cations225
and the A-site cations220
. This suggests that
larger cation sizes will result in decreased oxygen octahedral tilt angles, although the tetragonality
term is convoluted with the presence of octahedral tilt around the [001] direction. Filling of A-
site cations during the reduction of SBN seems to be well suited to test if A-site vacancies heavily
affect the tilt angle. The tilt angle may be measured as a function of site filling via structure
refinements. As the lattice parameter of SBN increases upon A-site filling 201, 226
it is thought that
this tilt angle is decreasing with filling, thereby increasing the electron mobility.
7.2.2 Determination of Thermal Conductivity in a Variety of Normal and Relaxor
Ferroelectric Tungsten Bronzes
The thermal conductivity of Strontium Barium Niobate is glasslike at low temperatures
32. This fact was a major point of interest when choosing SBN as potential ferroelectric-
thermoelectric. Early papers suggested that the glasslike thermal conductivity is primarily due to
the relaxor ferroelectric nature of SBN. The results of Li et al.185
show that Ba-rich, oxygen
deficient SBN shows similar glasslike behavior. The Seebeck behavior, however, suggests that
the samples are normal ferroelectrics.185
If these glasslike samples are indeed normal
ferroelectrics, then the glasslike nature of SBN may not primarily be due to relaxor
ferroelectricity. This is not an impossibility, as neutron scattering measurements of SBN show
that low-lying optic phonon modes intersect the acoustic phonon modes227
, and this intersection,
similar to clathrates60
, may be the cause of the low thermal conductivity of SBN. If the low
thermal conductivity is not due to relaxor ferroelectricity, then the idea of ferroelectric-based

145
thermoelectrics may be unnecessary and instead focus should shift toward tungsten bronze
structured thermoelectrics outside of the subset of relaxor ferroelectric tungsten bronzes. If
relaxor ferroelectricity is not necessary, this vastly opens the design space of tungsten bronze
thermoelectric, giving greater hope of finding a possible high-zT material within the tungsten
bronzes. It is imperative that the role of relaxor ferroelectricity be determined, as this will allow
for better future planning of where to focus energy on the design of tungsten bronze
thermoelectrics.
To understand if the thermal conductivity is due to relaxor ferroelectricity or the ‘rattling’
of A-site cations, a series of samples may be measured which range from normal to relaxor
ferroelectric behavior. This may be done in SBN via changing the Sr:Ba ratio, similar to that
which was done in Chapter 3. It may seem very similar to the work of Ref. 185
, but the key
difference is the lack of A-site filling and electronic carriers. Outside of the measurement of
Figure 4-4 clear evidence on how A-site filling affects ferroelectric polarization is not available.
Therefore, it is simpler to investigate a system which is will understood – the unreduced variety
of strontium barium niobate. The ferroelectric properties can be easily understood using
capacitance vs temperature and frequency measurements to determine the normal or relaxor
ferroelectric nature, and this can be correlated to temperature-dependent thermal conductivity
experiments via laser flash diffusivity. If normal ferroelectric samples of SBN show glasslike
behavior similar to the Ba-rich samples of Ref. 185
then it would be shown that relaxor
ferroelectricity is not the cause of the glasslike nature. This does not, however, prove that relaxor
ferroelectricity does not play a role in the scattering of phonons. Domain walls have been shown
via separate means to act as phonon scattering sites 7, 8
; however, if relaxor ferroelectricity is not
necessary for the lowering of thermal conductivity for tetragonal tungsten bronze thermoelectrics,
than the ability to move away from the restrictive compositional space of only relaxor

146
ferroelectrics is lifted. This would enable further optimization of these tungsten bronze
thermoelectrics.
7.2.3 Increasing Stability of (Srx,Ba1-x)1+yNb2O6 in Air
For SBN to be a practically useful thermoelectric material, it must be stable at high
temperatures (>450°C) in air. The large power factors found in SBN are only achieved once
samples are equilibrated under reducing conditions and, as shown in section 4.3.4, on re-
equilibration in air, samples revert back to an insulating state. For real-world applications,
retention of the large power factors in air is necessary.
The processing of SBN in reducing atmospheres creates oxygen vacancies and increases
the A-site occupancy. In samples with increased A-site occupancy, the additional 2+ cations
sitting on normally vacant A-sites, 𝐴𝑉𝐴𝑥
∙∙ , are the major donor species. This means that if the
oxygen vacancies are filled without perturbing the 𝐴𝑉𝐴𝑥
∙∙ , the electronic carrier concentration
should show only minor changes. Unfortunately, annealing A-site filled samples in air fills not
only the oxygen vacancies, but additional oxygen is absorbed. This additional oxygen
compensates the A-site donors and therefore the material becomes insulating. The location of
these A-site compensating oxygen defects in the lattice is currently unknown. If the location of
the A-site compensating oxygen can be identified, then a doping strategy could be devised to
kinetically constrain their formation. For example, one possible site for the A-site compensating
oxygen is the empty C-site, as it is the largest empty volume in the crystal structure. If this is the
location of the additional oxygen, then addition of Li+ onto the C-site could severely hinder
oxygen diffusion along the channels of C-sites. This will not prevent the formation of oxygen
once equilibrium is reached, but may kinetically constrain oxygen absorption. It is unlikely that

147
this strategy alone will make samples fully oxidation resistant, but co-doping may help in
conjunction with additional strategies.
Another possibility is to block oxygen absorption via a coating on the material surface.
There are many types of possible coating processes which include, but are not limited to, atomic
layer deposition (ALD), dip coating of a sol-gel film, sputtered coatings, chemical vapor
deposition, and more. The main design parameter is for the coating is to prevent oxygen
diffusion. A scan of the literature shows potential in Al2O3 coatings 228–230
due to their low
oxygen diffusion coefficients. Using the diffusion coefficient of 2.7x10⁻¹⁹
m2/s measured in Ref.
230 for an ALD-deposited amorphous Al2O3 film, a 10,000 hour anneal at 900°C results in a
characteristic diffusion length of only ~3µm. The thermal expansion of Al2O3 and SBN are
similar with values of 8-9x10⁻⁶
/°C for Al2O3 231, 232
and 9x10⁻⁶
/°C for SBN75175
, suggesting that
films could remain crack-free during operation over 0-1000°C. There are many approaches to
prepare alumina films, including pulsed laser deposition233
, chemical vapor deposition234, 235
,
spray pyrolysis236
, sputtering237
, and sol-gel processing238–241
. Dense, crack-free 800nm films
deposited by dip-coating have been fabricated via sol-gel 240
although temperatures required for
removal of organics is ~600°C, and it would be necessary to investigate the oxidation of SBN
during this process. Crystallization of the sol-gel Al2O3 could be measured via TGA/DTA, which
would simultaneously measure any uptake of oxygen during the process. The quality of the
coating microstructure could be determined via SEM, and the phase can be determined via
grazing incidence x-ray diffraction. Oxidation resistance of the coated sample could be
determined via isothermal TGA at 1000°C in flowing air.

Appendix A: Control of Oxygen Partial Pressure
Control of oxygen partial pressure is key to investigating the defect chemistry of oxide
systems. The oxygen partial pressure is most commonly controlled via a reaction of gases with
different oxygen contents and controlling the oxygen content via Le Chatelier’s principle. In this
thesis the reaction used is:
𝐻2(𝑔) +1
2𝑂2(𝑔) ↔ 𝐻2𝑂(𝑔) (A.1)
Increasing the amount of 𝐻2(𝑔) will decrease the amount of 𝑂2(𝑔) and increasing the amount of
𝐻2𝑂(𝑔) will increase the amount of 𝑂2(𝑔). When a specific partial pressure of oxygen (pO2) is
required then the pH2 and pH2O can be controlled and the pO2 is therefore pinned via
thermodynamics. For Equation (A.1) the Gibbs free energy equation is:
∆𝐺𝑜 = −247,500 + 55.85𝑇 J (A.2)
where ∆𝐺𝑜 is the Gibbs free energy in the standard state (pressure of one atmosphere). The
equilibrium constant of Equation (A.1) is:
𝐾𝐸𝑞 = 𝑝𝐻2𝑂
𝑝𝐻2 ∗ 𝑝𝑂21
2⁄ (A.3)
The equilibrium constant and the Gibbs free energy of a reaction are related by:
∆𝐺𝑜 = −𝑅𝑇𝑙𝑛(𝐾𝐸𝑞) (A.4)
If Equation (A.2) is input into Equation (A.4), then:
ln(𝐾𝐸𝑞) =−247,500
𝑅𝑇+
55.85
𝑅 (A.5)
And insertion of Equation (A.3) with rearrangement gives:

149
𝑝𝑂21
2⁄ =𝑝𝐻20
𝑝𝐻2exp (
247,500
𝑅𝑇−
55.85
𝑅) (A.6)
The above equation shows that the partial pressure of oxygen depends on the 𝑝𝐻20
𝑝𝐻2 ratio
and temperature. The H2O is introduced into the gas via flowing a carrier gas through a bubbler.
The H2 is introduced either directly in its gaseous form or via a mixture of H2 and a carrier gas
called forming gas. The latter is useful as it is not flammable.
Two drawbacks of controlling pO2 via pH2/pH2O mixtures are the temperature
dependence of pO2 and the limited pO2 range. The temperature dependence of pO2 can be seen in
Equation (A.6) and means that during a furnace run a decreasing temperature will result in an
increased pO2. This increased pO2 can result in reoxidation of samples during furnace cooling.
This could lead to, for example, reoxidation of the grain boundaries of a reduced ceramic
resulting in an accidental barrier layer capacitor. Quenching under low pO2 may be needed to
alleviate this reoxidation problem.
The limited pO2 range of pH2/pH2O mixtures is seen in Figure A-1 for H2 flow of
1sccm-50sccm and N2 flow through a water bubbler of 10sccm-500sccm
Figure A-1. pO2 values obtainable from a 50sccm H2 and 500sccm N2 mass flow controller
through a room temperature water bubbler (green area) and flow of N2 through a H2O bubbler
only (yellow area).

150
The limited pO2 range is an experimental limitation. Gas flowmeters have a maximum
and minimum specified flow rate and therefore limit the range of deliverable pH2 and pH2O. The
high-pO2 range can be extended if pre-mixed gasses are used to source H2 (e.g. replacing pure H2
flow for 5% H2/Ar forming gas). One must be careful in this scenario, however. Mass flow
controllers are calibrated for a specific gas as the flow measurement depends on the heat capacity
and thermal conductivity of the flowing gas 242
. Care must be taken to accurately recalibrate
individual mass flow controllers for different gasses. The high-pO2 range can also be extended
by heating up the water in the bubbler to increase the amount of water delivered into the system at
the same flow rate. As the pH2O is introduced into the gas via a bubbler, the delivery of pH2O
depends on the saturated vapor pressure of liquid water at the temperature of the bubbler. As
anyone with itchy skin from the dry winter air knows, the saturation limit of water changes
drastically with temperature. The saturation vapor pressure of a liquid is given via the Clausius-
Clapeyron equation, but near room temperature it is common to use the empirically determined
Antoine equation:
𝑙𝑜𝑔10𝑝 = 𝐴 − 𝐵
𝐶 + 𝑇
(A.7)
where 𝑝 is the vapor pressure, T is temperature, and A, B, and C are material-specific constants.
The Antoine equation constants for water are: A=8.07131, B=1730.63, and C=233.426 for T=1 to
100°C. If extending the high-pO2 range via the above techniques is not enough, then gas mixtures
of CO and CO2 may be used. The ∆𝐺𝑜 of the reaction allows for higher pO2 control at the cost of
using poisonous gas. If this is the only route available, then CO sensors must be placed in the
room to protect against CO poisoning. Extending the controllable pO2 range toward the lower pO2
values is limited by the mount of possible H2 flow based on safety concerns and the lowest
controllable flow rate for gas through the bubbler. If the H2O source is turned off lower pO2

151
values may be reached using pure forming gas, but the actual pO2 will no longer be controllable
and will depend on the humidity in the gas lines or source gas, leaks in the system, or other
unknown sources of humidity. In this scenario the pO2 must be measured directly.

Appendix B: Seebeck Coefficient Measurements
From a surface level appreciation, Seebeck coefficient measurements are simple. The
Seebeck coefficient is simply as a voltage which results from a certain temperature gradient:
𝑆 = 𝑉
∆𝑇 (A.8)
Therefore, in principle all that would be required is a measurement of both the
temperature gradient, ∆𝑇, and the corresponding voltage, 𝑉. In practice, the small size of the
voltages being measured both across the samples and from the thermocouples leads to large
propagated errors. J. Martin et al. from the National Institute of Standards and Technology say it
best, “Measurement of the Seebeck coefficient is an exhaustive exercise in low voltage
metrology, requiring meticulous attention to the thermal and electric contact interfaces between
the probes and the sample, as well as to the instrumentation.” 215
Many errors will accumulate in
the process of measuring the Seebeck coefficient, although many can be mitigated to a large
degree. This section summarizes some of the main error sources and proper measurement of the
Seebeck coefficient to minimize these errors. Commercialized Seebeck Coefficient measurement
systems will often ignore large sources of error, so one must understand the physics and
intricacies of measuring the Seebeck coefficient and avoid treating commercial systems as black
boxes.
The four-point-probe measurement arrangement for Seebeck coefficient measurements is
shown in Figure A-2.
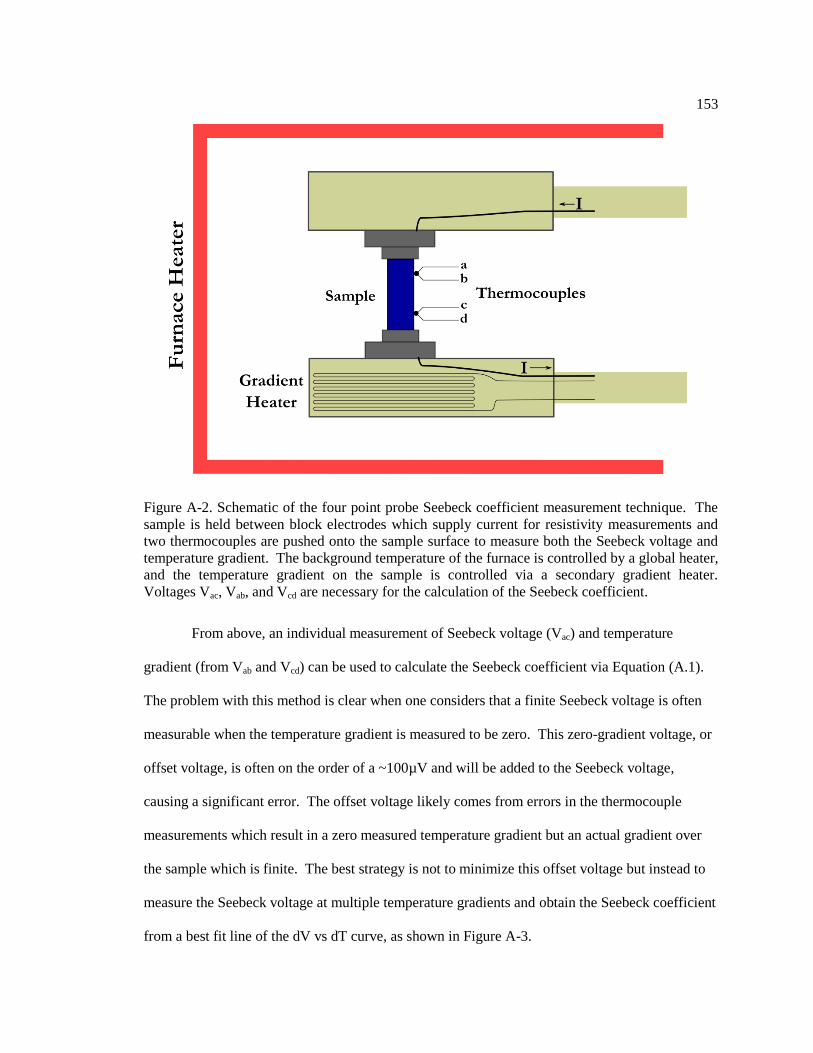
153
Figure A-2. Schematic of the four point probe Seebeck coefficient measurement technique. The
sample is held between block electrodes which supply current for resistivity measurements and
two thermocouples are pushed onto the sample surface to measure both the Seebeck voltage and
temperature gradient. The background temperature of the furnace is controlled by a global heater,
and the temperature gradient on the sample is controlled via a secondary gradient heater.
Voltages Vac, Vab, and Vcd are necessary for the calculation of the Seebeck coefficient.
From above, an individual measurement of Seebeck voltage (Vac) and temperature
gradient (from Vab and Vcd) can be used to calculate the Seebeck coefficient via Equation (A.1).
The problem with this method is clear when one considers that a finite Seebeck voltage is often
measurable when the temperature gradient is measured to be zero. This zero-gradient voltage, or
offset voltage, is often on the order of a ~100µV and will be added to the Seebeck voltage,
causing a significant error. The offset voltage likely comes from errors in the thermocouple
measurements which result in a zero measured temperature gradient but an actual gradient over
the sample which is finite. The best strategy is not to minimize this offset voltage but instead to
measure the Seebeck voltage at multiple temperature gradients and obtain the Seebeck coefficient
from a best fit line of the dV vs dT curve, as shown in Figure A-3.

154
Figure A-3. Temperature difference vs. Seebeck voltage plot. The Seebeck coefficient is given by
the slope.
Some commercial systems do not do this, instead opting for measuring a single Seebeck
voltage and temperature gradient. The LSR-3 system used in the present performs in this manner,
and additional data analysis must be performed to output Seebeck coefficients calculated from dV
vs dT curves.
There are two common ways to measure multiple Seebeck voltages and temperature
gradients. The first is via a steady state (or DC) approach where an applied temperature gradient
is allowed to stabilize for a set dwell time, and then the required voltage measurements are taken
(Vac, Vab, and Vcd). This is the most accurate method, but takes a long time as a dV/dT line
usually contains ~10-20 points and the entire line must be measured at each temperature gradient,
resulting in measurements which take nearly an entire day. An alternative method is quasi-steady
state (or qDC) measurements. In a qDC measurement the temperature gradient is steadily ramped
at a slow rate and the three required voltages are measured during the ramp. This obviously
introduces errors as Vac, Vab, and Vcd are not measured simultaneously (bar the investment of

155
three nanovoltmeters) and therefore error is introduced in the temporal inequivalence. The
magnitude of this error has been quantified by J. Martin et al. at NIST (by investing in three
nanovoltmeters).215
For a 2.3 second delay between voltage measurements at 23mK/s heating
rate the error in the Seebeck coefficient is ~9.5%. Due to the significant speed up in the
measurement, qDC is often the preferred technique, but minimization of this error with quick
sequential measurements or heating rates is desirable. Due to software limitations the LSR-3
system used in this thesis cannot measure qDC measurements, but accurate values were
obtainable using DC measurements.
As the Seebeck coefficient of the lead wires is finite, the measured Seebeck voltage is the
Seebeck voltage of the circuit and includes contributions both from the sample and the lead wires.
Knowledge of the Seebeck coefficient of the lead wires as a function of temperature is required to
correct for this error. Many Seebeck systems use platinum wiring as the Seebeck coefficient of
platinum is well known 243
. The uncorrected Seebeck coefficient of the sample from the circuit is
called the ‘relative Seebeck coefficient’ (RSC) while the Seebeck coefficient of the sample alone
is the ‘absolute Seebeck coefficient’ (ASC). The absolute Seebeck coefficient of the sample can
be obtained by adding the absolute Seebeck coefficient of the wiring, or:
𝐴𝑆𝐶𝑆𝑎𝑚𝑝𝑙𝑒 = 𝑅𝑆𝐶𝑆𝑎𝑚𝑝𝑙𝑒 + 𝐴𝑆𝐶𝑊𝑖𝑟𝑖𝑛𝑔
Additional errors come from improper measurement of the sample temperature via the
thermocouple. Once source of error of this type is due to the thermocouple-sample interface.
This interface is important as the thermocouple will measure the temperature not of the sample
but of the thermocouple bead, and therefore the thermocouple bead should be in good thermal
contact with the sample. A good thermal contact between the thermocouple bead and the sample
can be achieved in a couple ways. The atmosphere of the chamber may be filled with a gas which
allows for good thermal transfer. Measuring under a vacuum will allow for a larger thermal
gradient over the sample, but will increase the thermal contact resistance of the sample-
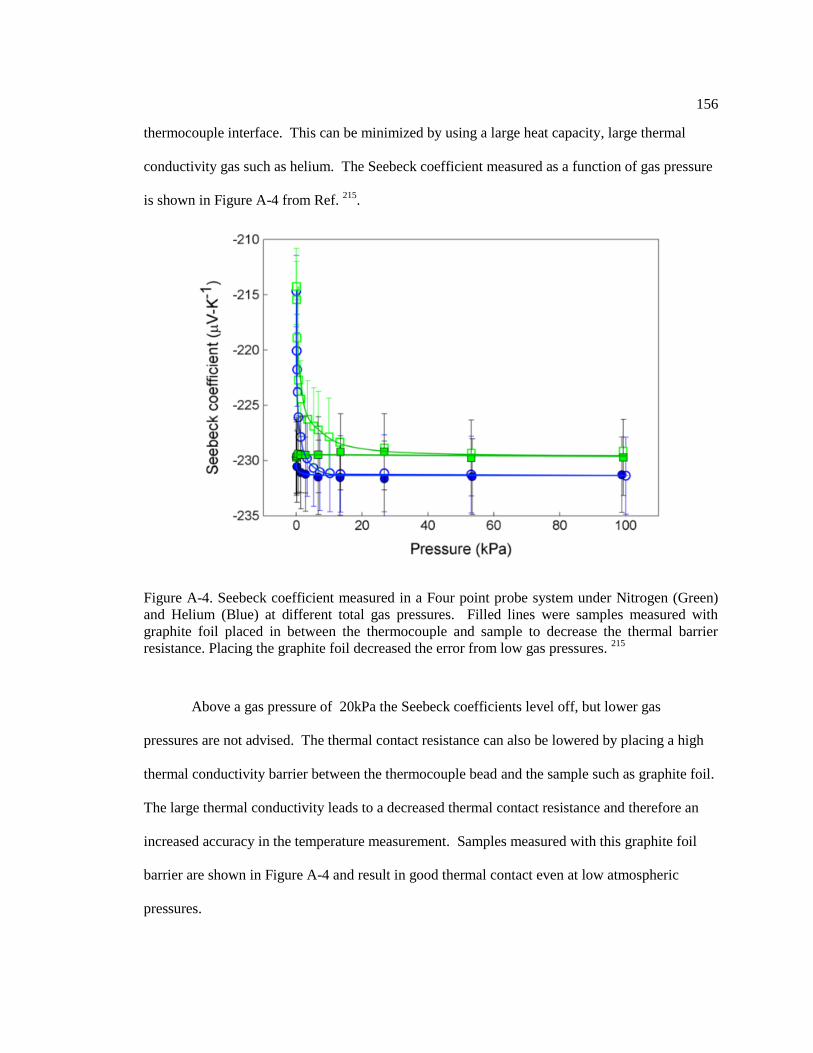
156
thermocouple interface. This can be minimized by using a large heat capacity, large thermal
conductivity gas such as helium. The Seebeck coefficient measured as a function of gas pressure
is shown in Figure A-4 from Ref. 215
.
Figure A-4. Seebeck coefficient measured in a Four point probe system under Nitrogen (Green)
and Helium (Blue) at different total gas pressures. Filled lines were samples measured with
graphite foil placed in between the thermocouple and sample to decrease the thermal barrier
resistance. Placing the graphite foil decreased the error from low gas pressures. 215
Above a gas pressure of 20kPa the Seebeck coefficients level off, but lower gas
pressures are not advised. The thermal contact resistance can also be lowered by placing a high
thermal conductivity barrier between the thermocouple bead and the sample such as graphite foil.
The large thermal conductivity leads to a decreased thermal contact resistance and therefore an
increased accuracy in the temperature measurement. Samples measured with this graphite foil
barrier are shown in Figure A-4 and result in good thermal contact even at low atmospheric
pressures.

157
Another source of thermocouple error is the ‘cold-finger effect’. This effect is where the
thermocouple will pull heat out of the sample and therefore not give an exact measurement of the
sample surface. This can be minimized by using thermocouples will small beads, small diameter
thermocouple wiring, and low thermal conductivity thermocouple material. This effect cannot be
eliminated entirely, however. Additionally, the magnitude of the error increases at high
temperatures due to the increased radiative heat transfer to the surroundings 244
. This increases
the uncertainty in the four point probe technique at high temperatures at larger temperature
gradients. This is shown in Figure A-5 ,which plots the modeled uncertainty for ΔT at different
furnace temperatures and temperature gradients.
Figure A-5. Values of the ΔT uncertainty at various furnace temperatures and temperature
gradients modeled via finite element analysis. The model was performed for a thermal contact
conductance of 33,000 W/mK2 and thermocouple emissivity of 0.7. The large errors at high
temperatures and temperature gradients occur primarily due to the cold finger effect. 244

158
This increase in the Delta T uncertainty in the upper right hand corner of Figure A-5 can
be explained as follows. Under a temperature gradient, both the upper and lower thermocouple
are at different temperatures and therefore the cold finger effect will affect the upper and lower
thermocouples differently. The hotter thermocouple has a larger cold finger effect due to
increased radiative heat transfer to the surroundings at high temperatures. This results in an
underestimate of the temperature gradient and an overestimate of the Seebeck coefficient. This
has been worked out in detail in reference 244
and the error source is shown to be only ~±1% at
room temperature, but can increase to +1.0%/−13.1% at 900°C. At high temperatures the four
point probe measurement therefore will tend to overestimate the Seebeck coefficient.

159
References
1 D. of Energy, Quadrennial Technology Review 2015 Direct Thermal Energy Conversion
Materials, Devices and Systems. 2015.
2 J. Yang and F.R. Stabler, “Automotive Applications of Thermoelectric Materials,” J.
Electron. Mater., 38 [7] 1245–1251 (2009).
3 D.J. Anderson, NASA Radioisotope Power Conversion Technology NRA Overview. 2005.
4 F.W. Dynys, M.-H. Berger, and A. Sehirlioglu, “Thermoelectric Properties of Undoped
and Doped (Ti0.75Sn0.25)O2,” J. Am. Ceram. Soc., 95 [2] 619–626 (2012).
5 T. Tsubota, M. Ohtaki, K. Eguchi, and H. Arai, “Thermoelectric Properties of ZnO Doped
with the Group 13 Elements;” pp. 240–243 in 16th Int. Conf. Thermoelectr. 1997.
6 D. Berardan, E. Guilmeau, A. Maignan, and B. Raveau, “In2O3:Ge, a Promising n-type
Thermoelectric Oxide Composite,” Solid State Commun., 146 97–101 (2008).
7 J.F. Ihlefeld, B.M. Foley, D.A. Scrymgeour, J.R. Michael, B.B. McKenzie, D.L. Medlin,
M. Wallace, S. Trolier-McKinstry, et al., “Room-Temperature Voltage Tunable Phonon
Thermal Conductivity via Reconfigurable Interfaces in Ferroelectric Thin Films,” Nano
Lett., 15 1791–1795 (2015).
8 M.A. Weilert, M.E. Msall, A.C. Anderson, and J.P. Wolfe, “Phonom Scattering from
Ferroelectric Domain Walls: Phonom Imaging in KDP,” Phys. Rev. Lett., 71 [5] 735–740
(1993).
9 S. Lee, R.H.T. Wilke, S. Trolier-McKinstry, S. Zhang, and C.A. Randall, “SrxBa1-xNb2O6-δ
Ferroelectric-thermoelectrics: Crystal Anisotropy, Conduction Mechanism, and Power
Factor,” Appl. Phys. Lett., 96 [3] 031910 (2010).
10 C.L. Choy, W.P. Leung, T.G. Xi, Y. Fei, and C.F. Shao, “Specific Heat and Thermal

160
Diffusivity of Strontium Barium Niobate (Sr1−xBaxNb2O6) Single Crystals,” J. Appl. Phys.,
71 [1] 170 (1992).
11 P. Drude, “Zur Elektronentheorie der Metalle,” Ann. Phys., 306 [3] 566 (1900).
12 N.W. Ashcroft and N.D. Mermin, Solid State Physics. Cengage Learning, Saunders,
Philadelphia, 1976.
13 N.W. Ashcroft and N.D. Mermin, “Failures of the Free Electron Model;” pp. 57–63 in
Solid State Phys. Cengage Learning, Saunders, Philadelphia, 1976.
14 C. Kittel, “The Nearly Free Electron Model;” pp. 164–167 in Introd. to Solid State Phys.,
8th ed. New York, NY, 2004.
15 P.A. Cox, “The Hubbard Model;” pp. 82–87 in Transit. Met. Oxides An Introd. to their
Electron. Struct. Prop. Oxford University Press, Oxford, New York, 1992.
16 J.K. Burdett, Chemical Bonding in Solids. Oxford University Press, New York, NY, 1995.
17 T. Brown, H. LeMay, B. Bursten, C. Murphy, P. Woodward, and M. Stoltzfus, Chemistry:
The Central Science, 13th ed. Prentice Hall, Bergen County, 2014.
18 G.K. Wertheim and S. Hüfner, “X-Ray Photoemission Band Structure of Some Transition-
Metal Oxides,” Phys. Rev. Lett., 28 [16] 1028–1031 (1972).
19 P.A. Cox, Transition Metal Oxides: An Introduction to their Electronic Structure and
Properties. Oxford Univeristy Press, Oxford, New York, 1992.
20 C.J. Ballhausen, Ligand Field Theory. McGrow Hill, New York, 1962.
21 P.W. Anderson, “Absence of Diffusion in Certain Random Lattices,” Phys. Rev., 109 [5]
1492–1505 (1958).
22 D.S. Wiersma, P. Bartolini, A. Lagendijk, and R. Righini, “Localization of Light in a
Disordered Medium,” Nature, 390 671–673 (1997).
23 J. Billy, V. Josse, Z. Zuo, A. Bernard, B. Hambrecht, P. Lugan, D. Clément, L. Sanchez-
Palencia, et al., “Direct Observation of Anderson Localization of Matter Waves in a

161
Controlled Disorder,” Nature, 453 891–894 (2008).
24 H. Kamimura and H. Aoki, The Physics of Interacting Electrons in Disordred Systems.
Oxford University Press, New York, 1989.
25 V.F. Gantmakher, “Metal-Insulator Transitions;” pp. 74–100 in Electrons Disord. Solids.
Oxford Univeristy Press, New York, NY, 2005.
26 N.F. Mott and E.A. Davis, “Theory of Electrons in a Non-Crystalline Medium;” pp. 7–62
in Electron. Process. Non-Crystalline Mater., 2nd ed. Oxford Univeristy Press, New
York, NY, 1979.
27 P.A. Cox, “Anderson Localization;” pp. 91–92 in Transit. Met. Oxides An Introd. to their
Electron. Struct. Prop. Oxford University Press, Oxford, New York, 1992.
28 N.F. Mott and E.A. Davis, “The Fermi Glass and the Anderson Transition;” pp. 98–160 in
Electron. Process. Non-Crystalline Mater., 2nd ed. 1979.
29 N.F. Mott and E.A. Davis, “Non-Crystalline Semiconductors;” pp. 199–314 in Electron.
Process. Non-crystalline Mater., 2nd ed. Oxford Univeristy Press, New York, NY, 1979.
30 C. Kittel, Introduction to Solid State Physics, 8th ed. Wiley, New York, NY, 2004.
31 I.G. Austin and N.F. Mott, “Polarons in Crystalline and Non-Crystalline Materials,” Adv.
Phys., 18 [71] 41–102 (1969).
32 S. Lee, J.A. Bock, S. Trolier-McKinstry, and C.A. Randall, “Ferroelectric-
Thermoelectricity and Mott Transition of Ferroelectric Oxides with High Electronic
Conductivity,” J. Eur. Ceram. Soc., 32 [16] 3971–3988 (2012).
33 D. Nuzhnyy, J. Petzelt, M. Savinov, T. Ostapchuk, V. Bovtun, M. Kempa, J. Hlinka, V.
Buscaglia, et al., “Broadband Dielectric Response of Ba(Zr,Ti)O3 Ceramics: From
Incipient via Relaxor and Diffuse up to Classical Ferroelectric Behavior,” Phys. Rev. B -
Condens. Matter Mater. Phys., 86 [1] 1–9 (2012).
34 O.K. Andersen and O. Jepsen, “Explicit, First-Principles Tight-Binding Theory,” Phys.

162
Rev. Lett., 53 [27] 2571–2574 (1984).
35 V.F. Gantmakher, Electrons and Disorder in Solids. Oxford Science Publications, New
York, 2005.
36 L.R. Friedman and D.P. Tunstall, “The Metal Non-Metal Transiiton in Disordered
Systems,” Scottish Univ. Summer Sch. Phys. Publ., (1974).
37 P.P. Edwards and M.J. Sienko, “Universality Aspects of the Metal-Nonmetal Transition in
Condensed Media,” Phys. Rev. B, 17 [6] 2575–2581 (1978).
38 E. Salje and B. Guttler, “Anderson Transition and Intermediate Polaron Formaiton in
WO3-x Transport Properties and Optical Absorption,” Philos. Mag. Part B, 50 [5] 607–620
(1984).
39 W. Wunderlich, H. Ohta, and K. Koumoto, “Enhanced Effective Mass in Doped SrTiO3
and Related Perovskites,” Phys. B Condens. Matter, 404 2202–2212 (2009).
40 C. Lee, J. Destry, and J.L. Brebner, “Optical Absorption and Transport in Semiconducting
SrTiO3,” Phys. Rev. B, 11 [6] 2299–2310 (1975).
41 P.P. Edwards, T. V Ramakrishnan, and C.N.R. Rao, “The Metal-Nonmetal Transition: A
Global Perspective,” J. Phys. Chem., 99 5228–5239 (1995).
42 E. Buixaderas, M. Savinov, M. Kempa, S. Veljko, S. Kamba, J. Petzelt, R. Pankrath, and
S. Kapphan, “Infrared and Dielectric Spectroscopy of the Relaxor Ferroelectric
Sr0.61Ba0.39Nb2O6,” J. Phys. Condens. Matter, 17 [4] 653–666 (2005).
43 D. Emin, “Strong Coupling: Self Trapping;” pp. 21–41 in Polarons. Oxford University
Press, Cambridge, NY, 2013.
44 D. Emin, Polarons. Cambridge University Press, Cambridge, UK, 2013.
45 D. Emin, “Small-Polaron Transport;” pp. 95–123 in Polarons. Cambridge Univeristy
Press, Cambridge, UK, 2013.
46 P.A. Cox, “Transport Properties;” pp. 160–169 in Transit. Met. Oxides An Introd. to their

163
Electron. Struct. Prop. Oxford University Press, Oxford, New York, 1992.
47 D. Emin, “Phonon-Assisted Jump Rate in Noncrystalline Solids,” Phys. Rev. Lett., 32 [6]
303–307 (1974).
48 N.F. Mott and E.A. Davis, “Hopping and Variable-Tange Hopping;” pp. 32–37 in
Electronc Process. Non-Crystalline Mater., Second. Edited by D.H.W. W. Marshall.
Oxford University Press, New York, NY, 2012.
49 H. Kamimura and H. Aoki, “Hopping Conduction and Related Phenomena;” pp. 121–147
in Phys. Interact. Electrons Disord. Syst. Oxford University Press, New York, NY, 1989.
50 N.F. Mott, “Conduction in Non-Crystalline Materials: III. Localized States in a Pseudogap
and Near Extremities of Conduciton and Valence Bands,” Philos. Mag., 10 [160] 835–852
(1969).
51 F. Reif, Fundamentals of Statistical and Thermal Physics, 1st ed. McGraw-Hill Higher
Education, 1965.
52 C. Kittel, “Free Electron Fermi Gas;” pp. 133–157 in Introd. to Solid State Phys., 8th ed.
Edited by S. Johnson, P. McFadden and M. Batey. John Wiley & Sons, Inc., New York,
NY, 2005.
53 C. Kittel, “Thermal Conductivity of Metals;” pp. 156–157 in Introd. to Solid State Phys.,
8th ed. Edited by S. Johnson, P. McFadden and M. Batey. John Wiley & Sons, Inc., New
York, NY, 2005.
54 C. Kittel, “Electrical Conductivity and Ohm’s Law;” pp. 147–148 in Introd. to Solid State
Phys., 8th ed. Edited by S. Johnson, P. McFadden and M. Batey. John Wiley & Sons, Inc.,
New York, 2005.
55 J. Yang, “Electronic Thermal Conduction;” pp. 3–9 in Therm. Conduct. Theory, Prop.
Appl. Edited by T.M. Tritt. Plenum Publishers, New York, NY, 2004.
56 T.M. Tritt, Thermal Conductivity: Theory, Properties, and Applications. Kluwer

164
Academic/Plenum publishers, New York, NY, 2004.
57 F.J. Blatt, P.A. Schroeder, C.L. Foiles, and D. Greig, Thermoelectric Power of Metals.
Plenum Press, New York, NY, 1976.
58 C. Kittel, “Two Atoms Per Primative Basis;” pp. 95–99 in Introd. to Solid State Phys., 8th
ed. Edited by S. Johnson, P. McFadden and M. Batey. John Wiley & Sons, Inc., New
York, NY, 2005.
59 C. Kittel, “Vibrations of Crystals with Monatomic Basis;” pp. 91–95 in Introd. to Solid
State Phys., 8th ed. Edited by S. Johnson, P. McFadden and M. Batey. John Wiley &
Sons, Inc., New York, NY, 2005.
60 M. Christensen, A.B. Abrahamsen, N.B. Christensen, F. Juranyi, N.H. Andersen, K.
Lefmann, J. Andreasson, C.R.H. Bahl, et al., “Avoided Crossing of Rattler Modes in
Thermoelectric Materials,” Nat. Mater., 7 [10] 811–815 (2008).
61 C. H. Lee, I. Hase, H. Sugawara, H. Yoshizawa, and H. Sato, “Low-Lying Optical Phonon
Modes in the Filled Skutterudite CeRu4Sb12,” J. Phys. Soc. Japan, 75 [12] 123602 (2006).
62 P.D. Maycock, “Thermal Conductivity of Silicon, Germanium, III–V Compounds and III–
V Alloys,” Solid. State. Electron., 10 161–168 (1967).
63 E.S. Toberer, L.L. Baranowski, and C. Dames, “Advances in Thermal Conductivity,”
Annu. Rev. Mater. Res., 42 179–209 (2012).
64 G.A. Slack, “The Thermal Conductivity of Nonmetallic Crystals;” pp. 1–77 in Solid State
Physics, Vol 34. Academic Press, New York, NY, 1979.
65 D.R. Gaskell, Introduction to the Thermodynamics of Materials, 4th ed. Taylor & Francis
Group, LLC, New York, NY, 2003.
66 C. Kittel, “Phonon Heat Capacity;” pp. 107–121 in Introd. to Solid State Phys., 8th ed.
Edited by S. Johnson, P. McFadden and M. Batey. John Wiley & Sons, Inc., New York,
NY, 2005.
165
67 W.D. Kingery, H.K. Bowen, and D.R. Uhlmann, “Heat Capacity;” pp. 586–589 in Introd.
to Ceram., Second. Edited by E. Burke, B. Chalmers and J. Krumhansl. John Wiley &
Sons, Inc., 1960.
68 S.S. Todd and R.E. Lorenson, “Heat Capacities at Low Temperatures and Entropies at
298.16K of Metatitanates of Barium and Strontium,” J. Am. Chem. Soc., 74 [8] 2043–
2045 (1952).
69 W. Cochran, The Dynamics of Atoms in Crystals. Crane Russak & Co., 1973.
70 A. Kumar, U.C. Naithani, and B.S. Semwal, “Sound Velocity Change in BaxSr1-xTiO3
Perovskites,” 42 18–24 (2004).
71 M. Tachibana, T. Kolodiazhnyi, and E. Takayama-Muromachi, “Thermal Conductivity of
Perovskite Ferroelectrics,” Appl. Phys. Lett., 93 [9] 092902 (2008).
72 R.E. Newnham, “Acoustic Waves I + II;” pp. 249–270 in Prop. Mater. Anisotropy,
Symmetry, Struct. Oxford University Press, New York, 2005.
73 M.E. Manley, J.W. Lynn, D.L. Abernathy, E.D. Specht, O. Delaire, A.R. Bishop, R.
Sahul, and J.D. Budai, “Phonon Localization Drives Polar Nanoregions in a Relaxor
Ferroelectric,” Nat. Commun., 5 3683 (2014).
74 M.E. Manley, “Impact of Intrinsic Localized Modes of Atomic Motion on Materials
Properties,” Acta Mater., 58 [8] 2926–2935 (2010).
75 M.E. Manley, “Intrinsic Localized Lattice Modes and Thermal Transport: Potential
Application in a Thermal Rectifier,” Mater. Res. Soc. Proc., 1172–T09–02 (2009).
76 R.E. Cohen, “Origin of Ferroelectricity in Perovskite Oxides,” Nature, 358 136–138
(1992).
77 M. Yamamoto, H. Ohta, and K. Koumoto, “Thermoelectric Phase Diagram in a CaTiO3-
SrTiO3-BaTiO3 System,” Appl. Phys. Lett., 90 [7] 072101 (2007).
78 “An American National Standard IEEE Standard Definitions of Terms Associated With

166
Ferroelectric and Related Materials,” IEEE Trans. Ultrason. Ferroelectr. Freq. Control,
50 [12] 1–32 (2003).
79 J. Fousek and V. Janovec, “The Orientation of Domain Walls in Twinned Ferroelectric
Crystals,” J. Appl. Phys., 40 135 (1969).
80 T. Sluka, A.K. Tagantsev, D. Damjanovic, M. Gureev, and N. Setter, “Enhanced
Electromechanical Response of Ferroelectrics Due to Charged Domain Walls,” Nat.
Commun., 3 748 (2012).
81 T. Sluka, A.K. Tagantsev, P. Bednyakov, and N. Setter, “Free-Electron Gas at Charged
Domain Walls in Insulating BaTiO3,” Nat. Commun., 4 1–6 (2013).
82 L.E. Cross, “Relaxor Ferroelectrics,” Ferroelectrics, 76 241–267 (1987).
83 A.A. Bokov and Z.-G. Ye, “Recent Progress in Relaxor Ferroelectrics with Perovskite
Structure,” J. Mater. Sci., 41 31–52 (2006).
84 A. Bussmann-Holder, A.R. Bishop, and T. Egami, “Relaxor Ferroelectrics and Intrinsic
Inhomogeneity,” Europhys. Lett., 71 [2] 249–255 (2005).
85 R.R. Heikes and R.W. Ure, Thermoelectricity: Science and Engineering. Interscience
Publishers, New York, NY, 1961.
86 C. Kittel, “Thermoelectric Effects;” pp. 214–215 in Introd. to Solid State Phys., 8th ed.
Edited by S. Johnson, P. McFadden and R. Smith. John Wiley & Sons, Inc., New York,
NY, 2005.
87 D.M. Rowe, “Thermoelectric and Thermomagnetic Effects;” pp. 1–2 in Thermoelectr.
Handb. Macro to Nano. Edited by D.M. Rowe. Taylor & Francis Group, LLC, Boca
Raton, FL, 2006.
88 H.J. Goldsmid, “The Thermoelectric and Related Effects;” pp. 1–6 in Introd. to
Thermoelectr. Edited by R. Hull, J. Parisis, R.M. Osgood and W. Hans. Springer - Verlage
Berlin Heidelberg, Berlin, 2010.
167
89 G.S. Nolas, J. Sharp, and H.J. Goldsmid, “Peltier Cooling and Thermoelectric Figure of
Merit;” pp. 1–13 in Thermoelectr. Basic Princ. New Mater. Dev. Edited by R. Hull, R.M.
Osgood, H. Sakaki and A. Zunger. 2001.
90 D.M. Rowe, “Thermoelectric Generation and the Figure-of-Merit;” pp. 1–3 in
Thermoelectr. Handb. Macro to Nano. Edited by D.M. Rowe. Taylor & Francis Group,
LLC, Boca Raton, FL, 2006.
91 G.J. Snyder and E.S. Toberer, “Complex Thermoelectric Materials.,” Nat. Mater., 7 105–
114 (2008).
92 A.F. Ioffe, Semiconductor Thermoelements and Thermoelectric Cooling. Infosearch,
London, UK, 1957.
93 A. Bulusu and D.G. Walker, “Review of Electronic Transport Models for Thermoelectric
Materials,” Superlattices Microstruct., 44 1–36 (2008).
94 N.F. Mott and E.A. Davis, “Thermopower;” pp. 52–56 in Electron. Process. Non-
Crystalline Mater., Second. Edited by W. Marshall and D.H. Wilkinson. Claredon Press,
Oxford, UK, 1979.
95 M. Jonson and G.D. Mahan, “Mott’s Formula for the Thermopower and the Wiedemann-
Franz Law,” Phys. Rev. B, 21 [10] 4223–9 (1980).
96 Y. Pei, H. Wang, and G.J. Snyder, “Band Engineering of Thermoelectric Materials,” Adv.
Mater., 24 6125–6135 (2012).
97 R.R. Heikes and R.W. Ure, “Distribution Treatment of Transport Properties;” pp. 47–53 in
Thermoelectr. Sci. Eng. Interscience Publishers, New York, NY, 1961.
98 C. Kittel, “Semiconducting Crystals;” pp. 186–217 in Introd. to Solid State Phys., 8th ed.
Edited by S. Johnson, P. McFadden and M. Batey. John Wiley & Sons, Inc., New York,
NY, 2005.
99 G.S. Nolas and H.J. Goldsmid, “Multiband Effects;” pp. 42–44 in Thermoelectr. Basic

168
Princ. New Mater. Dev. Edited by A. Zunger, R. Hull, R.M. Osgood and H. Sakaki.
Springer-Verlag Berlin Heidelberg, Berlin, 2001.
100 H.J. Goldsmid, “Thermoelectric Properties of Metals and Semiconductors;” pp. 23–41 in
Introd. to Thermoelectr. Edited by R. Hull, J. Parisi, R.M.J. Osgood and H. Warlimont.
Springer-Verlag Berlin Heidelberg, Berlin, 2010.
101 H.J. Goldsmid, “Extension of The Temperature Range;” pp. 93–95 in Introd. to
Thermoelectr. Edited by R. Hull, J. Parisi, R.M. Osgood and H. Warlimont. Springer -
Verlage Berlin Heidelberg, Berlin, 2010.
102 H.J. Goldsmid, “The Electrical Conductivity and Thermoelectric Power of Bismuth
Telluride,” Proc. Phys. Soc., 71 633–646 (1958).
103 D. Emin, “The Seebeck Coefficient;” pp. 5–2 in Thermoelectr. Handb. Macro to Nano.
Edited by D.M. Rowe. Taylor & Francis Group, LLC, Boca Raton, FL, 2006.
104 S. Hébert, S. Lambert, D. Pelloquin, and A. Maignan, “Large Thermopower in a Metallic
Cobaltite: The Layered Tl-Sr-Co-O Misfit,” Phys. Rev. B, 64 [17] 172101 (2001).
105 A. Maignan, S. Hébert, L. Pi, D. Pelloquin, C. Martin, C. Michel, M. Hervieu, and B.
Raveau, “Perovskite Manganites and Layered Cobaltites: Potential Materials for
Thermoelectric Applications,” Cryst. Eng., 5 365–382 (2003).
106 K. Berggold, M. Kriener, C. Zobel, A. Reichl, M. Reuther, R. Müller, A. Freimuth, and T.
Lorenz, “Thermal Conductivity, Thermopower, and Figure of Merit of La1-xSrxCoO3,”
Phys. Rev. B, 72 [15] 155116 (2005).
107 J.-P. Doumerc, “Thermoelectric Power for Carriers in Localized States: A Generalization
of Heikes and Chaikin-Beni Formulae,” J. Solid State Chem., 110 419–420 (1994).
108 W. Koshibae, K. Tsutsui, and S. Maekawa, “Thermopower in Cobalt Oxides,” Phys. Rev.
B, 62 [11] 6869–6872 (2000).
109 K. Fujita, T. Mochida, and K. Nakamura, “High-Temperature Thermoelectric Properties

169
of NaxCoO2-δ Single Crystals,” Jpn. J. Appl. Phys., 40 4644–4647 (2001).
110 H. Muta, K. Kurosaki, and S. Yamanaka, “Thermoelectric Properties of Rare Earth Doped
SrTiO3,” J. Alloys Compd., 350 292–295 (2003).
111 K. Takahata, Y. Iguchi, D. Tanaka, and T. Itoh, “Low Thermal Conductivity of the
Layered Oxide (Na,Ca)Co2O4: Another Example of a Phonon Glass and an Electron
Crystal,” Phys. Rev. B., 61 [19] 12551–55 (2000).
112 T. Tsubota, M. Ohtaki, K. Eguchi, and H. Arai, “Thermoelectric Properties of Al-Doped
ZnO as a Promising Oxide Material for High-Temperature Thermoelectric Conversion,” J.
Mater. Chem., 7 [1] 85–90 (1997).
113 M. Shikano and R. Funahashi, “Electrical and Thermal Properties of Single-Crystalline
(Ca2CoO3)0.7CoO2 with a Ca3Co4O9 Structure,” Appl. Phys. Lett., 82 [12] 1851–1854
(2003).
114 M. Ohtaki, K. Araki, and K. Yamamoto, “High Thermoelectric Performance of Dually
Doped ZnO Ceramics,” J. Electron. Mater., 38 [7] 1234–1238 (2009).
115 G. Xu, R. Funahashi, M. Shikano, I. Matsubara, and Y. Zhou, “Thermoelectric Properties
of the Bi- and Na-Substituted Ca3Co4O9,” Appl. Phys. Lett., 80 [20] 3760 (2002).
116 J. Son, P. Moetakef, B. Jalan, O. Bierwagen, N.J. Wright, R. Engel-Herbert, and S.
Stemmer, “Epitaxial SrTiO3 Films with Electron Mobilities Exceeding 30,000cm2V
−1 s
−1,”
Nat. Mater., 9 482–484 (2010).
117 S. Ohta, T. Nomura, H. Ohta, and K. Koumoto, “High-Temperature Carrier Transport and
Thermoelectric Properties of Heavily La- Or Nb-Doped SrTiO3 Single Crystals,” J. Appl.
Phys., 97 034106 (2005).
118 D.C. Look, “Recent Advances in ZnO Materials and Devices,” Mater. Sci. Eng. B, 80
383–387 (2001).
119 M. Ohtaki, T. Tsubota, and K. Eguchi, “Thermoelectric Properties of Oxide Solid
170
Solutions Based on Al-Doped ZnO;” pp. 610–613 in Seventeenth Int. Conf. Thermoelectr.
1998.
120 P.B. Jamieson, S.C. Abrahams, and J.L. Bernstein, “Ferroelectric Tungsten Bronze-Type
Crystal Structures. I. Barium Strontium Niobate Ba0.27Sr0.75Nb2O5.78,” J. Chem. Phys., 48
[11] 5048–57 (1968).
121 M.P. Trubelja, E. Ryba, and D.K. Smith, “A Study of Positional Disorder in Strontium
Barium Niobate,” J. Mater. Sci., 31 1435–1443 (1996).
122 H. Fan, L. Zhang, and X. Yao, “Relaxation Characteristics of Strontium Barium Niobate
Ferroelectric Ceramics,” J. Mater. Sci., 33 895–900 (1998).
123 W.H. Huang, D. Viehland, and R.R. Neurgaonkar, “Anisotropic Glasslike Characteristics
of Strontium Barium Niobate Relaxors,” J. Appl. Phys., 76 [1] 490–496 (1994).
124 C.J. Huang, K. Li, X.Q. Liu, X.L. Zhu, and X.M. Chen, “Effects of A1/A2-Sites
Occupancy upon Ferroelectric Transition in SrxBa1−xNb2O6 Tungsten Bronze Ceramics,”
J. Am. Ceram. Soc., 97 [2] 507–512 (2014).
125 M.E. Lines and A.M. Glass, “Semiconducting Ferroelectrics;” pp. 503–524 in Princ. Appl.
Ferroelectr. Relat. Mater. Oxford University Press, Oxford, New York, 1977.
126 V.M. Fridkin, Ferroelectric Semiconductors. Consultants Bureau, New York, NY, 1980.
127 W. Heywang, “Semiconducting Barium Titanate,” J. Mater. Sci., 6 1214–1224 (1971).
128 J. Seidel, L.W. Martin, Q. He, Q. Zhan, Y.-H. Chu, A. Rother, M.E. Hawkridge, P.
Maksymovych, et al., “Conduction at Domain Walls in Oxide Multiferroics.,” Nat.
Mater., 8 229–234 (2009).
129 V.P. Mineev and Y. Yoshioka, “Optical Activity of Noncentrosymmetric Metals,” Phys.
Rev. B, 81 094525 (2010).
130 V.M. Edelstein, “Features of Light Reflection Off Metals with Destroyed Mirror
Symmetry,” Phys. Rev. B, 83 113109 (2011).
171
131 P.W. Anderson and E.I. Blount, “Symmetry Considerations on Martensitic
Transformation: ‘Ferroelectric’ Metals?,” Phys. Rev. Lett., 14 [7] 217–219 (1965).
132 J.W. Bennett, K.F. Garrity, K.M. Rabe, and D. Vanderbilt, “Hexagonal ABC
Semiconductors as Ferroelectrics,” Phys. Rev. Lett., 109 167602 (2012).
133 I.A. Sergienko, V. Keppens, M. McGuire, R. Jin, J. He, S.H. Curnoe, B.C. Sales, P. Blaha,
et al., “Metallic ‘Ferroelectricity’ in the Pyrochlore Cd2Re2O7,” Phys. Rev. Lett., 92 [6]
065501 (2004).
134 Y. Shi, Y. Guo, X. Wang, A.J. Princep, D. Khalyavin, P. Manuel, Y. Michiue, A. Sato, et
al., “A Ferroelectric-Like Structural Transition in a Metal,” Nat. Mater., 12 1024–27
(2013).
135 G. Giovannetti and M. Capone, “Dual Nature of the Ferroelectric and Metallic State in
LiOsO3,” Phys. Rev. B, 90 195113 (2014).
136 D. Puggioni and J.M. Rondinelli, “Designing a Robustly Metallic Noncenstrosymmetric
Ruthenate Oxide with Large Thermopower Anisotropy.,” Nat. Commun., 5 1–9 (2014).
137 S. Podlozhenov, H.A. Graetsch, J. Schneider, M. Ulex, M. Wöhlecke, and K. Betzler,
“Structure of Strontium Barium Niobate SrxBa1-xNb2O6 (SBN) in the Composition Range
0.32≤x≤0.82,” Acta Crystallogr. Sect. B Struct. Sci., 62 960–965 (2006).
138 H. Ning, H. Yan, and M.J. Reece, “Piezoelectric Strontium Niobate and Calcium Niobate
Ceramics with Super-High Curie Points,” J. Am. Ceram. Soc., 93 [5] 1409–1413 (2010).
139 E.N. Bunting, G.R. Shelton, and A.S. Creamer, “Properties of Barium-Strontium Titanate
Dielectrics,” J. Natl. Bur. Stand., 38 337–349 (1947).
140 H.-Y. Lee and R. Freer, “Abnormal Grain Growth and Liquid-Phase Sintering in
Sr0.6Ba0.4Nb2O6 (SBN40) Ceramics,” J. Mater. Sci., 33 [7] 1703–1708 (1998).
141 S. Lee, G. Yang, R.H.T. Wilke, S. Trolier-McKinstry, and C.A. Randall, “Thermopower
in Highly Reduced n-type Ferroelectric and Related Perovskite Oxides and the Role of

172
Heterogeneous Nonstoichiometry,” Phys. Rev. B, 79 [13] 134110 (2009).
142 J.A. Bock, S. Trolier-McKinstry, G.D. Mahan, and C.A. Randall, “Polarization-Based
Perturbations to Thermopower and Electronic Conductivity in Highly Conductive
Tungsten Bronze Structured (Sr,Ba)Nb2O6-δ,” Phys. Rev. B, 90 [11] 115106 (2014).
143 A. Ziębińska, D. Rytz, K. Szot, M. Górny, and K. Roleder, “Birefringence Above TC in
Single Crystals of Barium Titanate,” J. Phys. Condens. Matter, 20 142202 (2008).
144 J.-H. Ko, T.H. Kim, K. Roleder, D. Rytz, and S. Kojima, “Precursor Dynamics in the
Ferroelectric Phase Transition of Barium Titanate Single Crystals Studied by Brillouin
Light Scattering,” Phys. Rev. B, 84 094123 (2011).
145 D.F. Rushman and M.A. Strivens, “The Permittivity of Polycrystals of the Perovskite
Type,” Trans. Faraday Soc., 42 A231–A238 (1946).
146 S. Kisaka, S. Ikegami, and H. Sasaki, “Dielectric Properties of Mixed Crystals of Barium-
Strontium Titanate,” J. Phys. Soc. Japan, 14 [12] 1680–1685 (1959).
147 I.-K. Jeong, S. Lee, S.-Y. Jeong, C.J. Won, N. Hur, and A. Llobet, “Structural Evolution
Across the Insulator-Metal Transition in Oxygen-Deficient BaTiO3-δ Studied Using
Neutron Total Scattering and Rietveld Analysis,” Phys. Rev. B, 84 [6] 064125 (2011).
148 I. Levin, V. Krayzman, and J.C. Woicik, “Local Structure in Perovskite (Ba, Sr)TiO3:
Reverse Monte Carlo Refinements From Multiple Measurement Techniques,” Phys. Rev.
B, 89 [2] 024106 (2014).
149 A.S. Bhalla, R. Guo, L.E. Cross, G. Burns, F.H. Dacol, and R.R. Neurgaonkar,
“Measurements of Strain and the Optical Indicies in the Ferroelectric Ba0.4Sr0.6Nb2O6:
Polarization Effects,” Phys. Rev. B, 36 [4] 2030–2035 (1987).
150 C.S. Pandey, J. Schreuer, M. Burianek, and M. Mühlberg, “Relaxor Behavior of CaxBa1-
xNb2O6 (0.18<x<0.35) Tuned by Ca/Ba Ratio and Investigated by Resonant Ultrasound
Spectrocopy,” Phys. Rev. B, 87 [9] 094101 (2013).

173
151 K. Uchino, Ferroelectric Devices. Marcel Dekker, Inc., New York, NY, 2000.
152 P. Muralt, R.G. Polcawich, and S. Trolier-McKinstry, “Piezoelectric Thin Films for
Sensors, Actuators, and Energy Harvesting,” MRS Bull., 34 658–664 (2009).
153 N. Setter, D. Damjanovic, L. Eng, G. Fox, S. Gevorgian, S. Hong, A. Kingon, H.
Kohlstedt, et al., “Ferroelectric Thin Films: Review of Materials, Properties, and
Applications,” J. Appl. Phys., 100 [5] 051606 (2006).
154 R. Thomas, J.F. Scott, D.N. Bose, and R.S. Katiyar, “Multiferroic Thin-Film Integration
onto Semiconductor Devices.,” J. Phys. Condens. Matter, 22 [42] 423201 (2010).
155 R.W. Whatmore, “Pyroelectric Devices and Materials,” Reports Prog. Phys., 49 1335–
1386 (1986).
156 R.E. Jones, P.D. Maniar, R. Moazzami, P. Zurcher, J.Z. Witowski, Y.T. Lii, P. Chu, and
S.J. Gillespie, “Ferroelectric Non-Volatile Memories for Low-Voltage, Low-Power
Applications,” Thin Solid Films, 270 584–588 (1995).
157 G. V. Lewis, C.R.A. Catlow, and R.E.W. Casselton, “PTCR Effect in BaTiO3,” J. Am.
Ceram. Soc., 68 [10] 555–558 (1985).
158 S.Y. Yang, J. Seidel, S.J. Byrnes, P. Shafer, C.-H. Yang, M.D. Rossell, P. Yu, Y.-H. Chu,
et al., “Above-Bandgap Voltages from Ferroelectric Photovoltaic Devices,” Nat.
Nanotechnol., 5 [2] 143–147 (2010).
159 H. Huang, “Solar Energy: Ferroelectric Photovoltaics,” Nat. Photonics, 4 [3] 134–135
(2010).
160 V.M. Fridkin and B.N. Popov, “Anomalous Photovoltaic Effect in Ferroelectrics,” Sov.
Phys. Usp., 21 [12] 991 (1978).
161 S. Lee, S. Dursun, C. Duran, and C.A. Randall, “Thermoelectric Power Factor
Enhancement of Textured Ferroelectric SrxBa1-xNb2O6-δ Ceramics,” J. Mater. Res., 26 [1]
26–30 (2011).

174
162 R.K. Vasudevan, W. Wu, J.R. Guest, A.P. Baddorf, A.N. Morozovska, E.A. Eliseev, N.
Balke, V. Nagarajan, et al., “Domain Wall Conduction and Polarization-Mediated
Transport in Ferroelectrics,” Adv. Funct. Mater., 23 2592–2616 (2013).
163 M. Schröder, A. Haußmann, A. Thiessen, E. Soergel, T. Woike, and L.M. Eng,
“Conducting Domain Walls in Lithium Niobate Single Crystals,” Adv. Funct. Mater., 22
3936–3944 (2012).
164 J. Guyonnet, I. Gaponenko, S. Gariglio, and P. Paruch, “Conduction at Domain Walls in
Insulating Pb(Zr0.2Ti0.8)O3 Thin Films,” Adv. Mater., 23 5377–5382 (2011).
165 T. Kolodiazhnyi, M. Tachibana, H. Kawaji, J. Hwang, and E. Takayama-Muromachi,
“Persistence of Ferroelectricity in BaTiO3 through the Insulator-Metal Transition,” Phys.
Rev. Lett., 104 [14] 147602 (2010).
166 T. Kolodiazhnyi, “Insulator-Metal Transition and Anomalous Sign Reversal of the
Dominant Charge Carriers in Perovskite BaTiO3−δ,” Phys. Rev. B, 78 [4] 045107 (2008).
167 B.T. Matthias, “Ferroelectricity,” J. Appl. Phys., 38 [3] 928–930 (1967).
168 P.E. Hopkins, C. Adamo, L. Ye, B.D. Huey, S.R. Lee, D.G. Schlom, and J.F. Ihlefeld,
“Effects of Coherent Ferroelastic Domain Walls on the Thermal Conductivity and Kapitza
Conductance in Bismuth Ferrite,” Appl. Phys. Lett., 102 [12] 121903 (2013).
169 J. Hlinka, S. Kamba, J. Petzelt, J. Kulda, C.A. Randall, and S.J. Zhang, “Origin of the
‘Waterfall’ Effect in Phonon Dispersion of Relaxor Perovskites.,” Phys. Rev. Lett., 91 [10]
107602 (2003).
170 O. Delaire, J. Ma, K. Marty, A.F. May, M.A. McGuire, M.-H. Du, D.J. Singh, A.
Podlesnyak, et al., “Giant Anharmonic Phonon Scattering in PbTe.,” Nat. Mater., 10 [8]
614–619 (2011).
171 K. Uchino, “Relaxor Ferroelectrics,” J. Ceram. Soc. Japan, 99 [1] 829–835 (1991).
172 R.F. Janninck and D.H. Whitmore, “Electrical Conductivity and Thermoelectric Power of

175
Niobium Dioxide,” J. Phys. Chem. Solids., 27 1183–1187 (1966).
173 A.B. Kuzmenko, “Kramers-Kronig Constrained Variational Analysis of Optical Spectra,”
Rev. Sci. Instrum., 76 [8] 083108 (2005).
174 N.E. Brown, S.M. Swapp, C.L. Bennett, and A. Navrotsky, “High-Temperature X-ray
Diffraction: Solutions to Uncertanties in Temperature and Sample Position,” J. Appl.
Crystallogr., 26 77–81 (1993).
175 A.S. Bhalla, R. Guo, L.E. Cross, G. Burns, F.H. Dacol, and R.R. Neurgaonkar, “Glassy
Polarization in the Ferroelectric Tungsten Bronze (Ba,Sr)Nb2O6,” J. Appl. Phys., 71 [11]
5591–5595 (1992).
176 C.S. Dandeneau, T.W. Bodick, R.K. Bordia, and F.S. Ohuchi, “Thermoelectric Properties
of Reduced Polycrystalline Sr0.5Ba0.5Nb2O6 Fabricated Via Solution Combustion
Synthesis,” J. Am. Ceram. Soc., 96 [7] 2230–2237 (2013).
177 L. Yi, L. Jian, W. Chun-Lei, S. Wen-Bin, Z. Yuan-Hu, L. Ji-Chao, and M. Liang-Mo,
“Thermoelectric Properties of Sr0.61Ba0.39Nb2O6−δ Ceramics in Different Oxygen-
Reduction Conditions,” Chinese Phys. B, 24 [4] 047201 (2015).
178 C.S. Dandeneau, Y. Yang, B.W. Krueger, M.A. Olmstead, R.K. Bordia, and F.S. Ohuchi,
“Site Occupancy and Cation Binding Sites in Reduced Polycrystalline SrxBa1-xNb2O6,”
Appl. Phys. Lett., 104 101607 (2014).
179 D. Emin, “Optical Properties of Large and Small Polarons and Bipolarons,” Phys. Rev. B,
48 [18] 13691–13702 (1993).
180 S. Uchida, T. Ido, H. Takagi, T. Arima, Y. Tokura, and S. Tajima, “Optical Spectra of
La2−xSrxCuO4: Effect of Carrier Doping on the Electronic Structure of the CuO2 Plane,”
Phys. Rev. B, 43 [10] 7942–7954 (1991).
181 J.L.M. van Mechelen, D. van der Marel, C. Grimaldi, A.B. Kuzmenko, N.P. Armitage, N.
Reyren, H. Hagemann, and I.I. Mazin, “Electron-Phonon Interaction and Charge Carrier

176
Mass Enhancement in SrTiO3,” Phys. Rev. Lett., 100 [22] 226403 (2008).
182 T. Zhao, Z.-H. Chen, F. Chen, H.-B. Lu, G.-Z. Yang, and H.-S. Cheng, “Electrical and
Optical Properties of Strongly Reduced Epitaxial BaTiO3−x Thin Films,” Appl. Phys. Lett.,
77 [26] 4338 (2000).
183 J. Hwang, T. Kolodiazhnyi, J. Yang, and M. Coullard, “Doping and Temperature
Dependent Optical Properties of Reduced BaTiO3−δ,” Phys. Rev. B, 82 214109 (2010).
184 C.N. Berglund and H.J. Braun, “Optical Absorption in Single-Domain Ferroelectric
Barium Titanate,” Phys. Rev., 164 [2] 790–799 (1967).
185 Y. Li, J. Liu, Y. Hou, Y. Zhang, Y. Zhou, W. Su, Y. Zhu, J. Li, et al., “Thermal
Conductivity and Thermoelectric Performance of SrxBa1−xNb2O6 Ceramics at High
Temperatures,” Scr. Mater., 109 80–83 (2015).
186 V. V. Shvartsman, W. Kleemann, T. Łukasiewicz, and J. Dec, “Nanopolar Structure in
SrxBa1-xNb2O6 Single Crystals Tuned by Sr/Ba Ratio and Investigated by Piezoelectric
Force Microscopy,” Phys. Rev. B, 77 [5] 054105 (2008).
187 K.L.I. Kobayashi, Y. Kato, Y. Katayama, and K.F. Komatsubara, “Carrier-concentration-
dependent phase transition in SnTe,” Phys. Rev. Lett., 37 [12] 772–774 (1976).
188 I. Henning, M. Mertig, R. Plath, G. Pompe, E. Heganbarth, and R. Schalge, “Glass-Like
Behavior of Sr1-xBaxNb2O6 (SBN) Single Crystals Demonstrated by Heat Capacity
Measurements,” Phys. Status Solidi, 73 K105–K109 (1982).
189 E. Gorham-Bergeron and D. Emin, “Phonon-Assisted Hopping Due to Interaction with
Both Acoustical and Optical Phonons,” Phys. Rev. B, 15 [8] 3667–3680 (1977).
190 S.T. Liu and L.E. Cross, “Primary Pyroelectricity in Strontium Barium Niobate
(Sr0.5Ba0.5Nb2O6) Single Crystals,” Phys. Status Solidi, 41 K83–K87 (1977).
191 C.S. Dandeneau, Y. Yang, M.A. Olmstead, R.K. Bordia, and F.S. Ohuchi, “Polaronic
Conduction and Anderson Localization in Reduced Strontium Barium Niobate,” Appl.

177
Phys. Lett., 107 [23] 232901 (2015).
192 C. David, A. Tunyagi, K. Betzler, and M. Wöhlecke, “Compositional Dependence of
Optical and Vibrational Properties of Strontium Barium Niobate (SrxBa1-xNb2O6),” Phys.
Status Solidi Basic Res., 244 [6] 2127–2137 (2007).
193 M. Cutler and N.F. Mott, “Observation of Anderson Localization in an Electron Gas,”
Phys. Rev., 181 1336–1340 (1969).
194 M.D. Ewbank, R.R. Neurgaonkar, W.K. Cory, and J. Feinberg, “Photorefractive
Properties of Strontium-Barium Niobate,” J. Appl. Phys., 62 [2] 374–380 (1987).
195 S. Sakamoto and T. Yazaki, “Anomalous Electro-Optic Properties of Ferroelectric
Strontium Barium Niobate and Their Device Applications,” Appl. Phys. Lett., 22 [9] 429–
431 (1973).
196 J.G. Carrio, Y.P. Mascarenhas, W. Yelon, I.A. Santos, D. Garcia, and J.A. Eiras,
“Structure Refinement of (Sr,Ba)Nb2O6 Ceramic Powder from Neutron and X-Rays
Diffraction Data,” Mater. Res., 5 [1] 57–62 (2002).
197 S.C. Abrahams, P.B. Jamieson, and J.L. Bernstein, “Ferroelectric Tungsten Bronze-Type
Crystal Structures. III. Potassium Lithium Niobate K6−x−yLi4+xNb10+yO30,” J. Chem. Phys.,
54 [6] 2355 (1971).
198 P.B. Jamieson, S.C. Abrahams, and J.L. Bernstein, “Ferroelectric Tungsten Bronze-Type
Crystal Structures. II. Barium Sodium Niobate Ba(4+x)Na(2-2x)Nb10O30,” J. Chem. Phys., 50
4352 (1969).
199 X. Zhu, M. Fu, M.C. Stennett, P.M. Vilarinho, I. Levin, C.A. Randall, J. Gardner, F.D.
Morrison, et al., “A Crystal-Chemical Framework for Relaxor versus Normal Ferroelectric
Behavior in Tetragonal Tungsten Bronzes,” Chem. Mater., 27 [9] 3250–3261 (2015).
200 Y. Chang, S. Lee, S. Poterala, C.A. Randall, and G.L. Messing, “A Critical Evaluation of
Reactive Templated Grain Growth (RTGG) Mechanisms in Highly [001] Textured

178
Sr0.61Ba0.39Nb2O6 Ferroelectric-Thermoelectrics,” J. Mater. Res., 26 [24] 3044–3050
(2011).
201 T. Kolodiazhnyi, H. Sakurai, O. Vasylkiv, H. Borodianska, and Y. Mozharivskyj,
“Abnormal Thermal Conductivity in Tetragonal Tungsten Bronze Ba6-xSrxNb10O30,” Appl.
Phys. Lett., 104 [11] 111903 (2014).
202 C.S. Dandeneau, “Defect Chemistry and Thermoelectric Behavior of n-type (SrxBa1-
x)Nb2O6”; University of Washington, 2015.
203 J.R. Carruthers and M. Grasso, “Phase Equilibria Relations in the Ternary System BaO-
SrO-Nb2O5,” J. Electrochem. Soc., 117 [11] 1426–1430 (1970).
204 C. Nikasch and M. Gobbels, “Phase Relations and Lattice Parameters in the System SrO-
BaO-Nb2O5 Focusing on SBN (SrxBa1-xNb2O6),” J. Cryst. Growth, 269 [2-4] 324–332
(2004).
205 A.W. Sleight, “The Crystal Structure of Nb16W18O94, a Member of a (MeO)xMeO3 Family
of Compounds,” Acta Chem. Scand., 20 [4] 1102–1112 (1966).
206 C.P. Heinrich, M. Schrade, G. Cerretti, I. Lieberwirth, P. Leidich, A. Schmitz, H. Fjeld, E.
Mueller, et al., “Tetragonal Tungsten Bronzes Nb8-xW9+xO47-δ: Optimization Strategies and
Transport Properties of a New n-Type Thermoelectric Oxide,” Mater. Horiz., 2 519–527
(2015).
207 G. Svensson, “X-Ray Diffraction and Electron Microscopy Studies of New Reduced
Phases in the Ba-Nb-O System,” Solid State Ionics, 32 126–133 (1989).
208 G. Svensson, “Ba2Nb5O9 - An Intergrowth of BaNbO3 (Perovskite) and NbO,” Mat. Res.
Bull., 23 437–446 (1988).
209 G. Svensson, “HREM Studies of Introgrwoth Between NbO and Perovskite in the Ba,Sr
and K-Nb-O Systems,” Micros. Microanal. Microstruct., 1 343–356 (1990).
210 V.M. Zhukovsky and A.L. Podkorytov, “Investigation of s,p,d-Element Niobated and

179
Their Solid Solution Formation Processes by Thermal Analysis,” J. Therm. Anal.
Calorim., 60 523–534 (2000).
211 J. Chan, “Study of Filled Tungsten Bronze Strontium Barium Niobate for Thermoelectric
Applicaitons;” The Pennsylvania State University, 2016.
212 Y. Li, J. Liu, C. Wang, W. Su, Y. Zhu, J. Li, and L. Mei, “Effects of Oxygen-Reduction
on Thermoelectric Properties of Sr0.61Ba0.39Nb2O6 Ceramics,” Mater. Sci. Forum, 787
210–214 (2014).
213 C. Yu, M.L. Scullin, M. Huijben, R. Ramesh, and A. Majumdar, “Thermal Conductivity
Reduction in Oxygen-Deficient Strontium Titanates,” Appl. Phys. Lett., 92 [19] 191911
(2008).
214 Y. Li, J. Liu, Y. Zhang, Y. Zhou, J. Li, W. Su, J. Zhai, H. Wang, et al., “Enhancement of
Thermoelectric Performance of Sr0.7Ba0.3Nb2O6−δ Ceramics by Lanthanum Doping,”
Ceram. Int., 42 1128–1132 (2016).
215 J. Martin, W. Wong-Ng, and M.L. Green, “Seebeck Coefficient Metrology: Do
Contemporary Protocols Measure Up?,” J. Electron. Mater., 44 [6] 1998–2006 (2015).
216 J.A. Bock, S. Lee, S. Trolier-McKinstry, and C.A. Randall, “Metallic-like to Nonmetallic
Transitions in a Variety of Heavily Oxygen Deficient Ferroelectrics,” Appl. Phys. Lett.,
107 [9] 092902 (2015).
217 T. Tsubota, M. Ohtaki, K. Eguchi, and H. Arai, “Thermoelectric Properties of Al-Doped
ZnO as a Promising Oxide Material for High-Temperature Thermoelectric Conversion,” J.
Mater. Chem., 7 85–90 (1997).
218 A.J. Bosman and H.J. van Daal, “Small-Polaron Versus Band Conduction in Some
Transition-Metal Oxides,” Adv. Phys., 19 [77] 1–117 (1970).
219 I. Levin, M.C. Stennett, G.C. Miles, D.I. Woodward, A.R. West, and I.M. Reaney,
“Coupling Between Octahedral Tilting and Ferroelectric Order in Tetragonal Tungsten

180
Bronze-Structured Dielectrics,” Appl. Phys. Lett., 89 [12] 122908 (2006).
220 J. Gardner and F.D. Morrison, “A-site Size Effect in a Family of Unfilled Ferroelectric
Tetragonal Tungsten Bronzes: Ba4R0.67Nb10O30(R = La, Nd, Sm, Gd, Dy and Y),” Dalt.
Trans., 43 11687–11695 (2014).
221 M. Imada, A. Fujimori, and Y. Tokura, “Metal-Insulator Transitions,” Rev. Mod. Phys., 70
[4] 1039–1263 (1998).
222 J.B. Torrance, P. Lacorre, A.I. Nazzal, E.J. Ansaldo, and C. Niedermayer, “Systematic
Study of Insulator-Metal Transitions in Perovskites RNiO3 (R=Pr,Nd,Sm,Eu) Due to
Closing of Charge-Transfer Gap,” Phys. Rev. B, 45 [14] 8209–8212 (1992).
223 X.L. Zhu, K. Li, and X.M. Chen, “Ferroelectric Transition and Low-Temperature
Dielectric Relaxations in Filled Tungsten Bronzes,” J. Am. Ceram. Soc., 97 [2] 329–338
(2014).
224 H.A. Graetsch, J. Schreuer, M. Burianek, and M. Mühlberg, “Thermally Induced
Structural Changes in Incommensurate Calcium Barium Niobate Ca0.28Ba0.72Nb2O6
(CBN28),” J. Solid State Chem., 196 255–266 (2012).
225 D.C. Arnold and F.D. Morrison, “B-cation Effects in Relaxor and Ferroelectric Tetragonal
Tungsten Bronzes,” J. Mater. Chem., 19 [36] 6485 (2009).
226 S.B. Qadri, J.A. Bellotti, A. Garzarella, and D.H. Wu, “Anisotropic Thermal Expansion of
Strontium Barium Niobate,” Appl. Phys. Lett., 86 [25] 251914 (2005).
227 F. Prokert, “Neutron Scattering Studies on Strontium Barium Niobate,” Phys. Status
Solidi, 113 239–252 (1982).
228 H. Uchihashi, N. Tohge, and T. Minami, “Preparation of Amorphous Al2O3 Thin Films
from Stabilized Al-Alkoxides by the Sol-Gel Method,” Nippon Seramikkusu Kyokai
Gakujutsu Ronbunshi, 97 [3] 396–99 (1989).
229 R. Nakamura, T. Toda, S. Tsukui, M. Tane, M. Ishimaru, T. Suzuki, and H. Nakajima,

181
“Diffusion of Oxygen in Amorphous Al2O3, Ta2O5, and Nb2O5,” J. Appl. Phys., 116 [3]
033504 (2014).
230 T. Nabatame, T. Yasuda, M. Nishizawa, M. Ikeda, T. Horikawa, and A. Toriumi,
“Comparative Studies on Oxygen Diffusion Coefficients for Amorphous and γ-Al2O3
Films using 18
O Isotope,” Jpn. J. Appl. Phys., 42 7205–7208 (2003).
231 W.D. Kingery, “Density and Thermal Expansion of Crystals;” pp. 467–473 in Introd. To
Ceram., 1st ed. John Wiley & Sons, Inc., 1960.
232 J.B. Wachtman, T.G. Scuderi, and G.W. Cleek, “Linear Thermal Expansion of Aluminum
Oxide and Thorium Oxide from 100 to 1100K,” J. Am. Ceram. Soc., 45 [7] 319–323
(1962).
233 F. Di Fonzo, D. Tonini, A. Li Bassi, C.S. Casari, M.G. Beghi, C.E. Bottani, D. Gastaldi, P.
Vena, et al., “Growth Regimes in Pulsed Laser Deposition of Aluminum Oxide Films,”
Appl. Phys. A, 93 [3] 765–769 (2008).
234 T. Maruyama and T. Nakai, “Aluminum Oxide Thin Films Prepared by Chemical Vapor
Deposition From Aluminum 2-Ethylhexanoate,” Appl. Phys. Lett., 58 [19] 2079–80
(1991).
235 W. Koh, S.-J. Ku, and Y. Kim, “Chemical Vapor Deposition of Al2O3 Films Using Highly
Volatile Single Sources,” Thin Solid Films, 304 222–224 (1997).
236 M. Aguilar-Frutis, M. Garcia, C. Falcony, G. Plesch, and S. Jimenez-Sandoval, “A Study
of the Dielectric Characteristics of Aluminum Oxide Thin Films Deposited by Spray
Pyrolysis from Al(acac)3,” Thin Solid Films, 389 200–206 (2001).
237 S. Maniv and W.D. Westwood, “Discharge Characteristics for Magnetron Sputtering of Al
in Ar and Ar/O2 Mixtures,” J. Vac. Sci. Technol., 17 [3] 743 (1980).
238 T. Olding, M. Sayer, and D. Barrow, “Ceramic Sol-Gel Composite Coatings for Electrical
Insulation,” Thin Solid Films, 398-399 581–586 (2001).

182
239 K.R. Murali and P. Thirumoorthy, “Characteristics of Sol-Gel Deposited Alumina Films,”
J. Alloys Compd., 500 93–95 (2010).
240 C. Jing, X. Zhao, and Y. Zhang, “Sol-Gel Fabrication of Compact, Crack-Free Alumina
Film,” Mater. Res. Bull., 42 600–608 (2007).
241 Q. Fu, C.-B. Cao, and H.-S. Zhu, “Preparation of Alumina Films From a New Sol–Gel
Route,” Thin Solid Films, 348 99–102 (1999).
242 J.G. Olin, Capillary Tube Thermal Mass Flow Meters & Controllers A User’s Guide,
(2013).
243 N. Cusack and P. Kendall, “The Absolute Scale of Thermoelectric Power at High
Temperature,” Proc. Physcial Soc., 72 [5] 898–901 (1958).
244 J. Mackey, F. Dynys, and A. Sehirlioglu, “Uncertainty Analysis for Common Seebeck and
Electrical Resistivity Measurement Systems,” Rev. Sci. Instrum., 85 [8] 085119 (2014).

183
VITA
Jonathan A. Bock
Jonathan Anton Bock was born March 19th 1988 in Jefferson City, Missouri, to Robert
and Susan Bock. He attended school at the University of Missouri – Rolla and earned a degree in
Ceramic Engineering. Jonathan then went to Penn State to obtain his PhD in Material Science
and Engineering while working alongside Clive Randall and Susan Trolier-McKinstry with the
goal of studying ferroelectric-based thermoelectrics.