Fast Spectrum Molten Salt Reactor Options - Home - info.ornl.gov

ORNL/TM-2009/254
Investigation of Pipelines Integrity Associated with Pump Modules Vibration for Pumping Station 9 of Alyeska Pipeline Service Company
October 2009
Prepared by John Jy-An Wang, Oak Ridge National Laboratory

DOCUMENT AVAILABILITY
Reports produced after January 1, 1996, are generally available free via the U.S. Department of Energy (DOE) Information Bridge.
Web site http://www.osti.gov/bridge
Reports produced before January 1, 1996, may be purchased by members of the public from the following source.
National Technical Information Service
5285 Port Royal Road
Springfield, VA 22161
Telephone 703-605-6000 (1-800-553-6847)
TDD 703-487-4639
Fax 703-605-6900
E-mail [email protected]
Web site http://www.ntis.gov/support/ordernowabout.htm
Reports are available to DOE employees, DOE contractors, Energy Technology Data Exchange (ETDE) representatives, and International Nuclear Information System (INIS) representatives from the following source.
Office of Scientific and Technical Information
P.O. Box 62
Oak Ridge, TN 37831
Telephone 865-576-8401
Fax 865-576-5728
E-mail [email protected]
Web site http://www.osti.gov/contact.html
This report was prepared as an account of work sponsored by an agency of the United States Government. Neither the United States government nor any agency thereof, nor any of their employees, makes any warranty, express or implied, or assumes any legal liability or responsibility for the accuracy, completeness, or usefulness of any information, apparatus, product, or process disclosed, or represents that its use would not infringe privately owned rights. Reference herein to any specific commercial product, process, or service by trade name, trademark, manufacturer, or otherwise, does not necessarily constitute or imply its endorsement, recommendation, or favoring by the United States Government or any agency thereof. The views and opinions of authors expressed herein do not necessarily state or reflect those of the United States Government or any agency thereof.

iii
ORNL/TM-2009/254
Materials Science and Technology Division
INVESTIGATION OF PIPELINES INTEGRITY ASSOCIATED WITH PUMP MODULES VIBRATION FOR PUMPING STATION 9 OF
ALYESKA PIPELINE SERVICE COMPANY
John Jy-An Wang Oak Ridge National Laboratory
Date Published: October 2009
Prepared by
OAK RIDGE NATIONAL LABORATORY
P.O. Box 2008
Oak Ridge, Tennessee 37831-6285
managed by
UT-Battelle, LLC
for the
U.S. DEPARTMENT OF ENERGY
under contract DE-AC05-00OR22725

iii
CONTENTS
Page
EXECUTIVE SUMMARY .........................................................................................................1 1. Background .............................................................................................................................2 2. PS09 Site Visit and Vibration Measurement ............................................................................2 3. Investigations of the Root Causes of Pump Module Vibration Phenomena ..............................5
3.1 Background on Initial Piping System Structural Analysis ..................................................5 3.2 General Consideration on Vibration Mitigation Measure ...................................................6 3.3 Mixed-Mode Fatigue Damage Consideration .....................................................................7 3.4 The Impact of Rigidity and Inertia to the Pump Module Vibration ....................................8 3.5 The Potential Vibration Source from the Hydrodynamics Aspect ......................................8 3.6 Analysis Plan and Recommendations................................................................................9
4. Review Comments on EDI Report 93393-1 regarding PS09 and PS03 Vibration Investigation ................................................................................................................................................. 10
4.1 Piping vibration severity .................................................................................................. 10 4.2 Pulsation and its impact on the PS09 structure and piping system .................................... 14 4.3 Strain-gage stress history profiles ................................................................................... 17 4.4 The cavitation potential investigation .............................................................................. 20
Acknowledgments ..................................................................................................................... 21 APPENDIX A, B, and C: Vibration Velocity, Displacement, and Acceleration Spectra and the Associated Site Locations.......................................................................................................... 22

v
LIST OF FIGURES
Figure Page
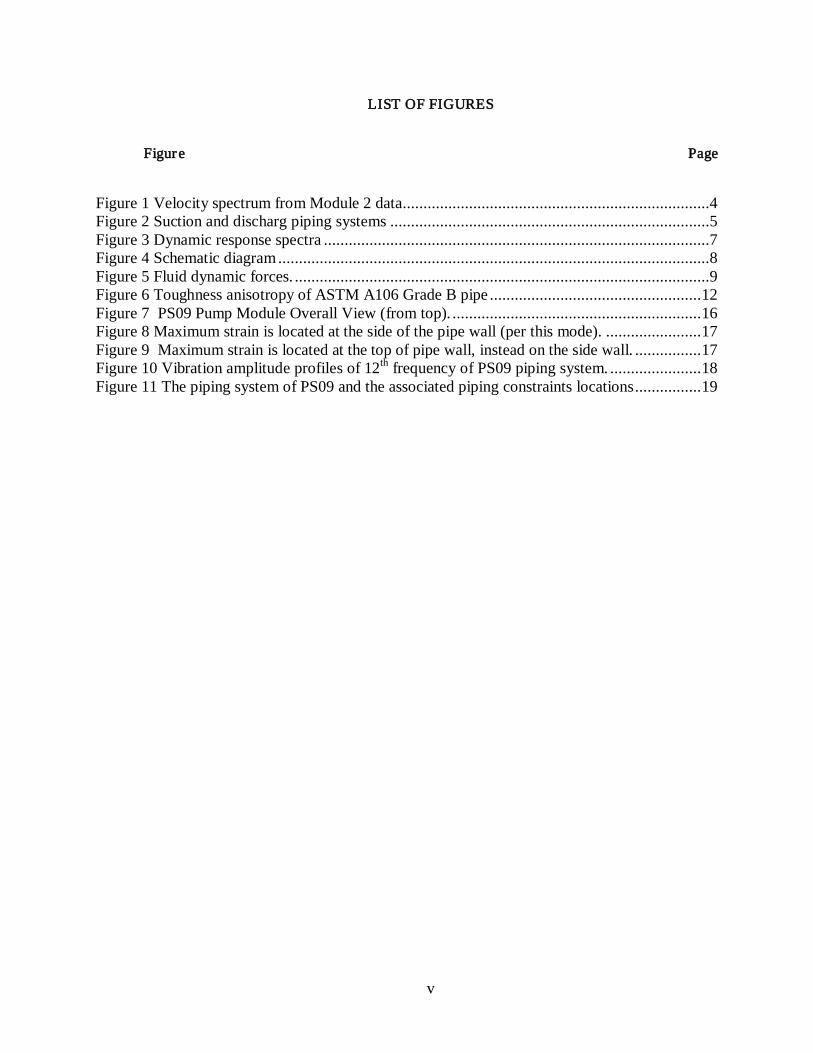
Figure 1 Velocity spectrum from Module 2 data ..........................................................................4 Figure 2 Suction and discharg piping systems .............................................................................5 Figure 3 Dynamic response spectra .............................................................................................7 Figure 4 Schematic diagram ........................................................................................................8 Figure 5 Fluid dynamic forces. ....................................................................................................9 Figure 6 Toughness anisotropy of ASTM A106 Grade B pipe ................................................... 12 Figure 7 PS09 Pump Module Overall View (from top). ............................................................ 16 Figure 8 Maximum strain is located at the side of the pipe wall (per this mode). ....................... 17 Figure 9 Maximum strain is located at the top of pipe wall, instead on the side wall. ................ 17 Figure 10 Vibration amplitude profiles of 12th frequency of PS09 piping system. ...................... 18 Figure 11 The piping system of PS09 and the associated piping constraints locations ................ 19


vii
LIST OF TABLES
Table Page
Table 1 Comparison of velocity measurements ............................................................................3
1
EXECUTIVE SUMMARY
Since the operation of PS09 SR module in 2007, it has been observed that there is vibration in various parts of the structures, on various segments of piping, and on appurtenance items. At DOT Pipeline and Hazardous Materials Safety Administration (PHMSA) request, ORNL Subject Matter Experts support PHMSA in its review and analysis of the observed vibration phenomenon. The review and analysis consider possible effects of pipeline design features, vibration characteristics, machinery configuration, and operating practices on the structural capacity and leak tight integrity of the pipeline. Emphasis are placed on protection of welded joints and machinery against failure from cyclic loading. A series of vibration measurements were carried out by the author during the site visit to PS09, the power of the operating pump during the data collection is at about 2970KW, which is less than that of APSC’s vibration data collected at 3900KW. Thus, a first order proportional factor of 4900/2970 was used to project the measured velocity data to that of APSC’s measurement of the velocity data. It is also noted here that the average or the peak-hold value of the measured velocity data was used in the author’s reported data, and only the maximum peak-hold data was used in APSC’s reported data. Therefore, in some cases APSC’s data is higher than the author’s projective estimates that using the average data. In general the projected velocity data are consistent with APSC’s measurements; the examples of comparison at various locations are illustrated in the Table 1. This exercise validates and confirms the report vibration data stated in APSC’s summary report. After the reinforcement project for PS09 Station, a significant reduction of vibration intensity was observed for the associated pipelines at the SR Modules. EDI Co. provided a detailed vibration intensity investigation for the newly reinforced Pump Module structures and the associated pipelines. A follow-up review of EDI's report was carried out by the author. The comments and questions regarding the EDI report are categorized into four subjects, namely (1) piping vibration severity, (2) pulsation and its impact on the PS09 structure and piping, (3) strain-gage stress history profiles, and (4) the cavitation potential investigation, where the questions are stated at the end of the comments for further follow-on investigations.

2
1. Background
Since the operation of PS09 SR module in 2007, it has been observed that there is vibration in various parts of the structures, on various segments of piping, and on appurtenance items. A general investigation was performed by Jerry DeHaas, as described in “Alyeska Pipeline Service Company’s (APSC) SR Mainline Motor, Pump and Module Vibration Investigation, PS09” APSC report. This report summarizes the vibration findings and offers recommendations to reduce the vibration by increasing the structure stiffness and damping of the pump module. The vibration data and the detailed recommendations are documented within a spreadsheet, ‘070430, SR Module Vibration, Summary and Recs’. As stated in the summary, “Most of the vibration issues appear to be the result of overly compliant structural elements and/or piping. This compliance or flexibility allows for the possibility of low natural frequencies and associated modes of motion. The magnitude of the vibration appears to increase with fluid flow, as would be expected. “
2. PS09 Site Visit and Vibration Measurement
A series of vibration measurements were carried out by the author during the recent site visit to PS09, the power of the operating pump during the data collection is at about 2970KW, which is less than that of APSC’s vibration data collected at 3900KW. Thus, a first order proportional factor of 4900/2970 was used to project the measured velocity data to that of APSC’s measurement of the velocity data. It is also noted here that the average or the peak-hold value of the measured velocity data was used in the author’s reported data, and only the maximum peak-hold data was used in APSC’s reported data. Therefore, in some cases APSC’s data is higher than the author’s projective estimates that using the average data. In general the projected velocity data are consistent with APSC’s measurements; the examples of comparison at various locations are illustrated in the Table 1. This exercise validates and confirms the report vibration data stated in APSC’s summary report. More details of the vibration velocity spectra and the associated locations are shown in Appendix A. The detailed vibration data provided in the PS09 vibration report was useful in performing a cursory analysis. Clearly a lot of time and effort was put into collecting and analyzing this data together. Analyzing the vibration data collected on the motor, and in comparison to data collected elsewhere indicates that the highest amplitude of vibration is not at turning speed or any turning speed related frequency. Using the data provided, the non-synchronous (to the motor and pump) vibration indicates that the major source of vibrational energy is either external or is resultant of fluid-flow induced energy. Based on this preliminary investigation I concur with APSC’s recommendations stated in the spreadsheet, ‘070430, SR Module Vibration, Summary and Recs’. Therefore, to increase the pump modules’ stiffness, including increasing the damping of the pump module system, will be the first step to mitigate the vibration phenomena occur in the PS09 pump modules.

3
Table 1 Comparison of velocity measurements
Velocity (inch per second) APSC ORNL 4900KW 2970KW Projective Pump Suction Line Guide Vert 0.16 0.103 0.17 Horiz 0.46 0.24 0.40 Axial 0.36 0.16 0.26 Drag valve Vert 0.75 0.669 1.10 Horiz EW 0.67 0.55 0.91 Horiz NS 0.44 0.23 0.38 Recycle line support structure E-W Horiz 0.36 0.24 0.39 N-S Horiz 0.52 0.33 0.55 Vert 0.45 0.292 0.48 Motor IBV 0.07 0.021 0.03 IBH 0.11 0.046 0.08 IBAx 0.07 0.038 0.06 Pump IBH 0.15 0.07 0.12 IBV 0.07 0.074 0.12 IBAx 0.095 0.054 0.09 Module Main I-Beam NE Corner Vert 0.06 0.0296 0.05 Horiz N-S 0.09 0.0353 0.06 Horiz E-W 0.12 0.0731 0.12 Pump Suc Line at Ring Anchor Horiz E-W 0.34 0.2 0.33 Horiz N-S 0.4 0.199 0.33 Near Vert 0.32 0.282 0.46 Pump Disch Line at Ring Anchor Horiz E-W 0.39 0.212 0.35 Horiz N-S 0.23 0.13 0.21 Vert 0.3 0.171 0.28
It is interested to note here that vibration velocity measurements at the wood cribbing sections, in either discharge or suction piping, are almost the same before or after the removal of the wood cribbing. The readings on the pump and piping indicate that the frequency of the pulsations do not occur at the motor speed or pump vane passing frequency. Acoustic measurement was also taken on the suction and discharge lines, with a pronounced increase in acoustic noise in the downstream of the strainer flange on the suction line. However, due to lack of proper instrumentation no detailed investigation was carried out on cavitation or hydrodynamic aspects at this visit.

4
Nevertheless, the intensity of turbulent flow induced cavitation phenomena in a piping system will be increased when the horizontal piping is changed to vertical orientation, such as in the discharge and suction lines sections within the pump modules. The consequence of the increased cavitation event is the increasing vibration and the potential of cavitation damage in the piping system. One effective way to catch the cavitation phenomena is through vibration measurement or ultrasonic detections. For example, the cavitation normally can be revealed through the wide-band spectrum in the high frequency range, as indicated in the following velocity spectrum from APSC’s vibration velocity data, in Module 2, at discharge line clamp guide location, Figure 1.
Figure 1 Velocity spectrum from Module 2 data If the initial mitigation measure is proved to be insufficient to control the vibration phenomena and the further investigation is warranted, more data, using more advanced techniques and other technologies maybe required for full analyses. Some suggestions are: a) Use ultrasonic technology to identify turbulent fluid flow b) Measure and evaluate the vibration energy input from turbulent fluid flow c) Collect phase data using a two channel vibration data collector for use of determining
torsional vibration and looking for relative motion component by component d) Collect natural frequency vibration data using a two channel vibration data collector on
piping and structural members for analysis and for confirmation of analytically derived data Once this data is collected and analyzed, it can be used to explore potential problem resolutions such as:
Potential cavitation characteristic

5
a) If flow-induced vibration is confirmed as the cause of the vibration, exploration of piping design changes to reduce this energy input.
b) Use of natural frequency measured data to determine potential structural changes to alter natural frequencies away from coincident input energy.
3. Investigations of the Root Causes of Pump Module Vibration Phenomena
3.1 Background on Initial Piping System Structural Analysis The piping analyses reports for the Alyeska Pipeline Service Company (APSC) Strategic Reconfiguration Project include discharge, suction and recirculation piping. Seasonal (summer and winter) effects on these systems were also incorporated to determine the maximum stress and loads for the final design. Seasonal effects include temperature and pressure extremes on the piping and pipe support pile fixity lengths for thawed and frozen soil conditions.
The pump suction and discharge piping connects the three new mainline pumps to the existing pump station suction and discharge header piping. The pumps and related piping are configured for parallel operation; the physical configurations of suction and discharge piping systems are illustrated in Fig. 2. Sufficient piping and valves are provided to permit the independent operation of any or the entire new pump sets. Unit and station recirculation piping is provided for pump startup, station startup, cold restart and possible load bank purposes.
The pipe rack and pump module analyses for the discharge or suction system at PS 9 were decoupled to improve model convergence. The piping analysis includes the assessment of pump connection and piping component loads to ensure compliance with specified limits and the specification of pipe support types, locations and design reactions.
The following element parameters were included in the structural analyses: • Pressures (up to 4 different values plus the hydrostatic test pressure)
Figure 2 Suction and discharg piping systems

6
• Temperatures (up to 8 different combinations), ranges from -20°F to 145°F • Insulation weight
• Weight of contents • Pipe Supports and Restraints
• External Forces & Moments • Wind Loading
• Seismic Loading (response spectra) • Imposed displacements
3.2 General Consideration on Vibration Mitigation Measure Adding the stiffener or other reinforcement to increase the overall structural stiffness is the first step to reduce the pump module vibration phenomena. Moreover, in order to increase the efficiency of reducing the overall pump module vibration, in addition to reinforcing the lower deck and pile brace, reinforcing the roof diaphragm to increase the overall rigidity needs to be considered, However, increasing rigidity may not be able to fully resolve the potential of cycle fatigue induced damage to the piping system. This because the increased rigidity of the structure will reduce the overall compliance and the individual vibration amplitude, but this will not reduce the overall energy input into the piping and structure systems from vibration sources. The increasing rigidly of the structure through utilizing reinforcing measure can reduce the overall vibration amplitude, but it will also result in the increase of the structure natural frequency. Therefore this may not lead to the net reduction of the total vibration energy input that has potential to induce fatigue damage to the piping system.
Therefore, the key steps of this investigation are to seek and confirm the vibration sources, and then to find mitigation protocols to correct the vibration sources. There are two likely vibration sources, namely, the motor and the associated pump apparatus, and the energy input by the fluid dynamics aspects throughout the existing piping system. Based on the preliminary review of the provided structural analyses reports, no evidence of the hydro-dynamics associated energy and momentum in the piping system were taken into account either through the element parameters or the load-case simulation (more than 25 loading cases were considered). Fluid dynamics evaluations are critical to confirm the vibration source and for a realistic estimate of the long term fatigue lifetime investigation. I believe the fluid dynamics aspect may provide the major input for the vibration of PS09. The pump frame and base plate are very stiff compared to the Pump Module structure elevated on piles. Therefore, the displacements of the module deck are a good indicator of the pump nozzle displacements. For a refined estimate, however, it is necessary to account for the actual stiffness of the pump and its base plate as well as the restraint provided to the pump by the pipe headers. The detailed model for seismic dynamics analyses is illustrated below. Four stiffness scenarios were investigated, the model of the full braced piles case with increased soil dynamics stiffness results in 50% reduction in seismic movement of pump module compared to that of the base model that has no pile braces. Therefore, the braced piles approach can result in significant

7
reduction in vibration displacement. However, in these analyses the hydro-dynamics load pattern from the piping system was not taken into account. Thus, the net efficiency of the vibration reduction through increased stiffness still needs to be further clarified.
3.3 Mixed-Mode Fatigue Damage Consideration Based on dynamics analysis results of the suction piping system, for a frequency of 2.35 Hz, the maximum deformation appears to be at the elbow section of the piping system, as illustrated in Fig. 3. If incorporating fluid dynamic contribution, it is very likely that the elbow section will be mostly under mix-mode loading, flexural tensile and torsional shear stresses. Based on our experience for ductile metals, at a critical phase angle, the mixed-mode associated fracture toughness will reduce to the half of mode-I (tensile opening mode) only fracture toughness. This could mean that the effective
Figure 3 Dynamic response spectra

8
lifetime of piping system due to fatigue under mixed-mode loading could reduce to the half of the effective lifetime compared to the tensile load only case. Thus, the mixed-mode failure mechanism deserves special attention. 3.4 The Impact of Rigidity and Inertia to the Pump Module Vibration Due to lack of enough rigidity in the pump module structure, the vibration response is fairly large as compared to that of motor or pump. The detailed investigation on the impact of the observed vibration intensity to the fatigue lifetime according to the current industry practices or standards on pipeline weldment needs to be carried out. From this initial investigation, the pump and motor hardware of PS09 would be better off if directly laid on a concrete pad on the ground floor instead of on an eight-foot high platform supported on the piles. Due to relative large mass from motor, pump, and the associated piping system as compared to that of pump module structure components, the momentum induced by the vibration motion inherited from the combined mass inertia of the motor, pump, and the piping system would be difficult to be constrained by the current pump module structure. Furthermore, the low natural frequency of the current pump module could be synchronized with the fluid-dynamic response; and the consequence is the increase of the overall vibration amplitude. Planned braces and other reinforcement to the piles and deck will be the first step to reduce the lateral displacement and the associated vibration phenomena. Nevertheless, such modification will also need the concurrence from the structure engineering on the seismic or other dynamic response consideration. The other option is to directly transmit the dynamic load to the ground by using the lateral support column and the associated piles. A schematic diagram of the momentum induced by combined mass of motor and piping is illustrated in Fig. 4. It is not difficult to visualize that the option of using lateral support reinforcement (marked with red line) would be an effective means to transmit the momentum or energy generated by the combined mass of motor, pump, and piping (including the fluid dynamic momentum), directly to the ground, if the space allows for such modification to mitigating the inertia impact on the overall vibration of the pump module. 3.5 The Potential Vibration Source from the Hydrodynamics Aspect Numerous elbows and bend sections are used in the design of the suction and discharge piping systems in the current pump module. This inevitably increases the hydrodynamics force to the pump module structure. Which in term provides the vibration source, in addition to the motor and pump associated energy input. Due to large mass inherited from motor, pump, and the piping system, even with small amount of vibration amplitude of the motor or piping system, the impact
Combined mass of motor, pump, piping
Momentum =mass*velocity
Figure 4 Schematic diagram

9
of the generated momentum to pump module deformation can be significant, due to relatively flexible superstructure of the pump module structure design and inertia ratio between combined mass and pump supporting structure. The pump piping is 14 inch, .375 wall pipe, under design flows of 1/3 of 1,140,000 bbl/day, the velocities in the sections reach 25 fps. At the time of inspection, the velocity was in the range of 20 fps. The potential for erosion at these velocities may be an avenue of investigation. A schematic diagram of reducer and/or elbow induced fluid dynamic forces is shown in Fig. 5. Proper anchor design is required to secure the piping system, the reaction transmitted to the pump module in term become the potential vibration source. Furthermore, the turbulent flow and the associated cavitation event is also a potential vibration source. The current suction and discharge piping set-up in the pump module seems to have potential for producing turbulent flow. This is because that at the section where fluid travels within a piping in a horizontal orientation was changed into a vertical orientation piping. The cavitation is the consequence of the induced turbulent flow in such system. The turbulent (vortex) flow and the associated cavitation could be an important vibration source and it may warrant further detailed investigation for verification.
3.6 Analysis Plan and Recommendations
1. The detailed investigation on the impact of the observed vibration intensity to the fatigue
lifetime, according to the current industry practices or standards, on the pipeline weldment within PS09 Pump Module needs to be carried out.
2. Increasing the stiffness and damping system in the pump module structure will be the first step to mitigate the vibration of PS09 Pump Module.
3. More detailed investigations need to be carried out on fluid dynamics contribution to the vibration phenomena, including turbulent flow and the associated cavitation event, follow with developing mitigation protocols.
4. The proposed Alyeska vibration mitigation procedure by increasing the stiffness of the pump module will require concurrence from a structural engineering with an update structure dynamic analysis. The update structure dynamics analysis needs to take into account the load contribution from hydrodynamics input of the existing piping systems, including discharge, suction and recirculation piping.
F
F
F
Figure 5 Fluid dynamic forces.

10
4. Review Comments on EDI Report 93393-1 regarding PS09 and PS03 Vibration Investigation
The review comments and questions on the EDI Report 93393-1 are categorized into four subjects, namely (1) piping vibration severity, (2) pulsation and its impact on the PS09 structure and piping, (3) strain-gage stress history profiles, and (4) the cavitation potential investigation, where the questions are stated at the end of the comments. 4.1 Piping vibration severity The EDI report used the piping severity charts to conclude that PS09 piping vibrations are normal and acceptable. EDI’s conclusion may be applicable to a very near term situation of a new structure, but this may not be true for an aging piping system or for a relative longer term operation. Thus, I have strong reservations about drawing such conclusions based only on this piping severity chart for PS09 piping vibration integrity investigation. "Allowable Piping Vibration Levels With Velocity Criteria Chart" was described in 1976 by Wachel, J.C. and Bates, C.L., "Techniques for Controlling Piping Vibration and Failures," ASME 76-PET-18. The authors also pointed out in another paper, "Piping Vibration and Stress," that such criteria (chart) are based largely upon the experience of field operation personnel who work with such equipment. While they may be applicable in a statistical sense to average or typical piping, they are fundamentally incorrect because they do not consider the configuration involved (such as size of the pipe, thickness, and other geometry constraints, etc.). As such, they introduce considerable risk when used to evaluate any specific piping system as they may result in a degree of design confidence which is unwarranted by the design procedure used. I certainly hope that this will not be the case for PS09 vibration study. The authors also pointed out that “the chart criterion as presented does not differentiate between a stiff compressor manifold system and a flexible scrubber lead line. It also should be noted that stress level in a pipe is a function of physical distortion only (i.e., strain), and is not a function of frequency for the general case.” Moreover, the chart data are from a wide spectrum of piping, for example, a large portion of data are from nuclear industry piping data, thus, it may have a significantly different design configuration as compared to that of Alyeska pipeline system, either in dimension or thickness of the piping, plus material properties, welding procedures and other aspects. Therefore, my comment on the EDI’s approach for using the Chart for PS09 integrity study is that: it can be used as a starting point in determining the piping system acceptability. But, when considering weighting a complex piping system, including the associated hydraulic dynamic loading and the constraint fixtures, application of the Chart criteria regarding the integrity of the PS09 pump module can be misleading; and the chart can not provide links or estimates on the reliability and safety of piping system on fatigue issues. This is because it lacks stress components for investigating piping systems, which is needed for accurate fatigue lifetime estimates. In general, the vibration velocity is proportional to the fatigue from the relationship of maximum strain energy and maximum kinetic energy, and the vibration acceleration is proportional to the force applied to or at the piping system. Therefore, vibration velocity and acceleration are also essential information, in addition the vibration displacement that is used in the Severity Chart, in

11
order to provide an accurate fatigue lifetime investigation for PS09 pump module vibration issue. Some strain-time history data were provided in the EDI report, which can be extremely useful in assisting the piping vibration evaluation. Unfortunately, the physical location of these strain gages are located at out-of-plane and align with the piping’s neutral axis of the associated vibration mode, which resulted in small strain measurements as anticipated from the neutral axis of the bending modes. Therefore, the reported small-amplitude strain-time history data from the EDI report are not representative, which was further discussed in details in Section 3. I would like to elaborate a bit more on the impact of large piping, such as the pipe radius-wall thickness ratio (R/t) on the piping effective capacity and the large pipe associated acoustic vibration mode. High strength steels used in the Alyeska pipelines, and the consequence of this is the increase of the pipe radius to pipe wall thickness ratio. Here, I would like to use the results provided in NRC report, NUREG/CR-6837, Vol. 1, to demonstrate the impact of high R/t ratio to the piping integrity. As can be seen from Figure 2.6 of NRC report, the higher the R/t ratio, the lower the experimental stress (load-carrying capacity) when compared with the predicted limit-load stress, i.e., NSC stress (obtained from the existing database and which do not have sufficient data to cover the high R/t spectrum). It has been hypothesized that this reduction in load-carrying capacity stems from the pipe cross section ovalizing for the thinner, higher R/t ratio pipes. For the PS09 of Alyeska Pipelines, which has wall thickness around 0.5 inch for 14-in, 20-in, 24-in and 36-in pipe, and the corresponding R/t ratio are ranged from 28, 40, 48, to 72. Based on Fig. 2.6, for a 14-in pipe with R/t=28, the load-carrying capacity will drop significantly, ~ 70% of that predicted by NSC predicted stress level. Furthermore, from Figure 2.7 of the same NRC report, which shows a comparison between the existing ASME Section XI Appendix H F-functions (geometry factor function of the stress intensity factor, K) and the newly developed F-functions as a function of crack depth for the case of an internal crack loaded in bending for a normalized crack length (c/a) of 16 and for a pipe with an R/t ratio of 40. As seen from this example, for a flaw depth that is less than workmanship standards (a/t < ~0.1), the difference in the F-function is near zero, however, as the crack depth (a/t) increases (or crack growth), the difference becomes much more substantial. For a very deep crack (75 percent through the thickness), the difference is nearly 45 percent. This means accelerated aging (or reducing the effective lifetime) for high R/t ratio piping regarding fatigue crack growth during service. Consequently using the existing F-functions in Section XI to predict the behavior of flaws in Class 2, 3, or BOP piping with much higher R/t ratios would result in a

12
significant underprediction of the crack-driving force, resulting in a nonconservative in-service flaw-evaluation assessment, at least for this set of conditions. Regarding the impact of piping material property variability to the piping effective lifetime, I would like to use the toughness anisotropy of A106 Grade-B carbon steel pipe to illustrate its impact. The Fig. 6 shows some data for A106 Grade B pipe material in which the toughness, measured in terms of Charpy impact energy, in the L-R direction (Curve D from Specimen D) is significantly higher than the toughness in the L-C direction (Curve C from Specimen C). As for circumferential oriented specimens, Curve A and Curve B show much less Charpy impact toughness than that of the axial oriented specimens. All these samples are machined from the same pipe. Thus, the nature of crack growth (physical location and crack growth orientation) within a piping system has a significant impact on the piping’s effective lifetime. Thus, the hoop stress and axial tensile stress both are important information for pipe fatigue lifetime estimates. In general, from a hydrostatic pressure point, for a thin-wall piping (R/t > ~10) the hoop stress level is about twice that of the axial tensile stress level. Pulsation in reciprocating compressors, positive displacement or centrifuge pumps environments can generally be described using one dimensional acoustics. In one dimensional acoustics, the wavelength of the pulsation is long compared with the pipe diameter, and the pressure pulse travels as a plane wave. Thus, in a one-dimensional model, the pressure properties are assumed to vary only along the length of the pipe and are constant over the cross-sectional area. However, for a large diameter piping, the wavelengths of propagating waves can be shorter than the characteristic dimensions of the pipe (plus the concern of the crude oil being an effective
Figure 6 Toughness anisotropy of ASTM A106 Grade B pipe

13
damping media even if it is being pressurized to increase the associated piping stiffness). When this occurs, the wave propagates at an oblique angle relative to the pipe wall, as compared with the plane wave propagation, which is parallel to the pipe wall. As a result, an interference pattern wave was formed, and so called cross-wall modes formed in the pipe. The acoustic pressure across a specific pipe cross-section is not constant, but varies as a function of the distance across the pipe. These acoustical natural frequencies are referred to as cross-wall or high-order mode. The cross-wall vibration modes and its impact to the piping integrity are also provided in details in “Source and Remedies of High-Frequencies Piping Vibration and Noise,” by Stephen Price and Don Smith of EDI. For thin wall piping (with high R/t ratio), at low frequencies, pipe vibration occurs laterally along its length (axial direction). At high frequencies, the pipe wall begins to vibrate in a radial orientation across its cross-section. At progressively higher frequencies, adjacent portions of the pipe wall may vibrate out-of-phase, producing a sine-wave around the circumference. Structural shell wall natural frequencies are amplification mechanisms that can result in high vibration when excited. For thin wall piping vibration acceptability criteria must relate vibration amplitudes to stress. This can be done by using the Mikasinovic formula; and then further relate the vibration velocity to the fatigue endurance limit. In general the accelerometer and strain gage are mounted in close vicinity and the strain gages are normally located in the circumference orientation (i.e., hoop stress orientation) for cross-wall mode investigation. Unfortunately, the EDI’s strain gage are all aligned with the axial orientation of piping; and without high frequencies vibration data (including pulsation data) provided in the report, for example at 14X to 28X running speed or 2 to 3X blade-pass frequencies, the cross-wall vibration modes can not be investigated. Therefore, the cross-wall modes’ associated potential impact on the piping integrity of PS09 piping system with relatively high R/t ratio is unknown. In summary, the strain-time or strain-frequency data are vital for this investigation. Vibration-induced piping stress is an area of major concern for piping designers and plant operators. Acceptable vibration amplitudes should be based on applicable fatigue criteria. Therefore, the stress level in a piping system is the primary index that should be considered in this investigation. Furthermore, based on my last visit to PS09, I learned that no detailed hydraulic dynamics analysis was carried out during the PS09 Module design phase; thus, the effective stress field of combining hydrodynamic and structural dynamics loading cases within the PS09 module and piping system is unknown. Moreover, due to the recent two phases of reinforcement of the P09 module, the associated structural dynamics response and the associated stress profiles will also be changed and this needs to be updated with new structural analyses accordingly. Therefore, if the vendor decides to re-analyze the stress fields for the updated PS09 module structure and the associated piping system, and they should take into account the hydrodynamics phenomena, then the in-situ strain-time history data may be waivered. However, I believe that the overall structure re-evaluation needs to be performed by the vendor to ensure that the overall structural integrity of the PS09 Module, w. r. t seismic and other dynamic transient combined loads still remain intact, and also to proceed with in-situ dynamic strain-history data evaluation for cross-validation (or to cross-check) of FEM results. Questions:
14
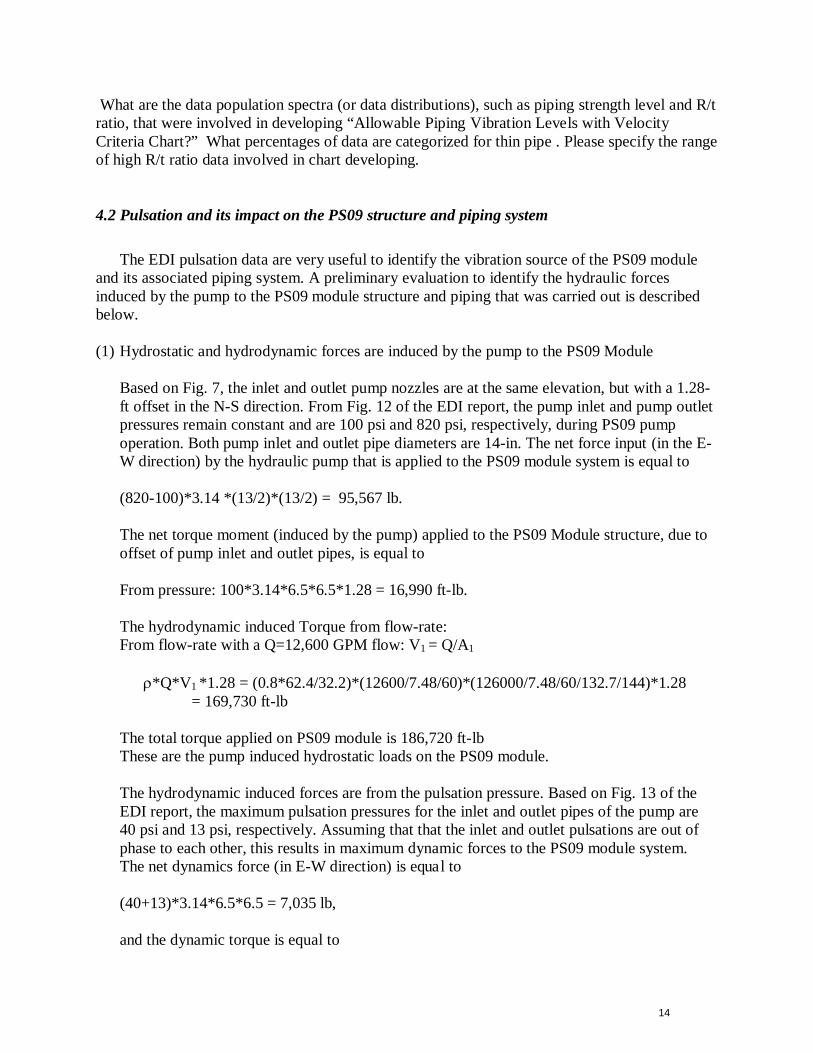
What are the data population spectra (or data distributions), such as piping strength level and R/t ratio, that were involved in developing “Allowable Piping Vibration Levels with Velocity Criteria Chart?” What percentages of data are categorized for thin pipe . Please specify the range of high R/t ratio data involved in chart developing. 4.2 Pulsation and its impact on the PS09 structure and piping system
The EDI pulsation data are very useful to identify the vibration source of the PS09 module and its associated piping system. A preliminary evaluation to identify the hydraulic forces induced by the pump to the PS09 module structure and piping that was carried out is described below.
(1) Hydrostatic and hydrodynamic forces are induced by the pump to the PS09 Module
Based on Fig. 7, the inlet and outlet pump nozzles are at the same elevation, but with a 1.28-ft offset in the N-S direction. From Fig. 12 of the EDI report, the pump inlet and pump outlet pressures remain constant and are 100 psi and 820 psi, respectively, during PS09 pump operation. Both pump inlet and outlet pipe diameters are 14-in. The net force input (in the E-W direction) by the hydraulic pump that is applied to the PS09 module system is equal to (820-100)*3.14 *(13/2)*(13/2) = 95,567 lb. The net torque moment (induced by the pump) applied to the PS09 Module structure, due to offset of pump inlet and outlet pipes, is equal to From pressure: 100*3.14*6.5*6.5*1.28 = 16,990 ft-lb. The hydrodynamic induced Torque from flow-rate: From flow-rate with a Q=12,600 GPM flow: V1 = Q/A1
ρ*Q*V1 *1.28 = (0.8*62.4/32.2)*(12600/7.48/60)*(126000/7.48/60/132.7/144)*1.28 = 169,730 ft-lb The total torque applied on PS09 module is 186,720 ft-lb These are the pump induced hydrostatic loads on the PS09 module. The hydrodynamic induced forces are from the pulsation pressure. Based on Fig. 13 of the EDI report, the maximum pulsation pressures for the inlet and outlet pipes of the pump are 40 psi and 13 psi, respectively. Assuming that that the inlet and outlet pulsations are out of phase to each other, this results in maximum dynamic forces to the PS09 module system. The net dynamics force (in E-W direction) is equal to (40+13)*3.14*6.5*6.5 = 7,035 lb, and the dynamic torque is equal to

15
(13)*3.14*6.6*6.5*1.28 = 2,209 ft-lb. These data are the hydrodynamic forces generated by the pump on the PS09 module structure.
(2) Hydrostatic and/or hydrodynamic forces are induced by the piping system configurations to
the PS09 Module
The pipe loop configurations, including all the pipe fittings, such as: elbow, reducer, and valves, will contribute to this category of forces. For demonstration purposes, the hydrodynamic force applied to the first elbow downstream of the pump is used as an example. For a 12,600 GPM flow at first elbow, (assuming that there is not much pressure variation at the first elbow inlet and outlet locations), the pressure is about 800 psi; the estimated resultant force components (at x and y-axis orientations) applied to the elbow can be written as below.
Fx = p1A1 + ρ*Q*V1, and Fy = p1A2 + ρ*Q*V2, where, V1 = Q/A1 = V 2 and p1= p1=800 psi, A1=A2=3.14*6.5*6.5=132.7 in^2; the crude oil density is set to 0.8 g/c.c.; substitute above into Fx,
Fx = Fy = 800*132.7 + (0.8*62.4/32.2)*(126000/7.48/60)*(126000/7.48/60/(132.7/144)) = 238,760-lb.
The associated resultant force FR is equal to 337,660-lb, at 45° angle (vertical) to the elbow. These hydrostatic and hydrodynamic forces and torques are significant and all need to be properly transmitted to the vertical supporting structure (VSM) of the PS09 module to ensure stability and safe operation of the pump and the associated piping system, i.e., the designed VSM of PS09 module must have sufficient stiffness and strength to cope with these hydrostatic and hydrodynamic forces generated by the pump and the associated piping systems. Questions: As provided in EDI report: “After a pipeline upset condition, a crack was discovered at the base of a small-bore pipe leading to the sump drain of Pump #1 at Pump Station 3. EDI performed a vibration survey. The purpose of the survey was to assess vibration amplitudes and recommend temporary modifications if required. Additionally, since the post-commissioning modifications had not yet been implemented, the data were to be used for comparison with data to be acquired after the modifications are completed. It was noted that the elevation of this pipe rack was lower at Station 3 than at Station 9. This would result in a relatively stiffer pipe support. Also, the permafrost at Station 3 resulted in a higher effective stiffness of the module VSMs.” (1) Fig. 97 indicates that the maximum pump flowrate of Unit 2-PS03 Module reached above
175,000 GPM, which is about 40% higher than that of PS09 pump module during vibration

16
investigation. Figs. 114-118 show high vibration amplitude data. Are these data related to this high flow-rate period during the vibration data collection?
(2) Figs 107-113 show most PS09 vibration data have higher vibration amplitude than that of the PS03. This is interesting to see that even after the reinforcement project of PS09, PS03 still performs better. Are these PS03 data also related to the high flow-rate data period?
Figure 7 PS09 Pump Module Overall View (from top).
17
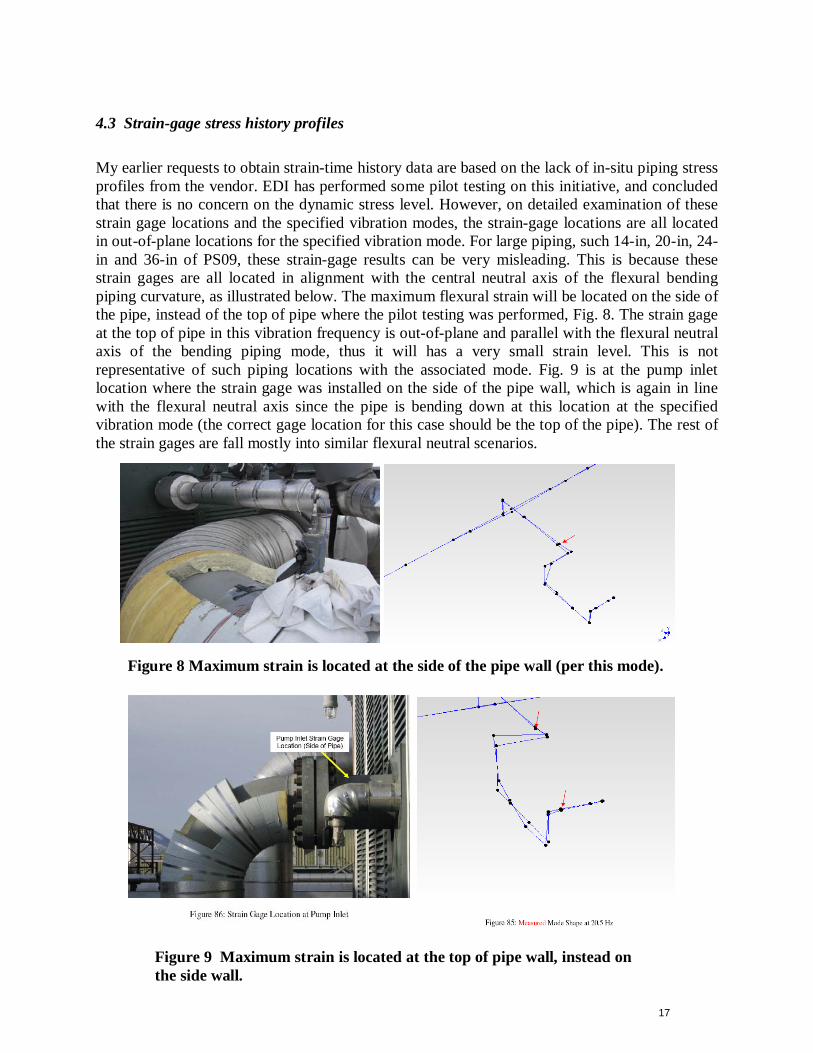
4.3 Strain-gage stress history profiles My earlier requests to obtain strain-time history data are based on the lack of in-situ piping stress profiles from the vendor. EDI has performed some pilot testing on this initiative, and concluded that there is no concern on the dynamic stress level. However, on detailed examination of these strain gage locations and the specified vibration modes, the strain-gage locations are all located in out-of-plane locations for the specified vibration mode. For large piping, such 14-in, 20-in, 24-in and 36-in of PS09, these strain-gage results can be very misleading. This is because these strain gages are all located in alignment with the central neutral axis of the flexural bending piping curvature, as illustrated below. The maximum flexural strain will be located on the side of the pipe, instead of the top of pipe where the pilot testing was performed, Fig. 8. The strain gage at the top of pipe in this vibration frequency is out-of-plane and parallel with the flexural neutral axis of the bending piping mode, thus it will has a very small strain level. This is not representative of such piping locations with the associated mode. Fig. 9 is at the pump inlet location where the strain gage was installed on the side of the pipe wall, which is again in line with the flexural neutral axis since the pipe is bending down at this location at the specified vibration mode (the correct gage location for this case should be the top of the pipe). The rest of the strain gages are fall mostly into similar flexural neutral scenarios.
Figure 9 Maximum strain is located at the top of pipe wall, instead on the side wall.
Figure 8 Maximum strain is located at the side of the pipe wall (per this mode).

18
Furthermore, from the Alyeska PS09 report, the vibration mode near the pump (either discharge or suction) are all very small due to multiple constraints as indicated in Fig. 4’s vibration profiles (the 12th frequency modes-the highest of Alyeska’s reported frequency modes, from suction and discharge pipelines are shown in Fig. 10). These plots show very limited amplitudes near the pump inlet or outlet sections and past the first elbow section. This is in contrast to DEI vibration modes shown in (report) Fig. 85, which shows significant displacement. The physical constraints at the Alyeska PS09 piping system are shown on Fig. 5, including line anchors, limit motion clamps, and guides, etc.. Note that the legends S, Y, G, and L stand for: S ─vertical support, Y ─Hold down, G ─guide with 1/8” gap except as noted, L ─limit stop. All these constraints have significant impact on the modal analyses outcome and need to be implemented into the analyses to obtain accurate amplitude profiles for the targeted frequencies.
There are two options here that can be considered to resolve this unknown effective piping stress issue: (1) carry out a detailed structural dynamics and hydrodynamics analyses, with consideration of the combined loading cases; or (2) use a well-designed strain-gage approach applied directly to key structural locations (including relative high stress and larger vibration-amplitude locations) to obtain the real-time strain history data. The later case of obtaining accurate strain-amplitude data will require the vendor to stop production; while the first option does not require the vendor to stop production. In any event, I believe that obtaining the detailed stress profiles for PS09 module structure and the associated piping system are in the best interest of the vendor, especially after the completion of the reinforcement project for the PS09 Module. The outcome of this effort is to ensure that the newly completed reinforcement structure is still consistent with the overall PS09 structural performance per seismic or other design criteria, in addition to piping integrity related to fatigue control. Questions: (1) In EDI modal analyses, I would like clarification on whether the piping constraints (shown in
Fig. 11) in both suction and discharge lines were properly implemented and taken into account in the modal analyses. Also what was the damping ratio of piping used in this analysis?
Figure 10 Vibration amplitude profiles of 12th frequency of PS09 i i

19
Figure 11 The piping system of PS09 and the associated piping constraints locations

20
4.4 The cavitation potential investigation The EDI report concluded that there were no cavitation concerns downstream of the suction strainer, based on the suction pressure point, as illustrated in Fig.96. However, there are many different cavitation forming mechanisms available in a piping system, thus, the suction pressure of 165 psi does not rule out other potential cavitation forming mechanisms. Therefore, I have reservations regarding EDI’s conclusion of no potential cavitation concerns that are described below. According to the PS09 pump module and the associated piping system design, with numerous fittings including different sizes of piping, reducers, elbows, and valves, plus the strainer, and the piping flow rate, it is very likely or has high probability that cavitation phenomena can exist in the PS09 piping systems. Based on my first visit to PS09 during September 2007, the acoustic horn reading data at the suction pipe section showed a significant increase in acoustic intensity at the location right after the strainer compared to the location right before the strainer. Note here that in general, there are two main suspected modes that can cause cavitation damage, namely, gaseous or vaporous cavitation. It is an uncertain timeframe for cavitation failure if cavitation phenomena exist in piping, but it is my understanding that it can work far more quickly and profoundly than the typical fatigue failures in piping, if the flow condition allows. The major difference between the gaseous and vaporous cavitation is: gaseous cavitation occurs when there is considerable free air suspended in the liquid media, therefore the process is not as violent or damaging; and while there is little air in the liquid, the cavity consists almost exclusively of vapor, which form the vaporous cavitation. The growth and collapse rates and the pressure generated upon cavity collapse associated with vaporous cavitation, are extremely high and can cause severe damage. Within a centrifugal pump, the flow area at the eye of the pump impeller is usually smaller than either the flow area of the pump suction piping or the flow area through the impeller vanes. When the liquid being pumped enters the eye of a centrifugal pump, the decrease in flow area results in an increase in flow velocity accompanied by a decrease in pressure. The greater the pump flow rate, the greater the pressure drop between the pump suction and the eye of the impeller. If the pressure drop is large enough, or if the temperature is high enough, the pressure drop may be sufficient to cause the liquid to flash to vapor, if the local pressure falls below saturation pressure for the fluid being pumped. Any vapor bubbles formed by the pressure drop at the eye of the impeller are swept along the impeller vanes by the flow of fluid. When the bubbles enter a region farther out from the impeller vane where local pressure is greater than saturation pressure, the vapor bubbles abruptly collapse. This physical shock can create small pits on the leading edge of the impeller vane or at the inner surface of the piping. Another different cavitation formation mechanism is the rarefaction wave format. This format is a negative pressure wave (or tensile pressure wave) generated by an initial pressure wave rebounded from a solid boundary. This can induce a small-size localized cavity or vacuum spot near the solid boundary. The consecutive pressure waves then strike these cavities (or vacuum bubbles); the shock wave and the micro-water jet will be formed upon cavity (bubble) collapsation near the solid boundary and results in a cavitation pitting erosion phenomenon. In general a small cavity (or bubble) can store much higher potential energy than its counterpart of

21
a large bubble, thus, a small bubble upon collapse can result in a more serious cavitation damage than that of a large size bubble. For a thin-walled pipe with a high R/t ratio, the pressure gradient of the cross-wall vibration modes is also a good mechanism to form this type of cavitation damage. The main sources of high-frequency pulsations are usually vortex shedding and/or blade-pass excitations. The high-frequency pulsations typically occur at frequencies above approximately 500 Hz. Vortex shedding is a phenomenon that occurs when there is flow over an obstruction. The flow passing through the strainer section of the pump suction line can be a good candidate for inducing vortex shedding, especially at a high Reynolds number. The associated vortex has high probability of forming the cavity bubble. In general, the suction pipe should never be smaller than the suction connection of the pump and, in most cases, should be at least one size larger. The suction pipe should be as short and as straight as possible, to make the flow smooth and lower friction loss. If the installation has suction lift, such as the PS09 module piping system, air pockets in the suction piping can be a source of trouble. The current suction line design has two reducers, 24x20 and 20x14 right after the strainer section before reaching the pump inlet elbow. It is expected that fluid pressure will be further reduced as fluid passes through these reducers, and additionally the vertical ascension of the piping may further assist air bubble formation. Cavitation induced piping vibration is also a potential vibration source, if cavitation exists and is sufficiently severe. With enough intensity, cavitation induced erosion pitting damage will occur much earlier than corrosion damage. A cavitation bubble collapse event has a localized high energy mechanical impact, while a corrosion event is a chemical process that will take time to form the associated damage. Thus, if cavitation is suspected it would be prudent to use ultrasonic or other NDE techniques to see if any detectable pitting sites exist at the inner surface of the piping system for an effective lifetime prediction, especially at the earlier stages of pipeline operation because the corrosion damage has probably not yet formed. Therefore, from a pipeline integrity view point, the pipeline cavitation event needs to be controlled and deserves future attention and study.
Acknowledgments
The research was sponsored by the DOT Pipeline and Hazardous Materials Safety Administration under contract DE-AC05-00OR22725 with UT-Battelle, LLC.

22
APPENDIX A: Vibration Velocity Spectra and the Associated Site Locations
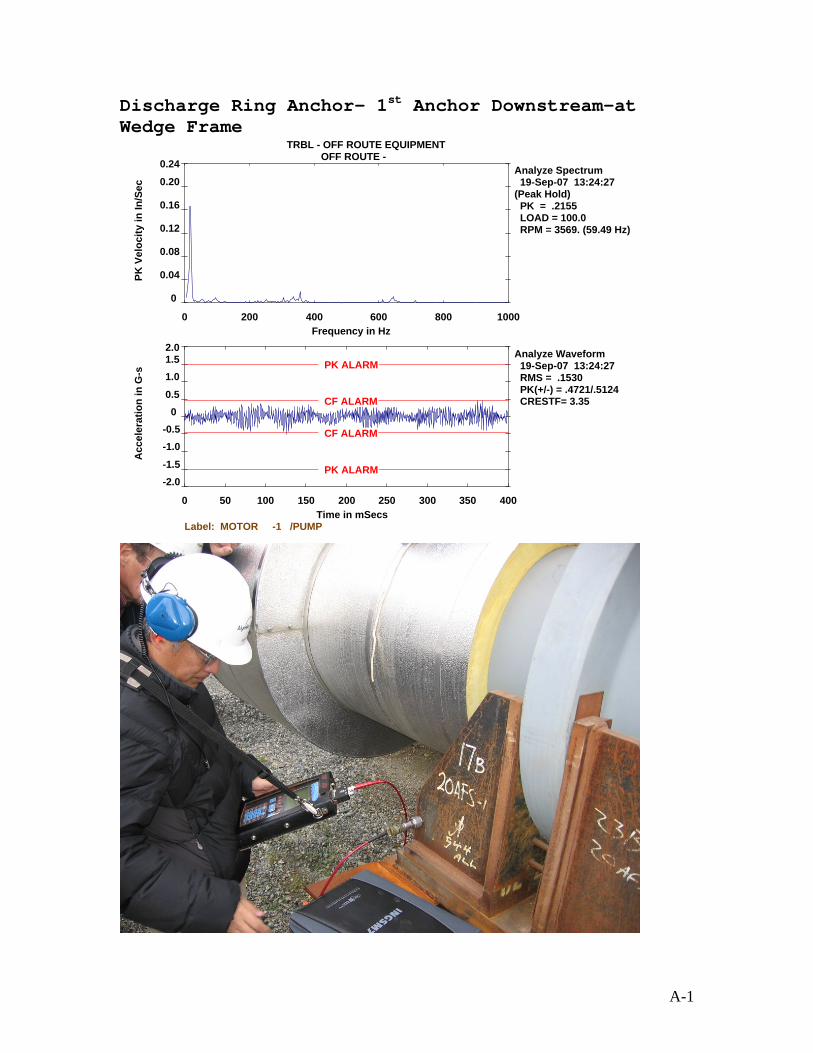
Discharge Ring Anchor- 1st Anchor Downstream-at Wedge Frame
TRBL - OFF ROUTE EQUIPMENTOFF ROUTE -
0.24
Analyze Waveform 19-Sep-07 13:24:27 RMS = .1530 PK(+/-) = .4721/.5124 CRESTF= 3.35
0 50 100 150 200 250 300 350 400
-2.0-1.5
-1.0-0.5
0 0.5
1.01.52.0
Time in mSecs
Acc
eler
atio
n in
G-s
CF ALARM
CF ALARM
PK ALARM
PK ALARM
Label: MOTOR -1 /PUMP
Analyze Spectrum 19-Sep-07 13:24:27 (Peak Hold) PK = .2155 LOAD = 100.0 RPM = 3569. (59.49 Hz)
0 200 400 600 800
0.20
0.16
1000
0
0.04
0.08
0.12
Frequency in Hz
PK V
eloc
ity in
In/S
ec
A-1

Discharge Ring Anchor- 1st Anchor Downstream-Horiz
TRBL - OFF ROUTE EQUIPMENTOFF ROUTE -
Analyze Waveform 19-Sep-07 13:25:43 RMS = .1624 PK(+/-) = .4701/.4975 CRESTF= 3.06
0 50 100 150 200 250 300 350 400
-2.0-1.5
-1.0-0.5
0 0.5
1.01.52.0
Time in mSecs
Acc
eler
atio
n in
G-s
CF ALARM
CF ALARM
PK ALARM
PK ALARM
Label: MOTOR -1 /PUMP
Analyze Spectrum 19-Sep-07 13:25:43 (Peak Hold) PK = .3174 LOAD = 100.0 RPM = 3676. (61.27 Hz)
0 200 400 600 800 1000
0 0.05
0.100.150.200.25
0.300.350.40
Frequency in Hz
PK V
eloc
ity in
In/S
ec
A-2

Discharge Ring Anchor- 1st Anchor Downstream-Axial
TRBL - OFF ROUTE EQUIPMENTOFF ROUTE -
0.16
Analyze Waveform 19-Sep-07 13:27:12 RMS = .1479 PK(+/-) = .4204/.4271 CRESTF= 2.89
0 50 100 150 200 250 300 350 400
-2.0-1.5
-1.0-0.5
0 0.5
1.01.52.0
Time in mSecs
Acc
eler
atio
n in
G-s
CF ALARM
CF ALARM
PK ALARM
PK ALARM
Label: MOTOR -1 /PUMP
Analyze Spectrum 19-Sep-07 13:27:12 (Peak Hold) PK = .1499 LOAD = 100.0 RPM = 3243. (54.04 Hz)
0 200 400 600 800
0.12
1000
0
0.04
0.08
Frequency in Hz
PK V
eloc
ity in
In/S
ec
A-3

Discharge Ring Anchor- 1st Anchor Downstream-Vert TRBL - OFF ROUTE EQUIPMENT
OFF ROUTE -0.24
Analyze Waveform 19-Sep-07 13:30:04 RMS = .1505 PK(+/-) = .5307/.4723 CRESTF= 3.53
0 50 100 150 200 250 300 350 400
-2.0-1.5
-1.0-0.5
0 0.5
1.01.52.0
Time in mSecs
Acc
eler
atio
n in
G-s
CF ALARM
CF ALARM
PK ALARM
PK ALARM
Label: MOTOR -1 /PUMP
Analyze Spectrum 19-Sep-07 13:30:04 (Peak Hold) PK = .2223 LOAD = 100.0 RPM = 3468. (57.80 Hz)
0 200 400 600 800
0.20
0.16
1000
0
0.04
0.08
0.12
Frequency in Hz
PK V
eloc
ity in
In/S
ec
A-4

Discharge Ring Anchor- 1st Anchor Downstream-Frame TRBL - OFF ROUTE EQUIPMENT
OFF ROUTE -0.14
Analyze Waveform 19-Sep-07 13:33:21 RMS = .5297 PK(+/-) = 1.53/1.60 CRESTF= 3.03
0 50 100 150 200 250 300 350 400
-2.0-1.6-1.2-0.8-0.40.00.40.81.21.6
Time in mSecs
Acc
eler
atio
n in
G-s
CF ALARM
CF ALARM
PK ALARM
PK ALARM
Label: MOTOR -1 /PUMP
Analyze Spectrum 19-Sep-07 13:33:21 (Peak Hold) PK = .2325 LOAD = 100.0 RPM = 3768. (62.79 Hz)
0 200 400 600 800
0.12
0.10
1000
0
0.02
0.04
0.06
0.08
Frequency in Hz
PK V
eloc
ity in
In/S
ec
A-5

Discharge Line Guide
Analyze Waveform 19-Sep-07 13:37:35 RMS = .6680 PK(+/-) = 1.26/1.80 CRESTF= 2.69
0 50 100 150 200 250 300 350 400
-3
-2
-1
0
1
2
3
Time in mSecs
Acc
eler
atio
n in
G-s CF ALARM
CF ALARM
PK ALARM
PK ALARM
TRBL - OFF ROUTE EQUIPMENTOFF ROUTE -
Label: MOTOR -1 /PUMP
Analyze Spectrum 19-Sep-07 13:37:35 (Peak Hold) PK = .3637 LOAD = 100.0 RPM = 3678. (61.30 Hz)
0 200 400 600 800 1000
0
0.1
0.2
0.3
0.4
0.5
Frequency in Hz
PK V
eloc
ity in
In/S
ec
A-6
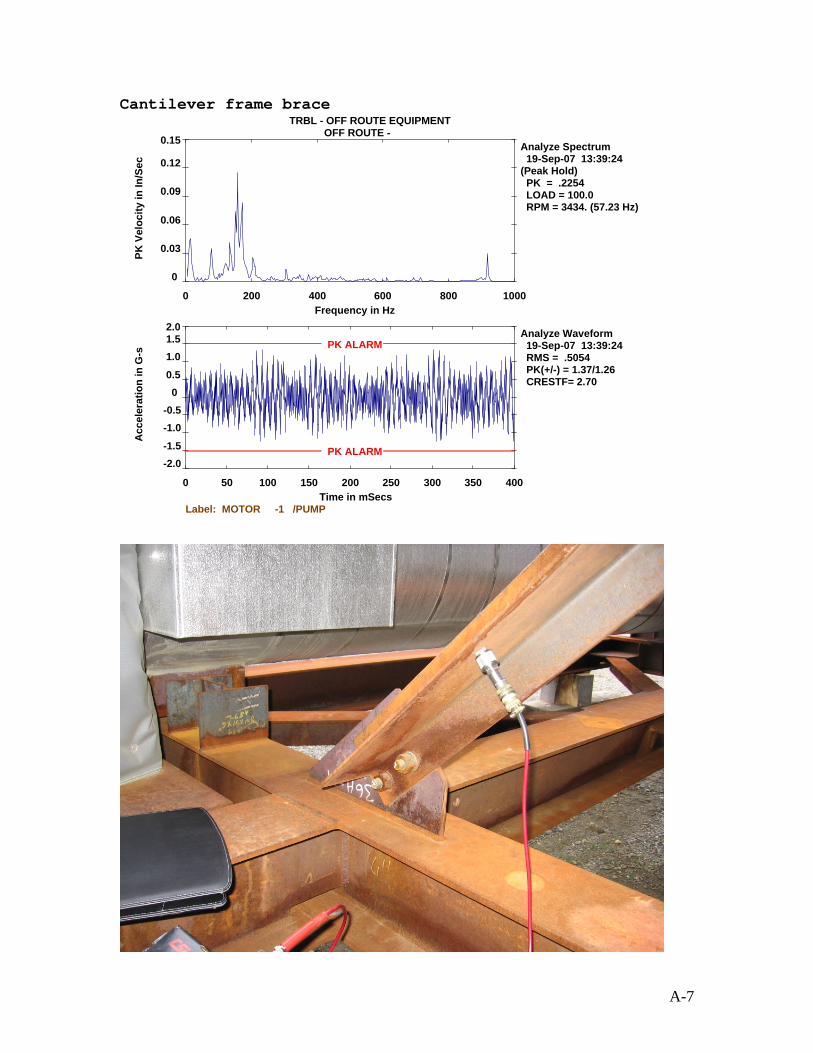
Cantilever frame brace
Analyze Waveform 19-Sep-07 13:39:24 RMS = .5054 PK(+/-) = 1.37/1.26 CRESTF= 2.70
0 50 100 150 200 250 300 350 400
-2.0-1.5
-1.0-0.5
0 0.5
1.01.52.0
Time in mSecs
Acc
eler
atio
n in
G-s
CF ALARM
CF ALARM
PK ALARM
PK ALARM
TRBL - OFF ROUTE EQUIPMENTOFF ROUTE -
Label: MOTOR -1 /PUMP
Analyze Spectrum 19-Sep-07 13:39:24 (Peak Hold) PK = .2254 LOAD = 100.0 RPM = 3434. (57.23 Hz)
0 200 400 600 800 1000
0
0.03
0.06
0.09
0.12
0.15
Frequency in Hz
PK V
eloc
ity in
In/S
ec
A-7

Post reading
Analyze Waveform 19-Sep-07 13:42:17 RMS = .0792 PK(+/-) = .2642/.2773 CRESTF= 3.50
0 50 100 150 200 250 300 350 400
-2.0-1.5
-1.0-0.5
0 0.5
1.01.52.0
Time in mSecs
Acc
eler
atio
n in
G-s
CF ALARM CF ALARM
PK ALARM
PK ALARM
TRBL - OFF ROUTE EQUIPMENTOFF ROUTE -
Analyze Spectrum 19-Sep-07 13:42:17 PK = .1337 LOAD = 100.0 RPM = 3675. (61.24 Hz)
0 200 400 600 800 1000
0
0.03
0.06
0.09
0.12
Frequency in Hz
PK V
eloc
ity in
In/S
ec
A-8
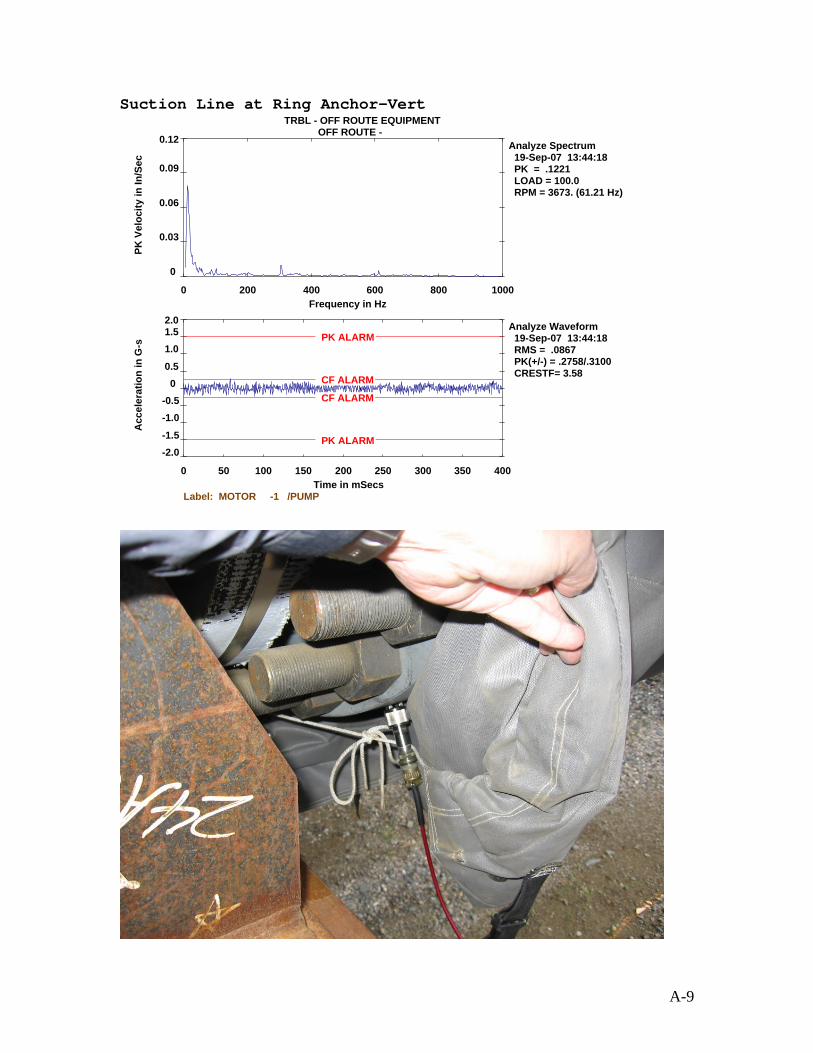
Suction Line at Ring Anchor-Vert
Analyze Waveform 19-Sep-07 13:44:18 RMS = .0867 PK(+/-) = .2758/.3100 CRESTF= 3.58
0 50 100 150 200 250 300 350 400
-2.0-1.5
-1.0-0.5
0 0.5
1.01.52.0
Time in mSecs
Acc
eler
atio
n in
G-s
CF ALARM
CF ALARM
PK ALARM
PK ALARM
OFF ROUTE -TRBL - OFF ROUTE EQUIPMENT
0.12
Label: MOTOR -1 /PUMP
Analyze Spectrum 19-Sep-07 13:44:18 PK = .1221 LOAD = 100.0 RPM = 3673. (61.21 Hz)
0 200 400 600 800
0.09
1000
0
0.03
0.06
Frequency in Hz
PK V
eloc
ity in
In/S
ec
A-9
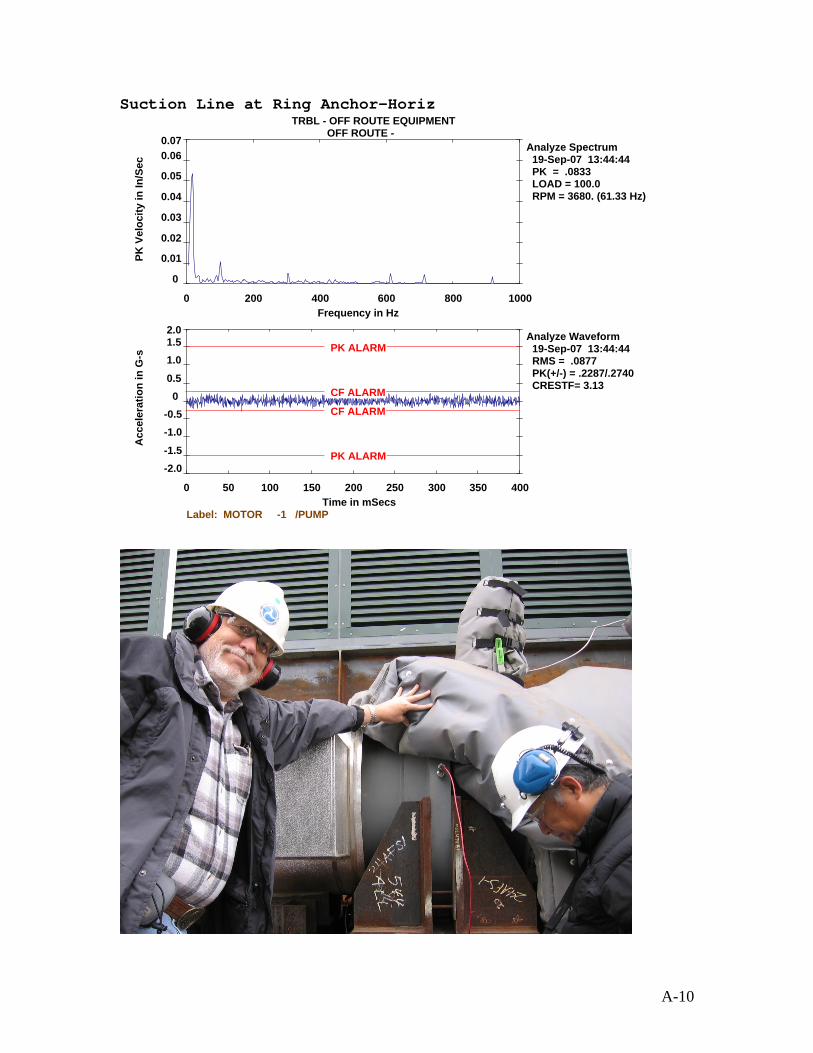
Suction Line at Ring Anchor-Horiz
Analyze Waveform 19-Sep-07 13:44:44 RMS = .0877 PK(+/-) = .2287/.2740 CRESTF= 3.13
0 50 100 150 200 250 300 350 400
-2.0-1.5
-1.0-0.5
0 0.5
1.01.52.0
Time in mSecs
Acc
eler
atio
n in
G-s
CF ALARM
CF ALARM
PK ALARM
PK ALARM
TRBL - OFF ROUTE EQUIPMENTOFF ROUTE -
Label: MOTOR -1 /PUMP
Analyze Spectrum 19-Sep-07 13:44:44 PK = .0833 LOAD = 100.0 RPM = 3680. (61.33 Hz)
0 200 400 600 800 1000
0
0.01
0.02
0.03
0.04
0.05
0.060.07
Frequency in Hz
PK V
eloc
ity in
In/S
ec
A-10
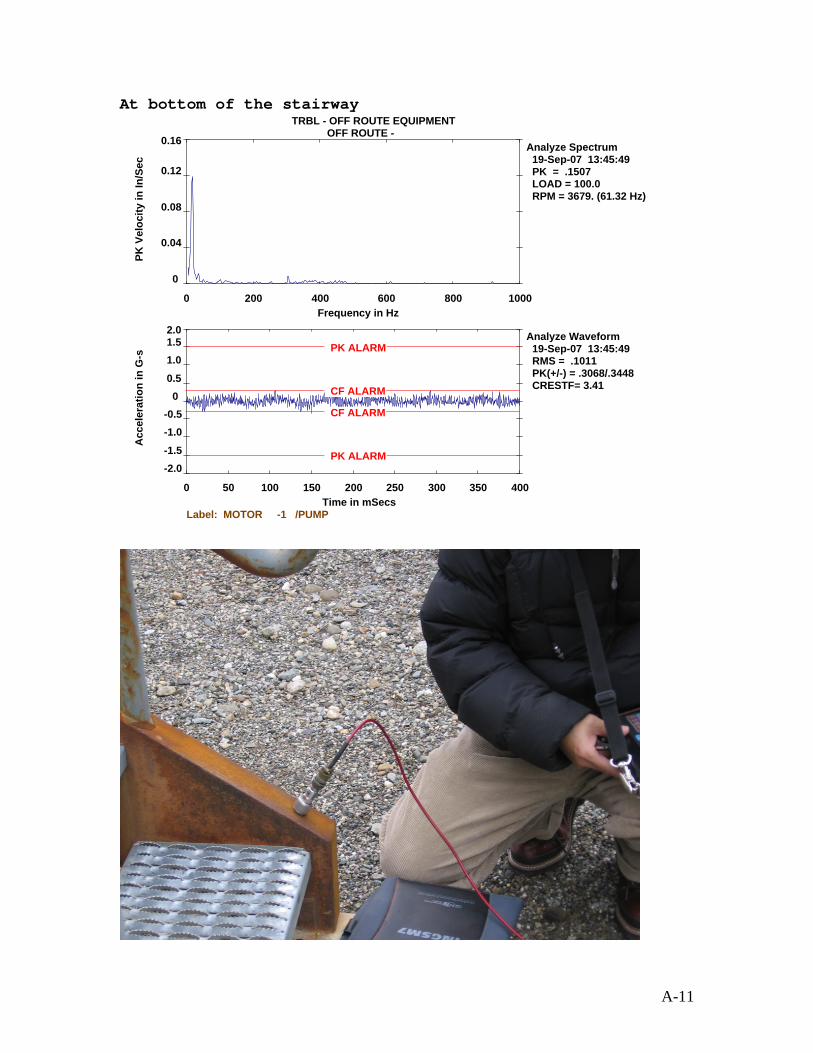
At bottom of the stairway
Analyze Waveform 19-Sep-07 13:45:49 RMS = .1011 PK(+/-) = .3068/.3448 CRESTF= 3.41
0 50 100 150 200 250 300 350 400
-2.0-1.5
-1.0-0.5
0 0.5
1.01.52.0
Time in mSecs
Acc
eler
atio
n in
G-s
CF ALARM
CF ALARM
PK ALARM
PK ALARM
TRBL - OFF ROUTE EQUIPMENTOFF ROUTE -
0.16
Label: MOTOR -1 /PUMP
Analyze Spectrum 19-Sep-07 13:45:49 PK = .1507 LOAD = 100.0 RPM = 3679. (61.32 Hz)
0 200 400 600 800
0.12
1000
0
0.04
0.08
Frequency in Hz
PK V
eloc
ity in
In/S
ec
A-11
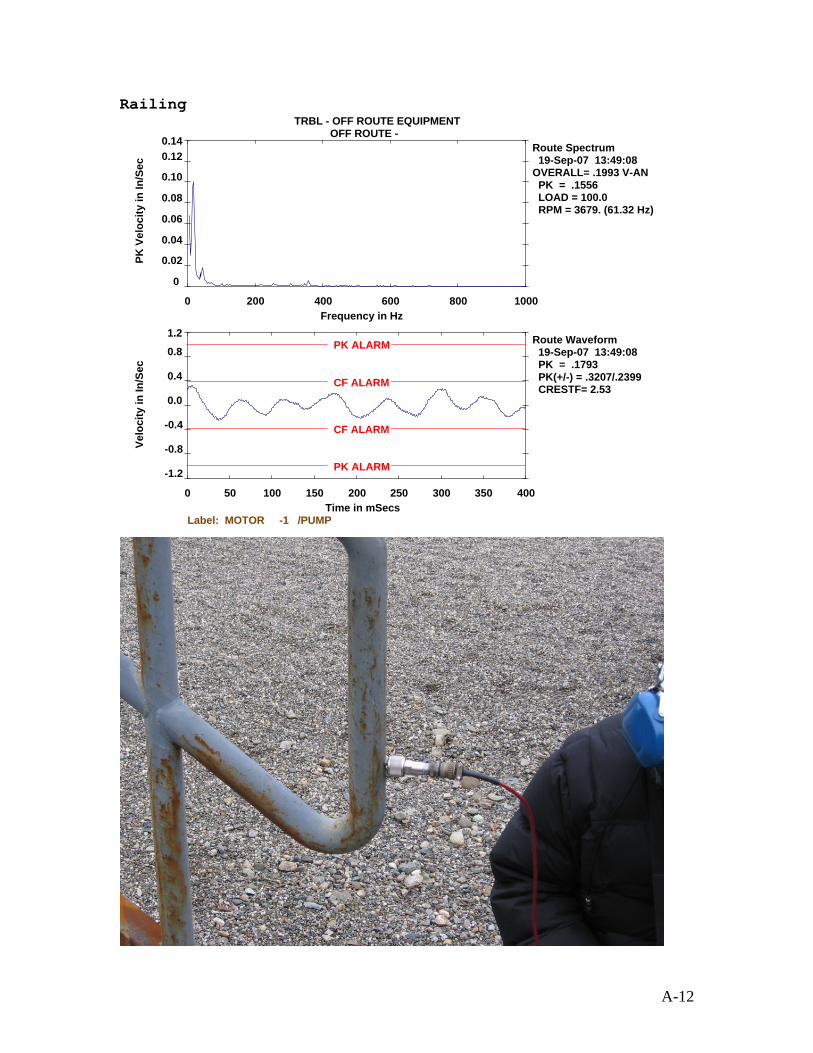
Railing TRBL - OFF ROUTE EQUIPMENT
OFF ROUTE -0.14
Route Waveform 19-Sep-07 13:49:08 PK = .1793 PK(+/-) = .3207/.2399 CRESTF= 2.53
0 50 100 150 200 250 300 350 400
-1.2
-0.8
-0.4
0.0
0.4
0.8
1.2
Time in mSecs
Velo
city
in In
/Sec
CF ALARM
CF ALARM
PK ALARM
PK ALARM
Label: MOTOR -1 /PUMP
Route Spectrum 19-Sep-07 13:49:08 OVERALL= .1993 V-AN PK = .1556 LOAD = 100.0 RPM = 3679. (61.32 Hz)
0 200 400 600 800
0.12
0.10
1000
0
0.02
0.04
0.06
0.08
Frequency in Hz
PK V
eloc
ity in
In/S
ec
A-12

At Stair
Analyze Waveform 19-Sep-07 13:49:31 RMS = .0434 PK(+/-) = .1329/.1384 CRESTF= 3.19
0 50 100 150 200 250 300 350 400
-2.0-1.5
-1.0-0.5
0 0.5
1.01.52.0
Time in mSecs
Acc
eler
atio
n in
G-s
CF ALARM CF ALARM
PK ALARM
PK ALARM
TRBL - OFF ROUTE EQUIPMENTOFF ROUTE -
0.25
Label: MOTOR -1 /PUMP
Analyze Spectrum 19-Sep-07 13:49:31 (Peak Hold) PK = .2454 LOAD = 100.0 RPM = 3476. (57.93 Hz)
0 200 400 600 800
0.20
1000
0
0.05
0.10
0.15
Frequency in Hz
PK V
eloc
ity in
In/S
ec
A-13
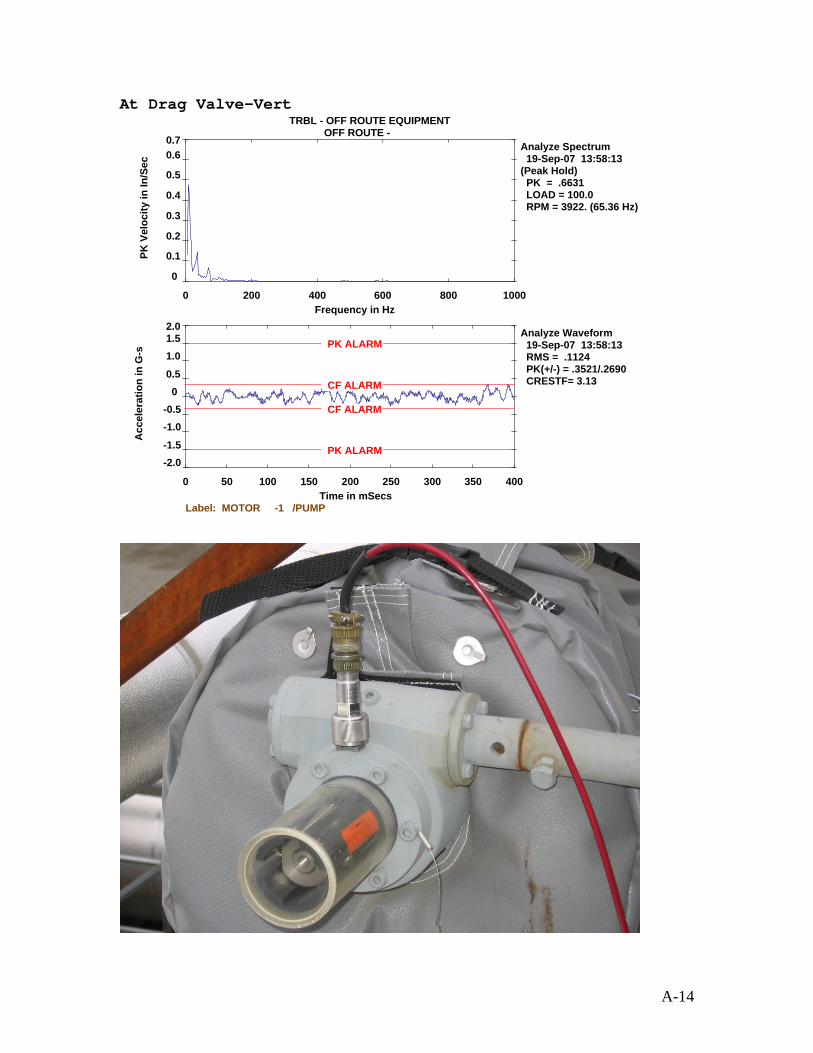
At Drag Valve-Vert
Analyze Waveform 19-Sep-07 13:58:13 RMS = .1124 PK(+/-) = .3521/.2690 CRESTF= 3.13
0 50 100 150 200 250 300 350 400
-2.0-1.5
-1.0-0.5
0 0.5
1.01.52.0
Time in mSecs
Acc
eler
atio
n in
G-s
CF ALARM
CF ALARM
PK ALARM
PK ALARM
TRBL - OFF ROUTE EQUIPMENTOFF ROUTE -
0.7
Label: MOTOR -1 /PUMP
Analyze Spectrum 19-Sep-07 13:58:13 (Peak Hold) PK = .6631 LOAD = 100.0 RPM = 3922. (65.36 Hz)
0 200 400 600 800
0.6
0.5
1000
0
0.1
0.2
0.3
0.4
Frequency in Hz
PK V
eloc
ity in
In/S
ec
A-14

At Drag V
alve-Horiz
Analyze Waveform 19-Sep-07 13:59:15 RMS = .0822 PK(+/-) = .2542/.2603 CRESTF= 3.17
0 50 100 150 200 250 300 350 400
-2.0-1.5
-1.0-0.5
0 0.5
1.01.52.0
Time in mSecs
Acc
eler
atio
n in
G-s
CF ALARM CF ALARM
PK ALARM
PK ALARM
TRBL - OFF ROUTE EQUIPMENTOFF ROUTE -
0.5
Label: MOTOR -1 /PUMP
Analyze Spectrum 19-Sep-07 13:59:15 (Peak Hold) PK = .5462 LOAD = 100.0 RPM = 3256. (54.27 Hz)
0 200 400 600 800
0.4
1000
0
0.1
0.2
0.3
Frequency in Hz
PK V
eloc
ity in
In/S
ec
A-15
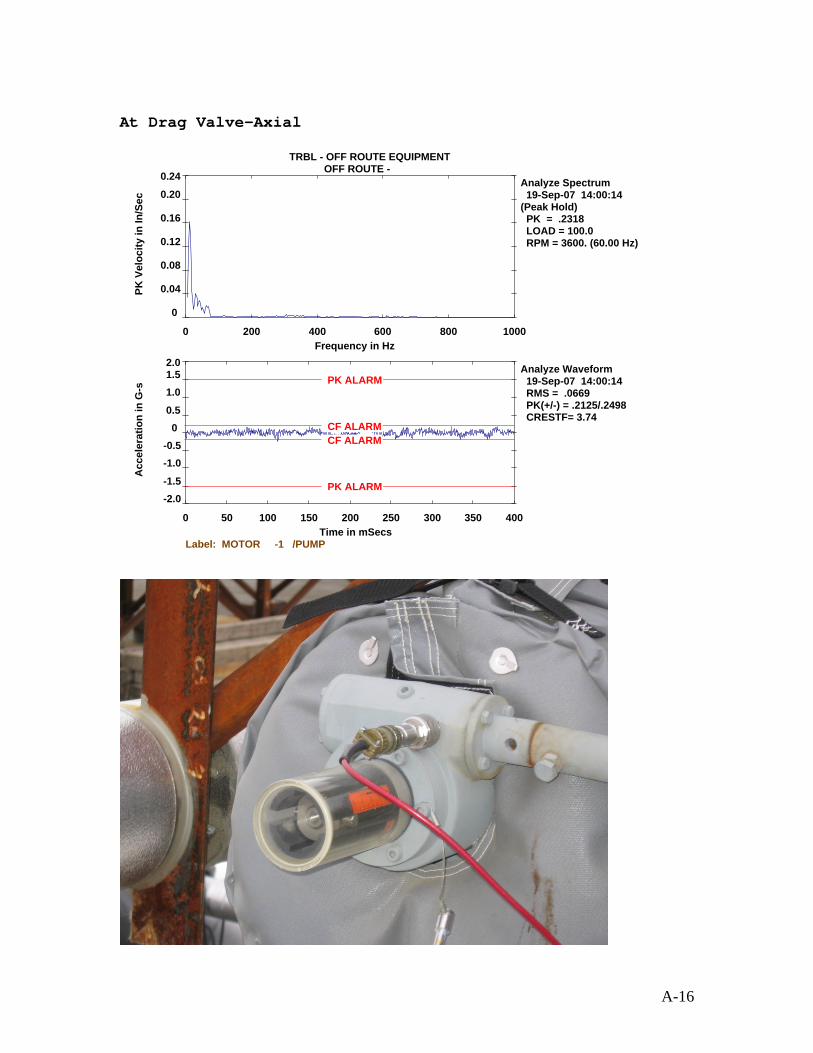
At Drag Valve-Axial
Analyze Waveform 19-Sep-07 14:00:14 RMS = .0669 PK(+/-) = .2125/.2498 CRESTF= 3.74
0 50 100 150 200 250 300 350 400
-2.0-1.5
-1.0-0.5
0 0.5
1.01.52.0
Time in mSecs
Acc
eler
atio
n in
G-s
CF ALARM CF ALARM
PK ALARM
PK ALARM
TRBL - OFF ROUTE EQUIPMENTOFF ROUTE -
0.24
Label: MOTOR -1 /PUMP
Analyze Spectrum 19-Sep-07 14:00:14 (Peak Hold) PK = .2318 LOAD = 100.0 RPM = 3600. (60.00 Hz)
0 200 400 600 800
0.20
0.16
1000
0
0.04
0.08
0.12
Frequency in Hz
PK V
eloc
ity in
In/S
ec
A-16

Recycle Line Support
Analyze Waveform 19-Sep-07 14:02:12 RMS = .2090 PK(+/-) = .5820/.6908 CRESTF= 3.30
0 50 100 150 200 250 300 350 400
-2.0-1.5
-1.0-0.5
0 0.5
1.01.52.0
Time in mSecs
Acc
eler
atio
n in
G-s
CF ALARM
CF ALARM
PK ALARM
PK ALARM
OFF ROUTE -TRBL - OFF ROUTE EQUIPMENT
0.30
Label: MOTOR -1 /PUMP
Analyze Spectrum 19-Sep-07 14:02:12 (Peak Hold) PK = .2910 LOAD = 100.0 RPM = 3570. (59.51 Hz)
0 200 400 600 800
0.25
1000
0
0.05
0.10
0.15
0.20
Frequency in Hz
PK V
eloc
ity in
In/S
ec
A-17

Recycle Line Support-Horiz
Analyze Waveform 19-Sep-07 14:02:47 RMS = .0894 PK(+/-) = .2552/.2592 CRESTF= 2.90
0 50 100 150 200 250 300 350 400
-2.0-1.5
-1.0-0.5
0 0.5
1.01.52.0
Time in mSecs
Acc
eler
atio
n in
G-s
CF ALARM
CF ALARM
PK ALARM
PK ALARM
L - OFF ROUTE EQUIPMENTOFF ROUTE -
TRB
0.18
Label: MOTOR -1 /PUMP
Analyze Spectrum 19-Sep-07 14:02:47 (Peak Hold) PK = .2361 LOAD = 100.0 RPM = 3600. (60.00 Hz)
0 200 400 600 800
0.15
0.12
1000
0
0.03
0.06
0.09
Frequency in Hz
PK V
eloc
ity in
In/S
ec
A-18

Motor-OB-VERT TRBL - OFF ROUTE EQUIPMENT
OFF ROUTE -0.030
Analyze Waveform 19-Sep-07 14:07:37 RMS = .0311 PK(+/-) = .0883/.0820 CRESTF= 2.84
0 50 100 150 200 250 300 350 400
-2.0-1.5
-1.0-0.5
0 0.5
1.01.52.0
Time in mSecs
Acc
eler
atio
n in
G-s
CF ALARM CF ALARM
PK ALARM
PK ALARM
Label: MOTOR -1 /PUMP
Analyze Spectrum 19-Sep-07 14:07:37 (Peak Hold) PK = .0304 LOAD = 100.0 RPM = 3839. (63.99 Hz)
0 200 400 600 800
0.025
0.020
1000
0
0.005
0.010
0.015
Frequency in Hz
PK V
eloc
ity in
In/S
ec
A-19
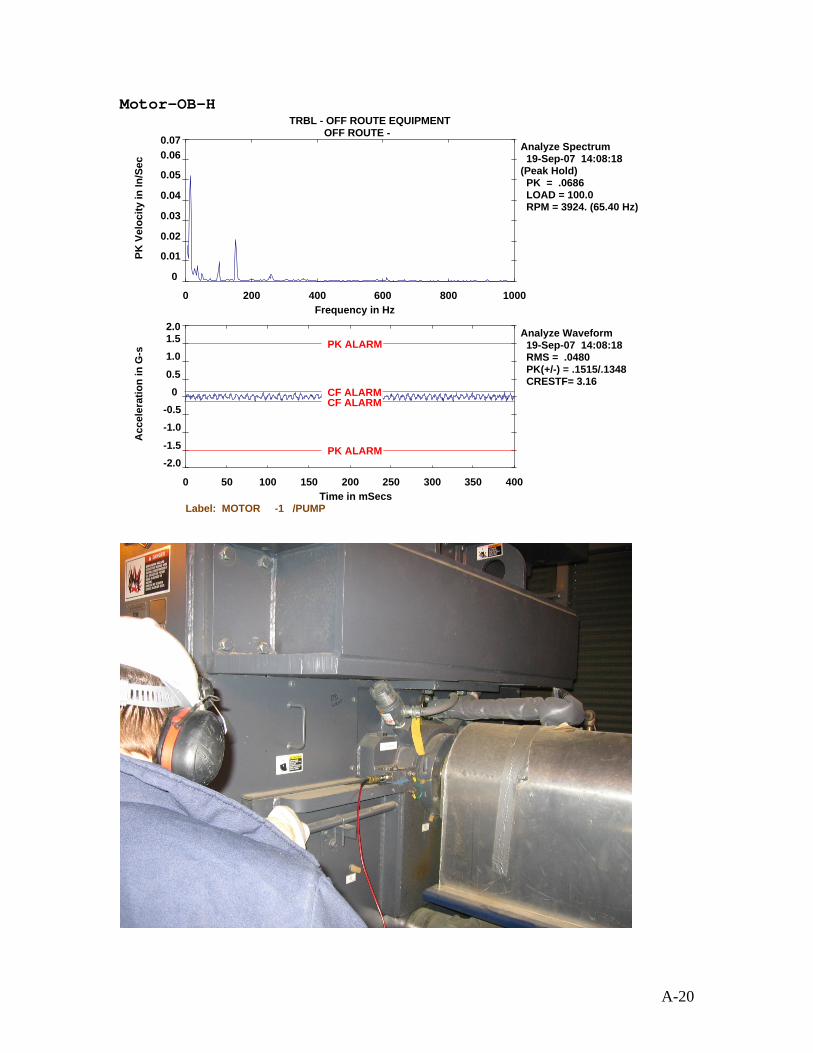
Motor-OB-H
Analyze Waveform 19-Sep-07 14:08:18 RMS = .0480 PK(+/-) = .1515/.1348 CRESTF= 3.16
0 50 100 150 200 250 300 350 400
-2.0-1.5
-1.0-0.5
0 0.5
1.01.52.0
Time in mSecs
Acc
eler
atio
n in
G-s
CF ALARM CF ALARM
PK ALARM
PK ALARM
TRBL - OFF ROUTE EQUIPMENTOFF ROUTE -
Label: MOTOR -1 /PUMP
Analyze Spectrum 19-Sep-07 14:08:18 (Peak Hold) PK = .0686 LOAD = 100.0 RPM = 3924. (65.40 Hz)
0 200 400 600 800 1000
0
0.01
0.02
0.03
0.04
0.05
0.060.07
Frequency in Hz
PK V
eloc
ity in
In/S
ec
A-20
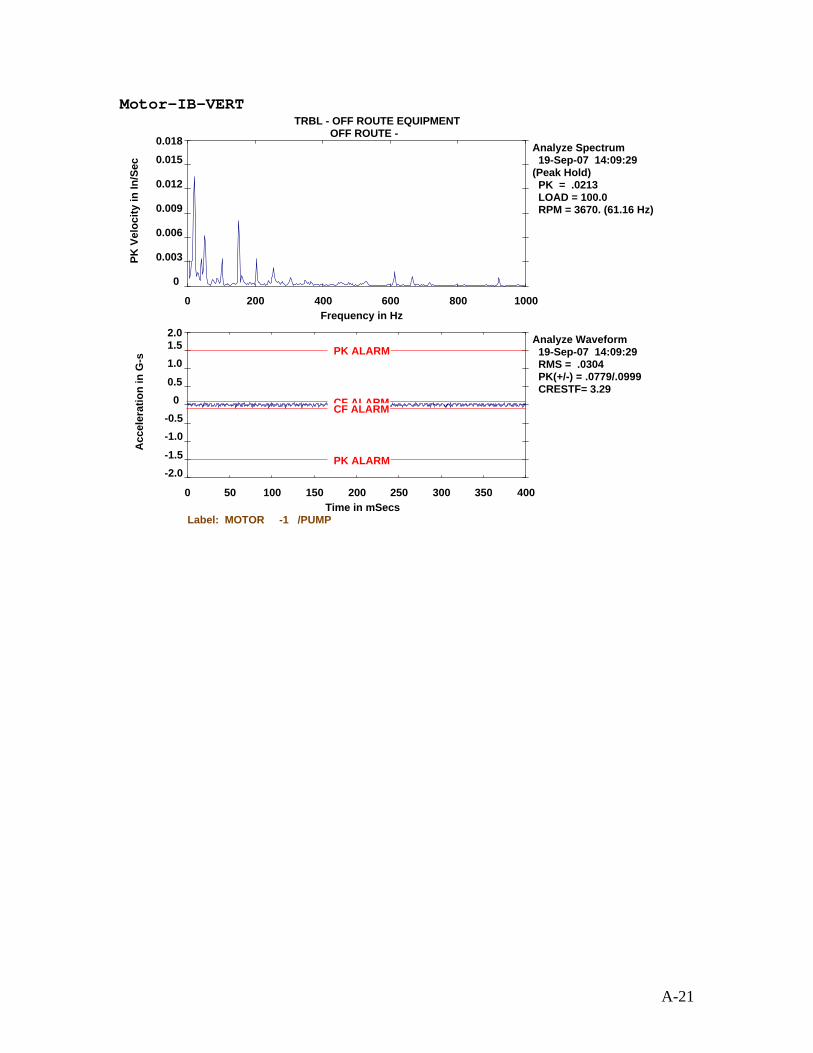
Motor-IB-VERT
Analyze Waveform 19-Sep-07 14:09:29 RMS = .0304 PK(+/-) = .0779/.0999 CRESTF= 3.29
0 50 100 150 200 250 300 350 400
-2.0-1.5
-1.0-0.5
0 0.5
1.01.52.0
Time in mSecs
Acc
eler
atio
n in
G-s
CF ALARM CF ALARM
PK ALARM
PK ALARM
TRBL - OFF ROUTE EQUIPMENTOFF ROUTE -
Label: MOTOR -1 /PUMP
Analyze Spectrum 19-Sep-07 14:09:29 (Peak Hold) PK = .0213 LOAD = 100.0 RPM = 3670. (61.16 Hz)
0 200 400 600 800 1000
0
0.003
0.006
0.009
0.012
0.015
0.018
Frequency in Hz
PK V
eloc
ity in
In/S
ec
A-21

Motor-IB-H TRBL - OFF ROUTE EQUIPMENT
OFF ROUTE -0.04
Analyze Waveform 19-Sep-07 14:09:50 RMS = .0348 PK(+/-) = .1000/.1007 CRESTF= 2.90
0 50 100 150 200 250 300 350 400
-2.0-1.5
-1.0-0.5
0 0.5
1.01.52.0
Time in mSecs
Acc
eler
atio
n in
G-s
CF ALARM CF ALARM
PK ALARM
PK ALARM
Label: MOTOR -1 /PUMP
Analyze Spectrum 19-Sep-07 14:09:50 (Peak Hold) PK = .0458 LOAD = 100.0 RPM = 3838. (63.97 Hz)
0 200 400 600 800
0.03
1000
0
0.01
0.02
Frequency in Hz
PK V
eloc
ity in
In/S
ec
A-22

Motor-IB-AX TRBL - OFF ROUTE EQUIPMENT
OFF ROUTE -0.025
Analyze Waveform 19-Sep-07 14:10:09 RMS = .0671 PK(+/-) = .1969/.2067 CRESTF= 3.08
0 50 100 150 200 250 300 350 400
-2.0-1.5
-1.0-0.5
0 0.5
1.01.52.0
Time in mSecs
Acc
eler
atio
n in
G-s
CF ALARM CF ALARM
PK ALARM
PK ALARM
Label: MOTOR -1 /PUMP
Analyze Spectrum 19-Sep-07 14:10:09 (Peak Hold) PK = .0377 LOAD = 100.0 RPM = 3759. (62.65 Hz)
0 200 400 600 800
0.020
1000
0
0.005
0.010
0.015
Frequency in Hz
PK V
eloc
ity in
In/S
ec
A-23

PUMP-IB-H
Analyze Waveform 19-Sep-07 14:10:55 RMS = .2583 PK(+/-) = .8456/.7455 CRESTF= 3.27
0 50 100 150 200 250 300 350 400
-2.0-1.5
-1.0-0.5
0 0.5
1.01.52.0
Time in mSecs
Acc
eler
atio
n in
G-s
CF ALARM
CF ALARM
PK ALARM
PK ALARM
TRBL - OFF ROUTE EQUIPMENTOFF ROUTE -
Label: MOTOR -1 /PUMP
Analyze Spectrum 19-Sep-07 14:10:55 (Peak Hold) PK = .0697 LOAD = 100.0 RPM = 3573. (59.55 Hz)
0 200 400 600 800 1000
0
0.008
0.016
0.024
0.032
0.040
Frequency in Hz
PK V
eloc
ity in
In/S
ec
A-24

PUMP-IB-V
Analyze Waveform 19-Sep-07 14:11:30 RMS = .2667 PK(+/-) = .7502/.7939 CRESTF= 2.98
0 50 100 150 200 250 300 350 400
-2.0-1.5
-1.0-0.5
0 0.5
1.01.52.0
Time in mSecs
Acc
eler
atio
n in
G-s
CF ALARM
CF ALARM
PK ALARM
PK ALARM
TRBL - OFF ROUTE EQUIPMENTOFF ROUTE -
Label: MOTOR -1 /PUMP
Analyze Spectrum 19-Sep-07 14:11:30 (Peak Hold) PK = .0731 LOAD = 100.0 RPM = 3807. (63.44 Hz)
0 200 400 600 800 1000
0
0.01
0.02
0.03
0.04
0.05
0.060.07
Frequency in Hz
PK V
eloc
ity in
In/S
ec
A-25

PUMP-IB-AX TRBL - OFF ROUTE EQUIPMENT
OFF ROUTE -0.032
Analyze Waveform 19-Sep-07 14:12:21 RMS = .1890 PK(+/-) = .6485/.5461 CRESTF= 3.43
0 50 100 150 200 250 300 350 400
-2.0-1.5
-1.0-0.5
0 0.5
1.01.52.0
Time in mSecs
Acc
eler
atio
n in
G-s
CF ALARM
CF ALARM
PK ALARM
PK ALARM
Label: MOTOR -1 /PUMP
Analyze Spectrum 19-Sep-07 14:12:21 (Peak Hold) PK = .0543 LOAD = 100.0 RPM = 3848. (64.13 Hz)
0 200 400 600 800
0.024
1000
0
0.008
0.016
Frequency in Hz
PK V
eloc
ity in
In/S
ec
A-26

PUMP-OB-H TRBL - OFF ROUTE EQUIPMENT
OFF ROUTE -0.030
Analyze Waveform 19-Sep-07 14:13:37 RMS = .1354 PK(+/-) = .3977/.4009 CRESTF= 2.96
0 50 100 150 200 250 300 350 400
-2.0-1.5
-1.0-0.5
0 0.5
1.01.52.0
Time in mSecs
Acc
eler
atio
n in
G-s
CF ALARM
CF ALARM
PK ALARM
PK ALARM
Label: MOTOR -1 /PUMP
Analyze Spectrum 19-Sep-07 14:13:37 (Peak Hold) PK = .0644 LOAD = 100.0 RPM = 3435. (57.24 Hz)
0 200 400 600 800
0.025
0.020
1000
0
0.005
0.010
0.015
Frequency in Hz
PK V
eloc
ity in
In/S
ec
A-27
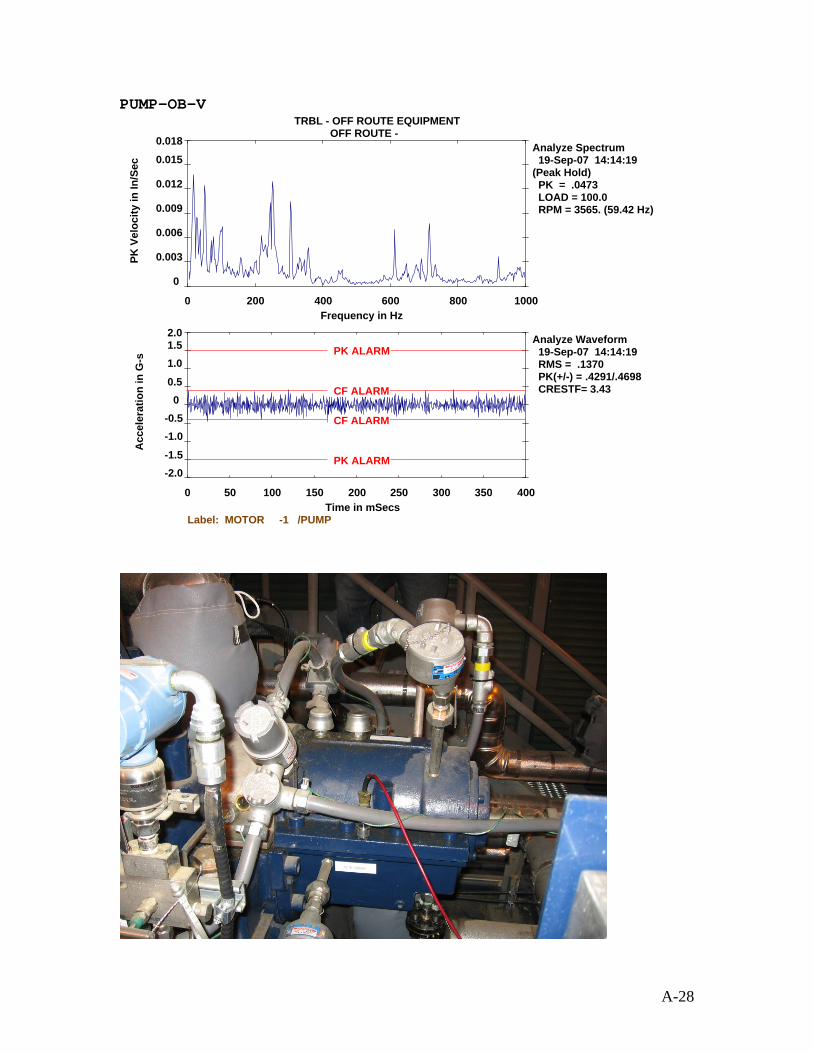
PUMP-OB-V TRBL - OFF ROUTE EQUIPMENT
OFF ROUTE -0.018
Analyze Waveform 19-Sep-07 14:14:19 RMS = .1370 PK(+/-) = .4291/.4698 CRESTF= 3.43
0 50 100 150 200 250 300 350 400
-2.0-1.5
-1.0-0.5
0 0.5
1.01.52.0
Time in mSecs
Acc
eler
atio
n in
G-s
CF ALARM
CF ALARM
PK ALARM
PK ALARM
Label: MOTOR -1 /PUMP
Analyze Spectrum 19-Sep-07 14:14:19 (Peak Hold) PK = .0473 LOAD = 100.0 RPM = 3565. (59.42 Hz)
0 200 400 600 800
0.015
1000
0
0.003
0.006
0.009
0.012
Frequency in Hz
PK V
eloc
ity in
In/S
ec
A-28

PUMP-OB-AX TRBL - OFF ROUTE EQUIPMENT
OFF ROUTE -0.030
Analyze Waveform 19-Sep-07 14:15:08 RMS = .2056 PK(+/-) = .6412/.6109 CRESTF= 3.12
0 50 100 150 200 250 300 350 400
-2.0-1.5
-1.0-0.5
0 0.5
1.01.52.0
Time in mSecs
Acc
eler
atio
n in
G-s
CF ALARM
CF ALARM
PK ALARM
PK ALARM
Label: MOTOR -1 /PUMP
Analyze Spectrum 19-Sep-07 14:15:08 (Peak Hold) PK = .0471 LOAD = 100.0 RPM = 3418. (56.97 Hz)
0 200 400 600 800
0.024
0.018
1000
0
0.006
0.012
Frequency in Hz
PK V
eloc
ity in
In/S
ec
A-29

MOTOR-NE CORNER SKID AT SKID BOLT-VERT TRBL - OFF ROUTE EQUIPMENT
OFF ROUTE -0.024
Analyze Waveform 19-Sep-07 14:18:14 RMS = .0711 PK(+/-) = .2214/.2075 CRESTF= 3.11
0 50 100 150 200 250 300 350 400
-2.0-1.5
-1.0-0.5
0 0.5
1.01.52.0
Time in mSecs
Acc
eler
atio
n in
G-s
CF ALARM CF ALARM
PK ALARM
PK ALARM
Label: MOTOR -1 /PUMP
Analyze Spectrum 19-Sep-07 14:18:14 (Peak Hold) PK = .0356 LOAD = 100.0 RPM = 3408. (56.80 Hz)
0 200 400 600 800
0.020
0.016
1000
0
0.004
0.008
0.012
Frequency in Hz
PK V
eloc
ity in
In/S
ec
A-30
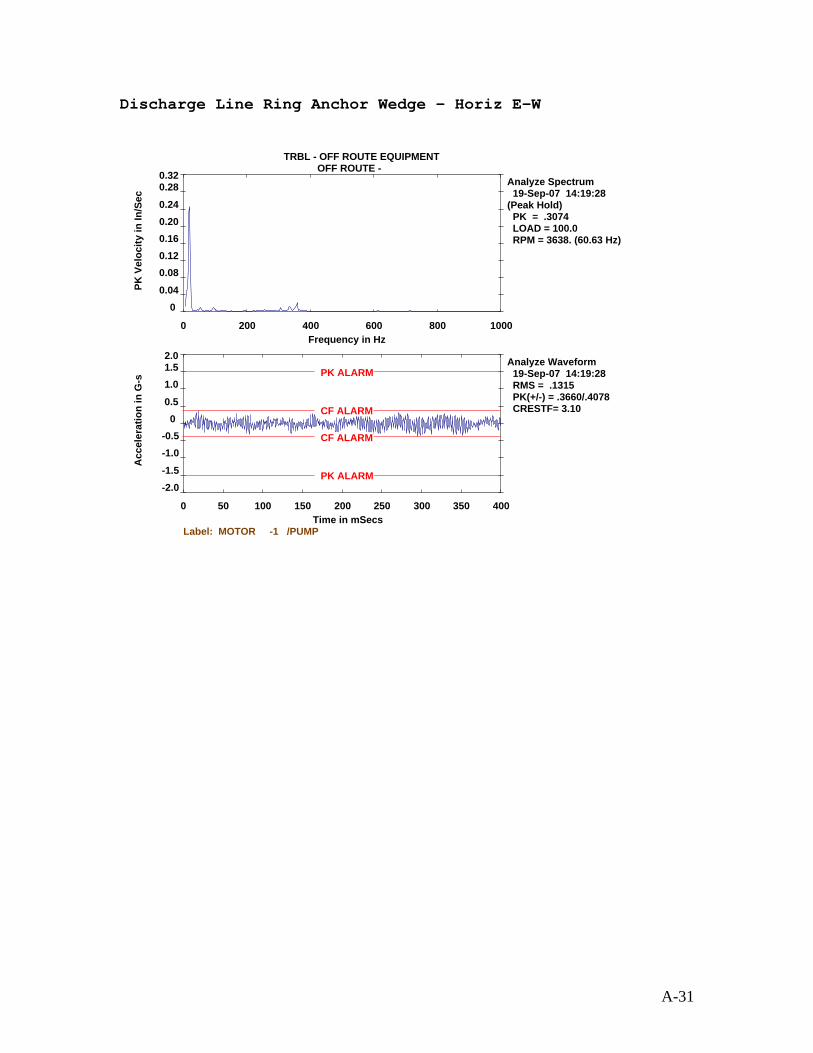
Discharge L
ine Ring Anchor Wedge – Horiz E-W
Analyze Waveform 19-Sep-07 14:19:28 RMS = .1315 PK(+/-) = .3660/.4078 CRESTF= 3.10
0 50 100 150 200 250 300 350 400
-2.0-1.5
-1.0-0.5
0 0.5
1.01.52.0
Time in mSecs
Acc
eler
atio
n in
G-s
CF ALARM
CF ALARM
PK ALARM
PK ALARM
TRBL - OFF ROUTE EQUIPMENTOFF ROUTE -
Label: MOTOR -1 /PUMP
Analyze Spectrum 19-Sep-07 14:19:28 (Peak Hold) PK = .3074 LOAD = 100.0 RPM = 3638. (60.63 Hz)
0 200 400 600 800 1000
0 0.04
0.080.120.160.200.24
0.280.32
Frequency in Hz
PK V
eloc
ity in
In/S
ec
A-31

Discharge Li
ne Ring Anchor Wedge – Horiz N-S
Analyze Waveform 19-Sep-07 14:20:04 RMS = .1684 PK(+/-) = .5904/.4511 CRESTF= 3.51
0 50 100 150 200 250 300 350 400
-2.0-1.5
-1.0-0.5
0 0.5
1.01.52.0
Time in mSecs
Acc
eler
atio
n in
G-s
CF ALARM
CF ALARM
PK ALARM
PK ALARM
TRBL - OFF ROUTE EQUIPMENTOFF ROUTE -
Label: MOTOR -1 /PUMP
Analyze Spectrum 19-Sep-07 14:20:04 (Peak Hold) PK = .1438 LOAD = 100.0 RPM = 3669. (61.14 Hz)
0 200 400 600 800 1000
0
0.03
0.06
0.09
0.12
Frequency in Hz
PK V
eloc
ity in
In/S
ec
A-32
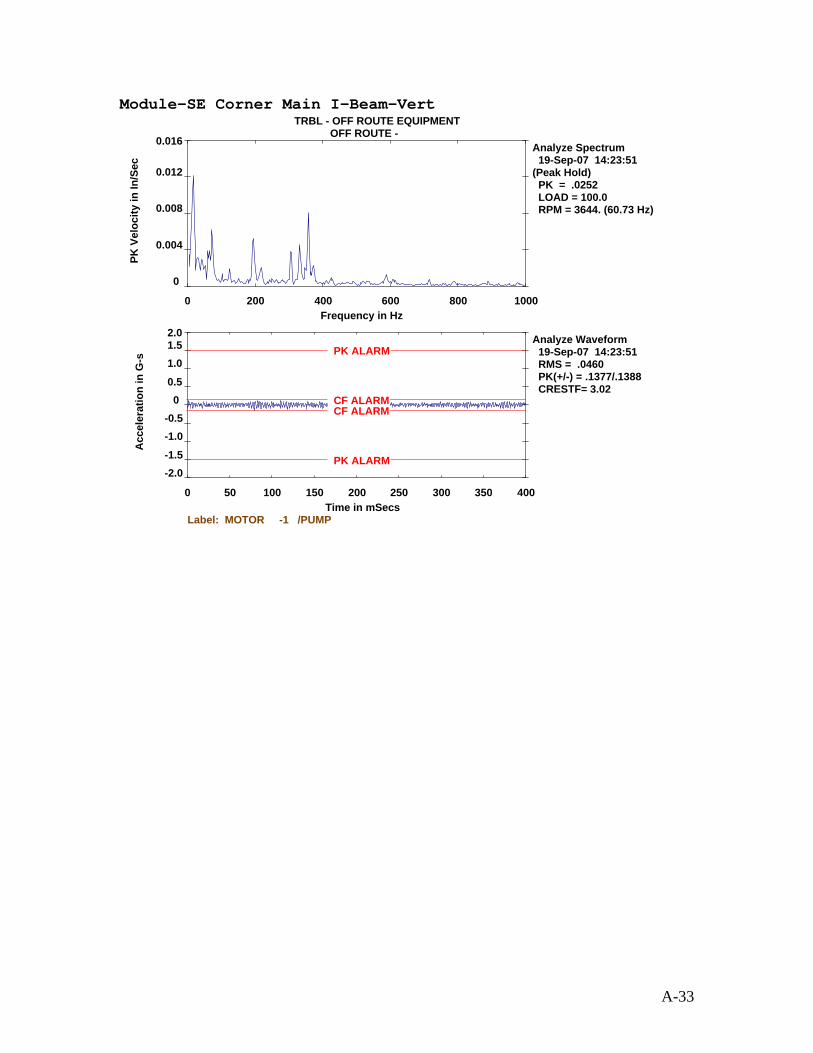
Module-SE Corner Main I-Beam-Vert TRBL - OFF ROUTE EQUIPMENT
OFF ROUTE -0.016
Analyze Waveform 19-Sep-07 14:23:51 RMS = .0460 PK(+/-) = .1377/.1388 CRESTF= 3.02
0 50 100 150 200 250 300 350 400
-2.0-1.5
-1.0-0.5
0 0.5
1.01.52.0
Time in mSecs
Acc
eler
atio
n in
G-s
CF ALARM CF ALARM
PK ALARM
PK ALARM
Label: MOTOR -1 /PUMP
Analyze Spectrum 19-Sep-07 14:23:51 (Peak Hold) PK = .0252 LOAD = 100.0 RPM = 3644. (60.73 Hz)
0 200 400 600 800
0.012
1000
0
0.004
0.008
Frequency in Hz
PK V
eloc
ity in
In/S
ec
A-33

Module-SE Corner Main I-Beam-Horiz N-S
Analyze Waveform 19-Sep-07 14:24:16 RMS = .0275 PK(+/-) = .0821/.0869 CRESTF= 3.16
0 50 100 150 200 250 300 350 400
-2.0-1.5
-1.0-0.5
0 0.5
1.01.52.0
Time in mSecs
Acc
eler
atio
n in
G-s
CF ALARM CF ALARM
PK ALARM
PK ALARM
OFF ROUTE -TRBL - OFF ROUTE EQUIPMENT
0.018
Label: MOTOR -1 /PUMP
Analyze Spectrum 19-Sep-07 14:24:16 (Peak Hold) PK = .0254 LOAD = 100.0 RPM = 3955. (65.92 Hz)
0 200 400 600 800
0.015
0.012
1000
0
0.003
0.006
0.009
Frequency in Hz
PK V
eloc
ity in
In/S
ec
A-34

Module-SE Corner Main I-Beam-Horiz- E-W
Analyze Waveform 19-Sep-07 14:25:12 RMS = .0283 PK(+/-) = .0915/.0893 CRESTF= 3.23
0 50 100 150 200 250 300 350 400
-2.0-1.5
-1.0-0.5
0 0.5
1.01.52.0
Time in mSecs
Acc
eler
atio
n in
G-s
CF ALARM CF ALARM
PK ALARM
PK ALARM
OFF ROUTE -TRBL - OFF ROUTE EQUIPMENT
0.030
Label: MOTOR -1 /PUMP
Analyze Spectrum 19-Sep-07 14:25:12 (Peak Hold) PK = .0439 LOAD = 100.0 RPM = 3600. (60.00 Hz)
0 200 400 600 800
0.025
0.020
1000
0
0.005
0.010
0.015
Frequency in Hz
PK V
eloc
ity in
In/S
ec
A-35

Module-NE Corner Main I-Beam-Vert TRBL - OFF ROUTE EQUIPMENT
OFF ROUTE -0.018
Analyze Waveform 19-Sep-07 14:26:19 RMS = .0330 PK(+/-) = .0814/.1013 CRESTF= 3.07
0 50 100 150 200 250 300 350 400
-2.0-1.5
-1.0-0.5
0 0.5
1.01.52.0
Time in mSecs
Acc
eler
atio
n in
G-s
CF ALARM CF ALARM
PK ALARM
PK ALARM
Label: MOTOR -1 /PUMP
Analyze Spectrum 19-Sep-07 14:26:19 (Peak Hold) PK = .0274 LOAD = 100.0 RPM = 3600. (60.00 Hz)
0 200 400 600 800
0.015
1000
0
0.003
0.006
0.009
0.012
Frequency in Hz
PK V
eloc
ity in
In/S
ec
A-36

Module-NE Corner Main I-Beam-Horiz-Vert
Analyze Waveform 19-Sep-07 14:27:02 RMS = .0279 PK(+/-) = .0772/.0853 CRESTF= 3.05
0 50 100 150 200 250 300 350 400
-2.0-1.5
-1.0-0.5
0 0.5
1.01.52.0
Time in mSecs
Acc
eler
atio
n in
G-s
CF ALARM CF ALARM
PK ALARM
PK ALARM
OFF ROUTE -TRBL - OFF ROUTE EQUIPMENT
0.016
Label: MOTOR -1 /PUMP
Analyze Spectrum 19-Sep-07 14:27:02 (Peak Hold) PK = .0294 LOAD = 100.0 RPM = 3800. (63.33 Hz)
0 200 400 600 800
0.012
1000
0
0.004
0.008
Frequency in Hz
PK V
eloc
ity in
In/S
ec
A-37

Module-NE Corner Main I-Beam-Horiz-N-S
Analyze Waveform 19-Sep-07 14:27:53 RMS = .0444 PK(+/-) = .1481/.1542 CRESTF= 3.47
0 50 100 150 200 250 300 350 400
-2.0-1.5
-1.0-0.5
0 0.5
1.01.52.0
Time in mSecs
Acc
eler
atio
n in
G-s
CF ALARM CF ALARM
PK ALARM
PK ALARM
OFF ROUTE -TRBL - OFF ROUTE EQUIPMENT
0.024
Label: MOTOR -1 /PUMP
Analyze Spectrum 19-Sep-07 14:27:53 (Peak Hold) PK = .0301 LOAD = 100.0 RPM = 3948. (65.80 Hz)
0 200 400 600 800
0.020
0.016
1000
0
0.004
0.008
0.012
Frequency in Hz
PK V
eloc
ity in
In/S
ec
A-38

Module-Middle Main I-Beam-East Side
-Vert
Analyze Waveform 19-Sep-07 14:29:25 RMS = .0631 PK(+/-) = .1953/.2296 CRESTF= 3.64
0 50 100 150 200 250 300 350 400
-2.0-1.5
-1.0-0.5
0 0.5
1.01.52.0
Time in mSecs
Acc
eler
atio
n in
G-s
CF ALARM CF ALARM
PK ALARM
PK ALARM
TRBL - OFF ROUTE EQUIPMENTOFF ROUTE -
0.05
Label: MOTOR -1 /PUMP
Analyze Spectrum 19-Sep-07 14:29:25 (Peak Hold) PK = .0603 LOAD = 100.0 RPM = 3672. (61.20 Hz)
0 200 400 600 800
0.04
1000
0
0.01
0.02
0.03
Frequency in Hz
PK V
eloc
ity in
In/S
ec
A-39
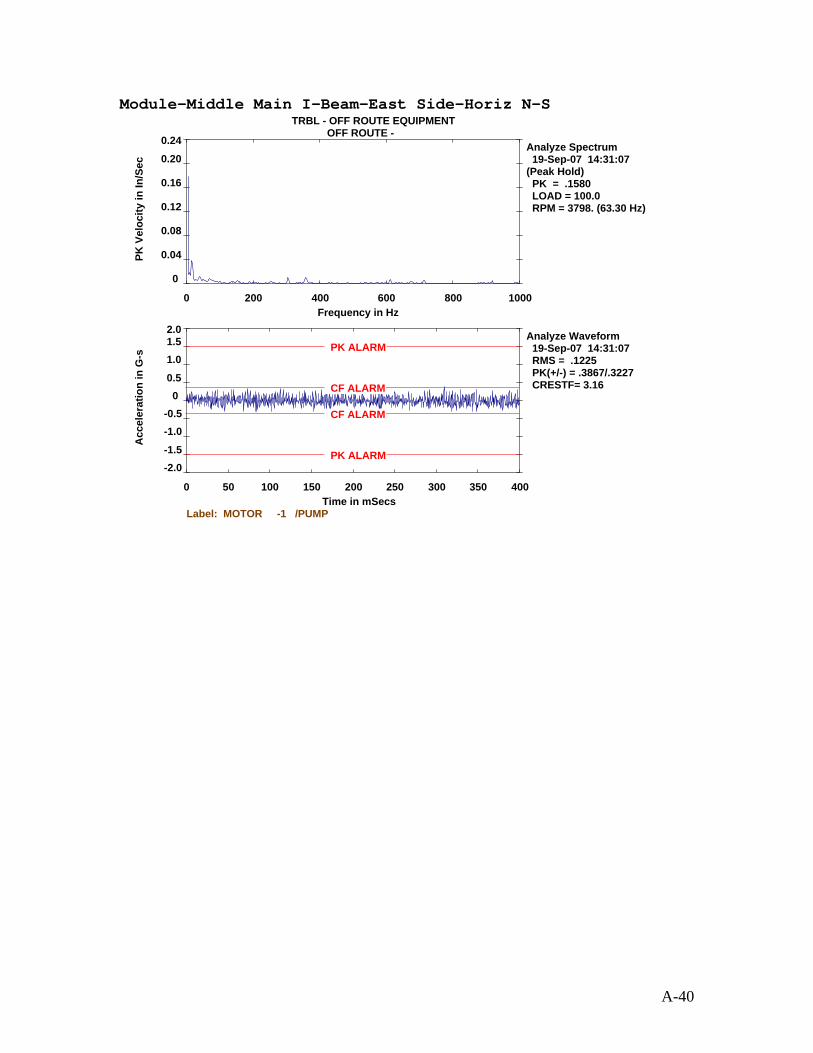
Module-Middle Main I-Beam-East Side-Horiz N-S TRBL - OFF ROUTE EQUIPMENT
OFF ROUTE -0.24
Analyze Waveform 19-Sep-07 14:31:07 RMS = .1225 PK(+/-) = .3867/.3227 CRESTF= 3.16
0 50 100 150 200 250 300 350 400
-2.0-1.5
-1.0-0.5
0 0.5
1.01.52.0
Time in mSecs
Acc
eler
atio
n in
G-s
CF ALARM
CF ALARM
PK ALARM
PK ALARM
Label: MOTOR -1 /PUMP
Analyze Spectrum 19-Sep-07 14:31:07 (Peak Hold) PK = .1580 LOAD = 100.0 RPM = 3798. (63.30 Hz)
0 200 400 600 800
0.20
0.16
1000
0
0.04
0.08
0.12
Frequency in Hz
PK V
eloc
ity in
In/S
ec
A-40

Pump #3 Suction Line at Ring Anchor-Hori
-E-W
Analyze Waveform 19-Sep-07 14:32:49 RMS = .0861 PK(+/-) = .2217/.2963 CRESTF= 3.44
0 50 100 150 200 250 300 350 400
-2.0-1.5
-1.0-0.5
0 0.5
1.01.52.0
Time in mSecs
Acc
eler
atio
n in
G-s
CF ALARM
CF ALARM
PK ALARM
PK ALARM
TRBL - OFF ROUTE EQUIPMENTOFF ROUTE -
0.15
Label: MOTOR -1 /PUMP
Analyze Spectrum 19-Sep-07 14:32:49 (Peak Hold) PK = .1408 LOAD = 100.0 RPM = 3920. (65.34 Hz)
0 200 400 600 800
0.12
1000
0
0.03
0.06
0.09
Frequency in Hz
PK V
eloc
ity in
In/S
ec
A-41

Pump #3 Suction Line at Ring Anchor-Hori-E-W
Analyze Waveform 19-Sep-07 14:34:07 RMS = .0857 PK(+/-) = .2296/.2472 CRESTF= 2.88
0 50 100 150 200 250 300 350 400
-2.0-1.5
-1.0-0.5
0 0.5
1.01.52.0
Time in mSecs
Acc
eler
atio
n in
G-s
CF ALARM
CF ALARM
PK ALARM
PK ALARM
TRBL - OFF ROUTE EQUIPMENTOFF ROUTE -
Label: MOTOR -1 /PUMP
Analyze Spectrum 19-Sep-07 14:34:07 (Peak Hold) PK = .1248 LOAD = 100.0 RPM = 3362. (56.03 Hz)
0 200 400 600 800 1000
0
0.02
0.04
0.06
0.08
0.10
Frequency in Hz
PK V
eloc
ity in
In/S
ec
A-42

Pump #3 Discharge Line at Ring Anchor-Hori-E-W
Analyze Waveform 19-Sep-07 14:37:31 RMS = .1080 PK(+/-) = .3180/.3030 CRESTF= 2.94
0 50 100 150 200 250 300 350 400
-2.0-1.5
-1.0-0.5
0 0.5
1.01.52.0
Time in mSecs
Acc
eler
atio
n in
G-s
CF ALARM
CF ALARM
PK ALARM
PK ALARM
TRBL - OFF ROUTE EQUIPMENTOFF ROUTE -
0.24
Label: MOTOR -1 /PUMP
Analyze Spectrum 19-Sep-07 14:37:31 (Peak Hold) PK = .2107 LOAD = 100.0 RPM = 3334. (55.56 Hz)
0 200 400 600 800
0.20
1000
0
0.04
0.08
0.12
0.16
Frequency in Hz
PK V
eloc
ity in
In/S
ec
A-43
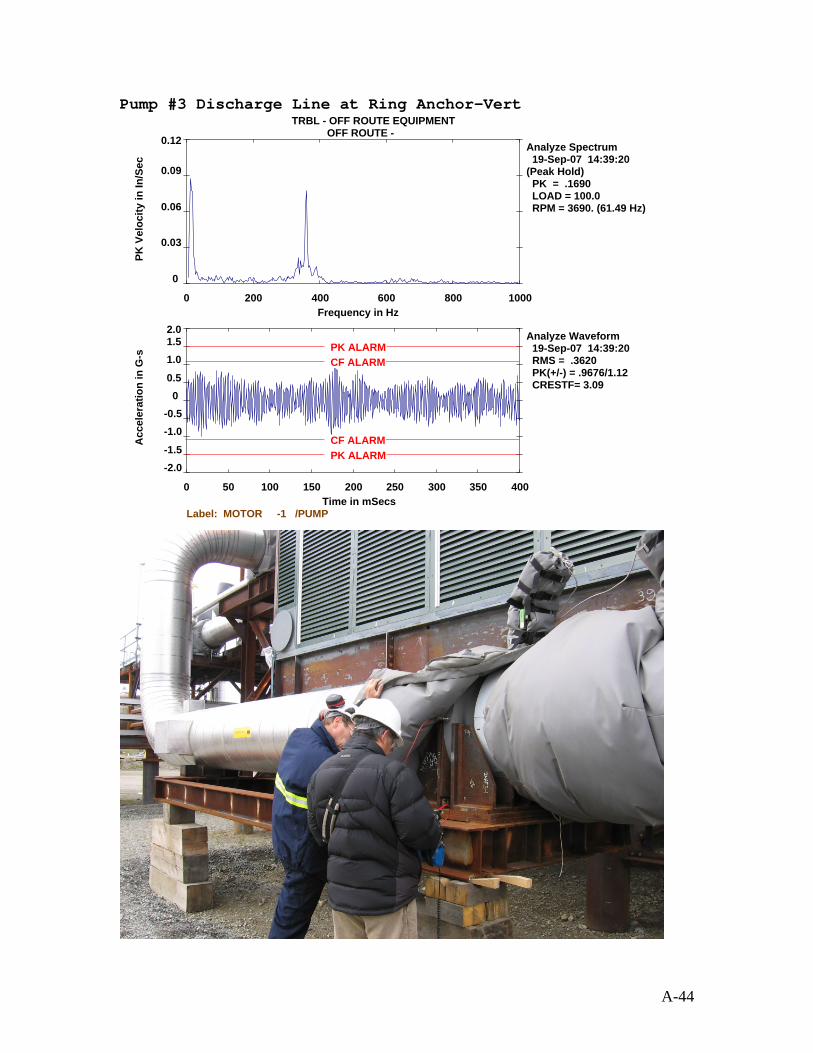
Pump #3 Discharge Line at Ring Anchor-Vert TRBL - OFF ROUTE EQUIPMENT
OFF ROUTE -0.12
Analyze Waveform 19-Sep-07 14:39:20 RMS = .3620 PK(+/-) = .9676/1.12 CRESTF= 3.09
0 50 100 150 200 250 300 350 400
-2.0-1.5
-1.0-0.5
0 0.5
1.01.52.0
Time in mSecs
Acc
eler
atio
n in
G-s CF ALARM
CF ALARM
PK ALARM
PK ALARM
Label: MOTOR -1 /PUMP
Analyze Spectrum 19-Sep-07 14:39:20 (Peak Hold) PK = .1690 LOAD = 100.0 RPM = 3690. (61.49 Hz)
0 200 400 600 800
0.09
1000
0
0.03
0.06
Frequency in Hz
PK V
eloc
ity in
In/S
ec
A-44

Pump #3 Discharge Line at Ring Anchor-Vert TRBL - OFF ROUTE EQUIPMENT
OFF ROUTE -
Label: MOTOR -1 /PUMP
Analyze Spectrum 19-Sep-07 14:39:32 (Peak Hold)
PK = .1798 LOAD = 100.0 RPM = 3941. (65.68 Hz)
0 200 400
0.16
A-45
600 800
0.12
1000
0
0.04
0.08
Frequency in Hz
PK V
eloc
ity in
In/S
ec
oustic Investigation Ac

APPENDIX B: Vibration Displacement Spectra
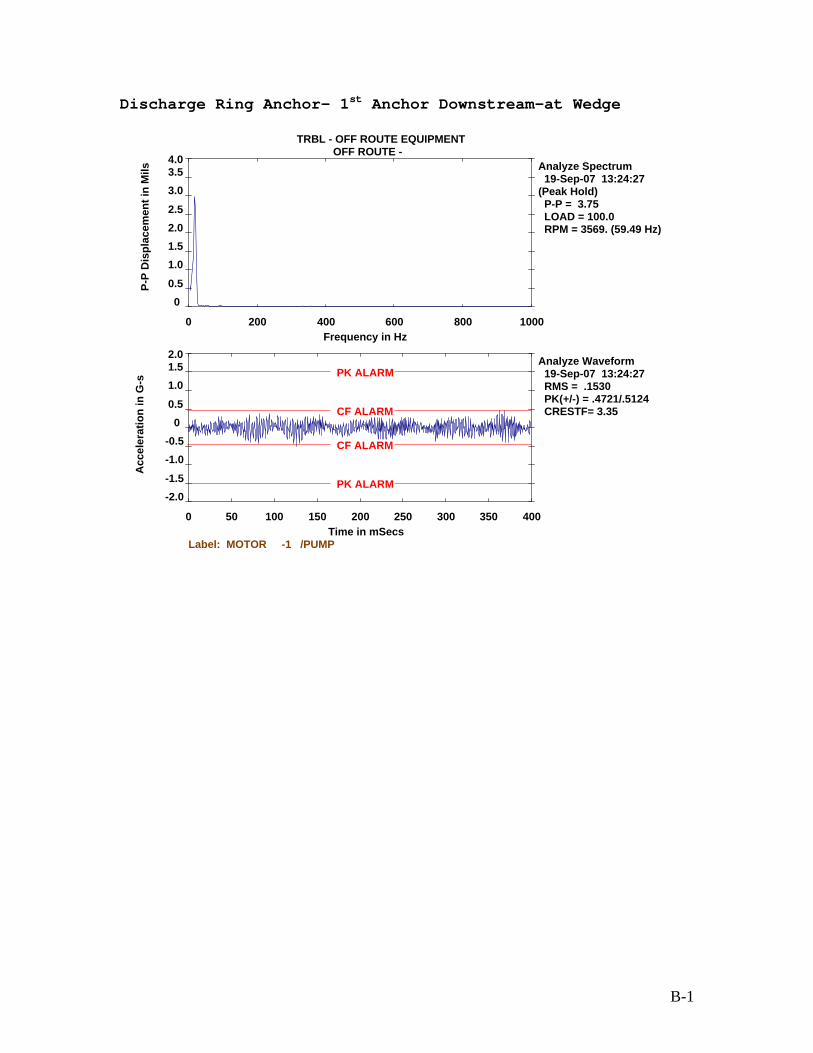
Discharge Ring Anchor- 1st Anchor Downstream-at Wedge
TRBL - OFF ROUTE EQUIPMENTOFF ROUTE -
Analyze Waveform 19-Sep-07 13:24:27 RMS = .1530 PK(+/-) = .4721/.5124 CRESTF= 3.35
0 50 100 150 200 250 300 350 400
-2.0-1.5
-1.0-0.5
0 0.5
1.01.52.0
Time in mSecs
Acc
eler
atio
n in
G-s
CF ALARM
CF ALARM
PK ALARM
PK ALARM
Label: MOTOR -1 /PUMP
Analyze Spectrum 19-Sep-07 13:24:27 (Peak Hold) P-P = 3.75 LOAD = 100.0 RPM = 3569. (59.49 Hz)
0 200 400 600 800 1000
0 0.5
1.01.52.02.5
3.03.54.0
Frequency in Hz
P-P
Dis
plac
emen
t in
Mils
B-1
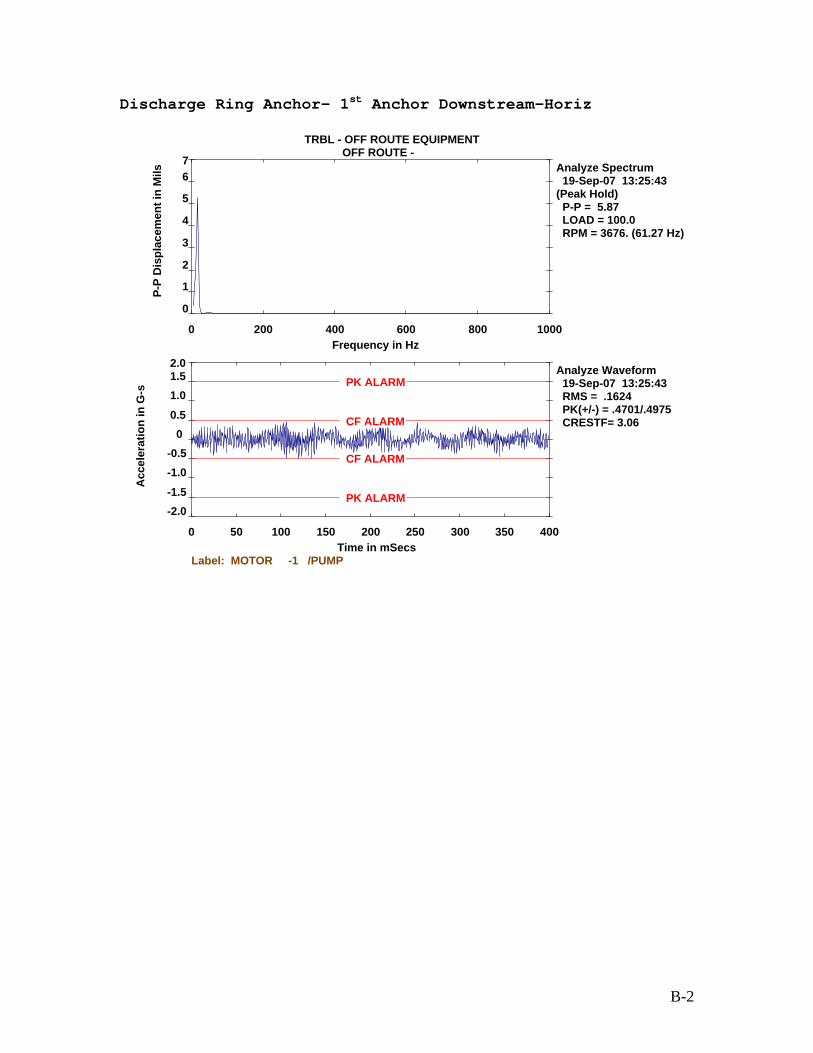
Discharge Ring Anchor- 1st Anchor Downstream-Horiz
TRBL - OFF ROUTE EQUIPMENTOFF ROUTE -
Analyze Waveform 19-Sep-07 13:25:43 RMS = .1624 PK(+/-) = .4701/.4975 CRESTF= 3.06
0 50 100 150 200 250 300 350 400
-2.0-1.5
-1.0-0.5
0 0.5
1.01.52.0
Time in mSecs
Acc
eler
atio
n in
G-s
CF ALARM
CF ALARM
PK ALARM
PK ALARM
Label: MOTOR -1 /PUMP
Analyze Spectrum 19-Sep-07 13:25:43 (Peak Hold) P-P = 5.87 LOAD = 100.0 RPM = 3676. (61.27 Hz)
0 200 400 600 800
76
5
1000
0
1
2
3
4
Frequency in Hz
P-P
Dis
plac
emen
t in
Mils
B-2

Discharge Ring Anchor- 1st Anchor Downstream-Axial
TRBL - OFF ROUTE EQUIPMENTOFF ROUTE -
3.0
Analyze Waveform 19-Sep-07 13:27:12 RMS = .1479 PK(+/-) = .4204/.4271 CRESTF= 2.89
0 50 100 150 200 250 300 350 400
-2.0-1.5
-1.0-0.5
0 0.5
1.01.52.0
Time in mSecs
Acc
eler
atio
n in
G-s
CF ALARM
CF ALARM
PK ALARM
PK ALARM
Label: MOTOR -1 /PUMP
Analyze Spectrum 19-Sep-07 13:27:12 (Peak Hold) P-P = 2.74 LOAD = 100.0 RPM = 3243. (54.04 Hz)
0 200 400 600 800
2.5
2.0
1000
0
0.5
1.0
1.5
Frequency in Hz
P-P
Dis
plac
emen
t in
Mils
B-3

Discharge Ring Anchor- 1st Anchor Downstream-Vert
TRBL - OFF ROUTE EQUIPMENTOFF ROUTE -
Analyze Waveform 19-Sep-07 13:30:04 RMS = .1505 PK(+/-) = .5307/.4723 CRESTF= 3.53
0 50 100 150 200 250 300 350 400
-2.0-1.5
-1.0-0.5
0 0.5
1.01.52.0
Time in mSecs
Acc
eler
atio
n in
G-s
CF ALARM
CF ALARM
PK ALARM
PK ALARM
Label: MOTOR -1 /PUMP
Analyze Spectrum 19-Sep-07 13:30:04 (Peak Hold) P-P = 4.20 LOAD = 100.0 RPM = 3468. (57.80 Hz)
0 200 400 600 800
5
4
3
1000
0
1
2
Frequency in Hz
P-P
Dis
plac
emen
t in
Mils
B-4

Discharge Ring Anchor- 1st Anchor Downstream-Frame
TRBL - OFF ROUTE EQUIPMENTOFF ROUTE -
2.4
Analyze Waveform 19-Sep-07 13:33:21 RMS = .5297 PK(+/-) = 1.53/1.60 CRESTF= 3.03
0 50 100 150 200 250 300 350 400
-2.0-1.6-1.2-0.8-0.40.00.40.81.21.6
Time in mSecs
Acc
eler
atio
n in
G-s
CF ALARM
CF ALARM
PK ALARM
PK ALARM
Label: MOTOR -1 /PUMP
Analyze Spectrum 19-Sep-07 13:33:21 (Peak Hold) P-P = 2.67 LOAD = 100.0 RPM = 3768. (62.79 Hz)
0 200 400 600 800
2.0
1.6
1000
0
0.4
0.8
1.2
Frequency in Hz
P-P
Dis
plac
emen
t in
Mils
B-5

Discharge Line Guide TRBL - OFF ROUTE EQUIPMENT
OFF ROUTE -2.0
Analyze Waveform 19-Sep-07 13:37:35 RMS = .6680 PK(+/-) = 1.26/1.80 CRESTF= 2.69
0 50 100 150 200 250 300 350 400
-3
-2
-1
0
1
2
3
Time in mSecs
Acc
eler
atio
n in
G-s CF ALARM
CF ALARM
PK ALARM
PK ALARM
Label: MOTOR -1 /PUMP
Analyze Spectrum 19-Sep-07 13:37:35 (Peak Hold) P-P = 2.04 LOAD = 100.0 RPM = 3678. (61.30 Hz)
0 200 400 600 800
1.5
1000
0
0.5
1.0
Frequency in Hz
P-P
Dis
plac
emen
t in
Mils
B-6

Cantilever frame brace
TRBL - OFF ROUTE EQUIPMENTOFF ROUTE -
1.5
Analyze Waveform 19-Sep-07 13:39:24 RMS = .5054 PK(+/-) = 1.37/1.26 CRESTF= 2.70
0 50 100 150 200 250 300 350 400
-2.0-1.5
-1.0-0.5
0 0.5
1.01.52.0
Time in mSecs
Acc
eler
atio
n in
G-s
CF ALARM
CF ALARM
PK ALARM
PK ALARM
Label: MOTOR -1 /PUMP
Analyze Spectrum 19-Sep-07 13:39:24 (Peak Hold) P-P = 1.71 LOAD = 100.0 RPM = 3434. (57.23 Hz)
0 200 400 600 800
1.2
1000
0
0.3
0.6
0.9
Frequency in Hz
P-P
Dis
plac
emen
t in
Mils
B-7

Post reading
TRBL - OFF ROUTE EQUIPMENTOFF ROUTE -
Analyze Waveform 19-Sep-07 13:42:17 RMS = .0792 PK(+/-) = .2642/.2773 CRESTF= 3.50
0 50 100 150 200 250 300 350 400
-2.0-1.5
-1.0-0.5
0 0.5
1.01.52.0
Time in mSecs
Acc
eler
atio
n in
G-s
CF ALARM CF ALARM
PK ALARM
PK ALARM
Label: MOTOR -1 /PUMP
Analyze Spectrum 19-Sep-07 13:42:17 P-P = 3.04 LOAD = 100.0 RPM = 3675. (61.24 Hz)
0 200 400 600 800 1000
0 0.4
0.81.21.62.0
2.42.83.2
Frequency in Hz
P-P
Dis
plac
emen
t in
Mils
B-8
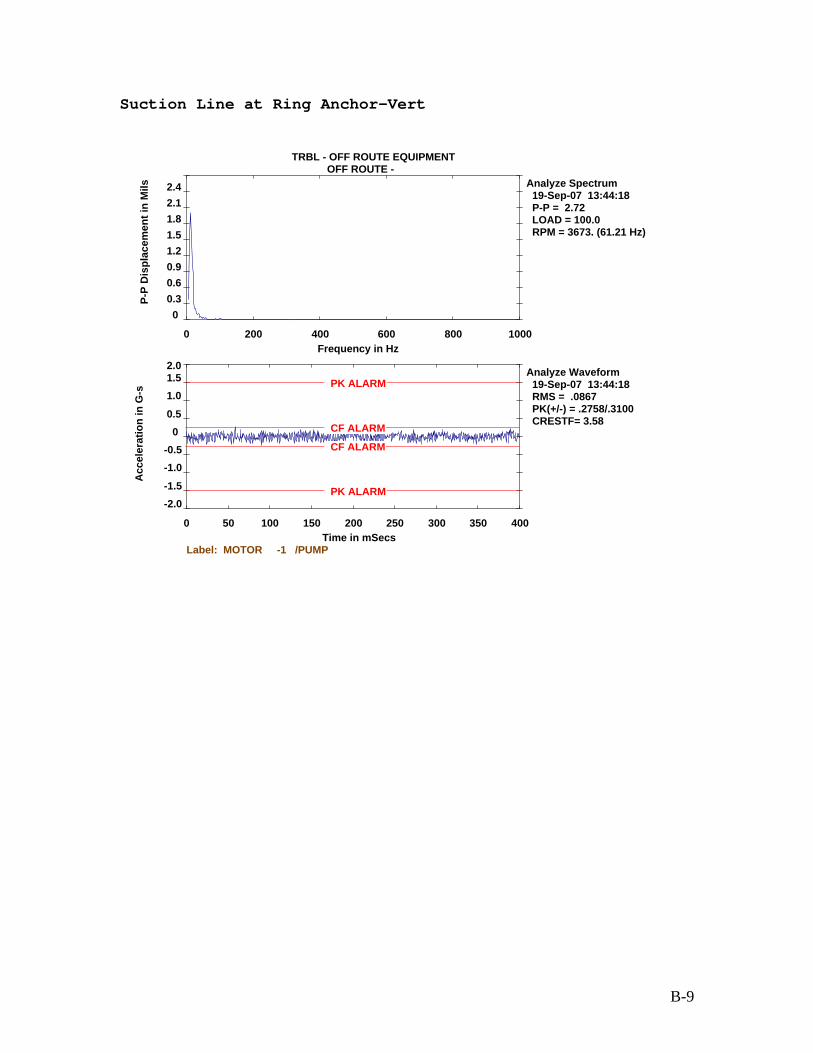
Suction Line at Ring Anchor-Vert
TRBL - OFF ROUTE EQUIPMENTOFF ROUTE -
Analyze Waveform 19-Sep-07 13:44:18 RMS = .0867 PK(+/-) = .2758/.3100 CRESTF= 3.58
0 50 100 150 200 250 300 350 400
-2.0-1.5
-1.0-0.5
0 0.5
1.01.52.0
Time in mSecs
Acc
eler
atio
n in
G-s
CF ALARM
CF ALARM
PK ALARM
PK ALARM
Label: MOTOR -1 /PUMP
Analyze Spectrum 19-Sep-07 13:44:18 P-P = 2.72 LOAD = 100.0 RPM = 3673. (61.21 Hz)
0 200 400 600 800 1000
0 0.30.60.91.21.51.82.12.4
Frequency in Hz
P-P
Dis
plac
emen
t in
Mils
B-9

Suction Line at Ring Anchor-Horiz
TRBL - OFF ROUTE EQUIPMENTOFF ROUTE -
1.5
Analyze Waveform 19-Sep-07 13:44:44 RMS = .0877 PK(+/-) = .2287/.2740 CRESTF= 3.13
0 50 100 150 200 250 300 350 400
-2.0-1.5
-1.0-0.5
0 0.5
1.01.52.0
Time in mSecs
Acc
eler
atio
n in
G-s
CF ALARM
CF ALARM
PK ALARM
PK ALARM
Label: MOTOR -1 /PUMP
Analyze Spectrum 19-Sep-07 13:44:44 P-P = 1.77 LOAD = 100.0 RPM = 3680. (61.33 Hz)
0 200 400 600 800
1.2
1000
0
0.3
0.6
0.9
Frequency in Hz
P-P
Dis
plac
emen
t in
Mils
B-10

At bottom of the stairway
TRBL - OFF ROUTE EQUIPMENTOFF ROUTE -
Analyze Waveform 19-Sep-07 13:45:49 RMS = .1011 PK(+/-) = .3068/.3448 CRESTF= 3.41
0 50 100 150 200 250 300 350 400
-2.0-1.5
-1.0-0.5
0 0.5
1.01.52.0
Time in mSecs
Acc
eler
atio
n in
G-s
CF ALARM
CF ALARM
PK ALARM
PK ALARM
Label: MOTOR -1 /PUMP
Analyze Spectrum 19-Sep-07 13:45:49 P-P = 3.07 LOAD = 100.0 RPM = 3679. (61.32 Hz)
0 200 400 600 800 1000
0 0.4
0.81.21.62.0
2.42.83.2
Frequency in Hz
P-P
Dis
plac
emen
t in
Mils
B-11

Railing
TRBL - OFF ROUTE EQUIPMENTOFF ROUTE -
Route Waveform 19-Sep-07 13:49:08 PK = .1793 PK(+/-) = .3207/.2399 CRESTF= 2.53
0 50 100 150 200 250 300 350 400
-1.2
-0.8
-0.4
0.0
0.4
0.8
1.2
Time in mSecs
Velo
city
in In
/Sec
CF ALARM
CF ALARM
PK ALARM
PK ALARM
Label: MOTOR -1 /PUMP
Route Spectrum 19-Sep-07 13:49:08 OVERALL= .1993 V-AN P-P = 4.85 LOAD = 100.0 RPM = 3679. (61.32 Hz)
0 200 400 600 800
6
5
4
1000
0
1
2
3
Frequency in Hz
P-P
Dis
plac
emen
t in
Mils
B-12
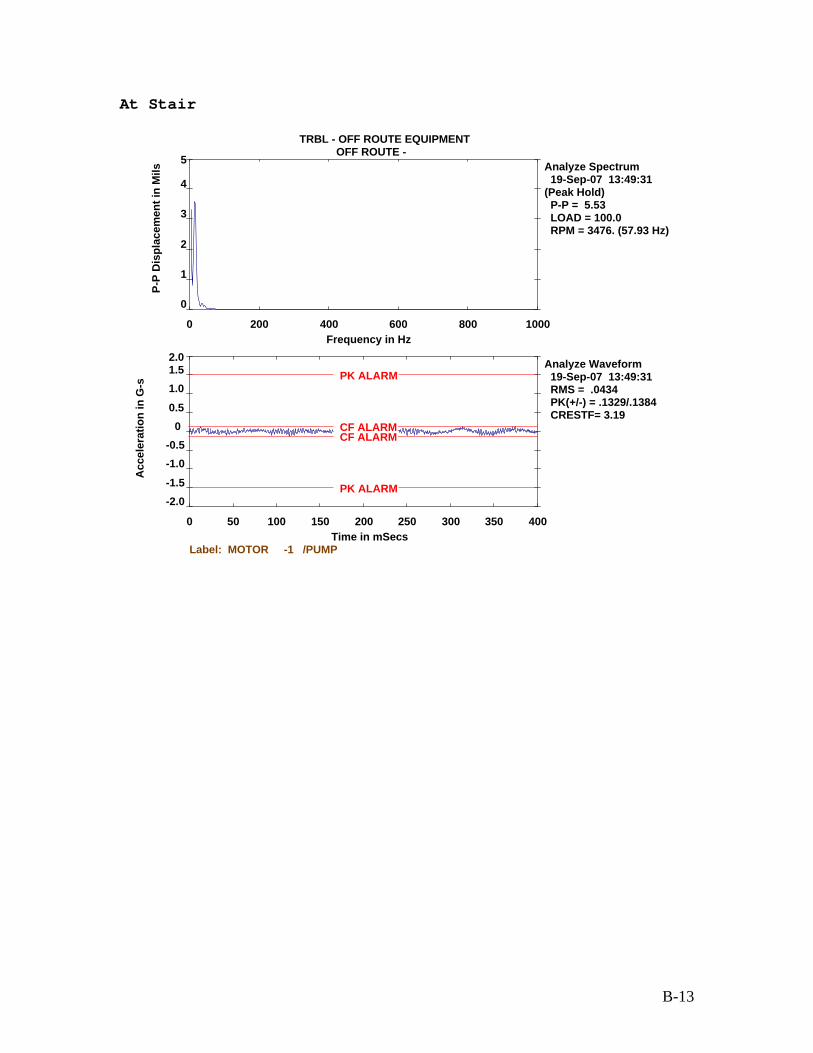
At Stair
TRBL - OFF ROUTE EQUIPMENTOFF ROUTE -
Analyze Waveform 19-Sep-07 13:49:31 RMS = .0434 PK(+/-) = .1329/.1384 CRESTF= 3.19
0 50 100 150 200 250 300 350 400
-2.0-1.5
-1.0-0.5
0 0.5
1.01.52.0
Time in mSecs
Acc
eler
atio
n in
G-s
CF ALARM CF ALARM
PK ALARM
PK ALARM
Label: MOTOR -1 /PUMP
Analyze Spectrum 19-Sep-07 13:49:31 (Peak Hold) P-P = 5.53 LOAD = 100.0 RPM = 3476. (57.93 Hz)
0 200 400 600 800
5
4
1000
0
1
2
3
Frequency in Hz
P-P
Dis
plac
emen
t in
Mils
B-13
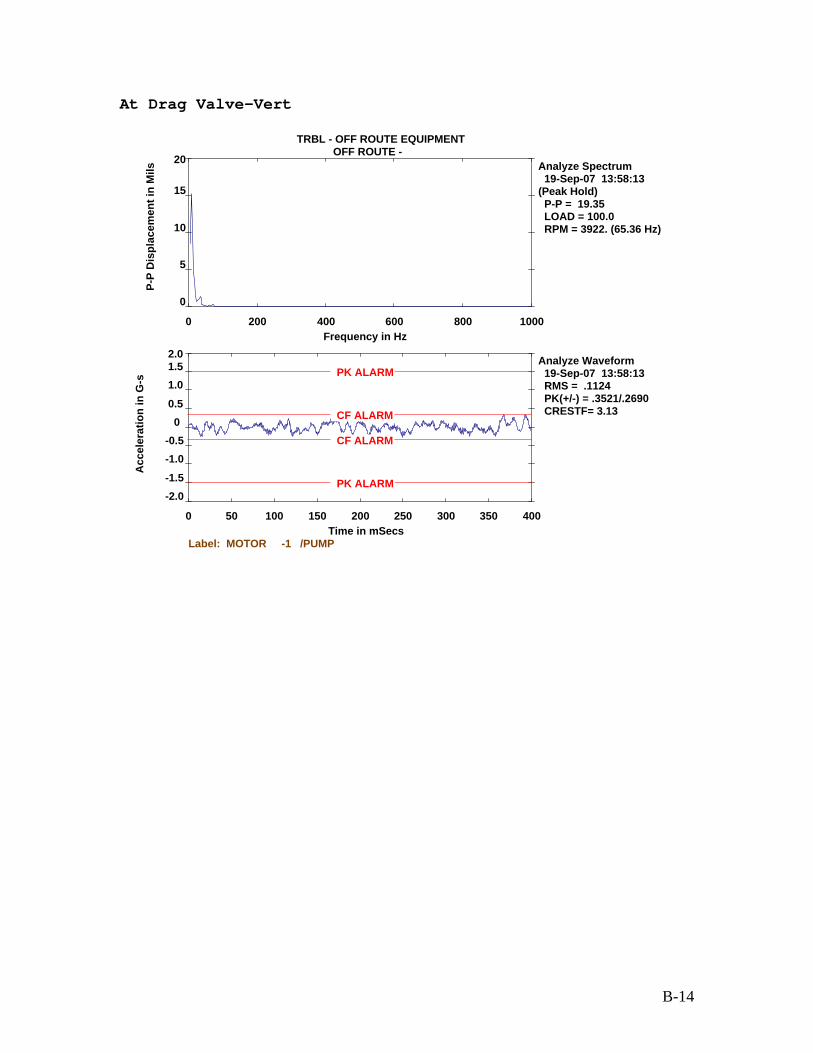
At Drag Valve-Vert
TRBL - OFF ROUTE EQUIPMENTOFF ROUTE -
Analyze Waveform 19-Sep-07 13:58:13 RMS = .1124 PK(+/-) = .3521/.2690 CRESTF= 3.13
0 50 100 150 200 250 300 350 400
-2.0-1.5
-1.0-0.5
0 0.5
1.01.52.0
Time in mSecs
Acc
eler
atio
n in
G-s
CF ALARM
CF ALARM
PK ALARM
PK ALARM
Label: MOTOR -1 /PUMP
Analyze Spectrum 19-Sep-07 13:58:13 (Peak Hold) P-P = 19.35 LOAD = 100.0 RPM = 3922. (65.36 Hz)
0 200 400 600 800
20
15
1000
0
5
10
Frequency in Hz
P-P
Dis
plac
emen
t in
Mils
B-14

At Drag Valve-Horiz
TRBL - OFF ROUTE EQUIPMENTOFF ROUTE -
Analyze Waveform 19-Sep-07 13:59:15 RMS = .0822 PK(+/-) = .2542/.2603 CRESTF= 3.17
0 50 100 150 200 250 300 350 400
-2.0-1.5
-1.0-0.5
0 0.5
1.01.52.0
Time in mSecs
Acc
eler
atio
n in
G-s
CF ALARM CF ALARM
PK ALARM
PK ALARM
Label: MOTOR -1 /PUMP
Analyze Spectrum 19-Sep-07 13:59:15 (Peak Hold) P-P = 16.51 LOAD = 100.0 RPM = 3256. (54.27 Hz)
0 200 400 600 800
20
15
1000
0
5
10
Frequency in Hz
P-P
Dis
plac
emen
t in
Mils
B-15

At Drag Valve-Axial
TRBL - OFF ROUTE EQUIPMENTOFF ROUTE -
Analyze Waveform 19-Sep-07 14:00:14 RMS = .0669 PK(+/-) = .2125/.2498 CRESTF= 3.74
0 50 100 150 200 250 300 350 400
-2.0-1.5
-1.0-0.5
0 0.5
1.01.52.0
Time in mSecs
Acc
eler
atio
n in
G-s
CF ALARM CF ALARM
PK ALARM
PK ALARM
Label: MOTOR -1 /PUMP
Analyze Spectrum 19-Sep-07 14:00:14 (Peak Hold) P-P = 5.82 LOAD = 100.0 RPM = 3600. (60.00 Hz)
0 200 400 600 800
6
5
4
1000
0
1
2
3
Frequency in Hz
P-P
Dis
plac
emen
t in
Mils
B-16

Recycle Line Support
TRBL - OFF ROUTE EQUIPMENTOFF ROUTE -
Analyze Waveform 19-Sep-07 14:02:12 RMS = .2090 PK(+/-) = .5820/.6908 CRESTF= 3.30
0 50 100 150 200 250 300 350 400
-2.0-1.5
-1.0-0.5
0 0.5
1.01.52.0
Time in mSecs
Acc
eler
atio
n in
G-s
CF ALARM
CF ALARM
PK ALARM
PK ALARM
Label: MOTOR -1 /PUMP
Analyze Spectrum 19-Sep-07 14:02:12 (Peak Hold) P-P = 6.34 LOAD = 100.0 RPM = 3570. (59.51 Hz)
0 200 400 600 800
76
5
1000
0
1
2
3
4
Frequency in Hz
P-P
Dis
plac
emen
t in
Mils
B-17

Recycle Line Support-Horiz
TRBL - OFF ROUTE EQUIPMENTOFF ROUTE -
3.5
Analyze Waveform 19-Sep-07 14:02:47 RMS = .0894 PK(+/-) = .2552/.2592 CRESTF= 2.90
0 50 100 150 200 250 300 350 400
-2.0-1.5
-1.0-0.5
0 0.5
1.01.52.0
Time in mSecs
Acc
eler
atio
n in
G-s
CF ALARM
CF ALARM
PK ALARM
PK ALARM
Label: MOTOR -1 /PUMP
Analyze Spectrum 19-Sep-07 14:02:47 (Peak Hold) P-P = 4.54 LOAD = 100.0 RPM = 3600. (60.00 Hz)
0 200 400 600 800
3.0
2.5
1000
0
0.5
1.0
1.5
2.0
Frequency in Hz
P-P
Dis
plac
emen
t in
Mils
B-18

Motor-OB-VERT
TRBL - OFF ROUTE EQUIPMENTOFF ROUTE -
0.5
Analyze Waveform 19-Sep-07 14:07:37 RMS = .0311 PK(+/-) = .0883/.0820 CRESTF= 2.84
0 50 100 150 200 250 300 350 400
-2.0-1.5
-1.0-0.5
0 0.5
1.01.52.0
Time in mSecs
Acc
eler
atio
n in
G-s
CF ALARM CF ALARM
PK ALARM
PK ALARM
Label: MOTOR -1 /PUMP
Analyze Spectrum 19-Sep-07 14:07:37 (Peak Hold) P-P = .4781 LOAD = 100.0 RPM = 3839. (63.99 Hz)
0 200 400 600 800
0.4
1000
0
0.1
0.2
0.3
Frequency in Hz
P-P
Dis
plac
emen
t in
Mils
B-19
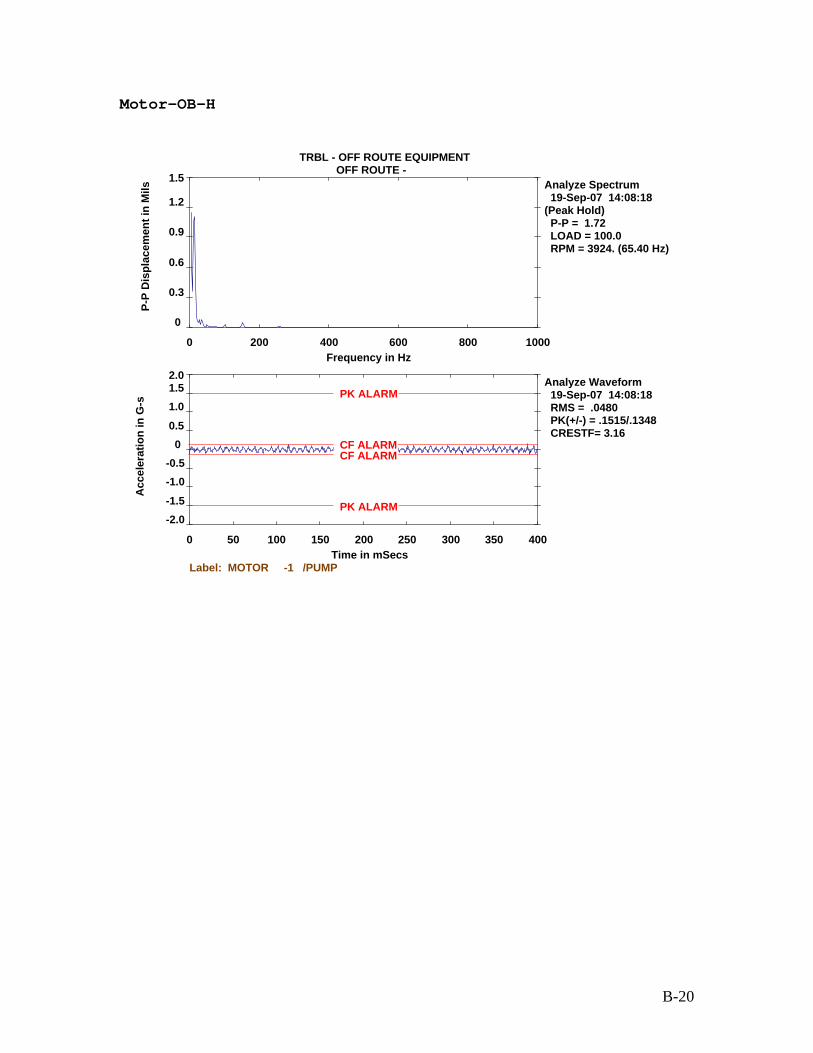
Motor-OB-H
TRBL - OFF ROUTE EQUIPMENTOFF ROUTE -
1.5
Analyze Waveform 19-Sep-07 14:08:18 RMS = .0480 PK(+/-) = .1515/.1348 CRESTF= 3.16
0 50 100 150 200 250 300 350 400
-2.0-1.5
-1.0-0.5
0 0.5
1.01.52.0
Time in mSecs
Acc
eler
atio
n in
G-s
CF ALARM CF ALARM
PK ALARM
PK ALARM
Label: MOTOR -1 /PUMP
Analyze Spectrum 19-Sep-07 14:08:18 (Peak Hold) P-P = 1.72 LOAD = 100.0 RPM = 3924. (65.40 Hz)
0 200 400 600 800
1.2
1000
0
0.3
0.6
0.9
Frequency in Hz
P-P
Dis
plac
emen
t in
Mils
B-20

Motor-IB-VERT
TRBL - OFF ROUTE EQUIPMENTOFF ROUTE -
0.28
Analyze Waveform 19-Sep-07 14:09:29 RMS = .0304 PK(+/-) = .0779/.0999 CRESTF= 3.29
0 50 100 150 200 250 300 350 400
-2.0-1.5
-1.0-0.5
0 0.5
1.01.52.0
Time in mSecs
Acc
eler
atio
n in
G-s
CF ALARM CF ALARM
PK ALARM
PK ALARM
Label: MOTOR -1 /PUMP
Analyze Spectrum 19-Sep-07 14:09:29 (Peak Hold) P-P = .3210 LOAD = 100.0 RPM = 3670. (61.16 Hz)
0 200 400 600 800
0.24
0.20
1000
0
0.04
0.08
0.12
0.16
Frequency in Hz
P-P
Dis
plac
emen
t in
Mils
B-21

Motor-IB-H
TRBL - OFF ROUTE EQUIPMENTOFF ROUTE -
1.4
Analyze Waveform 19-Sep-07 14:09:50 RMS = .0348 PK(+/-) = .1000/.1007 CRESTF= 2.90
0 50 100 150 200 250 300 350 400
-2.0-1.5
-1.0-0.5
0 0.5
1.01.52.0
Time in mSecs
Acc
eler
atio
n in
G-s
CF ALARM CF ALARM
PK ALARM
PK ALARM
Label: MOTOR -1 /PUMP
Analyze Spectrum 19-Sep-07 14:09:50 (Peak Hold) P-P = 1.31 LOAD = 100.0 RPM = 3838. (63.97 Hz)
0 200 400 600 800
1.2
1.0
1000
0
0.2
0.4
0.6
0.8
Frequency in Hz
P-P
Dis
plac
emen
t in
Mils
B-22

Motor-IB-AX
TRBL - OFF ROUTE EQUIPMENTOFF ROUTE -
0.7
Analyze Waveform 19-Sep-07 14:10:09 RMS = .0671 PK(+/-) = .1969/.2067 CRESTF= 3.08
0 50 100 150 200 250 300 350 400
-2.0-1.5
-1.0-0.5
0 0.5
1.01.52.0
Time in mSecs
Acc
eler
atio
n in
G-s
CF ALARM CF ALARM
PK ALARM
PK ALARM
Label: MOTOR -1 /PUMP
Analyze Spectrum 19-Sep-07 14:10:09 (Peak Hold) P-P = .6986 LOAD = 100.0 RPM = 3759. (62.65 Hz)
0 200 400 600 800
0.6
0.5
1000
0
0.1
0.2
0.3
0.4
Frequency in Hz
P-P
Dis
plac
emen
t in
Mils
B-23
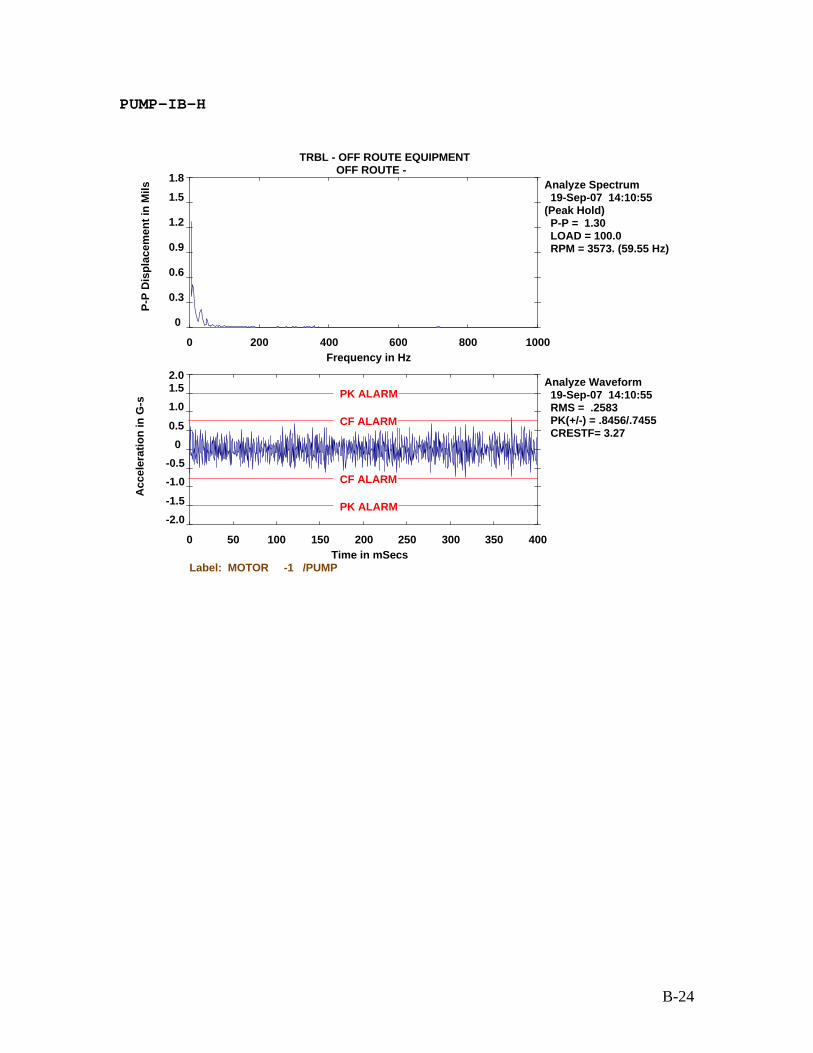
PUMP-IB-H
TRBL - OFF ROUTE EQUIPMENTOFF ROUTE -
1.8
Analyze Waveform 19-Sep-07 14:10:55 RMS = .2583 PK(+/-) = .8456/.7455 CRESTF= 3.27
0 50 100 150 200 250 300 350 400
-2.0-1.5
-1.0-0.5
0 0.5
1.01.52.0
Time in mSecs
Acc
eler
atio
n in
G-s
CF ALARM
CF ALARM
PK ALARM
PK ALARM
Label: MOTOR -1 /PUMP
Analyze Spectrum 19-Sep-07 14:10:55 (Peak Hold) P-P = 1.30 LOAD = 100.0 RPM = 3573. (59.55 Hz)
0 200 400 600 800
1.5
1.2
1000
0
0.3
0.6
0.9
Frequency in Hz
P-P
Dis
plac
emen
t in
Mils
B-24
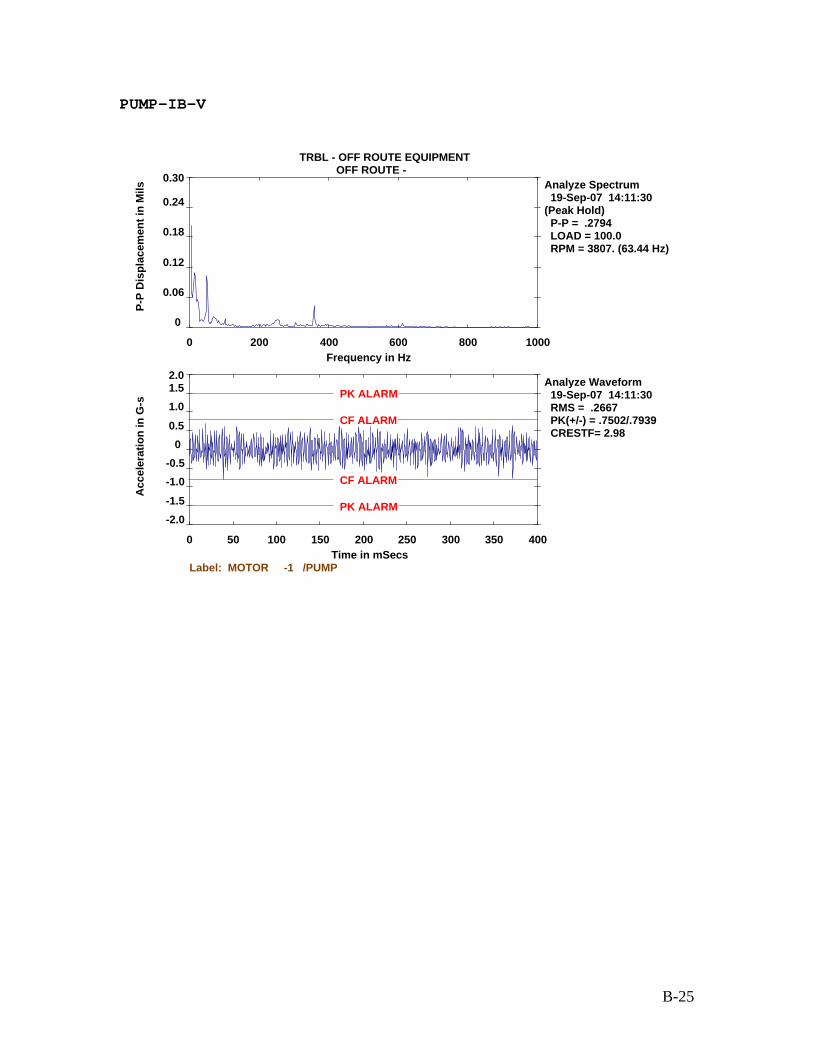
PUMP-IB-V
TRBL - OFF ROUTE EQUIPMENTOFF ROUTE -
0.30
Analyze Waveform 19-Sep-07 14:11:30 RMS = .2667 PK(+/-) = .7502/.7939 CRESTF= 2.98
0 50 100 150 200 250 300 350 400
-2.0-1.5
-1.0-0.5
0 0.5
1.01.52.0
Time in mSecs
Acc
eler
atio
n in
G-s
CF ALARM
CF ALARM
PK ALARM
PK ALARM
Label: MOTOR -1 /PUMP
Analyze Spectrum 19-Sep-07 14:11:30 (Peak Hold) P-P = .2794 LOAD = 100.0 RPM = 3807. (63.44 Hz)
0 200 400 600 800
0.24
0.18
1000
0
0.06
0.12
Frequency in Hz
P-P
Dis
plac
emen
t in
Mils
B-25

PUMP-IB-AX
TRBL - OFF ROUTE EQUIPMENTOFF ROUTE -
Analyze Waveform 19-Sep-07 14:12:21 RMS = .1890 PK(+/-) = .6485/.5461 CRESTF= 3.43
0 50 100 150 200 250 300 350 400
-2.0-1.5
-1.0-0.5
0 0.5
1.01.52.0
Time in mSecs
Acc
eler
atio
n in
G-s
CF ALARM
CF ALARM
PK ALARM
PK ALARM
Label: MOTOR -1 /PUMP
Analyze Spectrum 19-Sep-07 14:12:21 (Peak Hold) P-P = .8656 LOAD = 100.0 RPM = 3848. (64.13 Hz)
0 200 400 600 800 1000
0 0.1
0.20.30.40.5
0.60.70.8
Frequency in Hz
P-P
Dis
plac
emen
t in
Mils
B-26

PUMP-OB-H
TRBL - OFF ROUTE EQUIPMENTOFF ROUTE -
1.8
Analyze Waveform 19-Sep-07 14:13:37 RMS = .1354 PK(+/-) = .3977/.4009 CRESTF= 2.96
0 50 100 150 200 250 300 350 400
-2.0-1.5
-1.0-0.5
0 0.5
1.01.52.0
Time in mSecs
Acc
eler
atio
n in
G-s
CF ALARM
CF ALARM
PK ALARM
PK ALARM
Label: MOTOR -1 /PUMP
Analyze Spectrum 19-Sep-07 14:13:37 (Peak Hold) P-P = 1.37 LOAD = 100.0 RPM = 3435. (57.24 Hz)
0 200 400 600 800
1.5
1000
0
0.3
0.6
0.9
1.2
Frequency in Hz
P-P
Dis
plac
emen
t in
Mils
B-27
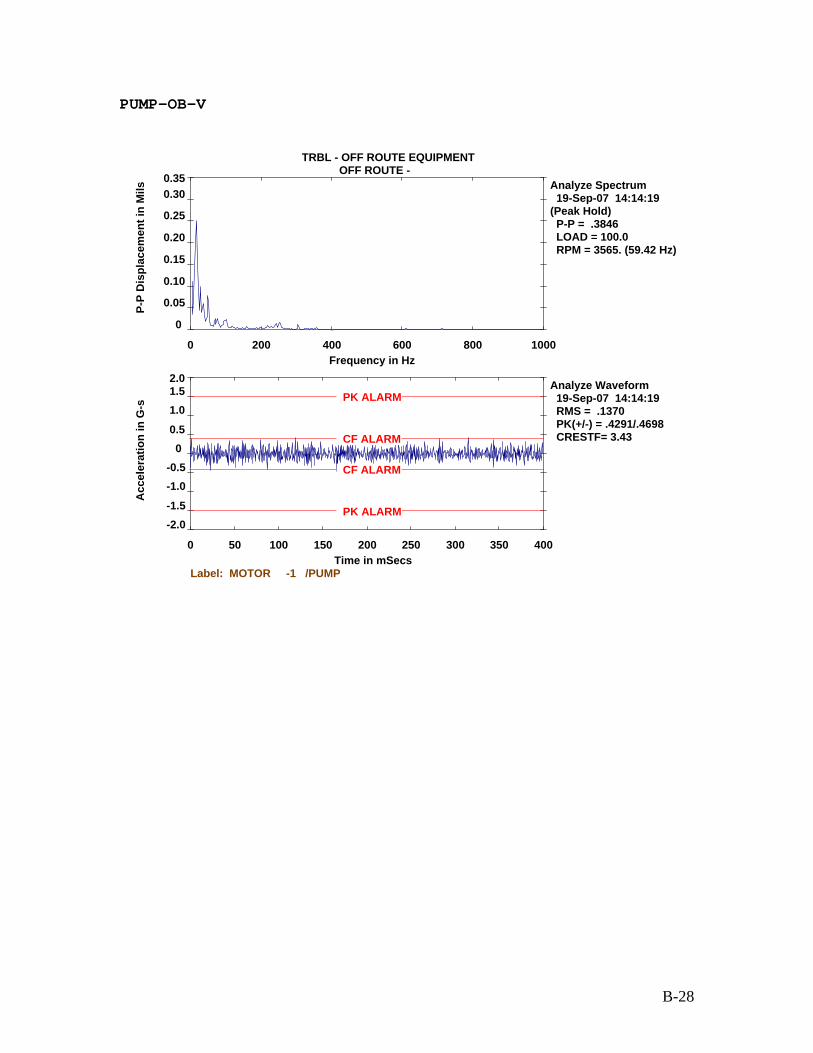
PUMP-OB-V
TRBL - OFF ROUTE EQUIPMENTOFF ROUTE -
0.35
Analyze Waveform 19-Sep-07 14:14:19 RMS = .1370 PK(+/-) = .4291/.4698 CRESTF= 3.43
0 50 100 150 200 250 300 350 400
-2.0-1.5
-1.0-0.5
0 0.5
1.01.52.0
Time in mSecs
Acc
eler
atio
n in
G-s
CF ALARM
CF ALARM
PK ALARM
PK ALARM
Label: MOTOR -1 /PUMP
Analyze Spectrum 19-Sep-07 14:14:19 (Peak Hold) P-P = .3846 LOAD = 100.0 RPM = 3565. (59.42 Hz)
0 200 400 600 800
0.30
0.25
1000
0
0.05
0.10
0.15
0.20
Frequency in Hz
P-P
Dis
plac
emen
t in
Mils
B-28

PUMP-OB-AX
TRBL - OFF ROUTE EQUIPMENTOFF ROUTE -
0.6
Analyze Waveform 19-Sep-07 14:15:08 RMS = .2056 PK(+/-) = .6412/.6109 CRESTF= 3.12
0 50 100 150 200 250 300 350 400
-2.0-1.5
-1.0-0.5
0 0.5
1.01.52.0
Time in mSecs
Acc
eler
atio
n in
G-s
CF ALARM
CF ALARM
PK ALARM
PK ALARM
Label: MOTOR -1 /PUMP
Analyze Spectrum 19-Sep-07 14:15:08 (Peak Hold) P-P = .6657 LOAD = 100.0 RPM = 3418. (56.97 Hz)
0 200 400 600 800
0.5
0.4
1000
0
0.1
0.2
0.3
Frequency in Hz
P-P
Dis
plac
emen
t in
Mils
B-29

MOTOR-NE CORNER SKID AT SKID BOLT-VERT
TRBL - OFF ROUTE EQUIPMENTOFF ROUTE -
Analyze Waveform 19-Sep-07 14:18:14 RMS = .0711 PK(+/-) = .2214/.2075 CRESTF= 3.11
0 50 100 150 200 250 300 350 400
-2.0-1.5
-1.0-0.5
0 0.5
1.01.52.0
Time in mSecs
Acc
eler
atio
n in
G-s
CF ALARM CF ALARM
PK ALARM
PK ALARM
Label: MOTOR -1 /PUMP
Analyze Spectrum 19-Sep-07 14:18:14 (Peak Hold) P-P = .4651 LOAD = 100.0 RPM = 3408. (56.80 Hz)
0 200 400 600 800 1000
0 0.05
0.100.150.200.25
0.300.350.40
Frequency in Hz
P-P
Dis
plac
emen
t in
Mils
B-30

Discharge Line Ring Anchor Wedge – Horiz E-W
TRBL - OFF ROUTE EQUIPMENTOFF ROUTE -
Analyze Waveform 19-Sep-07 14:19:28 RMS = .1315 PK(+/-) = .3660/.4078 CRESTF= 3.10
0 50 100 150 200 250 300 350 400
-2.0-1.5
-1.0-0.5
0 0.5
1.01.52.0
Time in mSecs
Acc
eler
atio
n in
G-s
CF ALARM
CF ALARM
PK ALARM
PK ALARM
Label: MOTOR -1 /PUMP
Analyze Spectrum 19-Sep-07 14:19:28 (Peak Hold) P-P = 5.48 LOAD = 100.0 RPM = 3638. (60.63 Hz)
0 200 400 600 800
6
5
4
1000
0
1
2
3
Frequency in Hz
P-P
Dis
plac
emen
t in
Mils
B-31

Discharge Line Ring Anchor Wedge – Horiz N-S
TRBL - OFF ROUTE EQUIPMENTOFF ROUTE -
Analyze Waveform 19-Sep-07 14:20:04 RMS = .1684 PK(+/-) = .5904/.4511 CRESTF= 3.51
0 50 100 150 200 250 300 350 400
-2.0-1.5
-1.0-0.5
0 0.5
1.01.52.0
Time in mSecs
Acc
eler
atio
n in
G-s
CF ALARM
CF ALARM
PK ALARM
PK ALARM
Label: MOTOR -1 /PUMP
Analyze Spectrum 19-Sep-07 14:20:04 (Peak Hold) P-P = 2.75 LOAD = 100.0 RPM = 3669. (61.14 Hz)
0 200 400 600 800 1000
0 0.30.60.91.21.51.82.12.4
Frequency in Hz
P-P
Dis
plac
emen
t in
Mils
B-32
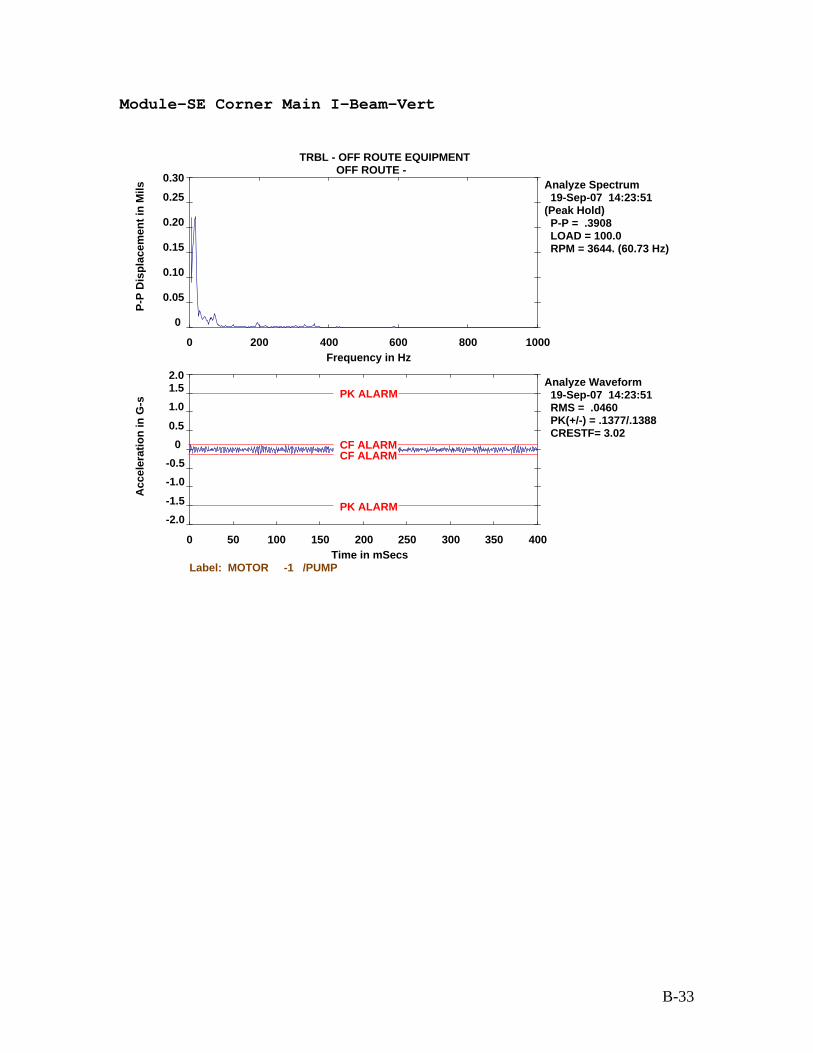
Module-SE Corner Main I-Beam-Vert
TRBL - OFF ROUTE EQUIPMENTOFF ROUTE -
0.30
Analyze Waveform 19-Sep-07 14:23:51 RMS = .0460 PK(+/-) = .1377/.1388 CRESTF= 3.02
0 50 100 150 200 250 300 350 400
-2.0-1.5
-1.0-0.5
0 0.5
1.01.52.0
Time in mSecs
Acc
eler
atio
n in
G-s
CF ALARM CF ALARM
PK ALARM
PK ALARM
Label: MOTOR -1 /PUMP
Analyze Spectrum 19-Sep-07 14:23:51 (Peak Hold) P-P = .3908 LOAD = 100.0 RPM = 3644. (60.73 Hz)
0 200 400 600 800
0.25
0.20
1000
0
0.05
0.10
0.15
Frequency in Hz
P-P
Dis
plac
emen
t in
Mils
B-33

Module-SE Corner Main I-Beam-Horiz N-S
TRBL - OFF ROUTE EQUIPMENTOFF ROUTE -
1.2
Analyze Waveform 19-Sep-07 14:24:16 RMS = .0275 PK(+/-) = .0821/.0869 CRESTF= 3.16
0 50 100 150 200 250 300 350 400
-2.0-1.5
-1.0-0.5
0 0.5
1.01.52.0
Time in mSecs
Acc
eler
atio
n in
G-s
CF ALARM CF ALARM
PK ALARM
PK ALARM
Label: MOTOR -1 /PUMP
Analyze Spectrum 19-Sep-07 14:24:16 (Peak Hold) P-P = .8568 LOAD = 100.0 RPM = 3955. (65.92 Hz)
0 200 400 600 800
0.9
1000
0
0.3
0.6
Frequency in Hz
P-P
Dis
plac
emen
t in
Mils
B-34

Module-SE Corner Main I-Beam-Horiz- E-W
TRBL - OFF ROUTE EQUIPMENTOFF ROUTE -
Analyze Waveform 19-Sep-07 14:25:12 RMS = .0283 PK(+/-) = .0915/.0893 CRESTF= 3.23
0 50 100 150 200 250 300 350 400
-2.0-1.5
-1.0-0.5
0 0.5
1.01.52.0
Time in mSecs
Acc
eler
atio
n in
G-s
CF ALARM CF ALARM
PK ALARM
PK ALARM
Label: MOTOR -1 /PUMP
Analyze Spectrum 19-Sep-07 14:25:12 (Peak Hold) P-P = 1.09 LOAD = 100.0 RPM = 3600. (60.00 Hz)
0 200 400 600 800 1000
0 0.10.20.30.40.50.60.70.8
Frequency in Hz
P-P
Dis
plac
emen
t in
Mils
B-35

Module-NE Corner Main I-Beam-Vert
TRBL - OFF ROUTE EQUIPMENTOFF ROUTE -
0.21
Analyze Waveform 19-Sep-07 14:26:19 RMS = .0330 PK(+/-) = .0814/.1013 CRESTF= 3.07
0 50 100 150 200 250 300 350 400
-2.0-1.5
-1.0-0.5
0 0.5
1.01.52.0
Time in mSecs
Acc
eler
atio
n in
G-s
CF ALARM CF ALARM
PK ALARM
PK ALARM
Label: MOTOR -1 /PUMP
Analyze Spectrum 19-Sep-07 14:26:19 (Peak Hold) P-P = .2697 LOAD = 100.0 RPM = 3600. (60.00 Hz)
0 200 400 600 800
0.18
0.15
1000
0
0.03
0.06
0.09
0.12
Frequency in Hz
P-P
Dis
plac
emen
t in
Mils
B-36

Module-NE Corner Main I-Beam-Horiz-Vert
TRBL - OFF ROUTE EQUIPMENTOFF ROUTE -
0.30
Analyze Waveform 19-Sep-07 14:27:02 RMS = .0279 PK(+/-) = .0772/.0853 CRESTF= 3.05
0 50 100 150 200 250 300 350 400
-2.0-1.5
-1.0-0.5
0 0.5
1.01.52.0
Time in mSecs
Acc
eler
atio
n in
G-s
CF ALARM CF ALARM
PK ALARM
PK ALARM
Label: MOTOR -1 /PUMP
Analyze Spectrum 19-Sep-07 14:27:02 (Peak Hold) P-P = .3991 LOAD = 100.0 RPM = 3800. (63.33 Hz)
0 200 400 600 800
0.25
1000
0
0.05
0.10
0.15
0.20
Frequency in Hz
P-P
Dis
plac
emen
t in
Mils
B-37

Module-NE Corner Main I-Beam-Horiz-N-S
TRBL - OFF ROUTE EQUIPMENTOFF ROUTE -
Analyze Waveform 19-Sep-07 14:27:53 RMS = .0444 PK(+/-) = .1481/.1542 CRESTF= 3.47
0 50 100 150 200 250 300 350 400
-2.0-1.5
-1.0-0.5
0 0.5
1.01.52.0
Time in mSecs
Acc
eler
atio
n in
G-s
CF ALARM CF ALARM
PK ALARM
PK ALARM
Label: MOTOR -1 /PUMP
Analyze Spectrum 19-Sep-07 14:27:53 (Peak Hold) P-P = .7972 LOAD = 100.0 RPM = 3948. (65.80 Hz)
0 200 400 600 800 1000
0 0.10.20.30.40.50.60.70.8
Frequency in Hz
P-P
Dis
plac
emen
t in
Mils
B-38

Module-Middle Main I-Beam-East Side-Vert
TRBL - OFF ROUTE EQUIPMENTOFF ROUTE -
1.0
Analyze Waveform 19-Sep-07 14:29:25 RMS = .0631 PK(+/-) = .1953/.2296 CRESTF= 3.64
0 50 100 150 200 250 300 350 400
-2.0-1.5
-1.0-0.5
0 0.5
1.01.52.0
Time in mSecs
Acc
eler
atio
n in
G-s
CF ALARM CF ALARM
PK ALARM
PK ALARM
Label: MOTOR -1 /PUMP
Analyze Spectrum 19-Sep-07 14:29:25 (Peak Hold) P-P = 1.13 LOAD = 100.0 RPM = 3672. (61.20 Hz)
0 200 400 600 800
0.8
1000
0
0.2
0.4
0.6
Frequency in Hz
P-P
Dis
plac
emen
t in
Mils
B-39
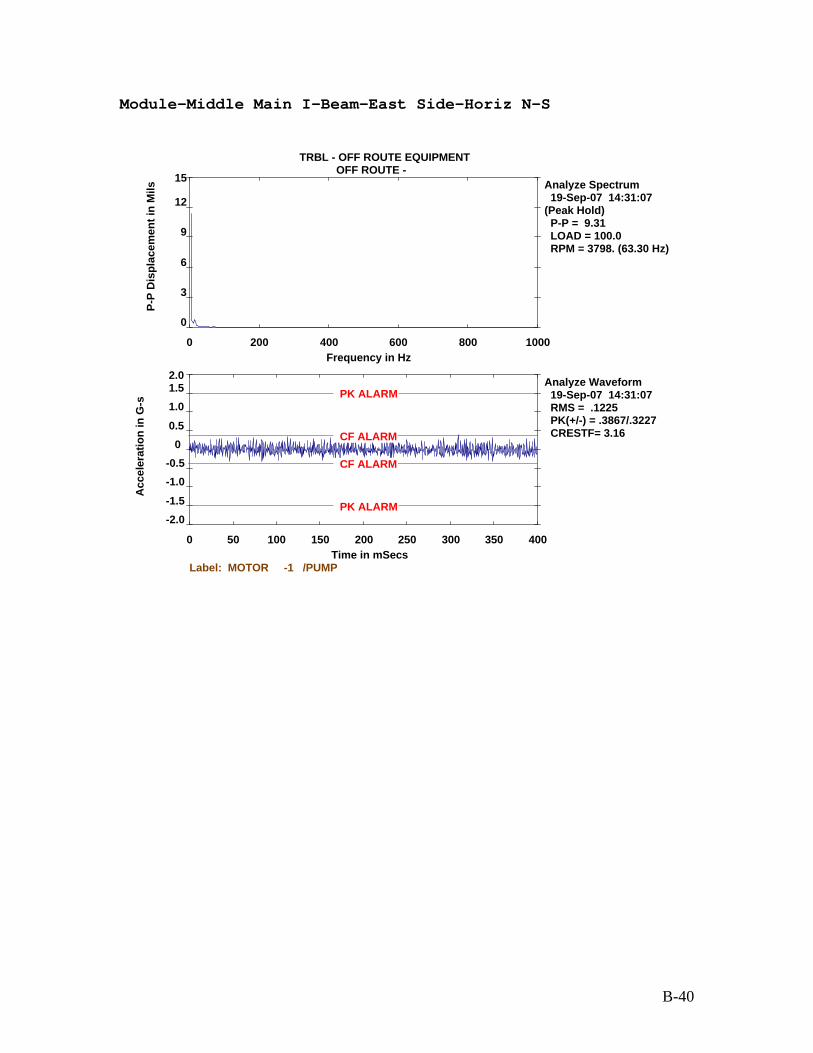
Module-Middle Main I-Beam-East Side-Horiz N-S
TRBL - OFF ROUTE EQUIPMENTOFF ROUTE -
Analyze Waveform 19-Sep-07 14:31:07 RMS = .1225 PK(+/-) = .3867/.3227 CRESTF= 3.16
0 50 100 150 200 250 300 350 400
-2.0-1.5
-1.0-0.5
0 0.5
1.01.52.0
Time in mSecs
Acc
eler
atio
n in
G-s
CF ALARM
CF ALARM
PK ALARM
PK ALARM
Label: MOTOR -1 /PUMP
Analyze Spectrum 19-Sep-07 14:31:07 (Peak Hold) P-P = 9.31 LOAD = 100.0 RPM = 3798. (63.30 Hz)
0 200 400 600 800
15
12
1000
0
3
6
9
Frequency in Hz
P-P
Dis
plac
emen
t in
Mils
B-40

Pump #3 Suction Line at Ring Anchor-Hori-E-W
TRBL - OFF ROUTE EQUIPMENTOFF ROUTE -
2.1
Analyze Waveform 19-Sep-07 14:32:49 RMS = .0861 PK(+/-) = .2217/.2963 CRESTF= 3.44
0 50 100 150 200 250 300 350 400
-2.0-1.5
-1.0-0.5
0 0.5
1.01.52.0
Time in mSecs
Acc
eler
atio
n in
G-s
CF ALARM
CF ALARM
PK ALARM
PK ALARM
Label: MOTOR -1 /PUMP
Analyze Spectrum 19-Sep-07 14:32:49 (Peak Hold) P-P = 2.64 LOAD = 100.0 RPM = 3920. (65.34 Hz)
0 200 400 600 800
1.8
1.5
1000
0
0.3
0.6
0.9
1.2
Frequency in Hz
P-P
Dis
plac
emen
t in
Mils
B-41
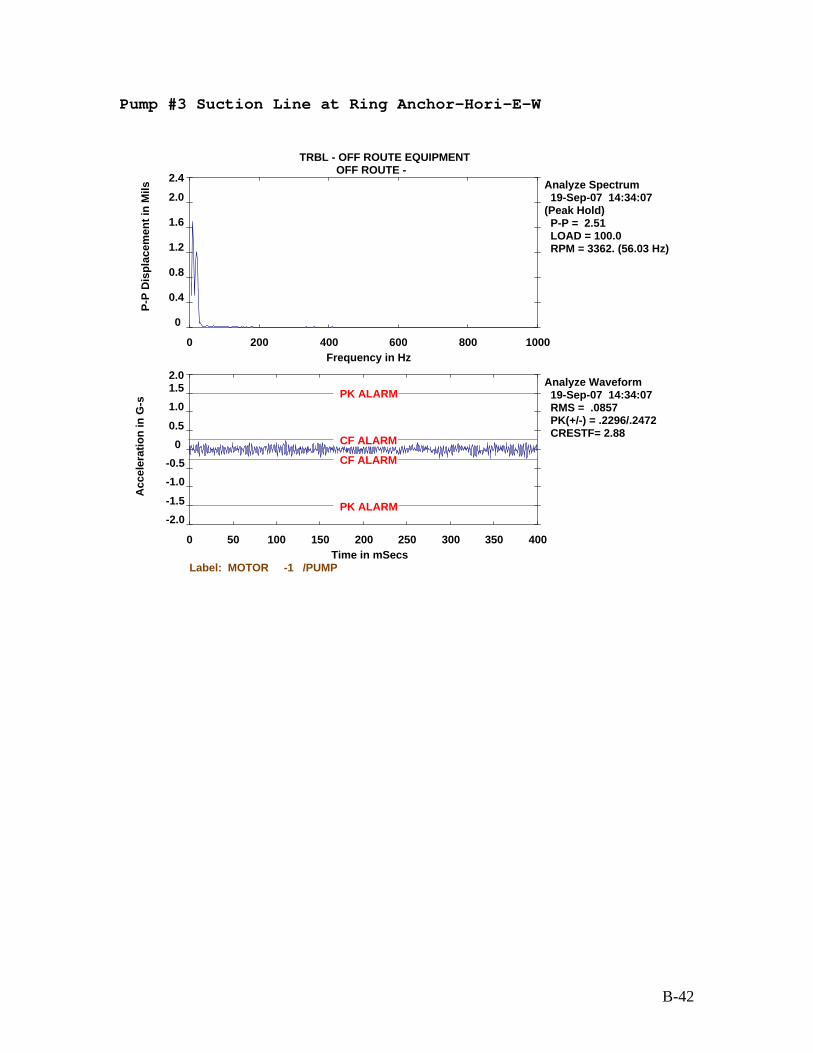
Pump #3 Suction Line at Ring Anchor-Hori-E-W
TRBL - OFF ROUTE EQUIPMENTOFF ROUTE -
2.4
Analyze Waveform 19-Sep-07 14:34:07 RMS = .0857 PK(+/-) = .2296/.2472 CRESTF= 2.88
0 50 100 150 200 250 300 350 400
-2.0-1.5
-1.0-0.5
0 0.5
1.01.52.0
Time in mSecs
Acc
eler
atio
n in
G-s
CF ALARM
CF ALARM
PK ALARM
PK ALARM
Label: MOTOR -1 /PUMP
Analyze Spectrum 19-Sep-07 14:34:07 (Peak Hold) P-P = 2.51 LOAD = 100.0 RPM = 3362. (56.03 Hz)
0 200 400 600 800
2.0
1.6
1000
0
0.4
0.8
1.2
Frequency in Hz
P-P
Dis
plac
emen
t in
Mils
B-42

Pump #3 Discharge Line at Ring Anchor-Hori-E-W
TRBL - OFF ROUTE EQUIPMENTOFF ROUTE -
Analyze Waveform 19-Sep-07 14:37:31 RMS = .1080 PK(+/-) = .3180/.3030 CRESTF= 2.94
0 50 100 150 200 250 300 350 400
-2.0-1.5
-1.0-0.5
0 0.5
1.01.52.0
Time in mSecs
Acc
eler
atio
n in
G-s
CF ALARM
CF ALARM
PK ALARM
PK ALARM
Label: MOTOR -1 /PUMP
Analyze Spectrum 19-Sep-07 14:37:31 (Peak Hold) P-P = 3.92 LOAD = 100.0 RPM = 3334. (55.56 Hz)
0 200 400 600 800
5
4
3
1000
0
1
2
Frequency in Hz
P-P
Dis
plac
emen
t in
Mils
B-43

Pump #3 Discharge Line at Ring Anchor-Vert
TRBL - OFF ROUTE EQUIPMENTOFF ROUTE -
3.0
Analyze Waveform 19-Sep-07 14:39:20 RMS = .3620 PK(+/-) = .9676/1.12 CRESTF= 3.09
0 50 100 150 200 250 300 350 400
-2.0-1.5
-1.0-0.5
0 0.5
1.01.52.0
Time in mSecs
Acc
eler
atio
n in
G-s CF ALARM
CF ALARM
PK ALARM
PK ALARM
Label: MOTOR -1 /PUMP
Analyze Spectrum 19-Sep-07 14:39:20 (Peak Hold) P-P = 3.02 LOAD = 100.0 RPM = 3690. (61.49 Hz)
0 200 400 600 800
2.5
2.0
1000
0
0.5
1.0
1.5
Frequency in Hz
P-P
Dis
plac
emen
t in
Mils
B-44

Pump #3 Discharge Line at Ring Anchor-Vert
TRBL - OFF ROUTE EQUIPMENTOFF ROUTE -
Label: MOTOR -1 /PUMP
Analyze Spectrum 19-Sep-07 14:39:32 (Peak Hold)
P-P = 3.05 LOAD = 100.0 RPM = 3941. (65.68 Hz)
0 200 400 600 800 1000
0
0.5
1.0
1.5
2.0
2.5
3.0
3.5
Frequency in Hz
P-P
Dis
plac
emen
t in
Mils
B-45

APPENDIX C: Vibration Acceleration Spectra

Discharge Ring Anchor- 1st Anchor Downstream-at Wedge
TRBL - OFF ROUTE EQUIPMENTOFF ROUTE -
0.12
Analyze Waveform 19-Sep-07 13:24:27 RMS = .1530 PK(+/-) = .4721/.5124 CRESTF= 3.35
0 50 100 150 200 250 300 350 400
-2.0-1.5
-1.0-0.5
0 0.5
1.01.52.0
Time in mSecs
Acc
eler
atio
n in
G-s
CF ALARM
CF ALARM
PK ALARM
PK ALARM
Label: MOTOR -1 /PUMP
Analyze Spectrum 19-Sep-07 13:24:27 (Peak Hold) RMS = .2038 LOAD = 100.0 RPM = 3569. (59.49 Hz)
0 200 400 600 800
0.09
1000
0
0.03
0.06
Frequency in Hz
RM
S A
ccel
erat
ion
in G
-s
Discharge Ring Anchor- 1st Anchor Downstream-Horiz
TRBL - OFF ROUTE EQUIPMENTOFF ROUTE -
0.14
Analyze Waveform 19-Sep-07 13:25:43 RMS = .1624 PK(+/-) = .4701/.4975 CRESTF= 3.06
0 50 100 150 200 250 300 350 400
-2.0-1.5
-1.0-0.5
0 0.5
1.01.52.0
Time in mSecs
Acc
eler
atio
n in
G-s
CF ALARM
CF ALARM
PK ALARM
PK ALARM
Label: MOTOR -1 /PUMP
Analyze Spectrum 19-Sep-07 13:25:43 (Peak Hold) RMS = .2227 LOAD = 100.0 RPM = 3676. (61.27 Hz)
0 200 400 600 800
0.12
0.10
1000
0
0.02
0.04
0.06
0.08
Frequency in Hz
RM
S A
ccel
erat
ion
in G
-s
C-1

Discharge Ring Anchor- 1st Anchor Downstream-Axial
TRBL - OFF ROUTE EQUIPMENTOFF ROUTE -
0.10
Analyze Waveform 19-Sep-07 13:27:12 RMS = .1479 PK(+/-) = .4204/.4271 CRESTF= 2.89
0 50 100 150 200 250 300 350 400
-2.0-1.5
-1.0-0.5
0 0.5
1.01.52.0
Time in mSecs
Acc
eler
atio
n in
G-s
CF ALARM
CF ALARM
PK ALARM
PK ALARM
Label: MOTOR -1 /PUMP
Analyze Spectrum 19-Sep-07 13:27:12 (Peak Hold) RMS = .2024 LOAD = 100.0 RPM = 3243. (54.04 Hz)
0 200 400 600 800
0.08
1000
0
0.02
0.04
0.06
Frequency in Hz
RM
S A
ccel
erat
ion
in G
-s
Discharge Ring Anchor- 1st Anchor Downstream-Vert
TRBL - OFF ROUTE EQUIPMENTOFF ROUTE -
0.10
Analyze Waveform 19-Sep-07 13:30:04 RMS = .1505 PK(+/-) = .5307/.4723 CRESTF= 3.53
0 50 100 150 200 250 300 350 400
-2.0-1.5
-1.0-0.5
0 0.5
1.01.52.0
Time in mSecs
Acc
eler
atio
n in
G-s
CF ALARM
CF ALARM
PK ALARM
PK ALARM
Label: MOTOR -1 /PUMP
Analyze Spectrum 19-Sep-07 13:30:04 (Peak Hold) RMS = .1899 LOAD = 100.0 RPM = 3468. (57.80 Hz)
0 200 400 600 800
0.08
1000
0
0.02
0.04
0.06
Frequency in Hz
RM
S A
ccel
erat
ion
in G
-s
C-2

Discharge Ring Anchor- 1st Anchor Downstream-Frame TRBL - OFF ROUTE EQUIPMENT
OFF ROUTE -0.6
Analyze Waveform 19-Sep-07 13:33:21 RMS = .5297 PK(+/-) = 1.53/1.60 CRESTF= 3.03
0 50 100 150 200 250 300 350 400
-2.0-1.6-1.2-0.8-0.40.00.40.81.21.6
Time in mSecs
Acc
eler
atio
n in
G-s
CF ALARM
CF ALARM
PK ALARM
PK ALARM
Label: MOTOR -1 /PUMP
Analyze Spectrum 19-Sep-07 13:33:21 (Peak Hold) RMS = .7018 LOAD = 100.0 RPM = 3768. (62.79 Hz)
0 200 400 600 800
0.5
0.4
1000
0
0.1
0.2
0.3
Frequency in Hz
RM
S A
ccel
erat
ion
in G
-s
Discharge Line Guide
Analyze Waveform 19-Sep-07 13:37:35 RMS = .6680 PK(+/-) = 1.26/1.80 CRESTF= 2.69
0 50 100 150 200 250 300 350 400
-3
-2
-1
0
1
2
3
Time in mSecs
Acc
eler
atio
n in
G-s
TRBL - OFF ROUTE EQUIPMENTOFF ROUTE -
CF ALARM
CF ALARM
PK ALARM
PK ALARM
Label: MOTOR -1 /PUMP
Analyze Spectrum 19-Sep-07 13:37:35 (Peak Hold) RMS = .7473 LOAD = 100.0 RPM = 3678. (61.30 Hz)
0 200 400 600 800 1000
0 0.1
0.20.30.40.5
0.60.70.8
Frequency in Hz
RM
S A
ccel
erat
ion
in G
-s
C-3

Cantilever frame brace TRBL - OFF ROUTE EQUIPMENT
OFF ROUTE -
Analyze Waveform 19-Sep-07 13:39:24 RMS = .5054 PK(+/-) = 1.37/1.26 CRESTF= 2.70
0 50 100 150 200 250 300 350 400
-2.0-1.5
-1.0-0.5
0 0.5
1.01.52.0
Time in mSecs
Acc
eler
atio
n in
G-s
CF ALARM
CF ALARM
PK ALARM
PK ALARM
Label: MOTOR -1 /PUMP
Analyze Spectrum 19-Sep-07 13:39:24 (Peak Hold) RMS = .5601 LOAD = 100.0 RPM = 3434. (57.23 Hz)
0 200 400 600 800 1000
0 0.05
0.100.150.200.25
0.300.350.40
Frequency in Hz
RM
S A
ccel
erat
ion
in G
-s
Post reading
TRBL - OFF ROUTE EQUIPMENTOFF ROUTE -
0.06
Analyze Waveform 19-Sep-07 13:42:17 RMS = .0792 PK(+/-) = .2642/.2773 CRESTF= 3.50
0 50 100 150 200 250 300 350 400
-2.0-1.5
-1.0-0.5
0 0.5
1.01.52.0
Time in mSecs
Acc
eler
atio
n in
G-s
CF ALARM CF ALARM
PK ALARM
PK ALARM
Label: MOTOR -1 /PUMP
Analyze Spectrum 19-Sep-07 13:42:17 RMS = .0807 LOAD = 100.0 RPM = 3675. (61.24 Hz)
0 200 400 600 800
0.05
0.04
1000
0
0.01
0.02
0.03
Frequency in Hz
RM
S A
ccel
erat
ion
in G
-s
C-4

Suction Line at Ring Anchor-Vert TRBL - OFF ROUTE EQUIPMENT
OFF ROUTE -0.05
Analyze Waveform 19-Sep-07 13:44:18 RMS = .0867 PK(+/-) = .2758/.3100 CRESTF= 3.58
0 50 100 150 200 250 300 350 400
-2.0-1.5
-1.0-0.5
0 0.5
1.01.52.0
Time in mSecs
Acc
eler
atio
n in
G-s
CF ALARM
CF ALARM
PK ALARM
PK ALARM
Label: MOTOR -1 /PUMP
Analyze Spectrum 19-Sep-07 13:44:18 RMS = .0822 LOAD = 100.0 RPM = 3673. (61.21 Hz)
0 200 400 600 800
0.04
1000
0
0.01
0.02
0.03
Frequency in Hz
RM
S A
ccel
erat
ion
in G
-s
Suction Line at Ring Anchor-Horiz
TRBL - OFF ROUTE EQUIPMENTOFF ROUTE -
0.05
Analyze Waveform 19-Sep-07 13:44:44 RMS = .0877 PK(+/-) = .2287/.2740 CRESTF= 3.13
0 50 100 150 200 250 300 350 400
-2.0-1.5
-1.0-0.5
0 0.5
1.01.52.0
Time in mSecs
Acc
eler
atio
n in
G-s
CF ALARM
CF ALARM
PK ALARM
PK ALARM
Label: MOTOR -1 /PUMP
Analyze Spectrum 19-Sep-07 13:44:44 RMS = .0862 LOAD = 100.0 RPM = 3680. (61.33 Hz)
0 200 400 600 800
0.04
1000
0
0.01
0.02
0.03
Frequency in Hz
RM
S A
ccel
erat
ion
in G
-s
C-5
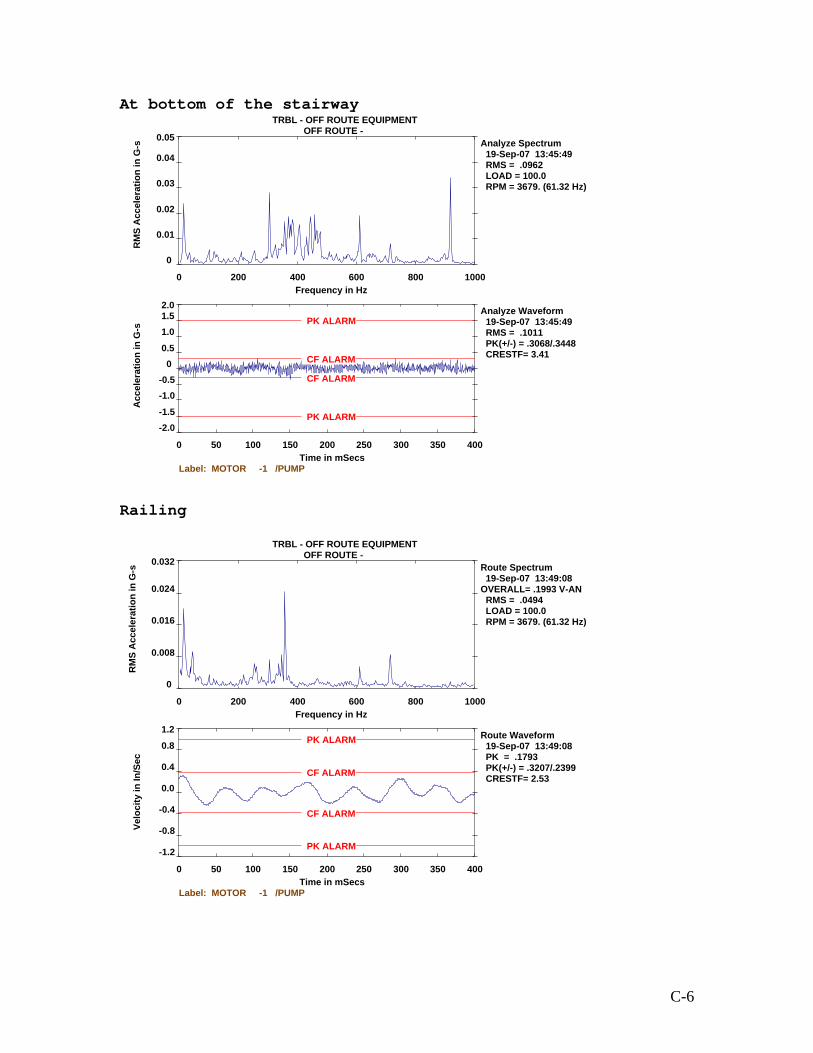
At bottom of the stairway TRBL - OFF ROUTE EQUIPMENT
OFF ROUTE -0.05
Analyze Waveform 19-Sep-07 13:45:49 RMS = .1011 PK(+/-) = .3068/.3448 CRESTF= 3.41
0 50 100 150 200 250 300 350 400
-2.0-1.5
-1.0-0.5
0 0.5
1.01.52.0
Time in mSecs
Acc
eler
atio
n in
G-s
CF ALARM
CF ALARM
PK ALARM
PK ALARM
Label: MOTOR -1 /PUMP
Analyze Spectrum 19-Sep-07 13:45:49 RMS = .0962 LOAD = 100.0 RPM = 3679. (61.32 Hz)
0 200 400 600 800
0.04
1000
0
0.01
0.02
0.03
Frequency in Hz
RM
S A
ccel
erat
ion
in G
-s
Railing
TRBL - OFF ROUTE EQUIPMENTOFF ROUTE -
0.032
Route Waveform 19-Sep-07 13:49:08 PK = .1793 PK(+/-) = .3207/.2399 CRESTF= 2.53
0 50 100 150 200 250 300 350 400
-1.2
-0.8
-0.4
0.0
0.4
0.8
1.2
Time in mSecs
Velo
city
in In
/Sec
CF ALARM
CF ALARM
PK ALARM
PK ALARM
Label: MOTOR -1 /PUMP
Route Spectrum 19-Sep-07 13:49:08 OVERALL= .1993 V-AN RMS = .0494 LOAD = 100.0 RPM = 3679. (61.32 Hz)
0 200 400 600 800
0.024
1000
0
0.008
0.016
Frequency in Hz
RM
S A
ccel
erat
ion
in G
-s
C-6

At Stair TRBL - OFF ROUTE EQUIPMENT
OFF ROUTE -0.06
Analyze Waveform 19-Sep-07 13:49:31 RMS = .0434 PK(+/-) = .1329/.1384 CRESTF= 3.19
0 50 100 150 200 250 300 350 400
-2.0-1.5
-1.0-0.5
0 0.5
1.01.52.0
Time in mSecs
Acc
eler
atio
n in
G-s
CF ALARM CF ALARM
PK ALARM
PK ALARM
Label: MOTOR -1 /PUMP
Analyze Spectrum 19-Sep-07 13:49:31 (Peak Hold) RMS = .0658 LOAD = 100.0 RPM = 3476. (57.93 Hz)
0 200 400 600 800
0.05
0.04
1000
0
0.01
0.02
0.03
Frequency in Hz
RM
S A
ccel
erat
ion
in G
-s
At Drag Valve-Vert
TRBL - OFF ROUTE EQUIPMENTOFF ROUTE -
Analyze Waveform 19-Sep-07 13:58:13 RMS = .1124 PK(+/-) = .3521/.2690 CRESTF= 3.13
0 50 100 150 200 250 300 350 400
-2.0-1.5
-1.0-0.5
0 0.5
1.01.52.0
Time in mSecs
Acc
eler
atio
n in
G-s
CF ALARM
CF ALARM
PK ALARM
PK ALARM
Label: MOTOR -1 /PUMP
Analyze Spectrum 19-Sep-07 13:58:13 (Peak Hold) RMS = .1574 LOAD = 100.0 RPM = 3922. (65.36 Hz)
0 200 400 600 800 1000
0 0.01
0.020.030.040.050.06
0.070.08
Frequency in Hz
RM
S A
ccel
erat
ion
in G
-s
C-7

At Drag Valve-Horiz TRBL - OFF ROUTE EQUIPMENT
OFF ROUTE -0.12
Analyze Waveform 19-Sep-07 13:59:15 RMS = .0822 PK(+/-) = .2542/.2603 CRESTF= 3.17
0 50 100 150 200 250 300 350 400
-2.0-1.5
-1.0-0.5
0 0.5
1.01.52.0
Time in mSecs
Acc
eler
atio
n in
G-s
CF ALARM CF ALARM
PK ALARM
PK ALARM
Label: MOTOR -1 /PUMP
Analyze Spectrum 19-Sep-07 13:59:15 (Peak Hold) RMS = .1246 LOAD = 100.0 RPM = 3256. (54.27 Hz)
0 200 400 600 800
0.09
1000
0
0.03
0.06
Frequency in Hz
RM
S A
ccel
erat
ion
in G
-s
At Drag Valve-Axial
TRBL - OFF ROUTE EQUIPMENTOFF ROUTE -
0.032
Analyze Waveform 19-Sep-07 14:00:14 RMS = .0669 PK(+/-) = .2125/.2498 CRESTF= 3.74
0 50 100 150 200 250 300 350 400
-2.0-1.5
-1.0-0.5
0 0.5
1.01.52.0
Time in mSecs
Acc
eler
atio
n in
G-s
CF ALARM CF ALARM
PK ALARM
PK ALARM
Label: MOTOR -1 /PUMP
Analyze Spectrum 19-Sep-07 14:00:14 (Peak Hold) RMS = .0813 LOAD = 100.0 RPM = 3600. (60.00 Hz)
0 200 400 600 800
0.024
1000
0
0.008
0.016
Frequency in Hz
RM
S A
ccel
erat
ion
in G
-s
C-8

Recycle Line Support
TRBL - OFF ROUTE EQUIPMENTOFF ROUTE -
0.20
Analyze Waveform 19-Sep-07 14:02:12 RMS = .2090 PK(+/-) = .5820/.6908 CRESTF= 3.30
0 50 100 150 200 250 300 350 400
-2.0-1.5
-1.0-0.5
0 0.5
1.01.52.0
Time in mSecs
Acc
eler
atio
n in
G-s
CF ALARM
CF ALARM
PK ALARM
PK ALARM
Label: MOTOR -1 /PUMP
Analyze Spectrum 19-Sep-07 14:02:12 (Peak Hold) RMS = .2651 LOAD = 100.0 RPM = 3570. (59.51 Hz)
0 200 400 600 800
0.15
1000
0
0.05
0.10
Frequency in Hz
RM
S A
ccel
erat
ion
in G
-s
Recycle Line Support-Horiz
TRBL - OFF ROUTE EQUIPMENTOFF ROUTE -
0.04
Analyze Waveform 19-Sep-07 14:02:47 RMS = .0894 PK(+/-) = .2552/.2592 CRESTF= 2.90
0 50 100 150 200 250 300 350 400
-2.0-1.5
-1.0-0.5
0 0.5
1.01.52.0
Time in mSecs
Acc
eler
atio
n in
G-s
CF ALARM
CF ALARM
PK ALARM
PK ALARM
Label: MOTOR -1 /PUMP
Analyze Spectrum 19-Sep-07 14:02:47 (Peak Hold) RMS = .1166 LOAD = 100.0 RPM = 3600. (60.00 Hz)
0 200 400 600 800
0.03
1000
0
0.01
0.02
Frequency in Hz
RM
S A
ccel
erat
ion
in G
-s
C-9

Motor-OB-VERT TRBL - OFF ROUTE EQUIPMENT
OFF ROUTE -0.024
Analyze Waveform 19-Sep-07 14:07:37 RMS = .0311 PK(+/-) = .0883/.0820 CRESTF= 2.84
0 50 100 150 200 250 300 350 400
-2.0-1.5
-1.0-0.5
0 0.5
1.01.52.0
Time in mSecs
Acc
eler
atio
n in
G-s
CF ALARM CF ALARM
PK ALARM
PK ALARM
Label: MOTOR -1 /PUMP
Analyze Spectrum 19-Sep-07 14:07:37 (Peak Hold) RMS = .0346 LOAD = 100.0 RPM = 3839. (63.99 Hz)
0 200 400 600 800
0.020
1000
0
0.004
0.008
0.012
0.016
Frequency in Hz
RM
S A
ccel
erat
ion
in G
-s
Motor-OB-H
TRBL - OFF ROUTE EQUIPMENTOFF ROUTE -
0.05
Analyze Waveform 19-Sep-07 14:08:18 RMS = .0480 PK(+/-) = .1515/.1348 CRESTF= 3.16
0 50 100 150 200 250 300 350 400
-2.0-1.5
-1.0-0.5
0 0.5
1.01.52.0
Time in mSecs
Acc
eler
atio
n in
G-s
CF ALARM CF ALARM
PK ALARM
PK ALARM
Label: MOTOR -1 /PUMP
Analyze Spectrum 19-Sep-07 14:08:18 (Peak Hold) RMS = .0531 LOAD = 100.0 RPM = 3924. (65.40 Hz)
0 200 400 600 800
0.04
1000
0
0.01
0.02
0.03
Frequency in Hz
RM
S A
ccel
erat
ion
in G
-s
C-10

Motor-IB-VERT TRBL - OFF ROUTE EQUIPMENT
OFF ROUTE -0.020
Analyze Waveform 19-Sep-07 14:09:29 RMS = .0304 PK(+/-) = .0779/.0999 CRESTF= 3.29
0 50 100 150 200 250 300 350 400
-2.0-1.5
-1.0-0.5
0 0.5
1.01.52.0
Time in mSecs
Acc
eler
atio
n in
G-s
CF ALARM CF ALARM
PK ALARM
PK ALARM
Label: MOTOR -1 /PUMP
Analyze Spectrum 19-Sep-07 14:09:29 (Peak Hold) RMS = .0330 LOAD = 100.0 RPM = 3670. (61.16 Hz)
0 200 400 600 800
0.015
1000
0
0.005
0.010
Frequency in Hz
RM
S A
ccel
erat
ion
in G
-s
Motor-IB-H
TRBL - OFF ROUTE EQUIPMENTOFF ROUTE -
0.030
Analyze Waveform 19-Sep-07 14:09:50 RMS = .0348 PK(+/-) = .1000/.1007 CRESTF= 2.90
0 50 100 150 200 250 300 350 400
-2.0-1.5
-1.0-0.5
0 0.5
1.01.52.0
Time in mSecs
Acc
eler
atio
n in
G-s
CF ALARM CF ALARM
PK ALARM
PK ALARM
Label: MOTOR -1 /PUMP
Analyze Spectrum 19-Sep-07 14:09:50 (Peak Hold) RMS = .0413 LOAD = 100.0 RPM = 3838. (63.97 Hz)
0 200 400 600 800
0.025
0.020
1000
0
0.005
0.010
0.015
Frequency in Hz
RM
S A
ccel
erat
ion
in G
-s
C-11

Motor-IB-AX
TRBL - OFF ROUTE EQUIPMENTOFF ROUTE -
0.05
Analyze Waveform 19-Sep-07 14:10:09 RMS = .0671 PK(+/-) = .1969/.2067 CRESTF= 3.08
0 50 100 150 200 250 300 350 400
-2.0-1.5
-1.0-0.5
0 0.5
1.01.52.0
Time in mSecs
Acc
eler
atio
n in
G-s
CF ALARM CF ALARM
PK ALARM
PK ALARM
Label: MOTOR -1 /PUMP
Analyze Spectrum 19-Sep-07 14:10:09 (Peak Hold) RMS = .0820 LOAD = 100.0 RPM = 3759. (62.65 Hz)
0 200 400 600 800
0.04
0.03
1000
0
0.01
0.02
Frequency in Hz
RM
S A
ccel
erat
ion
in G
-s
PUMP-IB-H
TRBL - OFF ROUTE EQUIPMENTOFF ROUTE -
0.24
Analyze Waveform 19-Sep-07 14:10:55 RMS = .2583 PK(+/-) = .8456/.7455 CRESTF= 3.27
0 50 100 150 200 250 300 350 400
-2.0-1.5
-1.0-0.5
0 0.5
1.01.52.0
Time in mSecs
Acc
eler
atio
n in
G-s
CF ALARM
CF ALARM
PK ALARM
PK ALARM
Label: MOTOR -1 /PUMP
Analyze Spectrum 19-Sep-07 14:10:55 (Peak Hold) RMS = .2898 LOAD = 100.0 RPM = 3573. (59.55 Hz)
0 200 400 600 800
0.20
1000
0
0.04
0.08
0.12
0.16
Frequency in Hz
RM
S A
ccel
erat
ion
in G
-s
C-12

PUMP-IB-V TRBL - OFF ROUTE EQUIPMENT
OFF ROUTE -0.30
Analyze Waveform 19-Sep-07 14:11:30 RMS = .2667 PK(+/-) = .7502/.7939 CRESTF= 2.98
0 50 100 150 200 250 300 350 400
-2.0-1.5
-1.0-0.5
0 0.5
1.01.52.0
Time in mSecs
Acc
eler
atio
n in
G-s
CF ALARM
CF ALARM
PK ALARM
PK ALARM
Label: MOTOR -1 /PUMP
Analyze Spectrum 19-Sep-07 14:11:30 (Peak Hold) RMS = .3156 LOAD = 100.0 RPM = 3807. (63.44 Hz)
0 200 400 600 800
0.24
1000
0
0.06
0.12
0.18
Frequency in Hz
RM
S A
ccel
erat
ion
in G
-s
PUMP-IB-AX
TRBL - OFF ROUTE EQUIPMENTOFF ROUTE -
0.14
Analyze Waveform 19-Sep-07 14:12:21 RMS = .1890 PK(+/-) = .6485/.5461 CRESTF= 3.43
0 50 100 150 200 250 300 350 400
-2.0-1.5
-1.0-0.5
0 0.5
1.01.52.0
Time in mSecs
Acc
eler
atio
n in
G-s
CF ALARM
CF ALARM
PK ALARM
PK ALARM
Label: MOTOR -1 /PUMP
Analyze Spectrum 19-Sep-07 14:12:21 (Peak Hold) RMS = .2183 LOAD = 100.0 RPM = 3848. (64.13 Hz)
0 200 400 600 800
0.12
0.10
1000
0
0.02
0.04
0.06
0.08
Frequency in Hz
RM
S A
ccel
erat
ion
in G
-s
C-13

PUMP-OB-H TRBL - OFF ROUTE EQUIPMENT
OFF ROUTE -0.10
Analyze Waveform 19-Sep-07 14:13:37 RMS = .1354 PK(+/-) = .3977/.4009 CRESTF= 2.96
0 50 100 150 200 250 300 350 400
-2.0-1.5
-1.0-0.5
0 0.5
1.01.52.0
Time in mSecs
Acc
eler
atio
n in
G-s
CF ALARM
CF ALARM
PK ALARM
PK ALARM
Label: MOTOR -1 /PUMP
Analyze Spectrum 19-Sep-07 14:13:37 (Peak Hold) RMS = .1646 LOAD = 100.0 RPM = 3435. (57.24 Hz)
0 200 400 600 800
0.08
0.06
1000
0
0.02
0.04
Frequency in Hz
RM
S A
ccel
erat
ion
in G
-s
PUMP-OB-V
TRBL - OFF ROUTE EQUIPMENTOFF ROUTE -
0.10
Analyze Waveform 19-Sep-07 14:14:19 RMS = .1370 PK(+/-) = .4291/.4698 CRESTF= 3.43
0 50 100 150 200 250 300 350 400
-2.0-1.5
-1.0-0.5
0 0.5
1.01.52.0
Time in mSecs
Acc
eler
atio
n in
G-s
CF ALARM
CF ALARM
PK ALARM
PK ALARM
Label: MOTOR -1 /PUMP
Analyze Spectrum 19-Sep-07 14:14:19 (Peak Hold) RMS = .1807 LOAD = 100.0 RPM = 3565. (59.42 Hz)
0 200 400 600 800
0.08
0.06
1000
0
0.02
0.04
Frequency in Hz
RM
S A
ccel
erat
ion
in G
-s
C-14
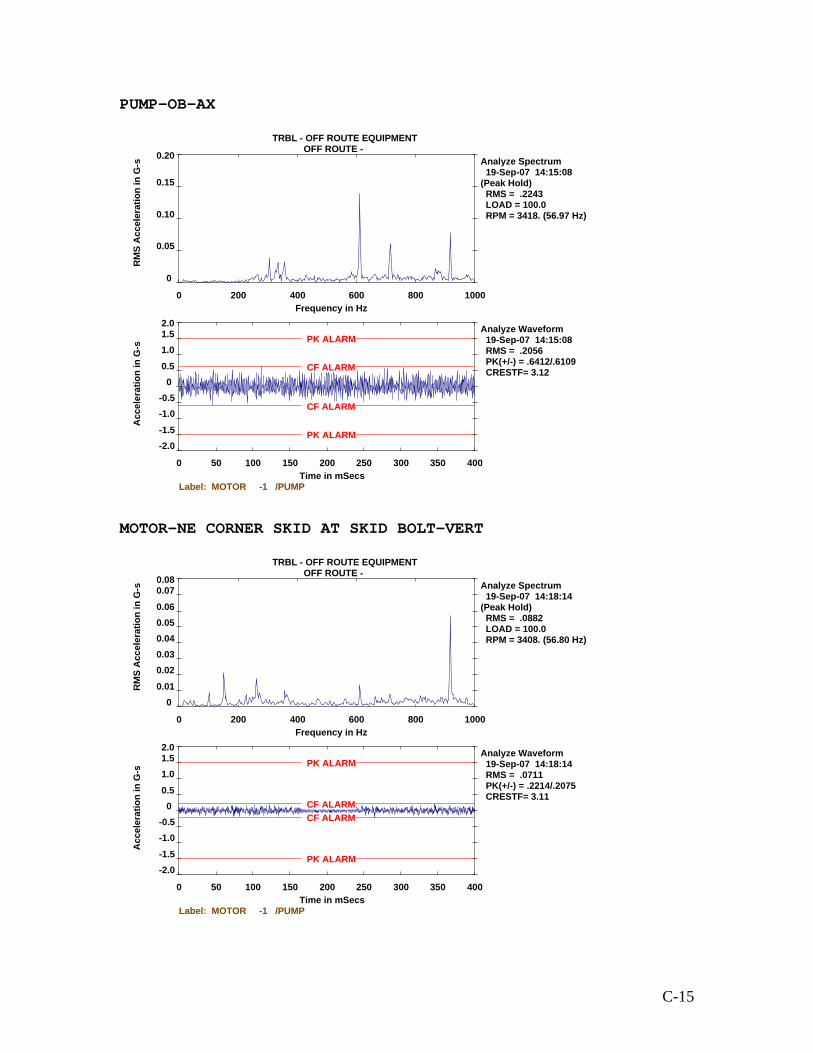
PUMP-OB-AX
TRBL - OFF ROUTE EQUIPMENTOFF ROUTE -
0.20
Analyze Waveform 19-Sep-07 14:15:08 RMS = .2056 PK(+/-) = .6412/.6109 CRESTF= 3.12
0 50 100 150 200 250 300 350 400
-2.0-1.5
-1.0-0.5
0 0.5
1.01.52.0
Time in mSecs
Acc
eler
atio
n in
G-s
CF ALARM
CF ALARM
PK ALARM
PK ALARM
Label: MOTOR -1 /PUMP
Analyze Spectrum 19-Sep-07 14:15:08 (Peak Hold) RMS = .2243 LOAD = 100.0 RPM = 3418. (56.97 Hz)
0 200 400 600 800
0.15
1000
0
0.05
0.10
Frequency in Hz
RM
S A
ccel
erat
ion
in G
-s
MOTOR-NE CORNER SKID AT SKID BOLT-VERT
TRBL - OFF ROUTE EQUIPMENTOFF ROUTE -
Analyze Waveform 19-Sep-07 14:18:14 RMS = .0711 PK(+/-) = .2214/.2075 CRESTF= 3.11
0 50 100 150 200 250 300 350 400
-2.0-1.5
-1.0-0.5
0 0.5
1.01.52.0
Time in mSecs
Acc
eler
atio
n in
G-s
CF ALARM CF ALARM
PK ALARM
PK ALARM
Label: MOTOR -1 /PUMP
Analyze Spectrum 19-Sep-07 14:18:14 (Peak Hold) RMS = .0882 LOAD = 100.0 RPM = 3408. (56.80 Hz)
0 200 400 600 800 1000
0 0.01
0.020.030.040.050.06
0.070.08
Frequency in Hz
RM
S A
ccel
erat
ion
in G
-s
C-15
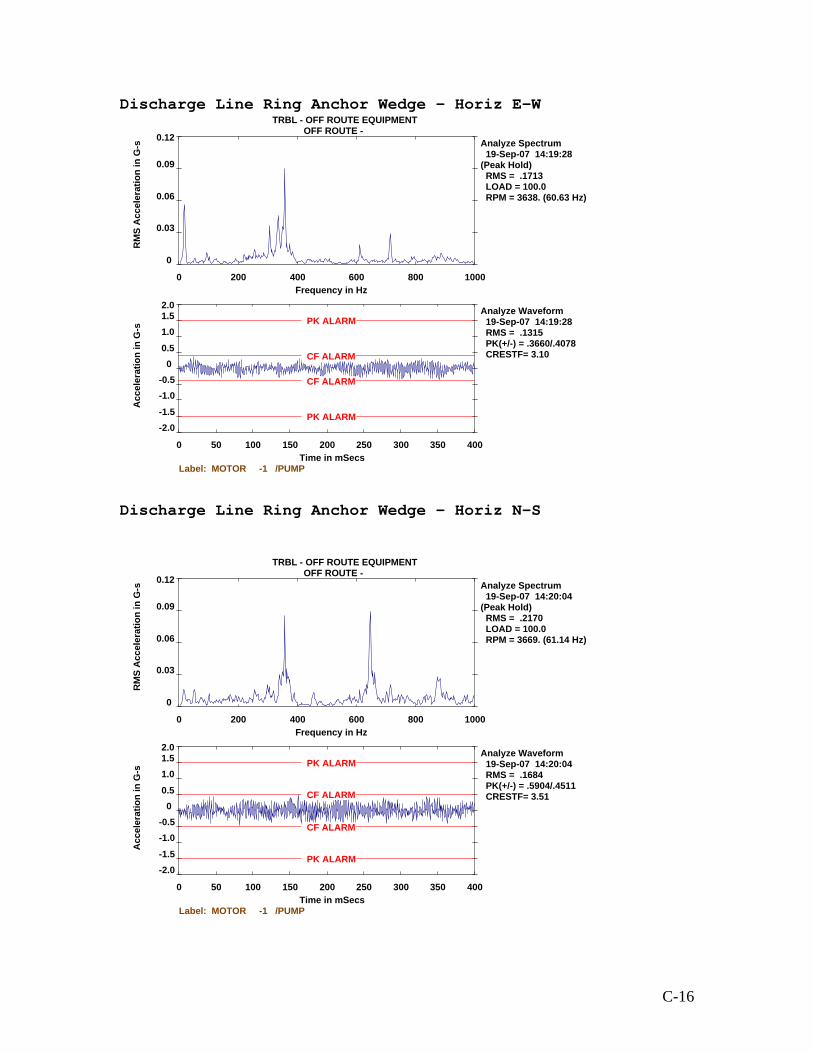
Discharge Line Ring Anchor Wedge – Horiz E-W TRBL - OFF ROUTE EQUIPMENT
OFF ROUTE -0.12
Analyze Waveform 19-Sep-07 14:19:28 RMS = .1315 PK(+/-) = .3660/.4078 CRESTF= 3.10
0 50 100 150 200 250 300 350 400
-2.0-1.5
-1.0-0.5
0 0.5
1.01.52.0
Time in mSecs
Acc
eler
atio
n in
G-s
CF ALARM
CF ALARM
PK ALARM
PK ALARM
Label: MOTOR -1 /PUMP
Analyze Spectrum 19-Sep-07 14:19:28 (Peak Hold) RMS = .1713 LOAD = 100.0 RPM = 3638. (60.63 Hz)
0 200 400 600 800
0.09
1000
0
0.03
0.06
Frequency in Hz
RM
S A
ccel
erat
ion
in G
-s
Discharge Line Ring Anchor Wedge – Horiz N-S
TRBL - OFF ROUTE EQUIPMENTOFF ROUTE -
0.12
Analyze Waveform 19-Sep-07 14:20:04 RMS = .1684 PK(+/-) = .5904/.4511 CRESTF= 3.51
0 50 100 150 200 250 300 350 400
-2.0-1.5
-1.0-0.5
0 0.5
1.01.52.0
Time in mSecs
Acc
eler
atio
n in
G-s
CF ALARM
CF ALARM
PK ALARM
PK ALARM
Label: MOTOR -1 /PUMP
Analyze Spectrum 19-Sep-07 14:20:04 (Peak Hold) RMS = .2170 LOAD = 100.0 RPM = 3669. (61.14 Hz)
0 200 400 600 800
0.09
1000
0
0.03
0.06
Frequency in Hz
RM
S A
ccel
erat
ion
in G
-s
C-16

Module-SE Corner Main I-Beam-Vert TRBL - OFF ROUTE EQUIPMENT
OFF ROUTE -0.05
Analyze Waveform 19-Sep-07 14:23:51 RMS = .0460 PK(+/-) = .1377/.1388 CRESTF= 3.02
0 50 100 150 200 250 300 350 400
-2.0-1.5
-1.0-0.5
0 0.5
1.01.52.0
Time in mSecs
Acc
eler
atio
n in
G-s
CF ALARM CF ALARM
PK ALARM
PK ALARM
Label: MOTOR -1 /PUMP
Analyze Spectrum 19-Sep-07 14:23:51 (Peak Hold) RMS = .0591 LOAD = 100.0 RPM = 3644. (60.73 Hz)
0 200 400 600 800
0.04
0.03
1000
0
0.01
0.02
Frequency in Hz
RM
S A
ccel
erat
ion
in G
-s
Module-SE Corner Main I-Beam-Horiz N-S
TRBL - OFF ROUTE EQUIPMENTOFF ROUTE -
0.016
Analyze Waveform 19-Sep-07 14:24:16 RMS = .0275 PK(+/-) = .0821/.0869 CRESTF= 3.16
0 50 100 150 200 250 300 350 400
-2.0-1.5
-1.0-0.5
0 0.5
1.01.52.0
Time in mSecs
Acc
eler
atio
n in
G-s
CF ALARM CF ALARM
PK ALARM
PK ALARM
Label: MOTOR -1 /PUMP
Analyze Spectrum 19-Sep-07 14:24:16 (Peak Hold) RMS = .0357 LOAD = 100.0 RPM = 3955. (65.92 Hz)
0 200 400 600 800
0.012
1000
0
0.004
0.008
Frequency in Hz
RM
S A
ccel
erat
ion
in G
-s
C-17

Module-SE Corner Main I-Beam-Horiz- E-W TRBL - OFF ROUTE EQUIPMENT
OFF ROUTE -0.024
Analyze Waveform 19-Sep-07 14:25:12 RMS = .0283 PK(+/-) = .0915/.0893 CRESTF= 3.23
0 50 100 150 200 250 300 350 400
-2.0-1.5
-1.0-0.5
0 0.5
1.01.52.0
Time in mSecs
Acc
eler
atio
n in
G-s
CF ALARM CF ALARM
PK ALARM
PK ALARM
Label: MOTOR -1 /PUMP
Analyze Spectrum 19-Sep-07 14:25:12 (Peak Hold) RMS = .0346 LOAD = 100.0 RPM = 3600. (60.00 Hz)
0 200 400 600 800
0.020
1000
0
0.004
0.008
0.012
0.016
Frequency in Hz
RM
S A
ccel
erat
ion
in G
-s
Module-NE Corner Main I-Beam-Vert
TRBL - OFF ROUTE EQUIPMENTOFF ROUTE -
0.030
Analyze Waveform 19-Sep-07 14:26:19 RMS = .0330 PK(+/-) = .0814/.1013 CRESTF= 3.07
0 50 100 150 200 250 300 350 400
-2.0-1.5
-1.0-0.5
0 0.5
1.01.52.0
Time in mSecs
Acc
eler
atio
n in
G-s
CF ALARM CF ALARM
PK ALARM
PK ALARM
Label: MOTOR -1 /PUMP
Analyze Spectrum 19-Sep-07 14:26:19 (Peak Hold) RMS = .0387 LOAD = 100.0 RPM = 3600. (60.00 Hz)
0 200 400 600 800
0.024
0.018
1000
0
0.006
0.012
Frequency in Hz
RM
S A
ccel
erat
ion
in G
-s
C-18

Module-NE Corner Main I-Beam-Horiz-Vert TRBL - OFF ROUTE EQUIPMENT
OFF ROUTE -0.030
Analyze Waveform 19-Sep-07 14:27:02 RMS = .0279 PK(+/-) = .0772/.0853 CRESTF= 3.05
0 50 100 150 200 250 300 350 400
-2.0-1.5
-1.0-0.5
0 0.5
1.01.52.0
Time in mSecs
Acc
eler
atio
n in
G-s
CF ALARM CF ALARM
PK ALARM
PK ALARM
Label: MOTOR -1 /PUMP
Analyze Spectrum 19-Sep-07 14:27:02 (Peak Hold) RMS = .0428 LOAD = 100.0 RPM = 3800. (63.33 Hz)
0 200 400 600 800
0.025
0.020
1000
0
0.005
0.010
0.015
Frequency in Hz
RM
S A
ccel
erat
ion
in G
-s
Module-NE Corner Main I-Beam-Horiz-N-S
TRBL - OFF ROUTE EQUIPMENTOFF ROUTE -
0.030
Analyze Waveform 19-Sep-07 14:27:53 RMS = .0444 PK(+/-) = .1481/.1542 CRESTF= 3.47
0 50 100 150 200 250 300 350 400
-2.0-1.5
-1.0-0.5
0 0.5
1.01.52.0
Time in mSecs
Acc
eler
atio
n in
G-s
CF ALARM CF ALARM
PK ALARM
PK ALARM
Label: MOTOR -1 /PUMP
Analyze Spectrum 19-Sep-07 14:27:53 (Peak Hold) RMS = .0533 LOAD = 100.0 RPM = 3948. (65.80 Hz)
0 200 400 600 800
0.025
0.020
1000
0
0.005
0.010
0.015
Frequency in Hz
RM
S A
ccel
erat
ion
in G
-s
C-19

Module-Middle Main I-Beam-East Side-Vert TRBL - OFF ROUTE EQUIPMENT
OFF ROUTE -0.04
Analyze Waveform 19-Sep-07 14:29:25 RMS = .0631 PK(+/-) = .1953/.2296 CRESTF= 3.64
0 50 100 150 200 250 300 350 400
-2.0-1.5
-1.0-0.5
0 0.5
1.01.52.0
Time in mSecs
Acc
eler
atio
n in
G-s
CF ALARM CF ALARM
PK ALARM
PK ALARM
Label: MOTOR -1 /PUMP
Analyze Spectrum 19-Sep-07 14:29:25 (Peak Hold) RMS = .0765 LOAD = 100.0 RPM = 3672. (61.20 Hz)
0 200 400 600 800
0.03
1000
0
0.01
0.02
Frequency in Hz
RM
S A
ccel
erat
ion
in G
-s
Module-Middle Main I-Beam-East Side-Horiz N-S
TRBL - OFF ROUTE EQUIPMENTOFF ROUTE -
0.06
Analyze Waveform 19-Sep-07 14:31:07 RMS = .1225 PK(+/-) = .3867/.3227 CRESTF= 3.16
0 50 100 150 200 250 300 350 400
-2.0-1.5
-1.0-0.5
0 0.5
1.01.52.0
Time in mSecs
Acc
eler
atio
n in
G-s
CF ALARM
CF ALARM
PK ALARM
PK ALARM
Label: MOTOR -1 /PUMP
Analyze Spectrum 19-Sep-07 14:31:07 (Peak Hold) RMS = .1527 LOAD = 100.0 RPM = 3798. (63.30 Hz)
0 200 400 600 800
0.05
1000
0
0.01
0.02
0.03
0.04
Frequency in Hz
RM
S A
ccel
erat
ion
in G
-s
C-20

Pump #3 Suction Line at Ring Anchor-Hori-E-W TRBL - OFF ROUTE EQUIPMENT
OFF ROUTE -0.06
Analyze Waveform 19-Sep-07 14:32:49 RMS = .0861 PK(+/-) = .2217/.2963 CRESTF= 3.44
0 50 100 150 200 250 300 350 400
-2.0-1.5
-1.0-0.5
0 0.5
1.01.52.0
Time in mSecs
Acc
eler
atio
n in
G-s
CF ALARM
CF ALARM
PK ALARM
PK ALARM
Label: MOTOR -1 /PUMP
Analyze Spectrum 19-Sep-07 14:32:49 (Peak Hold) RMS = .1072 LOAD = 100.0 RPM = 3920. (65.34 Hz)
0 200 400 600 800
0.05
0.04
1000
0
0.01
0.02
0.03
Frequency in Hz
RM
S A
ccel
erat
ion
in G
-s
Pump #3 Suction Line at Ring Anchor-Hori-E-W
TRBL - OFF ROUTE EQUIPMENTOFF ROUTE -
Analyze Waveform 19-Sep-07 14:34:07 RMS = .0857 PK(+/-) = .2296/.2472 CRESTF= 2.88
0 50 100 150 200 250 300 350 400
-2.0-1.5
-1.0-0.5
0 0.5
1.01.52.0
Time in mSecs
Acc
eler
atio
n in
G-s
CF ALARM
CF ALARM
PK ALARM
PK ALARM
Label: MOTOR -1 /PUMP
Analyze Spectrum 19-Sep-07 14:34:07 (Peak Hold) RMS = .1063 LOAD = 100.0 RPM = 3362. (56.03 Hz)
0 200 400 600 800 1000
0 0.01
0.020.030.040.050.06
0.070.08
Frequency in Hz
RM
S A
ccel
erat
ion
in G
-s
C-21

Pump #3 Discharge Line at Ring Anchor-Hori-E-W
TRBL - OFF ROUTE EQUIPMENTOFF ROUTE -
0.10
Analyze Waveform 19-Sep-07 14:37:31 RMS = .1080 PK(+/-) = .3180/.3030 CRESTF= 2.94
0 50 100 150 200 250 300 350 400
-2.0-1.5
-1.0-0.5
0 0.5
1.01.52.0
Time in mSecs
Acc
eler
atio
n in
G-s
CF ALARM
CF ALARM
PK ALARM
PK ALARM
Label: MOTOR -1 /PUMP
Analyze Spectrum 19-Sep-07 14:37:31 (Peak Hold) RMS = .1457 LOAD = 100.0 RPM = 3334. (55.56 Hz)
0 200 400 600 800
0.08
1000
0
0.02
0.04
0.06
Frequency in Hz
RM
S A
ccel
erat
ion
in G
-s
Pump #3 Discharge Line at Ring Anchor-Vert
TRBL - OFF ROUTE EQUIPMENTOFF ROUTE -
0.5
Analyze Waveform 19-Sep-07 14:39:20 RMS = .3620 PK(+/-) = .9676/1.12 CRESTF= 3.09
0 50 100 150 200 250 300 350 400
-2.0-1.5
-1.0-0.5
0 0.5
1.01.52.0
Time in mSecs
Acc
eler
atio
n in
G-s CF ALARM
CF ALARM
PK ALARM
PK ALARM
Label: MOTOR -1 /PUMP
Analyze Spectrum 19-Sep-07 14:39:20 (Peak Hold) RMS = .4541 LOAD = 100.0 RPM = 3690. (61.49 Hz)
0 200 400 600 800
0.4
0.3
1000
0
0.1
0.2
Frequency in Hz
RM
S A
ccel
erat
ion
in G
-s
C-22

Pump #3 Discharge Line at Ring Anchor-Vert
TRBL - OFF ROUTE EQUIPMENTOFF ROUTE -
Label: MOTOR -1 /PUMP
Analyze Spectrum 19-Sep-07 14:39:32 (Peak Hold)
RMS = .4764 LOAD = 100.0 RPM = 3941. (65.68 Hz)
0 200 400 600 800 1000
0
0.1
0.2
0.3
0.4
0.5
Frequency in Hz
RM
S A
ccel
erat
ion
in G
-s
C-23