Investigation of Pavement Emulsion Absorption Rates
41
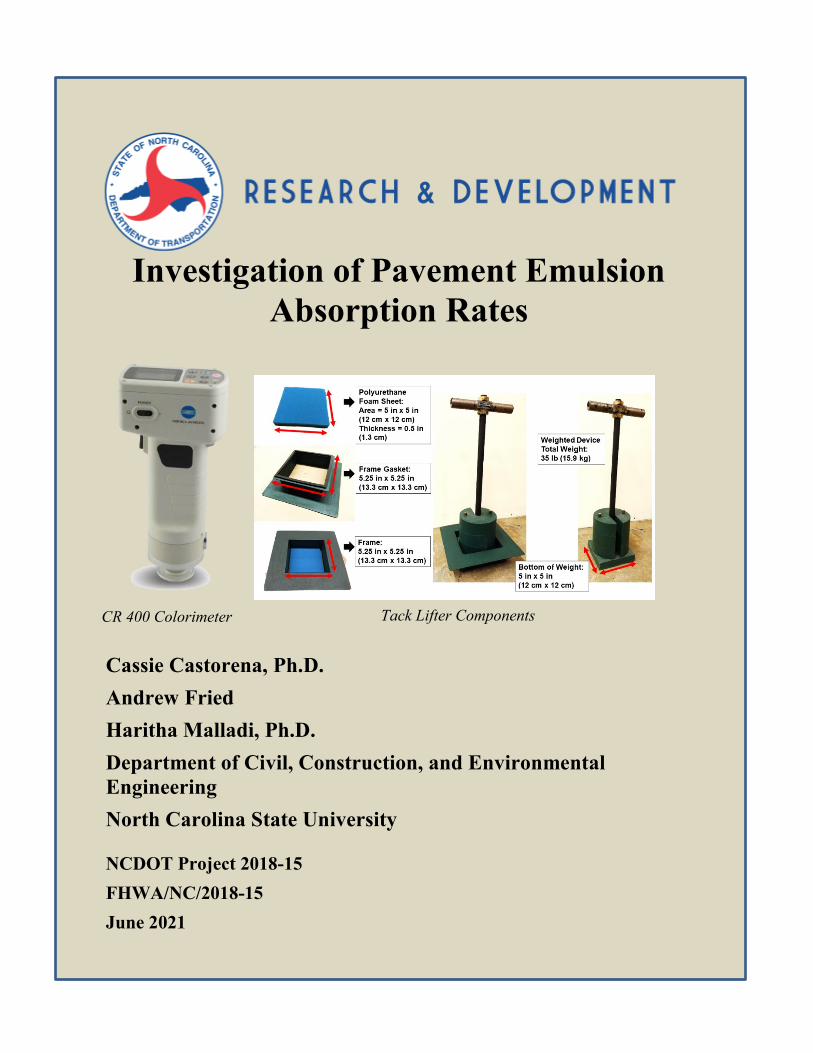
Investigation of Pavement Emulsion Absorption Rates NCDOT Project 2018-15 FHWA/NC/2018-15 June 2021 Cassie Castorena, Ph.D. Andrew Fried Haritha Malladi, Ph.D. Department of Civil, Construction, and Environmental Engineering North Carolina State University CR 400 Colorimeter Tack Lifter Components
Transcript of Investigation of Pavement Emulsion Absorption Rates
0
Investigation of Pavement Emulsion Absorption Rates
NCDOT Project 2018-15 FHWA/NC/2018-15 June 2021
Cassie Castorena, Ph.D. Andrew Fried Haritha Malladi, Ph.D. Department of Civil, Construction, and Environmental Engineering North Carolina State University
CR 400 Colorimeter Tack Lifter Components

1
Investigation of Pavement Emulsion Absorption Rates
FINAL REPORT
Submitted to the North Carolina Department of Transportation (Research Project No. FHWA/NCDOT 2018-15)
Submitted by Cassie Castorena, Ph.D.
Associate Professor North Carolina State University
Department of Civil, Construction and Environmental Engineering 915 Partners Way
Raleigh, NC 27695 E-mail: [email protected]
Andrew Fried, M.S.
Graduate Research Assistant North Carolina State University
Department of Civil, Construction and Environmental Engineering E-mail: [email protected]
Haritha Malladi, Ph.D. Postdoctoral Scholar
North Carolina State University Department of Civil, Construction and Environmental Engineering
E-mail: [email protected]
Department of Civil, Construction, & Environmental Engineering North Carolina State University
Raleigh, NC
JUNE 2021

2
Technical Report Documentation Page 1. Report No. FHWA/NC/2018-15
2. Government Accession No. … …
3. Recipient’s Catalog No. … …
4. Title and Subtitle Investigation of Pavement Emulsion Absorption Rates
5. Report Date 6/7/2021
6. Performing Organization Code … …
7. Author(s) Cassie Castorena, Andrew Fried, and Haritha Malladi
8. Performing Organization Report No. … …
9. Performing Organization Name and Address
10. Work Unit No. (TRAIS) … …
North Carolina State University Department of Civil, Construction and Environmental Engineering 915 Partners Way Raleigh, NC 27695
11. Contract or Grant No. … …
12. Sponsoring Agency Name and Address NC Department of Transportation Research and Development Unit
13. Type of Report and Period Covered Report
1020 Birch Ridge Drive Raleigh, North Carolina 27610
8/1/2017-5/31/2021
14. Sponsoring Agency Code 2018-15
Supplementary Notes: … …
16. Abstract
The Emulsion Application Rate (EAR) is critical to the performance of both tack coats and chip seals. When emulsion is applied to an aged flexible pavement, a portion of the applied emulsion will be absorbed by the existing pavement. To compensate, the current practice is to adjust the required target EAR used in the construction based on visual inspection of the existing pavement surface, which is subjective. The objectives of this project are to: (1) determine the pavement emulsion absorption rate as a function of surface characteristics and (2) develop guidelines for the adjustment of the target EAR to account for emulsion absorption based on quantitative measurement of the existing pavement surface characteristics. Tack Lifter field experiments conducted on 13 pavements indicate that the absorbed EAR vary considerably depending on the existing pavement surface conditions. Statistical analysis of the field measurements acquired in this study indicate that the application (i.e., chip seal versus tack coat) and mean texture depth affect the resultant pavement emulsion absorption rate. A linear regression model was calibrated to predict the pavement emulsion absorption rate as a function of mean texture depth and application that yielded moderate prediction accuracy (R2 = 0.56). The moderate prediction capability indicates that other factors that were not captured by the application type and texture influence the emulsion absorption capacity of pavements but allows for an approximation of the absorbed EAR in cases where project-specific Tack Lifter testing cannot be conducted. Tack Lifter experiments conducted on field cores in the laboratory indicate that Colorimeter measurements of hue are moderately correlated to the pavement emulsion absorption rate (R2 = 0.42), which merits further investigation using field experiments in the future. Field core measurements of emulsion absorption rates indicated differences from field measurements of emulsion absorption rates with respect to sensitivity to the mean texture depth and mean values in tack coat applications. This could be due to differences in application procedures in the field versus the lab. Also, field measurements were made in the wheel path whereas field cores were extracted elsewhere.
17. Key Words Chip seal, tack coat, asphalt emulsion, absorption, application rate
18. Distribution Statement … …
19. Security Classif. (of this report) Unclassified
20. Security Classif. (of this page) Unclassified
21. No. of Pages 41
22. Price … …
Form DOT F 1700.7 (8-72) Reproduction of completed page authorized

3
DISCLAIMER
The contents of this report reflect the views of the author(s) and not necessarily the views of the
University. The author(s) are responsible for the facts and the accuracy of the data presented
herein. The contents do not necessarily reflect the official views or policies of either the North
Carolina Department of Transportation or the Federal Highway Administration at the time of
publication. This report does not constitute a standard, specification, or regulation.

4
ACKNOWLEDGEMENTS The authors would like to acknowledge the financial support from the North Carolina Department of Transportation under project NCDOT RP 2018-15. The authors sincerely thank Averette Moore and Teresa Robinson for their assistance with the coordination of the field experiments. The authors also thank Mary Rawls who conducted experiments in NCDOT RP 2014-03 that were incorporated into the analysis conducted under this project. The authors also appreciate the help of Elizabeth Braswell, Benjamin Fonte, Jaemin Heo, Christie Kim, Sonja Pape, Nooralhuda Saleh and Dr. Jun Zhang in conducting field measurements.

5
EXECUTIVE SUMMARY Emulsions are used as tack coats to bond hot-mix asphalt layers and in chip seals to bind aggregates. The Emulsion Application Rate (EAR) is critical to the performance of both tack coats and chip seals and hence, is an important design factor. Emulsion is often applied to aged flexible pavements in North Carolina. Oxidative aging embrittles asphalt binder near the pavement surface which increases top down cracking and raveling, leaving the pavement surface porous and dry. Consequently, when emulsion is applied to an aged flexible pavement, a portion of the applied emulsion will be absorbed by the existing pavement. To compensate, the current practice is to adjust the required target EAR used in the construction based on visual inspection of the existing pavement surface, which is subjective. Therefore, an improved method is needed to inform adjustment of the target EAR during construction to account for emulsion lost to absorption. Improved selection of the design EAR will result in prolonged pavement service life, potentially resulting in significant economic savings. The objectives of this project are to: (1) determine the pavement emulsion absorption rate as a function of surface characteristics and (2) develop guidelines for the adjustment of the target EAR to account for emulsion absorption based on quantitative measurement of the existing pavement surface characteristics. To accomplish these objectives, a literature review was conducted to identify pavement surface characteristics that can affect emulsion absorption. Subsequently, an experimental plan was executed to assess the influence of pavement surface characteristics (i.e., surface type, texture, and color) on emulsion absorption in both tack coats and chip seals using both in-situ measurements in field projects and the laboratory evaluation of field cores. Emulsion absorption rates were quantified using the Tack Lifter developed in NCDOT RP 2014-03 and 2017-43. The Tack Lifter field experiments conducted on 13 pavements indicate that the absorbed EAR vary considerably depending on the existing pavement surface conditions. Statistical analysis of the field measurements acquired in this study indicate that the application (i.e., chip seal versus tack coat) and mean texture depth measured via sand patch test affect the resultant pavement emulsion absorption rate. A linear regression model was calibrated to predict the pavement emulsion absorption rate as a function of mean texture depth and application that yielded moderate prediction accuracy (R2 = 0.56). The moderate prediction capability indicates that other factors that were not captured by the application type and texture influence the emulsion absorption capacity of pavements but allows for an approximation of the absorbed EAR in cases where project-specific Tack Lifter testing cannot be conducted. Tack Lifter experiments conducted on field cores in the laboratory indicate that Colorimeter measurements of hue are moderately correlated to the pavement emulsion absorption rate (R2 = 0.42), which merits further investigation using field experiments in the future. Tack Lifter measurements conducted on field cores also indicated a correlation between the emulsion absorption rate and Mean Texture Depth (MTD) (R2 = 0.68). However, field core measurements of emulsion absorption rates indicated differences from field measurements of emulsion absorption rates with respect to sensitivity to the mean texture depth and mean values in tack coat applications. This could be due to differences in application procedures in the field versus the lab. In addition, field measurements were made in the wheel path whereas field cores were extracted outside of the wheel path, which could further lead to differences.
6
TABLE OF CONTENTS
DISCLAIMER ................................................................................................................................ 3
ACKNOWLEDGEMENTS ............................................................................................................ 4
EXECUTIVE SUMMARY ............................................................................................................ 5
TABLE OF CONTENTS ................................................................................................................ 6
LIST OF FIGURES ........................................................................................................................ 7
LIST OF TABLES .......................................................................................................................... 8
INTRODUCTION .......................................................................................................................... 9
RESULTS OF THE LITERATURE REVIEW ............................................................................ 10
Importance of EAR on Performance ......................................................................................... 10
Existing Procedures to Adjust Target EARs to Account for Emulsion Absorption ................. 10
Visual Inspection of Existing Pavement ............................................................................... 10
Surface Texture Measurement .............................................................................................. 11
Colorimeter ........................................................................................................................... 11
Visual Inspection of Emulsion Absorption ........................................................................... 12
Tack Lifter ................................................................................................................................ 13
Summary of Knowledge Gaps and Applications ...................................................................... 14
EXPERIMENTAL PLAN ............................................................................................................ 14
Field Experiments ..................................................................................................................... 14
Field Core Experiments ............................................................................................................ 17
EXPERIMENTAL RESULTS...................................................................................................... 19
Field Experiments ..................................................................................................................... 19
Field Core Experiments ............................................................................................................ 27
FINDINGS AND CONCLUSIONS ............................................................................................. 36 RECOMMENDATIONS .............................................................................................................. 37 IMPLEMENTATION AND TECHNOLOGY TRANSFER PLAN ............................................ 38 CITED REFERENCES ................................................................................................................. 39

7
LIST OF FIGURES Figure 1. EAR Corrections Based on Surface Texture (Shuler et al. 2011). ................................ 11
Figure 2. CR 400 colorimeter manufactured by Konica Minolta. ................................................ 12
Figure 3. Visual method of determining pavement emulsion absorption capacity (Caltrans). ..... 12
Figure 4. Tack Lifter components. ................................................................................................ 13
Figure 5. Balance set-up for field data collection. ........................................................................ 16
Figure 6. Steel plates placed on the roadway prior to emulsion application in (a) tack coat and (b) chip seal projects. .......................................................................................................................... 17
Figure 7. Field project applied EAR results.................................................................................. 21
Figure 8. Field project absorbed EAR and MTD results. ............................................................. 22
Figure 9. Relationship between Absorbed EAR and RAR field measurements. .......................... 23
Figure 10. Average field measurements of absorbed EAR and MTD results for different applications and surface types. ..................................................................................................... 24
Figure 11. Relationship between field measurements of absorbed EAR and MTD. .................... 26
Figure 12. Comparison between measured and regression model predictions of field absorbed EAR values. .................................................................................................................................. 27
Figure 13. Relationship between absorbed and applied EAR values on field cores..................... 28
Figure 14. Relationship between absorbed EAR and RAR values for the field core experiments........................................................................................................................................................ 29
Figure 15. Absorbed EAR values of field cores as a function of surface type. Red indicates chip seal emulsion was applied; gray indicates tack coat. .................................................................... 30
Figure 16. Field core surface texture results: (a) sand patch MTD, and (b) laser MPD. .............. 31
Figure 17. Relationship between sand patch MTD and laser MPD texture measurements. ......... 32
Figure 18. Relationship between absorbed EAR and surface texture of field cores based on (a) sand patch MTD and (b) laser MPD. ............................................................................................ 32
Figure 19. Field core colorimeter results: (a) L*, (b) C*, and (c) h. ............................................. 33
Figure 20. Relationships among colorimeter parameters: (a) L* versus C*, (b) L* versus h, and (c) C* versus h. ............................................................................................................................. 34
Figure 21. Relationship between absorbed EAR and colorimeter results of field cores: (a) L*, (b) C*, and (c) h. ................................................................................................................................. 35

8
LIST OF TABLES Table 1. McLeod (1969) Recommendations for Adjustment to Chip Seal EARs ........................ 10
Table 2. Summary of Tack Coat Best Practices ........................................................................... 11
Table 3. Summary of Field Experiments ...................................................................................... 15
Table 4. Field Core Summary ....................................................................................................... 19
Table 5. Collective Field Project Summary .................................................................................. 20
Table 6. Average Field Measurements of Absorbed EAR and MTD for Different Application and Surface Types................................................................................................................................ 24
Table 7. p-values from F-Tests and t-Tests of Absorbed EAR Comparisons .............................. 25
Table 8. Average Absorbed EAR Values for NCDOT Use.......................................................... 25
Table 9. Regression Model for the Prediction of Absorbed EAR ................................................ 26
Table 10. Collective Field Core Results ....................................................................................... 27
Table 11. Average Absorbed EAR Values and Corresponding Standard Errors for Field Cores Experiments .................................................................................................................................. 30
Table 12. Comparison of Field versus Field Core Measurements of Absorbed EAR .................. 31
Table 13. Field Core Absorbed EAR Regression Models ............................................................ 36
Table 14. Average Absorbed EAR Values. .................................................................................. 38
9
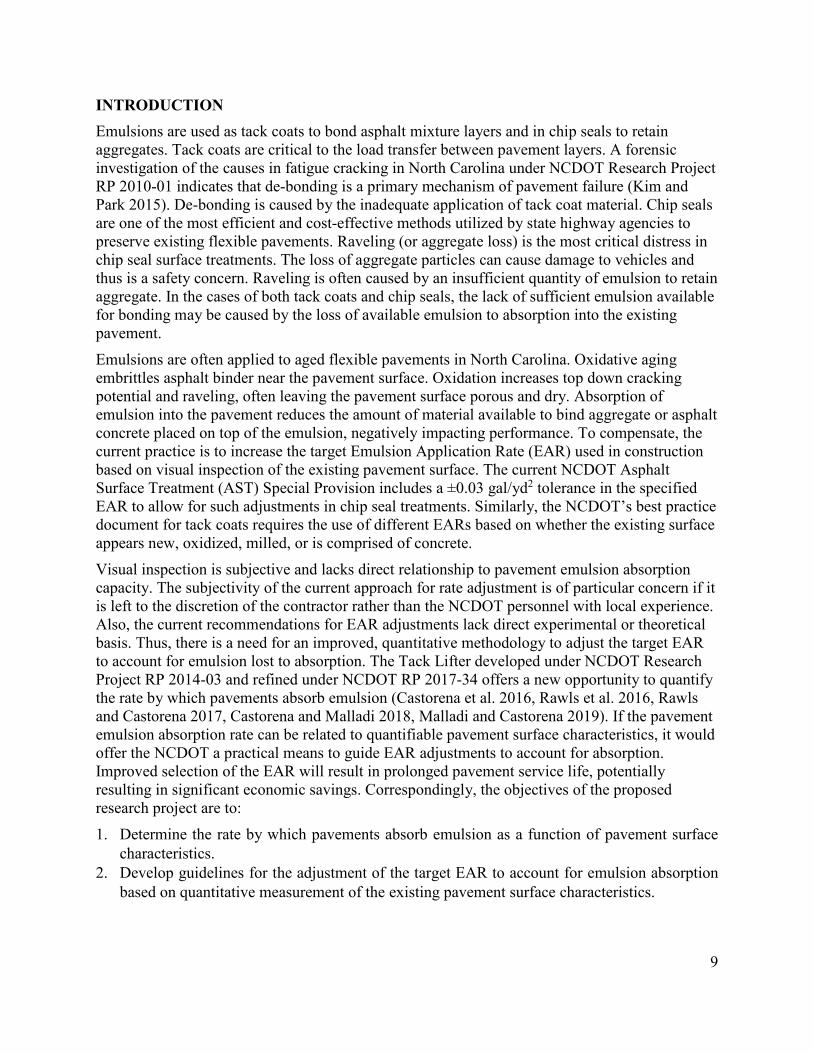
INTRODUCTION Emulsions are used as tack coats to bond asphalt mixture layers and in chip seals to retain aggregates. Tack coats are critical to the load transfer between pavement layers. A forensic investigation of the causes in fatigue cracking in North Carolina under NCDOT Research Project RP 2010-01 indicates that de-bonding is a primary mechanism of pavement failure (Kim and Park 2015). De-bonding is caused by the inadequate application of tack coat material. Chip seals are one of the most efficient and cost-effective methods utilized by state highway agencies to preserve existing flexible pavements. Raveling (or aggregate loss) is the most critical distress in chip seal surface treatments. The loss of aggregate particles can cause damage to vehicles and thus is a safety concern. Raveling is often caused by an insufficient quantity of emulsion to retain aggregate. In the cases of both tack coats and chip seals, the lack of sufficient emulsion available for bonding may be caused by the loss of available emulsion to absorption into the existing pavement. Emulsions are often applied to aged flexible pavements in North Carolina. Oxidative aging embrittles asphalt binder near the pavement surface. Oxidation increases top down cracking potential and raveling, often leaving the pavement surface porous and dry. Absorption of emulsion into the pavement reduces the amount of material available to bind aggregate or asphalt concrete placed on top of the emulsion, negatively impacting performance. To compensate, the current practice is to increase the target Emulsion Application Rate (EAR) used in construction based on visual inspection of the existing pavement surface. The current NCDOT Asphalt Surface Treatment (AST) Special Provision includes a ±0.03 gal/yd2 tolerance in the specified EAR to allow for such adjustments in chip seal treatments. Similarly, the NCDOT’s best practice document for tack coats requires the use of different EARs based on whether the existing surface appears new, oxidized, milled, or is comprised of concrete. Visual inspection is subjective and lacks direct relationship to pavement emulsion absorption capacity. The subjectivity of the current approach for rate adjustment is of particular concern if it is left to the discretion of the contractor rather than the NCDOT personnel with local experience. Also, the current recommendations for EAR adjustments lack direct experimental or theoretical basis. Thus, there is a need for an improved, quantitative methodology to adjust the target EAR to account for emulsion lost to absorption. The Tack Lifter developed under NCDOT Research Project RP 2014-03 and refined under NCDOT RP 2017-34 offers a new opportunity to quantify the rate by which pavements absorb emulsion (Castorena et al. 2016, Rawls et al. 2016, Rawls and Castorena 2017, Castorena and Malladi 2018, Malladi and Castorena 2019). If the pavement emulsion absorption rate can be related to quantifiable pavement surface characteristics, it would offer the NCDOT a practical means to guide EAR adjustments to account for absorption. Improved selection of the EAR will result in prolonged pavement service life, potentially resulting in significant economic savings. Correspondingly, the objectives of the proposed research project are to: 1. Determine the rate by which pavements absorb emulsion as a function of pavement surface
characteristics. 2. Develop guidelines for the adjustment of the target EAR to account for emulsion absorption
based on quantitative measurement of the existing pavement surface characteristics.

10
RESULTS OF THE LITERATURE REVIEW Importance of EAR on Performance Tack coats are essential for load transfer between pavement layers and thus constitute a critical component of a pavement structure. The tack coat type and application rate are important design considerations. Tack coat failure can occur in two modes: tensile and shear, which can lead to a variety of distresses, including slippage cracking, top-down cracking, premature fatigue cracking, pothole development, and complete delamination (Mohammad et al. 2012). Excessive EARs cause slippage and delamination whereas insufficient EARs can lead to lack of adhesion between layers (Leng et al. 2008, Mohammad et al. 2010, Hakimzadeh et al. 2012). Thus, if the tack coat EAR is not properly adjusted to reflect emulsion absorption into the existing pavement surface, premature pavement failure will likely occur. The EAR also affects the performance of chip seals. Excessive emulsion application causes bleeding which diminishes skid resistance. Insufficient emulsion application leads to aggregate loss. Aggregate loss, also referred to as raveling, can lead to a flushed surface, imparting poor skid resistance. In addition, aggregate loss can lead to windshield damage. Gurer et al. (2012) conducted a field study of the performance of five chip seals and found that deterioration was highly correlated to the agreement of the in-situ EAR to the target EAR. Furthermore, Kim et al. (2011) conducted a series of laboratory studies using simulated traffic loading which demonstrated the significance of EAR on chip seal performance. Therefore, proper adjustment of the target EAR during construction to reflect the quantity of emulsion lost to absorption is critical to the performance of chip seals.
Existing Procedures to Adjust Target EARs to Account for Emulsion Absorption Visual Inspection of Existing Pavement Adjustments to the design EAR to account for emulsion absorption are most often based on crude visual inspection of the existing pavement. The McLeod method for chip seal design provides provisions for adjustments to the target EAR according to the surface condition as listed in Table 1. Corrections range from -0.06 gal/yd2 to +0.06 gal/yd2 (McLeod 1969). McLeod’s work does not specify how the recommended rate adjustments were selected.
Table 1. McLeod (1969) Recommendations for Adjustment to Chip Seal EARs
Existing Pavement Surface Texture Correction (in gal/yd2)
Black, flushed asphalt surface -0.06 Smooth, nonporous surface -0.03
Slightly porous, oxidized surface 0.00 Slightly pocked, porous, oxidized surface +0.03 Badly pocked, porous, oxidized surface +0.06
Tack coat practices and standards vary by state. Many agencies specify different EARs as a function of the pavement surface used. Table 2 compares the different tack coat application rates by state and surface type. In general, the rougher the surface texture of the existing pavement, the higher the specified EAR.

11
Table 2. Summary of Tack Coat Best Practices
Existing Surface
Recommended Application Rate (gal/yd2) NCDOT ODOT LADOT WADOT FHWA
New Asphalt 0.04 0.05 to 0.06 0.035 0.035 0.03 to 0.07
Oxidized or Milled 0.06 0.08 to 0.09 0.055
0.05 (Oxidized)
0.07 (Milled)
0.06 to 0.12
Concrete 0.08 0.06 to 0.08 0.045 0.05 0.05 to 0.08
Surface Texture Measurement Shuler et al. (2011) proposed that the mean texture depth (MTD) of the existing pavement surface, quantified using the sand patch test in accordance with ASTM E965-15, can be used to guide adjustment of the design EAR in chip seals to account for surface absorption. Recommended adjustments to the target EAR as a function of sand patch test results are shown in Figure 1. Note that lower sand patch diameters correspond to lower surface texture. Thus, Shuler et al.’s (2011) recommendations suggest that higher pavement surface texture equates to greater emulsion absorption and hence, the need for greater adjustment to the design EAR.
Figure 1. EAR Corrections Based on Surface Texture (Shuler et al. 2011).
Colorimeter Visual inspection of the pavement surface according to the methods described above largely relies on subjective inferences of texture and color. An objective way to quantify color is the use of a commercially available Spectrophotometer, also known as a Colorimeter or Chroma Meter. Figure 5 shows a one such handheld Colorimeter device. Several manufacturers have similar devices available in the market. Color perception by the human eye is influenced by a variety of external factors; this human bias can be effectively removed using a Colorimeter device. NCDOT RP 2014-14 developed correlations between Tensile Strength Ratio and readings from the Colorimeter device (Tayebali et al. 2017). Colorimeter readings of the pavement surface may indicate dryness and therefore, relate to emulsion absorption potential; however, this has yet to be evaluated.

12
Figure 2. CR 400 colorimeter manufactured by Konica Minolta.
Visual Inspection of Emulsion Absorption Several fog seal guidelines recommend the trial application of emulsion at different rates to determine absorption capacity based on visual observation (e.g., FWHA 2016, Caltrans 2003). Caltrans (2003) recommends applying one liter of emulsion over a square meter of pavement area and visually observing whether or not the emulsion is fully absorbed by the pavement. The process is depicted in Figure 3. If the emulsion is completely absorbed, the process if repeated at incrementally higher application rates until the absorption capacity of the pavement is reached. Similarly, if the emulsion ponds on the pavement, the application rate is incrementally decreased until an application rate where the pavement absorbs all emulsion is achieved. This procedure is cumbersome and visual observations of absorption are subjective.
Figure 3. Visual method of determining pavement emulsion absorption capacity (Caltrans).

13
Tack Lifter The Tack Lifter, shown in Figure 4, was developed under NCDOT RP 2014-03 by Castorena et al. (2016) in partnership with Instrotek, Inc. to enable in-situ measurements of the effective emulsion application rate on the pavement surface, neglecting the emulsion absorbed by the pavement surface. To conduct a Tack Lifter test, the area of interest is first isolated by using the Tack Lifter frame with gasket to the pavement surface. Next, a pre-weighed absorbent sheet is placed inside the frame. The Tack Lifter weighted device is placed on top of the absorbent sheet for 30 seconds. The weighted device is removed and the sheet is transferred to a balance. The mass of the sheet after the application of the Tack Lifter minus the initial mass provides the mass of effective emulsion absorbed by the sheet. When applied to a pavement, the sheet absorbs the “effective” emulsion on the pavement, neglecting emulsion absorbed into the pavement. The test is conducted prior to emulsion breaking. Equation (1) is used to calculate EAR using the Tack Lifter test.
22 22
gal gal in, 0.000264 1296ccyd yd26.01in s
AEARG
= × ××
(1)
Where A = net mass of emulsion absorbed by the sheet, g; Gs = specific gravity of the asphalt emulsion.
Figure 4. Tack Lifter components.
The Tack Lifter test can also be executed on a plate placed on the pavement surface prior to emulsion application in chip seal application using an analogous approach. In this case, all of the
14
applied emulsion is absorbed by the Tack Lifter sheet since the plate is impermeable and thus, the test provides a measurement of the applied EAR. In tack coat applications, applied EAR measurements should be made by simply placing pre-weighed plates of known area on the pavement surface prior to emulsion application (Castorena and Malladi 2018). After emulsion application, the plates can be carefully removed and weighed. Subsequently, the weight of emulsion on the plate combined with the known plate area can be used to calculate the applied EAR using Equation (1). The pre-weighed plate method of applied EAR measurement cannot be used in chip seal projects because the relatively high application rates used in chip seals do not allow for removing and transporting the steel plates after emulsion application without the emulsion dripping from the plate edges (Castorena and Malladi 2018). Residual binder rates can be obtained by collecting pre-weighed plates or Tack Lifter sheets in-situ and weighing after curing; this mitigates time constraints and the need for leveling and shielding a balance from wind in the field. The difference between Tack Lifter measurements of EAR on the plate (i.e., EARApplied) and pavement (i.e., EAREffective) is used to determine the pavement absorbed emulsion rate (i.e., EARAbsorbed) as shown in Equation (2).
Absorbed Applied EffectiveEAR EAR EAR= − (2)
Past Tack Lifter field experiments demonstrate that the Tack Lifter can effectively capture pavement emulsion absorption rates and longitudinal variability in the applied EAR in chip seal applications and tack coat projects (Castorena et al. 2016, Castorena and Malladi 2018). Results of NCDOT 2014-03 suggest that the amount of emulsion absorbed by a pavement is influenced by pavement surface type (e.g., asphalt concrete versus chip seal) and pavement surface texture (Castorena et al. 2016); however, relatively few field projects were conducted within this project and they were limited to chip seal applications.
Summary of Knowledge Gaps and Applications The literature demonstrates that existing tack coat and chip seal design guidelines recognize that different existing pavement conditions warrant different design EARs to account for differences in the expected emulsion absorption. Existing procedures largely rely on subjective visual assessment of the existing pavement surface type, color, and texture. The Tack Lifter offers an opportunity to measure in-situ emulsion absorption rates of pavements. Complementary measurements of the existing pavement surface texture and color may allow for objective estimation of the pavement emulsion absorption rate in lieu of subjective visual assessment or project-specific Tack Lifter testing.
EXPERIMENTAL PLAN Field Experiments Table 3 summarizes the field experiments conducted in this project along with those from past NCDOT RP 2014-03; both were leveraged to assess the impacts of the existing surface condition on pavement emulsion absorption. Tables 1 encompasses a total of 13 field projects, nine of which are chip seal projects and four of which are tack coat projects. All chip seal projects included the application of CRS-2L emulsion whereas all tack coat projects involved the application of CRS-1h emulsion. Ten of the field projects were evaluated within this project and the others are from past NCDOT RP 2014-03. Tack Lifter measurements of emulsion absorption

15
were made at two locations within each project within the wheel path with the exception of two of the tack coat field projects where only one measurement was made. A minimum of two replicate measurements of applied EAR and two replicate measurements of effective EAR were made at each location. It should be noted that two of the NCDOT RP 2014-03 field projects included three wheel path measurement locations of emulsion absorption; only two of the three that included the most consistent texture were included in the evaluation herein to avoid bias to any given section. Prior to emulsion application, the mean texture depth (MTD) of the existing pavement surface was quantified using the sand patch test, in accordance with ASTM E965-15.
Table 3. Summary of Field Experiments
ID Date Project County Application Surface Type Emulsion
Target EAR
(gal/yd2)
No. of Test Sites
1 5/26/2015 2014-03 Vance Chip Seal CRS-2L 0.25 2 2 8/10/2015 2014-03 Franklin Chip Seal CRS-2L 0.30 2 3 5/31/2018 2018-15 Warren Chip Seal CRS-2L 0.30 2 4 8/16/2019 2018-15 Person Chip Seal CRS-2L 0.30 2 5 9/27/2019 2018-15 Chatham Chip Seal CRS-2L 0.30 2 6 6/23/2015 2014-03 Warren Aged Asphalt Mixture CRS-2L 0.30 2 7 5/15/2018 2018-15 Vance Aged Asphalt Mixture CRS-2L 0.25 2 8 6/7/2018 2018-15 Durham Aged Asphalt Mixture CRS-2L 0.30 2 9 7/17/2018 2018-15 Wilson Aged Asphalt Mixture CRS-2L 0.25 2
10 6/4/2018 2018-15 Wake Aged Asphalt Mixture CRS-1h 0.06 2 11 6/19/2018 2018-15 Wake Aged Asphalt Mixture CRS-1h 0.06 2 12 7/10/2018 2018-15 Wake Milled Asphalt Mixture CRS-1h 0.06 1 13 4/18/2017 2018-15 Durham New Asphalt Mixture CRS-1h 0.06 1
A Sartorius Entris 3202-1S balance (3,200 g capacity with 0.01 g resolution) powered by a battery pack was used to obtain all mass measurements of emulsion application in the field. A shield was constructed and placed around the balance to mitigate the influence of wind on mass measurements. Prior to performing any measurements, the balance, battery pack, and draft shield were set up close to the measurement site and the balance was levelled. Figure 5 shows the balance and draft shield at a field trial. To minimize errors due to evaporative loss and delay in the construction activity, all measurements of emulsion application at a test site were taken in close proximity to the weighing station.

16
Figure 5. Balance set-up for field data collection.
In tack coat field experiments, the applied EAR was measured using pre-weighed plates as proposed in NCDOT RP 2017-34 (Castorena and Malladi 2018). The pre-weighed plates are flat, steel plates with dimensions of 8 in by 8 in (20.32 cm by 20.32 cm). The plates were placed on the roadway prior to emulsion application in a single wheel path, as shown in Figure 6 (a). The wheel path was selected as a critical location for testing as it represents the location where pavement distress is most likely to develop. The plates were removed from the pavement following emulsion application with the aid of a spatula to determine the net mass of applied emulsion. The EAR was calculated from the pre-weighed plate measurements using an analogous approach to the Tack Lifter tests, by converting the net mass of the applied emulsion to EAR using the known plate area and emulsion density. All pre-weighed plates were weighed within 60 seconds of emulsion application for EAR determination. Tack Lifter tests on the pavement were conducted in the same wheel path and in close proximity to the pre-weighed plate measurements to obtain measurements of the effective EAR. The difference between applied EAR measurements from the plates and effective EARs from Tack Lifter tests conducted on the pavement were used to calculate the pavement absorption rates. Tack Lifter tests were completed within 60 seconds of emulsion application; the sheets were weighed for EAR determination within 60 seconds of removal from the pavement.

17
Figure 6. Steel plates placed on the roadway prior to emulsion application in (a) tack coat
and (b) chip seal projects. In each chip seal field trial, emulsion absorption measurements were made for the bottom layer of double seals only. Loose aggregate from the bottom chip seal layer adhered to the foam sheets when Tack Lifter tests were conducted directly on the pavement during surface layer application, which prevented measurement of emulsion absorption by the bottom layer chip seal when applying the surface layer. During the construction of the bottom layer, flat, 8 in by 8 in steel plates were placed in the wheel path prior to emulsion application, as shown in Figure 6 (b). Tack Lifter tests were conducted on the plates as well as on the pavement in the same wheel path, adjacent to the plates. Tack lifter sheets and the pans used for applied EAR measurements in tack coat projects were safely transported to the lab and reweighed following full curing to also allow for determination of the absorbed Residual Application Rate (RAR). Note that RAR measurements were not made in NCDOT RP 2014-03.
Field Core Experiments To further evaluate pavement emulsion absorption in a more controlled environment, the existing surface condition and emulsion absorption capacity of field core samples were evaluated in the laboratory. Due to the lack of construction-related time constraints and traffic control needs in the laboratory, the field cores samples allowed for more detailed surface texture assessment, using both the sand patch test and a laser profilometer, as well as color measurements using a Colorimeter. Furthermore, relatively few tack coat field projects could be coordinated during the project and thus, the evaluation of the field cores allowed for a broader assessment of emulsion absorption in tack coat applications. The field cores were extracted by NCDOT personnel and

18
delivered to the research team. It should be noted that the field cores were not extracted from the wheel path where field measurements were conducted and were from entirely different pavement sections. Thus, there is no correspondence between the Project IDs in Table 3 and Core IDs in Table 4. A Chroma Meter CR400 was used to quantify the color of the field core surfaces prior to emulsion application. The Colorimeter quantifies three parameters that define the color of a surface: L*, C*, and h. L* is a measure of lightness versus darkness, C* is a measure of brightness versus dullness, and h is a measure of hue. The Colorimeter could not be used in field experiments due to its concurrent laboratory use in NCDOT RP 2017-01 and NCDOT RP 2020-15. The laser profilometer quantifies surface texture by measuring the distance between a laser sensor and the pavement surface at varying longitudinal and transverse locations (Adams and Kim 2014). The stationary profilometer includes a point laser with adjustable resolution. For this study, a laser scan area of 100 mm (3.9 in) by 100 mm (3.9 in) was utilized for all surfaces with 0.5 mm (0.02 in) resolution. Scanning time was approximately six minutes, which is why the use of the laser was limited to the laboratory. The laser was mounted on a set of bed risers to allow for analysis of raised samples. Given the vertical clearance under the mounted laser, the field cores were sawn below the surface to a maximum thickness of six inches. Samples were adjusted under the laser to achieve a level surface and then scanned. Gwyddion software was used to process the result to determine the Mean Profile Depth (MPD). Subsequently, the texture was evaluated using the sand patch test using a reduced sample volume than specified in ASTM E965-15 given the limited diameter of the field cores. The emulsion application rate applied to the field core samples was controlled via mass measurements of emulsion applied to the core. To simulate chip seal applications, CRS-2L emulsion was applied to field cores by pouring emulsion onto the sample and spreading uniformly using a paint brush to achieve a target EAR of 0.30 gal/yd2. To simulate tack coat applications, CRS-1h emulsion was poured into a graduated cylinder and then carefully poured and spread onto the field core using a foam paint brush to achieve a target EAR of 0.08 gal/yd2. Note that applying emulsion at a target rate of 0.06 gal/yd2 to match that used in field projects was initially tried but was very difficult to control, which was rectified by increasing the target application rate to 0.08 gal/yd2. The absorption capacity of a surface is assumed to be independent of the applied emulsion and therefore, the discrepancy between field and laboratory application rates was considered acceptable. Samples were rejected/excluded from analyses if the emulsion began to visually break prior to Tack Lifter testing completion. The actual applied EAR was calculated based on the measured mass of emulsion applied to each core combined with image analysis of a photo taken of the sample after Tack Lifter testing with a scale present, which allowed for calculation of the area over which the emulsion was applied. The effective EAR was measured by conducting Tack Lifter testing on the core within one minute of emulsion application in an analogous approach to field measurements. The effective RAR was measured by reweighing the Tack Lifter sheet following full curing. The applied RAR was estimated based on the measured applied EAR combined with the specified water content of the emulsion. Table 4 summarizes the field cores evaluated based on the surface type, emulsion applied, and target EAR. Note that the majority of cores were used to simulate tack coat applications given that relatively few tack coat field experiments were conducted relative to chip seals. Furthermore, since

19
aged asphalt mixture constituted the only surface type to which a chip seal would be applied, all field cores with new or milled surfaces were used to simulate tack coat application.
Table 4. Field Core Summary
Core ID Surface Type Emulsion Target EAR (gal/yd2)
1 Aged Asphalt CRS-1h 0.08 2 Aged Asphalt CRS-1h 0.08 3 Milled Asphalt CRS-1h 0.08 4 Milled Asphalt CRS-1h 0.08 5 Milled Asphalt CRS-1h 0.08 6 New Asphalt CRS-1h 0.08 7 New Asphalt CRS-1h 0.08 8 New Asphalt CRS-1h 0.08 9 New Asphalt CRS-1h 0.08
10 New Asphalt CRS-1h 0.08 11 Aged Asphalt CRS-2L 0.30 12 Aged Asphalt CRS-2L 0.30 13 Aged Asphalt CRS-2L 0.30
EXPERIMENTAL RESULTS Field Experiments The collective field project results are summarized in Table 5. Note that each measurement represents results of a minimum of two replicates each for measurements of MTD, applied EAR, effective EAR, applied RAR, and effective RAR. The reported absorbed EAR results were calculated based on the average applied EAR results at the measurement location minus the average effective EAR at the same location. Absorbed RAR values were calculated using an analogous approach. Note that MTD measurements were not made in the field projects with IDs of 7 and 13 due to time constraints in the construction process, which prohibited the measurements.

20
Table 5. Collective Field Project Summary
ID Application
Surface Type
Emulsion Target EAR
(gal/yd2) Meas. MTD
(mm)
Applied EAR
(gal/yd2)
Absorbed EAR
(gal/yd2)
Absorbed RAR
(gal/yd2)
1 Chip Seal CRS-2L 0.25 1 0.83 0.24 0.020 NA 2 1.42 0.26 0.070 NA
2 Chip Seal CRS-2L 0.30 1 0.86 0.34 0.033 NA 2 0.77 0.33 0.019 NA
3 Chip Seal CRS-2L 0.30 1 0.44 0.31 0.020 0.012 2 0.44 0.28 0.041 0.025
4 Chip Seal CRS-2L 0.30 1 1.32 0.29 0.036 0.027 2 1.26 0.31 0.057 0.040
5 Chip Seal CRS-2L 0.30 1 1.29 0.31 0.07 0.048 2 1.26 0.32 0.05 0.035
6 Aged Asphalt CRS-2L 0.30
1 1.32 0.30 0.064 NA 2 1.62 0.32 0.089 NA
7 Aged Asphalt CRS-2L 0.25 1 NA 0.24 0.085 0.059
2 NA 0.25 0.048 0.044
8 Aged Asphalt CRS-2L 0.30 1 0.61 0.32 0.026 0.016
2 0.61 0.29 0.046 0.029
9 Aged Asphalt CRS-2L 0.25
1 0.66 0.24 0.042 0.026 2 0.66 0.27 0.031 0.022
10 Aged Asphalt CRS-1h 0.06 1 1.07 0.08 0.043 0.030
2 1.07 0.06 0.033 0.021
11 Aged Asphalt CRS-1h 0.06 1 1.08 0.05 0.036 0.024
12 Milled Asphalt CRS-1h 0.06 1 1.57 0.07 0.041 0.021
13 New HMA CRS-1h 0.06 1 NA 0.04 0.015 0.009
The field measurements of applied EAR along with the corresponding target EAR values for all measurement locations are shown graphically in Figure 7. The data series are numbered according to the IDs given in Table 3 and Table 5 along with the measurement number in the case where two measurements were made. Figure 7 demonstrates that the target and in-situ EARs were generally within ± 0.03 gal/yd2 in chip seal applications and within ± 0.02 gal/yd2 for tack coat applications. However, some sections were outside of the current NCDOT tolerance ranges for chip seal and tack coat applications, which are ± 0.03 gal/yd2
and ± 0.01 gal/yd2, respectively.

21
Figure 7. Field project applied EAR results.
Figure 8 shows the collective field measurements of MTD and absorbed EAR. The results show that absorbed EARs vary considerably among projects and in some cases even within a project when the texture is highly variable (e.g., Project 1). The results show that higher MTD values often correspond to higher rates of emulsion absorption; however, this trend does not hold in all cases. Visually, it is difficult to infer if application type (i.e., tack coat versus chip seal) and application surface type yield differences in absorbed EAR. Note that the tack coat field projects with IDs of 10 and 11 included aged asphalt mixture application surfaces, 12 included milled asphalt as the application surface, and 13 included new asphalt mixture as the application surface as indicated in Table 5.
0.00
0.05
0.10
0.15
0.20
0.25
0.30
0.35
0.40Ap
plie
d EA
R (g
al/y
d2)
Location
Measured EARTarget EAR
Chip Seal Application on Chip Seal Chip Seal Application on Asphalt Mixture
Tack Coat Application

22
Figure 8. Field project absorbed EAR and MTD results.
Figure 9 shows the relationship between the measurements of absorbed EAR and absorbed RAR for all project measurement locations. The results show a high correlation is evident, indicating that either EAR or RAR measurements can be used to inform refinement of the target EAR during construction to account for emulsion absorption. Furthermore, there is no clear bias in the trends of tack coat and chip seal emulsions. The results indicate an average of 71 percent binder content. The specified binder contents of the emulsions were 60 to 70 percent and thus, these results suggest that a slightly higher proportion of binder is absorbed by the pavement than reflected by the binder content of the applied emulsion. It is speculated that this is due to the greater affinity of the binder to the existing surface compared to water. RAR measurements negate the need for mass measurements in the field; however, the emulsion must fully cure prior to mass measurement and therefore, RAR measurements could not be used to inform refinement of the target EAR directly preceding construction. Rather, if RAR measurements are used to inform refinement of the target EAR, Tack Lifter tests would need to be conducted at least one day prior to construction.
0.0
0.2
0.4
0.6
0.8
1.0
1.2
1.4
1.6
1.8
2.0
0.00
0.01
0.02
0.03
0.04
0.05
0.06
0.07
0.08
0.09
0.10
MTD
(mm
)
Abso
rbed
EAR
(gal
/yd2
)
Location
Absorbed EARMTD
Chip Seal Application on Chip Seal Chip Seal Application on Asphalt Mixture
Tack Coat Application

23
Figure 9. Relationship between Absorbed EAR and RAR field measurements.
Figure 10 and Table 6 show the average MTD and absorbed EAR values as a function of application and surface types. The numbers following the application surface designation indicate the number of measurement locations that the average values were calculated from. The error bars in Figure 10 correspond to the standard error of the absorbed measurements. The chip seal application results visually indicate similar absorbed EAR values irrespective of the application surface given the overlap of the error bars shown in Figure 10. The MTD values of aged asphalt mixtures and chip seals are also comparable. The tack coat application results show very similar absorbed EAR values for the aged asphalt mixture and milled asphalt mixture surface types despite notable MTD differences. The tack coat applied to a new asphalt mixture yielded a lower absorbed EAR than the other tack coat application surfaces, which matches expectations. However, it should be noted that the absorbed EAR was only measured at a single tack coat project with a new asphalt mixture application surface and a single tack coat project with a milled asphalt mixture surface and therefore, the results may not be broadly representative.
y = 1.4068xR² = 0.923
0.00
0.02
0.04
0.06
0.08
0.10
0.00 0.02 0.04 0.06 0.08
Abso
rbed
EAR
(gal
/yd2
)
Absorbed RAR (gal/yd2)
Chip SealTack Coat

24
Figure 10. Average field measurements of absorbed EAR and MTD results for different
applications and surface types. Table 6. Average Field Measurements of Absorbed EAR and MTD for Different
Application and Surface Types
Application Surface Type (number of measurements)
Average Absorbed
EAR
Standard Error
Average MTD
Standard Error
Chip Seal Chip Seal (10) 0.041 0.006 0.990 0.131 Chip Seal Aged Asphalt Mix (8) 0.054 0.008 0.914 0.221 Tack Coat New Asphalt Mix (1) 0.015 0.003 NA NA Tack Coat Aged Asphalt Mix (3) 0.037 NA 1.073 0.005 Tack Coat Milled Asphalt Mix (1) 0.041 NA 1.570 NA
To further evaluate the effects of application type and application surface type on the absorbed EAR, statistical analyses were conducted. F-tests were conducted to evaluate if differences in the variance among absorbed EAR values from different application surfaces and types exist. Subsequently, Student’s t-tests were conducted to evaluate the statistical significance of differences in mean absorbed EAR values; t-tests were conducted assuming equal variance if the F-test results indicated equal variance based on a 95 percent confidence level and unequal variance otherwise. Three statistical comparisons were made: chip seal applications to existing chip seals versus aged asphalt mixtures, chip seal applications versus tack coat applications, and chip seal versus tack coat applications to aged asphalt mixtures only. The latter allows for more direct evaluation of the application type than considering all tack coat versus all chip seal results. Statistical evaluation of the effect of application surface in tack coat applications was not conducted because of the limited measurements on new and milled surface types.
0.0
0.2
0.4
0.6
0.8
1.0
1.2
1.4
1.6
1.8
2.0
0.00
0.01
0.02
0.03
0.04
0.05
0.06
0.07
0.08
0.09
0.10
Chip Seal (10) Aged Asphalt Mix(8)
New Asphalt Mix(1)
Aged Asphalt Mix(3)
Milled Asphalt Mix(1)
MTD
(mm
)
Abso
rbed
EAR
(gal
/yd2
)
Application Surface
Absorbed EARMTD
Chip Seal Tack Coat

25
The p-value results of the statistical analyses are presented in Table 7. Significant differences were assessed using a 95 percent confidence level; that is, p-values less than 0.05 were used to identify significant differences. The results demonstrate that chip seal applications to existing chip seals and aged asphalt mixtures yield statistically equivalent variance and mean values. When a broad comparison of all chip seal versus tack coat results is conducted, statistical differences in the two application types are not detected. However, when a more direct comparison is conducted using chip seal versus tack coat applications to only aged asphalt mixtures, statistically significant differences in the variance and mean values exist between the two application types.
Table 7. p-values from F-Tests and t-Tests of Absorbed EAR Comparisons
Comparison F-Test t-Test Chip Seal on Chip Seal vs. Chip Seal on Aged Asphalt Mix 0.288 0.112
Chip Seal vs. Tack Coat Application 0.103 0.102 Chip Seal on Aged Asphalt Mix vs. Tack Coat on Aged Asphalt Mix 0.046 0.048
Based on the statistical analysis results and the similar absorbed EAR results among milled versus aged asphalt mixture results in tack coat applications shown in Figure 10, average absorbed EAR values were calculated and rounded to the nearest hundredth of a gal/yd2 for two categories: chip seal applied to an existing chip seal or aged asphalt mixture and tack coat applied to aged or milled asphalt mixture. These average values are shown in Table 8 and can be used by the NCDOT to inform refinement of the target EAR during construction in the absence of project-specific Tack Lifter testing. Given that the absorbed EAR was only measured in a single project that included the application of a tack coat to new asphalt mixture, an average value for this application condition is not reported in Table 8.
Table 8. Average Absorbed EAR Values for NCDOT Use
Application Surface Type Average Absorbed EAR gal/yd2
Chip Seal Chip Seal or Aged Asphalt Mix 0.05 Tack Coat Aged or Milled Asphalt Mix 0.04
To evaluate if texture measurements could be integrated for predicting the appropriate absorbed EAR value in the absence of project-specific Tack Lifter testing, the relationship between the absorbed EAR measurements and MTD was investigated. Figure 11 shows the correlation between the field measurements of absorbed EAR and MTD. A moderate correlation (R2 = 0.47) is evident, indicating higher MTD values generally correspond to higher absorption rates. No clear visual bias in the trends of tack coat versus chip seal results is apparent in Figure 11. However, it is worth noting that the tack coat measurements do all fall below the regression line, which matches the expected trend based on the results presented above that suggest slightly lower absorbed EAR values in tack coat applications compared to chip seals when the application surface type is consistent.

26
Figure 11. Relationship between field measurements of absorbed EAR and MTD.
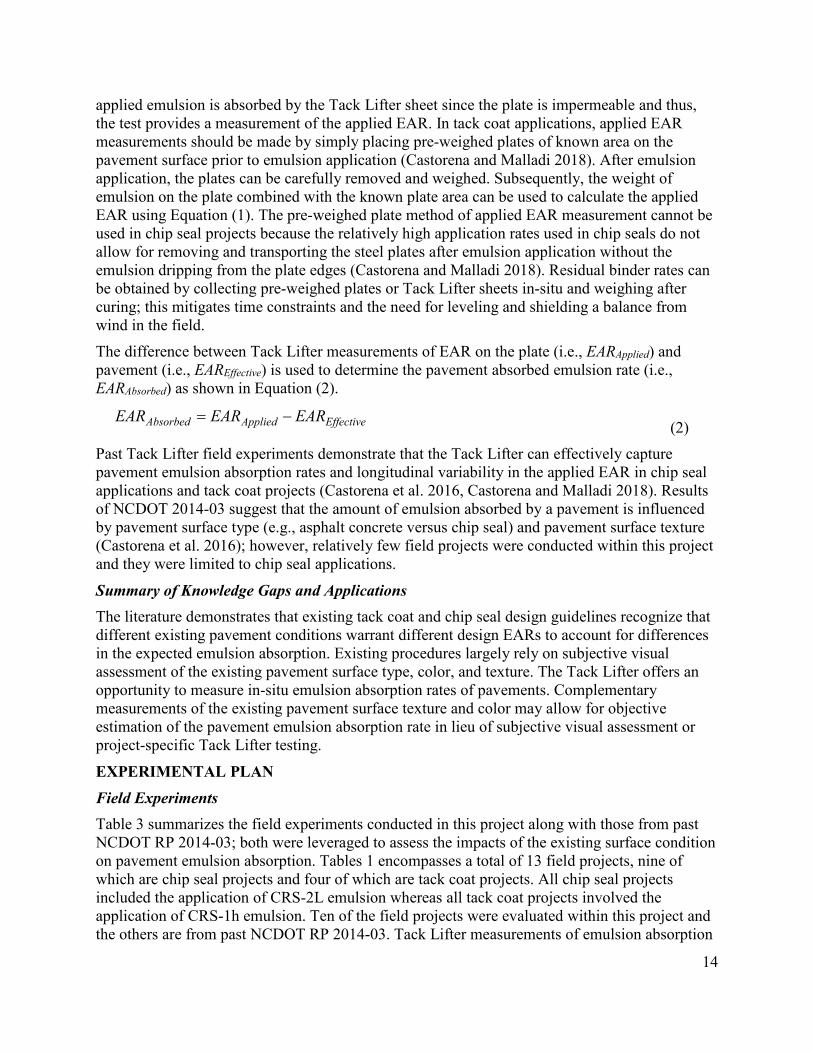
Based on the results presented, a regression model to estimate the absorbed EAR as a function of MTD and application type was calibrated using all field measurements of absorbed EAR where corresponding MTD values were available. Application type was included by assigning a value of zero for chip seal applications and one for tack coat applications. Initially, the regression model was calibrated included an intercept but the intercept was statistically insignificant so the model was recalibrated using an intercept of zero. Table 9 shows the resultant regression model and Figure 12 depicts the model accuracy. Table 9 demonstrates that both independent model variables are statistically significant using a confidence level of 95 percent since the p-values are less than 0.05. Furthermore, the coefficient values match intuition based on the results previously presented; the coefficients suggest that a higher MTD yields a higher absorbed EAR and that chip seals yield higher absorbed EAR than tack coats. Figure 12 shows that the model has moderate predictive capability, indicated by the R2 of 0.56 and Root Mean Squared Error (RMSE) of 0.012 gal/yd2. The regression model in Table 9 can be used to estimate the project-specific absorbed EAR in cases where the sand patch test is feasible but Tack Lifter measurements are not. However, given the scatter evident in Figure 12, it is evident that application type and texture depth are not the only factors that influence the absorbed EAR of a pavement.
Table 9. Regression Model for the Prediction of Absorbed EAR
Factor Coefficients Standard Error p-value
Mean Texture Depth (mm) 0.045119 0.0031 1.75·10-11
Application Type (0 for chip seal vs. 1 for tack coat) -0.01578 0.0073 0.045
y = 0.0343x + 0.0085R² = 0.467
0.00
0.02
0.04
0.06
0.08
0.10
0.0 0.2 0.4 0.6 0.8 1.0 1.2 1.4 1.6 1.8 2.0
Abso
rbed
EAR
(gal
/yd2
)
MTD (mm)
Chip SealTack Coat
27
Figure 12. Comparison between measured and regression model predictions of field
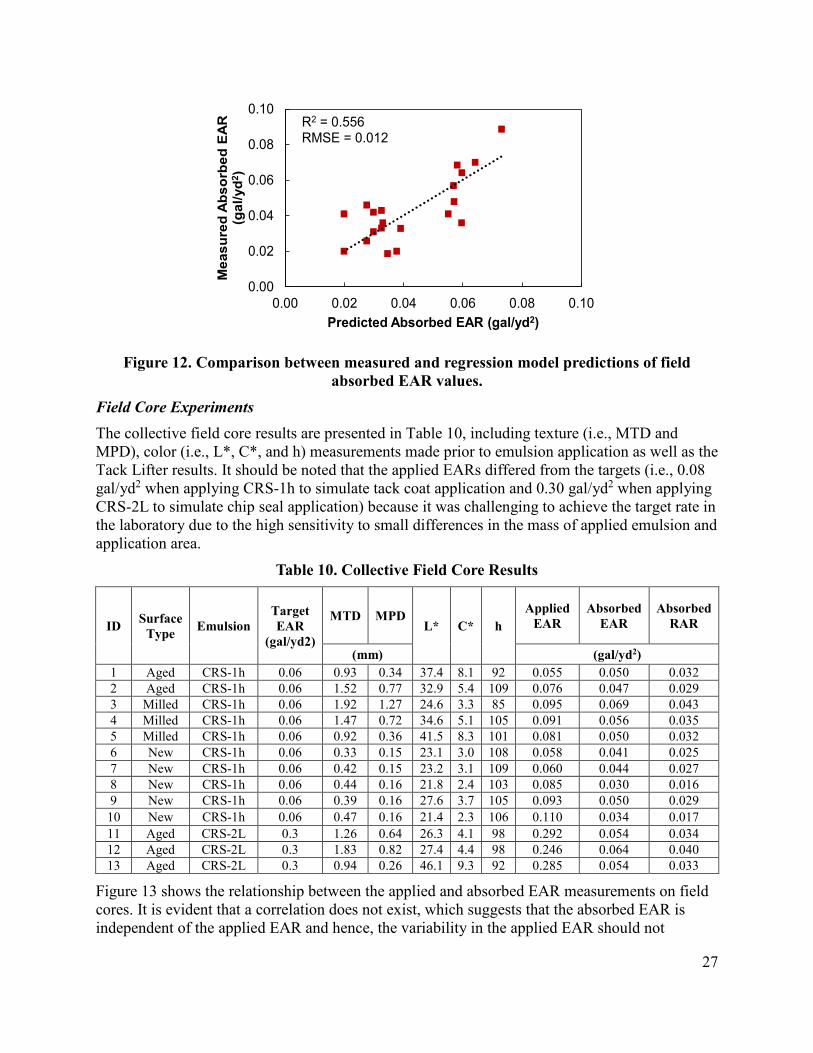
absorbed EAR values. Field Core Experiments The collective field core results are presented in Table 10, including texture (i.e., MTD and MPD), color (i.e., L*, C*, and h) measurements made prior to emulsion application as well as the Tack Lifter results. It should be noted that the applied EARs differed from the targets (i.e., 0.08 gal/yd2 when applying CRS-1h to simulate tack coat application and 0.30 gal/yd2 when applying CRS-2L to simulate chip seal application) because it was challenging to achieve the target rate in the laboratory due to the high sensitivity to small differences in the mass of applied emulsion and application area.
Table 10. Collective Field Core Results
ID Surface Type Emulsion
Target EAR
(gal/yd2)
MTD MPD L* C* h
Applied EAR
Absorbed EAR
Absorbed RAR
(mm) (gal/yd2) 1 Aged CRS-1h 0.06 0.93 0.34 37.4 8.1 92 0.055 0.050 0.032 2 Aged CRS-1h 0.06 1.52 0.77 32.9 5.4 109 0.076 0.047 0.029 3 Milled CRS-1h 0.06 1.92 1.27 24.6 3.3 85 0.095 0.069 0.043 4 Milled CRS-1h 0.06 1.47 0.72 34.6 5.1 105 0.091 0.056 0.035 5 Milled CRS-1h 0.06 0.92 0.36 41.5 8.3 101 0.081 0.050 0.032 6 New CRS-1h 0.06 0.33 0.15 23.1 3.0 108 0.058 0.041 0.025 7 New CRS-1h 0.06 0.42 0.15 23.2 3.1 109 0.060 0.044 0.027 8 New CRS-1h 0.06 0.44 0.16 21.8 2.4 103 0.085 0.030 0.016 9 New CRS-1h 0.06 0.39 0.16 27.6 3.7 105 0.093 0.050 0.029 10 New CRS-1h 0.06 0.47 0.16 21.4 2.3 106 0.110 0.034 0.017 11 Aged CRS-2L 0.3 1.26 0.64 26.3 4.1 98 0.292 0.054 0.034 12 Aged CRS-2L 0.3 1.83 0.82 27.4 4.4 98 0.246 0.064 0.040 13 Aged CRS-2L 0.3 0.94 0.26 46.1 9.3 92 0.285 0.054 0.033
Figure 13 shows the relationship between the applied and absorbed EAR measurements on field cores. It is evident that a correlation does not exist, which suggests that the absorbed EAR is independent of the applied EAR and hence, the variability in the applied EAR should not
0.00
0.02
0.04
0.06
0.08
0.10
0.00 0.02 0.04 0.06 0.08 0.10
Mea
sure
d A
bsor
bed
EAR
(g
al/y
d2)
Predicted Absorbed EAR (gal/yd2)
R2 = 0.556RMSE = 0.012

28
influence inferences related to the absorbed EAR. The lack of a relationship between absorbed and applied EAR is expected since the absorption capacity of a given surface is a fixed quantity, assumed to be smaller than the applied EAR.
Figure 13. Relationship between absorbed and applied EAR values on field cores.
Figure 14 shows the relationship between the absorbed EAR and absorbed RAR of the field cores samples. A high correlation (R2 = 0.94) exists between the two quantities; however, it is noted that the slope of the relationship between the absorbed EAR and RAR of the field cores differs somewhat from the results of field measurements shown in Figure 9 (1.62 for field cores versus 1.41 for field measurements). Note that field measurements of the applied and effective RARs were made to calculate the absorbed RAR whereas the applied RAR of the field core samples was calculated based on the measurement of the applied EAR, which could contribute to these differences. In addition, preferential absorption of the binder from the emulsion into the existing pavement in the field versus the lab may differ due to the differences in emulsion application procedures (i.e., distributor application in the field versus pouring/spreading with a brush in the lab) and possible presence of dirt and water in the field that were not present in the lab.
0.00
0.02
0.04
0.06
0.08
0.10
0.00 0.10 0.20 0.30 0.40
Abso
rbed
EAR
(gal
/yd2
)
Applied EAR (gal/yd2)
Chip SealTack Coat

29
Figure 14. Relationship between absorbed EAR and RAR values for the field core experiments.
Figure 15 shows the absorbed EAR results of individual field cores as a function of surface type. The average absorbed EAR values and corresponding standard errors as a function of surface type and application type are shown in Table 11. It is difficult to infer clear trends with respect to surface and application type from Figure 15. Table 11 shows that, on average, new asphalt mixtures absorb less emulsion than aged and milled surfaces. The average absorbed EAR of aged and milled cores in tack coat applications are similar, which matches field findings. The average absorbed EAR in chip seal applications to aged asphalt mixtures is 0.01 gal/yd2 higher than in tack coat applications, which also matches the trends with respect to tack coat versus chip seal applications found from field experiments.
y = 1.6231xR² = 0.943
0.00
0.02
0.04
0.06
0.08
0.10
0.00 0.02 0.04 0.06 0.08
Abso
rbed
EAR
(gal
/yd2
)
Absorbed RAR (gal/yd2)
Chip SealTack Coat

30
Figure 15. Absorbed EAR values of field cores as a function of surface type. Red indicates chip seal emulsion was applied; gray indicates tack coat.
Table 11. Average Absorbed EAR Values and Corresponding Standard Errors for Field Cores Experiments
Application Type Application Surface Average Absorbed EAR (gal/yd2) Standard Error
Tack Coat Aged Asphalt Mix 0.05 0.0014 Tack Coat Milled Asphalt Mix 0.06 0.0058 Tack Coat New Asphalt Mix 0.04 0.0036 Chip Seal Aged Asphalt Mix 0.06 0.0033
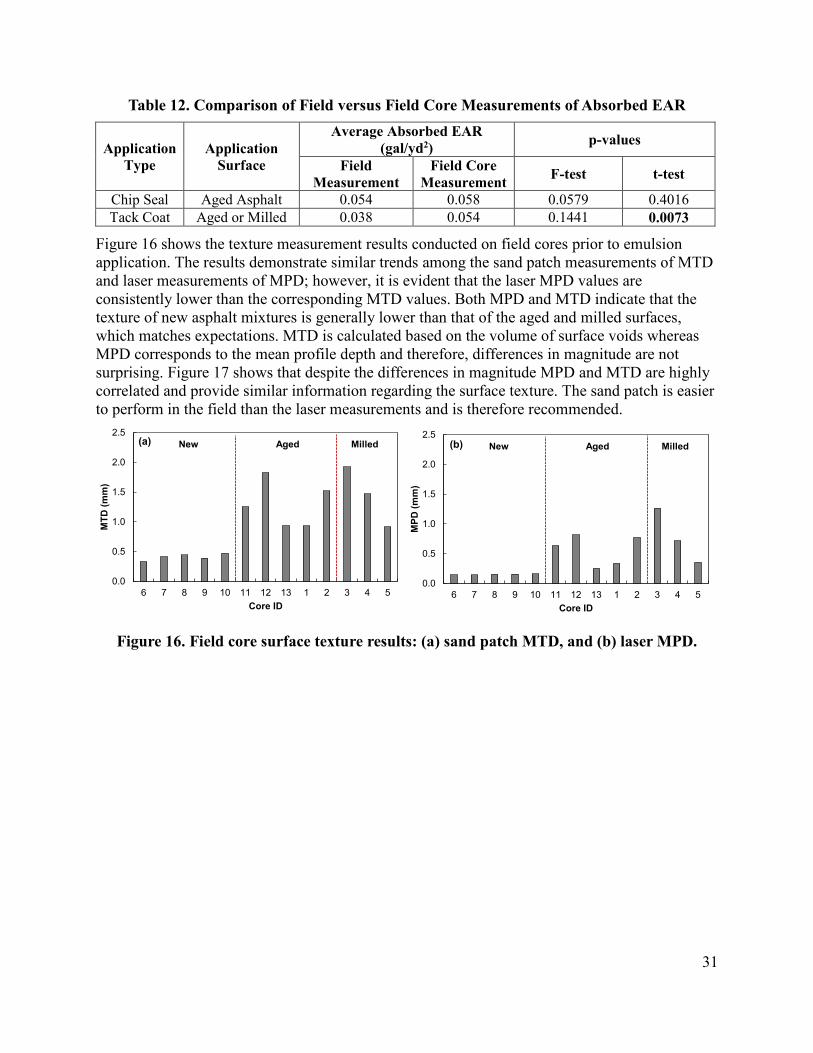
Table 12 shows a comparison of field versus field core average measurements of absorbed EAR values where comparisons could be made; these included chip seal applications to aged asphalt mixtures and tack coat applications to aged and milled surfaces. The results demonstrate that the average field measurements of absorbed EAR are higher than those from the laboratory measurements on field core. These differences were evaluated statistically. The resultant p-values from the statistical analyses are shown in Table 12. First, F-tests were conducted to determine if the variance of field measurements and field core measurements were equivalent. Then, t-tests were conducted to evaluate differences in the mean values. Then, t-tests were conducted assuming equal variance since F-tests indicated p-values that exceeded 0.05 in both cases (indicating the variances of field and field core measurements were equal based on a 95 percent confidence level). The absorbed EAR values of field cores in tack coat applications are statistically different from the field measurements based on the t-test results. This could be due to differences in application procedures in the field versus the lab. In addition, field measurements were made in the wheel path whereas field cores were extracted outside of the wheel path, which could further lead to differences. Given that traffic wears down the texture and densifies the pavement, it is expected that the wheel path would have a lower absorption capacity than the surrounding pavement which matches the general trends when comparing field versus laboratory measurements.
0.000.010.020.030.040.050.060.070.080.090.10
6 7 8 9 10 11 12 13 1 2 3 4 5
Abso
rbed
EAR
(gal
/yd2 )
Core ID
New Aged Milled
31
Table 12. Comparison of Field versus Field Core Measurements of Absorbed EAR
Application Type
Application Surface
Average Absorbed EAR (gal/yd2) p-values
Field Measurement
Field Core Measurement F-test t-test
Chip Seal Aged Asphalt 0.054 0.058 0.0579 0.4016 Tack Coat Aged or Milled 0.038 0.054 0.1441 0.0073
Figure 16 shows the texture measurement results conducted on field cores prior to emulsion application. The results demonstrate similar trends among the sand patch measurements of MTD and laser measurements of MPD; however, it is evident that the laser MPD values are consistently lower than the corresponding MTD values. Both MPD and MTD indicate that the texture of new asphalt mixtures is generally lower than that of the aged and milled surfaces, which matches expectations. MTD is calculated based on the volume of surface voids whereas MPD corresponds to the mean profile depth and therefore, differences in magnitude are not surprising. Figure 17 shows that despite the differences in magnitude MPD and MTD are highly correlated and provide similar information regarding the surface texture. The sand patch is easier to perform in the field than the laser measurements and is therefore recommended.
Figure 16. Field core surface texture results: (a) sand patch MTD, and (b) laser MPD.
0.0
0.5
1.0
1.5
2.0
2.5
6 7 8 9 10 11 12 13 1 2 3 4 5
MTD
(mm
)
Core ID
New Aged Milled(a)
0.0
0.5
1.0
1.5
2.0
2.5
6 7 8 9 10 11 12 13 1 2 3 4 5
MPD
(mm
)
Core ID
New Aged Milled(b)

32
Figure 17. Relationship between sand patch MTD and laser MPD texture measurements. Figure 18 shows the relationship between absorbed EAR measurements and texture measurements of the field core samples. Moderate correlations with R2 exceeding 0.6 between the absorbed EAR and surface texture measurements from both sand patch and laser methods are evident with higher texture generally indicated higher rates of absorption. There is no clear bias in the results of chip seal versus tack coat applications. While a moderate correlation between the absorbed EAR and MTD was also observed in field measurements, the sensitivity of the absorbed EAR to MTD was more apparent in the field as shown in Figure 11. The slope of the best-fit line to the absorbed EAR versus MTD is 0.034 whereas the best-fit line has a slope of 0.016 in Figure 18 (a); this further suggests possible differences in laboratory versus field (or non-wheel path versus wheel path) absorbed EAR values.
Figure 18. Relationship between absorbed EAR and surface texture of field cores based on (a) sand patch MTD and (b) laser MPD.
Figure 19 shows the Colorimeter measurement results of the field cores obtained prior to emulsion application. L* is a measure of the difference between light and dark with higher
y = 1.4814x + 0.303R² = 0.9189
0
0.5
1
1.5
2
2.5
0 0.5 1 1.5
MTD
(mm
)
MPD (mm)
y = 0.0159x + 0.0337R² = 0.675
0.000
0.020
0.040
0.060
0.080
0.100
0.00 0.50 1.00 1.50 2.00 2.50
Abso
rbed
EAR
(gal
/yd2
)
MTD (mm)
Chip SealTack Coat
(a) y = 0.0246x + 0.0382R² = 0.6304
0.000
0.020
0.040
0.060
0.080
0.100
0.00 0.50 1.00 1.50
Abso
rbed
EAR
(gal
/yd2
)
MPD (mm)
Chip SealTack Coat
(b)

33
values indicate lighter conditions. C* is measure of brightness versus dullness with higher values indicating brighter conditions. h is a measure of the color hue. Figure 19 (a) and (b) indicate similar trends that suggest lower values in new asphalt compared to aged and milled conditions. Trends in Figure 19 (c) with respect to surface type are less clear, suggesting that hue is less closely tied to the surface type compared to L* and C*.
Figure 19. Field core colorimeter results: (a) L*, (b) C*, and (c) h. Figure 20 shows the relationships among the three Colorimeter readings. It is evident that C* and L* are highly correlated for field core surfaces (R2 = 0.97). However, h appears to provide unique information as no clear relationship with L* or C* is evident in Figure 20 (b) or (c).
0
10
20
30
40
50
60
6 7 8 9 10 11 12 13 1 2 3 4 5
L*
Core ID
New Aged Milled(a)
0
2
4
6
8
10
12
6 7 8 9 10 11 12 13 1 2 3 4 5
C*
Core ID
New Aged Milled(b)
7580859095
100105110115120125
6 7 8 9 10 11 12 13 1 2 3 4 5
h
Core ID
New Aged Milled(c)

34
Figure 20. Relationships among colorimeter parameters: (a) L* versus C*, (b) L* versus h, and (c) C* versus h.
Figure 21 shows the relationships between the field core measurements of the absorbed EAR and color. No relationship is evident between the absorbed EAR and L* or C* in Figure 21 (a) or (b), respectively. However, h shows evidence of a weak to moderate relationship with the absorbed EAR (R2 = 0.42), suggesting that measurements of hue may help to predict the absorbed EAR in the absence of project-specific Tack Lifter testing. There is no clear bias in the results of chip seal versus tack coat applications.
y = 3.534x + 13.171R² = 0.970
0
10
20
30
40
50
0 2 4 6 8 10
L*
C*
(a)y = -0.305x + 60.254
R² = 0.0790
10
20
30
40
50
75 85 95 105 115 125
L*
h
(b)
y = -0.096x + 14.341R² = 0.101
0
2
4
6
8
10
75 85 95 105 115 125
C*
h
(c)

35
Figure 21. Relationship between absorbed EAR and colorimeter results of field cores: (a)
L*, (b) C*, and (c) h. Linear regression analyses were conducted to further evaluate the relationship between sand patch texture measurements, Colorimeter measurements of hue, and the absorbed EAR of field cores. Five regression models were calibrated using varying numbers and combinations of three independent variables to predict the absorbed EAR: MTD, h, and application type (0 for chip seal versus 1 for tack coat). The results are presented in Table 13. Cases where the independent variable was deemed significant using a confidence level of 95 percent (i.e., where the p-value is less than 0.05) are indicated in bold within Table 13. Model 1 in Table 13 demonstrates that when MTD, h, and application type are used to calibrate a regression model to predict the absorbed EAR, only the intercept and MTD are statistically significant. Similarly, Model 2 in Table 13 demonstrates that only the intercept and MTD are statistically significant when a model is calibrated using MTD and h. Model 3 shows that only the intercept and MTD are statistically significant when a model is calibrated using MTD and type, which were the parameters used to calibrate the field measurement regression model summarized in Table 9 and Figure 12. The results, therefore, do not suggest that MTD and h can be used together to improve the prediction of the absorbed EAR measured using the field core samples. However, since a greater sensitivity of the field measurements of absorbed EAR to MTD was observed in the field compared to the lab, the incorporation of color hue to improve estimation of the absorbed EAR may merit further investigation in the field. Models 4 and 5 in Table 13 show that MTD and h are statistically significant variables when included in a regression model in isolation from each other and other
y = 0.0004x + 0.0366R² = 0.0983
0.00
0.02
0.04
0.06
0.08
0.10
0 10 20 30 40 50
Abso
rbed
EAR
(gal
/yd2
)
L*
Chip SealTack Coat
(a)
y = 0.0014x + 0.0427R² = 0.0913
0.00
0.02
0.04
0.06
0.08
0.10
0 2 4 6 8 10
Abso
rbed
EAR
(gal
/yd2
)
C*
Chip SealTack Coat
(b)
y = -0.0009x + 0.1446R² = 0.4167
0.00
0.02
0.04
0.06
0.08
0.10
75 85 95 105 115 125
Abso
rbed
EAR
(gal
/yd2
)
h
Chip SealTack Coat
(c)

36
independent variables. Model 4 has the highest R2 of all models where all independent variables are statistically significant.
Table 13. Field Core Absorbed EAR Regression Models Model 1 Model 2 Model 3 Model 4 Model 5
Variable Coeff. Value
p-value
Coeff. Value
p-value
Coeff. Value
p-value
Coeff. Value
p-value
Coeff. Value
p-value
Intercept 0.0793 0.032 0.0805 0.023 0.0375 0.000 0.0337 0.000 0.1446 0.001 MTD 0.0126 0.011 0.0129 0.006 0.0149 0.002 0.0159 0.001
h -0.0004 0.208 -0.0004 0.147 -0.0009 0.017 Type -0.0022 0.647 -0.004 0.453
R2 0.746 0.739 0.694 0.675 0.417 Standard
Error 0.006 0.006 0.007 0.007 0.009
FINDINGS AND CONCLUSIONS The following findings and conclusions are drawn from this study: 1. The Tack Lifter field experiments conducted on 13 pavements indicate that the absorbed
EAR vary considerably depending on the existing pavement surface conditions. Therefore, Tack Lifter testing is recommended to determine the project-specific emulsion pavement absorption rate wherever possible.
2. Field measurements of emulsion absorption rate indicate the mean and variance of emulsion rates in existing chip seals and aged asphalt mixtures are statistically equivalent in chip seal applications.
3. Statistical analysis of the field measurements acquired in this study indicate that the application (i.e., chip seal versus tack coat) and mean texture depth measured via sand patch test affect the resultant pavement emulsion absorption rate. A linear regression model was calibrated to predict the pavement emulsion absorption rate as a function of mean texture depth and application that yielded moderate prediction accuracy (R2 = 0.56). The moderate prediction capability indicates that other factors that were not captured by the application type and texture influence the emulsion absorption capacity of pavements but allows for an approximation of the absorbed EAR in cases where project-specific Tack Lifter testing cannot be conducted.
4. Tack Lifter experiments conducted on field cores in the laboratory indicate that Colorimeter measurements of hue are moderately correlated to the pavement emulsion absorption rate (R2 = 0.42). Tack Lifter measurements conducted on field cores also indicated a correlation between the emulsion absorption rate and MTD (R2 = 0.68), confirming field observations that the surface texture influences the emulsion absorption capacity of pavements. A combined regression model including both MTD and hue as independent variables to predict the absorbed EAR yielded only MTD as a statistically significant variable; therefore, it is unclear if both MTD and hue can be used together to improve the estimation of the absorbed EAR of a pavement. The use of both MTD and hue to predict the absorbed EAR merits further investigation using field experiments.

37
5. Laser-based measurements of mean profile depth and sand patch-based measurements of mean texture depth were highly correlated for the 13 new asphalt mixture, aged asphalt mixture, and milled asphalt mixture field cores analyzed in this study.
6. Field core measurements of emulsion absorption rates indicated differences from field measurements of emulsion absorption rates with respect to sensitivity to the mean texture depth and mean values in tack coat applications. This could be due to differences in application procedures in the field versus the lab. In addition, field measurements were made in the wheel path whereas field cores were extracted outside of the wheel path, which could further lead to differences. Given that traffic wears down the texture and densifies the pavement, it is expected that the wheel path would have a lower absorption capacity than the surrounding pavement which matches the general trends when comparing field versus laboratory measurements.
RECOMMENDATIONS Based on the collective results of this study, the following guidelines are proposed to determine the pavement emulsion absorption rate. The guidelines include three approaches that can be used to determine the pavement emulsion absorption rate, which constitutes the amount of the applied emulsion that will be lost to absorption and therefore, unavailable to bond aggregate or asphalt mixture placed on top of it. These three approaches vary in terms of accuracy and simplicity. All methods are applicable to aged and milled asphalt mixture surfaces as a well as existing chip seal surfaces. Methods 2 and 3 are only applicable to aged asphalt mixture, milled asphalt mixture, and chip seal surfaces. The pavement absorbed EAR can be used to adjust the target emulsion application rate during the construction of chip seals and tack coats. Method 1: Tack Lifter Testing. Wherever possible, it is recommended that Tack Lifter tests be conducted in the wheel path on a test strip at the start of construction to determine the project-specific emulsion absorption rate following the procedure included in the appendix of the NCDOT RP 2017-34 final report. If significant changes in the surface condition are observed along the length of construction, Tack Lifter testing can be repeated at different locations to inform adjustment of the target EAR along the length of construction. Method 2: Prediction based on Mean Texture Depth. Sand patch testing can be conducted in accordance with ASTM E965 prior to construction and used within Equation (3) to estimate the appropriate emulsion absorption rate in lieu of Tack Lifter testing. Note that Method 2 encompasses some uncertainty as the model prediction accuracy of Equation (3) was moderate (R2 = 0.56).
0.045119Absorbed 0.015 8R = 7EA MTD Type× − × (3)
where: Absorbed EAR = pavement emulsion absorption rate in gal/yd2, MTD is the mean texture depth in mm determined via sand patch test, and Type is 0 for chip seal and 1 for tack coat. Method 3: Use of Average Values. If neither sand patch or Tack Lifter testing is deemed feasible, the average values of emulsion absorption rates measured in field projects and given in Table 14 can be used to adjust the target EAR during construction. These values reflect the amount of emulsion that is essentially lost to

38
absorption and unavailable to serve to bond aggregate or an adjacent asphalt layer. The specified application rate should be adjusted to account for the expected loss of emulsion due to absorption. This method is considered the least accurate of the three presented but is the simplest to implement.
Table 14. Average Absorbed EAR Values.
Application Surface Type Average Absorbed EAR gal/yd2
Chip Seal Chip Seal or Aged Asphalt Mix 0.05 Tack Coat Aged or Milled Asphalt Mix 0.04
Emulsion absorption was only quantified in one field project that included a new asphalt mixture surface. Given this limited data combined with the statistically significant differences observed in field core measurements versus field measurements of emulsion absorption rates in tack coat applications, guidance under Methods 2 and 3 above could not be provided for new asphalt mixture surfaces. Future work should further evaluate the emulsion absorption rates of new asphalt surfaces. Furthermore, laboratory investigations of emulsion absorption indicate that the hue of the existing pavement, quantified using a Colorimeter, may provide additional insight into the emulsion absorption capacity, which could be explored in the field in future research.
IMPLEMENTATION AND TECHNOLOGY TRANSFER PLAN It is recommended that the NCDOT implement the guidelines for determining pavement emulsion absorption rates provided under Recommendations. Implementation of Method 1 can be facilitated by adoption of the Tack Lifter into routine testing. Draft AASHTO standards for conducting Tack Lifter tests are provided in NCDOT RP 2017-23. Hands-on training of the NCDOT personnel will be provided by the research team.
39
CITED REFERENCES 1. Adams, J., and Y. R. Kim. Mean Profile Depth Analysis of Field and Laboratory Traffic-
loaded Chip Seal Surface Treatments, International Journal of Pavement Engineering, Vol. 15, No. 7, pp. 645-656.
2. ASTM International. Standard Test Method for Measuring Pavement Macrotexture Depth Using A Volumetric Technique, ASTM E965-15, West Conshohocken, PA, 2015.
3. Caltrans. Fog Seals, Caltrans Division of Maintenance, October 2003. 4. Castorena, C., and H. Malladi. Implementation of the Tack Lifter, Final Report
FHWA/NC/2017-34, North Carolina Department of Transportation, Raleigh, NC, 2018. 5. Castorena, C., M. Rawls, and J.H. Im. In-situ Measurement of Emulsion Application Rates
for Tack Coats and Pavement Surface Treatments, Final Report FHWA/NC/2014-03, North Carolina Department of Transportation, Raleigh, NC, 2016.
6. FHWA. Tack Coat Best Practices, Tech Brief, FHWA-HIF-16-017, 2016. 7. Gurer, C., M. Karas, C. Sedat, and B. Bekir Aktas. Effects of Construction-Related Factors
on Chip Seal Performance. Construction and Building Materials, Vol. 35, 2012, pp. 605–613.
8. Hakimzadeh, S., W. G. Buttlar, and R. Santarromana. Shear- and Tension-Type Tests to Evaluate Bonding of Hot-Mix Asphalt Layers with Different Tack Coat Application Rates. In Transportation Research Record: Journal of the Transportation Research Board, No. 2295, Transportation Research Board of the National Academies, Washington, D.C., 2012, pp. 54–62.
9. Kim, Y. R., and J. Adams. Development of a New Chip Seal Mix Design Method. Final Report HWY-2008-04. North Carolina Department of Transportation, Raleigh, 2011.
10. Kim, Y.R., and H.J. Park. Investigation of Primary Causes of Fatigue Cracking in Asphalt Pavement in North Carolina, NCDOT Final Report, HWY-2010-01, 2015.
11. Leng, Z., H. Ozer, I.L. Al-Qadi, and S.H. Carpenter. Interface Bonding Between Hot-Mix Asphalt and Various Portland Cement Concrete Surfaces: Laboratory Assessment. Transportation Research Record, No. 2057, pp. 46-53, 2008.
12. Malladi, M., and C. Castorena. Field Measurements of Emulsion Application Rates in Chip Seals and Tack Coats, Construction and Building Materials, Vol. 218, 2019, pp. 701-711.
13. McLeod, N. W. “A General Method of Design for Seal Coats and Surface Treatments,” Proceedings of the Association of Asphalt Paving Technologists, Vol. 38, pp. 537-630, 1969.
14. Mohammad, L. N., A. Bae, M. A. Elseifi, J. Button, and N. Patel. Effects of Pavement Surface Type and Sample Preparation Method on Tack Coat Interface Shear Strength. In Transportation Research Record: Journal of the Transportation Research Board, No. 2180, Transportation Research Board of the National Academies, Washington, D.C., 2010, pp. 93–101.
15. Mohammad, L. N., M. A. Elseifi, A. Bae, N. Patel, J. Button, and J. A. Scherocman. NCHRP Report 712: Optimization of Tack Coat for HMA Placement, Transportation Research Board of the National Academies, Washington, D.C., 2012.
16. North Carolina Department of Transportation. Asphalt Quality Management System Manual, Materials and Tests Unit, 2016.
17. Ohio Department of Transportation. Proper Tack Coat Application, Technical Bulletin, Dublin, Ohio, 2012.

40
18. Rawls, M. L., J. H. Im, and C. Castorena. Tack Lifter for in-situ measurement of effective emulsion application rates. In Transportation Research Record: Journal of the Transportation Research Board, No. 2550, Transportation Research Board of the National Academies, Washington, D.C., 2016, pp. 80–88.
19. Rawls, M. L., and C. Castorena. In-situ measurements of emulsion application rates. International Journal of Pavement Engineering, https://doi.org/10.1080/10298436.2017.1347438, 2017, pp. 1–9.
20. Shuler, S., A. Lord, A. Epps-Martin, and D. Hoyt. Manual for Emulsion-Based Chip Seals for Pavement Preservation, NCHRP Report 680, National Research Council, Washington, D.C., 2011.
21. Tayebali, A., Pour-Ghaz, M., Kusam, A., and R. Rashetnia. Alternate Methods for Evaluation of Moisture Sensitivity of Asphalt Mixtures. NCDOT Final Report, FY-2014-04, 2017.