Investigation of operational parameters effect on quality...
11
Bulgarian Chemical Communications, Volume 49, Special Issue J (pp. 19 – 28) 2017 19 Investigation of operational parameters effect on quality of HDPE in Ziegler-Natta solution polymerization of ethylene A. Ariayee 1 , A. Marjani *2 1 Department of Chemical Engineering, Farahan Branch, Islamic Azad University, Farahan, Iran 2 Department of Chemistry, Arak Branch, Islamic Azad University, Arak, Iran Received May 15, 2017; Revised August 21, 2017 In this project, simulation of high-density polyethylene production process was performed using Aspen Polymer software and after comparing the simulation data with experimental values, sensitivity analysis was conducted on operational parameters and the effects of these parameters on system performance were analyzed. PC-SAFT or POLYPCSF thermodynamic model was used for the thermodynamic expression of the system. Comparing the experimental values with simulation data demonstrated that the simulated process can properly show the system’s actual behavior. To carry out the sensitivity analysis of the flow rate of the input feed into the first reactor, flow rate of the input feed into the second reactor, temperature and pressure of the first reactor and temperature and pressure of the second reactor were considered as variable and the impact of these changes on the conversion rate in the reactor, the amount of the polymer produced, PDI and Mn of the produced polymer were examined. Studies revealed that increased flow rate reduces the conversion rate and increases the amount of the produced polymer. Further, increased pressure and decreased temperature lead to enhanced conversion rate and thus an increase in the amount of the polymer produced. Keywords: High-density polyethylene, Aspen polymer, PDI, Mn, conversion rate INTRODUCTION Polyethylene (polyethene) is the simplest polymer because two carbon atoms are connected to all carbons of the main chain. This polyethylene is of a thermoplastic type and the reason is that the bonds between nonpolar chains in this polymer are weak. Hence, polyethylene chains can slide over each other by heating and break the London bonds while the strong covalent bonds in the polymer are still maintained. Lateral branchless polyethylene chains can become so close to each other that they make high-density polyethylene. This polyethylene has more strength and flexibility compared to the ordinary polyethylene. Polyethylene is a chain polymer with 104 units or more of ethene. This polymer was accidentally formed in the 1930s when oxygen entered the container of ethene. Initially, the created wax-like white substance was not considered seriously. Subsequent tests showed that this substance has high stability and is a good electricity insulator. This substance was first used as the cable insulator and cover for the radar areas in World War II. Also, it was first applied as an electrical insulator in 1939. Various types of polyethylene have different applications including pipes, packaging fibers, production of plastic materials used in the kitchen, components of chemical plants, boxes, toys, bulletproof vests and electrical insulation. Due to its greater tensile strength and hardness, high-density polyethylene is used in the manufacture of pipes, production of liquids and milk containers and plastic kitchen appliances and many other utensils and containers [1, 2]. Different scholars have worked in the field of polymer processing simulation and have provided various reports in this regard. Hakim, et al. [3, 4] have carried out the simulation of ethylene polymerization in the slurry phase in steady state with Ziegler–Natta catalyst to produce high-density polyethylene. The results obtained from this simulation have been compared with the data related to the first reactor in High- Density Polyethylene Unit of Arak Petrochemical Complex. The desired model has the ability to predict the production rate, average molecular weight, dispersion index and concentration of monomer, co-monomer and hydrogen inside the reactor. Ethylene polymerization reactors can be placed alongside each other in a sequential or parallel form. For one of the HDPE extrusion grades in Arak Petrochemical Complex, there are two stirred tank reactors in series and the contents of the first reactor go to the second reactor. Since the contents of the second reactor go to the final reactor and the polymerization reaction gets complete in it, hydrogen, monomer, catalyst, co-catalyst and hexane solvent are fed into the first reactor and co- monomer (1 - butene), monomer and solvent are fed To whom all correspondence should be sent: E-mail: [email protected] 2017 Bulgarian Academy of Sciences, Union of Chemists in Bulgaria
Transcript of Investigation of operational parameters effect on quality...
Bulgarian Chemical Communications, Volume 49, Special Issue J (pp. 19 – 28) 2017
19
Investigation of operational parameters effect on quality of HDPE in Ziegler-Natta
solution polymerization of ethylene
A. Ariayee1, A. Marjani*2
1Department of Chemical Engineering, Farahan Branch, Islamic Azad University, Farahan, Iran
2Department of Chemistry, Arak Branch, Islamic Azad University, Arak, Iran
Received May 15, 2017; Revised August 21, 2017
In this project, simulation of high-density polyethylene production process was performed using Aspen Polymer
software and after comparing the simulation data with experimental values, sensitivity analysis was conducted on
operational parameters and the effects of these parameters on system performance were analyzed. PC-SAFT or
POLYPCSF thermodynamic model was used for the thermodynamic expression of the system. Comparing the
experimental values with simulation data demonstrated that the simulated process can properly show the system’s actual
behavior. To carry out the sensitivity analysis of the flow rate of the input feed into the first reactor, flow rate of the input
feed into the second reactor, temperature and pressure of the first reactor and temperature and pressure of the second
reactor were considered as variable and the impact of these changes on the conversion rate in the reactor, the amount of
the polymer produced, PDI and Mn of the produced polymer were examined. Studies revealed that increased flow rate
reduces the conversion rate and increases the amount of the produced polymer. Further, increased pressure and decreased
temperature lead to enhanced conversion rate and thus an increase in the amount of the polymer produced.
Keywords: High-density polyethylene, Aspen polymer, PDI, Mn, conversion rate
INTRODUCTION
Polyethylene (polyethene) is the simplest
polymer because two carbon atoms are connected to
all carbons of the main chain. This polyethylene is
of a thermoplastic type and the reason is that the
bonds between nonpolar chains in this polymer are
weak. Hence, polyethylene chains can slide over
each other by heating and break the London bonds
while the strong covalent bonds in the polymer are
still maintained. Lateral branchless polyethylene
chains can become so close to each other that they
make high-density polyethylene. This polyethylene
has more strength and flexibility compared to the
ordinary polyethylene. Polyethylene is a chain
polymer with 104 units or more of ethene. This
polymer was accidentally formed in the 1930s when
oxygen entered the container of ethene. Initially, the
created wax-like white substance was not considered
seriously. Subsequent tests showed that this
substance has high stability and is a good electricity
insulator. This substance was first used as the cable
insulator and cover for the radar areas in World War
II. Also, it was first applied as an electrical insulator
in 1939. Various types of polyethylene have
different applications including pipes, packaging
fibers, production of plastic materials used in the
kitchen, components of chemical plants, boxes, toys,
bulletproof vests and electrical insulation.
Due to its greater tensile strength and hardness,
high-density polyethylene is used in the manufacture
of pipes, production of liquids and milk containers
and plastic kitchen appliances and many other
utensils and containers [1, 2].
Different scholars have worked in the field of
polymer processing simulation and have provided
various reports in this regard.
Hakim, et al. [3, 4] have carried out the
simulation of ethylene polymerization in the slurry
phase in steady state with Ziegler–Natta catalyst to
produce high-density polyethylene. The results
obtained from this simulation have been compared
with the data related to the first reactor in High-
Density Polyethylene Unit of Arak Petrochemical
Complex. The desired model has the ability to
predict the production rate, average molecular
weight, dispersion index and concentration of
monomer, co-monomer and hydrogen inside the
reactor. Ethylene polymerization reactors can be
placed alongside each other in a sequential or
parallel form. For one of the HDPE extrusion grades
in Arak Petrochemical Complex, there are two
stirred tank reactors in series and the contents of the
first reactor go to the second reactor. Since the
contents of the second reactor go to the final reactor
and the polymerization reaction gets complete in it,
hydrogen, monomer, catalyst, co-catalyst and
hexane solvent are fed into the first reactor and co-
monomer (1 - butene), monomer and solvent are fed
To whom all correspondence should be sent:
E-mail: [email protected]
2017 Bulgarian Academy of Sciences, Union of Chemists in Bulgaria

A. Ariayee ,A. Marjani: Investigation of operational parameters effect on quality of HDPE in Ziegler-Natta solution ...
20
into the the second reactor. In this way,
homopolymer chains with not much molecular mass
are produced in the first reactor and turn into
copolymer in the second reactor in combination with
co-monomer and increase molecular mass. For
micro-scale modeling, differential equations were
written for all the components inside the reactor and
zeroth, first and second moments of growing and
dead polymer chains, using kinetic rate constants.
Neeraj et al. [5] also investigated the static and
dynamic modeling of the high-density polyethylene
process. Experimental data was obtained from two
industrial units with a capacity of 144000 ton / year
and 240000 ton / year, which reactors of the first unit
were placed in series and reactors of the second unit
were placed in parallel. In their simulation, they
initially determined the parameters of the state
equation using the physical properties of pure
substances existing in the process. Then, they
implemented the processes intended for the
simulation using Poymer Plus software. Kinetic
constants were calculated using the experimental
data provided.
Hakim et al. [8] examined the modeling and
simulation of ethylene polymerization process in the
slurry phase in three series stirred tank reactors for
the production of HDPE, using the Ziegler-Natta
catalyst. The catalyst model with several active
centers was used for modeling. By analysis of the
distribution chart, the molecular weight of the
polymer sample was specified and it was concluded
that at least six active centers are needed to simulate
the wide distribution of molecular weight of the
produced polymer. In the adopted method, only the
distribution chart of molecular weight of the first
reactor was analyzed to optimize the kinetic
parameters. After setting the kinetic parameters and
optimizing them, it was shown that the obtained
model is able to predict the experimental data
associated with average molecular weight,
molecular weight distribution, production rate and
the residence time of the polymer product in the
reactors. Using the model, the effect of changes in
the flow rate of hydrogen, monomer, co-monomer
and flow of impurities on the rate of production and
molecular weight distribution was evaluated. An
overview of the polymerization process used has
been displayed in Fig 8.2.
2. SIMULATION PROCESS
In this paper, simulation of high-density
polyethylene production process has been provided
using the Ziegler Natta method. To this end, the
production process has been initially presented by
drawing flow diagrams and expressing the operating
conditions of the equipment.
2.1 Production process
In different resources, high-density polyethylene
production process from the polymerization of
ethylene has been stated [6, 3, 5, 7]. The intended
process in this project for the solution
polymerization of ethylene has been shown in Fig
3.1. In this process, the feed flow with the specified
properties initially enters into the reactor of CSTR
type. This reactor acts at a temperature of 160 ºC and
pressure of 200 atm. In the reactor, sufficient
retention time is given to the materials so that the
polymerization operation is performed in the
presence of Ziegler-Natta catalyst which is TiCl4 in
this project. Next, the output current is sent from the
first reactor to the second reactor to complete the
polymerization operation and increase the
conversion rate. Along with this flow, another feed
flow with specific percent composition enters into
the second reactor. Operating conditions and
performance of this reactor are similar to the first
reactor. The output current from the second reactor
contains polymer, solvent, unreacted gases and used
catalyst. This flow is sent to the separator drum so
that the produced polymer is separated from other
materials existing in the stream. Separation in this
drum is done by reducing the pressure, which by
doing this, unreacted gases are separated from the
produced polymer and are removed from the top of
the drum and are returned to the beginning of the
process. The polymer produced as the final product
is sent from the bottom of the tower to packaging and
storage.
Fig 1: Flow diagram of HDPE production process
2.2 Ziegler-Natta processes
These are the processes in which the catalysts
first discovered by two people named Ziegler and
Natta are used. Processes of producing high-density
polyethylene, linear low-density polyethylene and
polypropylene use this kind of catalyst. Operating
conditions of production in these processes are lower
compared to the operating conditions of low-density

A. Ariayee ,A. Marjani: Investigation of operational parameters effect on quality of HDPE in Ziegler-Natta solution ...
21
polyethylene production. Operating pressure in these
processes is in the range of 10-80 atm and operating
temperature ranges from 80-110° C. However, in
some cases of solution polymerization, the pressure
may increase up to about 200 atm and the
temperature may rise up to about 250° C.
2.3 Process simulation in Aspen Plus software
This software is a set of software from Aspen
tech-company. This company has offered several
software programs to the market in the field of
simulation and modeling of processes, their
economic evaluation, engineering designs and so on
for different uses. Aspen Polymer module is among
the subset of process simulation software of this
company. Different versions of this software are
available in the market. In this project, Aspen
Polymer 7.2 has been applied. For process
simulation using this software, the process flow
diagram should be first determined and after entering
the necessary data for simulation and running the
program, the results will be visible. To carry out
simulation in the mentioned software, the steps
below should be followed:
2.3.1 Definition of components
The first step in simulation using this software is
the definition of the components existing in the
simulation. The list of the materials defined in this
simulation to evaluate the process is as follows:
Table 1: Software-defined materials list
Component ID Type Component name Formula
TICL4 CONV TITANIUM-TETRACHLORIDE TICL4
TEA CONV TRIETHYL-ALUMINUM C6H15AL
C2H4 CONV ETHYLENE C2H4
H2 CONV HYDROGEN H2
HEXANE CONV N-HEXANE C6H14-1
HDPE POLYMER HIGH-DENSITY-POLY(ETHYLENE) HDPE
C2H4-R SEGMENT ETHYLENE-R C2H4-R
In the software applied, additional information
should be included for the substances whose type is
not selected as conventional so that the substance
can be identified by the software. In this project, this
information should be entered for the two substances
which have been defined as the ethylene and
polymer segment of HDPE. For the segment, its type
should be entered, which the Repeat type was chosen
for this segment. For HDPE, the type of polymer
production should be selected, which in this project,
Ziegler-Natta method was chosen.
2.3.2 Thermodynamic model
Selection of the appropriate thermodynamic
model to calculate physical properties is essential.
Thermodynamic behavior and physical properties of
polymeric systems are much more complex than
conventional systems. Relationships of this section
are generally divided into equations of state and
activity coefficient models. Equations of state are the
relations that provide the system pressure equation
as a function of solution volume and temperature and
activity coefficient models are the relations used to
calculate the correction factor of Raoult’s law which
has been provided assuming the solution as ideal [8].
In this project, PC-SAFT or POLYPCSF equation of
state has been used for the thermodynamic
expression of the system [9, 10]. This equation of
state has been presented based on the perturbation
theory of chain molecules. Gross and
Sadowski argued that PC-SAFT equation of state
better predicts the thermodynamic properties of pure
substances and mixtures compared to the SAFT
equation itself [11, 12].
PC-SAFT equation of state like SAFT equation
of state and other chain state equations which are
based on the perturbation theory is expressed based
on the total of the reference mode and perturbation
distribution of Helmholtz free energy. This
expression is provided as the following equation:
In the above equation, A is the total Helmholtz
free energy; N is the total number of molecules; K is
Boltzmann's constant and T is the absolute
temperature. Overall, the reference term existing in
the equation states the distribution of repulsive
forces and perturbation term is due to the existence
of forces of attraction. In PC-SAFT equation, chain
A. Ariayee ,A. Marjani: Investigation of operational parameters effect on quality of HDPE in Ziegler-Natta solution ...
22
fluid with hard pellets has been selected as the
reference fluid. Thus, the reference term in equation
1 states the characteristics of chain fluid with hard
pellets, which this section is similar to SAFT
equation of state. These parameters include the
number of segments (m), diameter of segments (σ)
and the energy of each segment (ε /k). According to
PC-SAFT theory, the number of segments (m) is
directly proportional to the size of molecules
(molecular weight). Values of these three parameters
are usually available in data bank of the software.
But if they do not exist or it is necessary to carry out
the simulation more accurately, the values of the
parameters of the intended state equation are
determined using the regression of physical
properties of each material. In the present project,
given that ethylene, high-density polyethylene and
TiCl4 and TEA catalysts are the main substances in
simulation, the values of these three parameters were
determined using the regression of physical
properties. The values specified for these three
parameters have been reported in Table 2. The
determined values should be entered by the user into
the desired section in simulation so that the software
can use these values in its calculations. Table 2. Included values of the parameters of PC-SAFT
state equation. TiCl4 TEA Ethylene HDPE
r 0.0333 0.0333 0.0544 0.0535
ϵ/k(K) 236.770 236.770 181.331 245.342
σ(A°) 3.798 3.798 3.488 3.782
2.3.3 Definition of reaction
The next step is the definition of the reactions
performed in the system. The model that states the
reactions occurred in Ziegler-Natta systems has been
reported in various articles [12]. Although a lot of
mechanisms have been stated for this purpose, the
mechanism that accurately expresses the kinetic
behavior of Ziegler-Natta systems has not been
reported so far.
Rate of each reaction is equal to the product of
the concentrations of reactants and reaction rate
constant. To calculate the constant of each reaction,
modified Arrhenius equation which considers the
dependence of temperature and pressure is used.
In the above equation, K0 is the reaction constant
whose unit is equal to 1/sec for the first order
reactions and m3/kmol-sec for the second order
reactions. Ea is the activation energy; P is the
reaction pressure, R is the universal gas constant and
Tref is the reference temperature. Types of reactions
defined in this process have been presented in the
table below. The number of these reactions is 8. On
the other hand, 4 types of active sites were
considered for each catalyst and all of these reactions
occur on each of the active sites of the catalyst and
each has its own special kinetic speed. Therefore, 32
reactions were totally defined for this system. Type
of the reactions defined for each active site has been
provided in Table 3.
Table 3: Types of the reactions defined in the software for HDPE production process
Reaction Reaction type
𝐶𝑝𝑠 + 𝐴𝑚 → 𝑃0𝑘 Site Activation by cocatalyst
𝐶𝑝𝑠 → 𝑃0𝑘 Spontaneous site activation
𝑃0𝑘 +𝑀𝑖 → 𝑃𝛿𝑖𝑖 Chain initiation
𝑃𝑛,𝑗𝑘 +𝑀𝑖 → 𝑃𝑛 + 𝛿𝑖𝑖 Propgation
𝑃𝑛,𝑗𝑘 + 𝐻2 → 𝐷𝑛
𝑘 + 𝑃0𝑘 Chain transfer to hydrogen
𝑃𝑛,𝑗𝑘 +𝑀𝑖 → 𝐷𝑛−
𝑘 + 𝑃0𝑘 Chain transfer to monomer
𝑃𝑛,𝑗𝑘 → 𝐷𝑛−
𝑘 + 𝑃0𝑘 Spontaneous chain transfer
𝑃0𝑘 → 𝐶𝑑𝑠
𝑃𝑛,𝑗𝑘 → 𝐶𝑑𝑠 + 𝐷𝑛
𝑘 Spontaneous site deactivation
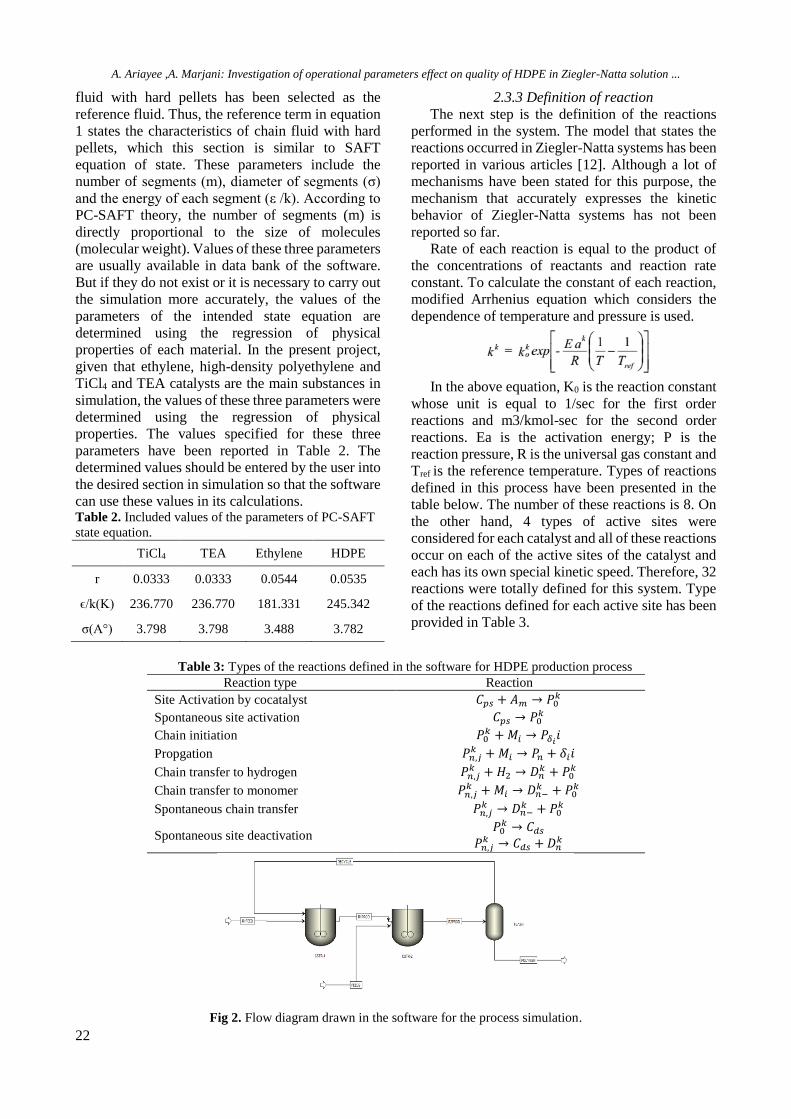
Fig 2. Flow diagram drawn in the software for the process simulation.

A. Ariayee ,A. Marjani: Investigation of operational parameters effect on quality of HDPE in Ziegler-Natta solution ...
23
2.3.4 Drawing flow diagram
The next step includes the drawing of flow
diagram and step by step simulation of the process.
The general flow diagram drawn has been displayed
in Fig 2. In this Fig, CSTR-1 and CSTR-2 reactors
are polymerization reactors in which the reactions
mentioned in the previous section are performed.
Flash block is used at the end of the process to
separate the produced polymer from unreacted gases
and solvents. Calculations of this block in the
software are based on the phase equilibrium.
Unreacted gases along with the solvent are returned
to the beginning of the process.
3. SIMULATION RESULTS
In this paper, the results obtained from simulation
have been discussed in two sections. First, the results
of simulation have been compared with the
experimental data. Then, sensitivity analysis was
conducted based on the simulation carried out and
the influence of different parameters on the
production rate and quality of the produced polymer
was examined.
3.1 Comparing the experimental data with
simulation
In this section, the results obtained from the
initial simulation carried out have been compared
with different experimental data. Experimental data
has been obtained from various articles in this regard
[1, 3, 5, 7]. The comparisons made have been
displayed in Fig 3 and 4. In Fig 3, the amount of
production of various grades has been compared
with the data obtained from simulation. With respect
to the chart of Fig 3, it can be observed that the
simulation conducted provides an accurate
prediction of the amount of the produced polymer in
different modes. The rate of relative error calculated
for different modes is between 1% and 2%, which is
acceptable. In Fig 4, the experimental data related to
the amount of average molecular weight has been
compared with the data obtained from simulation.
By studying the chart of this Fig, it can be concluded
that the investigated simulation has had a relatively
accurate prediction of the amount of this parameter.
The average relative error calculated in this mode is
between 2% and 3% for various modes, which is
acceptable. Hence, it can be generally concluded that
the simulation carried out has provided a relatively
accurate prediction of the behavior of actual
processes and can be used with great accuracy for
engineering applications.
3.2 Sensitivity analysis
According to the simulation conducted, the
sensitivity analysis was performed for different
parameters in simulation. The results of different
examinations are as follows.
3.2.1 Investigating the effect of flow rate of the
input feed into the first reactor
In an industrial unit, it is possible that changes take
place in the flow rate of the input feed into the unit
for various reasons. Thus, the flow rate of the input
feed into the first reactor was initially changed in a
predetermined range and impacts of this change on
the conversion rate in the first reactor, conversion
rate in the second reactor, the overall conversion rate
of the unit, the final amount of the produced
polymer, PDI and Mn of the produced polymer were
assessed. The results of the studies conducted have
been provided in Fig 5 and 6.
5000
6000
7000
8000
9000
10000
5000 6000 7000 8000 9000 10000
Pre
dic
ted
pro
du
cti
on
ra
te (
kg
/hr)
Plant Production Rate (kg/hr)
Model Prediction
45 Line
Fig 3: Comparing the experimental data with the values
of simulation for HDPE production rate.
Fig 4. Comparing the experimental data with the values
of simulation for Mn of the produced polymer. In Fig 5, changes in the conversion rate in the
reactors and the overall conversion rate of the unit
with the changes in the input flow rate have been
5000
10000
15000
20000
25000
30000
5000 10000 15000 20000 25000 30000
Mo
del
Pre
dct
ion
fo
r M
n
Plant Mn
ModelPredic…

A. Ariayee ,A. Marjani: Investigation of operational parameters effect on quality of HDPE in Ziegler-Natta solution ...
28
shown. As can be seen in the chart, the conversion
rate in the reactors has decreased with an increase in
the flow rate, which can be due to the fact that with
increased flow rate, greater amount of ethylene
enters into the reactor and the rate of unreacted
ethylene increases. Hence, the conversion rate has
been reduced. In Fig 6, the changes in the amount of
the produced polymer along with the changes in the
rate of the input feed into the unit have been
displayed. As is clear from the chart, the amount of
the polymer produced has increased with an increase
in the input feed into the first reactor, which is an
expected phenomenon. So, it should be considered
that with an increase in the rate of the input feed into
the unit, the amount of the polymer produced
increases despite decreasing the conversion
percentage. In Fig 7, the effect of changes in the
input flow rate on the PDI rate of the produced
polymer has been shown. As can be observed in the
chart, with increased flow rate of the input feed into
the unit, PDI of the polymers produced in the first
and second reactors increases, which has a negative
impact on the quality of the polymer produced. In
polymer processes, it is desirable that movement be
made towards the PDI equal to 1, which in this state,
all the chains of the produced polymer will have the
same length and there will be no dispersion in the
chains. However, despite the increase in PDI of the
produced polymer, its amount is not to the extent that
it is considered to be unacceptable. In Fig 8, it is
determined that with increased input feed into the
first reactor, the Mn rate of the produced polymer in
the first reactor decreases. In other words, the
produced polymer will have a shorter chain, but Mn
of the produced polymer in the output of the second
reactor which is the amount of the final Mn increases
and polymer chains with greater length are formed.
This can lead to increased strength of the produced
polymer.
Fig 5. Examining the effect of changes in the input feed
into the first reactor on the conversion rate in the
reactors.
Fig 6. Examining the effect of changes in the input feed
into the first reactor on the rate of HDPE produced
Fig 7. Examining the effect of changes in the input feed
into the first reactor on PDI
Fig 8. Examining the effect of changes in the input feed
into the first reactor on Mn of the produced polymer.
3.2.2 Investigating the impact of the flow rate of the
input feed into the second reactor
In this section, the results obtained from the
changes in the flow rate of the input feed into the
second reactor on the conversion rate, the amount of
the produced polymer, PDI and Mn of the polymer
have been provided. The results of these
investigations have been shown in Fig 9 and 10.
In Fig 9, the effect of changes in the flow rate of
the feed in the second reactor on the conversion rate
0
10000
20000
30000
40000
0 30000 60000 90000 120000 150000
Nu
mb
er a
vera
ge M
ole
cula
r W
eigh
t
Feed mass flow rate(kg/hr)
1-stReactor…
A. Ariayee ,A. Marjani: Investigation of operational parameters effect on quality of HDPE in Ziegler-Natta solution ...
27
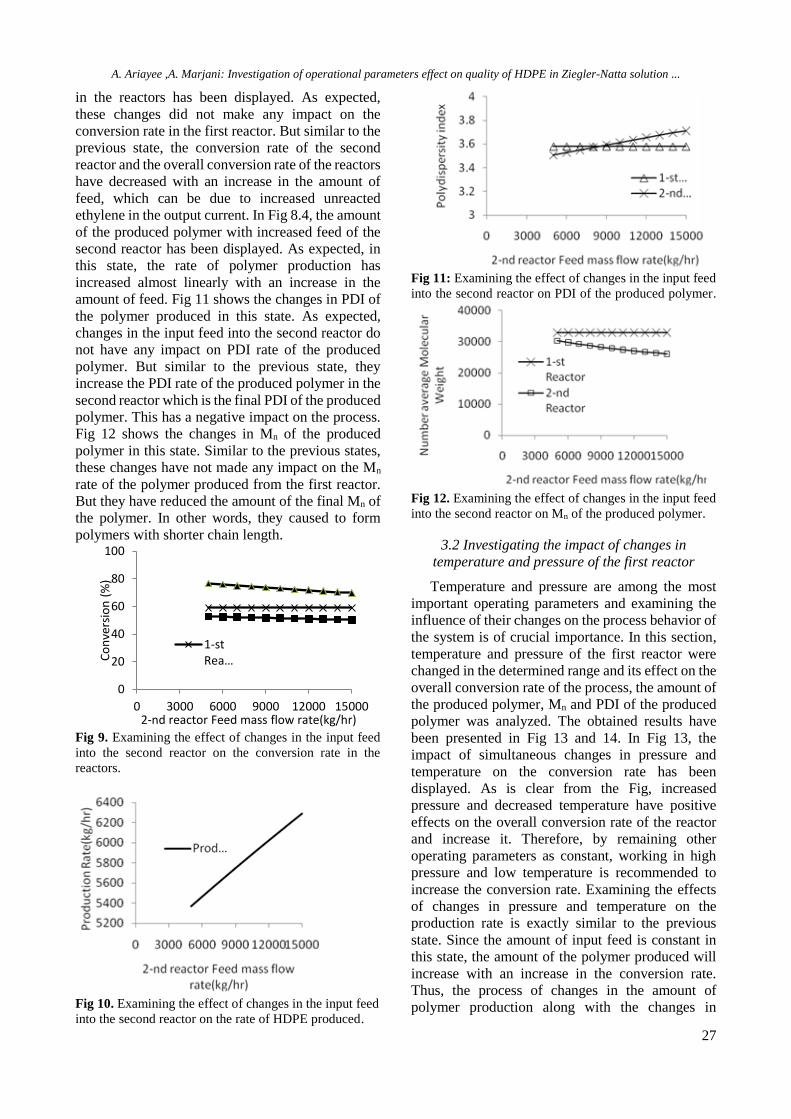
in the reactors has been displayed. As expected,
these changes did not make any impact on the
conversion rate in the first reactor. But similar to the
previous state, the conversion rate of the second
reactor and the overall conversion rate of the reactors
have decreased with an increase in the amount of
feed, which can be due to increased unreacted
ethylene in the output current. In Fig 8.4, the amount
of the produced polymer with increased feed of the
second reactor has been displayed. As expected, in
this state, the rate of polymer production has
increased almost linearly with an increase in the
amount of feed. Fig 11 shows the changes in PDI of
the polymer produced in this state. As expected,
changes in the input feed into the second reactor do
not have any impact on PDI rate of the produced
polymer. But similar to the previous state, they
increase the PDI rate of the produced polymer in the
second reactor which is the final PDI of the produced
polymer. This has a negative impact on the process.
Fig 12 shows the changes in Mn of the produced
polymer in this state. Similar to the previous states,
these changes have not made any impact on the Mn
rate of the polymer produced from the first reactor.
But they have reduced the amount of the final Mn of
the polymer. In other words, they caused to form
polymers with shorter chain length.
Fig 9. Examining the effect of changes in the input feed
into the second reactor on the conversion rate in the
reactors.
Fig 10. Examining the effect of changes in the input feed
into the second reactor on the rate of HDPE produced.
Fig 11: Examining the effect of changes in the input feed
into the second reactor on PDI of the produced polymer.
Fig 12. Examining the effect of changes in the input feed
into the second reactor on Mn of the produced polymer.
3.2 Investigating the impact of changes in
temperature and pressure of the first reactor
Temperature and pressure are among the most
important operating parameters and examining the
influence of their changes on the process behavior of
the system is of crucial importance. In this section,
temperature and pressure of the first reactor were
changed in the determined range and its effect on the
overall conversion rate of the process, the amount of
the produced polymer, Mn and PDI of the produced
polymer was analyzed. The obtained results have
been presented in Fig 13 and 14. In Fig 13, the
impact of simultaneous changes in pressure and
temperature on the conversion rate has been
displayed. As is clear from the Fig, increased
pressure and decreased temperature have positive
effects on the overall conversion rate of the reactor
and increase it. Therefore, by remaining other
operating parameters as constant, working in high
pressure and low temperature is recommended to
increase the conversion rate. Examining the effects
of changes in pressure and temperature on the
production rate is exactly similar to the previous
state. Since the amount of input feed is constant in
this state, the amount of the polymer produced will
increase with an increase in the conversion rate.
Thus, the process of changes in the amount of
polymer production along with the changes in
0
20
40
60
80
100
0 3000 6000 9000 12000 15000
Co
nve
rsio
n (
%)
2-nd reactor Feed mass flow rate(kg/hr)
1-stRea…

A. Ariayee ,A. Marjani: Investigation of operational parameters effect on quality of HDPE in Ziegler-Natta solution ...
28
pressure and temperature shown in Fig 14 is similar
to the previous state. By studying the charts in Fig
15 and 16, it becomes clear that increased pressure
and decreased temperature reduce the PDI rate of the
produced polymer and increase the amount of Mn.
Hence, it can be said that overall, an increase in
pressure and a reduction in temperature will have
positive effects on the system’s performance and
efficiency.
3.2.2 Investigating the impact of the flow rate of the
input feed into the second reactor
In this section, the results obtained from the
changes in the flow rate of the input feed into the
second reactor on the conversion rate, the amount of
the produced polymer, PDI and Mn of the polymer
have been provided. The results of these
investigations have been shown in Fig 9 and 10.
In Fig 9, the effect of changes in the flow rate of
the feed in the second reactor on the conversion rate
in the reactors has been displayed. As expected,
these changes did not make any impact on the
conversion rate in the first reactor. But similar to the
previous state, the conversion rate of the second
reactor and the overall conversion rate of the reactors
have decreased with an increase in the amount of
feed, which can be due to increased unreacted
ethylene in the output current. In Fig 8.4, the amount
of the produced polymer with increased feed of the
second reactor has been displayed. As expected, in
this state, the rate of polymer production has
increased almost linearly with an increase in the
amount of feed. Fig 11 shows the changes in PDI of
the polymer produced in this state. As expected,
changes in the input feed into the second reactor do
not have any impact on PDI rate of the produced
polymer. But similar to the previous state, they
increase the PDI rate of the produced polymer in the
second reactor which is the final PDI of the produced
polymer. This has a negative impact on the process.
Fig 12 shows the changes in Mn of the produced
polymer in this state. Similar to the previous states,
these changes have not made any impact on the Mn
rate of the polymer produced from the first reactor.
But they have reduced the amount of the final Mn of
the polymer. In other words, they caused to form
polymers with shorter chain length.
Fig 13. Examining the effect of changes in pressure and
temperature of the first reactor on the conversion rate in
the reactors.
Fig 14. Examining the effect of changes in pressure and
temperature of the first reactor on the amount of HDPE
produced.
Fig 15. Examining the effect of changes in pressure and
temperature of the first reactor on the PDI rate of the
produced polymer.
Fig 16. Examining the effect of changes in pressure and
temperature of the first reactor on the Mn rate of the
produced polymer.

A. Ariayee ,A. Marjani: Investigation of operational parameters effect on quality of HDPE in Ziegler-Natta solution ...
27
3.3 Investigating the impact of changes in
temperature and pressure of the second reactor
The effect of changes in the amount of operating
parameters of temperature and pressure in the second
reactor on the conversion rate of the reactor, the
amount of the polymer produced, PDI and Mn of the
produced polymer was also analyzed and the results
in this state have been shown in Figs 15.4 and 18.4.
Effects of these changes are similar to the state of the
first reactor and only in this state, the values of
increasing and decreasing the parameters are
different compared to the previous state.
Fig 17. Examining the effect of changes in temperature
and pressure of the second reactor on the conversion rate
in the reactors.
Fig 18. Examining the effect of changes in temperature
and pressure of the second reactor on the amount of HDPE
produced.
Fig 19. Examining the effect of changes in temperature
and pressure of the second reactor on the PDI rate of the
produced polymer.
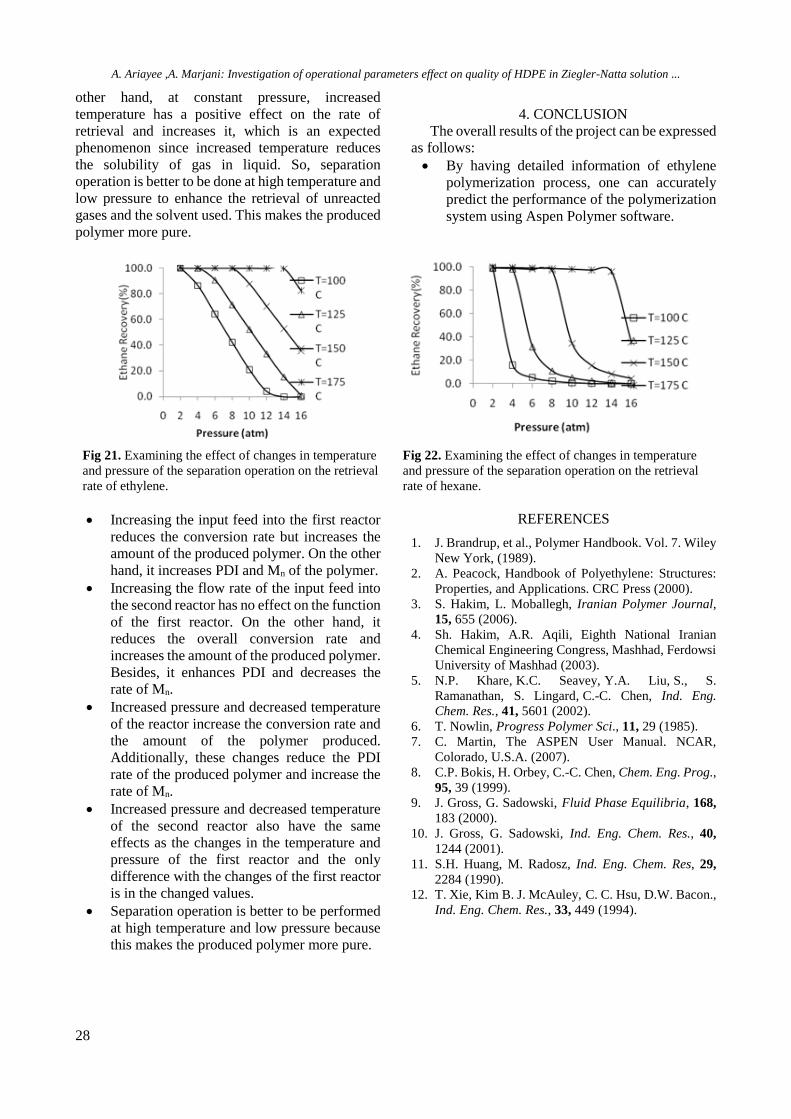
3.4 Investigating the impact of temperature and
pressure of separation operation
In the final flash drum, the produced polymer is
separated from unreacted ethylene gases and the
solvent used which is hexane. Temperature and
pressure are among the effective parameters of the
separation operation. In this section, the temperature
was changed from 100° C to 175° C and the pressure
was changed from 2 atm to 16 atm and the impact of
these changes on the retrieval rate of ethylene and
hexane which are respectively the unreacted gas and
solvent used was evaluated.
In Fig 19.4, the effect of simultaneous changes in
temperature and pressure on the retrieval rate of
ethylene has been displayed. In Fig 20.4, the effect
of simultaneous changes in temperature and pressure
on the retrieval rate of hexane has been shown.
As is evident in both charts, at a constant
temperature, the amount of retrieval is reduced with
increased pressure, which is an expected
phenomenon because increased pressure enhances
Fig 20. Examining the effect of changes in temperature
and pressure of the second reactor on the Mn rate of the
produced polymer.
the solubility of the unreacted gas in the polymer,
which causes to reduce the rate of retrieval. On the
A. Ariayee ,A. Marjani: Investigation of operational parameters effect on quality of HDPE in Ziegler-Natta solution ...
28
other hand, at constant pressure, increased
temperature has a positive effect on the rate of
retrieval and increases it, which is an expected
phenomenon since increased temperature reduces
the solubility of gas in liquid. So, separation
operation is better to be done at high temperature and
low pressure to enhance the retrieval of unreacted
gases and the solvent used. This makes the produced
polymer more pure.
4. CONCLUSION
The overall results of the project can be expressed
as follows:
By having detailed information of ethylene
polymerization process, one can accurately
predict the performance of the polymerization
system using Aspen Polymer software.
Fig 21. Examining the effect of changes in temperature
and pressure of the separation operation on the retrieval
rate of ethylene.
Fig 22. Examining the effect of changes in temperature
and pressure of the separation operation on the retrieval
rate of hexane.
Increasing the input feed into the first reactor
reduces the conversion rate but increases the
amount of the produced polymer. On the other
hand, it increases PDI and Mn of the polymer.
Increasing the flow rate of the input feed into
the second reactor has no effect on the function
of the first reactor. On the other hand, it
reduces the overall conversion rate and
increases the amount of the produced polymer.
Besides, it enhances PDI and decreases the
rate of Mn.
Increased pressure and decreased temperature
of the reactor increase the conversion rate and
the amount of the polymer produced.
Additionally, these changes reduce the PDI
rate of the produced polymer and increase the
rate of Mn.
Increased pressure and decreased temperature
of the second reactor also have the same
effects as the changes in the temperature and
pressure of the first reactor and the only
difference with the changes of the first reactor
is in the changed values.
Separation operation is better to be performed
at high temperature and low pressure because
this makes the produced polymer more pure.
REFERENCES
1. J. Brandrup, et al., Polymer Handbook. Vol. 7. Wiley
New York, (1989).
2. A. Peacock, Handbook of Polyethylene: Structures:
Properties, and Applications. CRC Press (2000).
3. S. Hakim, L. Moballegh, Iranian Polymer Journal,
15, 655 (2006).
4. Sh. Hakim, A.R. Aqili, Eighth National Iranian
Chemical Engineering Congress, Mashhad, Ferdowsi
University of Mashhad (2003).
5. N.P. Khare, K.C. Seavey, Y.A. Liu, S., S.
Ramanathan, S. Lingard, C.-C. Chen, Ind. Eng.
Chem. Res., 41, 5601 (2002).
6. T. Nowlin, Progress Polymer Sci., 11, 29 (1985).
7. C. Martin, The ASPEN User Manual. NCAR,
Colorado, U.S.A. (2007).
8. C.P. Bokis, H. Orbey, C.-C. Chen, Chem. Eng. Prog.,
95, 39 (1999).
9. J. Gross, G. Sadowski, Fluid Phase Equilibria, 168,
183 (2000).
10. J. Gross, G. Sadowski, Ind. Eng. Chem. Res., 40,
1244 (2001).
11. S.H. Huang, M. Radosz, Ind. Eng. Chem. Res, 29,
2284 (1990).
12. T. Xie, Kim B. J. McAuley, C. C. Hsu, D.W. Bacon.,
Ind. Eng. Chem. Res., 33, 449 (1994).

A. Ariayee ,A. Marjani: Investigation of operational parameters effect on quality of HDPE in Ziegler-Natta solution ...
23