
Investigation of New Heat Exchanger Design Performance ... - DiVA portal643538/FULLTEXT01.pdf ·...
44
Master of Science Thesis KTH School of Industrial Engineering and Management Energy Technology EGI-2013-067MSC EKV961 Division of Heat and Power Technology SE-100 44 STOCKHOLM Investigation of New Heat Exchanger Design Performance for Solar Thermal Chemical Heat Pump Cordova
Transcript of Investigation of New Heat Exchanger Design Performance ... - DiVA portal643538/FULLTEXT01.pdf ·...

Master of Science Thesis
KTH School of Industrial Engineering and Management
Energy Technology EGI-2013-067MSC EKV961
Division of Heat and Power Technology
SE-100 44 STOCKHOLM
Investigation of New Heat Exchanger
Design Performance for Solar
Thermal Chemical Heat Pump
Cordova
-2-
Master of Science Thesis EGI-2013-067MSC
EKV961
Investigation of New Heat Exchanger Design
Performance for Solar Thermal Chemical
Heat Pump
Cordova, Cordova
Approved
12 August 2013
Examiner
Viktoria Martin
Supervisor
Viktoria Martin
Commissioner
Contact person
Abstract
The emergence of Thermally Driven Cooling system has received more attention recently due to its ability
to utilize low grade heat from engine, incinerator or simple flat plate solar collector which are considered
as renewable energy sources. ClimateWell AB located in Stockholm has been developing this cooling
system based on its patented chemical heat pump technology. The heat pump with its tube shape is put
under the absorber as in simple flat plate solar collector making it possible be directly attached on the roof
without any additional solar collector. A high performance heat exchanger is needed by its reactor to
absorb the energy efficiently during the desorption process as well as to recover heat during the
absorption process. Current heat exchanger design has direct contact with the tube’s surface, yet air gaps
between the tube and heat exchanger result in alower amount of heat transferred and non-uniform heat
distribution across this surface. Moreover, a special treatment which cannot be done by machinery has to
be performed in attaching the tube with this heat exchanger. It becomes a problem during mass
production since a lot of man power is needed. A new heat exchanger design was proposed to overcome
those limitations. This design has annulus which is filled with thermal fluid inside. This fluid will make
perfect contact to the heat pump tube’s surface and eliminate the air gap. Furthermore, the need of man
power in its production can be minimized. Even though perfect contact can be achieved, the fluid in this
new design will increase thermal resistance in the radial direction. Therefore, an investigation has to be
conducted to evaluate the performance of this new heat exchanger design based on heat transfer
coefficient under steady state condition. The performance investigation also included the influence of
various thermal fluids which will be used for this new heat exchanger. The work performed by doing
simulation in COMSOL continued with validation of the result with experiment in laboratory. New heat
exchanger design efficiency was only 50% while the current one was 82% during the desorption process.
In this process, the fluid’s thermal conductivity was the most influencing fluid property. During
absorption process, two heat recovery methods are used. First is by flowing the fluid inside the annulus
and second is by using additional heat recovery pipe that is attached outside the heat exchanger surface.
The first method gave the highest UA value around 34 W/K while the second one gave almost the same
value as the current design which is around 11 W/K. In the first method, the thermal fluid’s viscosity
strongly influenced its UA value while the second method is greatly influenced by fluid’s heat conductivity.

-3-
Acknowledgement
This thesis is based on work conducted within the KIC InnoEnergy MSc Shool, in the SELECT
programme. The SELECT Programme starts from the concept of basic renewable energy sources and
considers the pathways towards a future sustainable energy system, in combine with an integrated
innovation and business approach. This programme is supported financially by the KIC InnoEnergy. KIC
InnoEnergy is a company supported by the European Institute of Innovation and Technology (EIT), and
has the mission of delivering commercial products and services, new businesses, innovators and
entrepreneurs in the field of sustainable energy through the integration of higher education, research,
entrepreneurs and business companies. Shareholders in KIC InnoEnergy are industries and universities
from across Europe. www.kic-innoenergy.com
In this opportunity, I would like to gratefully acknowledged KIC InnoEnergy for its financial support
during my master study in the SELECT programme. My highest respect is dedicated to all of them who
have helped me in giving their guidance and assistance to complete my final master thesis project. I would
like to thank to ClimateWell AB in Stockholm and all of the staffs for their cooperation during the
execution of this project. I also would like to express my special appreciation to Corey Blackman and
Ulrika Tornerefelt from ClimateWell AB for providing me with a challenging and realistic topic and for
becoming my thesis project supervisor. I am really thankful to Viktoria Martin as my thesis supervisor at
KTH-Royal Institute of Technology for her guidance along the completion of this project. My gratitude
also dedicated to all of the lecturers at KTH-Royal Institute of Technology and Eindhoven University of
Technology for their effort to share their knowledge in the class and during any discussion which has
enlighten me about sustainable energy concept and sustainable development from different point of
views. Finally, I wish to express my sincere thanks to my family, SELECT committee and consortium and
all of my friend for their support and encouragement in accomplishing my thesis project and my master
programme.

-4-
Table of Contents
Abstract ........................................................................................................................................................................... 2
Acknowledgement ......................................................................................................................................................... 3
Table of figures .............................................................................................................................................................. 6
Nomenclature and abbreviations ................................................................................................................................ 7
2 Introduction .......................................................................................................................................................... 8
2.1 Background .................................................................................................................................................. 8
2.2 The Technology of ClimateWell ............................................................................................................... 9
2.2.1 Current heat exchanger design ...........................................................................................................11
2.2.2 New heat exchanger design ................................................................................................................11
2.3 Objectives ...................................................................................................................................................12
2.4 Hypothesis ..................................................................................................................................................13
2.5 Methodology ..............................................................................................................................................13
3 Basic theory .........................................................................................................................................................14
3.1 Absorption and adsorption cooling .......................................................................................................14
3.2 Chemical heat pump .................................................................................................................................15
3.3 Energy balance inside C-HP....................................................................................................................16
3.3.1 Discharging process .............................................................................................................................17
3.3.2 Charging process ..................................................................................................................................18
3.4 C-HP performance ...................................................................................................................................19
3.5 Heat transfer from absorber plate ..........................................................................................................20
3.6 Heat exchanger ..........................................................................................................................................20
3.6.1 Heat transfer during charging .............................................................................................................21
3.6.2 Heat transfer during discharging ........................................................................................................22
3.7 Pressure drop .............................................................................................................................................24
3.8 Thermal fluid .............................................................................................................................................24
4 COMSOL simulation.........................................................................................................................................26
4.1 Model development ..................................................................................................................................26
4.2 Simulation for charging ............................................................................................................................27
4.2.1 Heat distribution ...................................................................................................................................27
4.2.2 Heat transfer rate ..................................................................................................................................29
4.3 Simulation for discharging .......................................................................................................................30
4.3.1 Active passive mode .............................................................................................................................31
4.3.2 Passive-passive mode ...........................................................................................................................34
4.3.3 Simulation discussion ...........................................................................................................................35
5 Lab experiment ...................................................................................................................................................37
5.1 Experimental rig set-up ............................................................................................................................37

-5-
5.2 Experimental result ...................................................................................................................................38
6 Conclusion and recommendation ....................................................................................................................40
Bibliography .................................................................................................................................................................41
Appendix A: COMSOL Physical model dimension ..............................................................................................42
Appendix B: COMSOL Simulation result ...............................................................................................................43
Appendix C: Thermal fluids data sheet ....................................................................................................................44
-6-
Table of figures
Figure 1-1: Cross sectional schematic of ClimateWell's heat exchanger. A: Current design; B: New design
1; C: New design 2. .....................................................................................................................................................10
Figure 1-3: Schematic drawing of current heat exchanger design. Left: Heat exchanger; Right: Heat
exchanger with reactor tube. ......................................................................................................................................11
Figure 2-1: Schematic of: A. Vapor compression refrigeration cycle; B. Absorption refrigeration cycle. ....14
Figure 2-2: Schematic of adsorption refrigeration cycle........................................................................................15
Figure 2-3: Schematic drawing of chemical heat pump. .......................................................................................15
Figure 2-4: Clausius-Clapeyron's diagram of C-HP operating cycle. ..................................................................16
Figure 2-5: Ideal intermittent absorption cycle schematic[]. .................................................................................17
Figure 2-6: Reactor's typical operating temperature in 24 hours. ........................................................................19
Figure 2-7: Cross sectional diagram of heat exchanger configuration ................................................................22
Figure 3-1: COMSOL simulation model; A: Charging; B: Discharging active-passive; C: Discharging
passive-passive. ............................................................................................................................................................26
Figure 3-2: Heat distribution during charging with water as thermal fluid inside the annulus. ......................28
Figure 3-3: Heat distribution during charging with Duratherm 450 as thermal fluid. .....................................28
Figure 3-4: Influence of different fluid conductivity to temperature difference on cylinder surface. ...........29
Figure 3-5: Influence of different fluids conductivity to the UA value for charging. ......................................30
Figure 3-6: UA value of discharging active-passive mode with different flow speed. .....................................31
Figure 3-7: Influence of fluid's viscosity to the UA value of active-passive mode. ..........................................32
Figure 3-8: Influence of fluid's specific heat capacity to the UA value of active-passive mode. ....................32
Figure 3-9: Influence of fluid's conductivity to the UA value of active-passive mode. ...................................33
Figure 3-10: Influence of fluid's viscosity to the pressure drop. ..........................................................................33
Figure 3-11: Influence of fluid's conductivity to the UA value of passive-passive mode. ..............................34
Figure 3-12: UA value comparison of two new heat exchanger modes. ............................................................35
Figure 4-1: Hydraulic diagram of experimental rig. ...............................................................................................37
Figure 4-2: Wiring diagram of control and data acquisition system for experimental rig. ..............................38
Figure 4-3: Linear relationship of various thermal fluid flow speed during discharging. ................................39

-7-
Nomenclature and abbreviations
= Metal cylinder surface area = Mass of water in liquid phase
= Solar collector surface area = Mass of water in gas phase
= Glass tube surface area = P
= Heat transfer surface area = Prandtl number
= Thermal fluid surface area = Total energy in reactor during absorption
= Coefficient of performance for cooling
= Total energy in condenser during desorption
= Coefficient of performance for heating
= Total energy in evaporator during absorption
= Coefficient of performance for ideal condition
= Total energy in reactor during desorption
= Total coefficient of performance = Total energy loss
= Specific heat of evaporator material
= Specific heat of thermal/ heat recovery fluid
= Rayleigh number
= Specific heat of reactor material = Reynold number
= Specific heat of salt = Cylinder radius
= Specific heat of water in gas phase = Radius of metal cylinder inner surface
= Specific heat of water in liquid phase = Radius of glass tube inner surface
= Diameter = Radius of metal cylinder outer surface
= Hydraulic diameter = Radius of glass tube outer surface
= Absorber heat removal factor
= Enthalpy = Incident solar energy
= Enthalpy of salt during absorption = Temperature
= Enthalpy of salt during desorption = Reactor temperature during absorption
= Enthalpy of evaporation at absorption temperature
= Absorber temperature
= Enthalpy of evaporation at evaporation temperature.
= Condenser temperature
during desorption
= Convection rate = Temperature evaporator during absorption
= Convection rate inside the glass tube = Thermal fluid inlet temperature
= Convection rate outside metal cylinder = Thermal fluid outlet temperature
= Thermal conductivity = Reactor temperature during desorption
= Metal cylinder thermal conductivity = Inlet temperature
= Effective thermal conductivity = Glass tube inner surface temperature
= Glass tube thermal conductivity = Metal cylinder outer surface temperature
= Thermal fluid thermal conductivity
= Length = Heat transfer coefficient during desorption (charging)
= Nusselt number = Heat transfer coefficient during absorption (discharging)
= Nusselt number for circular tube = Absorber heat transfer coefficient
= Nusselt number for concentric tube = Average flow velocity
= Mass of evaporator material = Thermal fluid viscosity
= Mass of thermal/heat recovery fluid = Thermal fluid density
= Mass of salt

-8-
1 Introduction
The scarcity of fossil fuel and pollution caused from its utilization have encouraged research in the field of
sustainable and green energy to develop rapidly. The growing number of world’s population has
enormously increased the energy demand, which particularly relates to product consumption,
transportation, and housing. Energy needed for building accounted for a large proportion of the world’s
total energy demand. It is estimated that more than eighty percent of all human activities take place inside
of building, where most of the energy supplied is used to provide thermal comfort for its inhabitants.
Therefore, researching sustainable methods to achieve building’s thermal comfort is one of the options
that can be used to reduce total energy demand significantly.
1.1 Background
Thermal comfort is one of the measurements which determine comfort conditions in buildings. In
traditional buildings or in areas where the climate conditions and ambient temperature are comfortable
enough, this situation can be achieved by natural ventilation such as window. However, for severe climate
areas which daily and annual maximum and minimum temperatures have large difference, ventilation is
not adequate. This condition also applies for locations where their ambient temperature can be very high
above 250 C such as tropical areas or even some places in Europe during summer. This high temperature
will make inconvenient conditions for people to do any activities inside. For that reason, the installation of
air conditioning systems for such buildings is quite common in order to maintain temperature levels to
provide thermal comfort for their occupants.
Air conditioning systems based on the vapor compression refrigeration cycle are widely used in cooling
systems for building. This system uses refrigerant (CFC and HCFC) as its working fluid which is
continuously compressed, condensed, expanded, and evaporated while taking energy from the space to
provide cooling. Unfortunately, this cycle requires high electrical power to drive a compressor. It causes
high loads on the electricity power grids especially when high cooling demand occurs during hot sunny
days. Moreover, higher energy demand also leads to higher carbon emissions produced by buildings since
carbon based fuel is used to generate and supply its energy needs. In addition, the utilization of
refrigerants is not environmental friendly because it promotes the ozone layer hole in the atmosphere.
Thus massive utilization for this technology in the future will threaten the world’s sustainable
development from both, energy and environmental points of view.
Thermally driven cooling (TDC) systems have received more attention recently due to its ability to utilize
low grade heat such as waste heat from engine, waste incinerator, or simple flat plate solar collector. Being
compared with vapor compression refrigeration system, TDC can provide cooling energy with very low
electricity consumption. The replacement of the compressor function with a generator and absorber
powered by a thermal source makes it possible. For that reason, TDC is very promising to replace high
energy density air conditioning system. Buildings’ electricity consumption can be reduced while
maintaining temperatures at comfort level. Furthermore, the absence of harmful refrigerants and replacing
it with water or ammonia makes this system more environmental friendly. In addition, the emissions from
burning fossil fuels to provide electricity can be avoided as a consequence of using renewable energy. On
the other hand, integration of this system with an engine to use its waste heat as the energy source will
increase its fuel efficiency.
TDCs can be classified into two different processes which are heat transformation processes and thermo-
mechanical processes. However, the first process is the most developed and used system [1]. It is based
on absorption or adsorption cycles of two different chemical substances. These substances usually called
as sorption pairs consist of liquid-liquid pair or liquid-solid pair. One of the substances in this pair acts as
a sorbent and the other acts as a refrigerant. The typical pairs which are widely used are NH3/H2O and
LiBr/H2O for absorption, and Silica Gel/H2O for adsorption. These pairs have coefficients of

-9-
performance (COP) 0,7-0,8 and 0,5-0,6 respectively, as well as cooling temperatures that can be delivered
between 7-15 0C and 12-18 0C respectively [1].
A chiller that uses an absorption cycle allows the refrigeration process to occur continuously because the
pair used is in the liquid state. Yet, the absorption chiller can also be a pseudo-continuous machine if the
absorbent is in solid state. In this case, the absorption happens due to the chemical reaction is not so
much the state of the sorption pairs. On the other hand, the one with adsorption cycle is only able to have
pseudo-continuous process since the pair employs is in the solid phase. Thus, adsorption chiller needs two
reaction chambers or more to provide cooling power continuously. For this type of chiller, it is well
known that an excessively short cycle time of each chamber is responsible for lower cooling capacity and
COP, and a longer cycle time may cause a lower performance [2]. Hence, the determination of the length
of the cycle is a dynamic optimization of this pseudo-continuous system. In addition, The cycle time of
this system is strongly dependent on the configuration of the heat exchanger [3].
CilmateWell AB located in Stockholm is developing TDC system based on its patented absorption
process of LiCl/H2O named “CoolStore”. The system utilizes a simple configuration of a chemical heat
pump that only consists of one reaction chamber called the reactor and a combine evaporator-condenser,
which has cylindrical shape, with efficiency between 50%-60% [4]. With this, CoolStore is cheaper, has
simple operation and maintenance, and is more reliable since no moving mechanical systems are involved
[5].
To produce cooling energy, this heat pump employs solar power as its energy source. The solar power is
used to heat up the sorption pair material inside its reactor. Even though the absorption process occurrs
in it, the working principle of this system is similar to an adsorption chiller which consists of desorption
(charging) and adsorption (discharging). The design of this TDC allows the charging process to occur
during the day and discharging process during the night. Thus switching frequency is not a big issue since
full charging condition will be reached at the end of the day when the solar power is no longer available.
However, the heat utilization when solar power is available shall be optimized. For this reason, the
employment of a good performance heat exchanger is needed.
1.2 The Technology of ClimateWell
ClimateWell’s CoolStore technology is specialized to be used directly with solar energy as its thermal
energy source. Consequently, no additional thermal energy generation—such as solar thermal collector—
has to be installed in applying this product. The principle of the chemical heat pump which is used by this
TDC system is not only to provide both cooling and heating, but also to store a large amount of energy
thermochemicaly. This storage feature is beneficial for such a system to deal with intermittent heat source
due to unstable weather condition and partial load condition.
During charging, the reactor is heated by the heat source allowing a desorption process to occur inside.
The water as the refrigerant which was previously restrained in the hygroscopic salt (absorbent), is released
in the form of water vapor as a result of increasing temperature. Then, the water vapor flows to condenser
which is cooled down by a heat rejection system. The heat that has been recovered from condensing
vapor can be used either for space heating or as an alternative for water heating while it is connected with
a water heating system. The process continues until the salt is dried and is crystallizes. This condition is
referred to as the fully charged condition. If this condition is achieved, it means that the system can
provide maximum heating and/or cooling when it is switched to the discharging operation. At the fully
charged condition, energy can be stored if the connection between reactor and evaporator/condenser is
closed.
During discharging, the condenser acts as evaporator. The water evaporates creating a cooling effect
which may be used to absorb heat from the space to be cooled. Then, the water vapor flows to the salt
due to the difference in surface vapor pressure between evaporator which is higher and reactor which is

-10-
lower. In the reactor, the water is absorbed by the salt and the heat released. This heat needs to be carried
away from the reactor by a heat exchanger and is able to be employed for pre-heating in water heating
system and low temperature space heating system like floor heating.. The absorption process continues
while cooling and heating power decrease until all the water in the condenser is vaporized and the
absorbent is in saturation stage. In this condition, cooling and heating power are no longer delivered. With
these charging and discharging processes, ClimateWell’s customer can get heating and cooling power at
the same time with only one system without high operational cost.
Figure 1-1: Cross sectional schematic of ClimateWell's heat exchanger. A: Current design; B: New design 1; C: New design 2.
Figure 1-2: CoolStore collector and its simple installations configuration.1
In order to use solar power efficiently, ClimateWell has specially designed its heat exchanger that allows its
heat pump to be directly attached with solar absorber as shown in Figure 1-1. This is the same principle
which is used in flat plate solar collector for water heaters. Each of the CoolStore cylindrical tubes is put
under the solar absorber plate, and 10 to 20 of these tubes are attached together in series which is then
called the CoolStore collector. This collector can be put directly on the roof of customer’s building like
common solar flat plate collectors as shown in Figure 1-2. By doing this, installation of separate solar
collectors is no longer needed like conventional solar cooling technology. This also gives the benefit of
1 http://www.sunwindenergy.com/news/chiller-collector
1
-11-
lowering CoolStore overall system cost and will be more viable for it to be widely used by various
customers.
1.2.1 Current heat exchanger design
Attaching the heat pump’s reactor chamber to solar collector or absorber directly is an innovative idea
from ClimateWell to simplify its solar cooling system. Moreover, this simplification will cause the cost of
it to be lower. Nevertheless, this idea has raised some challenges in transferring the heat to the sorption
pair in the reactor. One challenge comes from the reactor tube material which is made of glass. It causes a
limitation in distributing the heat uniformly across the tube’s surface. Hence, the optimum desorption
process cannot be achieved. Though it has been known that the glass is an insulator, the utilization of it is
still interesting for ClimateWell to avoid corrosion when metal based material is used. The other challenge
is a difficulty when attaching the absorber—made of copper or aluminum—since it cannot be directly
welded to the glass.
To overcome those challenges, ClimateWell has designed its heat exchanger by welding the absorber on a
thin copper plate that has been curved following the shape of the glass tube. Then this plate will be used
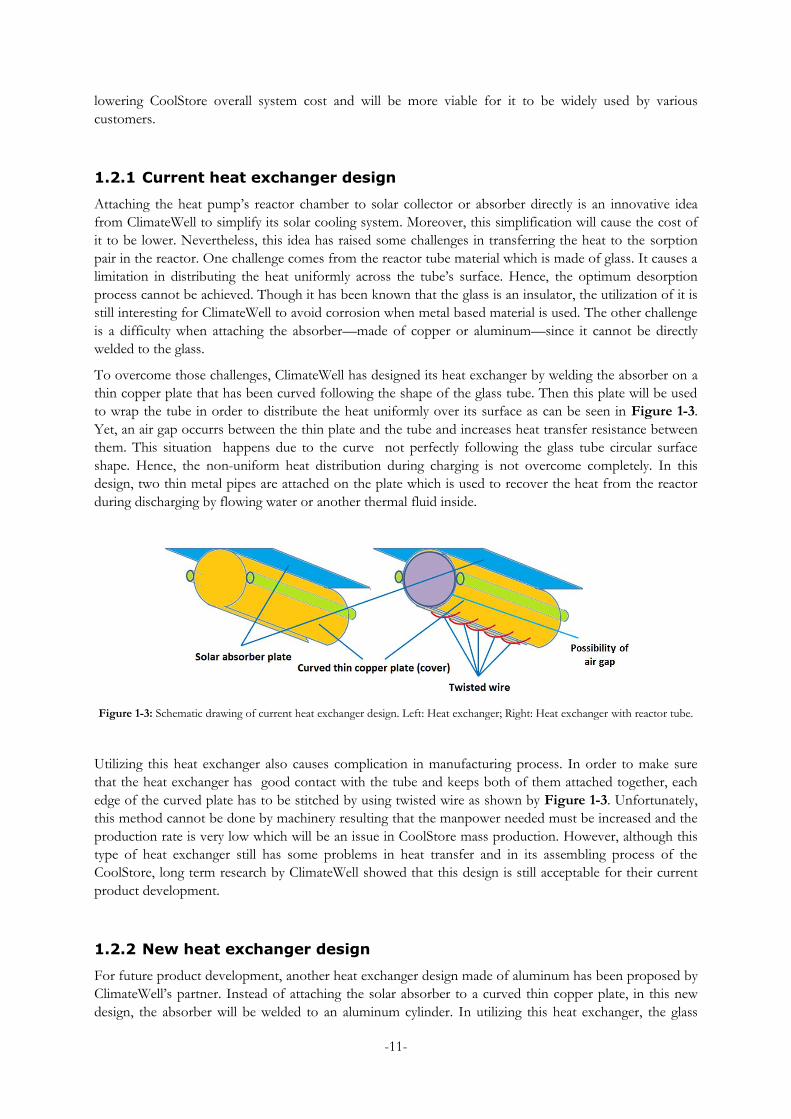
to wrap the tube in order to distribute the heat uniformly over its surface as can be seen in Figure 1-3.
Yet, an air gap occurrs between the thin plate and the tube and increases heat transfer resistance between
them. This situation happens due to the curve not perfectly following the glass tube circular surface
shape. Hence, the non-uniform heat distribution during charging is not overcome completely. In this
design, two thin metal pipes are attached on the plate which is used to recover the heat from the reactor
during discharging by flowing water or another thermal fluid inside.
Figure 1-3: Schematic drawing of current heat exchanger design. Left: Heat exchanger; Right: Heat exchanger with reactor tube.
Utilizing this heat exchanger also causes complication in manufacturing process. In order to make sure
that the heat exchanger has good contact with the tube and keeps both of them attached together, each
edge of the curved plate has to be stitched by using twisted wire as shown by Figure 1-3. Unfortunately,
this method cannot be done by machinery resulting that the manpower needed must be increased and the
production rate is very low which will be an issue in CoolStore mass production. However, although this
type of heat exchanger still has some problems in heat transfer and in its assembling process of the
CoolStore, long term research by ClimateWell showed that this design is still acceptable for their current
product development.
1.2.2 New heat exchanger design
For future product development, another heat exchanger design made of aluminum has been proposed by
ClimateWell’s partner. Instead of attaching the solar absorber to a curved thin copper plate, in this new
design, the absorber will be welded to an aluminum cylinder. In utilizing this heat exchanger, the glass

-12-
tube will be simply inserted into this cylinder. Hence, it will eliminate the need of stitching the edge of the
plate which is done in the current design. For the insertion purpose, the clearance between inner surface
of the cylinder and the tube’s outer surface has to be made and annulus between these two cylindrical
shapes appears. In this annulus, an air gap will still occur and heat resistance will be very high. To
overcome this, thermal fluid that has lower resistance compared to air will be used to fill the annulus.
Moreover, this fluid will make a perfect contact with the glass tube and cylinder inner surface, and will
distribute the heat uniformly. This new heat exchanger design has two possible operating methods which
are “active-passive” and “passive-passive” as shown in Figure 1-1 B and C respectively.
In active-passive mode, for the new design, thermal fluid will be put inside the annulus between metal
cylinder and glass tube. During charging, this thermal fluid will stay inside—not moving (passive)—,
hence the heat from the absorber distributed by the cylinder needs to penetrate through this fluid before
reaching the reactor. During discharging the fluid inside the annulus will flowing (active) to recover the
heat from the reactor with a constant flow rate. One of the constraints of this design is that more heat loss
is occurs from the absorber during charging. It is due to the higher heat resistance as a result of the
thermal fluid inside the annulus. Another constraint is, if the glass breaks for some reasons, the salt inside
of the reactor will contaminate the fluid circulation circuit. This condition will cause severe corrosion in
the circuit. On the other hand, some benefits are that the thermal fluid will act as a suspension for glass
tube and reduce the risk of breaking during transporting, installation and operation. Furthermore, the heat
recovery rate will increase during discharging.
For passive-passive, the fluid inside the annulus will not flowing during both charging and discharging.
The heat recovery during discharging, will be carried out by flowing water inside two small metal tubes
attached on the metal cylinder. This is the same recovery method as used in the current design. With this
configuration, the heat from reactor will need to pass through the thermal resistance of the glass, fluid in
the annulus and metal cylinder before it reaches the thermal fluid. This design has the same benefits with
active-passive design except for the heat recovery during discharging. The thermal resistance during
discharging will be larger as in active-passive and reduce heat transfer rate. One benefit is that, the annulus
and all the reactor tube assembly is a separate close system from thermal fluid circuit. This condition
eliminate the risk of fluid contamination if the glass broke, hence the corrosion possibility will be avoided.
Further investigation is needed to be conducted in order to determine which heat exchanger design will
give the best heat transfer and operational performance for the entire collector system. With that, a
decision can be made whether acquiring a new heat exchanger design to improve manufacturing process
and to protect the glass tube will compromise heat pump performance. At the moment, the current design
is the best design for ClimateWell compared with several previous designs.
1.3 Objectives
With the overall aim of this thesis being a study of new heat exchanger performance for solar thermal
chemical heat pump, the work performed had the following detailed objectives:
Investigate heat transfer performance of a new heat exchanger design for the reactor side and compare
it with previous heat exchanger’s design performance. Comparison will be based on heat transfer
coefficient (U-value) of each heat exchanger with various thermal fluids under steady state condition. It
will be performed by comparing current model by using COMSOL.
Investigate the influence of thermal fluid properties on the heat transfer process of the heat exchanger
and determine which thermal fluid should be used for the new design.

-13-
1.4 Hypothesis
The heat transfer process of a heat exchanger system is highly depended on the thermal properties of
materials used. In addition, the thermal properties of some elements that have thermal connection
(thermal bridge) with it also affect the process. Thermal resistance which is a function of thermal
conductivity and convection process will cause an amount of heat that cannot be transferred and become
losses. During a transient process, the heat will be used to increase heat exchanger temperature from its
initial condition to its operating temperature. The amount of heat used for this process is determined by
specific heat of heat pump tube’s components. Consequently, not all of the collected heat will be
exchanged since some of it will be used as sensible heat by the tube and the heat exchanger assembly
during transient conditions.
In this work, the transient condition is not of interest. So that, the heat exchanger performance is only
observed at its steady state condition which is divided into two, charging and discharging. It is because the
transient period is relatively short when compared to the overall operating hours of the CoolStore tube. In
steady state, the hypothesis regarding heat exchanger performance can be defined as follow:
During charging, thermal fluid will become a heat transfer medium between absorber and glass tube.
As a result, a thermal bridges occurs between these two components. In this condition, thermal
conductivity of each heat exchanger’s components will determine the total heat transferred as well as
the heat losses. This conductivity is also an important factor during the discharging process for
passive-passive design.
Compared with current design, the employment of fluid will increase thermal resistance. As a result,
the existence of the fluid in annulus will reduce the amount of heat reaches the reactor. Yet, it can
uniformly distribute the heat through the glass tube’s surface.
For discharging with active-passive design, the heat transfer process strongly influenced by the mass
transfer of the flowing fluid. Hence, thermal fluid’s flow rate and its specific heat are the most
influencing properties. Furthermore, the fluid’s viscosity will also affect properties since it affects
convective heat transfer by modifying dimensionless coefficients such as Nusselt, Reynold and Prandtl.
This convective heat transfer also influenced by water flow rate inside the metal tube will also affect
the process apart from thermal fluid’s conductivity.
Since the total resistance in active-passive is less than in passive-passive in discharging condition, the
first will give better performance compared with the last one.
1.5 Methodology
In order to investigate the heat exchanger performance, a literature study of heat transfer processes and
fluid transport properties has been studied. Then, the model of the newly designed heat exchanger was
developed in COMSOL software with some assumptions needed. The heat transfer calculation with
various types of thermal fluids was performed with this software. To have equal performance comparison,
the model of current heat exchanger design was also developed in COMSOL with the same approach.
With this simulation, the influence of various thermal fluid properties during charging and discharging can
be investigated. A lab experiment was conducted to validate the simulation model. Nevertheless, this is
only done for water and Tyfocor® due to some limitations.

-14-
2 Basic theory
There are several technologies available to provide cooling energy using a thermal source. Absorption and
adsorption TDC as well as chemical heat pumps are the most common technologies currently available on
the market. These technologies use thermo-chemical process of sorption pair to provide cooling power.
The amount of the power produced is dependent on the composition of this pair and also the amount of
energy supplied. In order to increase its efficiency which is usually presented as a coefficient of
performance, a heat exchanger with high effectiveness value is needed. Heat exchanger geometry and its
material’s thermal properties are very important to enhance that value.
2.1 Absorption and adsorption cooling
Absorption cooling system is the best known technology among closed TDC system technology [1]. For
this technology, there are three sorption pairs—NH3/H2O, LiBr/H2O, and LiCl/H2O—which are widely
used. Among those pairs LiBr/H2O is the most popular one to be used for solar cooling due to its ability
to reach low temperature [6]. These systems utilize almost the same components as a conventional vapor
compression system, yet compressor function is replaced by the set of generator and absorber as shown
by Figure 2-1. Usually, a heat exchanger is also put between the flow line of the generator and absorber to
increase system efficiency.
Figure 2-1: Schematic of: A. Vapor compression refrigeration cycle; B. Absorption refrigeration cycle.
Adsorption cooling’s working principle is almost the same as absorption, however there is no liquid
sorbent involved. Instead, it uses solid adsorbent such as silica gel which adsorb the refrigerant which is
usually water. For that reason, the adsorption process occurs in the same chamber as the desorption
process since the saturated chemical pair cannot flow as in absorption. As a result, a continuous cycle will
not happen if the system only utilizes one adsorption chamber. Therefore, the adsorption cooling system
usually has two chambers to provide pseudo-continuous cycle as shown in Figure 2-2. With this
configuration, the desorption process occurs alternately in one chamber while desorption process is
occurs in another one.

-15-
Figure 2-2: Schematic of adsorption refrigeration cycle.
2.2 Chemical heat pump
A chemical heat pump (C-HP) combines the benefit of absorption and adsorption system as well as
thermochemical storage. This device uses the advantage of a reversible thermochemical reaction through
the utilization of a heat source. This reaction makes C-HP able to deliver heating and cooling power as
well as store thermal energy. Compared with other absorption technology, C-HP provides high storage
capacity, long term storage, lower heat loss during storage and higher heat of reaction [5, 7]. As with other
sorption technologies, the sorption pairs used and their compositions will influence the amount of heat
needed to drive the reaction in the reactor. To determine the appropriate composition, formulation
suggested by Conde [8] can be used.
Figure 2-3: Schematic drawing of chemical heat pump.
A C-HP system as shown in Figure 2-3 consists a reactor which is directly coupled with evaporator-
condenser without any moving mechanical system. Even though it uses the same pair as used in an
absorption chiller, the operation is the same as an adsorption chiller since the pair will be heated up until
the salt is dried and left in reactor. The reaction that occurs in the reactor is based on a mono-variant
equilibrium of solid and gas, and triggered by a pressure and temperature in non-equilibrium conditions

-16-
[9]. By knowing the relation between vapor pressure of the working fluid and the adsorbent temperature
equilibrium, the cycle of this reaction process can be explained in Clausius-Clapeyron’s diagram as shown
in Figure 2-4. In addition, the relationship between temperature and pressure can be presented in
Clausius-Clapeyron’s equation in Equation (2.1).
( )
(2.1)
Figure 2-4: Clausius-Clapeyron's diagram of C-HP operating cycle.
From that diagram, it can be seen that C-HP operates at three temperature levels which are Tc (cooling
temperature), Th (heat source temperature), and Ths (heat sink temperature). During absorption or
discharging process, liquid (condensed gas) in evaporator will evaporate while absorbing the heat (QE)
from the environment. Thus the environment experiences a cooling effect—with temperature Tc (cooling
temperature)—from this process. Due to the increasing pressure inside evaporator, vapor will move to the
reactor in which dried salt exists. Then, the vapor will be condensed in it and absorbed by the solid. The
heat of reaction Qd-d between these two substances is released to a heat sink with temperature Ths. When
all of the vapor is absorbed, the desorption or charging process can be started. In this process, the heat
(QS) from heat source with temperature Th will increase the bed temperature to evaporate the liquid and
release it in the vapor form. The increasing temperature causes the pressure inside the reactor to increase
pushing the vapor to the condenser. In the condenser, the heat Qd-c will be released to the heat sink with
temperature Ths, while the vapor is condensed.
2.3 Energy balance inside C-HP
In developing its C-HP (CoolStore) system, ClimateWell uses two connected cylindrical tube as reactor
and condenser-evaporator. The absorption and desorption processes occur inside the tube during
discharging and charging in order to provide cooling power. Nevertheless, the energy used or generated is
not only used for this purpose, but also will be absorbed by the components of which the tube is
constructed due to their heat capacity. Furthermore, some of the energy also flows to the environment as
the heat loss. Figure 2-5 present the schematic of ideal intermittent absorption cycle inside the tube.

-17-
Figure 2-5: Ideal intermittent absorption cycle schematic[2].
2.3.1 Discharging process
Condenser/Evaporator side
∑ ( )
(2.2)
The energy balance during the discharging process at the evaporator side can be described by Equation
(2.2). The equation shows that, cooling power occurs while the water inside evaporator evaporates.
However, not all of this energy is delivered to the environment. Instead, some of it is used to cool down
the tube structure from its temperature during the charging process to the temperature for cooling. Also,
some of heat losses that can be assumed 5-10%[3] of QE. With this equation, the mass of water needed to
produce several hours of cooling energy can be calculated. As a result, the amount of salt needed in the
reactor also can be calculated.
Reactor side
∑( )( ) ( )
(2.3)
The energy balance during discharging process on the reactor side can be described by Equation (2.3). In
this situation, the reactor has to be cooled down from charging temperature to discharging temperature. It
2 Based on: Blackman, Corey. Investigation of the performance of individual sorption components of a novel thermally driven heat
pump for solar applications. Master of Science Thesis. KTH-Royal Institute of Technology. Stockholm: 2011. Page 31. 3 ClimateWell’s common practice

-18-
is needed by the salt inside to be able to attract more water vapor from the evaporator. On this side, heat
is also produced during the absorption process of water by the salt and also during condensation of water
vapor coming from reactor. Since water vapor enters the reactor at evaporator temperature, some of heat
produced is used to equalize its temperature with reactor’s.
2.3.2 Charging process
Reactor side
∑ ( )
( )( )
(2.4)
The energy during the charging process on the reactor side can be described by Equation (2.4). That
equation shows that, not all of the heat supplied is used to desorb the water. Some of it is needed by the
reactor structure, salt as well as water to increase their temperature to charging temperature providing
optimum conditions for desorption. Additionally, it also used to evaporate the water, while the rest is the
real amount which is for desorption. However, heat losses always occur that can flow to the environment
and to the condenser.
Condenser/Evaporator side
( ) ∑ ( )
(2.5)
In the charging process, the evaporator changes its role to that of a condenser for the vaporized water
from the salt. In this situation, the energy balance inside it can be described by Equation (2.5). This
equation shows that the heat from the reactor is presented as latent heat and heat of condensation of
water vapor, as well as some of heat loss from reactor. This heat is used to increase condenser material’s
temperature to condensing temperature.
From the equation above, QG and QA are the energy supplied and released to and from the reactor
respectively. However, QG is not purely the total of solar incident irradiation absorbed by the absorber,
instead, it is the total of heat transferred from absorber to reactor which is affected by the thermal
resistance between these two elements. In order to increase QG under constant energy supply, this
resistance has to be minimized. Different conditions are applied for QA since it occurs internally as a result
of the absorption process. This internal heat has to be removed in order to maintain optimum absorption
temperature. Hence a heat recovery process, which is determined by the reactor’s heat exchanger
performance, is very important..
On the other hand, condenser/evaporator side also has its particular heat exchanger which is a different
component to the one that is used on the reactor side as shown by Figure 2-3 above. QC and QE are
energy parameters that are used to describe the energy balance on the condenser/evaporator side which
depend on this heat exchanger performance. Yet, the heat exchanger on this side will not be studied in
this project.

-19-
2.4 C-HP performance
The performance of the thermally driven cooling system depends on driving temperature, heat sink
temperature, and cooled space (evaporator) temperature. Since heat is the main energy source, the heat
transfer process also plays an important role in determining this performance as already discussed before.
Though the cycle time is important for an intermittent heat pump, the performance of CoolStore will not
be significantly affected by it, because the system will be charged during the day time and start to produce
and store cooling energy during the night as shown by its operation characteristic in Figure 2-6.
However, in the real application, fluctuation of the heat supplied occur as a result of unsteady solar
irradiation. Thus, to calculate the total performance using an average value is more representative.
Figure 2-6: Reactor's typical operating temperature in 24 hours.
C-HP’s are usually represented by a comparison of the energy produced with the amount of energy
supplied. Since C-HP can produce heating and cooling, its COP can be described as COPcooling, COPheating,
and COPtotal. The formulas to determine these actual values are shown by Equation (2.6)-(2.8). Other than
COP, cooling power, cooling energy QE, heating power, heating energy (QA and QC) are also indicators
that can be used to investigate system performance in each stage.
(2.6)
(2.7)
(2.8)
Equation 2.9 shows another way of calculating COPcooling with the temperature data of three temperature
levels which are heating, cooling, and heat sink temperatures. The result obtained from this equation is the
0
20
40
60
80
100
120
140
0 2 4 6 8 10 12 14 16 18 20 22 24
Tem
pera
ture
(d
eg
C)
Hours
-20-
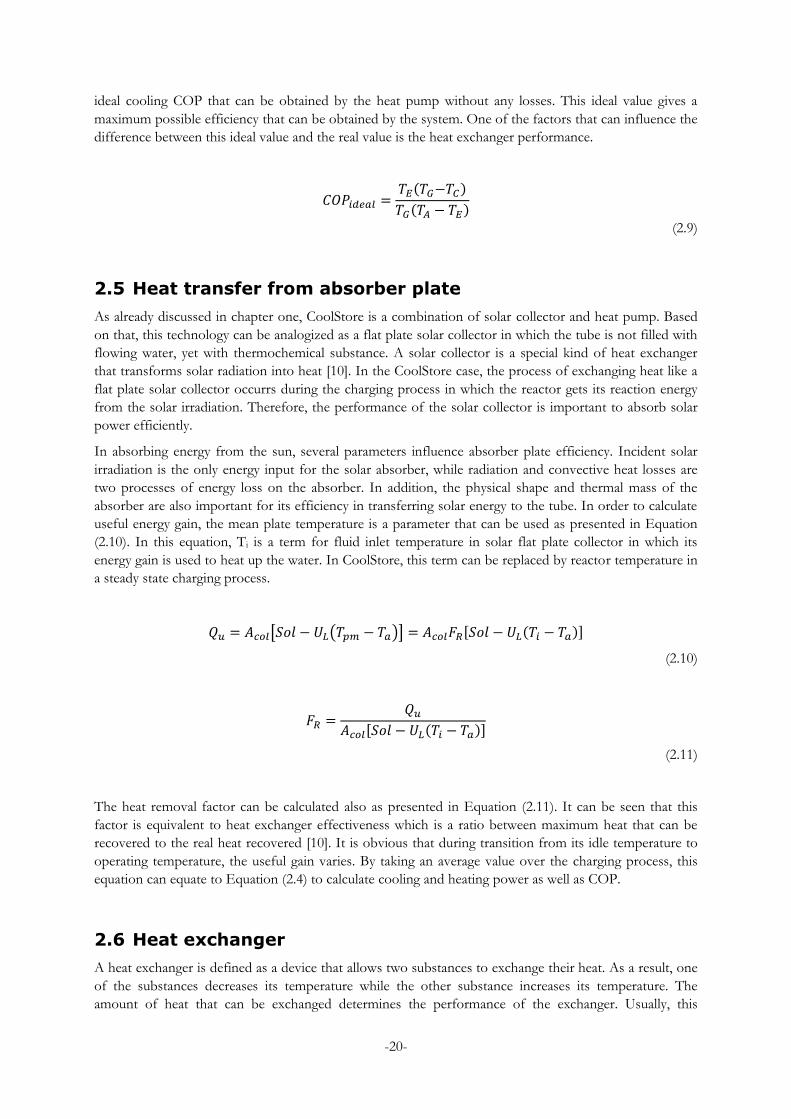
ideal cooling COP that can be obtained by the heat pump without any losses. This ideal value gives a
maximum possible efficiency that can be obtained by the system. One of the factors that can influence the
difference between this ideal value and the real value is the heat exchanger performance.
( )
( )
(2.9)
2.5 Heat transfer from absorber plate
As already discussed in chapter one, CoolStore is a combination of solar collector and heat pump. Based
on that, this technology can be analogized as a flat plate solar collector in which the tube is not filled with
flowing water, yet with thermochemical substance. A solar collector is a special kind of heat exchanger
that transforms solar radiation into heat [10]. In the CoolStore case, the process of exchanging heat like a
flat plate solar collector occurrs during the charging process in which the reactor gets its reaction energy
from the solar irradiation. Therefore, the performance of the solar collector is important to absorb solar
power efficiently.
In absorbing energy from the sun, several parameters influence absorber plate efficiency. Incident solar
irradiation is the only energy input for the solar absorber, while radiation and convective heat losses are
two processes of energy loss on the absorber. In addition, the physical shape and thermal mass of the
absorber are also important for its efficiency in transferring solar energy to the tube. In order to calculate
useful energy gain, the mean plate temperature is a parameter that can be used as presented in Equation
(2.10). In this equation, Ti is a term for fluid inlet temperature in solar flat plate collector in which its
energy gain is used to heat up the water. In CoolStore, this term can be replaced by reactor temperature in
a steady state charging process.
[ ( )] [ ( )]
(2.10)
[ ( )]
(2.11)
The heat removal factor can be calculated also as presented in Equation (2.11). It can be seen that this
factor is equivalent to heat exchanger effectiveness which is a ratio between maximum heat that can be
recovered to the real heat recovered [10]. It is obvious that during transition from its idle temperature to
operating temperature, the useful gain varies. By taking an average value over the charging process, this
equation can equate to Equation (2.4) to calculate cooling and heating power as well as COP.
2.6 Heat exchanger
A heat exchanger is defined as a device that allows two substances to exchange their heat. As a result, one
of the substances decreases its temperature while the other substance increases its temperature. The
amount of heat that can be exchanged determines the performance of the exchanger. Usually, this

-21-
performance is presented as heat transfer coefficient called as U value or UA value with their unit
W/m2.K or W/K respectively.
In CoolStore, there are two heat exchangers, one on the reactor side while the other one is on the
condenser/evaporator side. The last one acts the same as the definition above. It exchanges the heat
contained in condensing water vapor while the fluid flowing on condenser/evaporator surface absorbs
this heat. As a result, the fluid temperature increases. The reverse condition occurs during evaporation
while the heat from the fluid is taken by the water inside evaporator to evaporate resulting in lower fluid
temperature at the outlet of the exchanger. However for the reactor side, the definition no longer applies.
The heat exchanger at the reactor side only exchanges heat during the discharging condition. The heat
inside of reactor coming from the absorption process is taken by the fluid flowing on the reactor surface.
Yet, during charging there is no heat exchanging process occurring between the two substances. At this
condition, the reactor’s heat exchanger only acts as a heat transfer medium between solar absorber plate
and the reactor.
2.6.1 Heat transfer during charging
In the full assembly of CoolStore tube, the thermochemical substance is put inside of a glass tube reactor.
Both of the new heat exchanger configuration will allow this glass tube to be put inside of a metal cylinder
that has been attached to a solar absorber plate. Then, the thermal fluid is put in the annulus between the
tube and the cylinder. With this arrangement, the heat transfer process during charging can be modeled as
the heat conduction from the outside cylindrical tube to its inner part across different materials as shown.
For solid materials, heat conduction is influenced by thermal conductivity and heat capacity. This
conductivity determines the thermal resistance which affects the amount of heat transferred through the
material. For a static fluid inside the annulus, viscosity also modifies this resistance due to the existence of
free convection. The relationship between heat transfer coefficient, conductivity, heat convection and
thermal resistance for charging is modeled in Equation (2.12) and the heat flow during charging and
discharging shown in Figure 2-7.
( ⁄ )
( ⁄ )
( ⁄ )
(2.12)
Equation (2.12) shows that the resistance value depends on the conductivity of each material and the heat
exchanger’s geometry. In addition, the convective heat transfer coefficient is also a variable that affects
this value. The higher the coefficient the lower the resistance. Nonetheless, since the heat is needed inside
the reactor, a higher convective coefficient is more desired there. That condition can be achieved if the
reactor has a high temperature which leads to a higher desorption rate. On the other hand, the convection
outside the metal cylinder has to be minimized to avoid heat loss from cylinder surface to the
environment.

-22-
Figure 2-7: Cross sectional diagram of heat exchanger configuration
In order to include the free convection influence which occurs in the annulus, the fluid’s heat conductivity
can be replaced by effective conductivity [11] which can be calculated with Equation (2.13). This
conductivity is a function of two dimensionless coefficient which are Prandtl number (Pr) and Rayleigh
number (Ra).
(
)
⁄
⁄
(2.13)
With the heat transfer coefficient value, the heat transfer rate from the outside of the cylinder to the
reactor tube can be calculated by Equation (2.14). In an efficient heat exchanger, the total heat transfer
value from this equation should has the almost the same value as useful heat from the absorber in
Equation (2.10).
( )
(2.14)
Since the absorber is only attached on the upper part of the metal cylinder, it is obvious that the heat
distribution across the cylinder surface will not be uniform. The attaching point is a location where the
highest temperature occurs on the surface while its opposite location has the lowest temperature. This
condition also applies for the fluid and the glass tube inside the cylinder. However, the average surface
temperature still can be used with Equation (2.14) to obtain total heat transfer rate.
2.6.2 Heat transfer during discharging
Beside heat transfer, mass flow also exists during discharging due to the heat recovery fluid flow. The
change in flow speed will consequently affect mass flow rate. Since the fluid has a heat capacitance, the
change of the flow speed will change the amount of heat that can be recovered by the fluid which is
shown by Equation (2.15).

-23-
( )
(2.15)
From that equation the heat transfer coefficient Udc across the heat exchanger wall also influences the
total of heat transferred. As in the charging process, this coefficient is also a sum of all thermal
conductance and convective heat transfer at the heat exchanger excluding chemical material inside the
reactor [12]. Consequently, the conduction concept in charging process also applies to it.
With that conception, it is obvious that the UA value for active-passive and passive-passive will be
different since the amount of conductance, the size of heat transfer surface and the convection involved
in the heat transfer process is also different. In active-passive, the heat exchanger can be modeled as
concentric tube type in which heat conduction only exist through the glass tube’s wall. In passive-passive,
the conduction happens like in the charging process with the heat flow in the opposite direction from the
reactor to the outside of cylinder. From Equation (2.12), it is clear that the more material involved in this
process will increase the value of the heat resistance. Consequently, for the same mass flow rate, the heat
transfer rate of the active-passive design will be higher than the rate of the passive-passive design. For
active-passive the heat transfer surface is the outer surface of the glass tube while in passive-passive is the
inner surface of the metal tube where the recovery fluid flowing.
Applying this concept for flowing fluid, the convective heat transfer on the heat transfer surface is the
most influencing parameter for transferring heat. In order to enhance the heat transfer rate in the
discharging process, as well as decrease thermal resistance, a higher value of the convective heat transfer
coefficient is needed. To achieve this, the flow speed shall be increased to increase the Reynolds (Re)
number Equation (2.16). For the same flow speed, this coefficient can be different for active-passive and
passive-passive due to the both methods have different hydraulic diameter.
(2.16)
The increasing Reynolds will also increase the Nusselt (Nu) number of the flow that causes a higher value
of the convective coefficient which is shown by Equation (2.17).
(2.17)
For active-passive, the Nu number for the flow inside the annulus with thermal contact can be calculated
with Equation (2.17). While the Nu number for the flow inside the cylindrical pipe in passive-passive can
be calculated with Equation (2.18).
(
)
⁄
( )
⁄
(2.18)

-24-
( ⁄ )
[( ⁄ ) ] ⁄
(2.19)
For both operating modes, turbulent flow is more preferable since it gives higher heat transfer rates. Though, it is difficult to be achieved by the new heat exchanger design due to the small hydraulic diameter for both modes. As a result, to achieve this type of flow, high pump pressure is needed to provide a very high flow speed. This condition is undesired, moreover for active-passive mode since it will expose the glass tube to the high pressure fluid. Besides that, higher pump pressure will increase pump power that leads to higher electricity needs. Hence, increasing speed may reduce overall system efficiency in which electrical power supply also taken into account. So that, the optimal correlation between the heat transfer performance and overall system performance has to be calculated before determining the flow regime. When it is decided to have turbulent flow, Equation (2.18) and (2.19) are no longer valid. Instead of these, Gnielinski [13, 11] has proposed different formula to calculate Nusselt number.
2.7 Pressure drop
One thing that is also important to investigate the heat exchanger performance is the pressure drop along
the flow path. In the complete system installation, a pump is needed to make the thermal fluid flowi with
a certain flow speed by creating a pressure difference in the fluid channel system. Hence in order to create
a constant flow, this pressure difference has to have a higher value than the pressure drop. The higher the
difference needed, the higher the power required by the pump to work resulting higher electricity needs.
For that reason, a lower pressure drop is preferable that will reduce electricity consumption.
Consequently, the total energy consumption will be low.
To calculate the pressure drop inside the heat exchanger, the general hydrodynamic equation for the flow
in the annulus for laminar flow as presented in Equation 2.20 and 2.21 can be used for the cylindrical tube
flow and annulus flow, respectively. Those equations show that, the geometry of the heat exchanger is
influenced by the diameter size for a simple tube and by the annulus size for annular flow.
(2.20)
[ ( ⁄ )
( ⁄ ) ( ⁄ )
(( ⁄ ) )]
(2.21)
2.8 Thermal fluid
The characteristics of the thermal fluid which will be used inside the annulus will determine heat
exchanger performance for both processes, charging and discharging. As already explained previously, the
thermal properties of this fluid, mostly heat conductivity and heat capacity, will influence the heat transfer
process. However, in determining the type of thermal fluid other physical and chemical properties also
need to be considered.
As an example fluid viscosity and boiling point. For flowing fluid, low viscosity is more preferable since it
will lead the flow condition to approach the transition or turbulence region that is good for the heat

-25-
transfer process. Moreover, a low viscosity fluid will cause a low pressure drop along the flow channel
which can reduce the pump power needed during operation. Regarding boiling point, a high number of
this point is desired. It is because in the real applications, CoolStore tube temperature can reach above 100 0C during charging. Hence, the static thermal fluid in the annulus has to be able to withstand this
condition without compromising safety operation of the entire system such as pressure build-up.
High pressure inside the annulus will harm the glass tube which has vacuum pressure inside. Once the
tube breaks, the system would stop working since there would be no sorption process. On the other hand,
the salt will contaminate the fluid flow of the entire hydraulic system such as piping and pump which are
made of metal based materials. As a result, severe corrosion will occur that will damage the system. Thus,
even though water and water base glycol have good thermal properties for the heat transfer process, they
should not be used in the system due to the possibility of high pressure occurrence.
As an alternative, an oil based heat transfer fluid which is widely used in industry can be utilized for the
new the heat exchanger design. In the market, this fluid is available with various heat conductivities and
specific heats, but still lower than water and glycol. Typically the one with higher conductivity has low
viscosity which makse it promising to be used. Unfortunately most of the low viscosity oil also has low
flash point and flame point which increase the potential of fire if it used in an open system as in
CoolStore. On the other hand, the one with highest value of these two points has low conductivity and
high viscosity. Though, by adding small amounts of nanoparticles, the conductivity can be enhanced
without compromising other properties [14]. Another constraint in utilizing this thermal oil is its high
price which can reach € 40/Liter[4]—that obviously will affect the CoolStore investment cost on the
customer side.
Generally the thermal fluid that will be used for the new CoolStore heat exchanger model preferably
hasthe following properties:
For safety reason:
- High boiling point
- High flash point
- High ignition point
For good heat transfer performance:
- High conductivity
- Low viscosity
4 Current market price from several thermal fluid manufacturers which were asked for quotation for this project.
The shipping cost is already included in it.
-26-
3 COMSOL simulation
In order to determine which design gives the best heat transfer performance for the CoolStore tube, a
simulation using CFD software (COMSOL) was performed. This kind of simulation has some benefits for
this research, such as minimizing time and cost, due to its ability to simulate the design with various types
of thermal fluids in it. As already discussed before, the price of thermal fluids available in the market is
very high for a small quantity. Consequently, it is very wise to do the simulation instead of conducting the
real experiments. Once the simulation result has been gathered and the performance value has been
calculated, further decisions can be taken to determine which model and which fluids are promising. This
model and fluids will then undergo further investigation in the real experiment.
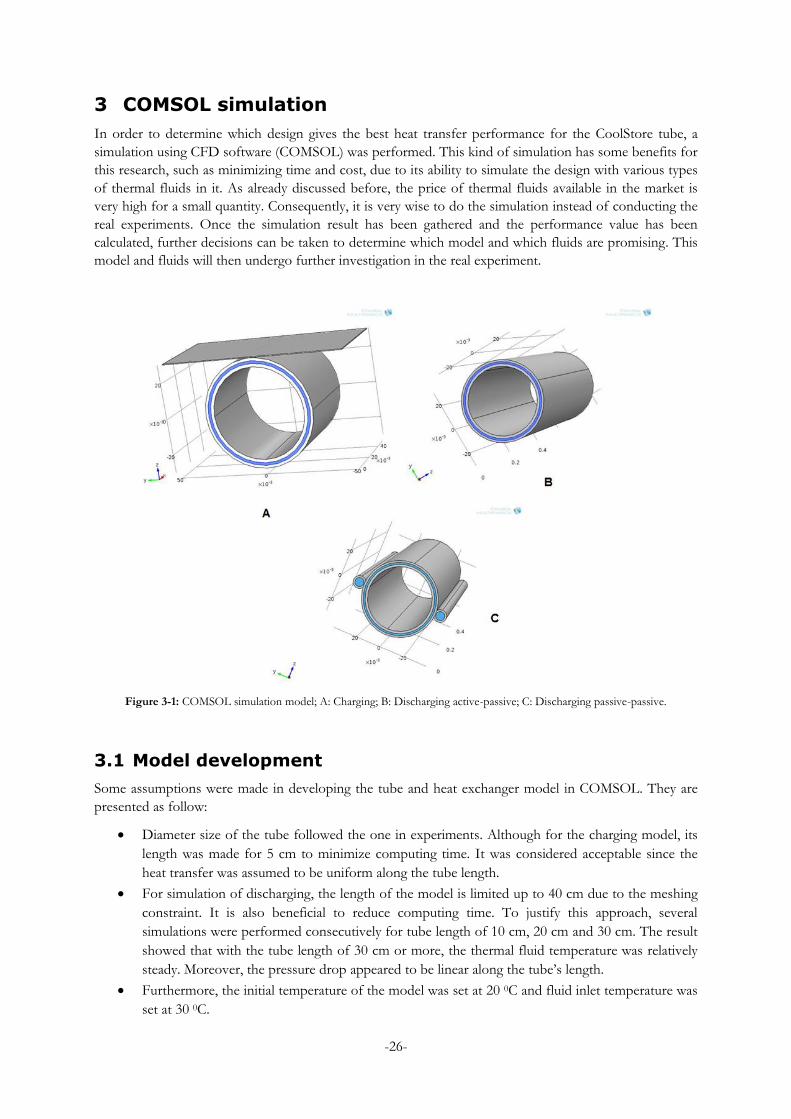
Figure 3-1: COMSOL simulation model; A: Charging; B: Discharging active-passive; C: Discharging passive-passive.
3.1 Model development
Some assumptions were made in developing the tube and heat exchanger model in COMSOL. They are
presented as follow:
Diameter size of the tube followed the one in experiments. Although for the charging model, its
length was made for 5 cm to minimize computing time. It was considered acceptable since the
heat transfer was assumed to be uniform along the tube length.
For simulation of discharging, the length of the model is limited up to 40 cm due to the meshing
constraint. It is also beneficial to reduce computing time. To justify this approach, several
simulations were performed consecutively for tube length of 10 cm, 20 cm and 30 cm. The result
showed that with the tube length of 30 cm or more, the thermal fluid temperature was relatively
steady. Moreover, the pressure drop appeared to be linear along the tube’s length.
Furthermore, the initial temperature of the model was set at 20 0C and fluid inlet temperature was
set at 30 0C.

-27-
In discharging model, the absorber was eliminated to reduce computing problem due to large
differences of meshing size.
The backside of the absorber and outer surface of the cylinder were well-insulated, hence no heat
losses modeled in this simulation.
Only conductive heat transfer through fluid was considered for the charging simulation.
In the current design model for charging, the air gap is eliminated. Hence, the curved thin plate is
perfectly in contact with the surface of the glass tube.
During charging, heat was supplied to absorber’s surface uniformly with 500 W/m2 heat source.
No heat losses through convection as well as radiation were assumed.
Attachment point of absorber and metal cylinder was modeled with two parallel lines with 1.5x10-
3 m width. In the real heat exchanger, these two lines are welding points between absorber and
cylinder tube.
To model the thermochemical reaction (desorption) during charging, 110 W/m2 convective
cooling was assumed to occur inside the glass tube model. This value was based on previous
COMSOL simulation conducted by ClimateWell.
For simplification in active-passive discharging model, the inlet and outlet channel which located
on the cylinder’s upper surface were not taken into account.
A constant temperature of 35 0C was assumed to occur inside the surface of the glass tube to
model the absorption process during discharging. This assumption was made based on the fact
that the absorption occurs at constant temperature due to the condensation of water vapor.
Thermal properties of the fluid were obtained from manufacturers’ datasheet and were
interpolated at 30 0C and 80 0C for discharging and charging, respectively.
Detail physical dimension of these models are provided in Appendix A.
3.2 Simulation for charging
Simulation for the charging process was done to investigate two problems. First, it was aimed to study
heat distribution from absorber into glass tube. Secondly the role of various fluid properties in heat
transfer process was also explored. This simulation was not limited by the safety issue in utilizing
flammable fluid. Since the main purpose of this simulation was to investigate the influence of fluid
thermal conductivity and viscosity, several thermal fluids with low flash point were also simulated. It is
possible because this simulation was not limited by the safety issue in utilizing flammable fluid. In
addition, the model of current heat exchanger design was modeled for this simulation to compare its
performance with the new design.
3.2.1 Heat distribution
In the first simulation, investigation of heat distribution across the cylinder’s tangential and radial direction
was conducted. Instead of doing steady state simulations, dynamic simulations were preferable to observe
the changes in heat distribution. The heat distribution resulted from this simulation was plotted in Figure
3-2 for water and Figure 3-3 for Marlotherm 450. The conductivity of these fluids was 0.61 W/m.K and
0.14 W/m.K, respectively.

-28-
Figure 3-2: Heat distribution during charging with water as thermal fluid inside the annulus.
Figure 3-3: Heat distribution during charging with Duratherm 450 as thermal fluid.
As shown in the pictures above, heat distribution can be observed easily from different color which
represents different temperature level. Duratherm 450 as thermal fluid which has lower conductivity than
water, gives more uniform heat distribution across tangential direction. This condition occurred since
lower conductivity fluid has higher heat resistance. Therefore, when low conductivity fluid is used in
annulus, more heat will flow through the fluid layer in cylinder at its tangential direction than its radial
direction. Moreover, this condition was supported by the metal cylinder of the heat exchanger—made of
aluminum—which has very high heat conductivity (205 W/m.K). This high heat conductivity lowers the
cylinder heat resistance.
Fluid type Cond.
(W/mK)
Metal cylinder Glass
Tmax Tmin dT Tmax Tmin dT
Water 0,609 73,05 71,49 1,56 72,51 71,25 1,26
Tyfocor 0,455 73,20 72,63 1,57 72,46 71,25 1,21
Paratherm LR 0,145 74,25 72,61 1,64 72,22 73,36 0,86
Duratherm 450 0,138 74,33 72,68 1,65 72,21 71,36 0,84
Duratherm LT 0,136 74,35 72,71 1,65 72,20 71,36 0,84
Paratherm MR 0,131 74,41 72,76 1,65 72,19 71,37 0,83
Paratherm OR 0,126 74,48 72,83 1,65 72,18 71,37 0,81
Marlotherm SH 0,123 74,53 72,87 1,65 72,18 71,38 0,81
Marlotherm X 0,116 74,63 72,97 1,66 72,16 71,38 0,78
Table 3-1: Charging simulation temperature result with various thermal fluid.

-29-
Heat distribution can also be investigated by comparing the temperatures below attachment point (Point
1), at which the heat from the absorber is transferred to the whole assembly, with the temperature at the
point in the opposite direction (Point 2). The temperature at Point 1 was found to be the highest (Tmax)
temperature of the cylinder system while the temperature at Point 2 was the lowest (Tmin). These
temperature data are presented in Table 3-1 and Figure 3-4. It can be seen that the lower the fluid’s
thermal conductivity used, the lower the temperature difference between those two points on glass tube’s
surface. In other word, more distributed heat will result when a lower conductivity fluid is used due to
higher thermal resistance in the tangential direction.
Observations on the metal cylinder surface were also done with this simulation. In contrast to previous
results, lower the fluid conductivity will lead to the higher temperature difference on this surface. This
implies that utilization of lower conductivity fluid will increase the resistance for heat to penetrate into the
reactor, which gives consequence to greater heat loss.
Figure 3-4: Influence of different fluid conductivity to temperature difference on cylinder surface.
3.2.2 Heat transfer rate
To simulate the real charging condition, a 3D model was developed for both the current heat exchanger
design and the new one. In this simulation, the total amount of heat transferred to the inner part of
reactor can be directly recorded. The UA value was calculated by dividing this amount by the average
temperature difference between the outer part of the metal cylinder and the inner part of glass tube.
Figure 3-5 and Table 3-2 present the calculation results from the simulation of the current design and
the new design. The efficiency, which is a comparison of the heat reached the reactor and the heat that
was supplied on the absorber, was reduced from 82% in the current design to 50% in the new one.
Moreover, the UA value was also reduced following the reduction of the fluid’s heat conductivity. On the
other hand, temperature difference between cylinder surface and the tube’s temperature rose as the
conductivity decreased. This indicates that a higher temperature on the absorber surface is required to
provide optimum charging temperature inside the reactor. However, this large different was occurred
since the simulation of current design did not consider the air gap between the thin plate and the glass
tube.
According to heat transfer theory which is shown by Equation 2.12, the amount of heat transferred
depends on the distance from the heat source represented by heat exchanger diameter, conductivity of the
fluid, and contact area with the heat source. Based on that understanding, it is obvious that the decrease in
efficiency of the new the design compared with the current design is caused by the presence of the
0
0,1
0,2
0,3
0,4
0,5
0,6
0,7
0,7
0,9
1,1
1,3
1,5
1,7
1,9
Fluid conductivity vs surface temperature difference; left axis (0C); right axis (W/m.K)
dT glass
dT cylinder
Conductivity

-30-
annulus. This annulus will add one more element to the equation which causes a higher value of total
resistance. In order to reduce this resistance while keeping the existence of this annulus, this additional
element can be minimized. It can be performed by simply reducing the annulus size and using a fluid with
a higher conductivity.
Figure 3-5: Influence of different fluids conductivity to the UA value for charging.
Current Model Heat flux (W/m2) Q (W) dT (K) UA (W/K) ε (%)
300,00 2,06 0,26 7,91 82,27
New model Heat flux (W/m2) Q (W) dT (K) UA (W/K) ε (%)
Fluid
Water 158,74 1,26 0,44 2,83 50,24
Tyfocor LS 158,14 1,25 0,59 2,11 50,05
Paratherm LR 157,63 1,25 1,62 0,77 49,89
Duratherm 450 157,61 1,25 1,69 0,74 49,89
Duratherm LT 157,61 1,25 1,72 0,73 49,88
Paratherm MR 157,59 1,25 1,77 0,70 49,88
Paratherm OR 157,58 1,25 1,84 0,68 49,88
Marlotherm SH 157,57 1,25 1,88 0,66 49,87
Marlotherm X 157,56 1,25 1,99 0,63 49,87
Table 3-2: Simulation data comparison of current heat exchanger design with new heat exchanger design.
3.3 Simulation for discharging
In this simulation, two discharging modes of the new heat exchanger design were simulated. The purpose
of this was to find out the benefit and drawbacks of each method specifically. The result of it will be used
to decide whether both of the modes are favorable for further investigation in a laboratory experiment or
not. Based on chapter 2.62, the formula given regarding the discharging process shows that not only heat
0
0,1
0,2
0,3
0,4
0,5
0,6
0,7
0,00
0,50
1,00
1,50
2,00
2,50
3,00
Influence of fluid conductivity to the UA value for charging left axis (W/K); right axis (W/m.K)
UA
Conductivity

-31-
conductivity will influence the heat transfer process and UA value. The flowing thermal fluid generates
higher convection which is a function of Nusselt number. This number is determined by the flow speed
of the fluid and its viscosity. Moreover, the variation of flow speed also affect the mass flow rate which is
an important factor in this case due to its affect to the total heat capacity of the fluid. Therefore, the
simulation for discharging was also done with various flow rate to investigate its influence in this process.
A detailed calculation result of this simulation is provided in Appendix B.
3.3.1 Active passive mode
In order to investigate the influence of the fluid’s properties, the same fluid as used in charging simulation
was also used in this discharging model. Yet, the properties were based on inlet temperature simulate
which was 30 0C. Three flow rates—0,01; 0,02; 0,04 m/s—were simulated for each fluid type, and inlet-
outlet temperature as well as pressure drop across the annulus length were recorded. Then, the inlet and
outlet temperatures were recorded and heat transfer coefficients (UA values) were calculated with
Equation (2.15). The result of the simulation and calculation are plotted in Figure 3-6.
Figure 3-6: UA value of discharging active-passive mode with different flow speed.
The figure above implies that the UA value during discharging is strongly influenced by fluid’s flow rate.
The rate is increasing with the increasing speed for all of the fluid. Nevertheless, water acts differently if
higher flow rate is applied. This anomaly happens because in annular flow, the inner wall was heated while
the other wall experiencing convective cooling due to the flowing liquid. The higher the flow rate, the
higher the Nusselt number as well as convection coefficient generated. In addition, water has low viscosity
which increases the value of this number easily. In the high Nusselt number condition, the heat flux on
the outside wall surface can be positive or negative [15]. Hence, there was a possibility that in ideal
conditions with higher speed as in this model, the heat flow direction was reversed. Instead of transferring
heat from inside wall to the outside of the system, the outside wall with its initial temperature can supply
the heat to the annular flow resulting in the heat transfer rate from the glass tube to the annulus
decreasing. Thus, the water does not experience a linear heat transfer increment as with the other fluids.
This condition can occur with other low viscosity fluid since the Nusselt number can be very high as well
as its convection rate coefficient.
Further investigations were done by plotting the graph in Figure 3-6 with fluid’s thermal and physical
properties. By doing this, the influence of each property to the heat transfer process was observed. Figure
0
5
10
15
20
25
30
35
40
45
50
W/K
UA value of active-passive mode
0,01 m/s
0,02 m/s
0,04 m/s

-32-
3-7 shows the relationship between heat transfer rate with the viscosity of each fluid. It is very explicit that
heat transfer rate is also strongly influenced by this property. It happens because the heat transfer for the
flowing fluid is the function of Nusselt number which is influenced by the viscosity. Unlike the influence
of flow speed, the UA value and the viscosity are inversely correlated. The results showed that the higher
the viscosity results in the lower the heat transfer coefficient and vice versa. However, a different result
was seen for Tyfocor. Even though its viscosity is higher than Parahterm LR, the coefficient for this fluid
is also higher. This condition is understandable since Tyfocor’s conductivity and heat capacity are much
higher than the same properties for Paratherm LR. Equation 2.12 and 2.15 shows the influence of these
properties on the heat transfer process during discharging.
Figure 3-7: Influence of fluid's viscosity to the UA value of active-passive mode.
Figure 3-8: Influence of fluid's specific heat capacity to the UA value of active-passive mode.
To further analyze the effect of heat capacity, Figure 3-8 shows the relationship of it to the UA value. It
seems that this property is not really affecting that value. It can be seen by comparing Paratherm LR,
Duratherm LT and Paratherm MR. The heat capacity for Paratherm LR is lower than Paratherm MR
while its UA value is higher. On the other hand, the heat capacity for Duratherm LT is lower than
0
0,01
0,02
0,03
0,04
0,05
0,06
0,07
0
5
10
15
20
25
30
35
40
45
50
UA Value and Viscosity VS Fluid type a-p left axis (W/K); right axis (W/K)
0,01 m/s
0,02 m/s
0,04 m/s
Viscosity
0
0,5
1
1,5
2
2,5
3
3,5
4
4,5
0
5
10
15
20
25
30
35
40
45
50
UA Value and Specific Heat Capacity VS Fluid type a-p left axis (W/K); right axis (kJ/kg.K)
0,01 m/s
0,02 m/s
0,04 m/s
Cp
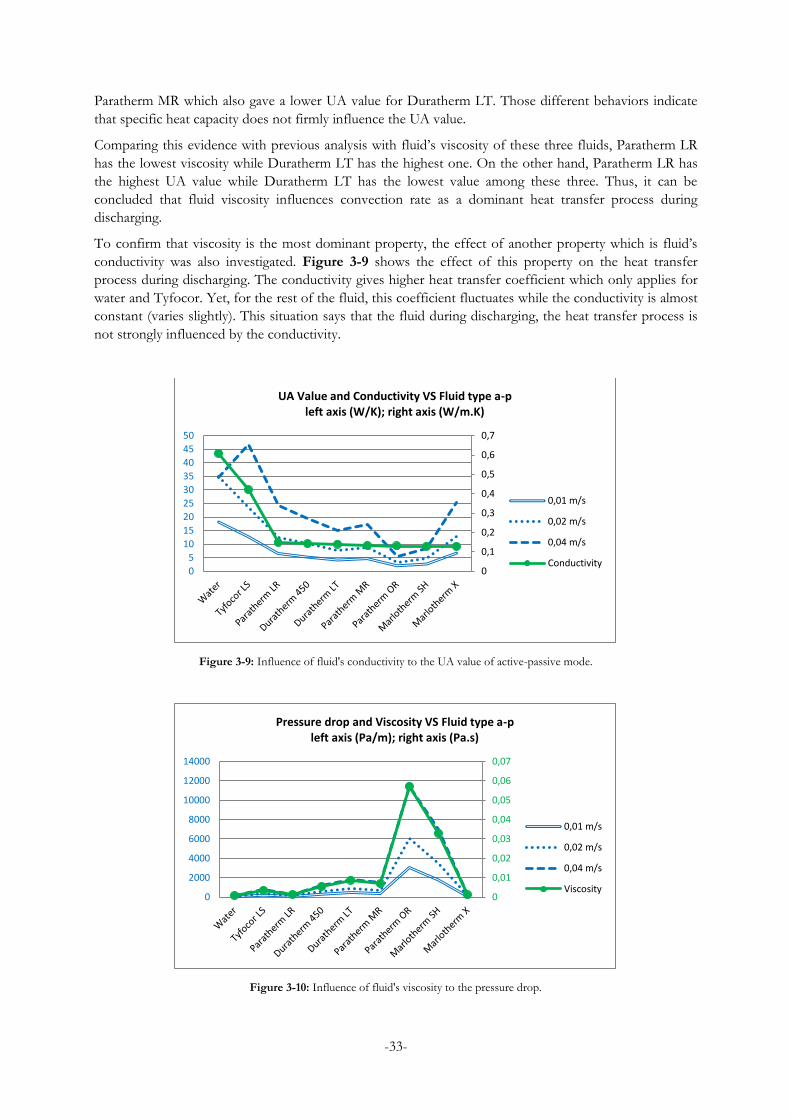
-33-
Paratherm MR which also gave a lower UA value for Duratherm LT. Those different behaviors indicate
that specific heat capacity does not firmly influence the UA value.
Comparing this evidence with previous analysis with fluid’s viscosity of these three fluids, Paratherm LR
has the lowest viscosity while Duratherm LT has the highest one. On the other hand, Paratherm LR has
the highest UA value while Duratherm LT has the lowest value among these three. Thus, it can be
concluded that fluid viscosity influences convection rate as a dominant heat transfer process during
discharging.
To confirm that viscosity is the most dominant property, the effect of another property which is fluid’s
conductivity was also investigated. Figure 3-9 shows the effect of this property on the heat transfer
process during discharging. The conductivity gives higher heat transfer coefficient which only applies for
water and Tyfocor. Yet, for the rest of the fluid, this coefficient fluctuates while the conductivity is almost
constant (varies slightly). This situation says that the fluid during discharging, the heat transfer process is
not strongly influenced by the conductivity.
Figure 3-9: Influence of fluid's conductivity to the UA value of active-passive mode.
Figure 3-10: Influence of fluid's viscosity to the pressure drop.
0
0,1
0,2
0,3
0,4
0,5
0,6
0,7
0
5
10
15
20
25
30
35
40
45
50
UA Value and Conductivity VS Fluid type a-p left axis (W/K); right axis (W/m.K)
0,01 m/s
0,02 m/s
0,04 m/s
Conductivity
0
0,01
0,02
0,03
0,04
0,05
0,06
0,07
0
2000
4000
6000
8000
10000
12000
14000
Pressure drop and Viscosity VS Fluid type a-p left axis (Pa/m); right axis (Pa.s)
0,01 m/s
0,02 m/s
0,04 m/s
Viscosity
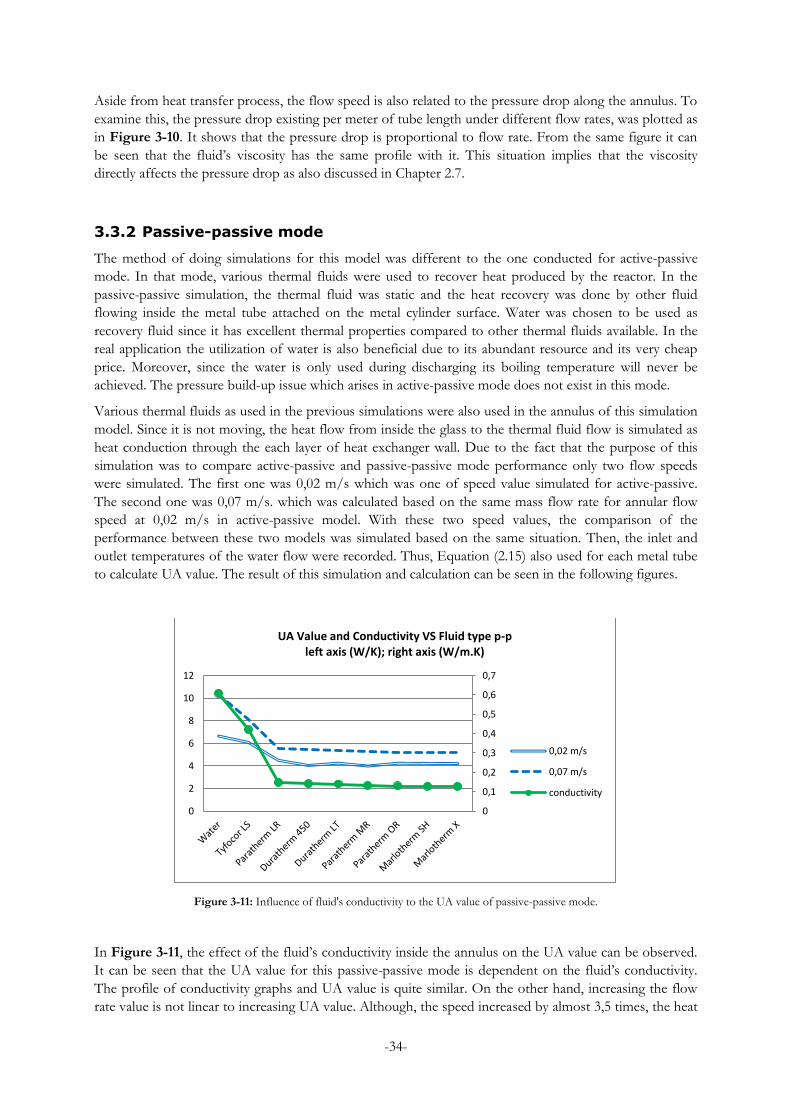
-34-
Aside from heat transfer process, the flow speed is also related to the pressure drop along the annulus. To
examine this, the pressure drop existing per meter of tube length under different flow rates, was plotted as
in Figure 3-10. It shows that the pressure drop is proportional to flow rate. From the same figure it can
be seen that the fluid’s viscosity has the same profile with it. This situation implies that the viscosity
directly affects the pressure drop as also discussed in Chapter 2.7.
3.3.2 Passive-passive mode
The method of doing simulations for this model was different to the one conducted for active-passive
mode. In that mode, various thermal fluids were used to recover heat produced by the reactor. In the
passive-passive simulation, the thermal fluid was static and the heat recovery was done by other fluid
flowing inside the metal tube attached on the metal cylinder surface. Water was chosen to be used as
recovery fluid since it has excellent thermal properties compared to other thermal fluids available. In the
real application the utilization of water is also beneficial due to its abundant resource and its very cheap
price. Moreover, since the water is only used during discharging its boiling temperature will never be
achieved. The pressure build-up issue which arises in active-passive mode does not exist in this mode.
Various thermal fluids as used in the previous simulations were also used in the annulus of this simulation
model. Since it is not moving, the heat flow from inside the glass to the thermal fluid flow is simulated as
heat conduction through the each layer of heat exchanger wall. Due to the fact that the purpose of this
simulation was to compare active-passive and passive-passive mode performance only two flow speeds
were simulated. The first one was 0,02 m/s which was one of speed value simulated for active-passive.
The second one was 0,07 m/s. which was calculated based on the same mass flow rate for annular flow
speed at 0,02 m/s in active-passive model. With these two speed values, the comparison of the
performance between these two models was simulated based on the same situation. Then, the inlet and
outlet temperatures of the water flow were recorded. Thus, Equation (2.15) also used for each metal tube
to calculate UA value. The result of this simulation and calculation can be seen in the following figures.
Figure 3-11: Influence of fluid's conductivity to the UA value of passive-passive mode.
In Figure 3-11, the effect of the fluid’s conductivity inside the annulus on the UA value can be observed.
It can be seen that the UA value for this passive-passive mode is dependent on the fluid’s conductivity.
The profile of conductivity graphs and UA value is quite similar. On the other hand, increasing the flow
rate value is not linear to increasing UA value. Although, the speed increased by almost 3,5 times, the heat
0
0,1
0,2
0,3
0,4
0,5
0,6
0,7
0
2
4
6
8
10
12
UA Value and Conductivity VS Fluid type p-p left axis (W/K); right axis (W/m.K)
0,02 m/s
0,07 m/s
conductivity

-35-
transferred only doubled (for water utilization) or even less (for other thermal fluids). This condition
shows that when the flow speed rises, the increment percentage of UA value is not greatly affected. On
that account, it can be concluded that for this mode, the conductivity is dominantly affecting the heat
transfer rate. In addition, increasing the flow rate will not proportionately increase the heat transfer.
This situation occurs since in this mode, the heat needs to pass the thermal fluid layer and metal cylinder
layer before it is recovered by the water. Furthermore, convective heat transferr only occurs on the metal
tube inner surface which is very small compared to the convection surface in the previous simulation. For
those reasons, the convective heat transfer does not greatly influence the UA value in this mode.
Figure 3-12: UA value comparison of two new heat exchanger modes.
To examine the performance difference between two modes of the new heat exchanger design, the UA
value under the same mass flow rate for both discharging modes were plotted in Figure 3-12. The figure
clearly shows that for most of the fluid types which were used, active-passive mode gave higher
performance. Nevertheless, in the utilization of thermal oil—other than water and glycol—this difference
was not significant such as with Duratherm LT and Paratherm MR. Furthermore, the UA value of active-
passive mode were lower than passive-passive value for some thermal oils. This condition occurs for oils
with low conductivity and high viscosity like Paratherm OR and Marlotherm SH.
3.3.3 Simulation discussion
From all of the simulations and calculations that have been conducted, it can be concluded that the heat
transfer during charging for both of new designs were highly depended on the heat conductivity of the
fluid. Hence, without considering operational constraints, water was the best thermal fluid for it.
However, the possibility of pressure built up in the annulus for it utilization is very high. For that reason,
it is not viable to put water in the annulus. The second fluid that gave the best performance for charging is
Tyfocor. This is a propylene glycol-water based fluid that is usually used for solar collector applications.
The boiling point of this fluid is slightly higher than water, hence the same issue as in water would still
occur for high temperature utilization of this fluid. Furthermore, continuous cycles of heating and cooling
makes this fluid degrade easily which is undesirable.
Apart from those two fluids, each simulated thermal oil gave almost the same result for charging since the
conductivity is only slightly different among them. However, based on their datasheet in Appendix C,
Paratherm LR, Parahterm MR and Marlotherm X are not possible to be used in real application because

-36-
of their low flash point and flame point. Meanwhile, even though Paratherm OR and Marlotherm SH
have much higher values for these physical properties, utilization of this will reduce the heat transfer rate
during discharging in active-passive mode. Hence, only Duratherm 450 and Duratherm LT are promising
to be employed.
Charging
UA (W/K) %
Current design 7,91 82,27
New design Water Tyfocor Water Tyfocor
2,83 2,11 50,24 50,08
Discharging
UA (W/K)
Water Tyfocor
Current design 11 6
New design Active-passive 35 24
Passive-passive 10 8
Table 3-3: Comparison summary of current design with new design.
The summary of comparison is shown in Table 3-3 for both charging and discharging. However, it only
shows the comparison with water and Tyfocor since they gave the best performance in the COMSOL
simulations. It can be seen that the current design performed the best in the heat transfer process for
charging, while active passive performed the best for discharging. However, the discharging result for
passive-passive is only slightly different to the current design and made it interesting for further
investigation in the terms of its overall economic value compared to active-passive. It is because in active-
passive, the overall system will require a large volume of thermal oil which is really expensive. On the
other hand, passive-passive only requires a smaller volume since it is static inside the annulus during
charging and discharging. Based on the heat transfer theory, increasing contact between absorber and the
heat exchanger assembly, as well as reducing annulus size will increase heat transfer rate during
discharging. However, the second one is only possible for passive-passive mode since the pressure drop is
not an issue for it while smaller annulus size is used.

-37-
4 Lab experiment
In order to validate the COMSOL simulation result, a laboratory experiment was carried on with the real
heat exchanger assembly. This experiment was only done for the active-passive design since it gives the
best discharging performance while the passive-passive performance is relatively low in discharging.
Furthermore, only water and Tyfocor were used as thermal fluid due to unavailability of other thermal oil.
4.1 Experimental rig set-up
For this experiment, a hollow glass tube was used instead of a tube with chemical material inside. The
purpose of it was to minimize chemical influence of heat exchanging process. Thus, the real heat transfer
coefficient of heat exchanger which is only influenced by its physical properties could be obtained. Figure
4-1 and Figure 4-2 shows hydraulic diagram and wiring diagram of experimental rig respectively. Two
types of pumps were used which were centrifugal pump to provide high flow speed and peristaltic pump
in which its flow speed could be controlled. The peristaltic pump was used in the charging experiment to
pump low speed water inside the glass tube. It was needed to get low flowi speed resulting in a
distinguishable temperature difference between inlet and outlet. Thus, the difference could be recorded
and the energy transferred from the absorber could be calculated. This practice was also conducted for
annular flow in the discharging experiment. On the other hand, the high flow speed of water with
particular temperature level was created inside the glass tube during discharging experiment. The purpose
of doing it was to create constant temperature condition inside the tube as would occur during the real
discharging process with chemical material inside the tube. This kind of flow speed made the temperature
between inlet and outlet only slightly different due to higher mass rate.
For both charging and discharging, all the inlet temperatures were maintained at constant level. Since no
flow meter was used in both fluid channels, the mass flow rate was measured by allowing the outlet to
flow into a container for specific time period and measuring the mass of the collected water.
Figure 4-1: Hydraulic diagram of experimental rig.

-38-
Figure 4-2: Wiring diagram of control and data acquisition system for experimental rig.
4.2 Experimental result
Charging experiment
In this experiment, 192 W of heat was supplied on the absorber surface. The water flowed inside of glass
tube, then its inlet as well as outlet temperature measured. The difference between these temperatures was
calculated and the mass flow was measured. By performing these steps, the amount of energy transferred
to the glass tube was calculated with Equation 2.15. In this experiment, the average temperature on the
cylinder surface and glass tube surface was calculated and with the result from previous calculation, the
UA values were calculated with Equation 2.14. The result is presented in Table 4-1 below.
Input 192,00 W
Q (W)
dT (K)
UA (W/K)
ε %
Water 113,70 5,92 19,19 59,22
Tyfocor 109,06 6,49 16,81 56,80
Table 4-1: Experimental result for charging.
The table above shows that the amount of heat transferred to the glass tube for both fluids is around 50%
of the power supplied. This result is almost the same with the COMSOL simulation with the same type of
fluids. In addition, the heat transferred between these two fluids is only slightly different which is agrees
with the simulation result. Also, the temperature different between cylinder surface and glass tube surface
presented by dT gives the same trend as in simulation result. However, the value is larger than in
simulation since more heat losses occurred in the experiment than in the simulation—which had ideal
conditions and was well insulated.

-39-
Discharging experiment
In this experiment, three flow speeds were used to investigate its influence on the heat transfer process.
The calculation for heat transferred was done also using Equation 2.15 with temperature difference of
inlet and outlet of annular flow, and also with its measured mass flow rate. Equation 2.14 was also used to
calcualte UA values for this experiment. The result shows proportional linear relationship with the heat
transferred as well as the UA value. With this relationship, the values under the same volume flow rate as
in the simulation were calculated. Table 4-2 below shows the calculated experimental result which is
based on the volume flow rate 0,3 L/min or 0,02 m/s of simulation’s flow speed. This calculation was
done using the linear relationship of the result which is shown in Figure 4-3.
Q (W)
LMTD (K)
UA (W/K)
Water 91,42 2,22 41,18
Tyfocor 74,86 2,62 28,57
Table 4-2: Experimental result for discharging.
Figure 4-3: Linear relationship of various thermal fluid flow speed during discharging.
The table shows that there are differences between the simulation result and the experimental result. The
Q and the UA value of the experiment one was higher than those values in the simulation. It is obvious
since in the simulation model, the heat from inside reactor tube was modeled as a heat source with
constant temperature without any convection on the inner surface. Meanwhile, in the experimental work,
water was flowed at high speed (5L/min) through the tube to maintain its temperature at the same level
as in the simulation. This flowing water provided higher convection coefficient to the heat transfer
process resulting in lower thermal resistance between the inner part of the tube and the annulus.
Therefore, heat transfer coefficient in this experimental result was higher compared to the simulation
results. On the other hand, the value for water is still higher than Tyfocor, this showed that the same
behavior as in the simulation result also happened in this experiment. Comparing with the current design’s
performance with its UA value 11 W/K and 6 W/K for water and Tyfocor respectively, this active passive
design gave much higher values in the discharging process.
0
20
40
60
80
100
0 2 4 6
W
g/s
Tyfocor
Tyfocor
0
20
40
60
80
100
0 2 4 6
W
g/s
Water
Water

-40-
5 Conclusion and recommendation
An investigation of the performance of a new heat exchanger for CoolStore has been conducted. The
work encompassed two operational modes of this new heat exchanger which are active-passive and
passive-passive. Some simulation models were developed to understand easily the influence of thermal
fluid properties on the performance. With the result from the simulation that the active-passive
demonstrated better performance than passive-passive, an experimental rig for this mode was developed
to validate the simulation result. With all of those works done, the conclusions are as follows:
COMSOL can be used to evaluate the performance of heat exchanger designs.
In the new heat exchanger design, the existence of thermal fluid increases thermal resistance to
the heat transfer process. Consequently, its UA value becomes very low and only half of the heat
that is supplied to the absorber can be transferred to the reactor.
This thermal resistance also caused the UA value in passive-passive mode to be much lower than
active-passive mode.
Heat transfer fluid conductivity is the most influencing properties for charging. This also applied
in discharging for passive-passive mode.
Meanwhile, during discharging with active-passive mode, fluid viscosity is the most influencing
properties and inversely proportional to UA value.
Overall, the current heat exchanger design gives the best performance during charging while the
active-passive mode gives the best performance during discharging..
Although the new heat exchanger design can give good protection to the glass tube, the existence of fluid
will give a considerably low heat transfer performance to the CoolStore assembly. Moreover, the fluid with
the highest thermal conductivity such as water and Tyfocor cannot be used in the system. As a result, low
flammable thermal oil is an alternative that can be taken. However, the price of this oil on the market is
very high which obviously will increase CoolStore price. For that reason, utilizing this type of new heat
exchanger design seems not promising for CoolStore performance.
Nevertheless, further study of passive-passive design is recommended to be performed by considering
complete system operational condition. The static thermal fluid requires much lower amount of thermal
oil compared to active-passive. Hence, the additional cost that will be inccurred in using this fluid can be
minimized. Moreover, comparing with the current design, the UA value during discharging is only slightly
different. Improving the performance for this design can be done by increasing contact surface between
absorber and the metal cylinder, and also by reducing the annulus size. If this improvement works and the
performance of this passive-passive can be the same or only slightly lower than current design, this
passive-passive design will be more promising to replace the current one. With it, the performance will not
very much reduced while the tube can be well protected. In addition, the mass production of CoolStore
can be faster and the man power can be minimized.

-41-
Bibliography
[1] T. Nunez, "Thermally driven cooling: Technologies, developments and applications," Journal of
Sustainable Energy, vol. 1, no. 4, pp. 16-24, 2010.
[2] K. Alam, Y. Kang, B. Saha, A. Akisawa and T. Kashiwagi, "A novel approach to determine optimum
switching frequency of a conventional adsorption chiller," Energy, vol. 28, pp. 1021-1037, 2003.
[3] K. Alam, B. Saha, Y. Kang, A. Akisawa and T. Kashiwagi, "Heat exchanger design effect on the
system performance of silica gel adsorption refrigeration systems," International journal of heat and mass
transfer, vol. 43, pp. 4419-4431, 2000.
[4] www.climatewell.com, accessed on February 2, 2013.
[5] T. Li, R. Wang, J. Kiplagat and H. Chen, "Experimental study and comparison of thermochemical
resorption refrigeration cycle and adsorption refrigeration cycle," Chemical Engineering Science, vol. 65,
pp. 4222-4230, 2010.
[6] A. H. H. Ali, P. Noeres and C. Pollerberg, "Performance assesment of an integrated free cooling and
solar powere single-effect lithium bromide-water absorption chiller," Solar Energy, vol. 82, pp. 1021-
1030, 2008.
[7] W. Wongsuwan, S. Kumar, P. Neveu and F. Meunier, "A review of chemical heat pump technology
and applications," Applied thermal engineering, vol. 21, pp. 1489-1519, 2001.
[8] M. R. Conde, "Properties of aqueous solutions of lithium and calcium chlorides: formulations for use
in air condition equipment design," International Journal of Thermal Sciences, vol. 43, pp. 367-382, 2004.
[9] M. Lebrun and B. Spinner, "Models of heat and mass transfers in solid-gas reactors used as chemical
heat pumps," Chemical engineering science, vol. 45, no. 7, pp. 1743-1753, 1990.
[10] J. A. Duffie and W. A. Beckman, Solar Engineering of Thermal Processes, New Jersey: John Willey &
Sons, 2006.
[11] F. P. Incropera, D. P. Dewitt, T. L. Bergman and A. S. Lavine, Fundamental of Heat and Mass
Transfer, -: John Wiley & Sons, 2007.
[12] M. Mbaye, Z. Aidoun, V. Valkov and A. Legault, "Analysis of chemical heat pumps (CHPS): Basic
concepts and numerical model description," Applied Thermal Engineering, vol. 18, pp. 131-146, 1998.
[13] V. Gnielinski, "Heat Transfer Coefficients for Turbulent Flow in Concentric Annular Ducts," Heat
Transfer Engineering, vol. 30, no. 6, pp. 431-436, 2009.
[14] J. Taha-Tijerina, T. N. Narayanan, G. Gao, M. Rohde, D. A. Tsentalovich, M. Pasquali and P. M.
Ajayan, "Electrically Insulating Thermal Nano-Oils Using 2D Fillers," American Chemical Society, vol. 6,
no. 2, pp. 1214-1220, 2012.
[15] V. R, "Heat transfer with laminar flow in a concentric annulus with precribed wall temperatures,"
Applied Scientific Research, vol. 12, no. 6, pp. 463-476, 1964.

-42-
Appendix A: COMSOL Physical model dimension
Charging
Aluminum cylinder
OD : 60 mm
ID : 57 mm
Length : 50 mm
Glass tube
OD : 54 mm
ID : 50,4 mm
Length : 50 mm
Solar absorber
Wide : 100 mm
Thickness : 0,4 mm
Length : 50 mm
Discharging
Aluminum cylinder
OD : 60 mm
ID : 57 mm
Length : 400 mm
Glass tube
OD : 54 mm
ID : 50,4 mm
Length : 400 mm
Recovery tube (Passive-Passive)
OD : 10 mm
ID : 7 mm
Length : 400 mm

-43-
Appendix B: COMSOL Simulation result
Active-Passive
Passive-Passive
v 0,01 m/s
v 0,02 m/s
V 2,62E-06 m3/s
V 1,54E-06 m3/s
Fluid
Q LMTD UA
Fluid
Q LMTD UA
Water
43,43 2,39 18,18
Water
20,43 3,08 6,64
Tyfocor LS 35,60 2,80 12,74
Tyfocor LS 19,42 3,19 6,08
Paratherm LR 16,06 2,45 6,56
Paratherm LR 16,02 3,56 4,50
Duratherm 450 15,83 3,02 5,24
Duratherm 450 14,90 3,68 4,05
Duratherm LT 13,56 3,25 4,17
Duratherm LT 15,39 3,63 4,25
Paratherm MR 15,26 3,24 4,71
Paratherm MR 14,75 3,69 4,00
Paratherm OR 8,09 4,02 2,01
Paratherm OR 15,39 3,63 4,24
Marlotherm SH 9,98 3,72 2,68
Marlotherm SH 15,34 3,63 4,23
Marlotherm X 16,35 2,43 6,71
Marlotherm X 15,32 3,63 4,21
v 0,02 m/s
v 0,07 m/s
V 5,23E-06 m3/s
V 5,23E-06 m3/s
Fluid
Q LMTD UA
Fluid
Q LMTD UA
Water
85,45 2,45 34,84
Water
40,87 3,96 10,33
Tyfocor LS 68,67 2,90 23,68
Tyfocor LS 33,81 4,15 8,15
Paratherm LR 31,64 2,50 12,64
Paratherm LR 24,32 4,40 5,53
Duratherm 450 31,14 3,06 10,17
Duratherm 450 23,92 4,41 5,42
Duratherm LT 25,87 3,35 7,72
Duratherm LT 23,83 4,41 5,40
Paratherm MR 29,40 3,32 8,87
Paratherm MR 23,44 4,42 5,30
Paratherm OR 13,57 4,19 3,24
Paratherm OR 23,12 4,43 5,22
Marlotherm SH 17,73 3,88 4,57
Marlotherm SH 23,18 4,43 5,23
Marlotherm X 32,26 2,49 12,98
Marlotherm X 23,11 4,43 5,22
v 0,04 m/s
V 1,04562E-05 m3/s
Fluid
Q LMTD UA
Water
117,96 3,42 34,48
Tyfocor LS 136,55 2,91 46,85
Paratherm LR 62,36 2,56 24,41
Duratherm 450 60,62 3,13 19,38
Duratherm LT 50,99 3,38 15,09
Paratherm MR 58,04 3,34 17,37
Paratherm OR 23,99 4,29 5,59
Marlotherm SH 32,91 3,97 8,30
Marlotherm X 63,82 2,53 25,27

-44-
Appendix C: Thermal fluids data sheet