INVESTIGATION OF LATERAL ACCELERATION-BENDING … · for a large 3ooster utilizing multi...
52
. INVESTIGATION OF LATERAL ACCELERATION-BENDING COUPLING FOR A LARGE 3OOSTER UTILIZING MULTI ACCELEROMETERS https://ntrs.nasa.gov/search.jsp?R=19660015202 2018-09-08T02:10:39+00:00Z
Transcript of INVESTIGATION OF LATERAL ACCELERATION-BENDING … · for a large 3ooster utilizing multi...

.
INVESTIGATION OF LATERAL
ACCELERATION-BENDING COUPLING
FOR A LARGE 3OOSTER UTILIZING
MULTI ACCELEROMETERS
https://ntrs.nasa.gov/search.jsp?R=19660015202 2018-09-08T02:10:39+00:00Z

PREPARED BY:
PAOtS ArrLCTED
....... " .... I .......... " .......................................................................... DATE REM ARK I BY ATP.
.............................. +. ....... ..." ................ ".. "... .....
INVESTIGATION OF LATERAL
ACCELERATION - BENDING COUPLING
FOR A LARGE BOOSTER UTILIZING
MULTI ACCELEROMETERS
ENGINEERING REPORT NO. 121 3
22 DECEMBER 1965
........................ "...."....".........<
........ ".............,
RUE-509 REV.
c
APPROVED BY:
C. L. Anker
P. R . Coulson Program Manager
t
I I I
I I I 1 I I
,
I
t
I
HAYES INTERNATIONAL CORPORATION
ABSTRACT
A method for analyzing lateral acceleration-bending coupling in a large
flexible booster is studied with the hope of obtaining a simplified frequency
domain analysis method which will aid in positioning multiple accelerometers.
This analysis technique i s an attempt to gain basic insight into the problem of
positioning multiple accelerometers by defining a lateral-acceleration-bending
f i l ter function that depends on accelerometer position and number.
function amplitude and phase characteristic is varied by positioning the acceler-
The filter
ometers.
Straightforward application of Nyquist cr i ter ia permits determination of
the stability of the uncoupled bending-lateral acceleration loop. Trends in over-
all system stability a r e indicated by this technique as shown by comparison with
root locus studies.
The method developed herein requires much less digital computer rulr
time than comparable root locus studies and is applied to several familiar pro-
blems with some success.
Mr. R. S. Ryan, Chief, Dynamic Analysis Branch of the Flight Mechanics
and Dynamics Division of the Aero-Astrodynamics Laboratory was the technical
supervisor and the work reported herein was accomplished under contract NAS8-
20201 with Marshall Space Flight Center, National Aeronautics and Space Admin-
istration.

HAYES INTERNATIONAL CORPORATION
TABLE OF CONTENTS
TITLE
LIST OF SYMBOLS
LIST OF FIGURES
INTRODUCTION
THEORY
RESULTS
CONCLUSIONS
REFERENCES
APPENDIX
AMPLITUDE PLOTS
PHASE PLOTS
NYQUIST DIAGRAMS
ROOT CONTOURS
PAGE
i
iii
1
4
8
12
13

HAYES INTERNATIONAL CORPORATION
LIST OF SYMBOLS
System transfer function
Indicated lateral acceleration
g2 i A i
Swivel engine thrust
Longitudinal acceleration of the vehicle
Gain of accelerometer control loop
The number of accelerometers
Effective moment of inertia of the vehicle about its c. g.
The number of bending modes
Dynamic characteristics of engine gimbal system
Generalized bending mass A d
The complex number f rom - !ko ) I n
Accelerometer location
Translation displacement of rigid vehicle
Displacement and slope of bending mode at X a i
E Displacement and slope of bending mode at X
Swivel angle (angle of the engine gimbal relative to the center line of the vehicle a t the gimbal point)
Gimbal angle control signal
i

HAYES INTERNATIONAL CORPORATION
LIST OF SYMBOLS (CONTINUED)
Damping factor of accelerometer
Damping factor of bending mode
‘.ai
h j
Generalized bending coordinate
Pitch angle of rigid vehicle relative to inertial space “j
4)
Bending frequency (rad/sec) wBj
ii
W Coupled frequency n

I I I I I E I I I I I I 1 I i
I
I I
I
I I
1
HAYES INTERNATIONAL CORPORATION iii
LIST OF FIGURES
FIGURE TITLE PAGE
3 1 LATERAL ACCELERATION-BENDING COUPLED SYSTEM
A AMPLITUDE PLOTS FOR THREE BENDING MODES WITH ONE, TWO AND THREE ACCELEROMETERS
A-1
A-2
A-3
A-4
A-5
A-6
A-7
A-8
A-9
. B
B- 1
B-2
B - 3
B-4
B-5
B-6
14
17
20
24
27
30
3 4
37
40
PHASE PLOTS FOR THREE BENDING MODES WITH ONE, TWO AND THREE ACCELEROMETERS
15
18
21
25
28
31

C L HAYES INTERNATIONAL CORPORATION
FIGURE TITLE
B-7 I B-8
B-9
C
c- 1
c - 2
c - 3
c-4
c - 5
C-6
c - 7
C - 8
c-9
D-1
D-2
D-3
iv
PAGE
35
38
41
NYQUIST DIAGRAMS FOR THREE BENDING MODES WITH ONE, TWO AND THREE ACCELEROMETERS
16
19
22
26
29
32
36
39
42
ROOT LOCUS FOR ONE, TWO AND THREE BENDING MODES WITH ACTUATOR DYNAMICS AND ONE ACCELEROMETER
ROOT LOCUS FOR ONE, TWO AND THREE BENDING MODES WITH ACTUATOR DYNAMICS AND TWO ACCELEROMETERS
ROOT LOCUS FOR ONE, TWO AND THREE BENDING MODES WITH ACTUATOR DYNAMICS AND THREE ACCELEROMETERS
23
33
43

I I I I I I I I I I I I I I I t I
1
I I
HAYES INTERNATIONAL CORPORATION
T A B L E
1
V
TITLE PAGE
SUMMARY OF RESULTS SHOWING STABILITY AND INSTABILITY FOR VARIOUS ACCELEROMETER CONDITIONS
10
I

HAYES INTERNATIONAL CORPORATION 1 % 1
IN T R ODU C TION
The effects of bending coupling via the lateral acceleration loop of a large
flexible booster vehicle i s investigated f o r the purpose of defining sensor place-
ment cr i ter ia for multiple accelerometers used in combination in the feedback
loop.
control problem at Hayes has been conducted with the aid of root locus plots of
the system closed loop poles.
varied in systematic fashion and the variation in vehicle dynamics was observed
on a root locus plot.
based on stability of the overall system (sensors were varied to keep system
poles in the left half plane). These studies pointed out several disadvantages
of the method, which evaluated sensor position directly a s a function of the closed
Pas t analysis of the multiaccelerometer, lateral acceleration feedback
The positions of multiple accelerometers were
The criterion for choosing sensor position was primarily
I
I loop system poles. F i r s t , all insight into the problem was lost. The basic I
mechanisms by which the acceleration-bending coupling affected stability of
I the various modes was not apparent. Second, the computational requirements
1 were large due to the expansion of a high order determinant to obtain the char-
acter is t ic equation which in turn had to be factored.
e s sa ry for each sensor position and for a complicated system the computer
time was extensive.
This procedure was nec-
The purpose of this report is to investigate an alternate method for locating
sensors , that would provide a good indication or estimate of optimum sensor
positions, with a relatively small computational effort.
herein which is used to accomplish this result, makes use of a bending-lateral
The concept investigated

I I I I I I I I t
I I t i I I 1 I I
I
I
I
I
HAYES INTERNATIONAL CORPORATION 2
acceleration decoupling filter which is synthesized by positioning the multiple
accelerometers which a r e combined to give the lateral acceleration feedback
signal.
model with no rigid body modes.
A first t r y a t this technique is attempted using a simplified vehicle
The simplified system developed herein includes gimbal dynamic, three
bending modes, and mutliple accelerometers, with the rigid body modes omitted.
With this se t of simplified equations and a direct application of Nyquist cr i ter ia ,
an approximation of the effects of bending coupling via the lateral acceleration
loop on system stability may be obtained.
that all system design may be accomplished with the open loop transfer functions.
It must be realized that this is not a complete analysis of the bending coupling
problem, but rather an accelerated procedure that provides an initial under-
standing of the problem.
The advantage of this approach is

3
7 w
N m i? F F

I - t - I I I I I I I I I I I
i
HAYES INTERNATIONAL CORPORATION 4
THEORY
This analysis of lateral acceleration bending coupling will utilize a different
approach for analyzing the interaction and coupling in the lateral acceleration
loop. In brief, the accelerometer, bending mode, and gimbal dynamics equations
will be used to examine the transfer characteristics through the bending equations
and the lateral acceleration control loop as illustrated in Figure 1.
to think of the AI/I transfer function (frequency response function) a s a lateral
acceleration-bending mode coupling filter function which we may change at will
by moving the relative position of the multiple accelerometers. The amplitude
and phase characteristics of the A 1 / I transfer function will be investigated to
determine to what degree they may be modified with various sensor placements
and combinations.
It is helpful
Consider the following equations:
c v A. s A j E .p = 0 .. z qj + 2 b j W S j ij -t WBj T j -
M q
L i

HAYES {NTERNATIONAL CORPORATION 5
where j = the number of bending modes and i = the number of accelerometers.
The Y , & and 4 t e rms a r e omitted with the exclusion of the rigid body modes.
This assumption is justified to some degree because the coupling between the
bending modes and rigid body modes is small.
significant.
the A'/I t ransfer function and will be qualified later in the report.
Omission of the 3 t e r m is most
These simplifications a r e necessary to achieve the proper form of
The simplified Laplace transformed equations a r e
The At/Q t ransfer function is defined as C
Equation (5) i s expanded to give

HAYES INTERNATIONAL CORPORATION 6
when g = I, which is the open loop transfer function for the lateral acceleration- C
bending loop.
The frequency response function for the lateral acceleration-bending
loop is obtained by the substitution S = kw in equation 6. The frequency response
function is
where k = fi F o r computational purposes we will define
P(0) = k g A I - - (kw) - 1 e
The complex number P(w) computed from equation (7 ) presents a complete
pidture of the amplitude and phase of the lateral accele ration-bending coupling
at each frequency o. The computation of P(o) requires relatively small digital
computer computational time and makes investigation of effects of large numbers

HAYES INTERNATIONAL CORPORATION
of accelerometers and bending modes feasible.
Two methods of analysis a r e feasible: (1) Analysis of amplitude and
phase plots of P (Bode plots) to determine ability to shape P by moving accelero-
meters , ( 2 ) Analysis of loop stability using Nyquist cr i ter ia . Both methods
may be compared with root locus plots for the unsimplified system equations to
validate results obtained from the simplified analysis. 1
I The Generalized Nyquist Criteria was applied to the system as defined
7
below
where the sign of K is determined by the sign of Y
2nd slope respectively of the j-th bending mode at the i-th accelerometer position.
Note that the system is assumed to have positive feedback and the resulting c r i -
terion fo r stability of this system is zero encirclements of the (1,O) point.
Variations in the sign of K appear implicitly in the Nyquist diagram.
in question has no open loop poles in the right half plane as evidenced by inspection
of equation (6).
and Y! , the displacement ja i J a i
The system

HAYES INTERNATIONAL CORPORATION 8
RESULTS
In order that the feasibility of the technique previously described can be
investigated, three separate booster control system configurations were investi-
gated. The cases chosen a r e a s follows:
( 1 ) Booster model with three bending modes and one accelerometer
in the lateral acceleration feedback loop.
(2)
(3 )
Same as (1) except with 2 accelerometers combined to give A i .
Same as ( 1 ) except with 3 accelerometers combined.
Both good and bad accelerometer locations for the above mentioned cases were
chosen from previous analysis of the problem.
effect of accelerometer position on system closed loop poles is presented in
Figures D-1, D-2 , and D - 3 for cases 1, 2, and 3 . For this study the static
acceleration feedback gain g2 f o r the drift minimum case (gz =
in conjunction with nominal values of a1 and ac.
a r e used the static contribution of all sensors is chosen to give g2 = . 0 3 8 6 6 7 with
equal weight given to each accelerometer.
Root locus plots illustrating the
. 0 3 8 6 6 7 ) was used
When multiple accelerometers
The P(w) data fo r the three cases is presented in two forms. F i r s t ampli-
tude and phase plots ( for various accelerometer positions) a r e shown in Figures
A-1 through B-9.
in Figures C-1 through C-9.
correlated with the root locus plots for the nonsimplified system.
Next Nyquist plots of P(w) for the various cases a re presented
Both the Bode plots and the Nyquist plots can be
With the aid of the Bode and Nyquist plots we will now t ry to answer the
following questions in order that some light may be shed on the usefulness of this
technique :

HAYES INTERNATIONAL CORPORATION 9
(1) Is there correlation between nonsimplified system stability as
indicated in the root locus plots and the simplified system Nyquist diagrams?
(2) How much modification of the filter function P ( w ) is feasible, and
can the modifications be used as a quantitative indication of system stability?
Can improvements be noted quantitatively on the Bode plots?
(3) Can this method be used successfully as a tool for positioning
multiple accelerometers.
First, question (1) will be discussed in view of the root locus and Nyquist
plots. The following table presents these results at a glance:
F rom Table 1 it can be seen that the simplified system Nyquist plot
predicts in general very stable and very unstable cases with fair accuracy.
However, marginally stable (roots close to imaginary axis) system characterie-
t ics a r e not predicted well. These results a r e in general what is to be expected
f rom a simplification of the type in question.
simplified system to be more stable than the nonsimplified system.
it can be said, in answer to question (1) that there is correlation between the
simplified system and the nonsimplified.
Normally we would expect the
Tentatively
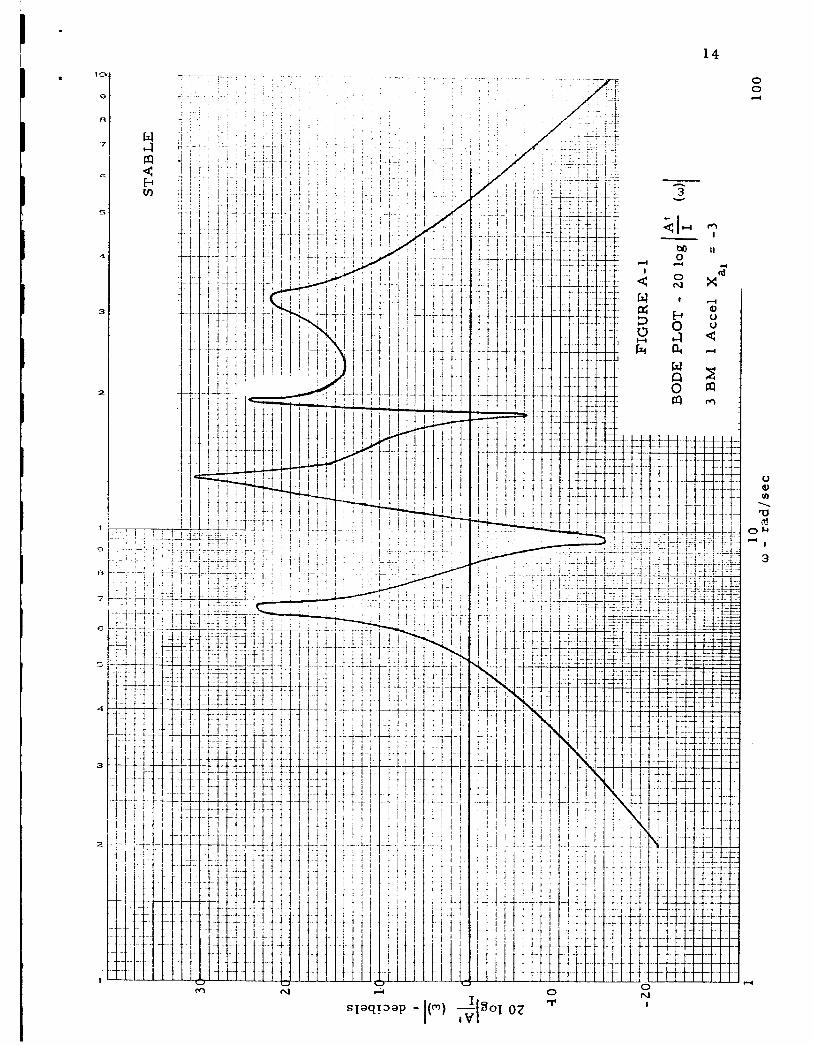
In answer to question ( Z ) , we will refer to the Bode plots of P(w) shown in
FigurPs A-1 through A - 9 . Inspection of the amplitude plots of Plw) immediately
show a very marked similarity in shape, with the main difference being a re-
duction in overall level of as the number of accelerometers is increased,
Good location of either one, two, or three accelerometers seems to give a very
similar shape P(w) versus o curve. However, good location of 3 accelerometers
p ( ~ )

w J -4 E-c m
a
5
10

I I I I I
i i
I I
I
I
HAYES INTERNATIONAL CORPORATION
markedly reduces the amplitude
11
of P(w) . The phase plots shown in Figures
B-1 through B-9 exhibit very similar characteristics and correlate well with
trends indicated by the Nyquist plots.
respond to unstable cases predicted by the nonsimplified equations.
of the accelerometer positions gives in some instances major changes in the
filter function phase characteristic.
(1) that great changes in the filter function P(w) do not seem feasible but significant
changes in phase can be produced.
directly obtainable from the Bode plots; however, good accelerometer locations
seem to give a particular shape of filter function amplitude and phase. Qualita-
tive information does exist, however, but more cases need to be considered
before the Bode piot information is very usefui.
Radical phase changes a r e seen to cor-
Movement
In answer to question (2) we will conclude
(2) Quantitative stability information is not
In answer to question (3) which concerns the feasibility of using this tech-
nique as a design tool we will have to s a y that more work needs to be done before
direct use can be made of this method.
tion the method as presented herein will provide useful results in the form of
approximate accelerometer locations.
is approximate and the effect of the X a i
sidered separately. From previous s tud ie s it is indicated that C X should
equal zero.
If used as supplementary design informa-
It should be remembered that this method
4 t e r m in the equations needs to be con- ..
i a i

HAYES INTERNATIONAL CORPORATION 12
CONCLUSIONS
The major conclusions resulting from this study a r e as follows:
1. In general, the simplified method for choosing accelerometer positions
was successful in predicting system stability, as the comparison with root locus
8 tudie s indicate.
2. It is concluded that major shaping of the filter function can be obtained
by accelerometer position variation and these results can be directly translated
into qualitative information regarding sensor placement.
3.
this analysis.
4.
Quantitative stability information is not obtainable from the results of
Major savings in computer time were achieved by using this technique
for analysis of multiple sensor location effects.
It is generally concluded f rom this study that an approach of this type is feasible
and could concievably be a very us~.fi~il tool for sensor positioning.

HAYES INTERNATIONAL CORPORATION
REFERENCES
1 3
1, Cheng, David K . , "Analysis of Linear Systems", Addison- Wesley Publish- ing Company, Inc. , Reading, Massachusetts, 1959.
2. McWaters, S. R e x and Bailey, J . E . , "Stability Investigation of Multi- Accelerometer Control of Large Flexible Booster Vehicles", Hayes Engineering Report No. 1 0 5 4 , Birmingham, Alabama, 20 August 1964.
14 IC
a
q
7
E
5
4
3
2
I
0
63
7
c
5
4
3
2
1
7 - I -
_._
N I
- A
3 Y
II 0 d
P) 0
s u
0 0 d

15
0 0 cu I
rcl I
0 0 In
l I
0 0 I 4

16
I I I 1 1 I ! I I i I I , ~ Y I i I I I I I i I I I t I I ! I I I I Y I i I T I : 7 I I r i 1 - 1 ; I
__.. * -7 T - . r

17 1 0
0
e
7
a
5
4
3
2
0 cr)
0 N
0 0 0 0 N I
0 0 rl
3

1 0
D
R
7
4
3
2
U
f
18

19

20
0 0 4
- A
3 Y
h
0 0 0 0 ru
I

21
0 0 0 .-I I
0 0 N
1
0 0 rr) I
0 0 * I
0 0 m I
0 0 .-(
u a, rn
-=
O m - 2 3 1

I -

Page 23

I
I
I
1 0
8
e
7
6
9
4
3
2
N d
24
-_
d
I 1 I
(d - - - x 3 v
0 N I

25
N I


27 la
9
E
7
E
5
4
3
2
s
2
N N I
0 0 4
U 0 m \ ea
- 2 I
3

28
1
3
N I
hl I


I
30

31
0 0 & N
f I
0 0 cc) * I f

I I


1c
t
e
,
s
A
1
a
1 C * N N
I
34
3 I . 4

35 1 0
e
e
7
6
5
4
3
2
1 0 0 0
0 0 4 N I I
0 0 m I
0 0
7

f
x;

37 4 .-
In II
ld" X
. 0
6
7
6
-%?x 3 S
j- I ti: 1
I- i ! I C C I I 1
t i
a a0 bo " I O
3
P 4 n
0 0 m N
0 0 0 ni
0 m I

30
0 0 0 4 I
0 0 nl
I
0 0 m I
“ t II .

39
t
. . , - . .

C q m
0 nl
I
0 rr) I

41
0 0 0 4 I
0 0 N
I
0 0 r) I
0 0
d:

42 - _.
In
II
r(
(d" X
t -1 I I

- 4 0 4 (I H - H -6