INVESTIGATION OF CONTAMINANT LEVELS IN GREEN TURTLES...
160
FINAL REPORT INVESTIGATION OF CONTAMINANT LEVELS IN GREEN TURTLES FROM GLADSTONE 31 March 2012 Prepared by: Caroline Gaus 1 *, Sharon Grant 1 , Nat Ling Jin 1 , Kristina Goot 1 , Lan Chen 1 , Alex Villa 1 , Frank Neugebauer 2 , Lixia Qi 1 , Colin Limpus 3 1 National Research Centre for Environmental Toxicology (Entox), The University of Queensland, 39 Kessels Road, Brisbane, QLD 4108, Australia 2 Eurofins GfA Lab Service GmBH, Neulaender Kamp 1, 21079 Hamburg, Germany 3 Aquatic Threatened Species and Threatening Processes, Environment and Resource Sciences Division, Department of Environment and Resource Management, Block C1, 41 Boggo Rd, Dutton Park QLD 4102 *Correspondence to: Caroline Gaus, email: [email protected]
Transcript of INVESTIGATION OF CONTAMINANT LEVELS IN GREEN TURTLES...

FINAL REPORT
INVESTIGATION OF CONTAMINANT LEVELS IN
GREEN TURTLES FROM GLADSTONE
31 March 2012
Prepared by:
Caroline Gaus1*, Sharon Grant1, Nat Ling Jin1, Kristina Goot1, Lan
Chen1, Alex Villa1, Frank Neugebauer2, Lixia Qi1, Colin Limpus3
1National Research Centre for Environmental Toxicology (Entox), The University of Queensland, 39 Kessels
Road, Brisbane, QLD 4108, Australia
2Eurofins GfA Lab Service GmBH, Neulaender Kamp 1, 21079 Hamburg, Germany
3Aquatic Threatened Species and Threatening Processes, Environment and Resource Sciences Division,
Department of Environment and Resource Management, Block C1, 41 Boggo Rd, Dutton Park QLD 4102
*Correspondence to: Caroline Gaus, email: [email protected]

Investigation of contaminant levels in green turtles from Gladstone
2
ACKNOWLEDGEMENTS
We thank Julia Playford and her team at the Department of Environment and Resource
Management for support, and Dr Michael Warne for review comments. We thank Prof. Jack Ng
and Prof. Beate Escher for reviewing this report, and their helpful discussions throughout this
study.

Investigation of contaminant levels in green turtles from Gladstone
3
EXECUTIVE SUMMARY
The objective of the present study was to measure the concentration of contaminants in blood of
live green turtles captured in the Boyne River estuary near Gladstone, and to evaluate whether
the contaminant levels are elevated and may pose a risk to the health of the turtle population.
During early 2011, Port Curtis experienced approximately 5 times higher mortality rates of sea
turtles compared to previous years, as well as increased mortality rates of other wildlife species.
In July 2011, an evaluation of the health status of live and diseased local green turtles was
conducted. In parallel with this investigation, blood was collected from 40 live green turtles to
assess exposure to a range of organic and inorganic contaminants that may be associated with
agricultural, urban and industrial activities and that are known to accumulate in marine wildlife
and may present a hazard to these species. Three of these 40 green turtles had to be euthanised
due to poor diagnoses for survival, providing liver and kidney samples in addition to blood.
Additional liver and fat samples were also obtained from stranded specimens.
The measured levels of contaminants in the Boyne River estuary turtle samples were compared to
the levels reported in the peer-reviewed scientific literature for other green turtles, sea turtles
and, where limited information was available, other vertebrates from both polluted and relatively
low impacted areas. These levels were further evaluated against reported contaminant
concentrations in a range vertebrate species where either chronic health effects (after long term
exposure to contaminants) or acute health effects (after short term exposure) have been
observed. Based on these assessments, the contaminants that were found in the turtle samples
were classified into three categories:
1. Contaminants were considered of “relatively low concern” if they were detected in the Boyne
River turtles at relatively low concentrations that were comparable to those reported for
most other sea turtles and vertebrates, including those considered healthy and originating
from relatively low impacted areas. At these levels, no associated adverse health effects have
been reported in the scientific literature for turtles or other vertebrate species.
Contaminants assigned to this category were: bioaccumulative pesticides, organotins, flame
retardants (polybrominated diphenyl ethers (PBDEs)), perfluorinated compounds
(perfluorooctane sulfonate (PFOS) and perfluorooctanoic acid (PFOA)), aluminium (Al), iron (Fe),
manganese (Mn), and zinc (Zn).
2. Contaminants were considered “possibly of concern” if they were present at concentrations
that were comparable to the upper ranges of those reported for other sea turtles and
vertebrates. Where relevant information was available, the contaminant levels in a
proportion of the Boyne River green turtles were found to be above the concentrations where
chronic effects occur in other vertebrates; i.e. long term exposure at these levels may result in
adverse health effects. In contrast, the levels in the turtles were lower than the
concentrations expected to result in adverse health effects after short term, acute exposure
to these compounds.

Investigation of contaminant levels in green turtles from Gladstone
4
Contaminants that fell within this category were: polychlorinated dibenzo-p-dioxins and
dibenzofurans (PCDD/Fs), dioxin-like polychlorinated biphenyls (PCBs), silver (Ag), copper (Cu),
chromium (Cr), molybdenum (Mo), and lead (Pb).
3. Contaminants were considered “of concern” if their concentrations were clearly higher
compared to most other green turtles and sea turtles, or within the upper levels reported
from animals that were moribund and/or originated from areas considered relatively
polluted. These contaminants were also present at higher levels compared to normal
concentrations known for other vertebrates from low impacted or unpolluted areas. In
particular, the measured concentrations in Boyne River turtles were found to be above or
near the concentrations where acute adverse health effects have been observed across
different vertebrate taxa. Although the sensitivity of sea turtles to these contaminants is
mostly unknown, this suggests that adverse health effects are possible in the Boyne River
estuary turtle population at the detected concentrations.
Contaminants that fell within this category were: arsenic (As), cadmium (Cd), cobalt (Co), mercury
(Hg), nickel (Ni), selenium (Se), and vanadium (V).
It should be noted that information on the sensitivity of green turtles to contaminants are limited.
For this study, as for other studies reported in the scientific literature, comparisons to other
vertebrates were required in most instances. There is, therefore, an uncertainty involved when
evaluating the effects that a particular concentration of contaminants may have on green turtles.
Considering these results, it is recommended to monitor the health and contaminant levels in
adult and juvenile green turtles from Gladstone as well as other, suitable control populations.
Investigation of contaminants with strong tendencies to biomagnify in marine biota should be
carried out across species of different trophic levels, and detailed speciation of metal/metalloids
should be considered to provide a better understanding on the risks associated with the
compounds of concern based on total metal/metalloid concentrations.

Investigation of contaminant levels in green turtles from Gladstone
5
TABLE OF CONTENTS
1.0 BACKGROUND ...................................................................................................... 12
1.1 Blood as exposure surrogate .......................................................................................... 12
2.0 OBJECTIVES AND SCOPE ........................................................................................ 14
3.0 METHODOLOGY .................................................................................................... 16
3.1 Sampling ......................................................................................................................... 16
3.2 Analyses .......................................................................................................................... 18
3.2.1 Description of tiered analysis approach ....................................................................................................... 18 3.2.2 Trace element analysis ................................................................................................................................. 19 3.2.3 Analysis for organotins ................................................................................................................................. 20
3.2.4 Analysis for bioaccumulative pesticides ....................................................................................................... 20 3.2.5 Analysis for polychlorinated dibenzo-p-dioxins (PCDDs), polychlorinated dibenzofurans (PCDFs) and
polychlorinated biphenyls (PCBs) .............................................................................................................. 21
3.2.6 Analysis for polybrominated diphenyl ethers (PBDEs) ................................................................................. 22 3.2.7 Analysis for perfluorinated compounds (PFCs) ............................................................................................ 22 3.2.8 Statistical analyses ....................................................................................................................................... 23
4.0 RESULTS................................................................................................................ 25
4.1 Turtle biometrics and health states ............................................................................... 25
4.2 Screening ........................................................................................................................ 25
4.2.1 Tier 1 - Qualitative (non-target) screening ................................................................................................... 25 4.2.2 Tier 2 – Quantitative (target) screening ....................................................................................................... 26 4.2.3 Tier 3 – Quantitative target analysis ............................................................................................................ 29
5.0 DISCUSSION .......................................................................................................... 34
5.1 Contaminant levels in relation to turtle biometrics, health and sampling location ...... 34
5.2 Contaminant exposure concentrations and risk evaluation .......................................... 35
5.2.1 Contaminants of relatively low concern ....................................................................................................... 36 5.2.2 Contaminants possibly of concern ............................................................................................................... 36 5.2.3 Contaminants of concern ............................................................................................................................. 37
5.3 Review - contaminants of concern ................................................................................. 38
5.3.1 Arsenic (As) .................................................................................................................................................. 38 5.3.2 Cadmium (Cd) ............................................................................................................................................... 42
5.3.3 Cobalt (Co) .................................................................................................................................................... 47 5.3.4 Mercury (Hg) ................................................................................................................................................ 50
5.3.5 Nickel (Ni) ..................................................................................................................................................... 55 5.3.6 Selenium (Se)................................................................................................................................................ 58
5.3.7 Silver (Ag) ..................................................................................................................................................... 62 5.3.8 Vanadium (V) ................................................................................................................................................ 65 5.3.9 Zinc (Zn) ........................................................................................................................................................ 68 5.3.10 Dioxins and PCBs .......................................................................................................................................... 71
6.0 CONCLUSIONS AND RECOMMENDATIONS ............................................................. 76
7.0 REFERENCES .......................................................................................................... 77
8.0 APPENDICES.......................................................................................................... 87

Investigation of contaminant levels in green turtles from Gladstone
6
8.1 Results for individual turtle samples .............................................................................. 87
8.2 Comparisons of contaminant concentrations in sea turtles .......................................... 94
8.2.1 Aluminium (Al) ............................................................................................................................................. 95 8.2.2 Arsenic (As) .................................................................................................................................................. 97 8.2.3 Cadmium (Cd) ............................................................................................................................................. 102
8.2.4 Chromium (Cr) ............................................................................................................................................ 110 8.2.5 Cobalt (Co) .................................................................................................................................................. 112 8.2.6 Copper (Cu) ................................................................................................................................................ 115 8.2.7 Iron (Fe) ...................................................................................................................................................... 121 8.2.8 Lead (Pb) .................................................................................................................................................... 125 8.2.9 Manganese (Mn) ........................................................................................................................................ 130 8.2.10 Mercury (Hg) .............................................................................................................................................. 134 8.2.11 Molybdenum (Mo) ..................................................................................................................................... 139 8.2.12 Nickel (Ni) ................................................................................................................................................... 141
8.2.13 Selenium (Se).............................................................................................................................................. 145 8.2.14 Silver (Ag) ................................................................................................................................................... 149 8.2.15 Vanadium (V) .............................................................................................................................................. 151 8.2.16 Zinc (Zn) ...................................................................................................................................................... 153 8.2.17 Dioxins ........................................................................................................................................................ 159

Investigation of contaminant levels in green turtles from Gladstone
7
LIST OF FIGURES
Figure 1 Three-tiered approach adopted for the present study to prioritise contaminant
analysis in live green turtles from Boyne River estuary, Gladstone. ............................14
Figure 2 Total Ion Count (TIC) GC-MS chromatogram of a green turtle liver pool (n=9). The
10 most abundant peaks (numbered) were identified based on the mass spectra
of each peak. .................................................................................................................26
Figure 3 Box and whisker plots for metal and metalloid concentrations (ppb ww) in blood
from individual (n=40) green turtles (Chelonia mydas) from Boyne River estuary
near Gladstone, Queensland. Box plots show the mean (red cross) and median
(red line), the 25th (bottom of box) and 75th (top of box) percentiles, and 1.5
times the inter quartile range (whiskers). ....................................................................33
Figure 4 Probabilistic distributions of body burden (ng kg-1 bw (x-axis)) in juvenile green
turtles from Gladstone; A) derived using mammalian TEFs and B) derived using
avian TEFs. The blue portion of the graph depicts the fraction of the juvenile
population at or above the LOAEL of A) 3 ng kg-1 bw for biochemical effects in
mammals (29%) and B) 9 ng kg-1 bw for developmental toxicity in chickens
(5.0%). ...........................................................................................................................74
LIST OF TABLES
Table 1 Sample information for green turtles (Chelonia mydas) from Boyne River estuary
near Gladstone, Queensland ........................................................................................17
Table 2 List of target contaminant groups and individual analytes quantified under Tier 2
and Tier 3 analysis; note: organotin concentrations are reported on the basis of
their organic forms as well as normalised to tin (Sn). ..................................................24
Table 3 Concentrations of perfluorinated compounds (PFOS/PFOA; ppb ww) in pooled
green turtle (Chelonia mydas) blood (n=40) from Boyne River estuary near
Gladstone, Queensland. Water content approximately 89%. ......................................27
Table 4 Concentrations of polychlorinated dibenzo-p-dioxins and dibenzofurans (PCDD/F;
ppt lw), WHO-PCBs (ppt lw) and indicator PCBs (ppt lw) in pooled green turtle
(Chelonia mydas) fat (n=9) from Boyne River estuary near Gladstone,
Queensland. Lipid content 1.7%. ..................................................................................27
Table 5 Concentrations of brominated flame retardants (PBDEs; ppb dw), organotins (ppb
dw), perfluorinated compounds (PFOS/PFOA; ppb dw) and bioaccumulative
pesticides (ppb dw) in pooled green turtle (Chelonia mydas) liver (n=9) from
Boyne River estuary near Gladstone, Queensland. Water content approximately
78%. ..............................................................................................................................28
Table 6 Summary (descriptive statistics) of concentrations of polychlorinated dibenzo-p-
dioxins and dibenzofurans (PCDD/F; ppt lw) and WHO-PCBs (ppt lw) in blood
from individual (n=22) green turtles (Chelonia mydas) from Boyne River estuary
near Gladstone, Queensland. .......................................................................................30

Investigation of contaminant levels in green turtles from Gladstone
8
Table 7 Summary (descriptive statistics) of concentrations of bioaccumulative pesticides
(ppb ww) and organotins (ppb ww) in blood from individual (n=7) green turtles
(Chelonia mydas) from Boyne River estuary near Gladstone, Queensland. ................31
Table 8 Summary (descriptive statistics) of concentrations of metals and metalloids (ppb
ww) in blood from individual (n=40) green turtles (Chelonia mydas) from Boyne
River estuary near Gladstone, Queensland. .................................................................32
Table 9 Summary (descriptive statistics) of concentrations of metals and metalloids (ppm
ww) in liver and kidney from individual (n=3) green turtles (Chelonia mydas)
from Boyne River estuary near Gladstone, Queensland. .............................................32
Table 10 Concentrations of polychlorinated dibenzo-p-dioxins and dibenzofurans (PCDD/Fs;
ppt lw) in individual (n=22) blood samples of green turtles (Chelonia mydas)
from Boyne River estuary near Gladstone, Queensland. .............................................88
Table 11 Concentrations of polychlorinated biphenyls (WHO-PCBs; ppt lw) in individual
(n=22) blood samples of green turtles (Chelonia mydas) from Boyne River
estuary near Gladstone, Queensland. ..........................................................................89
Table 12 Concentrations of organotins (ppb ww) in individual (n=7) blood samples of green
turtles (Chelonia mydas) from Boyne River estuary near Gladstone, Queensland. .....90
Table 13 Concentrations of bioaccumulative pesticides (ppb ww) in individual (n=7) blood
samples of green turtles (Chelonia mydas) from Boyne River estuary near
Gladstone, Queensland. ...............................................................................................91
Table 14 Concentrations of metals and metalloids (ppb ww) in individual (n=40) blood
samples of green turtles (Chelonia mydas) from Boyne River estuary near
Gladstone, Queensland. ...............................................................................................92
Table 15 Concentration of metals and metalloids (ppm ww) in liver and kidney of individual
(n=3) green turtles (Chelonia mydas) from Boyne River estuary near Gladstone,
Queensland. ..................................................................................................................93

Investigation of contaminant levels in green turtles from Gladstone
9
ABBREVIATIONS AND ACRONYMS
Ag Silver
Al Aluminium
As Arsenic
Bioaccumulation Uptake (from the environment or food) and net contaminant accumulation
over time (age) within an organism at a rate greater than that at which the
contaminant is lost
Biomagnification Increase of contaminant concentrations between successive trophic levels
via uptake from food; progressive build-up of contaminants by successive
trophic levels
Body condition A measure of health condition based on body mass in relation to CCL
Cd Cadmium
Co Cobalt
Cr Chromium
Cu Copper
DERM Queensland Department of Environment and Resource Management
Dioxin A group of 210 compounds, comprising polychlorinated dibenzo-p-dioxins
and dibenzofurans
dw Dry weight
Entox National Research Centre for Environmental Toxicology, The University of
Queensland
Eurofins Eurofins GfA Laboratory Service, Hamburg, Germany
Fe Iron
Hg Mercury
Indicator PCBs Six PCBs are commonly measured as indicators for the group of non dioxin-
like PCBs; non dioxin-like PCBs have a different toxic mechanism to dioxins
and accordingly are not assigned TEFs
Inorganic metals Metals combined with elements such as chlorine, sulfur, or oxygen
LD50 Lethal dose at which 50% of the study population died
Lipophilicity Affinity for lipids and organic matter
LOQ Limit of quantification
Lower bound Contaminants below the LOQ are not accounted for (i.e. concentration are
assumed to be zero)

Investigation of contaminant levels in green turtles from Gladstone
10
lw Lipid weight
Metalloid An element having both properties of a metal and non-metal
Microgram (µg) 10-6 grams
Middle bound Contaminants below the LOQ are assumed to be present at half the LOQ
concentration
Milligram (mg) 10-3 grams
Mn Manganese
Mo Molybdenum
Moribund In a state of dying or near death based on biological condition
NA Not available
Nanogram (ng) 10-9 grams
ND No data
Ni Nickel
Organic metals Metals combined with carbon
Pb Lead
PCBs Polychlorinated biphenyls
PCDD/Fs Polychlorinated dibenzo-p-dioxins and dibenzofurans, collectively also
referred to as dioxins
Pesticides A general term for a range of chemicals used as herbicides, insecticides,
fungicides or biocides
PFOS/PFOA The fluorosurfactants perfluorooctane sulfonate (PFOS); perfluorooctanoic
acid (PFOA)
Physico-chemical
properties
The properties of a particular chemical which describe their behaviour, e.g.
its stability, tendency to volatilise, affinity for organic carbon and lipids etc.
Picogram (pg) 10-12 grams
ppb Parts per billion (= µg/kg, µg/L, ng/g, ng/mL)
ppm Parts per million (= mg/kg, mg/L, µg/g, µg/mL)
ppt Parts per trillion (= ng/kg, ng/L, pg/g, pg/mL)
QHFSS Queensland Health and Forensic Scientific Services
Se Selenium
TEF Toxic Equivalency Factor; a relative measure of toxic potency of individual
dioxin and dioxin-like PCB congeners compared to the most toxic dioxin
(2,3,7,8-TCDD). In this report, TEFs adopted by WHO in 2005 have been
used.

Investigation of contaminant levels in green turtles from Gladstone
11
TEQ Toxic Equivalency based on toxic equivalency factors (TEFs) adopted by
WHO in 2005; a measure of the overall toxic potency of a dioxin mixture
TEQdf Toxic Equivalency (TEQ) for PCDD/Fs
TEQpcb Toxic Equivalency (TEQ) for PCBs
Upper bound Contaminants below the LOQ are assumed to be present at the LOQ
concentration
V Vanadium
WHO PCBs Dioxin-like PCBs, having the same toxic mechanism as dioxins. TEFs for
dioxin-like PCBs have been adopted by the World Health Organisation
(WHO)
ww Wet weight (or fresh weight)
Zn Zinc

Investigation of contaminant levels in green turtles from Gladstone
12
1.0 BACKGROUND
Since early 2011, Port Curtis has been experiencing higher than usual mortality rates of sea turtles,
with 260 reported strandings between 1 January 2011 and 28 February 2012 in the Gladstone region
from Rodds Bay Peninsula to Sandy Point north of Yeppoon, compared to 50-51 reported strandings
per year during 2008-2010 (DERM, 2012). There has also been an increase in the number of other
wildlife strandings, as well as outbreaks of diseases in fish in this region (DEEDI, 2011).
The mass turtle stranding event was attributed partly to the significant loss of seagrass beds, which
form important foraging habitats for resident populations of green turtles (DERM, 2012). The
summer of 2010-2011 witnessed unprecedented extensive flooding in the Gladstone Harbour region
as well as across much of Queensland, resulting in increased freshwater and sediment outflow and
subsequent reduced seagrass cover (Sankey et al., 2011). These events are compounded by the
large-scale industrial development in the Gladstone Harbour region. As a major port city along the
Queensland coast, Gladstone hosts a variety of industries, including mining and processing of
minerals, and liquefied natural gas, a large fishing industry, as well as agricultural activities within the
catchment. Since 20 May 2011, the city has been undergoing substantial development of its port
resources, including dredging and land reclamation (Gladstone Ports Corporation, 2011).
In response to the wildlife strandings, a Scientific Advisory Committee was formed at the request of
the Queensland Minister for the Environment, and recommended the investigation of the health
status of green turtles within the Gladstone Harbour. This investigation commenced with an on-site
survey and sample collection during 8-11 July 2011 by a team from Queensland Department of
Environment and Resource Management (DERM) and the School of Veterinary Sciences, The
University of Queensland. Clinical examination of 56 green turtles revealed that the juvenile turtle
population from this region were generally in poor health, due most likely to chronic malnutrition
(Eden et al., 2011). Diseases of the digestive, respiratory, and circulatory systems were found and, in
most cases, may have developed secondary to chronic debilitation. Spirorchiid fluke infection was
the most commonly identified infectious agent on complete necropsy of 10 green turtles, with other
infectious diseases diagnosed as fibropapillomatosis and bacterial gastroenteritis.
In parallel with the health assessment, a comprehensive contaminant exposure assessment was
conducted for blood of live captured green turtles. Of interest were a range of inorganic and organic
contaminants that may have been brought downstream from the catchment with flood waters or
have arisen from industrial activities.
1.1 BLOOD AS EXPOSURE SURROGATE
Blood has been demonstrated to be an appropriate matrix for assessing exposure to a broad range of
chemical groups, including both organic and inorganic compounds (Hermanussen et al., 2008; van de
Merwe et al., 2010). Blood provides a logistically feasible, ethical and nonlethal option for exposure
assessment of free ranging wildlife. Despite this, blood and tissue concentrations of contaminants
are dependent on a number of factors that need to be considered when interpreting analytical
results for exposure and risk assessment.
The contaminant’s physico-chemical properties and its speciated ion (molecular form) affect the
toxicokinetics (uptake, distribution, metabolism and excretion) in organisms. Persistent lipophilic

Investigation of contaminant levels in green turtles from Gladstone
13
contaminants are accumulated in body lipids, and their concentrations in blood, when normalised to
a lipid basis, are typically comparable to those in other tissues (Hermanussen, 2009; van de Merwe et
al., 2010). Thus, blood concentrations of persistent lipophilic contaminants can inform on tissue or
body burdens, and long-term exposure regimens. Many metals and metalloids exist as different
reduced and oxidised species, ranging from water-soluble ions to relatively lipophilic metalorganic
compounds. While the more water soluble ionic species are mostly circulated through the body via
the blood stream after absorption, they are often stored predominantly in the liver and kidney and
can be rapidly eliminated through faeces or urine. Therefore, blood analysis often provides a
snapshot of the most recent exposure to most metals and metalloids (in the order of days to months,
depending on the element and speciation), while storage tissues can inform on longer term exposure
regimens. Understanding of toxicokinetics of individual metals is thus particularly important for
interpreting blood concentrations of metals (Grillitsch and Schiesari, 2010). At constant exposure, the
concentrations of such contaminants in blood and organs are often correlated, with blood containing
considerably lower levels, except during initial phases of high-level exposure (Grillitsch and Schiesari,
2010). However, changes in exposure will be reflected rapidly in blood, with the levels depending on
time of exposure relative to time of sampling (Day et al., 2010).
An organism’s trophic level, age, and breeding status can considerably affect the distribution and
levels of many contaminants in tissues and blood. Concentrations of chemicals that are only poorly
metabolised typically (at constant exposure) increase with age (bioaccumulation) until a steady state
is reached where their rate of uptake is equal to the rate of metabolism or transformation. Such
chemicals may accumulate over time to levels that may be harmful, even at relatively low exposure
regimens (van den Berg et al., 2006). Some of these compounds also have strong tendencies to
biomagnify through the food chain, whereby the highest trophic levels contain the highest
concentrations. However, low trophic benthic feeders, such as green turtles, may take in substantial
amounts of such contaminants sorbed to seagrasses or sediments (Hermanussen, 2009).
Health and nutritional states are additional factors that may affect the toxicokinetics of contaminants
in organisms (Eisler, 2007). Nutrient deficient states and declining health of organisms can disturb
contaminant equilibria through mobilisation of lipid stores and associated chemicals, and may
influence the metabolic capacity of liver and kidneys, thus affecting storage, detoxification and
elimination pathways. This is particularly relevant for the present study, which focused on an area
where a large proportion of green turtles were found to be near or at emaciated states.

Investigation of contaminant levels in green turtles from Gladstone
14
2.0 OBJECTIVES AND SCOPE
The present study focused on assessing contaminants in live green turtles collected from the Boyne
River estuary, Gladstone, using mainly blood as anexposure surrogate. The objectives were:
To quantify a range of contaminant groups that are known to bioaccumulate in marine wildlife
and may present a hazard to green turtles in Gladstone
To evaluate whether detected contaminant concentrations in green turtles from Gladstone are
elevated and may present a risk to the turtle population.
Analysis was carried out using a tiered approach (Figure 1) whereby pooled samples were initially
screened for the presence of relatively high levels of nonpolar organic chemicals, in order to identify
contaminant groups that should be covered. In a second tier, pooled samples were analysed for a
broad range of known and potentially hazardous bioaccumulative pollutants to direct further
prioritisation. Based on information from these screenings, individual samples were analysed in the
third tier for compounds that may be elevated and/or have relatively high toxic potency.
Figure 1 Three-tiered approach adopted for the present study to prioritise contaminant analysis in
live green turtles from Boyne River estuary, Gladstone.
To evaluate whether contaminants detected in the green turtle samples are elevated, a literature
review was carried out to compare concentrations with those reported for other green turtles, and
where necessary due to a lack of data for green turtles, other sea turtles, marine biota or reptiles,
birds and mammals in general.
To evaluate whether contaminants present at elevated levels may present a risk to green turtles,
reptile specific toxicological studies were reviewed and, where insufficient information was available,
contaminant concentrations in green turtles from Gladstone were compared to effect concentrations
across a range of vertebrate taxa. Where possible, green turtle contaminant body burdens were
estimated using probabilistic approaches and compared to body burdens that elicit physiological
Pooled tissueTier 1:
Non-target screen
Tier 2: Target screen
Tier 3: Target analysis
Pooled tissue and blood
Blood from individuals
Identify possible presence of contaminant groups at high levels
Initial information on type and level of contaminants present for further prioritisation and sample
volume adjustment
Quantification of prioritised contaminants, based on results of Tiers 1-2, and taking into account
chemical hazardTissue from
matched individuals

Investigation of contaminant levels in green turtles from Gladstone
15
effects in a dose-dependent manner, to estimate the proportion of green turtles that may be at risk
of adverse effects. Where such approaches were not feasible, contaminant levels in green turtles
were compared with available tissue based effect concentrations to identify whether adverse effects
may be possible at the determined exposure levels.

Investigation of contaminant levels in green turtles from Gladstone
16
3.0 METHODOLOGY
3.1 SAMPLING
Green turtles (Chelonia mydas) were collected from the Boyne River estuary near Gladstone (-23.9
°S, 151.3 °E) during 8-11 July 2011. This population is characterised by turtles in poor health and
associated elevated incidence of mortality. The samples were collected using best practice Australian
standard procedures developed by DERM, and were stored at The University of Queensland School
of Veterinary Science and Entox.
For contaminant analysis, blood samples were collected from 40 live green turtles (Table 1). The
animals were collected while basking on land (n=31) or captured using a rodeo technique (n=9)
described in Limpus (1978). All specimens underwent assessment as described in Limpus et al. (1994)
including measurements of size (curved carapace length, CCL) and body weight, as well as
determination of age class (new recruit, juvenile, sub-adult or adult), gender and body condition, the
latter informing on body mass for a given CCL (according to Limpus and Chalaupka (1997)).
For contaminant analysis, 13-24 mL blood, depending on the individual’s size and body condition and
up to a maximum of 4% body weight, was collected from each turtle. Blood samples were taken from
the dorso-cervical sinus using an 18 gauge 38 mm needle and 10-25 mL syringe. Whole blood was
transferred to solvent-washed Schott bottles, with Teflon lined caps, containing 1.5 mL of
heparinised saline (50 international units (IU)), and stored at -20°C until analysis.
Three of the animals were severely emaciated and moribund, with poor clinical diagnosis for survival;
these were euthanized (by intravenous injection of sodium pentobarbitone (325 mg/mL)) by a
registered veterinarian and necropsied at The University of Queensland’s School of Veterinary
Science. Necropsies included gross pathology and histopathology examinations, and the results are
reported in Eden et al (2011). Blood, liver, kidney and fat samples were collected from these three
specimens (Table 1).
Additional stranded animals were collected by Queensland Parks and Wildlife Service staff and
underwent necropsy at the School of Veterinary Science, The University of Queensland, as described
above. Liver and fat tissues were collected from six additional specimens and pooled, together with
liver and fat from euthanized specimens described above, for analyses (n=9). Tissues were wrapped
in aluminium foil and stored frozen at -20°C until analysis.

Investigation of contaminant levels in green turtles from Gladstone
17
Table 1 Sample information for green turtles (Chelonia mydas) from Boyne River estuary near
Gladstone, Queensland
Lat. Long.
2 8/07/2011 -23.92641 151.355 Female 48 8.6 0.14 42 Very poor -
3 8/07/2011 -23.9267 151.3542 Male 47 8.7 0.22 26 Very poor -
22 9/07/2011 -23.92739 151.3549 Female 42 6.9 0.09 26 Very poor -
7 8/07/2011 -23.9283 151.3538 Male 39 5.4 0.06 87 Very poor -
8 8/07/2011 -23.9267 151.3544 Female 43 8.2 ND - Normal -
9 8/07/2011 -23.92835 151.3544 Male 44 8.0 0.20 29 Poor -
10 8/07/2011 -23.92621 151.355 Female 43 7.8 ND 68 Injured -
11 8/07/2011 -23.92789 151.3534 Male 45 9.4 ND 27 Normal -
13 9/07/2011 -23.92825 151.3548 Male 45 10 0.12 23 Normal -
14 8/07/2011 -23.92837 151.3542 Male 44 8.3 ND 38 Poor -
15 8/07/2011 -23.92729 151.3542 Male 46 9.5 ND 34 Poor -
20 9/07/2011 -23.92811 151.3552 Male 43 8.7 0.11 15 Poor -
21 9/07/2011 -23.94009 151.3531 Male 47 9.8 ND 7 Normal -
23 9/07/2011 -23.92581 151.3552 Male 42 7.9 ND 22 Normal -
24 9/07/2011 -23.92752 151.3544 Male 45 9.3 ND 59 Poor -
25 9/07/2011 -23.92802 151.354 Unknown 47 9.3 0.23 30 Very poor C3
26 9/07/2011 -23.92802 151.354 Male 49 10 ND 27 Poor -
30 10/07/2011 -23.92798 151.3535 Female 60 22 0.13 21 Poor B1
31 10/07/2011 -23.92792 151.3535 Female 47 8.6 ND - Poor -
32 10/07/2011 -23.92798 151.3535 Male 62 25 0.20 - Normal -
33 10/07/2011 -23.93218 151.3568 Female 45 10 ND 2 Normal -
34 10/07/2011 -23.93072 151.3571 Male 47 10 0.07 33 Poor -
35 10/07/2011 -23.93047 151.3572 Female 45 8.4 ND 2 Poor -
37 10/07/2011 -23.93132 151.3572 Male 48 12 ND 10 Normal B2
38 11/07/2011 -23.92681 151.3572 Female 52 15 0.15 - Normal -
39 10/07/2011 -23.94009 151.3531 Male 43 8.1 ND - Poor -
40 11/07/2011 -23.92823 151.3543 Female 45 8.6 ND 23 Poor -
41 11/07/2011 -23.93501 151.3566 Female 52 15 0.18 10 Normal -
42 11/07/2011 -23.9337 151.3562 Unknown 47 8.8 0.23 66 Very poor -
43 11/07/2011 -23.93316 151.3601 Male 44 9.7 0.11 - Normal -
44 11/07/2011 -23.93346 151.3564 Female 44 8.3 ND - Poor -
45 11/07/2011 -23.93188 151.3564 Female 44 9.2 0.17 35 Normal -
46 11/07/2011 -23.9317 151.3561 Unknown 45 8.8 0.17 1 Very poor -
47 11/07/2011 -23.93307 151.3564 Female 48 8.8 0.14 - Poor -
48 11/07/2011 -23.93108 151.3569 Male 53 15 0.11 - Normal -
49 11/07/2011 -23.93057 151.3567 Male 46 10 ND - Normal -
50 11/07/2011 -23.93158 151.3567 Female 43 8.0 0.12 22 Normal -
51 11/07/2011 -23.93078 151.3566 Female 46 9.8 ND - Normal A1
53 11/07/2011 -23.9338 151.3564 Female 48 13 0.090 1 Normal B3
36 10/07/2011 -23.92798 151.3535 Unknown 100 86 0.15 14 Very poor -
LocationSex
CCL
(cm)FP*
Body
condition
Barnicle
count
Lipid
(%)
Weight
(kg)
Juveniles that were euthanised and necropsied (blood, liver and kidney samples)
Live captured juveniles (blood samples)
EX
ID
Sampling
Date
Live captured adult (blood samples)
ND No data
FP* Fibropapilloma codes according to DERM classifications

Investigation of contaminant levels in green turtles from Gladstone
18
3.2 ANALYSES
3.2.1 Description of tiered analysis approach
TIER 1 - QUALITATIVE (NON-TARGET) SCREENING
This analysis was undertaken as a non-target-screening for the purpose of identifying the presence of
possible contaminants at high levels, to inform subsequent Tiers 2 and 3 (Figure 1). Analysis was
carried out on a high resolution gas chromatograph low resolution mass spectrometer at Eurofins
GfA.
One gram of liver was pooled from stranded and euthanized specimens that underwent necropsy
(n=9, including the three specimens EX2, 3, and 22 for which blood samples were also available;
Table 1). Approximately 0.5 g homogenised sample was extracted with n-hexane using
ultrasonication. The raw extract was then directly used for injection on an Agilent 6890/5973 GC-MS
system using a non-polar DB5-type capillary column. An electron ionisation mode was used to scan a
mass range of m/z 50-600. For evaluation, the 10 most abundant peaks were baseline subtracted and
evaluated with the assistance of spectra libraries (Wiley 75K; NIST) by manual spectra interpretation
and judgement for presence of artefacts or contaminants from the process.
TIER 2 - QUANTITATIVE (TARGET) SCREENING
Tier 2 screening comprised target chemical analysis using pooled samples of blood, liver and fat to
provide initial information on the type and levels of contaminants to be expected, and thus
estimation of minimum sample volume required for each contaminant group, as well as further
prioritisation for Tier 3 analysis (Figure 1).
For blood pools, 1 mL blood was sub-sampled and combined from each specimen (n=40). Liver and
fat pools comprised of 1 g tissue, respectively, from each necropsied specimen (n=9). These pools
underwent quantitative analyses for a set of contaminants listed in Table 2, except for metals and
metalloids (which were analysed for each sample under Tier 3).
Pooled turtle fat was analysed for polychlorinated dibenzo-p-dioxins (PCDDs), polychlorinated
dibenzofurans (PCDFs), dioxin-like polychlorinated biphenyls (WHO-PCBs) and a set of 7 indicator
PCBs listed in Table 2. Pooled turtle liver was analysed for organotins, polybrominated flame
retardants (PBDEs), bioaccumulative pesticides and perfluorinated compounds. Pooled turtle blood
was analysed for perfluorinated compounds. These analyses were carried out at an accredited
laboratory according to standardised protocols which are described briefly below.
TIER 3 - QUANTITATIVE TARGET ANALYSIS
In the third tier, blood samples from individual turtles underwent quantitative target analyses for
selected contaminant groups as prioritised based on the two screening Tiers (i.e. based on
contaminant type and expected concentrations, taking into account toxic potency) (Figure 1). In
addition to blood, liver and kidney from euthanized specimens (n=3) were analysed for individual
compound groups to evaluate tissue distributions and facilitate comparisons to literature data.

Investigation of contaminant levels in green turtles from Gladstone
19
Individual blood samples were analysed for metals and metalloids (n=40), organotins (n=7), WHO-
PCBs (n=22), PCDDs and PCDFs (n=22), and bioaccumulative pesticides (n=7). These analyses were
carried out and evaluated on a batch-by-batch approach. Where Tier 1, 2 and 3 confirmed the
presence of low levels, the limited volume for blood samples was prioritised for other analytes.
Hence, a varying number of samples have been analysed for the different contaminant groups.
Individual analytes for each of these groups are listed in Table 2, and a brief description on the
analytical methods, and associated quality assurance and quality control procedures are provided
below.
Analysis for organic compounds were performed at Eurofins GfA in Hamburg, Germany, which is
accredited for the determination of PCDD/F, PCB, chlorinated pesticides, PBDE and polyfluorinated
compounds (PFC) in biological material in accordance with DIN EN ISO/IEC 17025:2005. Analysis for
metals and metalloids was undertaken at the National Research Centre for Environmental Toxicology
(Entox) according to standardised protocols.
3.2.2 Trace element analysis
Analysis for the trace elements Al, As, Cd, Cr, Co, Cu, Fe, Pb, Mn, Hg, Mo, Ni, Se, Ag, V, and Zn was
undertaken using inductively coupled plasma mass spectrometry (ICP-MS).
Samples were prepared according to in-house standardised protocols. Briefly, a subsample of 0.5 mL
of whole blood was diluted to 10 mL with high purity MilliQ water (Millipore, Australia), and then
vortex mixed and centrifuged to remove precipitate. Liver and kidney samples were freeze-dried and
homogenised using a mortar and pestle. As tissue samples were stored in aluminium foil, the outer
tissue was removed; nevertheless, cross-contamination with aluminium cannot be excluded. Aliquots
of approximately 0.10 g homogenised tissue was then transferred into Teflon vessels and mixed with
1 mL of concentrated nitric acid (HNO3; 70% AR grade, BioLab (Aust) Pty Ltd). Tissue samples were
then digested in a water bath at 60-70 °C for 4 to 6 hours until the solution was clear. After cooling
down to room temperature, digested solutions were diluted (x50) with MilliQ water and filtered
through 0.45 m filters prior to analysis.
Blood and tissue solutions were then spiked with an internal standard solution containing the
elements Ge, Rh, Sc, Y, In and Bi (Agilent) to a final concentration in the samples equivalent to 10
g/L. Analysis and quantification was performed using an Agilent 7500CS ICP-MS equipped with a
quartz torch, and a quartz double-pass spray chamber fitted with a Micro Flow nebulizer.
Quantification was performed using the relative response of each trace metal to internal standards
against an external 5-point calibration curve.
For quality assurance and quality control, duplicates, reagent blanks, blank spikes, analytical spikes
were run with each batch of samples. Certified reference materials were analysed with each batch of
samples to ensure accuracy; these included DORM-3 fish protein standard reference material
(National Research Council, Canada), an in-house certified reference material (human blood
reference material provided by Queensland Health and Forensic Scientific Services) and Seronorm L-1
and L-2 whole blood trace elements (SERO, Norway). The limit of quantification (LOQ) for each
element was defined as three times the standard deviation of blank replicates (n=10) expressed in
g/L. The LOQs for each element in blood and tissue samples ranged from 0.11 (As) to 5.76 (Fe) and

Investigation of contaminant levels in green turtles from Gladstone
20
0.020 (Cr) to 22 (Fe) µg/L, respectively. Recovery was calculated using a triplicate analysis of certified
reference material DORM 3 (for tissue samples) and were generally between 70% and 130%, which is
considered acceptable for this analysis.
3.2.3 Analysis for organotins
The organotin compounds monobutyltin (MBT), dibutyltin (DBT), tributyltin (TBT), tetrabutyltin
(TTBT), monooctyltin (MOT), dioctyltin (DOT), triphenyltin (TPhT), tricyclohexyltin (TCHT) were
analysed using high resolution gas chromatography low resolution mass spectrometry (HRGC-LRMS).
Prior to extraction, all samples were spiked with internal standard substances
(monoheptyltintrichloride, diheptyltindichloride, tripropyltinchloride, tetrapropyltin). The samples
were homogenized, mixed and conditioned over night with methanol and trimethyl
ammoniumhydroxid, then buffered with an acetic acid/acetate buffer and extracted and
simultaneously derivatized with hexane and sodium tetraethylborate. The hexane phase was used
for clean-up by column chromatography on alumina, deactivated with 10% water and eluted with
hexane. The cleaned extract was evaporated and tetrapentyltin was added as injection standard for
the determination of recovery rates.
Analytical measurement was performed on an Agilent 6890/5973 HRGC-LRMS system with a DB-XLB
fused silica column. Quantification of the organotin compounds was carried out via the internal
standard method and based on daily instrument calibration.
For quality control, method blanks were run with each sample batch to monitor for possible
background contamination. Reference materials (pooled samples) are regularly monitored and the
laboratory participates in respective interlaboratory comparisons (e.g. QUASIMEME).
3.2.4 Analysis for bioaccumulative pesticides
Target analytes for pesticides were o,p'-DDT, p,p'-DDT, α-HCH, β-HCH, γ-HCH (lindane), δ-HCH; three
main toxaphene compounds (Parlar #26, #50 and #62), α-chlordane, γ-chlordane, oxychlordane,
heptachlor, cis-heptachlor epoxide, trans-heptachlor epoxide, aldrin, dieldrin, endrin, α-endosulfan,
β-endosulfan, endosulfan sulfate, mirex, hexachlorobenzene (HCB) and pentachlorobenzene. The
analysis was carried out by high resolution gas chromatography high resolution liquid mass
spectrometry (HRGC-HRMS), and high resolution gas chromatography tandem mass spectrometry
(HRGC-MS-MS).
Tissue samples were homogenized, mixed with sodium sulphate to create a free flowing mixture,
after which ultrasonic extraction was carried out with a mixture of n-hexane/acetone. Blood samples
were extracted by a specialised liquid-liquid extraction with n-hexane, followed by n-hexane/i-
propanol. All samples were spiked with quantification standards (internal standards) before
extraction using the following 13C-labeled compounds: β-HCH, γ-HCH, p,p'-DDT, p,p'-DDE,
pentachlorobenzene, hexachlorobenzene, endosulfan sulfate, β-endosulfan, dieldrin.
Clean-up was performed by column chromatography applying a combination of columns with basic
alumina and Florisil. Hexane was used for elution of the main fraction and toluene for a second
fraction for endosulfan compounds which underwent an additional clean-up step using
acetonitrile:hexane partitioning. The fractions were evaporated and 13C-PCB #105 was added as

Investigation of contaminant levels in green turtles from Gladstone
21
injection standard for the analytes of the first fraction and 13C-PCB #28 for the analytes of the second
fraction. Analyses for compounds of the first fraction was performed by HRGC/HRMS on a Thermo
DFS at mass resolution R ≥ 8,000 on a DB5-type fused silica column (60m x 0.25 mm i.d. x 0.25 µm
dF). Endosulfan compounds were determined on an Agilent 7000 triple quadropole HRGC-MS-MS.
Quantification was carried out by isotope dilution and internal standard methods against daily
calibration points, together with a multipoint calibration.
For quality control, method blanks were run with each sample batch to monitor for possible
background contamination. Reference materials (pooled samples) are regularly monitored and the
laboratory participates in respective interlaboratory comparisons (e.g. AMAP).
3.2.5 Analysis for polychlorinated dibenzo -p-dioxins (PCDDs),
polychlorinated dibenzofurans (PCDFs) and polychlorinated
biphenyls (PCBs)
Target analytes were the 17 2,3,7,8-substituted PCDD/Fs and the 12 dioxin-like PCBs (WHO-PCBs;
PCB #77, 81, 105, 114, 118, 123, 126, 156, 157, 167, 169, 189). Analyses were carried out using a high
resolution gas chromatograph high resolution mass spectrometer (HRGC-HRMS).
Tissue samples were homogenised, mixed with sodium sulphate to create a free flowing mixture
after which ultrasonic extraction was carried out with a mixture of n-hexane/acetone. Blood samples
were extracted by a specialised liquid-liquid extraction with n-hexane followed by n-hexane/i-
propanol. All samples were spiked with quantification standards (internal standards) prior to
extraction using all PCDD/F and PCB analytes as 13C-labeled compounds (exception: 1,2,3,7,8,9-
HexaCDD). The obtained raw extract was gently evaporated for fat determination and the yielded
lipids were used for clean-up.
The clean-up consisted of a sulfuric acid treatment and a fractionation on active carbon for
separation of PCDD/Fs and PCBs. This was followed by column chromatography with a combination
of columns using silica modified with sulfuric acid, basic alumina (activity super I) and florisil. Elution
was carried out with hexane, toluene and dichloromethane. The fractions were evaporated and a set
of four 13C-PCDD/Fs and four 13C-PCBs were added as injection standards. Analytical measurement
was performed by HRGC/HRMS on a Waters Autospec HRMS at mass resolution R ≥ 10,000 equipped
with a DB5ms-type fused silica column (60m x 0.32mm i.d. x 0.25µm dF). Quantification was carried
out by isotope dilution against daily calibration points together with a multipoint calibration.
For quality control, method blanks were run with each sample batch to monitor for possible
background contamination. Reference materials (pooled samples) are regularly monitored and the
laboratory participates in respective interlaboratory comparisons (e.g. Norway/ Norwegian Institute
of Public Health).
Analytes were accepted for quantification if their retention times were within 2 seconds of the
retention times of the relevant labelled internal standards and the ratios for the area of the two most
abundant isotopes were within 20% of their calculated values. The limit of quantification for PCDD/F
and PCB congeners was defined as a signal–to-noise ratio greater than 3 times the average baseline
variation. Analytes were marked with ‘<’ when the sample concentration did not exceed 3 times the
concentration found in the batch blank. Toxic equivalencies (TEQs) were calculated using mammalian

Investigation of contaminant levels in green turtles from Gladstone
22
toxic equivalency factors (TEFs) adopted by the World Health Organisation (van den Berg et al.,
2006), unless otherwise stated, and are reported using middle bound concentrations (i.e. half the
concentration of the limit of quantification (LOQ) or values marked with a “<”), unless otherwise
stated.
3.2.6 Analysis for polybrominated diphenyl ethers (PBDEs)
Target analytes for PBDEs were the congeners #17, 28, 47, 49, 66, 71, 77, 85, 99, 100, 119, 126, 138,
153, 154, 156, 183, 184, 191, 196, 197, 206, 207, 209. The analyses were carried out using high
resolution gas chromatography tandem mass spectrometry (HRGC-MS-MS).
Tissue samples were homogenised, mixed with sodium sulphate to create a free flowing mixture
after which ultrasonic extraction was carried with a mixture of n-hexane/acetone. Blood samples
were extracted by a specialised liquid-liquid extraction with n-hexane followed by n-hexane/i-
propanol. All samples were spiked with isotope-labelled quantification standards prior to extraction
using the six 13C12-PBDEs #28, 47, 99, 153, 154, 183 and 209. The obtained raw extract was gently
evaporated and the yielded lipids were used for clean-up. The clean-up consisted of a sulfuric acid
treatment followed by column chromatography and fractionation on alumina, preconditioned with
hexane and toluene, and eluted with dichloromethane. The eluate was evaporated and 13C-HexaBDE
#138 was added as injection standard. Analytical measurement was performed by HRGC/MS-MS on
an Agilent 7000 with a Restek RTX1614 column (15m x 0.25 mm i.d. x 0.1 µm dF). Quantification was
carried out by isotope dilution against daily calibration points together with a multipoint calibration.
For quality control, method blanks were run with each sample batch to monitor for possible
background contamination. Reference materials (pooled samples) are regularly monitored and the
laboratory participates in respective interlaboratory comparisons (e.g. Norwegian Institute of Public
Health and QUASIMEME).
3.2.7 Analysis for perfluorinated compounds (PFCs)
Target analytes for PFCs were perfluorooctanoic acid (PFOA) and perfluorooctane sulfonate (PFOS).
The analyses were carried out using high performance liquid chromatography tandem mass
spectrometry (HPLC-MS-MS).
The whole blood sample was homogenized and extracted using acetonitrile with ultrasonic
extraction. The tissue sample was homogenized, mixed with sodium sulphate and extracted with
acetonitrile. All samples were spiked with quantification standards (internal standards) before
extraction using 13C-labeled C8-PFOA and C4-PFOS.
Clean-up was performed by acetonitrile-hexane distribution and interference adsorption on
activated carbon (Envicarb). After removal from the carbon the extract was evaporated, dissolved in
methanol and 13C4-PFOA was added as injection standard for monitoring of the quantification
standard recoveries. Analytical measurement was performed on an Agilent Triple Quad 6460 LC-MS-
MS system equipped with a 100 x 2mm Phenomenex Synergi 4u Fusion RP80A column. Mobile phase
was methanol (0.05% acetic acid) and reagent water (2 mmol ammonium acetate), run with a
gradient programme. Quantification was carried out by isotope dilution against multiple daily
calibration points together with a multipoint calibration.

Investigation of contaminant levels in green turtles from Gladstone
23
For quality control, method blanks were run with each sample batch to monitor for possible
background contamination. Reference materials (pooled samples) are regularly monitored and the
laboratory participates in respective interlaboratory comparisons (e.g. University of Erlangen).
3.2.8 Statistical analyses
All statistical analyses were performed using XLSTAT Version 2012.2.01. Descriptive statistics (mean,
maximum, minimum, standard error, percentiles and median) were determined for analytes and
analyte groups, and are provided as box and whisker plots for metals and metalloids. A box plot
combines multiple information that can be obtained from a group of data points. Box plots used in
this report show the mean (red cross) and median (red line). The box represents the 25th (bottom)
and 75th (top) percentiles and whiskers represent 1.5 times the inter quartile range (i.e. the
difference between the 75th and 25th percentiles). All individual data points are also provided on
these plots.
Nonparametric one-way analysis of variance was performed using the Kruskal Wallis test to evaluate
statistically significant (p<0.05) differences of contaminant concentrations between turtles with very
poor, poor and normal body conditions.
Correlations between % lipid, turtle weight, turtle size (CCL) and contaminant concentrations were
tested using Pearson correlation coefficient with significance determined at p<0.05.

Investigation of contaminant levels in green turtles from Gladstone
24
Table 2 List of target contaminant groups and individual analytes quantified under Tier 2 and Tier 3
analysis; note: organotin concentrations are reported on the basis of their organic forms as well as
normalised to tin (Sn).
Aluminium Al 2,2',4-TriBDE BDE 17
Arsenic As 3,3',4,4'-TCB PCB 77 2,4,4'-TriBDE BDE 28
Cadmium Cd 3,4,4',5-TCB PCB 81 Total TriBDE
Chromium Cr 3,3',4,4',5-PeCB PCB 126 2,2',4,4'-TBDE BDE 47
Cobalt Co 3,3',4,4',5,5'-HxCB PCB 169 2,2',4,5'-TBDE BDE 49
Copper Cu 2,3',4,4'-TBDE BDE 66
Iron Fe 2,3,3',4,4'-PeCB PCB 105 2,3',4',6-TBDE BDE 71
Lead Pb 2,3,4,4',5-PeCB PCB 114 3,3',4,4'-TBDE BDE 77
Manganese Mn 2,3',4,4',5-PeCB PCB 118 Total TBDE
Mercury Hg 2',3,4,4',5-PeCB PCB 123 2,2',3,4,4'-PeBDE BDE 85
Molybdenum Mo 2,3,3',4,4',5-HxCB PCB 156 2,2',4,4',5-PeBDE BDE 99
Nickel Ni 2,3,3',4,4',5'-HxCB PCB 157 2,2',4,4',6-PeBDE BDE 100
Selenium Se 2,3',4,4',5,5'-HxCB PCB 167 2,3',4,4',6-PeBDE BDE 119
Silver Ag 2,3,3',4,4',5,5'-HpCB PCB 189 3,3',4,4',5-PeBDE BDE 126
Vanadium V TEQ Total PeBDE
Zinc Zn 2,2',3,4,4',5'-HxBDE BDE 138
2,2',4,4',5,5'-HxBDE BDE 153
2,4,4'-TriCB PCB 28 2,2',4,4',5,6'-HxBDE BDE 154
2,3,7,8-TCDD D4 2,2',5,5'-TCB PCB 52 2,3,3',4,4',5-HxBDE BDE 156
Total TCDDs 2,2',4,5,5'-PeCB PCB 101 Total HxBDE
1,2,3,7,8-PeCDD D5 2,3',4,4',5-PeCB PCB 118 2,2',3',4,4',5,6'-HpBDE BDE 183
Total PeCDDs 2,2',3,4,4',5'-HxCB PCB 138 2,2',3,4,4',6,6'-HpBDE BDE 184
1,2,3,4,7,8-HxCDD D6-1 2,2',4,4',5,5'-HxCB PCB 153 2,3,3',4,4',5',6-HpBDE BDE 191
1,2,3,6,7,8-HxCDD D6-2 2,2',3,4,4',5,5'-HxCB PCB 180 Total HpBDE
1,2,3,7,8,9-HxCDD D6-3 2,2',3,4,4',5,5',6-OctaBDE BDE 196
Total HxCDDs 2,2',3,3',4,4',6,6'-OctaBDE BDE 197
1,2,3,4,6,7,8-HpCDD D7 Aldrin Total OctaBDE
Total HpCDDs α-chlordane 2,2',3,3',4,4',5,5',6-NonaBDE BDE 206
OCDD D8 γ-chlordane 2,2',3,3'4,4',5,6,6'-NonaBDE BDE 207
Total PCDDs and TEQ o,p-DDT Total NonaBDE
p,p'-DDT DecaBDE BDE 209
Dieldrin
2,3,7,8-TCDF F4 α-endosulfan
Total TCDFs β-endosulfan Monobutyltin MBT
1,2,3,7,8-PeCDF F5-1 Endosulfan sulphate Monobutyltin-Sn MBT-Sn
2,3,4,7,8-PeCDF F5-2 Endrin Dibutyltin DBT
Total PeCDFs α-HCH Dibutyltin-Sn DBT-Sn
1,2,3,4,7,8-HxCDF F6-1 β-HCH Tributyltin TBT
1,2,3,6,7,8-HxCDF F6-2 γ-HCH Tributyltin-Sn TBT-Sn
1,2,3,7,8,9-HxCDF F6-3 Heptachlor Tetrabutyltin TTBT
2,3,4,6,7,8-HxCDF F6-4 cis -heptachlor epoxide Tetrabutyltin-Sn TTBT-Sn
Total HxCDFs trans -heptachlor epoxide Monooctyltin MOT
1,2,3,4,6,7,8-HpCDF F7-1 Hexachlorobenzene Monooctyltin-Sn MOT-Sn
1,2,3,4,7,8,9-HpCDF F7-2 Mirex Dioctyltin DOT
Total HpCDFs Octachlorostyrene Dioctyltin-Sn DOT-Sn
OCDF F8 Oxychlordane Triphenyltin TPhT
Total PCDFs and TEQ Pentachlorobenzene Triphenyltin-Sn TPhT-Sn
Toxaphene 26 Parlar 26 Tricyclohexyltin TCHT
PFCs Toxaphene 50 Parlar 50 Tricyclohexyltin-Sn TCHT-Sn
Perfluorooctane sulfonate PFOS Toxaphene 62 Parlar 62
Perfluorooctanoic acid PFOA
PCDFs
Organotins
PBDEs
Non-ortho
Mono-ortho
Metals and Metalloids WHO-PCBs
PCDDs
Indicator PCBs
Bioaccumulative Pesticides

Investigation of contaminant levels in green turtles from Gladstone
25
4.0 RESULTS
4.1 TURTLE BIOMETRICS AND HEALTH STATES
Among the forty green turtles sampled for this study, 39 were in their juvenile, neretic life stage
(average CCL 46; range 39-62 cm); the remaining specimen was an adult of unknown gender (CCL 100
cm) (Table 1). A large proportion of the animals (55%; n=22) were evaluated to have poor (35%;
n=14) or very poor (20%; n=8) body conditions, with the latter showing signs of emaciation; three of
these specimens were considered to have no chance of survival and were euthanized by a registered
veterinarian (Table 1). The remaining 18 animals (45%) appeared to have normal body conditions.
Accordingly, body weight was significantly (p<0.05) lower in green turtles with very poor (average
8.1; range 5.4-9.3 kg) and poor (average 9.8; range 8.0-22 kg), compared to normal (average 11;
range 7.8-25 kg) body conditions; curved carapace length (CCL) did not differ significantly between
these three groups. Despite this, no significant differences were observed for blood lipid content
between animals with normal (0.14 ±0.038; range 0.087-0.20%; n=9), poor (0.13 ±0.047; range 0.070-
0.20%; n=5) or very poor (0.16 ±0.064; range 0.062-0.23%; n=8) body conditions. This suggests that
the blood lipids consisted mainly of fats not used for storage (e.g. lipoproteins, cholesterol).
4.2 SCREENING
4.2.1 Tier 1 - Qualitative (non-target) screening
Figure 2 shows all signals obtained in the total ion count for the liver pool. No signals were identified
that could be traced to halogenated compounds or other common environmental pollutants. Using
the mass spectra, the most abundant peak was identified as the barbiturate pentobarbital (1), which
originates from the use of pentobarbitone to euthanize specimens included in the liver pool. The
phthalate, diisobutyl phthalate (2), was identified but possibly originates from the use of materials to
collect the samples (e.g. syringe) or materials in contact with the sample (e.g. heparinised saline).
The remaining peaks are associated with lipids and sterols naturally occurring in biological samples:
several fatty acid derivatives (3-6), a derivative of the hydrocarbon squalene (7), and derivatives of
the steroid cholestadien (8-10). Peaks 11a-e could not be identified but are likely to represent sterols
or similar compounds.

Investigation of contaminant levels in green turtles from Gladstone
26
Figure 2 Total Ion Count (TIC) GC-MS chromatogram of a green turtle liver pool (n=9). The 10 most
abundant peaks (numbered) were identified based on the mass spectra of each peak.
4.2.2 Tier 2 – Quantitative (target) screening
Detailed results from Tier 2 analysis of pooled blood (n=40 individuals), liver (n=9 individuals) and fat
(n=9 individuals) are presented in Table 3, Table 4 and Table 5. The lipid content in pooled carapace
fat was determined to be 1.7% and the water content 89%; the water content of the liver pool was
not determined, but averaged 78% (range 76-80%) in liver of three of the specimens included in this
pool.
The concentrations for the majority of contaminant groups analysed in these pooled samples were
below the limit of quantification (LOQ).
In pooled blood, middle bound total PFOS and PFOA levels were 100 ppb ww; upper bound
concentrations were 200 ppb ww (Table 3).
Middle bound concentrations for toxic equivalency (TEQ) of PCDD/Fs and PCBs in pooled fat were 6.1
ppt lw and 4.9 ppt lw, respectively (Table 4). Respective upper bound estimates were 12 and 22 ppt
lw. The middle and upper bound concentrations for sum indicator PCBs in pooled fat were 13,000
and 25,000 ppt lw, respectively (Table 4).
The middle to upper bound concentration ranges for sum tri- to deca-brominated flame retardants
(PBDEs) and sum organotins in pooled liver were 2.4 to 3.0 ppb dw (approx. 0.53 to 0.66 ppb ww)
and 29 to 58 ppb dw (approx. 6.4 to 13 ppb ww), respectively, while perfluorinated compounds were
present at 0.65 to 0.70 ppb dw (approx. 0.14 to 0.15 ppb ww) (Table 5).

Investigation of contaminant levels in green turtles from Gladstone
27
Table 3 Concentrations of perfluorinated compounds (PFOS/PFOA; ppb ww) in pooled green turtle
(Chelonia mydas) blood (n=40) from Boyne River estuary near Gladstone, Queensland. Water content
approximately 89%.
Table 4 Concentrations of polychlorinated dibenzo-p-dioxins and dibenzofurans (PCDD/F; ppt lw),
WHO-PCBs (ppt lw) and indicator PCBs (ppt lw) in pooled green turtle (Chelonia mydas) fat (n=9) from
Boyne River estuary near Gladstone, Queensland. Lipid content 1.7%.
PFCsPerfluorooctane sulfonate <100
Perfluorooctanoic acid <100
SPFOS/PFOA (Lower) <LOQ
SPFOS/PFOA (Middle) 100
SPFOS/PFOA (Upper) 200< Below the limit of quantification (LOQ)
PCDD/Fs WHO-PCBs
2,3,7,8-TCDD <3.6
1,2,3,7,8-PeCDD <2.4 PCB 77 <170
1,2,3,4,7,8-HxCDD <5.3 PCB 81 <34
1,2,3,6,7,8-HxCDD <5.3 PCB 126 <46
1,2,3,7,8,9-HxCDD <5.3 PCB 169 <170
1,2,3,4,6,7,8-HpCDD <40
OCDD <130 PCB 105 <360
PCB 114 <80
2,3,7,8-TCDF <5.3 PCB 118 <1300
1,2,3,7,8-PeCDF <4.7 PCB 123 <110
2,3,4,7,8-PeCDF <4.7 PCB 156 <440
1,2,3,4,7,8-HxCDF <4.7 PCB 157 <77
1,2,3,6,7,8-HxCDF <4.7 PCB 167 <170
1,2,3,7,8,9-HxCDF <5.9 PCB 189 <110
2,3,4,6,7,8-HxCDF <4.7
1,2,3,4,6,7,8-HpCDF <7.7 TEQ05 WHO-PCBs (Lower) <LOQ
1,2,3,4,7,8,9-HpCDF <7.1 TEQ05 WHO-PCBs (Middle) 4.9
OCDF <37 TEQ05 WHO-PCBs (Upper) 9.8
TEQ05 PCDD/Fs (Lower) <LOQ
TEQ05 PCDD/Fs (Middle) 6.1 Indicator PCBs
TEQ05 PCDD/Fs (Upper) 12 PCB 28 <5000
TEQ05 PCDD/Fs + WHO-PCBs (Lower) <LOQ PCB 52 <2600
TEQ05 PCDD/Fs + WHO-PCBs (Middle) 11 PCB 101 <3700
TEQ05 PCDD/Fs + WHO-PCBs (Upper) 22 PCB 118 <1300
PCB 138 <4400
PCB 153 <4700
PCB 180 <3400
SIndicator PCBs (Lower) <LOQ
SIndicator PCBs (Middle) 13000
SIndicator PCBs (Upper) 25000
Non-ortho
Mono-ortho
< Below the limit of quantification (LOQ)
< Below the limit of quantification (LOQ)
< Below the limit of quantification (LOQ)

Investigation of contaminant levels in green turtles from Gladstone
28
Table 5 Concentrations of brominated flame retardants (PBDEs; ppb dw), organotins (ppb dw),
perfluorinated compounds (PFOS/PFOA; ppb dw) and bioaccumulative pesticides (ppb dw) in pooled
green turtle (Chelonia mydas) liver (n=9) from Boyne River estuary near Gladstone, Queensland.
Water content approximately 78%.
PBDEs Organotins2,2',4-TriBDE <0.020 Monobutyltin <5.0
2,4,4'-TriBDE <0.016 Monobutyltin-Sn <3.4
Total TriBDE 0.036 Dibutyltin <5.0
2,2',4,4'-TBDE <0.025 Dibutyltin-Sn <2.6
2,2',4,5'-TBDE <0.031 Tributyltin <5.0
2,3',4,4'-TBDE <0.036 Tributyltin-Sn <2.1
2,3',4',6-TBDE <0.031 Tetrabutyltin <5.0
3,3',4,4'-TBDE <0.025 Tetrabutyltin-Sn <1.7
Total TBDE 0.15 Monooctyltin <5.0
2,2',3,4,4'-PeBDE <0.039 Monooctyltin-Sn <2.6
2,2',4,4',5-PeBDE <0.028 Dioctyltin <5.0
2,2',4,4',6-PeBDE <0.025 Dioctyltin-Sn <1.7
2,3',4,4',6-PeBDE <0.030 Triphenyltin <5.0
3,3',4,4',5-PeBDE <0.025 Triphenyltin-Sn <1.7
Total PeBDE 0.15 Tricyclohexyltin <5.2
2,2',3,4,4',5'-HxBDE <0.044 Tricyclohexyltin-Sn <1.7
2,2',4,4',5,5'-HxBDE <0.040
2,2',4,4',5,6'-HxBDE <0.040 SOrganotins (Lower) <LOQ
2,3,3',4,4',5-HxBDE <0.064 SOrganotins (Middle) 29
Total HxBDE 0.19 SOrganotins (Upper) 58
2,2',3',4,4',5,6'-HpBDE <0.050
2,2',3,4,4',6,6'-HpBDE <0.050
2,3,3',4,4',5',6-HpBDE <0.050 Bioaccumulative pesticides Total HpBDE 0.15 Aldrin <0.10
2,2',3,4,4',5,5',6-OctaBDE <0.13 α-chlordane <0.020
2,2',3,3',4,4',6,6'-OctaBDE <0.16 γ- or trans -chlordane <0.020
Total OctaBDE 0.29 o,p'-DDT <0.020
2,2',3,3',4,4',5,5',6-NonaBDE <0.44 p,p'-DDT <0.020
2,2',3,3'4,4',5,6,6'-NonaBDE <0.37 Dieldrin <0.15
Total NonaBDE 0.81 α-endosulfan <0.14
DecaBDE <1.2 β-endosulfan <1.0
Endosulfan sulphate <1.0
SPBDEs (Lower) 1.8 Endrin <0.23
SPBDEs (Middle) 2.4 α-HCH <0.097
ΣPBDEs (Upper) 3.0 β-HCH <0.049
γ-HCH <0.12
Heptachlor <0.10
PFCs cis -heptachlor epoxide <0.057
Perfluorooctane sulfonate 0.60 trans -heptachlor epoxide <0.11
Perfluorooctanoic acid <0.10 Hexachlorobenzene <0.090
Mirex 0.070
SPFOS/PFOA (Lower) 0.60 Oxychlordane <0.081
SPFOS/PFOA (Middle) 0.65 Pentachlorobenzene <0.15
SPFOS/PFOA (Upper) 0.70 Toxaphene, Parlar 26 <0.087
Toxaphene, Parlar 50 <0.11
Toxaphene, Parlar 62 <0.22
< Below the limit of quantification (LOQ)
< Below the limit of quantification (LOQ)
< Below the limit of quantification (LOQ)
< Below the limit of quantification (LOQ)

Investigation of contaminant levels in green turtles from Gladstone
29
4.2.3 Tier 3 – Quantitative target analysis
Table 6, Table 7 and Table 8 provide a summary of the mean, minimum, maximum and median
concentrations, as well as other descriptive statistics, for PCDD/Fs, PCBs, bioaccumulative pesticides,
organotins and metals and metalloids analysed in blood of individual green turtles from Boyne River
estuary. Table 9 provides mean, minimum and maximum concentrations for metal and metalloid
concentrations obtained in liver and kidney samples.
The mean lipid content in blood was determined to be 0.15% (n=22, range 0.062-0.23%). In liver, the
mean water content was 78% (range 76-80%) and in kidney 88% (range 85-92%).
Combined blood TEQ levels for PCDD/Fs and PCBs (TEQdf+pcb) in Gladstone green turtles ranged from
7.1-130 ppt lw on a mammalian TEF basis (middle bound). Using avian TEFs, the levels were 13-120
ppt lw. The highest blood TEQdf+pcb levels were found in the adult turtle blood (130 ppt lw, n=1). For
the juvenile samples (n=21), the mean middle bound TEQdf+pcb levels were 19 (range 7-39) and 33
(range 13-62) ppt lw using mammalian and avian TEFs, respectively.
For four blood samples, concentrations of some individual PCDD/F and PCB congeners could not be
quantified due to analytical interferences in the chromatograms, partially due to low sample
volumes. Reported TEQs would potentially be appreciably understated if these congeners were not
included in the TEQ calculation. Consequently, predicted values for these congeners were
determined and are reported in brackets in Table 6, and in Table 10 and Table 11 in Appendix 8.1. A
consistent relative contribution for each PCDD/F and PCB congener (i.e. congener profile) across all
(complete) blood samples for juvenile green turtles was observed, and this common profile was used
to predict the missing congener values.
Analytes of bioaccumulative pesticides and organotins were mostly below the limit of quantification,
or were present at relatively low concentrations in blood of green turtles. Results for all analytes in
these groups and for each individual turtle are provided in Table 7, and in Table 12 and Table 13 in
Appendix 8.1.
Total metal and metalloid concentrations were highly variable in blood of green turtles, often ranging
over 2 (maximum 3) orders of magnitudes for individual elements (Table 8; Figure 3). For three
turtles, blood, liver and kidney concentrations were determined for each individual (Ex 2, 3 and 22;
Table 9). Concentrations of most metals and metalloids were, as expected, lower in blood compared
to the matched liver or kidney samples, but concentrations of arsenic (As), iron (Fe) copper (Cu),
selenium (Se) and lead (Pb) in blood were similar (within the same order of magnitude) or higher
compared to those present in matched kidney (and for As also liver) samples. The concentrations for
all analytes in this group are summarised in Table 8 and Table 9 and are listed for each individual
sample in Table 14 and 15 in Appendix 8.1.

Investigation of contaminant levels in green turtles from Gladstone
30
Table 6 Summary (descriptive statistics) of concentrations of polychlorinated dibenzo-p-dioxins
and dibenzofurans (PCDD/F; ppt lw) and WHO-PCBs (ppt lw) in blood from individual (n=22) green
turtles (Chelonia mydas) from Boyne River estuary near Gladstone, Queensland.
Compound Mean Minimum Maximum25th
percentileMedian
75th
percentile
Standard
error
Polychlorinated dibenzo-p-dioxins and dibenzofurans (PCDD/Fs; ppt lw)
TEQ05 SPCDD/Fs† 16 2.7 120 5.8 13 16 5.0
PCDDs2,3,7,8-TCDD <3.9 <0.69 <12 <1.3 <2.8 <5.5 <0.70
1,2,3,7,8-PeCDD 9.0 <0.89 82 2.7 5.0 8.6 3.5
1,2,3,4,7,8-HxCDD 11 <0.22 90 1.8 3.8 12 4.0
1,2,3,6,7,8-HxCDD 12 2.8 100 4.2 5.9 14 4.3
1,2,3,7,8,9-HxCDD 11 2.7 76 4.1 5.9 13 3.3
1,2,3,4,6,7,8-HpCDD 54 18 180 32 40 65 8.2
OCDD 200 58 (<470) 110 150 260 25
PCDFs2,3,7,8-TCDF 11 <1.2 43 3.7 6.4 18 2.2
1,2,3,7,8-PeCDF 2.5 <0.44 6.7 1.0 2.1 3.4 0.41
2,3,4,7,8-PeCDF 3.0 <0.34 7.7 1.2 1.8 5.6 0.55
1,2,3,4,7,8-HxCDF 3.0 <0.32 14 0.93 1.7 3.5 0.71
1,2,3,6,7,8-HxCDF 2.7 <0.31 14 0.84 1.7 3.1 0.64
1,2,3,7,8,9-HxCDF 3.6 <0.42 26 1.3 2.6 3.5 1.1
2,3,4,6,7,8-HxCDF 3.2 0.61 19 0.92 1.8 3.2 0.84
1,2,3,4,6,7,8-HpCDF 11 2.5 26 5.1 9.0 16 1.4
1,2,3,4,7,8,9-HpCDF 5.3 <1.0 33 2.1 3.4 5.9 1.4
OCDF 49 19 98 32 43 62 4.8
Polychlorinated biphenyls (PCBs; ppt lw)
TEQ05 SWHO-PCBs† 8.2 3.7 18 5.1 7.8 9.5 0.77
Non-OrthoPCB 77 <150 <75 <290 <100 <140 <190 <11
PCB 81 <55 <25 <110 <42 <54 <65 <4.2
PCB 126 <120 <50 <290 <69 <110 <140 <12
PCB 169 <150 <75 <300 <100 <150 <190 <12
Mono-orthoPCB 105 810 <300 3300 430 640 850 140
PCB 114 <220 <100 <620 <140 <200 <260 <24
PCB 118 3500 <1,500 11000 2100 3000 4200 460
PCB 123 220 <100 440 140 210 280 21
PCB 156 780 <300 2600 410 640 860 120
PCB 157 410 <150 1600 210 330 420 76
PCB 167 620 <250 1800 300 470 590 99
PCB 189 230 <100 520 140 210 280 24† Middle bound TEQ reported: TEQ values are calculated using WHO 2005 TEFs; non-quantified congeners are included at half the value of
their LOQ
< Below the limit of quantification (LOQ); (<) Predicted value (see text)

Investigation of contaminant levels in green turtles from Gladstone
31
Table 7 Summary (descriptive statistics) of concentrations of bioaccumulative pesticides (ppb ww)
and organotins (ppb ww) in blood from individual (n=7) green turtles (Chelonia mydas) from Boyne
River estuary near Gladstone, Queensland.
Compound Mean Minimum Maximum25th
percentileMedian
75th
percentile
Standard
error
Bioaccumulative pesticides (ppb ww)Aldrin NA <0.10 <0.10 NA NA NA NA
α-chlordane NA <0.020 <0.020 NA NA NA NA
γ-chlordane NA <0.020 <0.020 NA NA NA NA
o,p-DDT <0.022 <0.02 <0.027 <0.020 <0.020 <0.023 <0.0011
p,p'-DDT <0.024 <0.02 <0.032 <0.022 <0.023 <0.027 <0.0017
Dieldrin <0.064 <0.057 <0.079 <0.059 <0.062 <0.066 <0.0029
α-endosulfan <0.14 <0.10 <0.18 <0.12 <0.13 <0.16 <0.012
β-endosulfan NA <0.20 <0.20 NA NA NA NA
Endosulfan sulphate NA <0.20 <0.20 NA NA NA NA
Endrin <0.11 <0.099 <0.14 <0.10 <0.11 <0.11 <0.0051
α-HCH 0.037 <0.02 0.14 0.020 0.020 0.020 0.017
β-HCH <0.022 <0.02 <0.027 <0.020 <0.021 <0.024 <0.0010
γ-HCH <0.021 <0.02 <0.023 <0.020 <0.020 <0.020 <0.00040
Heptachlor NA <0.10 <0.10 NA NA NA NA
cis -heptachlor
epoxide<0.047 <0.035 <0.061 <0.041 <0.043 <0.052 <0.0034
trans -heptachlor
epoxideNA <0.10 <0.10 NA NA NA NA
Hexachlorobenzene 0.032 <0.023 0.045 0.027 0.030 0.036 0.0031
Mirex <0.026 <0.02 <0.034 <0.023 <0.024 <0.029 <0.0019
Octachlorostyrene NA <0.020 <0.020 NA NA NA NA
Oxychlordane <0.072 <0.052 <0.095 <0.062 <0.068 <0.081 <0.0061
Pentachlorobenzene <0.023 <0.020 <0.034 <0.020 <0.020 <0.025 <0.0023
Toxaphene 26 <0.11 <0.085 <0.15 <0.10 <0.11 <0.13 <0.0084
Toxaphene 50 <0.24 <0.18 <0.31 <0.21 <0.22 <0.27 <0.017
Toxaphene 62 <0.48 <0.35 <0.62 <0.42 <0.44 <0.54 <0.035
Organotins (ppb ww)Monobutyltin <8.5 <6.8 <9.4 <8.6 <8.6 <8.7 <0.30
Monobutyltin-Sn <5.7 <4.6 <6.3 <5.8 <5.8 <5.9 <0.20
Dibutyltin <12 <6.8 <20 <8.6 <10 <14 <1.9
Dibutyltin-Sn <6.0 <3.5 <10 <4.4 <5.1 <7.1 <0.98
Tributyltin <16 <8.6 <27 <13 <13 <19 <2.4
Tributyltin-Sn <6.6 <3.5 <11 <5.2 <5.5 <7.9 <0.97
Tetrabutyltin <20 <15 <27 <19 <20 <21 <1.4
Tetrabutyltin-Sn <6.9 <5.0 <9.3 <6.5 <6.8 <7.3 <0.49
Monooctyltin <9.7 <6.8 <16 <7.8 <8.6 <10 <1.2
Monooctyltin-Sn <5.0 <3.5 <8.3 <4.0 <4.4 <5.3 <0.62
Dioctyltin <13 <8.6 <27 <9.3 <10 <15 <2.6
Dioctyltin-Sn <4.6 <2.9 <9.1 <3.2 <3.5 <5.2 <0.91
Triphenyltin <8.7 <6.8 <10 <8.6 <8.6 <9.1 <0.38
Triphenyltin-Sn <2.9 <2.3 <3.4 <2.9 <2.9 <3.1 <0.13
Tricyclohexyltin <34 <30 <41 <30 <31 <39 <2.0
Tricyclohexyltin-Sn <11 <9.6 <13 <9.7 <9.8 <13 <0.64< Below the limit of quantification (LOQ)
NA Not applicable

Investigation of contaminant levels in green turtles from Gladstone
32
Table 8 Summary (descriptive statistics) of concentrations of metals and metalloids (ppb ww) in
blood from individual (n=40) green turtles (Chelonia mydas) from Boyne River estuary near
Gladstone, Queensland.
Table 9 Summary (descriptive statistics) of concentrations of metals and metalloids (ppm ww) in
liver and kidney from individual (n=3) green turtles (Chelonia mydas) from Boyne River estuary near
Gladstone, Queensland.
Compound Mean Minimum Maximum25th
percentileMedian
75th
percentile
Standard
error
Metals and Metalloids (ppb ww)Aluminium ND ND ND ND ND ND ND
Arsenic 2300 40 20000 410 1200 2600 550
Cadmium 40 8.1 110 16 36 61 4.3
Chromium 16 1.3 340 2.3 3.3 3.8 9.3
Cobalt 150 28 440 73 120 200 15
Copper 780 450 1900 610 710 840 43
Iron 66000 33000 96000 54000 67000 79000 2400
Lead 18 0.20 76 7.2 15 21 2.5
Manganese 35 16 92 24 32 39 2.4
Mercury 9.3 <0.22 38 1.2 3.3 13 1.8
Molybdenum 11 4.6 83 6.5 8.5 11 1.9
Nickel 5.2 0.67 17 3.1 4.6 6.9 0.53
Selenium 1900 84 8600 410 1000 2700 330
Silver 0.66 0.011 7.1 0.084 0.22 0.74 0.20
Vanadium 12 3.5 38 6.7 8.2 14 1.4
Zinc 8400 3800 12000 6800 8400 9600 310ND not determined
< Below the limit of quantification (LOQ)
Compound Mean Minimum Maximum Mean Minimum Maximum
Metals and Metalloids (ppm ww)Aluminium 2.8 2.4 3.5 0.39 0.28 0.48
Arsenic 2.0 2.0 2.0 1.2 0.88 1.5
Cadmium 17 13 24 48 17 90
Chromium 0.18 0.092 0.29 0.32 0.17 0.62
Cobalt 1.4 0.93 2.3 2.1 0.99 3.2
Copper 84 67 100 4.4 1.8 9.4
Iron 1900 1100 2800 15 11 21
Lead 0.16 0.12 0.20 0.096 0.047 0.15
Manganese 2.5 2.3 2.6 0.66 0.48 0.87
Mercury 1.3 0.86 1.6 0.42 0.15 0.72
Molybdenum 0.54 0.39 0.83 0.16 0.062 0.30
Nickel 0.20 0.17 0.23 9.1 0.42 26
Selenium 5.4 4.0 7.2 1.3 0.62 2.4
Silver ND ND ND ND ND ND
Vanadium 0.45 0.23 0.79 0.30 0.23 0.34
Zinc 45 41 51 33 20 40
Kidney
ND No data
Liver

Investigation of contaminant levels in green turtles from Gladstone
33
Figure 3 Box and whisker plots for metal and metalloid concentrations (ppb ww) in blood from
individual (n=40) green turtles (Chelonia mydas) from Boyne River estuary near Gladstone,
Queensland. Box plots show the mean (red cross) and median (red line), the 25th (bottom of box) and
75th (top of box) percentiles, and 1.5 times the inter quartile range (whiskers).
0
4,000
8,000
12,000
16,000
20,000
Co
nce
ntr
atio
n (p
pb
ww
)
Arsenic
0
20
40
60
80
100
120
Cadmium
0
400
800
1,200
1,600
2,000
Co
nce
ntr
atio
n (p
pb
ww
)
Copper
0
10
20
30
40
50
60
70
80
Lead
0
10
20
30
40
50
60
70
80
90
100
Manganese
0
1
2
3
4
5
6
7
8
Co
nce
ntr
atio
n (p
pb
ww
)
Silver
0
5
10
15
20
25
30
35
40Vanadium
0
2,000
4,000
6,000
8,000
10,000
12,000
Zinc
0
20,000
40,000
60,000
80,000
100,000
Iron
0
5
10
15
20
25
30
35
40
Co
nce
ntr
atio
n (p
pb
ww
)
Mercury
0
2
4
6
8
10
12
14
16
18
Nickel
0
2,000
4,000
6,000
8,000
10,000
Selenium
0
50
100
150
200
250
300
350
Chromium
0
100
200
300
400
500
Cobalt
0
10
20
30
40
50
60
70
80
90
Molybdenum
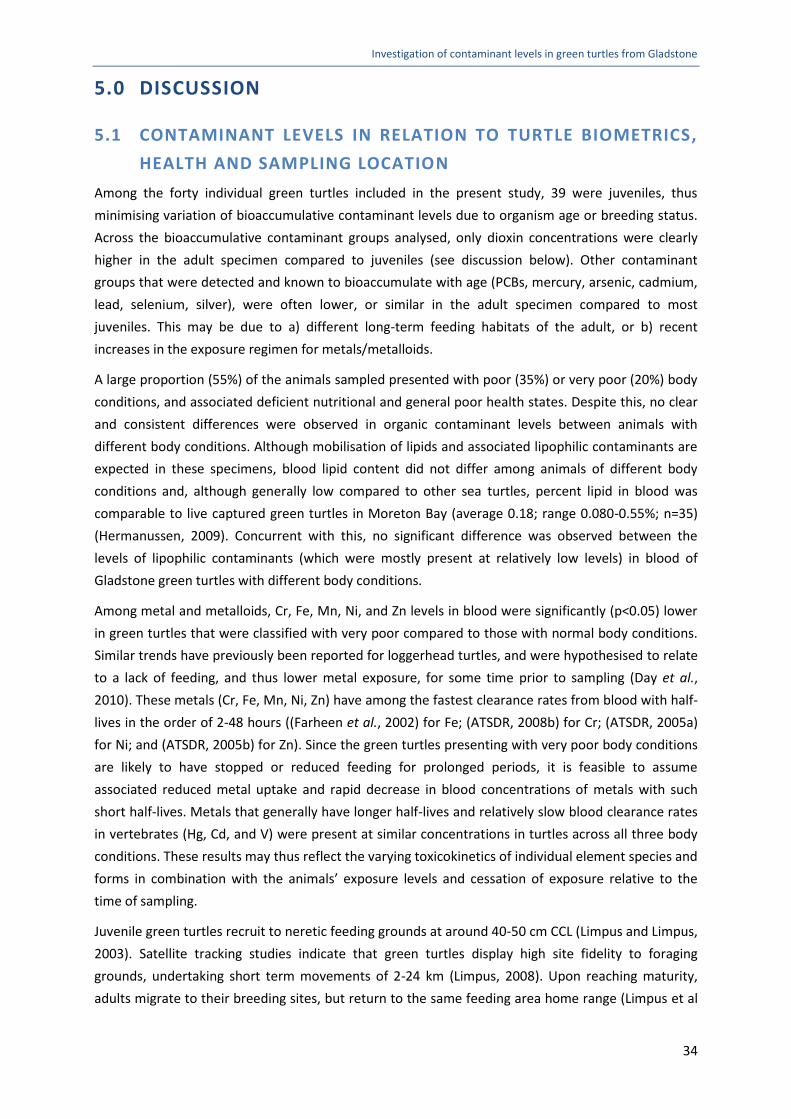
Investigation of contaminant levels in green turtles from Gladstone
34
5.0 DISCUSSION
5.1 CONTAMINANT LEVELS IN RELATION TO TURTLE BIOMETRICS,
HEALTH AND SAMPLING LOCATION
Among the forty individual green turtles included in the present study, 39 were juveniles, thus
minimising variation of bioaccumulative contaminant levels due to organism age or breeding status.
Across the bioaccumulative contaminant groups analysed, only dioxin concentrations were clearly
higher in the adult specimen compared to juveniles (see discussion below). Other contaminant
groups that were detected and known to bioaccumulate with age (PCBs, mercury, arsenic, cadmium,
lead, selenium, silver), were often lower, or similar in the adult specimen compared to most
juveniles. This may be due to a) different long-term feeding habitats of the adult, or b) recent
increases in the exposure regimen for metals/metalloids.
A large proportion (55%) of the animals sampled presented with poor (35%) or very poor (20%) body
conditions, and associated deficient nutritional and general poor health states. Despite this, no clear
and consistent differences were observed in organic contaminant levels between animals with
different body conditions. Although mobilisation of lipids and associated lipophilic contaminants are
expected in these specimens, blood lipid content did not differ among animals of different body
conditions and, although generally low compared to other sea turtles, percent lipid in blood was
comparable to live captured green turtles in Moreton Bay (average 0.18; range 0.080-0.55%; n=35)
(Hermanussen, 2009). Concurrent with this, no significant difference was observed between the
levels of lipophilic contaminants (which were mostly present at relatively low levels) in blood of
Gladstone green turtles with different body conditions.
Among metal and metalloids, Cr, Fe, Mn, Ni, and Zn levels in blood were significantly (p<0.05) lower
in green turtles that were classified with very poor compared to those with normal body conditions.
Similar trends have previously been reported for loggerhead turtles, and were hypothesised to relate
to a lack of feeding, and thus lower metal exposure, for some time prior to sampling (Day et al.,
2010). These metals (Cr, Fe, Mn, Ni, Zn) have among the fastest clearance rates from blood with half-
lives in the order of 2-48 hours ((Farheen et al., 2002) for Fe; (ATSDR, 2008b) for Cr; (ATSDR, 2005a)
for Ni; and (ATSDR, 2005b) for Zn). Since the green turtles presenting with very poor body conditions
are likely to have stopped or reduced feeding for prolonged periods, it is feasible to assume
associated reduced metal uptake and rapid decrease in blood concentrations of metals with such
short half-lives. Metals that generally have longer half-lives and relatively slow blood clearance rates
in vertebrates (Hg, Cd, and V) were present at similar concentrations in turtles across all three body
conditions. These results may thus reflect the varying toxicokinetics of individual element species and
forms in combination with the animals’ exposure levels and cessation of exposure relative to the
time of sampling.
Juvenile green turtles recruit to neretic feeding grounds at around 40-50 cm CCL (Limpus and Limpus,
2003). Satellite tracking studies indicate that green turtles display high site fidelity to foraging
grounds, undertaking short term movements of 2-24 km (Limpus, 2008). Upon reaching maturity,
adults migrate to their breeding sites, but return to the same feeding area home range (Limpus et al

Investigation of contaminant levels in green turtles from Gladstone
35
1992). Considering these studies, the contaminant levels in juvenile green turtles of this study are
likely associated with exposure in the local area from which they were sampled.
5.2 CONTAMINANT EXPOSURE CONCENTRATIONS AND RISK
EVALUATION
Contaminant exposure and associated risks of adverse effects are ideally assessed by integrating
spatial and temporal data on the exposure with detailed understanding on the mechanisms and
dose-dependent effect measures. Realistically, exposure is often unknown, and effect doses, which
vary among species, are only investigated for few, mostly laboratory test animals. Regardless of the
complexities and existing gaps, however, evaluations can be carried out using exposure surrogates
(e.g. analysis of blood) in combination with information on toxicokinetics (uptake, metabolism,
elimination) and effects, which, to some degree, can be extrapolated across species. Such
evaluations inherently carry uncertainties, but provide a reasonable preliminary basis to assess
whether the estimated exposure may be of concern (Hermanussen, 2009; Grillitsch and Schiesari,
2010).
While reptiles are generally underrepresented in toxicological studies (Grillitsch and Schiesari, 2010)
several publications are available to provide a comparative basis on tissue based exposure
concentrations of many contaminant groups in sea turtles, including green turtles (reviewed in
(Eisler, 2010; Grillitsch and Schiesari, 2010)). These studies indicate that, similar to vertebrates, tissue
levels in sea turtles parallel the degree of environmental contamination (Day et al., 2005;
Hermanussen, 2009; Grillitsch and Schiesari, 2010). Particularly for metals and metalloids, however,
it is difficult to establish what constitutes non-elevated, normal background levels in sea turtles due
to a) the spatial variability of naturally occurring elements, b) a general bias in the literature on
stranded and/or moribund sea turtles or live captured specimens from areas near agricultural, urban
and industrial sources, and c) relatively few comparable blood based concentrations in combination
with the rapid clearance rates of most metals and metalloids in blood. Available studies also indicate
that key uptake pathways, systemic transport, distribution and elimination routes of many
contaminants are similar in reptiles compared to those known for other vertebrates (Hermanussen,
2009; Grillitsch and Schiesari, 2010), and that adverse effects are possible in sea turtles at elevated
exposure levels experienced by wild specimens (Day et al., 2007; Grillitsch and Schiesari, 2010). In
the absence of reptile specific data for most contaminants, extrapolation from across vertebrate taxa
(fish, birds, mammals) is thus a commonly used approach (Grillitsch and Schiesari, 2010).
For the present study, exposure was assessed using predominantly blood, and where available,
matched tissue concentrations in comparison to those reported for other green turtles (Appendix 8.2
and Section 5.3). Where insufficient data was available, data from other sea turtles, and organisms
were used to evaluate whether contaminant tissue levels may be elevated, taking into account the
potential for contaminant biomagnification through the food chain. To determine whether exposure
may represent a risk to the study population, blood and tissue levels or, where possible, estimated
body burdens were compared to blood, tissue or body burden based effect concentrations reported
for reptiles, and across other vertebrate taxa (see Section 5.3). Note that comparisons of the
measured blood or tissue concentrations to oral doses (e.g. lowest-observed adverse effect levels)
was not possible, as very limited species/reptile-specific data is available in the literature, and blood

Investigation of contaminant levels in green turtles from Gladstone
36
or tissue concentrations are not comparable to dose effect concentrations across taxa; thus,
comparisons focus on tissue based effect levels. Based on these comparisons, contaminants were
classified into the following three categories:
5.2.1 Contaminants of relatively low concern
Overall, the samples analysed for the present study contained relatively low levels of
bioaccumulative pesticides, organotins, flame retardants (PBDEs), and perfluorinated compounds
(PFOS/PFOA). The concentrations of these contaminant groups in fat, liver and/or blood samples
were mostly near or below the limit of quantification (LOQ) (Table 3, Table 5, Table 7, Table 12, Table
13). Comparisons to the literature indicate that these concentrations are similar to background levels
reported in other green turtles and sea turtles (Hermanussen et al., 2008; Swarthout et al., 2010;
Malarvannan et al., 2011), or other marine megafauna, and considerably lower than the levels that
are considered elevated or of concern in such wildlife (Kannan et al., 2000; Keller et al., 2004a; Ross
et al., 2007; Orós et al., 2009; van de Merwe et al., 2009). Where detected, the concentrations of
these contaminants in tissue or blood therefore most likely represent background levels, and the risk
of adverse effects associated with each of these compounds in the study population is considered
relatively low; no further review was therefore conducted
Concentrations of aluminium (Al), iron (Fe), manganese (Mn) and zinc (Zn) were present in blood
and tissues (except for Al in blood, which could not be quantified) that were comparable to those
reported for many other sea turtles, including from apparently healthy specimens and locations
considered to be relatively unimpacted by local urban, agricultural or industrial point sources
(Appendix 8.2). The concentrations of these elements also generally fall within normal ranges
observed in other marine megafauna, and are thus considered likely to represent normal background
levels of little hazard to the study population; no further review was thus conducted.
In this context, it has to be noted that the presence of low levels of complex chemical mixtures may
result in chronic biochemical and/or physiological changes that can adversely affect organisms, even
if individual contaminants are below their respective threshold levels. However, current scientific
understanding is insufficient to quantitatively assess such mixture effects in most biota, particularly
megafauna such as sea turtles.
5.2.2 Contaminants possibly of concern
Concentrations of silver (Ag), copper (Cu), chromium (Cr), molybdenum (Mo) and lead (Pb) in blood
and for Cu also in liver and kidney were higher than those reported for most other sea turtles and
other vertebrates, but comparable to the upper range reported from moribund green turtles and
specimens from relatively polluted areas (Appendix 8.2). Compared to other vertebrates, these levels
appear to be elevated. Toxicological information for other organisms, where available, indicates
tissue-based concentrations for acute effects are considerably higher, but information on chronic
effects was lacking. Thus, there was insufficient information to assess whether these elements pose a
risk of effects to the turtle population at the exposure levels in Gladstone.
Dioxin and PCB toxic equivalencies (TEQ) in blood of juvenile green turtles from Gladstone were
comparable to the lower ranges reported for other green turtles (Appendix 8.2) and similarly low
trophic marine mammals (dugongs). However, the adult specimen contained elevated TEQ levels

Investigation of contaminant levels in green turtles from Gladstone
37
(mainly due to elevated dioxins, rather than PCBs), comparable to the upper ranges reported for
turtles and dugongs, and other, higher trophic marine wildlife. This may indicate chronic exposure to
elevated levels of dioxins, rather than elevated recent exposure, but more adult specimens would be
required to evaluate this. Risk assessment based on estimated body burdens suggests that TEQ levels
in 6.6% of the juvenile green turtles are above adverse effect levels (LOAELs) where biochemical
effects occur in mammals; these may or may not be harmful to the animals. Using upper bound TEQs
(i.e. a worst case scenario), the estimated body burden of up to 5.0% of the juvenile green turtles are
above the LOAELs for chronic developmental toxicity in avian species. While only one adult specimen
was obtained, it is noteworthy that the estimated body burden in this specimen exceeds the LOAEL
for immunological and developmental effects in both mammals and birds. The risk assessment and
results are discussed in more detail below (Section 5.3.10).
5.2.3 Contaminants of concern
For several metals/metalloids (arsenic (As), cadmium (Cd), cobalt (Co), mercury (Hg), nickel (Ni),
selenium (Se), and vanadium (V)), blood and/or tissue concentrations were clearly higher in green
turtles from Gladstone compared to those reported for most other green turtles (and for non-
biomagnifying compounds other sea turtles or vertebrates), or within the upper levels reported for
specimens that were moribund and/or originated from areas considered relatively polluted
(Appendix 8.2). In addition, these elements were present at higher levels compared to normal
background concentrations known for other vertebrates, including marine megafauna. In many
cases, elevated levels were present in blood, rather than in matched liver or kidney samples. Based
on the relatively rapid blood clearance rates of many of these elements, this suggests that exposure
may have occurred relatively recent prior to sampling (days to months, depending on the element
and level of exposure), rather than via chronic accumulation. Concentrations of Hg, Cd and Se were
above or within the levels where adverse effects have been suggested to occur in reptiles. The
concentrations of the remaining metals/metalloids (As, Co, Ni, and V) were above, near or within
tissue-based concentrations where acute effects have been observed in other vertebrates (birds and
mammals). Although the sensitivity of sea turtles to these elements is unknown, this suggests that
acute adverse effects from exposure of green turtles in Gladstone are possible, and chronic effects
may be expected if exposure persists.
These elements are discussed individually in Section 5.3. These sections include a brief background
on sources, fate and toxicokinetics, a detailed comparison of blood and tissue levels among green
turtles, sea turtles and other organisms, and a review of studies on toxicology and effects, including a
summary of available information on tissue based effect concentrations.

Investigation of contaminant levels in green turtles from Gladstone
38
5.3 REVIEW - CONTAMINANTS OF CONCERN
5.3.1 Arsenic (As)
SOURCES
Arsenic is a metalloid that occurs naturally in trace quantities in rock, soil, water and air. Arsenic
exists as four, but commonly only as three valency states (0 (elemental), +III (arsenite), +V
(arsenate)), and as numerous species in inorganic (combined with oxygen, chlorine, sulfur) and
organic (combined with carbon and hydrogen) form, which vary in their properties (e.g. water
solubility) and toxicities. Mining, smelting of non-ferrous metals, and burning of fossil fuels are the
key industrial processes that contribute to arsenic contamination of air, water and soil (Gomez-
Caminero et al., 2001). Depending on the level of industrialisation, significant quantities may also be
released by wastewater runoff derived from e.g. atmospheric depositions, residues from pesticide
usage, phosphate detergents and industrial effluent, particularly from the metal-processing industry
(Gomez-Caminero et al., 2001). Arsenic has been widely used in wood treatment as copper chromate
arsenate (CCA) and arsenic-containing pesticides were historically used primarily in cotton and
orchards (Gomez-Caminero et al., 2001; ATSDR, 2007). Typically, key arsenic input pathways to
marine environments are river runoff and atmospheric deposition (Sanders, 1980; Gomez-Caminero
et al., 2001).
TOXICOKINETICS
Organisms are exposed to many different forms of inorganic and organic arsenic species in food,
water, air, soil and sediments. Approximately 25% of arsenic in human food is inorganic, but levels in
fish or shellfish are low (<1%). Due to the different properties of arsenic species, including their
varying bioavailability and considerable interspecies differences in metabolism, the toxicokinetics of
arsenic is highly complex (Gomez-Caminero et al., 2001).
Arsenic is rapidly cleared from blood (within hours to days, depending on the organism, arsenic
forms and dose) (Gomez-Caminero et al., 2001; ATSDR, 2007). Blood and urine thus serve as useful
markers for very recent acute or stable, chronic, high-level exposure. Keratin rich tissues (e.g. scutes
of the shell in turtles) can, in contrast, be used as indicators of past arsenic exposure (Gomez-
Caminero et al., 2001).
In general, organisms can be exposed to arsenic via inhalation, ingestion of contaminated food or
water, and dermal exposure. As(III) and As(V) are also known to readily cross the placenta in
laboratory animals and humans (Gomez-Caminero et al., 2001). Oral bioavailability in laboratory
animals varies widely (5-85%), depending on the dose, matrix, arsenic form and animal species.
Dermal absorption of organoarsenic chemicals are in the order of 3-40%. Soluble arsenates
(arsenobetaine, monomethyl arsenic (MMA) and dimethyl arsenic (DMA)) and arsenates are rapidly
and extensively (near complete) absorbed from the gastrointestinal tract in laboratory animals and
most forms are excreted primarily via urine (Gomez-Caminero et al., 2001; ATSDR, 2007). In general,
organoarsenicals are less extensively metabolized than inorganic arsenic, but more rapidly
eliminated in both laboratory animals and humans. After exposure, arsenic is transported in blood
and distributed to liver, kidney, spleen and lung. Several weeks after exposure, arsenic is

Investigation of contaminant levels in green turtles from Gladstone
39
translocated to ectodermal tissues (hair, nails) because of the high concentration of sulfur-containing
proteins in these matrices (Eisler, 1988). Aquatic organisms, particularly marine plants, can
accumulate organic arsenic species, but biomagnification has not been observed in the aquatic food
chain (Eisler, 1988; Gomez-Caminero et al., 2001; ATSDR, 2007).
EXPOSURE CONCENTRATIONS IN GLADSTONE GREEN TURTLES
Arsenic concentrations in blood of green turtles from Gladstone were highly variable, ranging from
40 ppb to 20,000 ppb ww (mean: 2,300 ppb ww). To date, only few reports exist on arsenic in blood
of sea turtles and similarly high levels (94-20,000 ppb ww; mean 4,400 ppb; SE ±1400; n=16) have
been reported in green turtles from Moreton Bay or other areas in southeast Queensland (van de
Merwe et al., 2010). However, the latter study was focused on severely debilitated turtles which died
at the SeaWorld rehabilitation program and may have originated from relatively contaminated zones
(van de Merwe et al., 2010). In contrast, arsenic levels in blood from green turtles from San Diego
Bay (average 160 ± 26 ppb ww; n=30) are an order of magnitude lower, despite its highly urbanised
sources and routine dredging activities (Komoroske et al., 2011). Similarly, urine (an appropriate
marker for recent exposure) of green turtles from Japan contained arsenic levels of 900 ppb ww
(n=2) (Agusa et al., 2011), which is comparable to blood of clinically healthy loggerhead turtles from
the Mediterranean (average 770; range 230-2,600 ppb ww; n=5) (Jerez et al., 2010). Much lower
background blood As concentrations have been reported in four Amazon river turtle species
(averages 1.3, 3.5, 3.8, 4.9 ppb ww; n=60) (Burger et al., 2009) which are similar to those considered
normal for non-exposed humans, (<1 ppb) (ATSDR, 2007).
It is widely known that marine organisms, especially plants, shellfish and fish but also some higher
trophic marine mammals and seabirds (Kubota et al., 2003a) naturally accumulate higher quantities
of particular arsenic compounds, and thus contain higher total arsenic levels compared to terrestrial
biota. Typically, the predominant arsenic species accumulated in marine organisms, including marine
mammals, are water soluble organic forms, particularly arsenosugars and arsenobetaine,
respectively (Gomez-Caminero et al., 2001; Kunito et al., 2008), which have much lower toxic
potency compared to inorganic and other organic forms. Based on arsenic speciation studies it has,
however, been suggested that in addition to arsenobetaine, both green turtles and dugongs (who
share common food sources and habitats) may accumulate higher proportions of lipid soluble and/or
As(III) compounds such as MMA(III) and DMA(III). Arsenobetaine was for example found to be a
minor constituent in dugongs (n=4/4), who contained MMA at a relatively high portion (~40%) of
total arsenic (Kubota et al., 2003a). As(III) was detected in green turtles (Styblo et al., 2000; Kubota et
al., 2003b; Kubota et al., 2003a), including in liver and urine (Agusa et al., 2011), and relatively high
proportions of MMA(III) (1.9%; n=3/5), DMA(III) (5.2%; n=5/5), dimethylarsinic acid (6.6%; n=5/5) and
tetramethylarsonium ion (1%; n=4/5) were quantified in addition to arsenobetaine in green turtle
liver (Kubota et al., 2003b; Kubota et al., 2003a). Considering such unusual accumulation patterns,
adverse effects on turtle biological system are considered possible at elevated arsenic levels (Kubota
et al., 2002).
In addition to blood, arsenic was analysed in liver and kidney from three euthanized green turtles
(EX2, EX3 and EX 22; see Table 1) from Gladstone. Concentrations in these tissues were 2.0, 2.0 and
2.0 ppm ww and 1.2, 1.5 and 0.88 ppm ww, respectively. These concentrations are comparable to

Investigation of contaminant levels in green turtles from Gladstone
40
average levels reported from stranded or moribund green turtle liver and kidney from southeast
Queensland (3.2 and 2.7 ppm ww, respectively; (van de Merwe et al., 2010)). Similar levels have also
been reported in green turtle liver and kidney from Torres Strait (1.5 and 0.42 ppm ww, respectively;
(Gladstone, 1996)), Turkey (2.1 and 1.7 ppm ww; (Kaska et al., 2004)), Japan (0.38-1.2 and 1.6-2.1
ppm ww, respectively; (Agusa et al., 2008)) and China (1.0 and 0.85 ppm ww, respectively; (Lam et
al., 2004)). A recent study reported relatively low (0.67 ±0.019 ppm ww; n=20) arsenic levels in eggs
of flatback turtles collected on Curtis Island off Gladstone in 2006, which are considered to reflect
the exposure of the laying adults (Ikonomopoulou et al., 2011), however the transfer efficiency of
arsenic to eggs is unknown. Notably, the blood arsenic concentrations in the three euthanised
specimens from Gladstone were below the average (1100, 570, and 650 ppb ww, respectively), and
assuming a similar relationship between blood, liver and kidney concentrations as reported in green
turtles from southeast Queensland (van de Merwe et al., 2010), liver concentrations in some live
turtles from Gladstone may be several fold higher (up to 9.7 ppm ww in liver were observed in turtles
with blood arsenic levels of 20,000 ppb; (van de Merwe et al., 2010)).
For context, background arsenic levels in tissue of most other living animals are usually <1 ppm ww,
including humans (Eisler, 1988; Gomez-Caminero et al., 2001). Low levels have also been reported
for alligator and crocodile eggs (0.05-0.2 and 0.2 ppm ww, respectively; (Eisler, 1988), and most
marine mammals contain generally <1 ppm in liver and muscle (Muir et al., 1988; Varanasi et al.,
1994; Neff, 1997; Gomez-Caminero et al., 2001; Stavros et al., 2011; Poulsen and Escher, 2012).
However, pinnipeds can contain arsenic up to 1.7 ppm ww (Eisler, 1988). Among the highest arsenic
concentration recorded in marine mammals was 2.8 ppm ww in lipid of a cetacean from Norway
(Eisler, 1988).
TOXICITY AND EFFECTS
Different organ systems can be affected by arsenic, including skin, respiratory, cardiovascular,
immune, genitourinary, reproductive, gastrointestinal and nervous systems (Gomez-Caminero et al.,
2001). Symptoms of toxication can include gastrointestinal disorders, hepatic and renal failure,
disturbances of cardiovascular and nervous system functions, and eventually death. Chronic
exposure to arsenic is linked to increased risks of cancer in the skin, lungs, bladder and kidney, as
well as other skin changes such as hyperkeratosis and pigmentation changes. There is some evidence
for arsenic to cause hypertension and cardiovascular disease, diabetes, reproductive effects,
cerebrovascular disease, long-term neurological effects, and cancer at sites other than lung, bladder,
kidney and skin (Gomez-Caminero et al., 2001).
Both inorganic and organic forms of arsenic can cause adverse effects in organisms, however, the
degree of toxicity varies with speciation and oxidation state (valency). Generally, water soluble
inorganic arsenic species are more toxic than organic forms, and within these two classes, the
trivalent (III) arsenites tend to be more toxic than the pentavalent (V) arsenates (ATSDR, 2007). For
example, the lethal dose (LD50) values (oral administration to mice) range from approximately 8 ppm
(As(III), 21 ppm As(V)), 580 ppm (tetramethylarsonium chloride), 1800 ppm (MMA and DMA), to
>10,000 ppm (arsenobetaine) (Gomez-Caminero et al., 2001; ATSDR, 2007). However, it was also
reported that dimethylarsinic acid has cytotoxicity (Ochi et al., 1999; Kubota et al., 2003b) and
genotoxicity (Mass and Wang, 1997; Yamanaka et al., 1997; Kubota et al., 2003b). Furthermore,

Investigation of contaminant levels in green turtles from Gladstone
41
toxicity of methylarsonous acid and di-methylarsinous acid, metabolites of methylarsonic acid and
dimethylarsinic acid, respectively, is comparable or higher than that of arsenite (Styblo et al., 2000;
Kubota et al., 2003b). In addition, different biota exhibit a range of sensitivities to different arsenic
species, which is modified by numerous biological and environmental factors, particularly in the
aquatic environment (Eisler, 1988). In marine fish, the water based LC50 (96-hours) range from 13-29
ppm for As(III). In birds, dietary LD50 were reported at 48 ppm As(III) and >2000 ppm MMA (Costigan
et al., 2001). In marine mammals, water doses of 0.37-3.7 ppm arsenic (as AsCl3) resulted in
immunotoxic effects in lymphoma B cell lines from harbour seals (decreased lymphoproliferation,
phagocytic activity and efficiency) (Frouin et al., 2010).
No blood based effect levels are available for wildlife, but acutely toxic and fatal human cases have
been reported to occur at blood As levels of ~ 1,000 ppb (ATSDR, 2007). Reported tissue based effect
concentrations vary widely among animal species, however, most organisms show acute effects at
tissue levels in the low to mid ppm ww range. For example, lethal arsenic toxicoses in cattle, horses
and deer was reported at liver concentrations of 4-22 ppm (Gomez-Caminero et al., 2001). In birds,
residues in the 2 to 10 ppm ww range in liver or kidney are considered elevated; residues >10 ppm
are indicative of arsenic poisoning (Eisler, 1988). Adverse effects of arsenic on aquatic organisms
have been reported at concentrations of 1.3 to 5 ppm ww in tissues (Eisler, 1988). However, as
discussed above, many marine organisms can contain several fold higher organic arsenic levels that
seem to present little hazard to the organism or its consumers (Gomez-Caminero et al., 2001).
SUMMARY
Considering the arsenic levels reported for other sea turtles, and other marine species, As levels in
green turtle blood from Gladstone are unusually elevated, but comparable to those reported for
moribund green turtles. In contrast, liver and kidney As levels are within the typical ranges reported
from green turtles and other marine wildlife. This suggests recent high-level exposure may have
occurred. Considering the limited information on arsenic accumulation in sea turtles in general, and
the lack of information on arsenic species present in Gladstone green turtles, it is not possible to
conclude whether the levels observed present a hazard to these wildlife. However, available
speciation studies indicate that sea turtles can contain inorganic and other highly toxic arsenic
species. Considering this, in combination with blood arsenic levels (up to 20 ppm ww) in the range of
those where effects can be elicited in other organisms based on blood or tissue levels, adverse
effects due to arsenic exposure may be possible in Gladstone green turtles. Speciation of arsenic,
which is essential in understanding the toxicity, is thus recommended to improve evaluation of risks
to green turtles in Gladstone.

Investigation of contaminant levels in green turtles from Gladstone
42
5.3.2 Cadmium (Cd)
SOURCES
Cadmium is a rare heavy metal and typically present in small amounts in zinc ores. It commonly exists
only in one oxidation state (+2) and does not undergo oxidation-reduction reactions. It is typically
obtained as an industrial by-product of the production of zinc, copper and lead. Cd is used in
electroplating, pigment production, the manufacture of plastic stabilisers and batteries (ATSDR,
2008a). Major anthropogenic sources of Cd include smelter fumes and dusts, non-ferrous metal
mining and refining, incineration and disposal of Cd containing waste and fossil fuels, fertilisers, and
municipal as well as sludge discharges (Eisler, 1985a). Cd contamination can be especially severe in
the vicinity of smelters and urban industrialised areas, both from historical or current operations
(Eisler, 1985a; ATSDR, 2008a).
The fate of Cd in the environment and its availability to organisms depends on numerous factors,
including its chemical speciation, adsorption and desorption rates from soil/sediments, the
concentration of complexing ligands, pH, and the redox potential of the surroundings (Eisler, 1985a).
Elemental Cd is mostly insoluble in water and deposits and absorbs to sediments, but its chloride and
sulphate salts are freely soluble (and can also travel long distances in air a particles or vapours)
(Eisler, 1985a; ATSDR, 2008a). Changes in physico-chemical conditions, particularly pH and redox
potential may increase chemical mobility, and therefore bioavailability of sediment-bound Cd (Eisler,
1985a). It is also possible that Cd contaminated sediments are a source for root uptake by aquatic
plants, and Cd in plants growing in contaminated soils can contain very high levels that may be
detrimental not only to the plants but also to their consumers (Eisler, 1985a).
TOXICOKINETICS
The major pathway for exposure to Cd are food consumption, particularly plants grown in
contaminated grounds, and soil/sediment ingestion, although inhalation of significant Cd levels can
occur near cadmium emitting industries (ATSDR, 2008a). Dermal exposure to Cd is considered
negligible (<1%) in humans and laboratory animals, but may increase over prolonged exposure
(ATSDR, 2008a). Aquatic plants can accumulate Cd from sediments, and very high levels can be
present in contaminated areas, presenting a key source of exposure for herbivorous animals and the
food chain (ATSDR, 2008a). Various seagrass species have, however, been shown to contain relatively
low Cd concentrations (Denton et al., 1980; Talavera-Saenz et al., 2007). After oral exposure, only
<10% of Cd in the digestive tract enters the body in humans and laboratory animals, although,
absorption can be higher under iron and other nutrition deficient states (ATSDR, 2008a). The
biological half times of Cd are relatively long (in the order of years to decades) in humans (ATSDR,
2008a); birds showed similarly long biological half-lives of 99 days (Eisler, 1985a).
Cd tends to accumulate preferentially in kidneys and liver of mammals, and only small amounts are
eliminated via urine and faeces (ATSDR, 2008a). Cd has also been observed to accumulate readily in
sea turtle liver and kidneys, with the latter typically containing significantly higher levels (e.g. (Sakai
et al., 2000b; Anan et al., 2001; Kaska et al., 2004; Storelli et al., 2005; Andreani et al., 2008; Barbieri,
2009; Agusa et al., 2011)). Cd accumulation in these tissues is mainly due to the binding of metal ions
by metallothionein, a low molecular weight metal binding protein implicated in the detoxification of
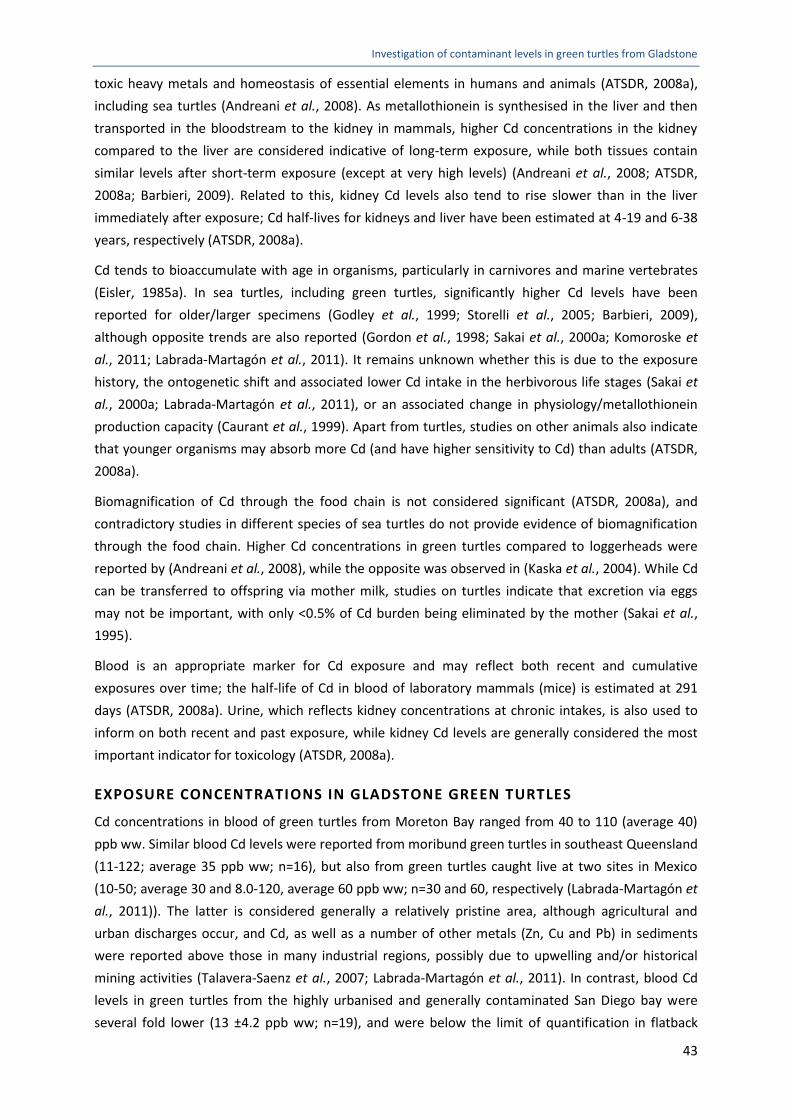
Investigation of contaminant levels in green turtles from Gladstone
43
toxic heavy metals and homeostasis of essential elements in humans and animals (ATSDR, 2008a),
including sea turtles (Andreani et al., 2008). As metallothionein is synthesised in the liver and then
transported in the bloodstream to the kidney in mammals, higher Cd concentrations in the kidney
compared to the liver are considered indicative of long-term exposure, while both tissues contain
similar levels after short-term exposure (except at very high levels) (Andreani et al., 2008; ATSDR,
2008a; Barbieri, 2009). Related to this, kidney Cd levels also tend to rise slower than in the liver
immediately after exposure; Cd half-lives for kidneys and liver have been estimated at 4-19 and 6-38
years, respectively (ATSDR, 2008a).
Cd tends to bioaccumulate with age in organisms, particularly in carnivores and marine vertebrates
(Eisler, 1985a). In sea turtles, including green turtles, significantly higher Cd levels have been
reported for older/larger specimens (Godley et al., 1999; Storelli et al., 2005; Barbieri, 2009),
although opposite trends are also reported (Gordon et al., 1998; Sakai et al., 2000a; Komoroske et
al., 2011; Labrada-Martagón et al., 2011). It remains unknown whether this is due to the exposure
history, the ontogenetic shift and associated lower Cd intake in the herbivorous life stages (Sakai et
al., 2000a; Labrada-Martagón et al., 2011), or an associated change in physiology/metallothionein
production capacity (Caurant et al., 1999). Apart from turtles, studies on other animals also indicate
that younger organisms may absorb more Cd (and have higher sensitivity to Cd) than adults (ATSDR,
2008a).
Biomagnification of Cd through the food chain is not considered significant (ATSDR, 2008a), and
contradictory studies in different species of sea turtles do not provide evidence of biomagnification
through the food chain. Higher Cd concentrations in green turtles compared to loggerheads were
reported by (Andreani et al., 2008), while the opposite was observed in (Kaska et al., 2004). While Cd
can be transferred to offspring via mother milk, studies on turtles indicate that excretion via eggs
may not be important, with only <0.5% of Cd burden being eliminated by the mother (Sakai et al.,
1995).
Blood is an appropriate marker for Cd exposure and may reflect both recent and cumulative
exposures over time; the half-life of Cd in blood of laboratory mammals (mice) is estimated at 291
days (ATSDR, 2008a). Urine, which reflects kidney concentrations at chronic intakes, is also used to
inform on both recent and past exposure, while kidney Cd levels are generally considered the most
important indicator for toxicology (ATSDR, 2008a).
EXPOSURE CONCENTRATIONS IN GLADSTONE GREEN TURTLES
Cd concentrations in blood of green turtles from Moreton Bay ranged from 40 to 110 (average 40)
ppb ww. Similar blood Cd levels were reported from moribund green turtles in southeast Queensland
(11-122; average 35 ppb ww; n=16), but also from green turtles caught live at two sites in Mexico
(10-50; average 30 and 8.0-120, average 60 ppb ww; n=30 and 60, respectively (Labrada-Martagón et
al., 2011)). The latter is considered generally a relatively pristine area, although agricultural and
urban discharges occur, and Cd, as well as a number of other metals (Zn, Cu and Pb) in sediments
were reported above those in many industrial regions, possibly due to upwelling and/or historical
mining activities (Talavera-Saenz et al., 2007; Labrada-Martagón et al., 2011). In contrast, blood Cd
levels in green turtles from the highly urbanised and generally contaminated San Diego bay were
several fold lower (13 ±4.2 ppb ww; n=19), and were below the limit of quantification in flatback

Investigation of contaminant levels in green turtles from Gladstone
44
turtles off the coast of Gladstone (<0.1 ppb ww; n=20) (Ikonomopoulou et al., 2011). Average Cd
levels in blood of Florida manatees were 1.0 (range 1.0-3.0) ppb ww (in (Eisler, 2010)). Mean blood
Cd in humans are typically around 0.47 ppb ww with slightly higher levels in older age groups, and
females (ATSDR, 2008a).
In liver and kidney of green turtles from Gladstone, Cd concentrations (average 17, 13-24 and
average 47, 17-90 ppm ww, respectively) are also comparable with elevated levels reported from
elsewhere. For example, green turtle liver and kidney from Moreton Bay contained what the authors
considered among the highest Cd levels recorded for marine vertebrates (average 38, 2.5-57 and
average 38, 1.7-76 ppm ww, respectively) (Gordon et al., 1998). Moribund green turtles from
southeast Queensland contained similarly high levels (average 14, 4.3-32 and 46, 13-100 ppm ww,
respectively) (van de Merwe et al., 2010). In the Torres Strait, Cd levels in liver and kidney of green
turtles (average 11, 6.0-17 and average 26, 12-42 ppm ww) were also comparably high (Gladstone,
1996). Similar Cd levels in kidneys (average 28, 4-56 ppm ww) of green turtles were also reported
from Japan, and were considered extremely high, although liver contained lower Cd concentrations
(average 5.6, 1.1-12 ppm ww) compared to Gladstone turtles (Anan et al., 2001). Similar Cd kidney
concentrations were reported from moribund green turtles with severe fibropapilloma (average 42,
16-70 ppm ww) compared to a captive (22 ppm ww) and stranded specimens (average 7.6, 4.7-10
ppm ww) (Aguirre et al., 1994). Liver Cd levels in these same specimens averaged 16 (5-26), 3.1 and
2.7 (0.39-5.4), respectively (Aguirre et al., 1994). Apart from these studies, Cd levels in green turtles
are typically one or two magnitudes lower. These include for example average kidney samples of
adults and juveniles from Brazil (0.26 and 0.12 ppm ww, respectively; (Barbieri, 2009)), Costa Rica
(4.7 ppm ww; (Andreani et al., 2008)), Cyprus (1.0 ppm ww; (Godley et al., 1999)), Turkey (1.9 ppm
ww; (Kaska et al., 2004)), Hong Kong (0.30 ppm ww; (Lam et al., 2004)) and Mexico (1.6 ppm ww;
(Talavera-Saenz et al., 2007)); liver tissue analysed in these latter studies contained similarly low or
lower Cd concentrations.
In seabirds, Cd levels in liver and kidney are typically <15 ppm ww and often much lower, but high
concentrations >50 ppm ww have been reported from various areas and species (Eisler, 2010).
Similarly, studies on marine mammals from Australia, indicate Cd concentrations typically range from
<LOQ to <15 ppm ww in liver and <LOQ to <30 ppm ww in kidney, but high concentrations up to 76
ppm ww and 106 ppm ww, respectively have been identified in some individuals across several
species (Kemper et al., 1994).
It has been suggested that the sometimes very high (up to 80 ppm ww) Cd levels in green turtles may
be a result of high accumulation in seagrass (Talavera-Saenz et al., 2007) and/or incidental ingestion
of sediment (Gladstone, 1996), although seagrass and sediment Cd concentrations have been found
to be relatively low in areas (Denton et al., 1980; Talavera-Saenz et al., 2007) (Gladstone, 1996).
Similar to green turtles, loggerhead and other higher trophic sea turtles appear to be able to
accumulate comparably high Cd levels which may be taken up via benthic food sources (e.g.
crustaceans, muscles) (Caurant et al., 1999). The elevated levels sometimes observed in sea turtles
may also be consequence turtle specific metabolic capacities (Caurant et al., 1999). Despite the
unknown reasons for the high accumulation efficiencies, there is strong evidence that higher
concentrations of Cd in individuals of a given species collected at different locations is almost always

Investigation of contaminant levels in green turtles from Gladstone
45
associated with proximity to industrial and urbanised areas or to point source discharges of Cd
containing waters (Eisler, 1985a).
TOXICITY AND EFFECTS
There is no evidence that Cd performs a beneficial role in biological systems, but it is known to be
one of the most toxic elements and exerts toxic effects including nephrotoxicity, carcinogenicity,
mutagenicity and reproductive toxicity (Eisler, 1985a). Cd has been implicated in severe deleterious
effects on wildlife, as well as deaths in humans (Eisler, 1985a). Long term exposure can lead to
accumulation of Cd in the kidneys and a range of effects (e.g. decreased growth, respiratory
disruption, altered enzyme levels, and abnormal muscular contractions (Eisler, 1985a)) and
eventually causing kidney damage and result in debilitating bone disease (Itai-Itai disease),
particularly in individuals with poor nutrition (ATSDR, 2008a). The various clinical symptoms from
chronic exposure are thought to result from the degeneration and atrophy of the proximal tubules
or, in the worse cases, interstitial fibrosis of the kidney (ATSDR, 2008a).
In reptiles, ovo-exposure to toxic elements including Cd and As has been shown to affect hatchling
growth, foraging efficiency, mortality, thyroid function or later reproductions (Hopkins et al., 1999;
Brasfield et al., 2004; Marco et al., 2004; Guirlet et al., 2008). A correlation between reduced
vitellogenic capacity and increased hepatic Cd concentrations was also reported for freshwater
turtles (Storelli et al., 2005).
The sensitivity of mammalian kidneys to Cd is related to Cd distribution in the body and the
production of metallothionein (a metal binding protein) in the kidney. Similarly, metallothionein has
been suggested to be involved in the regulation of Cd in sea turtles (Anan et al., 2001). Binding of Cd
to metallothionein decreases the toxicity of Cd (ATSDR, 2008a). When total Cd content in the renal
cortex reaches between 50-300 ppm ww, however, the amount of Cd not bound to metallothionein
becomes sufficiently high to cause tubural damage (ATSDR, 2008a).
Sublethal effects in most marine animals occur at Cd levels of 0.5-10 ppb in water (Eisler, 1985a). Cd
concentrations exceeding 10 ppm ww in liver or kidney of vertebrates, or 2 ppm ww whole body are
considered evidence of probably contamination, while elevated levels of 13-15 ppm ww in tissue
may represent a significant hazard to animals of higher trophic levels, and residues of 200 ppm ww
or 5 ppm ww whole body, are probably life-threatening to most organisms (Eisler, 1985a).
A recent study on freshwater turtles showed that relatively low Cd levels (7 ppm) in yolk could
impact on gonadal development and may impact the animals by disrupting reproductive process and
lowering fertility (Guirlet et al., 2008; Kitana and Callard, 2008). Blood Cd levels (average 13 ±4.2 ppb
ww) were also correlated with several health markers in green turtles however interpretation was
confounded by covariance with turtle size (Komoroske et al., 2011). Cd levels of 8.3 and 3.3 ppm ww
in liver of loggerhead turtles were considered high enough to potentially affect the health of these
organisms (Storelli et al., 2005).
In occupationally exposed humans, chronic blood Cd levels of 5.6 and 10 ppb were associated with a
10% prevalence of abnormal biomarkers of tubular damage (β2-microglobulin) and renal
dysfunction, respectively, and 33% had signs of glomerular damage at blood Cd levels of 5.6-<8.4 ppb
(ATSDR, 2008a). Kidney Cd burdens >50 ppm cortex are associated with renal damage in humans,

Investigation of contaminant levels in green turtles from Gladstone
46
and blood Cd levels of >1.5 ppb are significantly correlated with reduced sperm count in humans, and
showed weak correlations with defective sperm (ATSDR, 2008a).
SUMMARY
Cd levels in green turtle blood, liver and kidney from Gladstone are comparable to the upper
concentrations reported from green and other sea turtles from elsewhere, and are relatively high
compared to average concentrations typically found in marine mammals and seabirds. Lowest levels
reported in green and higher trophic sea turtle species are 1-2 orders of magnitude below these
concentrations; however, several other studies have reported high levels of Cd in different species of
sea turtles. While various hypotheses have been proposed to explain such elevated Cd levels in
turtles, to date these observations cannot be explained, and it remains unknown whether the
associated individuals or populations are adversely affected. In accord with other studies, the
elevated Cd levels observed in Gladstone green turtles are near or above tissue based concentrations
where significant adverse effects are observed in other animals, and higher compared to levels
where sublethal and biochemical effects were implicated, also for sea turtles. While the sensitivity of
turtles to Cd is unknown, these studies suggest that adverse effects are possible at the observed Cd
exposure levels, although sea turtle specific information is sparse.

Investigation of contaminant levels in green turtles from Gladstone
47
5.3.3 Cobalt (Co)
SOURCES
Cobalt is a naturally occurring element present at relatively low concentrations in the environment. It
commonly occurs in three valence states (0, +2 and +3) (ATSDR, 2004). It is an essential element
required in trace amounts to maintain health in animals and humans. In the environment, it is usually
combined with other elements (e.g. oxygen, sulfur, and arsenic). Co is used in the form of alloys in a
range of industrial, medical and agricultural applications. It may be released from a number of
anthropogenic activities, including coal-fired power plants and incinerators, vehicle exhaust,
industrial activities related to mining and processing of cobalt-containing ores, smelting facilities and
the production and use of cobalt alloys and chemicals (ATSDR, 2004).
The fate of Co in the environment depends on many factors, such as the release route, the chemistry
of the water and sediment. In general, Co compounds are non-volatile and most have a high affinity
for particles (ATSDR, 2004). Such forms are thus strongly associated with soils and sediments, but
ionic forms can also remain in the water column and the amount of Co that is mobile increases under
more acidic conditions (ATSDR, 2004). Plants can accumulate the cobalt from their surroundings and
animals can accumulate Co in their body, but biomagnification through the food chain has not been
observed (ATSDR, 2004).
TOXICOKINETICS
Generally, exposure to Co may occur via air or food and water, but Co can also readily enter an
organism via abraded parts of the skin, and has been shown to cross the placenta in animal studies
(ATSDR, 2004). Based on its fate in the environment, the predominant exposure route for turtles
would be expected to be contaminated sediments and seagrass, however, exposure via water may
also occur. The proportion of Co that enters the body from the gastrointestinal tract varies
considerably (18-97% in humans, 13-34% in rats, 1-2% in cows), based on the animal species, type
and dose of Co, and the nutritional status of the subjects, with higher absorption under iron deficient
nutritional states (ATSDR, 2004). Dermal exposure through abraded skin has been observed to be
~80% in guinea pigs, but is low (<1%) through intact skin (ATSDR, 2004).
After exposure, Co distributes via the blood to all tissues, predominantly the liver, kidney and bones
(ATSDR, 2004). Absorbed Co is eliminated from the body within days to weeks in humans and
laboratory animals, with the main route of excretion via urine (ATSDR, 2004). Blood is thus an
appropriate and commonly used marker for relatively recent (in the order of days to weeks)
exposure to Co (ATSDR, 2004).
EXPOSURE CONCENTRATIONS IN GLADSTONE GREEN TURTLES
Blood Co levels in Gladstone green turtles ranged from 28-440 (average 150) ppb ww. Average
concentrations (36 ±6.7 ppb ww) were considerably lower in moribund green turtles from southeast
Queensland (van de Merwe et al., 2010). In adult nesting flatback turtles off the coast of Gladstone
(Curtis Island), blood Co levels were below the LOQ (<0.1 ppb ww) (Ikonomopoulou et al., 2011). No
other information could be identified for Co blood concentrations in turtles. Normal Co blood levels
in humans range from 0.05-2.7 ppb (Catalani et al., 2011), while Co levels as high as 57-187 ppb ww

Investigation of contaminant levels in green turtles from Gladstone
48
have been observed in occupationally exposed cohorts (ATSDR, 2004), and a medical human case
study reported extremely high Co levels of 549 ppb ww (Catalani et al., 2011).
In liver and kidney of Gladstone turtles, average Co levels detected were 1.4 (range 0.93-2.3) and 2.1
(range 0.99-3.2) ppm ww, respectively. These concentrations are higher compared to those reported
from most other green turtles, particularly in liver. In liver of green turtles from Japan for example,
average Co levels were <0.030 (n=2; (Sakai et al., 2000a)), 0.077 (n=25; (Anan et al., 2001)), and
0.067 ppm ww (n=1; (Sakai et al., 2000b)). Approximately one order of magnitude lower levels were
also reported in liver of green turtles from Hong Kong (0.13; n=2; (Lam et al., 2004)) and southeast
Queensland (0.61; n=16; (van de Merwe et al., 2010)). Average kidney Co levels were also lower in
green turtles from Japan (0.3 (Sakai et al., 2000a), 0.51 (Anan et al., 2001), 0.81 (Sakai et al., 2000b)),
however the maximum Co levels in these studies reached the average concentration of green turtles
from Gladstone. Similar Co kidney concentrations compared to Gladstone were reported in green
turtles from Hong Kong (1.4 ppm ww; n=2) (Lam et al., 2004) and southeast Queensland (1.5 ppm
ww; n=x) (van de Merwe et al., 2010); both studies show similarly elevated levels of other metals and
metalloids.
Co in livers of various seabird species are typically very low ranging from 0.0011 to 0.024 ppm ww
(ATSDR, 2004). Similarly, in livers of cetaceans from Hong Kong, Co levels ranged from 0.0015-0.016
ppm ww (n=33) (Lam, 2009) and Co levels in marine mammals are usually less than 0.13 ppm ww
(Eisler, 2010). Similarly low levels have been reported for human liver (0.017 ppm ww) from Japan
(ATSDR, 2004).
TOXICITY AND EFFECTS
Co is part of the vitamin B12, and is (at trace levels) essential to the growth and development of
various organisms. On the other hand, Co may also elicit harmful effects in organisms if exposure is
sufficiently high. These include developmental and behavioural effects, and effects on the blood,
liver, kidneys and heart. After dermal exposure, the most commonly observed effect is dermatitis,
possibly caused by an allergic reaction (ATSDR, 2004). After inhalation, a range of effects on the
respiratory system are also observed (e.g. decreased pulmonary function, asthma, lung disease,
dyspnea), as well effects on thyroid and allergic dermatitis (ATSDR, 2004). Co has also been classified
as possibly carcinogenic by IARC (ATSDR, 2004).
Adequate chronic studies on the oral toxicity of Co in humans and animals are currently not available
(ATSDR, 2004). A human case study reported very high cobalt levels (549 ppb ww; whole blood) in a
subject that presented with cranial nerve impairment and mild distal sensory-motor disturbances,
followed by blindness, deafness and severe limbs motor weakness. The blood Co dropped to ~100
ppb within 10 days and remained elevated (33.9 ppb ww) above background (0.05-2.7 ppb ww) 14
months after exposure (ATSDR, 2004).
The doses for oral LD50 in rats range from 42 ppm body weight as cobalt chloride to 317 ppm body
weight as cobalt carbonate (ATSDR, 2004). Box turtles that were subcutaneously injected with 5 ppm
body weight 5 times per week died within 14 to 147 days (Altland and Thompson, 1958).

Investigation of contaminant levels in green turtles from Gladstone
49
SUMMARY
Based on the available studies on turtles and other organisms, blood Co levels appear to be relatively
high in Gladstone green turtles, however, comparative data are sparse. Co concentrations
determined in tissue samples also support that elevated exposure may have occurred, but while both
liver and kidney concentrations are higher compared those reported for most other sea turtles, they
are within the upper ranges of previously reported levels. Based on the general toxicokinetics of Co
in other organisms, this suggests exposure to elevated Co may have occurred relatively recent (days,
weeks to months) prior to sample collection. There is no information on the toxic effects of Co in
reptiles and it is unknown whether the observed levels may be associated with effects. However, the
blood Co levels are in the range of those where acute effects have been described in humans.

Investigation of contaminant levels in green turtles from Gladstone
50
5.3.4 Mercury (Hg)
SOURCES
Mercury occurs naturally in the environment and exists in several (elemental, inorganic, and organic)
forms. There are numerous anthropogenic sources of Hg to the environment, including fossil fuel
combustion, mining, smelting, steel mills, chloralkali plants, solid waste incineration, as well as via
fertilisers, fungicides and municipal waste, cement production, uncontrolled industrial releases and
from industrial wastewater (ATSDR, 1999). After release to air, the fate of mercury depends on its
speciation. For example, gaseous elemental Hg can undergo global-scale transport, or particulate and
reactive gaseous Hg is primarily deposited within the vicinity of the source. Hg can also be released
directly to the marine environment (e.g. via wastewater) or indirectly, via contaminated soil. In
aquatic systems, mercury is mostly bound to particles where it is relatively stable. Inorganic Hg is
microbially transformed to methylmercury (MeHg), a potent neurotoxin with strong tendency to
biomagnify in the aquatic food chain (ATSDR, 1999; Kampalath et al., 2006).
TOXICOKINETICS
The toxicokinetics of Hg species in organisms are complex and depend on the Hg form. Aquatic
organisms are exposed to mercury mainly via food (and ingested sediments), but exposure via the
water, air and skin may also occur, with bioavailability depending on the Hg form (ATSDR, 1999). In
addition, Hg can transfer to offspring readily in humans (ATSDR, 1999), however, it has been
suggested that maternal transfer is not a major elimination pathway for turtles, with only <5% of the
maternal Hg burden transferred per clutch (Sakai et al., 1995; Godley et al., 1999).
Generally, ingested MeHg is absorbed (almost completely) into the bloodstream within hours, which
is the primary transport mechanism of mercury through the body. In blood, the cellular component
(e.g. red blood cells) has the highest affinity for Hg, and can contain 10-200 times higher
concentrations compared to plasma (Day et al., 2007). However, blood Hg concentrations decline
within weeks after exposure ceases, as the dose is distributed to organs and tissues (ATSDR, 1999).
This is followed by a slower elimination phase, which may last several months (Day et al., 2007).
Organic Hg compounds are mainly excreted via the faeces in humans and animals, and
predominantly in the inorganic form (ATSDR, 1999).
Blood is therefore a biomarker for measuring relatively recent (within days to weeks) exposure to Hg,
but is affected by short-term changes in Hg levels (Day et al., 2005). Particularly the onset of
debilitated conditions in animals, including turtles, and the cessation of feeding may create artificially
low Hg levels in blood that are no longer representative of the burden during the beginning of their
health decline (Day et al., 2010). Despite this, blood Hg levels are often correlated to those in less
dynamic tissues suggesting a proportion of blood Hg may also reflect longer term exposure (Day et
al., 2005). Exposure assessment of mercury via blood has the added advantage that the majority of
Hg present is in its most toxic methylated form (MeHg) thus reducing the need for complex
speciation (Day et al., 2005; Day et al., 2007).
In contrast to blood, keratinised tissues are commonly used biomarkers of long-term exposure to Hg
due to its strong binding of keratin proteins, and relative persistence in these (Day et al., 2005). Liver
and kidney typically contain larger proportions of inorganic Hg forms, due to Hg demethylation in
Investigation of contaminant levels in green turtles from Gladstone
51
these organs (Day et al., 2005; Day et al., 2007). This is valid for green turtles, where liver MeHg was
shown to contribute approximately 9-19% of total mercury (Kampalath et al., 2006).
Hg has been shown repeatedly to bioaccumulate in a variety of organisms (ATSDR, 1999). Seemingly
contradictory to this, studies indicate that green turtles contain higher Hg levels in their juvenile,
rather than adult life stages (Gordon et al., 1998; Kampalath et al., 2006; Komoroske et al., 2011).
This has been suggested to be related to their ontogenetic shift in diet from a higher to low trophic
level and an associated growth dilution of Hg body burdens (McKenzie et al., 1999; Kampalath et al.,
2006; Komoroske et al., 2011). As the opposite trend is observed for other metals (e.g. lead)
alternative hypotheses for negative correlations between Hg levels and green turtle size may be a
change in physiological biotransformation and elimination, or up-regulation of metallothionein in
adult specimens (Komoroske et al., 2011). Despite this, juvenile green turtles typically contain
considerably (order of magnitude) lower Hg levels compared to loggerheads when collected from the
same area (e.g. (Godley et al., 1999; Anan et al., 2001; Kampalath et al., 2006)). This is consistent
with the strong tendency of Hg to biomagnify through the food chain.
EXPOSURE CONCENTRATIONS IN GLADSTONE GREEN TURTLES
Hg concentrations in blood of live green turtles from Gladstone ranged from <0.22 to 38 ppb ww
(average 9.3 ppb ww). Approximately 4 and 9 times lower concentrations were reported in blood of
moribund green turtles from southeast Queensland (0.25-7.1; average 2.5 ppb ww; n=16; (van de
Merwe et al., 2010)), and a highly urbanised estuary in San Diego (1.0 ppb ±0.16; n=30; (Komoroske
et al., 2011)), respectively. While Hg exposure in turtles has been investigated in a number of other
studies, including in blood, these studies focus mostly on higher trophic species. Notwithstanding the
expected higher Hg levels in higher trophic species (Kampalath et al., 2006) (even in blood, as
discussed above), Hg was below the limit of quantification (<0.01 ppb ww) in blood of nesting
flatback turtles collected on Curtis Island, off Gladstone in 2006 (Ikonomopoulou et al., 2011).
Relatively low levels were also reported in blood of nesting females of carnivorous olive ridley turtles
in Mexico (0.6 ppb dw or approx. 0.15 ppb ww using the reported conversion; n=25; (Páez-Osuna et
al., 2011)).
In contrast to the above mentioned literature, which possibly reflect low background exposure,
higher concentrations of Hg were reported in blood of live (higher trophic) loggerhead turtles from
the USA (6-77 ppb ww; average 29; n=60; (Day et al., 2007) and 5-188 ppb ww (Day et al., 2005)).
Similar levels were detected in live loggerhead turtles from the same area collected 3 years earlier
(average 29 ppb; n=34; (Day et al., 2005), with one severely and chronically emaciated animal
containing 188 ppb ww (Day et al., 2005). Mercury levels in these individuals were correlated with
the distance to the nearest major industrial river mouth. Blood from stranded loggerhead turtles,
collected in conjunction with the latter study, contained an average of 99 ppb ww and the highest
concentrations (306 ppm ww) was present in an individual that was severely and chronically
emaciated and exhibited extreme muscle atrophy as well as an empty gastrointestinal tract (Day et
al., 2005). These studies suggest a link between the observed blood Hg levels and negative impacts
on loggerhead turtle immune function (Day et al., 2007), as further discussed below. For context,
whole blood Hg levels of <5-20 ppb are considered normal in humans (ATSDR, 1999).

Investigation of contaminant levels in green turtles from Gladstone
52
Similar to blood, Hg liver (1.3; 0.86-1.6 ppm ww) and kidney (0.42; 0.39-0.72 ppm ww) levels in the
three euthanized green turtles from Gladstone were several fold to several magnitudes higher
compared to those reported for other green turtles from Australia, and elsewhere. Stranded green
turtles from Moreton Bay contained an average of 0.021 (<LOQ-0.052) and 0.020 (<LOQ-0.049) ppm
ww (n=23), respectively (Gordon et al., 1998). Liver and kidney of failed rehabilitation green turtles
from southeast Queensland also contained lower concentrations (0.19; <LOQ-0.54 and 0.06; <LOQ-
0.20 ppm ww; n=16; (van de Merwe et al., 2010), and Hg levels were below the limit of quantification
(<0.05 ppm ww) in eggs of the higher trophic flatback turtles collected off Gladstone on Curtis Island
(Ikonomopoulou et al., 2011). Similarly low levels were reported from Torres Strait (0.08; 0.02-0.17
ppm ww and 0.02; 0.01-0.04 ppm ww, n=12, respectively) (Gladstone, 1996). Similarly, liver and
kidney Hg levels in Gladstone turtles were higher compared to those from other areas around the
world, including e.g. Japan (0.29; 0.053-0.64 and 0.13; 0.029-0.25 ppm ww; n=46; (Sakai et al.,
2000a)), Hong Kong (0.17 and 0.04 ppm ww; (Lam et al., 2004)) and the Mediterranean (0.12 and
<LOQ ppm ww; (Godley et al., 1999)). In this respect it is noteworthy that liver and kidney samples
were only analysed from three specimens from Gladstone, which contained blood mercury levels
similar to the average (n=1) and 10-42 times lower (n=2) than the average of all turtles sampled.
Assuming a relationship exists between Hg blood, liver and kidney concentrations (van de Merwe et
al., 2010), considerably higher levels may be present in live turtles with high blood Hg levels
(estimated at 9-17 ppm ww, or more). Considering the dose-dependent demethylation of Hg in the
liver, prediction of Hg in liver from blood will be more suitable at low concentrations, and may
underestimate total Hg in this organ (and to a lesser extent in the kidney and brain) when higher
concentrations are present (Day et al., 2005).
The body of literature on Hg concentrations in tissues of other aquatic organisms is extensive, mainly
from higher trophic marine mammals (~0.3-300 ppm ww in liver) and seabirds (~0.1-100 ppm in liver)
(Sakai et al., 2000a), however, marine birds and mammals appear to have either lower proportions of
organic Hg, or lower susceptibility to Hg (reviewed in (NJDEP, 2001). Compared to these levels, Hg
levels in green turtles are low, likely due to their low trophic level status, but it has been suggested
that sea turtles may be substantially more sensitive to Hg toxicity (Day et al., 2007). Alligators from
the Everglades contained approximately 10 ppm ww in kidney, which exceeded the chronic risk
threshold (Yanochko et al., 1997; Duvall and Barron, 2000; NJDEP, 2001).
TOXICITY AND EFFECTS
Toxic effects of various mercuric forms include neurotoxicity, impaired growth and development,
reproductive effects, liver and kidney damage and immunotoxicity (ATSDR, 1999; Day et al., 2007).
Such effects have been shown to occur in mammals, birds and fish, and in contrast to many other
metals and metalloids, are also increasingly being investigated in turtles (Day et al., 2007). The
nervous system is highly sensitive to mercury (ATSDR, 1999). It has also been shown that Hg elicits
immunosuppressive effects for most lymphocyte functions, which is often accompanied by an
increase in the susceptibility to infectious agents (e.g. herpes virus; (Ellermann-Eriksen et al., 1994)
or tumour cells (Moszczyński, 1997; Day et al., 2007)). In aquatic organisms, MeHg is the most toxic
and physiologically important portion of the Hg burden.

Investigation of contaminant levels in green turtles from Gladstone
53
Blood Hg levels in green turtles (average 1 ppb ww) were correlated with several clinical health
markers from San Diego estuary (Komoroske et al., 2011), and similar results were reported in
Kemp’s ridley sea turtles (Day et al., 2007) as well as loggerhead turtles (average 29 ppb ww) from
southeast USA (Day et al., 2007), however, confounding factors could not be ruled out in these field
studies. Nevertheless, these findings, together with ex-vivo results showing negative correlations
with lymphocyte numbers and B-cell proliferative responses (in a population with average blood
mercury of 29 ppb ww) and in-vitro immunosuppressive responses (e.g. suppression of B-cell
proliferation with a no-observed-effect-level (NOEL) of 50 ppb ww in blood), indicate that adverse
effects on sea turtle immune function are possible from elevated exposure to mercury (Day et al.,
2007). These studies also suggest that effects in sea turtles occur at substantially lower
concentrations compared to other vertebrates, including rats and humans; and thus, the sea turtle
immune system may be highly sensitive to Hg toxicity (Day et al., 2007).
Tissue based concentrations of 0.5-6 ppm in various bird eggs are associated with decreased egg
weight, malformations, lowered hatchability, and /or altered behaviour in various species (reviewed
in (NJDEP, 2001)), while acutely poisoned birds usually have whole body mercury levels >20 ppb ww
(UNEP, 2002). In contrast, lethal or harmful effects in marine and terrestrial mammals are reported
at Hg concentrations >25 to 60 ppm ww in kidneys and liver (UNEP, 2002), while sublethal adverse
effects in harp seals were observed at tissue residue concentrations of 47-83 ppm ww (reviewed in
(NJDEP, 2001)). In this respect it is however interesting to note that significantly higher levels of liver
Hg (20 ppm ww) levels were reported in harbour porpoises that died from infectious diseases
compared to uninfected animals (2.3 ppm ww) (reviewed in (Poulsen and Escher, 2012)).
For protection of human consumers, maximum allowed or recommended levels of Hg in fish by
various countries (including Australia) and WHO/FAO range from 0.5 ppm (fish, crustaceans,
molluscs) ww to 1 ppm ww (high trophic fish).
SUMMARY
Overall, these comparisons suggest that green turtles from Gladstone were exposed to elevated
levels of mercury that resulted in blood and tissue levels mostly exceed those reported from green
turtles in Australia or elsewhere. As both blood and tissues are consistent in these results, the data
indicate mercury levels may be chronically elevated, although short term high-level exposure may
also have occurred. While the levels in low trophic, including juvenile, green turtles are expected to
be considerably lower compared to higher trophic species, levels detected in Gladstone specimens
are comparable to those reported from higher trophic loggerhead turtles foraging near known point
sources or in relatively polluted areas. Sensitivity to mercury toxicity is species specific, making it
difficult to predict toxic thresholds for green turtles from the limited available data. Nevertheless,
previous studies suggests that sea turtles may be particularly sensitive to mercury exposure, and
specimens from Gladstone, particularly those with higher mercury blood levels are within the range
of those associated with abnormal haematological markers of health in other green and loggerhead
turtles. These upper concentrations are also within the order of NOEL for immunosuppressive
responses determined ex-vivo for loggerhead turtles. Compared to other relatively sensitive species
(e.g. birds), tissue mercury levels in green turtles from Gladstone are also within the determined

Investigation of contaminant levels in green turtles from Gladstone
54
effect concentrations. These results suggest Hg levels in Gladstone green turtles are sufficiently high
to pose a potential risk of adverse effects in the study population.
Investigation of contaminant levels in green turtles from Gladstone
55
5.3.5 Nickel (Ni)
SOURCES
Nickel is a natural element that occurs at very low levels in the environment, and is essential for the
normal growth of many organisms (Eisler, 1998a; ATSDR, 2005a). It occurs as five stable isotopes,
most commonly in 0 and +2 oxidation states, and interacts with numerous inorganic and organic
compounds. The dominant species in water is Ni2+ in the form of octahedral hexahydrate ion
(Ni(H2O)6)2+) as soluble salts (Ni chloride hexahydrate, and Ni sulphate hexahydrate) and adsorbed to
organic matter (Ni nitrate, Ni hydroxide and Ni carbonate). The fate of Ni in marine and other aquatic
systems is strongly affected by its speciated form, as well as the pH, redox potential, ionic strength,
type and concentration of ligands (Eisler, 1998a). Anthropogenic sources of nickel include ore and
mineral mining, smelting, refining, fossil fuel and waste combustion, processing of iron, steel,
nonferrous metals, and timber products, electroplating, sludge disposal or application, effluents, and
other industries that use, process or manufacture chemicals, gum and wood or carbon black (Eisler,
1998a)
TOXICOKINETICS
Organisms are typically exposed to Ni via ingestion of food or sediments/soils, inhalation or dermal
absorption (Eisler, 1998a). The absorption of Ni is governed by the quantity of exposure and the
forms of Ni. Absorption from the gastrointestinal tract is in the order of 1-10% in humans and
laboratory animals, but higher absorption rates have been found when Ni is taken up via water, in
the absence of food (ATSDR, 2005a). Unabsorbed Ni is rapidly excreted in the faeces, while absorbed
Ni is primarily eliminated via urine (Eisler, 1998a; ATSDR, 2005a). Absorption via the skin has been
observed with an efficiency of 55-77% within 24 hours (Eisler, 1998a; ATSDR, 2005a). Ni retention is
relatively low in mammals with a rapid half-life of only several days (Eisler, 1998a). After absorption,
Ni enters the bloodstream where it is present as free hydrated Ni2+ ions, small and protein
complexes, and as Ni bound to blood cells in mammals. The partitioning among these compartments
varies according to the metal-binding properties of serum albumin, which is highly variable among
species (Eisler, 1998a). Via the bloodstream, Ni is distributed to all organs, but is typically found at
highest levels in the kidneys, although significant levels can also be deposited in liver, heart, lungs
and fat (Eisler, 1998a; ATSDR, 2004).
Nickel does not bioaccumulate to a great extent in animals (ATSDR, 2005a), but accumulation may
occur in some species, and Ni has been observed to increase in various organs with age of terrestrial
and marine mammals (Eisler, 1998b). In mammals, Ni can cross the placental barrier, although this
transfer route may be limited, and trophic position in the food chain, sex and reproductive state
typically do not significantly influence the Ni body burdens (Eisler, 1998a).
Ni levels in blood, as well as serum, plasma and urine provide the most appropriate indices of Ni
exposure; blood rapidly reflects current exposure, peaking within hours after oral exposure but Ni is
rapidly cleared with mean serum half-time of 30-60 hours (Eisler, 1998a; ATSDR, 2005a); thus blood
only reflects the most recent exposure before sampling (within hours to days).

Investigation of contaminant levels in green turtles from Gladstone
56
EXPOSURE CONCENTRATIONS IN GLADSTONE GREEN TURTLES
Ni concentrations in blood of green turtles from Gladstone averaged 5.2 ppb ww (range 0.67-17 ppb
ww). Concentrations of Ni in blood were below the LOQ (<0.1 ppb ww) in adult flatback turtles
collected in 2006 from Port Curtis (Ikonomopoulou et al., 2011), but surprisingly high levels were
reported in blood of live captured and apparently healthy, higher trophic Olive Ridley turtles from
Mexico (average 76 ±35 ppb ww). Normal serum levels for most mammalian animals are in the range
of 2.0-5.3 ppb ww (Eisler, 1998a), while reference Ni levels in human serum are 0.20 ppb ww (ATSDR,
2005a), although values of 3-7 ppb ww have been reported in whole blood (Eisler, 1998a), and
occupationally exposed humans plasma levels can reach >11 ppb ww, but decrease rapidly (Eisler,
1998a).
Kidney of green turtles from Gladstone contained average Ni levels of 9.0 ppm ww (range 0.42-26
ppm ww). These concentrations are 1-2 orders of magnitude higher compared to kidney Ni
concentrations reported from other green turtles (Aguirre et al., 1994; Sakai et al., 2000a; Sakai et
al., 2000b; Lam et al., 2004{Barbieri, 2009 #103; Barbieri, 2009), including Mexico (Talavera-Saenz et
al., 2007), and several fold higher compared to the maximum reported levels (average 1.2; range
0.51-1.7 ppm ww; n=14) from green turtles in the Mediterranean off Turkey (Kaska et al., 2004).
Kidney Ni levels in green turtles from Gladstone are similar to levels considered high in loggerhead
turtles from the Mediterranean off Spain (Torrent et al 2004) while the levels reported for other
loggerhead turtles from Japan (Sakai et al., 1995; Sakai et al., 2000b) and the Mediterranean off
Spain (Kaska et al., 2004) are considerably lower. In contrast to kidney, liver Ni levels in green turtles
from Gladstone (average 0.20; range 0.17-0.23 ppm ww) are an order of magnitude lower compared
to those reported in liver of green turtles from Turkey (Kaska et al., 2004) and Mexico (range <LOQ-
6.8 ppm ww; (Talavera-Saenz et al., 2007)) and similar or slightly higher compared to those reported
for other green turtles from a range of areas, including Oman (average 0.090 ppm ww; (Al-Rawahy et
al., 2007)), Japan (average 0.065; range 0.059-0.071 ppm ww; (Sakai et al., 2000b) and range 0.60-
0.31 ppm ww (Sakai et al., 2000a)), Hong Kong (average 0.059 ppm ww; (Lam et al., 2004)) and Brazil
(average 0.029 ppm ww; (Barbieri, 2009)).
Mammalian wildlife from uncontaminated habitats usually contain less than 0.1 to about 0.5 ppm dw
(or approx. 0.025-0.125 ppm ww) in tissues, while these levels can reach up to 10 ppm dw (or
approx. 2.5 ppm ww) in Ni contaminated areas (Eisler, 1998a). Similar levels are reported from birds
(0.1-2.5 ppm ww in liver from contaminated areas) (Eisler, 1998a) and lower levels are found in
unexposed humans (0.062 ppm dw (or approx. 0.0155 ppm ww) in kidney and 0.005 ppm dw (or
approx. 0.0125 ppm ww) in liver) (ATSDR, 2005a).
TOXICITY AND EFFECTS
Ni is reportedly an essential micronutrient for maintaining health in plants, invertebrates, birds and
mammals, including humans (Eisler, 1998a), although the functional important of Ni has not been
clearly demonstrated (ATSDR, 2005a). Ni deficiency is primarily manifested in the liver with effects
including abnormal liver morphology, oxidative and lipid metabolism, delayed gestation periods and
fewer offspring, decreased growth, anaemia, and dermatitis, (Eisler, 1998a; ATSDR, 2005a).
The toxicity of Ni is strongly dependent on its chemical and physical forms. Soluble Ni forms are more
toxic (e.g. rat single oral dose LD50 = 39 and 136 ppm body weight for Ni sulphate and Ni acetate,

Investigation of contaminant levels in green turtles from Gladstone
57
respectively) than less soluble forms (e.g. rat single oral dose LD50 >3,930 ppm body weight for Ni
oxide) (ATSDR, 2005a). Generally, hazards to human health are lower when ingested, but can be
severe when inhaled with dust, and for some aquatic crustaceans and fish, Ni is more potent at
higher pH (Eisler, 1998a). In addition, mixtures of metals (As, Cd, Cu, Cr, Hg, Pb, Zn) containing Ni
salts have been shown to be more toxic than predicted on the basis of individual components (Eisler,
1998a). The toxic and carcinogenic effects of Ni compounds are associated with Ni mediated
oxidative damage to DNA and proteins and the inhibition of cellular antioxidant defences (Eisler,
1998a). At the cellular levels, Ni interferes with enzymatic functions of calcium, iron, magnesium, and
zinc (Eisler, 1998a). Toxic effects of Ni to humans and laboratory animals are documented for
respiratory, cardiovascular, gastrointestinal, haematological, musculoskeletal, hepatic, renal, dermal,
ocular, immunological, developmental, neurological, and reproductive systems (Eisler, 1998a). The
WHO classifies nickel compounds as Group 1 carcinogens and metallic nickel as Group 2B (possible
human carcinogens) (Eisler, 1998b). The carcinogenicity of Ni compounds, however, varies
significantly with the chemical form, route and duration of exposure and species (Eisler, 1998a). Ni
carbonyl is a potent animal teratogen (Eisler, 1998a).
In birds, adverse effects are expected in most species at kidney and liver concentrations of >10 ppm
dw (approx. 2.5 ppm ww) and >3 ppm dw (approx. 0.75 ppm ww), respectively (Eisler, 1998a). Liver
and kidney of birds fed very high Ni containing diets contained <1.0 ppm ww in survivors, but up to
22.7 ppm ww in liver and 74.4 ppm ww in kidney in those that died (Eisler, 1998a). Reduced growth
rate in chickens fed with high Ni containing diets produced elevated kidney levels of 4.2 ppm ww
versus 0.13 ppm ww in controls (Eisler, 1998a).
In humans, serum Ni levels >4.6 ppb ww and plasma Ni levels >11.9 ppb ww are considered elevated
while less than 2.6 ppb are considered normal (Eisler, 1998a). Workers accidentally exposed to high
Ni levels contained serum concentrations of up to 286 ppb ww one day after exposure in individuals
with symptoms, and 50 ppb in those without symptoms (Eisler, 1998a). However, Ni tissue levels do
not always accurately predict potential health effects from exposure (ATSDR, 2005a).
Rats exposed to high Ni doses, and showing depressed growth, low hematocrit and haemoglobin,
and low tissue cytochrome oxidase had elevated Ni concentrations in kidney (40.7 ppm dw, or
approx. 10 ppm ww) and liver (4.0 ppm dw, or approx. 1 ppm ww) (Eisler, 1998a).
SUMMARY
The Ni concentrations in blood of green turtles from Gladstone are lower compared to levels
reported for other, albeit higher trophic sea turtle species. Considering the rapid clearance rates of
Ni from blood in other organisms blood Ni levels provide information on exposure during the last
hours to days prior to sampling, while kidneys and liver represent Ni exposure days to weeks, or
longer prior to sampling, respectively. Liver Ni levels appear slightly elevated, but are within the
levels observed for green turtles from several other areas. In contrast, kidney Ni concentrations are
1-2 orders of magnitude higher compared to those reported for other green turtles. While there are
no toxicological data for sea turtles, the levels observed in kidney are within the tissue based
concentrations where adverse effects have been reported for birds and rats.
Investigation of contaminant levels in green turtles from Gladstone
58
5.3.6 Selenium (Se)
SOURCES
Se is widely but unevenly distributed in the environment and particularly abundant in sulphide
minerals of various metals, including iron, lead and copper (Eisler, 1985b). It exists as six stable
isotopes, three allotropic forms and five valence states (-2 (selenide), 0 (elemental Se), +2 (selenium),
+4 (selenite) and +6 (selenate), which are commonly combined with other substances. Key
anthropogenic sources are combustion of coal, various industries, municipal wastes, as well as
mining and smelting operations (ATSDR, 2003). Se is primarily obtained as a byproduct of copper
refining, was used as a pesticide to control plant pests, and is today extensively used in the
manufacture and production of e.g. glass, rubber, metal alloys, and petroleum. However, aside from
highly localised contamination, the major source of Se is weathering of natural rock (ATSDR, 2003).
Se tends to be present in large amounts where soils have been derived from cretaceous rocks (Eisler,
1985b).
The fate of Se is highly complex and depends largely on its form and the conditions of the
environment. In the absence of oxygen and in acidic soils, only low amounts of Se enter plants
(ATSDR, 2003). Elemental Se and selenides are insoluble and largely unavailable to the biosphere,
hydrogen selenide is highly toxic and unstable, while soluble selenates occur in alkaline soils, which
are slowly reduced to selenites and may be taken up by plants. Selenites are less soluble and easily
reduced to elemental Se; they are often the dominant chemical species in seawater (Eisler, 1985b)
TOXICOKINETICS
Se is taken up as essential nutrient with food, both as organic (mainly selenomethionine and
selenocysteine) and inorganic (mainly selenate and selenite) forms, but higher than normal levels of
Se can also be taken up via soil/sediment, associated plants or water at naturally high Se sites or
anthropogenically contaminated areas (ATSDR, 2003). Dermal exposure to selenomethionine has
been observed, but there is limited information for other forms (ATSDR, 2003). Se is readily absorbed
in the gastrointestinal tract of humans and laboratory animals, often to >80% (ATSDR, 2003). After
absorption, Se is distributed by the circulatory system to all body organs, the concentrations being
often highest in liver and kidney of mammals (ATSDR, 2003), as well as sea turtles (Anan et al., 2001;
Storelli et al., 2005). However, accumulation depends on the chemical form and exposure levels, and
build up of Se can also occur in blood, lungs, heart, testes, and hair (ATSDR, 2003), as well as
carapace in sea turtles (Komoroske et al., 2011). Se has a relatively short biological life (in the order
of hours or days to weeks) in various organisms (Eisler, 1985b), and elimination occurs primarily in
the urine, but also the faeces, depending on exposure time and level (ATSDR, 2003). However, Se
metabolism is significantly modified by interaction with various heavy metals, other chemicals, and
numerous physico-chemical factors, and it is thus difficult to meaningfully interpret Se residues in
various tissues (Eisler, 1985b).
Se exposure can be measured in blood and urine to provide information on recent exposure to high
levels. The time of exposure reflected by Se blood levels depends on renewal of red blood cells,
which is approximately 120 days in humans (ATSDR, 2003). In sea turtles, Se concentrations in
different tissues are often correlated, for example, blood Se levels were significantly correlated with

Investigation of contaminant levels in green turtles from Gladstone
59
those in liver, kidney and muscle (van de Merwe et al., 2010) as well as with those in eggs (Guirlet et
al., 2008).
Se concentrations in mammals are often also correlated with those of other metals, particularly Hg,
As and Cd. Similar results have been observed for sea turtles (Komoroske et al., 2011), including in
green turtles of this study (p<0.05 for As, Cd, Co, Hg, Mo). This may be the result of Se playing a role
in various metal detoxification processes, as has been observed in other species.
While Se is typically eliminated rapidly from the body, it can accumulate with age to elevated levels
under long or high exposure regimes (ATSDR, 2003), particularly in higher trophic, long-lived, marine
vertebrate species (Eisler, 1985b). However, chronically ill and older people have been shown to
have lower organ concentrations of selenium than healthy individuals, although it is not clear if this is
a cause or consequence of aging or illness (ATSDR, 2003). In green turtles, Se has been observed to
be significantly negatively correlated with size (Komoroske et al., 2011), but positive correlations
have been reported for hawksbill turtles (Anan et al., 2001). There is evidence that Se biomagnifies in
the food chain and maternal transfer has been demonstrated for Se in humans and various animals
(ATSDR, 2003) including turtles (Guirlet et al., 2008).
EXPOSURE CONCENTRATIONS IN GLADSTONE GREEN TURTLES
Blood Se levels in Gladstone green turtles averaged 1900 (range 84-8600) ppb ww. These
concentrations are high compared to those considered normal in other animals or humans, but
similar levels (average 2400; range 68-9100 ppb ww) have been reported from moribund green
turtles in southeast Queensland (van de Merwe et al., 2010), as well as apparently healthy green
turtles from two areas in Mexico (average 1600 and 1800; range 30-5700 and 150-4700 ppb ww,
respectively) (Labrada-Martagón et al., 2011). Lower Se concentrations were reported in green
turtles from San Diego bay in the USA (average 780 ±250 ppb ww) (Komoroske et al., 2011).
In blood of herbivorous and omnivorous Amazon river turtles, average Se levels ranged from 164 to
538 ppb ww (Burger et al., 2009). Despite their higher trophic levels, typical Se blood levels in
humans range from 59 (New Zealand) to 210 (USA) ppb ww (ATSDR, 2003), and blood Se levels of
>40-50 ppb are recommended for cattle and sheep to avoid Se deficiency (Eisler, 2007).
In liver and kidney from three necropsied green turtles from Gladstone, Se concentrations averaged
5.4 (range 4.0-7.2) and 1.3 (range 0.62-2.4) ppm ww, respectively. Respective blood Se levels in these
animals were below the average in two of these specimens (850 ppb ww) and above the average in
the third individual (3,300 ppb ww). Similar to blood, Se levels in kidney and liver are comparable to
the upper ranges observed in other green turtles. For example, similar or higher Se concentrations
have been reported in kidney and liver of moribund green turtles from southeast Queensland
(average 1.7, range 0.29-5.1 and average 4.0, range 0.52-10 ppm ww, respectively) (van de Merwe et
al., 2010), stranded specimens from Japan (average 1.0, range 0.41-2.1 and average 1.6, range 0.62-
3.1 ppm ww, respectively) (Anan et al., 2001) and stranded specimens from the Mediterranean
(average 0.94, range 0.31-1.4 and average 2.3, range 0.22-4.2 ppm ww, respectively) (Kaska et al.,
2004), as well as Hong Kong (average 0.71 and 5.6 ppm ww, respectively) (Lam et al., 2004). The
remaining reported average Se levels in kidney and liver of green turtles are, however, 2-3 (kidney)
and 3-24 (liver) fold lower. These include samples collected from Australia (e.g. Moreton Bay (Gordon
Investigation of contaminant levels in green turtles from Gladstone
60
et al., 1998) and Torres Strait (Gladstone, 1996)), Hawaii (Aguirre et al., 1994), and Oman (Al-Rawahy
et al., 2007).
Corresponding with the potential for Se to biomagnify through the food chain, higher Se levels have
been reported from higher trophic hawksbill turtles from Japan (average of 5.5 and 15 ppm ww in
liver and kidney, respectively) (Anan et al., 2001), however, hawksbill turtles from Moreton Bay in
Australia contained Se levels comparable to green turtles from Gladstone (maximum 2.5 and 3.7 ppm
ww, respectively) (Gordon et al., 1998). Similarly, Se levels in kidney and liver of carnivorous
loggerhead turtles from Moreton Bay and the Mediterranean were similar or lower compared to
green turtles from Gladstone (e.g. average kidney Se levels: 1.5 and 0.93, average liver Se levels: 2.2
and 2.8, respectively). Mean concentrations of Se in kidneys of coastal birds from highly
industrialised areas in Texas, usually vary between 1.7 and 5.6 ppm ww; these concentrations are
considered sufficient to possibly impair reproduction in shorebirds (Eisler, 1985b), but levels higher
than 2 ppm ww have often been recorded in liver and kidney from higher trophic marine and coastal
vertebrates, including birds and mammals (Eisler, 1985b), and Se appears to readily accumulate to
elevated levels in reptiles (Grillitsch and Schiesari, 2010).
TOXICITY AND EFFECTS
Se is an essential micronutrient for humans and many animals, but can be harmful at levels not much
higher than those considered beneficial (Eisler, 1985b). It constitutes an integral part of important
proteins involved in antioxidant defense mechanisms (e.g. glutathione peroxidases), the thyroid
hormone metabolism and redox control of intracellular reactions (ATSDR, 2003). Similar to
vertebrates, it has been suggested that Se similarly plays a pivotal role at the beginning of embryonic
development in reptiles, whereby Se might affect the activation, synthesis and release of thyroid
hormones (Guirlet et al., 2008).
Se deficiency may in part underlie susceptibility to cancer, arthritis, hypertension, heart disease, and
possibly other diseases, including high embryonic mortality, anemia, poor growth and reproduction,
hepatic necrosis, hair loss and sterility (Eisler, 1985b; ATSDR, 2003). On the other hand, exposure to
Se above its beneficial levels can affect growth and reproduction in various organisms (Eisler, 1985b),
and may cause cancer (ATSDR, 2003). Acute poisoning can result in nausea, vomiting and diarrhea in
humans (ATSDR, 2003), and a range of symptoms have been observed in livestock (e.g. abnormal
movements, laboured breathing, bloating, lethargy and death), with post-mortems indicating many
pathological changes in the heart, lungs, rumen, liver, kidney and other organs (Eisler, 1985b).
Chronic selenosis may be induced by dietary Se levels 10-20 times the norm (ATSDR, 2003); signs
include skin lesions, lymph channel inflammation, loss of hair and nails, anaemia, enlarged organs,
fatigue, and dizziness (Eisler, 1985b). Chronic doses around 5 times higher the norm may cause
cardiovascular, gastrointestinal, haematological, hepatic, dermal, immunological, neurological and
reproductive effects (Eisler, 1985b).
A wide variety of interactions of Se have been demonstrated with essential and nonessential
elements, vitamins, and xenobiotics, including reduction of toxicity of many metals such as Hg, Cd,
Pb, Ag and to some extent, Cu. The degree to which Se is toxic, however, can be influenced by these
interactions, but they are complex and still poorly understood (ATSDR, 2003).
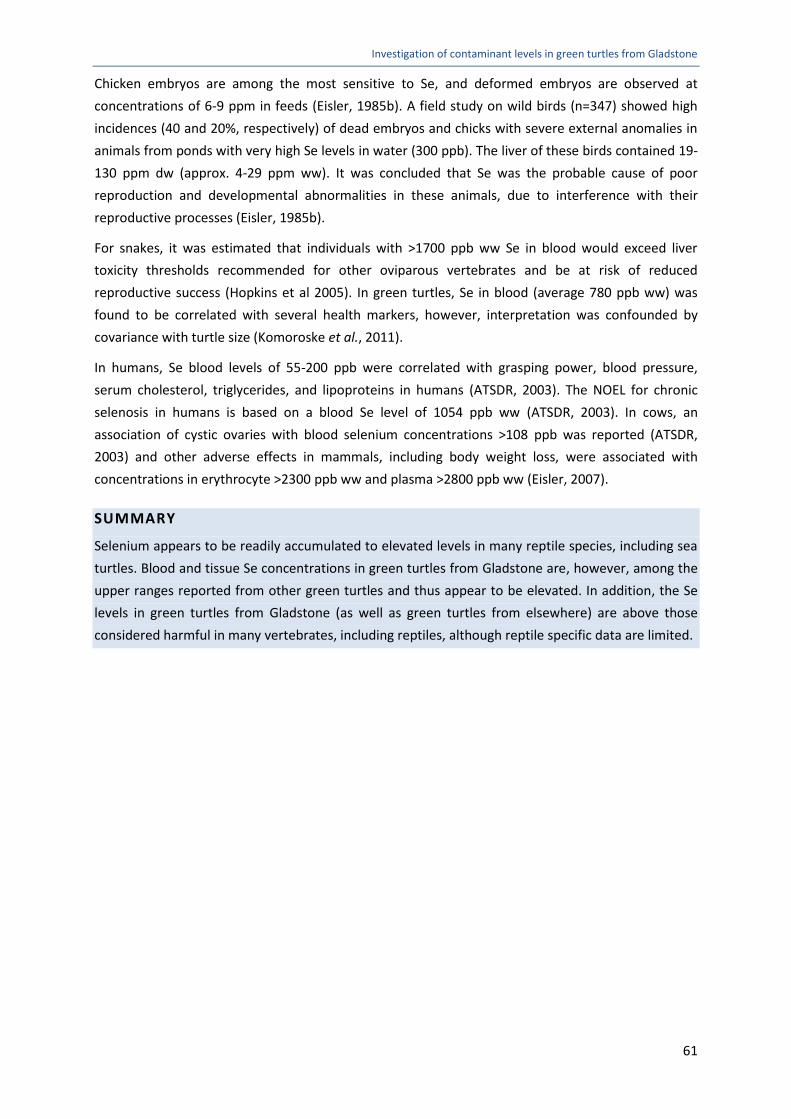
Investigation of contaminant levels in green turtles from Gladstone
61
Chicken embryos are among the most sensitive to Se, and deformed embryos are observed at
concentrations of 6-9 ppm in feeds (Eisler, 1985b). A field study on wild birds (n=347) showed high
incidences (40 and 20%, respectively) of dead embryos and chicks with severe external anomalies in
animals from ponds with very high Se levels in water (300 ppb). The liver of these birds contained 19-
130 ppm dw (approx. 4-29 ppm ww). It was concluded that Se was the probable cause of poor
reproduction and developmental abnormalities in these animals, due to interference with their
reproductive processes (Eisler, 1985b).
For snakes, it was estimated that individuals with >1700 ppb ww Se in blood would exceed liver
toxicity thresholds recommended for other oviparous vertebrates and be at risk of reduced
reproductive success (Hopkins et al 2005). In green turtles, Se in blood (average 780 ppb ww) was
found to be correlated with several health markers, however, interpretation was confounded by
covariance with turtle size (Komoroske et al., 2011).
In humans, Se blood levels of 55-200 ppb were correlated with grasping power, blood pressure,
serum cholesterol, triglycerides, and lipoproteins in humans (ATSDR, 2003). The NOEL for chronic
selenosis in humans is based on a blood Se level of 1054 ppb ww (ATSDR, 2003). In cows, an
association of cystic ovaries with blood selenium concentrations >108 ppb was reported (ATSDR,
2003) and other adverse effects in mammals, including body weight loss, were associated with
concentrations in erythrocyte >2300 ppb ww and plasma >2800 ppb ww (Eisler, 2007).
SUMMARY
Selenium appears to be readily accumulated to elevated levels in many reptile species, including sea
turtles. Blood and tissue Se concentrations in green turtles from Gladstone are, however, among the
upper ranges reported from other green turtles and thus appear to be elevated. In addition, the Se
levels in green turtles from Gladstone (as well as green turtles from elsewhere) are above those
considered harmful in many vertebrates, including reptiles, although reptile specific data are limited.

Investigation of contaminant levels in green turtles from Gladstone
62
5.3.7 Silver (Ag)
SOURCES
Silver is a naturally but relatively rare occurring element. It exists in several oxidation states, most
commonly as elemental Ag (0) and monovalent ion (+1). Silver is extracted mainly from argentite ore
(by cyanide, zinc reduction, or electrolytic processes), and is often recovered as byproduct from
smelting of nickel ores, lead-zinc and porphyry copper ores, platinum and gold deposits (Eisler, 1996).
Secondary sources include scrap generated in the manufacture of silver containing products and
electrical products, old film and photoprocessing wastes or batteries. Elevated silver concentrations
in biota can occur in the vicinity of sewage outfalls, mine waste sites, smelting operations,
manufacture and disposal of photographic and electrical supplies and coal combustion (Eisler, 1996;
Howe and Dobson, 2002). Major anthropogenic releases to the aquatic environment include mining
tails, soil erosion, urban runoff, sewage treatment plants and electroplating industries (Eisler, 1996).
The fate of Ag in soils, sediments and water is controlled mainly via sorption processes, and
sediments may be a significant source of Ag to the water column. Ag can be highly persistent in
sediments under high pH and salinity conditions (Howe and Dobson, 2002). In water, Ag exists mainly
as metallo-organic complexes or adsorbed to organic materials, including marine algae, which have
been shown to have high bioconcentration factors (commonly up to 66,000) (Eisler, 1996). With
increasing salinity in brackish and marine waters, sorption to particles decreases and concentrations
of chloro complexes (e.g. silver chloride (AgCl), silver chloride ion (AgCl2-)) increases, which retain
some silver in the dissolved form. Thus, relatively small inputs can substantially increase dissolved Ag
loads in these environments (Eisler, 1996).
TOXICOKINETICS
Organisms can be exposed to Ag via inhalation and ingestion, but Ag can also move across mucous
membranes and broken skin (Eisler, 1996). After exposure, Ag is mainly transported in the protein
fraction of blood plasma as silver albuminate or silver chloride (Eisler, 1996). Accumulation, retention
and elimination of Ag differ widely among species. In general, the majority of Ag is excreted rapidly
(in the order of hours to days/weeks) in faeces with <1% of intake absorbed and retained in tissues,
primarily the liver, via precipitation of insoluble silver salts. But Ag may also accumulate in the
spleen, muscles, kidney, skin and brain (Eisler, 1996). Tissue concentrations of Ag are related to the
dose, chemical form and route of exposure. Intestinal absorption in rodents, canids and primates
range from 10-50% (ATSDR, 1990).
Blood is an appropriate marker for recent Ag exposure (over days to weeks) prior to sampling
(ATSDR, 1990). Silver has been shown to bioaccumulate in mammalian tissues (Eisler, 1996), but food
chain biomagnification in aquatic systems is not considered likely at background concentrations
(Eisler, 1996).
EXPOSURE CONCENTRATIONS IN GLADSTONE GREEN TURTLES
Ag concentrations in blood of green turtles from Gladstone ranged from 0.011 to 7.1 ppb ww
(average 0.66 ppb ww), although the majority of blood samples contained Ag levels <2.0 ppb ww.
The only identified published data on Ag in blood of green turtles reported approximately two times

Investigation of contaminant levels in green turtles from Gladstone
63
higher average Ag levels (1.6 ppb ww (±0.53 SE; n=30)) from a highly urbanised and generally
contaminated estuary in San Diego (Komoroske et al., 2011). In Kemp’s ridley sea turtles, however,
average blood Ag levels were reported at 0.94 (range 0.042-2.7) ppb ww (Kenyon et al., 2001). In
humans, blood Ag levels in unexposed humans are very low (<0.1-0.2 ppb (Armitage et al., 1996)). In
highly and chronically exposed humans (chemical manufacturing workers) average blood Ag levels
were 11 ppb ww (ATSDR, 1990) and 0.1-23 ppb ww (Armitage et al., 1996).
Relatively high concentrations of Ag were observed in liver of green turtles from Japan (0.99 ppm
ww; 0.21-2.9 ppm ww); kidney contained considerably lower levels (0.0057 ppm ww; 0.00059-0.023
ppm ww) (Anan et al., 2001). Similar levels were reported from liver and kidney of green turtles from
South China (0.78 ±0.65 SE and 0.0070 ±0.0030 SE ppm ww, respectively) (Lam et al., 2004). In the
present study, Ag could not be analysed in tissues of green turtles due to matrix interferences.
Normal background levels in liver of most organisms are generally several orders of magnitude lower
compared to those reported for green turtles from Japan and China (e.g. 0.0044-0.14 ppm ww in
various birds, 0.006 ppm ww in humans, 0.16-0.21 in seals and polar bear ppm ww) (Eisler, 1996).
Maximum concentrations, collected from contaminated areas, range from approximately 0.33 ppm
ww in liver of marine mammals, 0.44 ppm ww in trout liver, 9.7 ppm ww in bird liver (Eisler, 1996;
Howe and Dobson, 2002).
TOXICITY AND EFFECTS
Silver has no known biological function in the body of mammals, and is (as Ag+) one of the
toxicologically most potent metals to aquatic organisms (Eisler, 1996). The acute toxicity to aquatic
species varies depending on the chemical form and correlates with the availability of free ionic silver
Ag+, which is the most toxic species (Eisler, 1996). Soluble silver salts are in general more toxic than
insoluble salts, and in water, the soluble ion Ag+ is the form of most concern. More recently toxicity
of silver nanoparticles has become an issue of concern because nano silver is widely a applied
antibacterial in consumer products. The toxic species of nano silver is also the Ag+, which is set free
intracellularly from the ingested nanoparticles.
Long-term, chronic exposure to silver and its compounds by birds and mammals have been
associated with induction of sarcomas, cardiac enlargement, vascular hypertension, hepatic necrosis,
anemia, lowered immunological activity, altered membrane permeability, kidney pathology, enzyme
inhibition, and growth retardation (Eisler, 1996). In aquatic environments ionic or free Ag have been
shown to interfere with calcium metabolism in frogs (resulting in deterioration of muscle fibres) and
with sodium and chloride uptake in gills of fish (Eisler, 1996).
There is limited data on the toxic threshold of Ag in avian or mammalian wildlife, and no information
for reptiles. Adverse effects of Ag on poultry occur at 1.8 ppm ww (whole egg), 10 ppm ww in
copper-deficient diets and 200 ppm ww in copper adequate diets (Eisler, 1996). Death in sensitive
mammalian species occurs at 14-20 ppm body weight (intraperitoneal injection).
SUMMARY
The average blood Ag levels in Gladstone green turtles are similar or lower compared to other green
turtles (from relatively contaminated areas) and sea turtles. However, some individuals from
Gladstone contained higher levels of Ag. Considering data from other organisms, the blood Ag

Investigation of contaminant levels in green turtles from Gladstone
64
concentrations in some green turtles from Gladstone may be above background, however, normal
background levels in sea turtles are unknown. No blood based Ag effect concentrations were
identified in the literature and only few tissue based effect levels are available. However, Ag could
not be quantified in tissues of the present study. Considering the limited comparable data for blood
in marine turtles, and lack of blood based effect levels, it is not possible to assess whether exposure
to Ag presents a hazard to the study population, but some individuals may contain levels that are
elevated.

Investigation of contaminant levels in green turtles from Gladstone
65
5.3.8 Vanadium (V)
SOURCES
Vanadium is a naturally occurring element present in soil, water and air (ATSDR, 2009). It most
commonly exists in the oxidation states of +3, +4 and +5 and various inorganic forms, e.g., vanadium
pentoxide (V2O5), sodium metavanadate (NaVO3), sodium orthovanadate (Na3VO4), vanadyl sulphate
(VOSO4), and ammonium vanadates (NH4VO3). V is found mostly in fossil fuel such as coal, oil shale,
tar sands and crude oil and in numerous minerals such as bauxite and magnetite. Releases of V to the
environment are primarily associated with oil refineries and power plants via combustion of
petroleum crude oils and coal, and may also occur from mining, clay and metallurgical industries,
municipal sewage and fertilisers (ATSDR, 2009). Upon entering the marine environment the main
fraction of V is deposited and adsorbed to sediments and only a small fraction (0.001%) is estimated
to persist in soluble form (Byerrum et al., 1974).
TOXICOKINETICS
Key pathways for marine organism exposure to vanadium are ingestion of soil/sediments and food.
After oral exposure, only a small fraction of vanadium is absorbed through the gastrointestinal tract
of animals (up to 17% in laboratory animals; approx. 3-20% in humans) (Costigan et al., 2001).
Dermal adsorption is thought to be minimal due to the low lipid/water solubility of vanadium.
Vanadium is distributed in blood and primarily to bone tissue with lesser amounts to kidney and liver
(Costigan et al., 2001). Blood, as well as organ concentrations have been found to decline rapidly to
trace levels within days upon cessation of exposure in mammals (ATSDR, 2009), via urine as the
primary elimination route (Costigan et al., 2001). Reported elimination half-lives in various tissues
and organisms are in the order of 1-14 days (ATSDR, 2009) (Costigan et al., 2001) (Miramand et al.,
1992). There is no evidence of long-term accumulation in humans or marine organisms and food
chains (Costigan et al., 2001). Bioconcentration factors for primary consumers in the marine food
chain have been reported to range from 40 to 150 (Miramand et al., 1992; Costigan et al., 2001).
Considering the toxicokinetics of vanadium in organisms, blood and urine are the most reliable
indicators on the level of exposure in mammals and fish (Costigan et al., 2001). Based on the
relatively rapid clearance of V from blood (in the order of days), V blood levels inform on recent
exposure regimens.
EXPOSURE CONCENTRATIONS IN GLADSTONE GREEN TURTLES
Vanadium concentrations in blood of green turtles from Gladstone ranged from 3.5 to 38 ppb ww
with an average concentration of 12 ppb ww (SD 9.1). No published data is available on vanadium in
blood of any sea turtle species, however, average levels are approximately 4 times lower in blood
from live captured green turtles in Moreton Bay (average 2.8; 0.29-8.5 ppb) (unpublished data from
2011; n=9). Compared to levels in human blood (average background: <0.05 ppb ww; (Byrne and
Kosta, 1978; Sabbioni et al., 1996; Nixon et al., 2002), these concentrations would be considered
elevated, and are in the order of those observed for occupationally exposed cohorts (average 33 ppb
ww) (Lin et al., 2004). However, marine organisms, including plants, invertebrates and seafood
generally contain higher levels of vanadium than their terrestrial counterparts (Costigan et al., 2001),
although reports on concentrations in blood from marine species are limited and background levels

Investigation of contaminant levels in green turtles from Gladstone
66
for turtles are unknown. The maximum levels present in green turtles from Gladstone compare to
the maximum V levels reported in blood from ospreys from relatively polluted Chesapeake Bay and
Delaware Bay (range <ND to 0.49 ppm dw or approx. 54 ppb ww) (Rattner et al., 2008; Eisler, 2010).
To facilitate further comparisons, liver and kidney (in addition to blood) were analysed from three
euthanized green turtles from Gladstone. Vanadium levels in these tissues (0.23-0.79 ppm ww in liver
and 0.23-0.34 ppm ww in kidney) are comparable to those in stranded or moribund green turtle liver
and kidney from Hawaii and Japan, while approximately one order of magnitude lower V levels were
reported in liver and kidney of stranded green turtles from Hong Kong and hawksbill turtles from
Japan. These levels are several orders of magnitude higher than typical levels in meat, poultry and
fish (around 0.1 ppt; range 0-11.9 ppt)(ATSDR, 2009) as well as those typically found in most marine
organisms (generally in the order of ppb (Michibata, 2012), <0.01 ppm ww in marine mammals
(Mackey et al., 1996) or fish (2.9-74 ppb ww; (Sepe et al., 2003; ATSDR, 2009). Liver tissue
concentrations in turtles are, however, comparable to chronically elevated liver concentrations in
common dolphins affected by high vanadium release via the Erika oil spill off the coast of France in
2000 (average 0.11; range 0.01-0.32 ppm ww, (Ridoux et al., 2004)), and approach the highest V
concentrations recorded in some marine mammals (up to 1.6 ppm ww in liver of harbour seal (Saeki
et al., 1999; Eisler, 2010).
TOXICITY AND EFFECTS
Although there is some evidence to suggest that vanadium is an essential nutrient, a functional role
has not been established. It acts as phosphate analogue and as such interferes with various ATPases,
phosphatises and phosphate-transfer enzymes; additionally, it has been shown to have insulin-
mimicking properties and the ability to induce cell proliferation, and IARC classifies vanadium
pentoxide as possibly carcinogenic (Group 2B) (IARC, 2009). Primary targets of toxicity following oral
vanadium exposure include the gastrointestinal tract, haematological system and developing
organism. Depending on the dose, effects in humans and laboratory animals exposed to vanadium
can include decreased number of red blood cells, increased blood pressure, diarrhoea, neurological
effects (e.g. decreased fetal growth, skeletal malformations) and lung cancer (through vanadium
pentoxide). Clinical signs of toxicity include lethargic behaviour, paralysis, lacrimation and diarrhoea,
and histological examination revealed necrosis of liver cells and cloudy swelling of renal tubules (Yao
and Zhang, 1986; Costigan et al., 2001).
In birds, liver V levels approaching 0.5 ppm ww have been suggested to alter lipid metabolism in
laying females (White et al., 1980; Eisler, 2010). Similarly, V concentrations of around 0.4 ppm ww
(whole body) have been reported to elicit effects in fish (reduced growth in juvenile rainbow trout)
(Hilton and Bettger, 1988). In mammalian species, Lethal Doses (LD50) for sodium metavanadate
range from 10-137 (rats) to 23-31 (mice) ppm/day (oral; 14 days) (Llobet and Domingo, 1984; Sun,
1987; Costigan et al., 2001; ATSDR, 2009). Minimal risk levels (MRLs) have been established for oral
exposure to vanadium (e.g. intermedium duration (15-364 days) exposure oral MRL: 0.01 ppm/day).
SUMMARY
Considering V levels reported for sea turtles, and other wildlife and organisms, the concentrations
detected in green turtles from Gladstone appear to be relatively high in blood, although information

Investigation of contaminant levels in green turtles from Gladstone
67
on baseline levels in sea turtles are lacking. Tissue levels of green turtles from Gladstone are within
or near the upper ranges reported from other green turtles and other marine wildlife. The levels
present in blood from green turtles in Gladstone may indicate relatively recent exposure to elevated
levels in food/sediment and/or water, but species specific toxicokinetics (e.g. absorption, long half-
lives, bioaccumulation) are unknown. While limited information exists on tissue based effect
concentrations across any species, and none is available for reptiles, the V tissue levels in green
turtles from Gladstone are similar to those shown to elicit adverse effects in other wildlife (birds,
fish).
Investigation of contaminant levels in green turtles from Gladstone
68
5.3.9 Zinc (Zn)
SOURCES
Zinc is among the most common elements and is naturally present in air, soil, water and food. It
occurs as two common oxidation states (Zn(0) and Zn(+2)). A large proportion of zinc also enters the
environment as a result of mining, purification of zinc, lead, and cadmium ores, steel production, coal
burning, and burning of wastes (ATSDR, 2005b). Waste streams from metal manufacturing and zinc
chemical industries, domestic waste-water and run-off from soil can discharge zinc into waterways.
Sludge and fertilisers can also contribute to increased zinc levels in soil (ATSDR, 2005b).
Zinc can combine with other elements, such as chlorine, oxygen, and sulfur to form organic or
inorganic zinc compounds. In the aquatic environment, zinc occurs primarily in the +2 oxidation state,
as the hydrated form of the divalent cation. Sorption is the dominant reaction, resulting in
enrichment of zinc in suspended and bed sediments. However, a small proportion may remain either
dissolved in the water or suspended with sediments. The levels of dissolved zinc in water can
increase with the acidity of the water (ATSDR, 2005b).
TOXICOKINETICS
The major zinc exposure pathways for organisms are ingestion of food and contaminated
soils/sediments, although exposure via water is a key pathway for fish and other organisms may be
exposed via drinking water; inhalation exposure may also occur in contaminated areas (ATSDR,
2005b). Dermal exposure can occur, but absorption studies are limited (ATSDR, 2005b). Absorption
of zinc from the gastrointestinal tract is homostatically regulated and ranges from 20 to 30% under
normal physiological conditions (ATSDR, 2005b). A number of factors can influence the absorption,
including the chemical form of zinc, the presence of inhibitors (e.g. calcium, phosphorus, dietary
fiber) and enhancers (amino acids, picolinic acid) in the diet. After absorption, zinc increases most
rapidly in blood (peaking within hours) and bone after exposure. In an initial phase after absorption,
zinc is concentrated in the liver, and subsequently distributed throughout the body with major
storage sites being the liver, pancreas, bone, kidney and muscle (ATSDR, 2005b). Highest
concentrations are typically present in muscle, bone, gastrointestinal tract, kidney, brain, and skin.
Elimination is predominantly via the urine and feces.
Zinc concentrations in humans increase in several organs with age, including the liver and kidney,
although levels in the kidneys peak at approximately 40-50 years of age and then decline. Zinc does
not concentrate in fish tissues with exposure to elevated concentrations (ATSDR, 2005b) and has not
been observed to biomagnify in reptiles (Grillitsch and Schiesari, 2010).
Blood is a commonly used marker for recent zinc exposure (ATSDR, 2005b). In mammals,
approximately two-thirds of zinc in plasma is loosely bound to albumin, which represents the
metabolically active pool of zinc (ATSDR, 2005b). However, since zinc levels can be affected by
dietary deficiency and cell stress, these result may not be directly related to current zinc exposure
(ATSDR, 2005b; Eisler, 2010).

Investigation of contaminant levels in green turtles from Gladstone
69
EXPOSURE CONCENTRATIONS IN GLADSTONE GREEN TURTLES
Zn blood levels in turtles from Gladstone averaged 8,400 ppb ww (range 3,800-12,000 ppb ww).
Similar, or higher levels have been observed in blood of green turtles from Mexico (average 14,000;
range 490-20,000 ppb ww) (Labrada-Martagón et al., 2011), moribund specimens from southeast
Queensland (average 7,900; range 3,500-12,000 ppb ww) (van de Merwe et al., 2010) and
leatherback turtles from French Guiana (average 11,000 ppb ww) (Guirlet et al., 2008). Similarly high
Zn levels were also reported in blood of Kep’s ridley sea turtles from the Gulf of Mexico (average
7,500; range 3,280-18,900 ppb ww) (Grillitsch and Schiesari, 2010). In contrast, Zn levels in blood of
flatback turtles from Curtis Island were considerably lower (average 150; range 98-210 ppb ww)
(Ikonomopoulou et al., 2011).
Substantially lower mean Zn concentrations are typically reported in whole blood of humans from
regions with low pollution (6.0-7.0 ppb ww), while up to 4,000 ppb ww were have been detected in
whole blood of children in highly industrialised urban areas of India (ATSDR, 2005b).
In kidney and liver of turtles from Gladstone, Zn concentrations averaged 33 and 46 ppm ww (range
20-40 and 41-51 ppm ww), respectively. While these levels lay within the upper ranges of those
reported previously from sea turtles, they are comparable to stranded specimens in Moreton Bay
(average 21 and 40 ppm ww in kidney and liver, respectively) (Gordon et al., 1998), and moribund
specimens from southeast Queensland (average 29 and 36 ppm ww, respectively) (van de Merwe et
al., 2010). Similar Zn levels in kidney and liver have also been reported for several other green turtles
around the world, e.g. Japan (average 34 and 58 ppm ww, respectively) (Sakai et al., 2000a), a
captive specimen from Hawaii (32 and 38 ppm ww, respectively) (Aguirre et al., 1994), and
specimens from Hong Kong (average 17 and 28 ppm ww, respectively ) (Lam et al., 2004).
Zn concentrations in marine birds from New Zealand are typically around 88 ppm ww in liver.
Elevated Zn liver levels of 890 ppm dw (approx. 220 ppm ww) have been reported in liver of heron
from Rhode Island (Eisler, 2010). Mallards exposed to high levels of zinc 450 ppm body weight
contained 217 ppm dw (approx. 54 ppm ww) in liver and 79 ppm dw (approx. 20 ppm ww) in kidney
(Eisler, 2010). Zn concentrations in tissues of marine mammals are usually less than 210 ppm dw
(approx. 53 ppm ww), but can range from 1.5-1390 ppm dw (or approx. 0.38-348 ppm ww). In human
kidney and liver, background zinc levels are typically around 47 and 23 ppm ww, respectively. In
exposed people, kidney and liver levels of 60 and 30 ppm ww, respectively, have been reported.
TOXICITY AND EFFECTS
Zinc is a trace mineral nutrient, and required in all animals for the function of several
metalloenzymes, and as such is required for normal nucleic acid, protein, and membrane
metabolism, as well as cell growth and division. Zinc deficiency can cause dermatitis, anorexia,
growth retardation, impaired reproductive capacity, impaired immune function, and depressed
mental function (ATSDR, 2005b).
Chronic exposure to zinc has been shown to decrease the absorption of copper from the diet,
resulting in development of copper deficiency. At low doses and intermediate exposure durations,
subclinical changes in copper-sensitive enzymes can occur. Higher exposure levels result in more
severe symptoms of copper deficiency, including anaemia, and lesions in liver, pancreas and kidneys,

Investigation of contaminant levels in green turtles from Gladstone
70
infertility, developmental effects and skin irritations (ATSDR, 2005b). Oral exposure to zinc may also
impair immune and inflammatory responses (ATSDR, 2005b).
The oral LD50 in rats and mice for several zinc compounds range from 186 to 623 ppm/day (ATSDR,
2005b). Zinc acetate was the most lethal compound in these laboratory animals, respectively.
Zn blood serum levels of 45,000 ppb were reported in a crocodile diagnosed with zinc poisoning;
blood Zn levels dropped to 30,000 ppb after 18, and to 4,000 ppb after 39 days of treatment (Eisler,
2010). Similarly, Zn poisoned birds frequently contain 16,000 ppb in plasma and 75-156 ppm dw
(approx. 19-39 ppm ww) in liver, versus <2 ppb and 21-33 ppm dw (approx. 5.3-8.3 ppm ww) in
controls, respectively (Eisler, 2010). Tissue residues of Zn are not yet reliable indicators of
contamination in mammals, although Zn intoxication is documented in terrestrial mammals when Zn
exceeds 274 ppm dw (approx. 68 ppm ww) in kidney, and 465 ppm dw (appox 116 ppm ww) in liver
(Eisler, 2010). Comparable data for marine mammals could not be identified, and zinc concentrations
in marine mammals frequencly exceed 100 ppm ww without apparent damage to the animal (Eisler,
2010)
SUMMARY
The Zn levels in green turtles from Gladstone generally lay within the upper ranges, but are
comparable to those reported for several other sea turtles from around the world. On the other
hand, levels associated with Zn poisoning in crocodiles, birds or mammals are only slightly higher
compared to the maximum concentrations detected in Gladstone green turtles, and chronic effect
levels are unknown. However, it appears that sea turtles frequently accumulate elevated levels of Zn,
and it is not possible to assess whether this may be a concern to these populations.

Investigation of contaminant levels in green turtles from Gladstone
71
5.3.10 Dioxins and PCBs
SOURCES
Polychlorinated dibenzo-p-dioxins (PCDDs) and polychlorinated dibenzofurans (PCDFs) comprise two
different groups of tricyclic, aromatic ethers with 210 possible congeners. PCDD/Fs are produced as
unintentional by-products of various combustion and industrial processes, e.g. during pesticide
manufacture, bleaching of paper pulp and waste incineration. In addition, current-use pesticides may
contain elevated levels of dioxins as impurities (Holt et al., 2010). Dioxins are released from these
sources as complex mixtures and while each congener has slightly different physico-chemical
properties, all PCDD/Fs display high lipophilicity and chemical stability (Mackay et al., 2006).
Polychlorinated biphenyls (PCBs) are thermally stable, good insulators, and are relatively
inflammable; hence they have been used widely as flame retardants, lubricants, coolants, and as
dielectric fluids (NAS, 2001; EC, 2006). Intentional manufacture of PCBs has ceased in many parts of
the world; however, PCBs remaining within stock piles still have the potential to enter the
environment. Commercial PCB sources consist of complex mixtures of individual PCBs (up to 209
congeners), resulting in complex mixtures of these lipophilic compounds in the environment.
The spatial distribution of PCCD/Fs and PCBs is related to the source location, type of emission
source, physico-chemical properties and environmental processes. These compounds have the
potential for dispersal throughout the environment, usually in association with mobile particles such
as organic matter, for example via atmospheric transport or with river systems (Eitzer, 1993; Pearson
et al., 1997; Gaus et al., 2001). Consequently, dioxins and PCBs can be found at trace levels in most
environmental matrices (air, soil and water) (Wagrowski and Hites, 2000), and in particular, are
known to accumulate in the marine system.
TOXICOKINETICS
Generally, exposure to PCDD/Fs and PCBs occurs mainly via ingestion. For herbivorous marine
turtles, contaminated seagrasses, as well as incidental consumption of sediment bound PCDD/Fs and
PCBs, represent the dominant uptake routes (Haynes et al., 1999; Gaus et al., 2004). After exposure,
these highly lipophilic compounds can be found in most tissues with the highest quantities in the
liver and fat (adipose tissue). Although some elimination can occur via faeces and to a lesser extent
urine, body fat and possibly the liver can store PCDD/Fs and PCBs for years to decades (ATSDR, 1998,
2000).
Absorption efficiency of PCDD/Fs and PCBs across the gastrointestinal tract vary depending on the
physico-chemical properties of the congeners and generally increases with decreasing degree of
chlorination (Niimi, 1996). The smaller congeners tend to be the more toxic congeners, and their
accumulation can lead to increased tissue toxicity levels compared to surrounding sediments
(Broman et al., 1992). Concentrations of mixtures of PCDD/Fs and PCBs are commonly reported on a
toxic equivalency (TEQ) basis. Toxic equivalence factors (TEF), relative to the toxicity of tetra-dioxin
(TCDD), have been assigned to 17 PCDD/F congeners and 12 PCBs. TEFs are not available for reptiles,
and assessments for turtles rely on TEFs determined for mammalian and avian species.

Investigation of contaminant levels in green turtles from Gladstone
72
Due to their lipophilicity and resistance to metabolism, PCDD/Fs and PCBs can bioaccumulate in
biota, biomagnify through the food web, and transfer to offspring via gestation and/or lactation
(Borgå et al., 2001; Boon et al., 2002; Falandysz et al., 2002).
Lipid-normalised concentrations of PCBs in marine turtle blood have been shown to significantly
correlate to levels found in matched fat samples, indicating blood to be a suitable marker for
exposure to PCDD/Fs and PCBs (Keller et al., 2004a). Lipid-normalised PCDD/F and PCB
concentrations in green turtles have been shown to closely reflect sediment contamination
(Hermanussen et al., 2006).
EXPOSURE CONCENTRATIONS IN GLADSTONE GREEN TURTLES
Middle bound TEQs in blood of juvenile green turtles from Gladstone averaged 19 ppt lw (range <7.1-
39 ppt lw). These concentrations are comparable to those reported for juvenile green turtles from
Shoalwater (average 27; range 24-29 ppt lw; n=2) and eastern Moreton Bays (average 17; range 6.0-
22 ppt lw) (Hermanussen, 2009). Higher TEQ levels have been reported from juvenile green turtles in
Hervey Bay (average 33; range 9.6-71) and western Moreton Bay (average 78; range 37-120 ppt lw)
(Hermanussen, 2009).
Blood from the adult specimen in Gladstone contained considerably higher TEQ levels compared to
juveniles (130 ppt lw), which is comparable to the upper concentrations reported from Hervey Bay
and Western Moreton Bay (Hermanussen, 2009). It is interesting to note that the major proportion
of this TEQ was derived from PCDD/Fs (120 ppt lw) while PCBs only contributed a minor fraction (7.9
ppt lw). As dioxins and PCBs bioaccumulate in organisms over their lifespan, these results suggest
adult turtles may be exposed to chronically elevated levels of dioxins; however, further data from
adult turtles would be required to evaluate chronic exposure in this region. No other TEQ levels have
been reported for sea turtle blood or tissues. In dugongs from Queensland, TEQ levels were
surprisingly elevated compared to many other marine biota, even higher trophic animals, ranging
from 5-140 and 0.92-55 ppt lw in adult males and females, respectively (Gaus et al., 2004)
TOXICITY AND EFFECTS
PCDD/Fs and dioxin-like PCBs primarily exert toxic effects in animals by binding to the aryl
hydrocarbon receptor (Ah receptor), and the ligand-activated Ah receptor acts as a transcription
factor for the regulation of genes (Hahn, 1998). Limited information is available on the effect of
dioxins and PCBs on reptiles; although field based epidemiological studies have indicated
reproductive and developmental effects in freshwater turtles (Bishop et al., 1998; De Solla et al.,
1998), and possible immune suppression in marine species (Keller et al., 2004b; Keller et al., 2006).
The effects of PCDD/Fs and dioxin-like PCBs on humans and other mammals, including marine
mammals, are well established. Effects include chloracne, liver and kidney damage, behavioural
alterations, reproductive and developmental abnormalities, reduced fertility, tetragenicity, endocrine
disruption and immune system suppression (ATSDR, 1998, 2000). TCDD has also been classified as a
Group 1 carcinogen by IARC. Lowest observed adverse effect levels (LOAELs) of dioxins and PCBs are
reported on a body burden basis – TEQ per kilogram of body weight (bw). LOAEL thresholds in
mammals range from biochemical effects at 3 ng kg-1 bw which may or may not result in adverse
health effects, immunological effects leading to increased viral sensitivity at 10 ng kg-1 bw,

Investigation of contaminant levels in green turtles from Gladstone
73
developmental neurotoxicity at 21 ng kg-1 bw, and reproductive toxicity resulting in reduced sperm
count at 28 ng kg-1 bw (WHO, 1998; USEPA, 2003). For birds, one of the most sensitive species is the
domesticated chicken with a LOAEL of 9 ng kg-1 bw for developmental toxicity resulting in cardiac
malformation (USEPA, 2003).
PROBABILISTIC RISK ASSESSMENT
A probabilistic approach can be used to estimate the proportion of the Gladstone turtle population
at risk of adverse effects based on the reported PCDD/F and PCB blood levels. TEQ data (on a lipid
basis in blood) for the turtle samples were transformed to body burdens by multiplying TEQ by the
expected total body lipid percentage. The expected population distribution of TEQ body burdens was
then determined using risk modelling software (Crystalball 2000 Decisioneering Inc.) and compared
to LOAELs in mammals and avian species (in the absence of reptile-specific dose-response
toxicological information). Total green turtle lipid percentage was assumed to vary uniformly
between 4 and 12% for foraging benthic-phase animals not undergoing breeding migration,
consistent with previously reported exposure assessments (Hermanussen, 2009). As only one adult
blood sample was obtained, data from the 21 juvenile turtles were assessed separately to the adult.
Lognormal frequency distributions are commonly observed for environmental pollutant
concentrations in animals (Ott, 1990), and therefore lognormal distributions were fitted to lipid
normalised TEQ concentrations for juveniles using mammalian and avian TEFs separately, and on
both a middle and upper bound basis.
Assuming that the juvenile turtles sampled in this study are representative of the Gladstone juvenile
turtle population, the likelihood (% of population) of TEQ body burdens at or above levels where
effects have been observed were determined. At middle bound TEQ, up to 6.6% of the juvenile
population may be above the LOAELs where biochemical effects are expected in mammals; when
considering the more conservative upper bound TEQ basis, this percentage increases to 29% (Figure
3). On an upper bound TEQ basis, up to 5% of the population may also be above the LOAEL for
developmental toxicity effects in avian species (Figure 3).
In contrast to juveniles, higher TEQs were observed in the adult blood sample. Probabilistic
assessments cannot be performed; however, based on the expected total body lipid percentage (4 –
12%) the estimated body burden is in the range of 5.0-15 ng kg-1 bw (middle bound) and 5.6-17 ng
kg-1 bw (upper bound) assuming mammalian TEFs. Using avian TEFs, the comparable ranges would
be 4.7-14 ng kg-1 bw (middle bound) and 5.6-17 ng kg-1 bw (upper bound). This adult’s predicted
body burden is in excess of the LOAEL for biochemical effects in mammals, and may exceed the
LOAELs for immunological effects and developmental effects in mammals and birds, respectively.
It is important to note that this risk assessment does not incorporate reptile-specific sensitivity to
PCDD/Fs and PCBs. When the toxicity threshold for a different species (but from the same class) is
used for risk assessment, the uncertainty is usually offset by dividing the LOAEL by a safety factor of
10 (WHO, 1998). In the case of this study, the uncertainty may be higher due to the class-difference
between the measured LOAELs (mammalian and avian) and species of interest (reptilian). Safety
factors have not been applied in the above assessment.

Investigation of contaminant levels in green turtles from Gladstone
74
Figure 4 Probabilistic distributions of body burden (ng kg-1 bw (x-axis)) in juvenile green turtles
from Gladstone; A) derived using mammalian TEFs and B) derived using avian TEFs. The blue portion
of the graph depicts the fraction of the juvenile population at or above the LOAEL of A) 3 ng kg-1 bw
for biochemical effects in mammals (29%) and B) 9 ng kg-1 bw for developmental toxicity in chickens
(5.0%).
A)
B)

Investigation of contaminant levels in green turtles from Gladstone
75
SUMMARY
Based on limited comparable data for PCDD/Fs and PCBs in turtles, blood levels in juvenile turtles
from Gladstone appear to be similar compared to green turtles from relatively low impacted areas in
Queensland. The adult specimen, however, contained elevated TEQ levels, comparable to the highest
concentrations identified for green turtles and dugongs; however, only one adult specimen was
sampled from Gladstone. Probabilistic risk assessment for the juvenile population suggests that low
proportions of the population may have body burdens in excess of LOAELs for biochemical effects in
mammals, which may or may not result in adverse health effects (6.6-29%) and developmental
toxicity in birds (0-5.0%). It should be noted, however, that no reptile-specific LOAELs are available
and no uncertainty factors have been applied to the mammalian and avian LOAELs used. For the one
adult turtle sampled, its estimated body burden was in excess of the LOAEL for biochemical effects in
mammals, and exceeds the LOAELs for immunological effects and developmental effects in mammals
and birds, respectively.

Investigation of contaminant levels in green turtles from Gladstone
76
6.0 CONCLUSIONS AND RECOMMENDATIONS
The results of this study show that exposure concentrations for several organic contaminant groups
and a range of metals are relatively low and unlikely to present a substantial hazard to the study
population; these include bioaccumulative pesticides, organotins, perfluorinated compounds,
brominated flame retardants, aluminium (Al), iron (Fe), manganese (Mn), and zinc (Zn).
A number of contaminant groups were detected at levels that suggest elevated exposure may have
occurred for a proportion of the green turtles from Boyne River estuary. These include dioxins and
dioxin-like PCBs, silver (Ag), copper (Cu), chromium (Cr), molybdenum (Mo), and lead (Pb). Effects
associated with exposure to these compounds may be possible, and may present a concern to the
health of the green turtle population in Gladstone. Where available, tissue based concentrations for
acute effects across vertebrate taxa are, however, considerably higher.
Levels of the metals/metalloids arsenic (As), cadmium (Cd), cobalt (Co), mercury (Hg), nickel (Ni),
selenium (Se), and vanadium (V) were clearly elevated in turtles from Gladstone and near or above
tissue based effect concentrations were acute adverse effects have been reported across different
vertebrate taxa. In the absence of information regarding the sensitivity of green turtles to such
elements, these results suggest they should be considered of concern to the health of the
population.
Based on these results, monitoring of the health and contaminant levels in juvenile green turtle
population is strongly recommended. As some of the contaminants investigated in this study are
known to have tendencies to bioaccumulate with age of organisms, and biomagnify through the food
chain it is additionally recommended to investigate the contaminant levels in adult sea turtles as well
as higher trophic level marine organisms. This would additionally provide more information on
whether acute high level, rather than chronic exposure occurred in this area. Analyses of varying
storage tissues (e.g. carapace) may further assist evaluation of exposure duration.
It is further recommended to identify and investigate suitable control populations, to provide a
better understanding on typical baseline levels for metals/metalloids in green turtle populations
from the wider Gladstone region, as the levels of some metals and metalloids may vary naturally
across different locations.
Since the toxic potency of many metals/metalloids are known to differ depending on chemical forms,
speciation of metals/metalloids in turtle blood and tissues should be considered to provide a better
understanding on the possible risks associated with elevated exposure.

Investigation of contaminant levels in green turtles from Gladstone
77
7.0 REFERENCES
Aguirre, A.A., Balazs, G.H., Zimmerman, B., Galey, F.D., 1994. Organic contaminants and trace metals in the tissues of green turtles (Chelonia mydas) afflicted with fibropapillomas in the Hawaiian islands. Marine Pollution Bulletin 28, 109-114.
Agusa, T., Takagi, K., Kubota, R., Anan, Y., Iwata, H., Tanabe, S., 2008. Specific accumulation of arsenic compounds in green turtles (Chelonia mydas) and hawksbill turtles (Eretmochelys imbricata) from Ishigaki Island, Japan. Environmental Pollution 153, 127-136.
Agusa, T., Takagi, K., Miller, T.W., Kubota, R., Anan, Y., Iwata, H., Tanabe, S., 2011. Intake and excretion of arsenicals in green (Chelonia mydas) and hawksbill turtles (Eretmochelys imbricata). Environmental Chemistry 8, 19-29.
Al-Rawahy, S.H., Al Kindi, A.Y., Elshafie, A., Ibrahim, M., Al Bahry, S.N., Al Siyabi, S.S., Mansour, M.H., Al Kiyumi, A.A., 2007. Accumulation of Metals in the Egg Yolk and Liver of Hatchling of Green Turtles Chelonia mydas at Ras Al Hadd, Sultante of Oman. Journal of Biological Sciences 7, 918-924.
Altland, P.D., Thompson, E.C., 1958. Some Factors Affecting Blood Formation in Turtles. Proceedings of the Society for Experimental Biology and Medicine 99, 456-459.
Anan, Y., Kunito, T., Watanabe, I., Sakai, H., Tanabe, S., 2001. Trace element accumulation in hawksbill turtles (Eretmochelys imbricata) and green turtles (Chelonia mydas) from Yaeyama Islands, Japan. Environmental Toxicology and Chemistry 20, 2802-2814.
Andreani, G., Santoro, M., Cottignoli, S., Fabbri, M., Carpenè, E., Isani, G., 2008. Metal distribution and metallothionein in loggerhead (Caretta caretta) and green (Chelonia mydas) sea turtles. Science of the Total Environment 390, 287-294.
Armitage, S.A., White, M.A., Wilson, H.K., 1996. The determination of silver in whole blood and its application to biological monitoring of occupationally exposed groups. Annals of Occupational Hygiene 40, 331-338.
ATSDR, 1990. Toxicological profile for Silver. Agency for Toxic Substances and Disease Registry, U.S. Department of Health and Human Services, Atlanta, Georgia.
ATSDR, 1998. Toxicological profile for Chlorinated Dibenzo-p-dioxins (CDDs). Agency for Toxic Substances and Disease Registry, U.S. Department of Health and Human Services, Atlanta, Georgia.
ATSDR, 1999. Toxicological profile for Mercury. Agency for Toxic Substances and Disease Registry, U.S. Department of Health and Human Services, Atlanta, Georgia.
ATSDR, 2000. Toxicological profile for Polychlorinated Biphenyls (PCBs). Agency for Toxic Substances and Disease Registry, U.S. Department of Health and Human Services, Atlanta, Georgia.
ATSDR, 2003. Toxicological profile for Selenium. Agency for Toxic Substances and Disease Registry, U.S. Department of Health and Human Services, Atlanta, Georgia.
ATSDR, 2004. Toxicological profile for Cobalt. Agency for Toxic Substances and Disease Registry, U.S. Department of Health and Human Services, Atlanta, Georgia.
ATSDR, 2005a. Toxicological profile for Nickel. Agency for Toxic Substances and Disease Registry, U.S. Department of Health and Human Services, Atlanta, Georgia.

Investigation of contaminant levels in green turtles from Gladstone
78
ATSDR, 2005b. Toxicological profile for Zinc. Agency for Toxic Substances and Disease Registry, U.S. Department of Health and Human Services, Atlanta, Georgia.
ATSDR, 2007. Toxicological profile for Arsenic. Agency for Toxic Substances and Disease Registry, U.S. Department of Health and Human Services, Atlanta, Georgia.
ATSDR, 2008a. Toxicological profile for Cadmium: Draft for Public Comment. Agency for Toxic Substances and Disease Registry, U.S. Department of Health and Human Services, Atlanta, Georgia, p. 454.
ATSDR, 2008b. Toxicological profile for Chromium: Draft for Public Comment. Agency for Toxic Substances and Disease Registry, U.S. Department of Health and Human Services, Atlanta, Georgia, p. 520.
ATSDR, 2009. Toxicological profile for Vanadium: Draft for Public Comment. Agency for Toxic Substances and Disease Registry, U.S. Department of Health and Human Services, Atlanta, Georgia.
Barbieri, E., 2009. Concentration of heavy metals in tissues of green turtles (Chelonia mydas) sampled in the Cananéia estuary, Brazil. Brazilian Journal of Oceanography 57, 243-248.
Bishop, C.A., Ng, P., Pettit, K.E., Kennedy, S.W., Stegeman, J.J., Norstrom, R.J., Brooks, R.J., 1998. Environmental contamination and developmental abnormalities in eggs and hatchlings of the common snapping turtle (Chelydra serpentina serpentina) from the Great Lakes-St Lawrence River basin (1989-91). Environmental Pollution 101, 143-156.
Boon, J.P., Lewis, W.E., Tjoen-A-Choy, M.R., Allchin, C.R., Law, R.J., de Boer, J., ten Hallers-Tjabbes, C.C., Zegers, B.N., 2002. Levels of Polybrominated Diphenyl Ether (PBDE) Flame Retardants in Animals Representing Different Trophic Levels of the North Sea Food Web. Environmental Science & Technology 36, 4025-4032.
Borgå, K., Gabrielsen, G.W., Skaare, J.U., 2001. Biomagnification of organochlorines along a Barents Sea food chain. Environmental Pollution 113, 187-198.
Brasfield, S.M., Bradham, K., Wells, J.B., Talent, L.G., Lanno, R.P., Janz, D.M., 2004. Development of a terrestrial vertebrate model for assessing bioavailability of cadmium in the fence lizard (Sceloporus undulatus) and in ovo effects on hatchling size and thyroid function. Chemosphere 54, 1643-1651.
Broman, D., Naef, C., Rolff, C., Zebuehr, Y., Fry, B., Hobbie, J., 1992. Using ratios of stable nitrogen isotopes to estimate bioaccumulation and flux of polychlorinated dibenzo-p-dioxins (PCDDs) and dibenzofurans (PCDFs) in two food chains from the Northern Baltic. Environmental Toxicology and Chemistry 11, 331-345.
Burger, J., Jeitner, C., Schneider, L., Vogt, R., Gochfeld, M., 2009. Arsenic, Cadmium, Chromium, Lead, Mercury, and Selenium Levels in Blood of Four Species of Turtles from the Amazon in Brazil. Journal of Toxicology and Environmental Health, Part A 73, 33-40.
Byerrum, R.U., Eckardt, R.E., Hopkins, L.L., Libsh, J.F., Rostoker, W., Zenz, C., 1974. Vanadium. Washington, DC.
Byrne, A.R., Kosta, L., 1978. Vanadium in foods and in human body fluids and tissues. Science of The Total Environment 10, 17-30.

Investigation of contaminant levels in green turtles from Gladstone
79
Catalani, S., Leone, R., Rizzetti, M.C., Padovani, A., Apostoli, P., 2011. The Role of Albumin in Human Toxicology of Cobalt: Contribution from a Clinical Case. ISRN Hematology 2011.
Caurant, F., Bustamante, P., Bordes, M., Miramand, P., 1999. Bioaccumulation of Cadmium, Copper and Zinc in some Tissues of Three Species of Marine Turtles Stranded Along the French Atlantic Coasts. Marine Pollution Bulletin 38, 1085-1091.
Costigan, M., Cary, R., Dobson, S., 2001. Vanadium pentoxide and other inorganic vanadium compounds. World Health Organization, Geneva.
Day, R.D., Christopher, S.J., Becker, P.R., Whitaker, D.W., 2005. Monitoring Mercury in the Loggerhead Sea Turtle, Caretta caretta. Environmental Science & Technology 39, 437-446.
Day, R.D., Keller, J.M., Harms, C.A., Segars, A.L., Cluse, W.M., Godfrey, M.H., Lee, A.M., Peden-Adams, M., Thorvalson, K., Dodd, M., Norton, T., 2010. Comparison of mercury burdens in chronically debilitated and healthy loggerhead sea turtles (Caretta caretta). Journal of Wildlife Diseases 46, 111-117.
Day, R.D., Segars, A.L., Arendt, M.D., Lee, A.M., Peden-Adams, M.M., 2007. Relationship of Blood Mercury Levels to Health Parameters in the Loggerhead Sea Turtle (Caretta caretta). Environmental Health Perspectives 115, 1421-1428.
De Solla, S.R., Bishop, C.A., Van der Kraak, G., Brooks, R.J., 1998. Impact of organochlorine contamination on levels of sex hormones and external morphology of common snapping turtles (Chelydra serpentina serpentina) in Ontario, Canada. Environmental Health Perspectives 106, 253-260.
DEEDI, 2011. Fish Health Sampling Reports. Gladstone Harbour. 3rd November 2011. Brisbane: Department of Employment, Economic Development and Innovation, Queensland.
Denton, G.R.W., Marsh, H., Heinsohn, G.E., Burdon-Jones, C., 1980. The unusual metal status of the dugong Dugon dugon. Marine Biology 57, 201-219.
DERM, 2012. Strandings hot spots. Department of Environment and Resource Management, Queensland Government.
Duvall, S.E., Barron, M.G., 2000. A Screening Level Probabilistic Risk Assessment of Mercury in Florida Everglades Food Webs. Ecotoxicology and Environmental Safety 47, 298-305.
EC, 2006. Polychlorinated Biphenyls (PCBs) - Fate and Effects in the Canadian Environment. Available at: http://www.ec.gc.ca/Publications/default.asp?lang=En&xml=261E1245-FB9E-4A01-91FC-BF3D4EED546E.
Eden, P., Flint, M., Mills, P., Owen, H., 2011. Health assessment of green sea turtles from Gladstone Harbour: July to October 2011. Veterinary Marine Animal Research, Teaching and Investigation (Vet-MARTI), Gatton, Queensland, Australia, p. 23.
Eisler, R., 1985a. Cadmium hazards to fish, wildlife, and invertebrates: a synoptic review. US Fish and Wildlife Service, Laurel, p. 30.
Eisler, R., 1985b. Selenium hazards to fish, wildlife, and invertebrates: a synoptic review. US Fish and Wildlife Service, Laurel, p. 41.
Eisler, R., 1988. Arsenic hazards to fish, wildlife, and invertebrates: a synoptic review. US Fish and Wildlife Service, Laurel, p. 65.

Investigation of contaminant levels in green turtles from Gladstone
80
Eisler, R., 1996. Silver hazards to fish, wildlife, and invertebrates: a synoptic review. National Biological Service, US Department of the Interior, Laurel, p. 48.
Eisler, R., 1998a. Copper hazards to fish, wildlife, and invertebrates: a synoptic review. Biological Resources Division, US Geological Survey, Laurel, p. 98.
Eisler, R., 1998b. Nickel hazards to fish, wildlife, and invertebrates: a synoptic review. Biological Resources Division, US Geological Survey, Laurel, p. 76.
Eisler, R., 2007. Eisler's Encyclopedia of Environmentally Hazardous Priority Chemicals. Elsevier, Oxford.
Eisler, R., 2010. Compendium of trace metals and marine biota. Elsevier, Oxford.
Eitzer, B.D., 1993. Comparison of point and nonpoint sources of polychlorinated dibenzo-p-dioxins and polychlorinated dibenzofurans to sediments of the Housatonic River. Environmental Science and Technology 27, 1632-1637.
Ellermann-Eriksen, S., Martiny Christensen, M., Mogensen, S.C., 1994. Effect of mercuric chloride on macrophage-mediated resistance mechanisms against infection with herpes simplex virus type 2. Toxicology 93, 269-287.
Falandysz, J., Wyrzykowska, B., Strandberg, L., Puzyn, T., Strandberg, B., Rappe, C., 2002. Multivariate analysis of the bioaccumulation of polychlorinated biphenyls (PCBs) in the marine pelagic food web from the southern part of the Baltic Sea, Poland. Journal of Environmental Monitoring 4, 929-941.
Farheen, A., Aslam, T., Almas, K., Bhatty, N., Nawaz, M., 2002. Biokinetics of inorganic iron in female volunteers. Pakistan Journal of Medical Research 41, 32-35.
Frouin, H., Fortier, M., Fournier, M., 2010. Toxic effects of various pollutants in 11B7501 lymphoma B cell line from harbour seal (Phoca vitulina). Toxicology 270, 66-76.
Gaus, C., Brunskill, G., Weber, R., Päpke, O., Müller, J., 2001. Historical PCDD inputs and their source implications from dated sediment cores in Queensland (Australia). Environmental Science and Technology 35, 4597-4603.
Gaus, C., O'Donohue, M., Connell, D., Müller, J., Haynes, D., Päpke, O., 2004. Exposure and potential risks of dioxins to the marine mammal dugong. Organohalogen Compounds 66, 1559-1566.
Gladstone Ports Corporation, 2011. Briefing - Western basin dredging and disposal project environmental impacts. Gladstone Ports Corporation, Gladstone, Queensland.
Gladstone, W., 1996. Trace metals in sediments, indicator organisms and traditional seafoods of the Torres Strait. Great Barrier Reef Marine Park Authority, Townsville, Australia.
Godley, B.J., Thompson, D.R., Furness, R.W., 1999. Do Heavy Metal Concentrations Pose a Threat to Marine Turtles from the Mediterranean Sea? Marine Pollution Bulletin 38, 497-502.
Gomez-Caminero, A., Howe, P., Hughes, M., Kenyon, E., Lewis, D., Moore, M., Ng, J., Aitio, A., Becking, G., 2001. Arsenic and Arsenic Compounds. World Health Organization, Geneva.
Gordon, A.N., Pople, A.R., Ng, J., 1998. Trace metal concentrations in livers and kidneys of sea turtles from south-eastern Queensland, Australia. Marine and Freshwater Research 49, 409-414.

Investigation of contaminant levels in green turtles from Gladstone
81
Grillitsch, B., Schiesari, L., 2010. Chapter 12. The Ecotoxicology of Metals in Reptiles. In: Sparling, D.W., Linder, G., Bishop, C.A., Krest, S.K. (Eds.), Ecotoxicology of Amphibians and Reptiles, Second Edition. CRC Press, pp. 337–448.
Guirlet, E., Das, K., Girondot, M., 2008. Maternal transfer of trace elements in leatherback turtles (Dermochelys coriacea) of French Guiana. Aquatic Toxicology 88, 267-276.
Hahn, M.E., 1998. The aryl hydrocarbon receptor: A comparative perspective. Comparative Biochemistry and Physiology Part C: Pharmacology, Toxicology and Endocrinology 121, 23-53.
Haynes, D., Mueller, J.F., McLachlan, M.S., 1999. Polychlorinated dibenzo-p-dioxins and dibenzofurans in Great Barrier Reef (Australia) dugongs (Dugong dugon). Chemosphere 38, 255-262.
Hermanussen, S., Limpus, C., Paepke, O., Connell, D.W., Gaus, C., 2006. Foraging habitat contamination determines green sea turtle PCDD/F exposure. Organohalogen Compounds 68, 592-595.
Hermanussen, S., Matthews, V., Päpke, O., Limpus, C.J., Gaus, C., 2008. Flame retardants (PBDEs) in marine turtles, dugongs and seafood from Queensland, Australia. Marine Pollution Bulletin 57, 409-418.
Hermanussen, S.F., 2009. Distribution and fate of persistent organic pollutants in nearshore marine turtle habitats of Queensland, Australia. The University of Queensland, St. Lucia, p. 218.
Hilton, J.W., Bettger, W.J., 1988. Dietary vanadium toxicity in juvenile rainbow trout: a preliminary study. Aquatic Toxicology 12, 63-71.
Holt, E., Weber, R., Stevenson, G., Gaus, C., 2010. Polychlorinated Dibenzo-p-Dioxins and Dibenzofurans (PCDD/Fs) Impurities in Pesticides: A Neglected Source of Contemporary Relevance. Environmental Science & Technology 44, 5409-5415.
Hopkins, W.A., Rowe, C.L., Congdon, J.D., 1999. Elevated trace element concentrations and standard metabolic rate in banded water snakes (Nerodia fasciata) exposed to coal combustion wastes. Environmental Toxicology and Chemistry 18, 1258-1263.
Howe, P., Dobson, S., 2002. Silver and Silver Compounds: Enviornmental Aspects (Draft Report). The Concise International Chemical Assessment Document Series. World Health Organization, Geneva, p. 36.
IARC, 2009. Agents Classified by the IARC Monographs, Volumes 1–103. 1.
Ikonomopoulou, M.P., Olszowy, H., Limpus, C., Francis, R., Whittier, J., 2011. Trace element concentrations in nesting flatback turtles (Natator depressus) from Curtis Island, Queensland, Australia. Marine Environmental Research 71, 10-16.
Jerez, S., Motas, M., Cánovas, R.Á., Talavera, J., Almela, R.M., del Río, A.B., 2010. Accumulation and tissue distribution of heavy metals and essential elements in loggerhead turtles (Caretta caretta) from Spanish Mediterranean coastline of Murcia. Chemosphere 78, 256-264.
Kampalath, R., Gardner, S.C., Méndez-Rodríguez, L., Jay, J.A., 2006. Total and methylmercury in three species of sea turtles of Baja California Sur. Marine Pollution Bulletin 52, 1816-1823.
Investigation of contaminant levels in green turtles from Gladstone
82
Kannan, K., Blankenship, A.L., Jones, P.D., Giesy, J.P., 2000. Toxicity Reference Values for the Toxic Effects of Polychlorinated Biphenyls to Aquatic Mammals. Human and Ecological Risk Assessment 6, 181-201.
Kaska, Y., Celik, A., Bag, H., Aureggi, M., Oezel, K., Elci, A., Kaska, A., Elci, L., 2004. Heavy metal monitoring in stranded sea turtles along the Mediterranean coast of Turkey. Fresenius Environmental Bulletin 13, 769-776.
Keller, J., McClellan-Green, P., Kucklick, J., Keil, D., Peden-Adams, M., 2006. Effects of organochlorine contaminants on loggerhead sea turtle immunity: Comparison of a correlative field study and in vitro exposure experiments. Environmental Health Perspectives 114, 70-76.
Keller, J.M., Kucklick, J.R., Harms, C.A., McClellan-Green, P.D., 2004a. Organochlorine contaminants in sea turtles: Correlations between whole blood and fat. Environmental Toxicology and Chemistry 23, 726-738.
Keller, J.M., Kucklick, J.R., Stamper, M.A., Harms, C.A., McClellan-Green, P.D., 2004b. Associations between Organochlorine Contaminant Concentrations and Clinical Health Parameters in Loggerhead Sea Turtles from North Carolina, USA. Environmental Health Perspectives 112, 1074-1079.
Kemper, C., Gibbs, P., Obendorf, D., Marvanek, S., Lenghaus, C., 1994. A review of heavy metal and organochlorine levels in marine mammals in Australia. Science of The Total Environment 154, 129-139.
Kenyon, L.O., Landry, A.M.J., Gill, G.A., 2001. Trace Metal Concentrations in Blood of the Kemp's Ridley Sea Turtle (Lepidochelys kempii). Chelonian Conservation and Biology 4, 128-135.
Kitana, N., Callard, I.P., 2008. Effect of cadmium on gonadal development in freshwater turtle (Trachemys scripta, Chrysemys picta) embryos. Journal of Environmental Science and Health, Part A 43, 262-271.
Komoroske, L.M., Lewison, R.L., Seminoff, J.A., Deheyn, D.D., Dutton, P.H., 2011. Pollutants and the health of green sea turtles resident to an urbanized estuary in San Diego, CA. Chemosphere 84, 544-552.
Kubota, R., Kunito, T., Tanabe, S., 2002. Chemical speciation of arsenic in the livers of higher trophic marine animals. Marine Pollution Bulletin 45, 218-223.
Kubota, R., Kunito, T., Tanabe, S., 2003a. Is arsenobetaine the major arsenic compound in the liver of birds, marine mammals, and sea turtles? Journal de Physique IV 107, 707-710.
Kubota, R., Kunito, T., Tanabe, S., 2003b. Occurrence of several arsenic compounds in the liver of birds, cetaceans, pinnipeds, and sea turtles. Environmental Toxicology and Chemistry 22, 1200-1207.
Kunito, T., Kubota, R., Fujihara, J., Agusa, T., Tanabe, S., 2008. Arsenic in marine mammals, seabirds, and sea turtles. In: Whitacre, D.M. (Ed.), Reviews of Environmental Contamination and Toxicology, Vol 195, pp. 31-69.
Labrada-Martagón, V., Tenorio Rodríguez, P.A., Méndez-Rodríguez, L.C., Zenteno-Savín, T., 2011. Oxidative stress indicators and chemical contaminants in East Pacific green turtles (Chelonia mydas) inhabiting two foraging coastal lagoons in the Baja California peninsula. Comparative Biochemistry and Physiology Part C: Toxicology & Pharmacology 154, 65-75.

Investigation of contaminant levels in green turtles from Gladstone
83
Lam, J.C.W., Tanabe, S., Chan, S.K.F., Yuen, E.K.W., Lam, M.H.W., Lam, P.K.S., 2004. Trace element residues in tissues of green turtles (Chelonia mydas) from South China Waters. Marine Pollution Bulletin 48, 174-182.
Lam, P.K.S., 2009. Tissue Analyses and Ecological Risk Assessment for Marine Mammals in Hong Kong. Final report submitted to the Agriculture, Fisheries and Conservation Department of the Government of the Hong Kong Special Administrative Region, China, p. 251.
Limpus, C., 1978. The Reef: uncertain land of plenty. In: Lavery, H.J. (Ed.), Exploration North - a natural history of Queensland. Lloyd O'Neill Pty Ltd, Sydney.
Limpus, C.J., 2008. A biological review of Australian Marine Turtles. 2. Green turtle Chelonia mydas (Linnaeus). Queensland Environmental Protection Agency, Queensland, Australia, pp. 1-96.
Limpus, C.J., Chalaupka, M., 1997. Non-power metric regression modelling of green sea turtle growth rates (Southern Great Barrier Reef). Marine Ecology - Progress Series 149, 27-34.
Limpus, C.J., Cooper, P.J., Read, M.A., 1994. The green turtle, Chelonia mydas, in Queensland; population structure in a warm tempered feeding area. Memoires of the Queensland Museum 35, 139-154.
Lin, T.S., Chang, C.L., Shen, F.M., 2004. Whole Blood Vanadium in Taiwanese College Students. Bulletin of Environmental Contamination and Toxicology 73, 781-786.
Llobet, J.M., Domingo, J.L., 1984. Acute toxicity of vanadium compounds in rats and mice. Toxicology Letters 23, 227-231.
Mackay, D., Shiu, W.Y., Ma, K.C., Lee, S.C., 2006. Handbook of physical-chemical properties and environmental fate for organic chemicals. CRC Press, Boca Raton, FL.
Mackey, E.A., Becker, P.R., Demiralp, R., Greenberg, R.R., Koster, B.J., Wise, S.A., 1996. Bioaccumulation of vanadium and other trace metals in livers of Alaskan cetaceans and pinnipeds. Archives of Environmental Contamination and Toxicology 30, 503-512.
Malarvannan, G., Takahashi, S., Isobe, T., Kunisue, T., Sudaryanto, A., Miyagi, T., Nakamura, M., Yasumura, S., Tanabe, S., 2011. Levels and distribution of polybrominated diphenyl ethers and organochlorine compounds in sea turtles from Japan. Marine Pollution Bulletin 63, 172-178.
Marco, A., López-Vicente, M., Pérez-Mellado, V., 2004. Arsenic Uptake by Reptile Flexible-Shelled Eggs from Contaminated Nest Substrates and Toxic Effect on Embryos. Bulletin of Environmental Contamination and Toxicology 72, 983-990.
Mass, M.J., Wang, L., 1997. Arsenic alters cytosine methylation patterns of the promoter of the tumor suppressor gene p53 in human lung cells: a model for a mechanism of carcinogenesis. Mutation Research - Reviews in Mutation Research 386, 263-277.
McKenzie, C., Godley, B.J., Furness, R.W., Wells, D.E., 1999. Concentrations and patterns of organochlorine contaminants in marine turtles from Mediterranean and Atlantic waters. Marine Environmental Research 47, 117-135.
Michibata, H., 2012. Vanadium: biochemical and molecular biological approaches. Springer, New York.
Miramand, P., Fowler, S., Guary, J., 1992. Experimental study on vanadium transfer in the benthic fish Gobius minutus. Marine Biology 114, 349-353.

Investigation of contaminant levels in green turtles from Gladstone
84
Moszczyński, P., 1997. Mercury compounds and the immune system: a review. International journal of occupational medicine and environmental health 10, 247-258.
Muir, D.C.G., Wagemann, R., Grift, N.P., Norstrom, R.J., Simon, M., Lien, J., 1988. Organochlorine chemical and heavy metal contaminants in white-beaked dolphins (Lagenorhynchus albirostris) and pilot whales (Globicephala melaena) from the coast of Newfoundland, Canada. Archives of Environmental Contamination and Toxicology 17, 613-629.
NAS, 2001. National Academy of Science: A Risk Management Strategy for PCB-Contaminated Sediments. . Committee on Remediation of PCB-Contaminated Sediments, Board on Environmental Studies and Toxicology, National Research Council. The National Academies Press.
Neff, J.M., 1997. Ecotoxicology of arsenic in the marine environment. Environmental Toxicology and Chemistry 16, 917-927.
Niimi, A.J., 1996. Evaluation of PCBs and PCDD/Fs retention by aquatic organisms. The Science of the Total Environment 192, 123-150.
Nixon, D.E., Neubauer, K.R., Eckdahl, S.J., Butz, J.A., Burritt, M.F., 2002. Evaluation of a tunable bandpass reaction cell for an inductively coupled plasma mass spectrometer for the determination of chromium and vanadium in serum and urine. Spectrochimica Acta Part B: Atomic Spectroscopy 57, 951-966.
NJDEP, 2001. Chapter 6: Ecological Effects of Mercury. In: Gochfeld, M. (Ed.), New Jersey Mercury Task Force Report, Volume 2: Exposure and Impacts. New Jersey Department of Environmental Protection, Environmental and Occupational Health Sciences Institute, New Jersey, pp. 55-69.
Ochi, T., Nakajima, F., Nasui, M., 1999. Distribution of γ-tubulin in multipolar spindles and multinucleated cells induced by dimethylarsinic acid, a methylated derivative of inorganic arsenics, in Chinese hamster V79 cells. Toxicology 136, 79-88.
Orós, J., González-Díaz, O.M., Monagas, P., 2009. High levels of polychlorinated biphenyls in tissues of Atlantic turtles stranded in the Canary Islands, Spain. Chemosphere 74, 473-478.
Ott, W.R., 1990. Physical explanation of the lognormality of pollutant concentrations. Journal of the Air & Waste Management Association 40, 1378-1383.
Páez-Osuna, F., Calderón-Campuzano, M.F., Soto-Jiménez, M.F., Ruelas-Inzunza, J., 2011. Mercury in blood and eggs of the sea turtle Lepidochelys olivacea from a nesting colony in Oaxaca, Mexico. Marine Pollution Bulletin 62, 1320-1323.
Pearson, R.F., Swackhamer, D.L., Eisenreich, S.J., Long, D.T., 1997. Concentrations, accumulations, and inventories of polychlorinated dibenzo-p-dioxins and dibenzofurans in sediments of the Great Lakes. Environmental Science and Technology 31, 2903-2909.
Poulsen, A., Escher, B., 2012. Chemically induced immunosuppression and disease susceptibility in marine wildlife: A literature review. National Research Centre for Environmental Toxicology, St. Lucia, p. 110.
Rattner, B., Golden, N., Toschik, P., McGowan, P., Custer, T., 2008. Concentrations of metals in blood and feathers of nestling ospreys (Pandion haliaetus) in Chesapeake and Delaware Bays. Archives of Environmental Contamination and Toxicology 54, 114-122.

Investigation of contaminant levels in green turtles from Gladstone
85
Ridoux, V., Lafontaine, L., Bustamante, P., Caurant, F., Dabin, W., Delcroix, C., Hassani, S., Meynier, L., Pereira da Silva, V., Simonin, S., 2004. The impact of the "Erika" oil spill on pelagic and coastal marine mammals: Combining demographic, ecological, trace metals and biomarker evidences. Aquatic Living Resources 17, 379-387.
Ross, P.S., Stern, G., Lebeuf, M., Institute of Ocean Sciences, P.B., 2007. Trouble at the Top of the Food Chain: Environmental Contaminants and Health Risks in Marine Mammals: a White Paper on Research Priorities for Fisheries and Oceans Canada. Canadian Technical Report of Fisheries and Aquatic Sciences 2734. Fisheries and Oceans Canada, Institute of Ocean Sciences.
Sabbioni, E., Kuèera, J., Pietra, R., Vesterberg, O., 1996. A critical review on normal concentrations of vanadium in human blood, serum, and urine. Science of The Total Environment 188, 49-58.
Saeki, K., Nakajima, M., Noda, K., Loughlin, T., Baba, N., Kiyota, M., Tatsukawa, R., Calkins, D., 1999. Vanadium accumulation in pinnipeds. Archives of Environmental Contamination and Toxicology 36, 81-86.
Sakai, H., Ichihashi, H., Suganuma, H., Tatsukawa, R., 1995. Heavy metal monitoring in sea turtles using eggs. Marine Pollution Bulletin 30, 347-353.
Sakai, H., Saeki, K., Ichihashi, H., Kamezaki, N., Tanabe, S., Tatsukawa, R., 2000a. Growth-Related Changes in Heavy Metal Accumulation in Green Turtle (Chelonia mydas) from Yaeyama Islands, Okinawa, Japan. Archives of Environmental Contamination and Toxicology 39, 378-385.
Sakai, H., Saeki, K., Ichihashi, H., Suganuma, H., Tanabe, S., Tatsukawa, R., 2000b. Species-Specific Distribution of Heavy Metals in Tissues and Organs of Loggerhead Turtle (Caretta caretta) and Green Turtle (Chelonia mydas) from Japanese Coastal Waters. Marine Pollution Bulletin 40, 701-709.
Sanders, J.G., 1980. Arsenic cycling in marine systems. Marine Environmental Research 3, 257-266.
Sankey, T.L., Hedge, S.A., McKenzie, L.J., McCormack, C.V., Rasheed, M.A., 2011. Gladstone Permanent Transect Seagrass Monitoring – April 2011 Update. Department of Employment, Economic Development and Innovation (DEEDI), Fisheries Queensland, Cairns, p. 30.
Sepe, A., Ciaralli, L., Ciprotti, M., Giordano, R., Funari, E., Costantini, S., 2003. Determination of cadmium, chromium, lead and vanadium in six fish species from the Adriatic Sea. Food Additives and Contaminants 20, 543-552.
Stavros, H.-C.W., Stolen, M., Durden, W.N., McFee, W., Bossart, G.D., Fair, P.A., 2011. Correlation and toxicological inference of trace elements in tissues from stranded and free-ranging bottlenose dolphins (Tursiops truncatus). Chemosphere 82, 1649-1661.
Storelli, M.M., Storelli, A., D'Addabbo, R., Marano, C., Bruno, R., Marcotrigiano, G.O., 2005. Trace elements in loggerhead turtles (Caretta caretta) from the eastern Mediterranean Sea: overview and evaluation. Environmental Pollution 135, 163-170.
Styblo, M., Del Razo, L.M., Vega, L., Germolec, D.R., LeCluyse, E.L., Hamilton, G.A., Reed, W., Wang, C., Cullen, W.R., Thomas, D.J., 2000. Comparative toxicity of trivalent and pentavalent inorganic and methylated arsenicals in rat and human cells. Archives of Toxicology 74, 289-299.
Sun, M., 1987. Toxicity of vanadium and its environmental health standard. Changdu, West China University of Medical Sciences, China, [cited in Costigan et al., 2001].

Investigation of contaminant levels in green turtles from Gladstone
86
Swarthout, R.F., Keller, J.M., Peden-Adams, M., Landry, A.M., Fair, P.A., Kucklick, J.R., 2010. Organohalogen contaminants in blood of Kemp’s ridley (Lepidochelys kempii) and green sea turtles (Chelonia mydas) from the Gulf of Mexico. Chemosphere 78, 731-741.
Talavera-Saenz, A., Gardner, S.C., Riosmena Rodriquez, R., Acosta Vargas, B., 2007. Metal profiles used as environmental markers of Green Turtle (Chelonia mydas) foraging resources. Science of The Total Environment 373, 94-102.
UNEP, 2002. Global mercury assessment. United Nations Environment Programme, UNEP Chemicals, Geneva.
USEPA, 2003. Exposure and Human Health Reassessment of 2,3,7,8-Tetrachlorodibenzo-p-Dioxin (TCDD) and Related Compounds - Part II. http://www.epa.gov/ncea/pdfs/dioxin/nas-review/.
van de Merwe, J.P., Hodge, M., Olszowy, H.A., Whittier, J.M., Lee, S.Y., 2010. Using blood samples to estimate persistent organic pollutants and metals in green sea turtles (Chelonia mydas). Marine Pollution Bulletin 60, 579-588.
van de Merwe, J.P.V., Hodge, M., Olszowy, H.A., Whittier, J.M., Ibrahim, K., Lee, S.Y., 2009. Chemical Contamination of Green Turtle (Chelonia mydas) Eggs in Peninsular Malaysia: Implications for Conservation and Public Health. Environmental Health Perspectives 117, 1397-1401.
van den Berg, M., Birnbaum, L.S., Denison, M., De Vito, M., Farland, W., Feeley, M., Fiedler, H., Hakansson, H., Hanberg, A., Haws, L., Rose, M., Safe, S., Schrenk, D., Tohyama, C., Tritscher, A., Tuomisto, J., Tysklind, M., Walker, N., Peterson, R.E., 2006. The 2005 World Health Organization Reevaluation of Human and Mammalian Toxic Equivalency Factors for Dioxins and Dioxin-Like Compounds. Toxicological Sciences 93, 223-241.
Varanasi, U., Stein, J.E., Tilbury, K.L., Meador, J.P., Sloan, C.A., Clark, R.C., Chan, S.-L., 1994. Chemical contaminants in gray whales (Eschrichtius robustus) stranded along the west coast of North America. Science of The Total Environment 145, 29-53.
Wagrowski, D., Hites, R., 2000. Insights into the Global distribution of Polychlorinated Dibenzo-p-dioxins and Dibenzofurans. Environ. Sci. Technol. 34, 2952-2958.
White, D.H., King, K.A., Prouty, R.M., 1980. Significance of organochlorine and heavy metal residues in wintering shorebirds at Corpus Christi, Texas, 1976-77. Pesticides Monitoring Journal 14, 58-63.
WHO, 1998. Executive summary: assessment of the health risk of dioxins: re-evaluatin of the Tolerable Daily Intake (TDI). European Centre for Environment and Health - International Programme on Chemical Safety, Geneva, Switzerland.
Yamanaka, K., Hayashi, H., Tachikawa, M., Kato, K., Hasegawa, A., Oku, N., Okada, S., 1997. Metabolic methylation is a possible genotoxicity-enhancing process of inorganic arsenics. Mutation Research - Genetic Toxicology and Environmental Mutagenesis 394, 95-101.
Yanochko, G.M., Jagoe, C.H., Brisbin Jr, I.L., 1997. Tissue Mercury Concentrations in Alligators (Alligator mississippiensis) from the Florida Everglades and the Savannah River Site, South Carolina. Archives of Environmental Contamination and Toxicology 32, 323-328.
Yao, D., Zhang, B., 1986. Study on the acute and subchronic toxicity of vanadium pentoxide. Dukou Sanitary and Anti-Epidemic Station [cited in Sun, 1987].

Investigation of contaminant levels in green turtles from Gladstone
87
8.0 APPENDICES
8.1 RESULTS FOR INDIVIDUAL TURTLE SAMPLES

Investigation of contaminant levels in green turtles from Gladstone
88
Table 10 Concentrations of polychlorinated dibenzo-p-dioxins and dibenzofurans (PCDD/Fs; ppt lw) in individual (n=22) blood samples of green turtles (Chelonia
mydas) from Boyne River estuary near Gladstone, Queensland.
1 2 3 1 2 1 2 3 4 1 2
2 0.14 <4.0 <2.6 <3.5 <3.4 <3.6 30 100 <2.6 <1.5 <1.2 <0.80 <0.81 <1.3 <0.84 8.2 <3.1 55 390 4.8
3 0.22 <1.2 2.7 <2.5 3.7 3.9 32 140 3.7 <0.71 <0.53 <0.81 <0.82 <1.4 <0.92 8.8 <5.9 68 360 5.4
22 0.086 <10.0 4.8 <1.7 6.0 3.7 49 370 21 4.0 6.5 4.0 3.2 <2.7 <1.8 16 <2.3 57 ND 17
7 0.062 (<7.0) (<11) (<13) (<16) (<16) (<96) (<370) (<22) <6.3 <6.5 <3.6 <4.4 <8.8 <7.4 26 10 97 ND (<16)
9 0.20 <0.74 4.5 <0.96 5.3 4.9 21 58 6.1 <0.44 <0.34 0.96 0.55 <0.53 0.61 4.0 1.6 25 200 7.1
13 0.12 <4.4 <5.0 <4.7 <4.6 9.3 36 150 <5.5 <3.1 <2.4 1.7 1.7 <2.6 2.9 7.6 <7.2 45 410 8.1
20 0.11 <8.4 6.7 <6.1 <5.8 <5.9 42 140 12 2.7 <1.6 <2.6 2.7 <3.6 <2.5 10 <3.7 36 ND 15
25 0.23 <0.97 <0.89 <1.7 4.0 3.4 24 130 3.7 <0.68 <0.53 <0.32 <0.31 <0.49 1.1 2.5 <1.0 25 240 2.7
30 0.13 <2.8 8.9 <2.1 7.9 10 53 150 21 6.7 <1.5 3.9 2.8 <2.5 3.0 10.0 4.4 65 470 17
32 0.20 <0.99 7.4 22 14 15 50 200 12 <0.56 2.4 1.2 1.6 <0.65 1.2 4.9 <1.1 37 520 16
34 0.070 <4.3 9.2 23 16 15 79 270 <2.8 <1.7 <1.2 <3.2 <3.2 <5.6 <3.2 9.3 <5.1 60 700 19
38 0.15 <1.8 5.0 12 10 5.9 38 140 13 <0.93 <0.69 <0.82 <0.81 <1.4 <0.84 6.5 <2.1 36 340 11
41 0.18 <2.8 <3.3 16 7.4 8.6 44 350 43 4.7 4.4 <1.7 <1.6 <2.7 <1.6 4.3 <2.2 57 600 13
42 0.23 <0.69 1.9 <1.1 2.8 2.7 18 75 14 2.5 2.0 1.2 0.74 <0.42 0.69 3.7 <1.5 27 220 5.4
43 0.11 <2.1 <2.1 <1.7 5.8 5.2 39 110 4.4 <2.0 7.7 6.5 4.7 <3.0 7.1 16 6.0 42 410 8.7
45 0.17 <4.4 5.5 <3.7 <3.5 5.3 33 110 <2.7 2.1 6.4 9.6 7.2 <2.5 4.8 19 <2.7 19 ND 14
46 0.17 <0.86 2.8 <0.22 3.7 3.1 23 85 2.1 <0.66 2.0 0.92 1.2 0.55 0.84 5.9 <1.7 31 250 5.4
47 0.14 <1.5 <1.4 <2.5 5.1 4.7 34 120 <1.2 <1.2 <0.90 <0.91 <0.90 <1.6 <0.92 4.2 <2.7 27 230 3.4
48 0.11 <2.5 7.5 <3.9 14 10 69 240 5.2 <1.7 <1.2 <1.8 <1.8 <3.2 <1.8 12 <5.2 62 600 13
50 0.12 (<5.9) (<9.5) (<11) (<14) (<14) (<81) (<320) (<19) <3.5 <7.7 <1.5 <1.9 <3.7 <3.8 17 7.5 98 ND (<13)
53 0.087 (<8.8) (<14) (<16) (<21) (<21) (<120) (<470) (<28) <6.2 <6.0 <14 <14 <26 <19 <20 <33 79 ND (<21)
36 0.15 <12 82 90 100 76 180 220 <6.6 <2.1 <1.6 2.9 2.6 <4.0 2.9 16 <5.9 38 ND 120
EX
ID
Lipid
(%)
D6D5D4 D7 D8 F8F4
F7F6F5S PCDD/Fs
TEQ05†
S PCDD/Fs
Live captured juveniles
Polychlorinated dibenzo-p -dioxins Polychlorinated dibenzofurans Totals
Juveniles that were euthanised and necropsied
Live captured adult
< Below the limit of detection (LOD) - the values given are the LOD; note: LOD is sometimes high, this is due to low volumes available for analysis and matrix problems
(<) Values that could not be determined analytically mostly due to interferances in the chromatogram. Predicted values are shown, deduced from similar PCDD/F composition profiles observed across all other
blood samples
† Middlebound TEQ reported: TEQ values (pg TEQ/g lw) are calculated by including the non-quantified congeners at half the value of their LOQ or predicted value (indicated by <)
ND No data

Investigation of contaminant levels in green turtles from Gladstone
89
Table 11 Concentrations of polychlorinated biphenyls (WHO-PCBs; ppt lw) in individual (n=22) blood
samples of green turtles (Chelonia mydas) from Boyne River estuary near Gladstone, Queensland.
EX
ID
Lipid
(%)77 81 126 169 105 114 118* 123 156 157 167 189
TEQ05†
S PCBs
2 0.14 <170 <55 <110 <170 <660 <220 <3300 <220 <660 <330 <440 <220 8.1
3 0.22 <97 <33 <65 <97 <390 <130 <2000 <130 <390 <200 <260 <130 4.8
22 0.086 (<200) (<78) <140 <210 <860 <290 <4300 <290 <860 <430 <570 <290 (<11)
7 0.062 (<290) (<110) (<210) <300 <1200 <620 <6000 <400 <1200 <600 <800 <400 (<15)
9 0.20 <75 <25 <50 <75 <300 <100 <1500 <100 <300 <150 250 <100 3.7
13 0.12 <160 <54 <110 <160 3300 <220 11000 390 2000 1300 1800 440 8.4
20 0.11 <170 <56 <180 <170 <670 <220 <3300 <220 <670 <330 <440 <220 11
25 0.23 <90 <49 <60 <90 <360 <120 <1800 <120 <360 <180 290 <120 4.4
30 0.13 <200 <65 <130 <200 <780 <260 <3900 <260 <780 <390 <520 <260 9.5
32 0.20 <100 <35 <69 <100 460 <140 <2100 <140 <410 <210 <280 <140 5.1
34 0.070 <230 <78 <160 <230 <940 <310 <4700 <310 <940 <470 800 <310 12
38 0.15 <130 <71 <86 <130 <510 <170 <2600 <170 <510 <260 <340 <170 6.3
41 0.18 <100 <57 <67 <100 440 <130 <2000 <130 <400 <200 <270 <130 4.9
42 0.23 <100 <44 <69 <100 <420 <140 <2100 <140 <420 <210 <280 <140 5.1
43 0.11 <140 <47 <94 <140 810 <190 2900 440 1000 400 1400 200 7.0
45 0.17 <110 <36 <150 <110 430 <150 <2100 <140 <430 <210 360 <140 9.0
46 0.17 <94 <31 <63 <94 <380 <130 <1900 <130 <380 <190 430 <130 4.6
47 0.14 <150 <51 <100 <150 <610 <200 <3100 <200 <610 <310 500 <200 7.5
48 0.11 <200 <65 <130 <200 <780 <260 <3900 <260 <780 <390 <520 <260 9.5
50 0.12 (<140) (<55) (<110) <150 <600 <360 <3000 <210 <600 330 590 230 (<7.6)
53 0.087 (<200) (<78) <290 <210 <860 <290 <4300 <290 <860 <430 <570 <290 (<18)
36 0.15 <130 <42 <110 <130 1900 180 5700 270 2600 1600 1800 520 7.9
Juveniles that were euthanised and necropsied
Live captured juveniles
Live captured adult
Non-ortho PCBs Mono-ortho PCBs
< Below the limit of detection (LOD) - the values given are the LOD; note: LOD is sometimes high, this is due to low volumes available for
analysis and matrix problems
( ) values that could not be determined analytically mostly due to interferances in the chromatogram. Predicted values are shown,
deduced from similar PCB composition profiles observed across all other blood samples
* Indicator PCB
† Middlebound TEQ reported: TEQ values (pg TEQ/g lw) are calculated by including the non-quantified congeners at half the value of their LOQ
(indicated by <)

Investigation of contaminant levels in green turtles from Gladstone
90
Table 12 Concentrations of organotins (ppb ww) in individual (n=7) blood samples of green turtles (Chelonia mydas) from Boyne River estuary near Gladstone,
Queensland.
MBT MBT-Sn DBT DBT-Sn TBT TBT-Sn TTBT TTBT-Sn MOT MOT-Sn DOT DOT-Sn TPhT TPhT-Sn TCHT TCHT-Sn
22 0.086 <6.8 <4.6 <6.8 <3.5 <20 <8.1 <15 <5.0 <6.8 <3.5 <27 <9.1 <6.8 <2.3 <39 <13
7 0.06 <8.6 <5.8 <8.6 <4.4 <8.6 <3.5 <19 <6.5 <8.6 <4.4 <10 <3.5 <8.6 <2.9 <30 <9.7
20 0.11 <8.6 <5.8 <8.6 <4.4 <13 <5.1 <27 <9.3 <8.6 <4.4 <8.6 <2.9 <8.6 <2.9 <30 <9.6
45 0.17 <8.6 <5.8 <17 <8.9 <19 <7.7 <20 <6.8 <7.0 <3.6 <20 <6.8 <8.6 <2.9 <40 <13
50 0.12 <9.4 <6.3 <20 <10 <13 <5.3 <19 <6.4 <9.4 <4.8 <9.9 <3.4 <9.4 <3.2 <30 <9.6
53 0.09 <8.7 <5.9 <10 <5.1 <27 <11 <22 <7.6 <16 <8.3 <10 <3.5 <10 <3.4 <41 <13
36 0.15 <8.7 <5.9 <10 <5.2 <13 <5.5 <20 <7.0 <11 <5.7 <8.7 <3.0 <8.7 <3.0 <31 <9.8
Dioctyltin Triphenyltin Tricyclohexyltin Lipid
(%)
EX
ID
Monobutyltin Dibutyltin Tributyltin Tetrabutyltin Monooctyltin
Juveniles that were euthanised and necropsied
Live captured juveniles
Live captured adult
< Below the limit of detection (LOD) - the values given are the LOD; note: LOD is sometimes high, this is due to low volumes available for analysis and matrix problems

Investigation of contaminant levels in green turtles from Gladstone
91
Table 13 Concentrations of bioaccumulative pesticides (ppb ww) in individual (n=7) blood samples of
green turtles (Chelonia mydas) from Boyne River estuary near Gladstone, Queensland.
EX Sample ID 22 7 20 45 50 53 36Lipid (%) 0.086 0.062 0.11 0.17 0.12 0.090 0.15
Bioaccumulative Pesticides (ppb ww)Aldrin <0.10 <0.10 <0.10 <0.10 <0.10 <0.10 <0.10
α-chlordane <0.020 <0.020 <0.020 <0.020 <0.020 <0.020 <0.020
γ-chlordane <0.020 <0.020 <0.020 <0.020 <0.020 <0.020 <0.020
o,p-DDT <0.024 <0.021 <0.020 <0.027 <0.020 <0.020 <0.020
p,p'-DDT <0.029 <0.024 <0.022 <0.032 <0.020 <0.023 <0.021
Dieldrin <0.068 <0.058 <0.062 <0.079 <0.059 <0.063 <0.057
α-endosulfan <0.18 <0.12 <0.13 <0.18 <0.13 <0.12 <0.10
β-endosulfan <0.20 <0.20 <0.20 <0.20 <0.20 <0.20 <0.20
Endosulfan sulphate <0.20 <0.20 <0.20 <0.20 <0.20 <0.20 <0.20
Endrin <0.12 <0.10 <0.11 <0.14 <0.10 <0.11 <0.099
α-HCH <0.020 <0.020 0.14 <0.020 <0.020 <0.020 <0.020
β-HCH <0.022 <0.021 <0.021 <0.027 <0.020 <0.025 <0.020
γ-HCH <0.020 <0.020 <0.020 <0.021 <0.020 <0.023 <0.020
Heptachlor <0.10 <0.10 <0.10 <0.10 <0.10 <0.10 <0.10
cis -heptachlor epoxide <0.061 <0.043 <0.041 <0.052 <0.042 <0.053 <0.035
trans -heptachlor epoxide <0.10 <0.10 <0.10 <0.10 <0.10 <0.10 <0.10
Hexachlorobenzene <0.030 <0.031 <0.045 <0.023 <0.026 <0.042 <0.028
Mirex <0.034 <0.024 <0.023 <0.029 <0.023 <0.030 <0.020
Octachlorostyrene <0.020 <0.020 <0.020 <0.020 <0.020 <0.020 <0.020
Oxychlordane <0.092 <0.061 <0.070 <0.095 <0.068 <0.063 <0.052
Pentachlorobenzene <0.020 <0.020 <0.020 0.03 <0.020 <0.034 <0.020
Toxaphene, Parlar 26 <0.15 <0.11 <0.10 <0.13 <0.10 <0.13 <0.085
Toxaphene, Parlar 50 <0.31 <0.22 <0.21 <0.26 <0.21 <0.27 <0.18
Toxaphene, Parlar 62 <0.62 <0.44 <0.42 <0.53 <0.43 <0.54 <0.35< Below the limit of quantification (LOQ)

Investigation of contaminant levels in green turtles from Gladstone
92
Table 14 Concentrations of metals and metalloids (ppb ww) in individual (n=40) blood samples of green
turtles (Chelonia mydas) from Boyne River estuary near Gladstone, Queensland.
EX
IDAg Al As Cd Co Cr Cu Fe Hg Mn Mo Ni Pb Se V Zn
2 0.47 ND 1100 34 140 1.8 670 44000 <0.22 28 7.5 3.7 3.5 850 13 5200
3 0.89 ND 570 26 260 1.3 620 33000 0.90 23 5.6 3.2 0.20 850 4.0 3800
22 7.1 ND 650 100 110 180 1900 79000 9.9 33 6.8 6.5 19 3300 12 9300
7 0.24 ND 20000 23 57 2.3 730 68000 8.6 24 7.5 1.7 6.6 2700 8.0 7900
8 0.15 ND 40 8.1 160 4.1 510 50000 <2.2 39 11 13 15 250 4.9 6500
9 0.20 ND 9300 61 220 3.8 740 78000 9.1 35 8.4 7.3 17 4500 8.2 9000
10 4.2 ND 2300 39 100 2.1 1200 66000 2.2 29 7.5 1.7 45 3100 4.9 6600
11 0.023 ND 1200 95 160 340 630 81000 28 43 7.3 7.2 19 3100 7.5 9600
13 0.72 ND 3500 62 46 3.8 950 61000 16 28 5.0 4.9 23 2200 19 7100
14 1.8 ND 610 30 73 1.9 1200 42000 5.4 24 7.0 1.7 3.8 1100 5.3 5700
15 0.13 ND 2400 54 120 2.3 790 57000 3.8 46 13 3.2 5.0 950 7.0 6700
20 <0.090 ND 3200 65 120 3.4 660 64000 4.7 28 10 9.0 8.0 2700 8.2 8400
21 0.14 ND 4100 37 99 3.2 610 66000 21 27 11 6.8 0.97 2000 7.0 7500
23 0.47 ND 2100 62 89 5.1 780 80000 12 39 5.5 6.3 38 5700 6.8 8800
24 <0.067 ND 5300 34 110 2.7 700 88000 38 47 11 0.67 13 8600 8.1 9000
25 0.057 ND 1200 38 250 3.5 550 49000 <0.72 23 6.1 7.6 7.5 1300 10 7200
26 0.040 ND 2000 56 95 3.5 720 73000 16 29 8.5 2.8 15 4400 9.9 9300
30 0.25 ND 260 12 440 7.1 600 68000 <0.90 41 5.8 4.2 76 170 10 9600
31 0.86 ND 87 14 160 3.4 1200 65000 0.66 38 5.4 4.8 36 960 35 9300
32 0.051 ND 280 9.7 360 4.2 700 91000 <1.9 36 16 17 10 120 17 12000
33 0.063 ND 600 38 140 3.1 830 80000 <0.96 73 13 5.8 21 670 37 11000
34 0.040 ND 1100 31 170 3.1 590 54000 1.2 23 19 5.8 13 620 7.2 8000
35 0.13 ND 230 9.0 220 4.0 770 79000 <2.5 32 9.3 3 56 350 21 11000
37 <0.10 ND 220 9.9 130 2.7 450 59000 <1.2 40 6.7 7.2 17 90 6.3 8100
38 0.20 ND 440 17 230 2.8 710 75000 <2.1 92 12 4.4 2.3 320 13 11000
39 0.38 ND 3000 44 68 1.9 910 47000 26 24 9.3 3.1 3.5 2600 4.5 5500
40 0.58 ND 130 78 50 2.8 1400 69000 0.68 26 16 4.0 36 2000 11 8300
41 <0.033 ND 170 15 210 4.1 680 73000 <0.44 58 9.5 6.9 15 220 5.7 10000
42 1.4 ND 1400 39 73 1.5 840 45000 11 16 4.6 1.0 <2.2 4600 3.5 5800
43 0.80 ND 6400 68 28 3.4 950 84000 35 19 83 3.4 15 8400 5.9 9800
44 1.2 ND 5000 28 67 1.8 470 51000 33 32 6.0 3.7 9.5 1600 13 5500
45 0.12 ND 1500 19 190 2.6 670 53000 1.3 27 6.7 7.6 19 640 8.2 7400
46 0.86 ND 900 41 43 1.7 790 51000 4.5 17 5.8 1.4 16 730 27 6200
47 0.36 ND 930 73 49 2.1 590 54000 25 22 4.9 4.1 22 770 30 6800
48 1.5 ND 330 10 340 3.7 740 82000 <2.0 51 16 10 13 84 6.8 11000
49 0.23 ND 2000 110 62 4.3 970 96000 6.0 36 11 1.4 34 1500 38 10000
50 0.34 ND 3200 65 110 3.4 580 70000 30 37 16 5.5 6.6 2300 14 9600
51 0.012 ND 790 19 260 3.6 530 64000 <2.4 34 7.4 5.7 17 350 6.5 8500
53 <0.14 ND 250 8.5 140 3.4 780 86000 <1.1 52 10 9.5 19 140 8.0 11000
36 <0.011 ND 1400 8.6 150 2.7 530 70000 <2.9 22 9.7 0.86 33 430 14 11000
Juveniles that were euthanised and necropsied
Live captured juveniles
Live captured adult
Blood (ppb ww)
ND No data
< Below the limit of detection (LOD), the values given are the LOD; note LOD is sometimes high, this is due to low volumes available for analysis
and matrix problems

Investigation of contaminant levels in green turtles from Gladstone
93
Table 15 Concentration of metals and metalloids (ppm ww) in liver and kidney of individual (n=3) green
turtles (Chelonia mydas) from Boyne River estuary near Gladstone, Queensland.
EX
IDAg Al As Cd Co Cr Cu Fe Hg Mn Mo Ni Pb Se V Zn
2 ND 2.4 2.0 13 0.95 0.092 84 1900 0.86 2.3 0.40 0.17 0.20 4.0 0.79 41
3 ND 3.5 2.0 15 0.93 0.29 67 1100 1.6 2.6 0.39 0.19 0.12 5.0 0.23 44
22 ND 2.4 2.0 24 2.3 0.16 100 2800 1.5 2.5 0.83 0.23 0.17 7.2 0.32 51
2 ND 0.48 1.2 17 0.99 0.18 9.4 11 0.15 0.48 0.062 26 0.15 0.62 0.34 20
3 ND 0.28 1.5 36 2.2 0.17 1.8 12 0.39 0.63 0.13 0.42 0.092 0.97 0.23 40
22 ND 0.40 0.88 90 3.2 0.62 2.1 21 0.72 0.87 0.30 0.89 0.047 2.4 0.34 39
Kidney (ppm ww)
Juveniles that were euthanised and necropsied
Liver (ppm ww)
Juveniles that were euthanised and necropsied
ND No data

Investigation of contaminant levels in green turtles from Gladstone
94
8.2 COMPARISONS OF CONTAMINANT CONCENTRATIONS IN SEA
TURTLES

Investigation of contaminant levels in green turtles from Gladstone
95
8.2.1 Aluminium (Al)
Turtle
species n Country Location
Location/source
information
Health & other
information Age class Gender Mean Min Max
Reference
Blood (ppb ww)
Green 40 Australia Gladstone Industrialised port estuary Unhealthy, incl.
moribund and healthy Juveniles
Males and
females ND ND ND
This study
Green 30 USA San Diego Highly urbanised &
contaminated estuary
Live captured
specimens
Juveniles,
Adults
Unknown
gender 150 ND ND
Komoroske et
al 2011
Kidney (ppm ww)
Green 3 Australia Gladstone Industrialised port estuary Unhealthy, incl.
moribund and healthy Juveniles
Males and
females 0.39 0.28 0.48
This study
Green 4 USA Hawaii Agricultural areas Stranded specimens
Males and
females 1.5 1.0 2.0
Aguirre et al
1994
Green 5 USA Hawaii Agricultural areas
Moribund specimens
with severe
fibropapilloma
Juveniles Males and
females 1.2 1.0 2.0
Aguirre et al
1994
Loggerhead 78 Spain Canary Islands, Mediterranean
Generally considered relatively contaminated areas; high Ni levels
Stranded Juveniles and subadults
Mainly females
0.72 0.030 7.6
Torrent et al 2004
Liver (ppm ww)
Green 3 Australia Gladstone Industrialised port estuary Unhealthy, incl.
moribund and healthy Juveniles
Males and
females 2.8 2.4 3.5
This study
Green 3 USA Hawaii Agricultural areas Stranded specimens
Males and
females 4.0 3.0 5.0
Aguirre et al
1994
Green 6 USA Hawaii Agricultural areas
Moribund specimens
with severe
fibropapilloma
Juveniles Males and
females 1.7 1.0 3.0
Aguirre et al
1994

Investigation of contaminant levels in green turtles from Gladstone
96
Green 1 USA Control, captive Agricultural areas Captive specimen Adult Female 1.0 ND ND
Aguirre et al
1994
Loggerhead 78 Spain Canary Islands Generally considered relatively contaminated areas; high Ni levels
Stranded Juveniles and sub-adults
Males and females
2.2 0.53 31
Torrent et al 2004
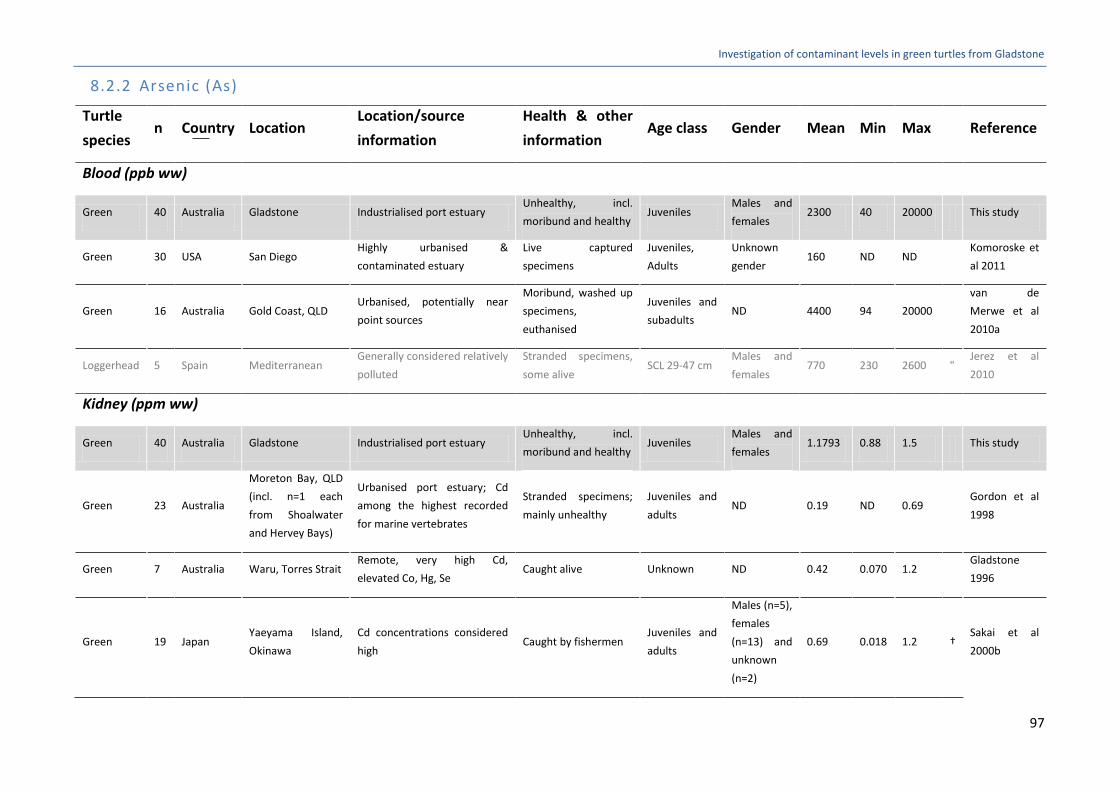
Investigation of contaminant levels in green turtles from Gladstone
97
8.2.2 Arsenic (As)
Turtle
species n Country Location
Location/source
information
Health & other
information Age class Gender Mean Min Max Reference
Blood (ppb ww)
Green 40 Australia Gladstone Industrialised port estuary Unhealthy, incl.
moribund and healthy Juveniles
Males and
females 2300 40 20000 This study
Green 30 USA San Diego Highly urbanised &
contaminated estuary
Live captured
specimens
Juveniles,
Adults
Unknown
gender 160 ND ND
Komoroske et
al 2011
Green 16 Australia Gold Coast, QLD Urbanised, potentially near
point sources
Moribund, washed up
specimens,
euthanised
Juveniles and
subadults ND 4400 94 20000
van de
Merwe et al
2010a
Loggerhead 5 Spain Mediterranean Generally considered relatively
polluted
Stranded specimens,
some alive SCL 29-47 cm
Males and
females 770 230 2600 "
Jerez et al
2010
Kidney (ppm ww)
Green 40 Australia Gladstone Industrialised port estuary Unhealthy, incl.
moribund and healthy Juveniles
Males and
females 1.1793 0.88 1.5 This study
Green 23 Australia
Moreton Bay, QLD
(incl. n=1 each
from Shoalwater
and Hervey Bays)
Urbanised port estuary; Cd
among the highest recorded
for marine vertebrates
Stranded specimens;
mainly unhealthy
Juveniles and
adults ND 0.19 ND 0.69
Gordon et al
1998
Green 7 Australia Waru, Torres Strait Remote, very high Cd,
elevated Co, Hg, Se Caught alive Unknown ND 0.42 0.070 1.2
Gladstone
1996
Green 19 Japan Yaeyama Island,
Okinawa
Cd concentrations considered
high Caught by fishermen
Juveniles and
adults
Males (n=5),
females
(n=13) and
unknown
(n=2)
0.69 0.018 1.2 † Sakai et al
2000b

Investigation of contaminant levels in green turtles from Gladstone
98
Green 2
Hong
Kong,
China
South China Sea
Urban and industrial area;
exposed to relatively high
levels of Se
Stranded specimens Juveniles ND 0.84 ND ND † Lam et al
2004
Green 14 Turkey Southwest
Mediterranean
Generally considered relatively
contaminated
Stranded specimens
from nesting
population, mainly
fishing related deaths
Adults and
subadults
Mostly
females 1.7 0.62 2.5 †
Kaska et al
2004
Green 6 Japan Ishigaki Island,
Okinawa
As levels higher or similar to
other regions Caught by fishermen
SCL average
43.7
(females),
41.4 (males)
Females
(n=17) and
males (n=3)
2.0 ND ND † Agusa et al
2008a
Green 20 Japan Ishigaki Island,
Okinawa
As levels higher or similar to
other regions Caught by fishermen
SCL 38.6-53.4
cm
Unknown
gender 2.0 0.55 5.3 †
Agusa et al
2008b
Green 16 Australia Gold Coast, QLD Urbanised, potentially near
point sources
Moribund, washed up
specimens,
euthanised
Juveniles and
subadults ND 2.7 0.12 9.3
van de
Merwe et al
2010a
Green 1 USA Hawaii Agricultural areas Stranded specimens ND Males and
females 6.8 ND ND
Aguirre et al
1994
Hawksbill 2 Australia Moreton Bay, QLD
Urbanised port estuary; Cd
among the highest recorded
for marine vertebrates
Stranded specimens;
mainly unhealthy Unknown ND ND 0.13 0.93
Gordon et al
1998
Hawksbill 4 Japan Yaeyama Island,
Okinawa As levels very high Caught by fishermen SCL 38-58 cm
Females
(n=3) and
unknown
(n=1)
3.4 1.0 4.4 † Saeki et al
2000
Hawksbill 6 Japan Ishigaki Island,
Okinawa
Extremely high As, particularly
in muscle Caught by fishermen
SCL average
40.9 Females 5.4 ND ND †
Agusa et al
2008a
Loggerhead 3 Australia Moreton Bay, QLD
Urbanised port estuary; Cd
among the highest recorded
for marine vertebrates
Stranded specimens;
mainly unhealthy Unknown ND 0.71 0.24 1.2
Gordon et al
1998

Investigation of contaminant levels in green turtles from Gladstone
99
Loggerhead 4 Japan North Pacific Cd concentrations considered
high Caught by fishermen
Juveniles and
adults
Females
(n=2) and
unknown
(n=2)
1.1 0.48 2.4 † Saeki et al
2000
Loggerhead 20 Turkey Southwest
Mediterranean
Generally considered relatively
contaminated
Stranded specimens
from nesting
population, mainly
fishing related deaths
Adults and
subadults ND 2.3 0.12 4.2 †
Kaska et al
2004
Loggerhead 78 Spain Canary Islands,
Mediterranean
Generally considered relatively
contaminated areas Stranded
Juveniles and
subadults
Mainly
females
(n=67)
14 1.2 120 Torrent et al
2004
Liver (ppm ww)
Green 40 Australia Gladstone Industrialised port estuary Unhealthy, incl.
moribund and healthy Juveniles
Males and
females 2.0115 2.0 1.9662 This study
Green 23 Australia
Moreton Bay, QLD
(incl. n=1 each
from Shoalwater
and Hervey Bays)
Urbanised port estuary; Cd
among the highest recorded
for marine vertebrates
Stranded specimens;
mainly unhealthy
Juveniles and
adults ND 0.26 0.040 0.74
Gordon et al
1998
Green 19 Japan Yaeyama Island,
Okinawa
Cd concentrations considered
high Caught by fishermen
Juveniles and
adults
Males (n=5),
females
(n=13) and
unknown
(n=2)
0.39 0.10 1.2 † Sakai et al
2000b
Green 2
Hong
Kong,
China
South China Sea
Urban and industrial area;
exposed to relatively high
levels of Se
Stranded specimens Juveniles ND 1.0 ND ND † Lam et al
2004
Green 5 Japan Ishigaki Island,
Okinawa
As levels higher or similar to
other regions Caught by fishermen
SCL average
43.7
(females),
41.4 (males)
Females
(n=17) and
males (n=3)
1.1 ND ND † Agusa et al
2008a

Investigation of contaminant levels in green turtles from Gladstone
100
Green 20 Japan Ishigaki Island,
Okinawa
As levels higher or similar to
other regions Caught by fishermen
SCL 38.6-53.4
cm
Unknown
gender 1.2 0.20 2.1 †
Agusa et al
2008b
Green 5 Japan Ishigaki Island,
Okinawa Caught alive ND ND 1.2 0.80 2.3
Fujihara et al
2003
Green 7 Australia Waru, Torres Strait Remote, very high Cd,
elevated Co, Hg, Se Caught alive Unknown ND 1.5 0.42 4.3
Gladstone
1996
Green 22 Turkey Southwest
Mediterranean
Generally considered relatively
contaminated
Stranded specimens
from nesting
population, mainly
fishing related deaths
Adults and
subadults
Mostly
females 2.1 0.31 3.7 †
Kaska et al
2004
Green 16 Australia Gold Coast, QLD Urbanised, potentially near
point sources
Moribund, washed up
specimens,
euthanised
Juveniles and
subadults ND 3.2 0.63 9.7
van de
Merwe et al
2010a
Green 2 USA Hawaii Agricultural areas Stranded specimens ND Males and
females 3.7 0.90 6.4
Aguirre et al
1994
Hawksbill 4 Japan Yaeyama Island,
Okinawa As levels very high Caught by fishermen SC 38-58 CM
Females
(n=3) and
unknown
(n=1)
3.4 1.1 7.2 † Saeki et al
2000
Hawksbill 5 Japan Ishigaki Island,
Okinawa ND Caught alive ND ND 4.4 0.66 7.5
Fujihara et al
2003
Hawksbill 10 Japan Ishigaki Island,
Okinawa
Extremely high As, particularly
in muscle Caught by fishermen
SCL average
40.9 Females 5.5 ND ND †
Agusa et al
2008a
Hawksbill 2 Australia Moreton Bay, QLD
Urbanised port estuary; Cd
among the highest recorded
for marine vertebrates
Stranded specimens;
mainly unhealthy Unknown ND ND 0.18 1.9
Gordon et al
1998
Loggerhead 6 Australia Moreton Bay, QLD
Urbanised port estuary; Cd
among the highest recorded
for marine vertebrates
Stranded specimens;
mainly unhealthy Unknown ND 0.46 ND 1.6
Gordon et al
1998

Investigation of contaminant levels in green turtles from Gladstone
101
Loggerhead 4 Japan North Pacific Cd concentrations considered
high Caught by fishermen
Juveniles and
adults
Females
(n=2) and
unknown
(n=2)
1.4 0.93 2.1 † Saeki et al
2000
Loggerhead 32 Turkey Southwest
Mediterranean
Generally considered relatively
contaminated
Stranded specimens
from nesting
population, mainly
fishing related deaths
Adults and
subadults ND 3.1 0.48 5.4 †
Kaska et al
2004
Loggerhead 7 Italy
Apulian coast
(South Adriatic
sea)
Pooled sample Stranded specimens Weight 1.8-90
kg ND 6.9 14 ND
Storelli &
Marcotrigiano
2000

Investigation of contaminant levels in green turtles from Gladstone
102
8.2.3 Cadmium (Cd)
Turtle
species n Country Location
Location/source
information
Health &
other
information
Age
class Gender Mean Min Max Reference
Blood (ppb ww)
Green 3 Australia Gladstone Industrialised port estuary
Unhealthy, incl.
moribund and
healthy
Juveniles Males and
females 40 8.1 110 This study
Green 19 USA San Diego Highly urbanised &
contaminated estuary
Live captured
specimens
Juveniles,
Adults
Unknown
gender 13 ND ND
Komoroske et al
2011
Green 14 Mexico Bahia Magdalena
Relatively pristine,
agriculture, shipyards &
urban wastewater
discharge, 19th century
mining; Cd, Zn, Cu and Pb
high in sediments
Live captured
specimens,
apparently healthy
Juveniles Unknown
gender 30 10 50 ˄
Labrada-Martagón
et al 2011
Green 16 Australia Gold Coast, QLD Urbanised, potentially near
point sources
Moribund, washed
up specimens,
euthanised
Juveniles
and
subadults
Males and
females 35 1.1 122
van de Merwe et al
2010a
Green 42 Mexico Punta Abreojos
Relatively pristine,
agriculture, shipyards &
urban wastewater
discharge, 19th century
mining; Cd, Zn, Cu and Pb
high in sediments
Live captured
specimens,
apparently healthy
Juveniles Unknown
gender 60 8.0 120 ˄
Labrada-Martagón
et al 2011
Flatback 20 Australia Curtis Isl, QLD Off the coast of Gladstone Live, nesting
Young
adults to
adults
Females <0.1 ND ND Ikonomopoulou et al
2011

Investigation of contaminant levels in green turtles from Gladstone
103
Olive Ridley 25 Mexico Oaxaca Various possible sources
along migration route Live, nesting Adults Females 12 ND ND #
Paez-Osuna et al
2010
Kidney (ppm ww)
Green 40 Australia Gladstone Industrialised port estuary
Unhealthy, incl.
moribund and
healthy
Juvenile Males and
females 47 17 90 This study
Green 15 Brazil Cananeia Estuary
Pollution considered
negligible (but 200 km
south of major industrial
area of Brazil)
Stranded Juvenile ND 0.12 ND ND † Barbieri et al 2009
Green 15 Brazil Cananeia Estuary
Pollution considered
negligible (but 200 km
south of major industrial
area of Brazil)
Stranded Adult ND 0.26 ND ND † Barbieri et al 2009
Green 2
Hong
Kong,
China
South China Sea Urban and industrial area Stranded
specimens Juveniles ND 0.30 ND ND † Lam et al 2004
Green 1 Cyprus Northern Cyprus,
Mediterranean
Generally contaminated,
presence of natural Hg bed
Stranded
specimens Juveniles ND 1.0 ND ND * Godley et al 1999
Green 14 Turkey Southwest
Mediterranean
Generally considered
relatively contaminated
Stranded
specimens from
nesting population,
mainly fishing
related deaths
Adults
and
subadults
Mostly
females 1.9 0.66 2.8 † Kaska et al 2004
Green 33 Costa Rica Tortuguero National
Park, North Carribean Cd considered background
Dead, nesting
turtles, killed by
jaguars
ND Pooled
sample 4.7 ND ND † Andreani et al 2008
Green 7 Italy Adreaiatic and Ionian
Seas, Mediterranean
Generally considered
contaminated Stranded Juveniles
Unknown
gender 5.1 2.2 7.5 Storelli et al 2008

Investigation of contaminant levels in green turtles from Gladstone
104
Green 5 USA Pelagic, Hawaii Agricultural areas Stranded
specimens ND
Males and
females 10 4.7 10 Aguirre et al 1994
Green 8 Mexico Magdalena Bay, Baja
California
19th century mining - Cd,
Zn, Cu and Pb in sediments
above those in
industrialised regions; Cd
considered elevated
Specimens
drowned in fishing
nets
SCL 47-77
cm
Unknown
gender 13 7.8 78 †
Talavera-Saenz et al
2007
Green 38 Australia
Moreton Bay, QLD (incl.
n=1 each from
Shoalwater and Hervey
Bays)
Urbanised port estuary; Cd
among the highest
recorded for marine
vertebrates
Stranded
specimens; mainly
unhealthy
Juveniles
and adults ND 15 1.7 76 Gordon et al 1998
Green 1 USA Control, Captive Agricultural areas Captive specimen ND Female 22 ND ND Aguirre et al 1994
Green 7 Australia Waru, Torres Strait Remote, very high Cd,
elevated Co, Hg, Se Caught alive ND ND 26 12 42 Gladstone et al 1996
Green 25 Japan Yaeyama Islands,
Okinawa Prefecture
Renal Cd levels considered
extremely high Fishing nets
Mostly
juveniles
Males and
females 28 4.0 60 ‡ Anan et al 2001
Green 23 Japan Yaeyama Isl, Okinawa Cd concentrations
considered high
Caught by
fishermen
Juveniles
and adults
Unknown
gender 39 7.3 81 Sakai et al 2000b
Green 2 Japan HahaJima/OgaSawara
Isl
Relatively high Cd
concentrations
Collected in coastal
waters Mature
Male and
female 41 37 46 Sakai et al 2000a
Green 6 USA Ahu-O-Laka, Kaneohe,
HI Agricultural areas
Moribund
specimens with
severe
fibropapilloma
Juveniles Males and
females 42 16 70 Aguirre et al 1994
Green 16 Australia Gold Coast, QLD Urbanised, potentially near
point sources
Moribund, washed
up specimens,
euthanised
Juvenile
and
subadult
ND 46 13 100 van de Merwe et al
2010a
Hawksbill 3 Australia Moreton Bay, QLD Urbanised port estuary; Cd
among the highest
Stranded
specimens; mainly Unknown ND ND 3.6 13 Gordon et al 1998

Investigation of contaminant levels in green turtles from Gladstone
105
recorded for marine
vertebrates
unhealthy
Hawksbill 19 Japan Yaeyama Islands,
Okinawa Prefecture
Renal Cd levels considered
extremely high Fishing nets
Mostly
juveniles
Males and
females 18 4.0 60 ‡ Anan et al 2001
Loggerhead 9 Italy Cesenatico & Sicily
Island, Mediterranean Cd considered background Stranded ND ND 0.70 ND ND † Andreani et al 2008
Loggerhead 20 Turkey Southwest
Mediterranean
Generally considered
relatively contaminated
Stranded
specimens from
nesting population,
mainly fishing
related deaths
Adults
and
subadults
Mostly
females 2.0 0.38 4.0 † Kaska et al 2004
Loggerhead 78 Spain Canary Islands,
Mediterranean
Generally considered
relatively contaminated
areas
Stranded
Juveniles
and
subadults
Mainly
females
(n=67)
5.0 0.010 61 Torrent et al 2004
Loggerhead 19 Italy Adreaiatic and Ionian
Seas, Mediterranean
Generally considered
contaminated; Cd
considered high enough to
affect health
Stranded Mainly
juvenile
Unknown
gender 8.4 1.3 16 Storelli et al 2005
Loggerhead 2 Cyprus Northern Cyprus,
Mediterranean
Generally contaminated,
presence of natural Hg bed
Stranded
specimens Juveniles ND 8.5 5.3 12 * Godley et al 1999
Loggerhead 5 France French Atlantic Coast Cd considered high Stranded, dead Juvenile ND 13 1.7 36 Caurant et al 1999
Loggerhead 5 Australia Moreton Bay, QLD
Urbanised port estuary; Cd
among the highest
recorded for marine
vertebrates
Stranded
specimens; mainly
unhealthy
Juveniles
and adults ND 28 11 39 Gordon et al 1998
Loggerhead 7 Japan Cape Ashizuri, Kochi
Highest Cd in specimens
with symptoms of kidney
congestion
Fishing net
entanglement
Adults
(SCL 76-
92)
Females
(n=6) and
n=1 male
39 18 57 Sakai et al 1995
Sakai et al 2000a

Investigation of contaminant levels in green turtles from Gladstone
106
Leatherback 5 France French Atlantic Coast Cd considered high Stranded, dead Juvenile ND 30 8.5 62 Caurant et al 1999
Olive Ridley 1 Australia Moreton Bay, QLD
Urbanised port estuary; Cd
among the highest
recorded for marine
vertebrates
Stranded
specimens; mainly
unhealthy
Unknown ND 30 ND ND Gordon et al 1998
Liver (ppm ww)
Green 3 Australia Gladstone Industrialised port estuary
Unhealthy, incl.
moribund and
healthy
Juvenile Males and
females 17 13 24 This study
Green 15 Brazil Cananeia Estuary
Pollution considered
negligible (but 200 km
south of major industrial
area of Brazil)
Stranded Juvenile ND 0.061 ND ND † Barbieri et al 2009
Green 50 Sultanate
of Oman
Ras Al-Hadd Turtle
Reserve ND
Eggs collected from
nest Hatchling ND 0.21 ND ND Al-Rawahy et al 2007
Green 15 Brazil Cananeia Estuary
Pollution considered
negligible (but 200 km
south of major industrial
area of Brazil)
Stranded Adult ND 0.21 ND ND † Barbieri et al 2009
Green 2
Hong
Kong,
China
South China Sea Urban and industrial area Stranded
specimens Juveniles ND 0.24 ND ND † Lam et al 2004
Green 4
Hong
Kong,
China
South China Sea Urban and industrial area Stranded
specimens Adults ND 0.32 ND ND † Lam et al 2004
Green 6 Cyprus Northern Cyprus,
Mediterranean
Generally contaminated,
presence of natural Hg bed
Stranded
specimens Juveniles ND 1.3 0.56 2.4 * Godley et al 1999
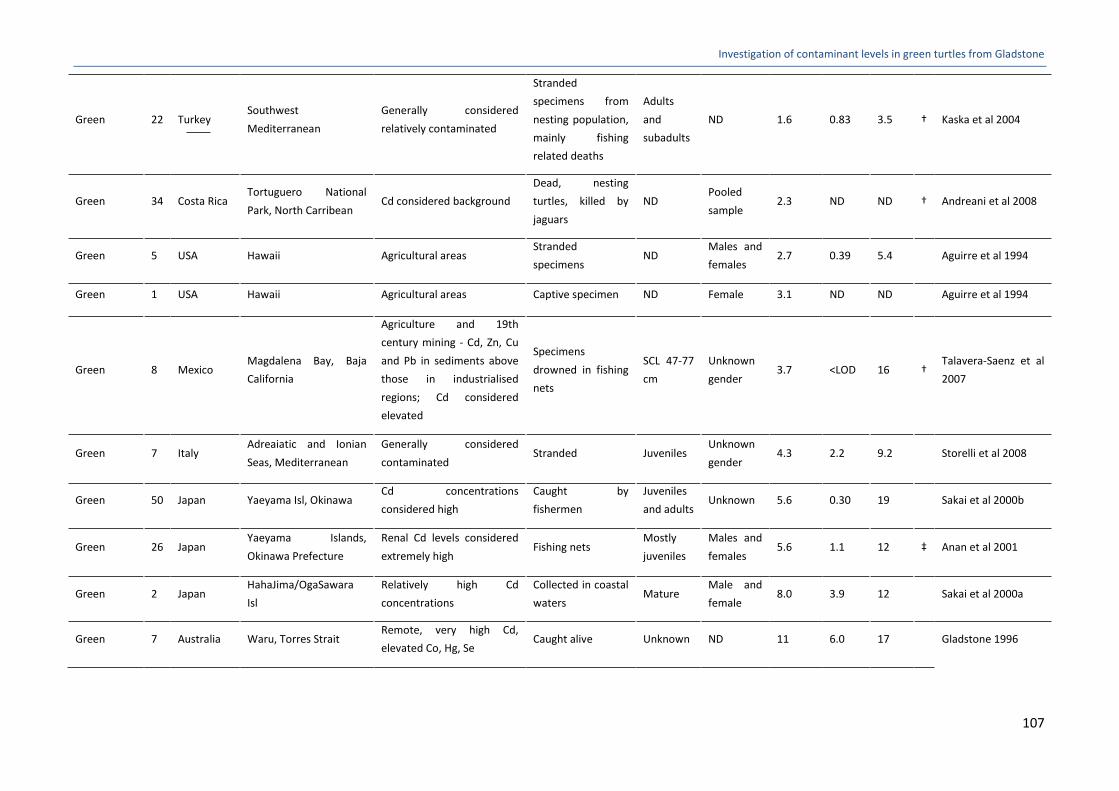
Investigation of contaminant levels in green turtles from Gladstone
107
Green 22 Turkey Southwest
Mediterranean
Generally considered
relatively contaminated
Stranded
specimens from
nesting population,
mainly fishing
related deaths
Adults
and
subadults
ND 1.6 0.83 3.5 † Kaska et al 2004
Green 34 Costa Rica Tortuguero National
Park, North Carribean Cd considered background
Dead, nesting
turtles, killed by
jaguars
ND Pooled
sample 2.3 ND ND † Andreani et al 2008
Green 5 USA Hawaii Agricultural areas Stranded
specimens ND
Males and
females 2.7 0.39 5.4 Aguirre et al 1994
Green 1 USA Hawaii Agricultural areas Captive specimen ND Female 3.1 ND ND Aguirre et al 1994
Green 8 Mexico Magdalena Bay, Baja
California
Agriculture and 19th
century mining - Cd, Zn, Cu
and Pb in sediments above
those in industrialised
regions; Cd considered
elevated
Specimens
drowned in fishing
nets
SCL 47-77
cm
Unknown
gender 3.7 <LOD 16 †
Talavera-Saenz et al
2007
Green 7 Italy Adreaiatic and Ionian
Seas, Mediterranean
Generally considered
contaminated Stranded Juveniles
Unknown
gender 4.3 2.2 9.2 Storelli et al 2008
Green 50 Japan Yaeyama Isl, Okinawa Cd concentrations
considered high
Caught by
fishermen
Juveniles
and adults Unknown 5.6 0.30 19 Sakai et al 2000b
Green 26 Japan Yaeyama Islands,
Okinawa Prefecture
Renal Cd levels considered
extremely high Fishing nets
Mostly
juveniles
Males and
females 5.6 1.1 12 ‡ Anan et al 2001
Green 2 Japan HahaJima/OgaSawara
Isl
Relatively high Cd
concentrations
Collected in coastal
waters Mature
Male and
female 8.0 3.9 12 Sakai et al 2000a
Green 7 Australia Waru, Torres Strait Remote, very high Cd,
elevated Co, Hg, Se Caught alive Unknown ND 11 6.0 17 Gladstone 1996

Investigation of contaminant levels in green turtles from Gladstone
108
Green 38 Australia
Moreton Bay, QLD (incl.
n=1 each from
Shoalwater and Hervey
Bays)
Urbanised port estuary; Cd
among the highest
recorded for marine
vertebrates
Stranded
specimens; mainly
unhealthy
Juveniles
and adults ND 13 2.5 57 Gordon et al 1998
Green 16 Australia Gold Coast, QLD Urbanised, potentially near
point sources
Moribund, washed
up specimens,
euthanised
Juvenile
and
subadult
ND 14 4.3 32 van de Merwe et al
2010a
Green 6 USA Hawaii Agricultural areas
Moribund
specimens with
severe
fibropapilloma
Juveniles Males and
females 16 5 26 Aguirre et al 1994
Hawksbill 22 Japan Yaeyama Islands,
Okinawa Prefecture
Renal Cd levels considered
extremely high Fishing nets
Mostly
juveniles
Males and
females 2.2 0.56 10 ‡ Anan et al 2001
Hawksbill 3 Australia Moreton Bay, QLD
Urbanised port estuary; Cd
among the highest
recorded for marine
vertebrates
Stranded
specimens; mainly
unhealthy
Unknown ND ND 2.4 6 Gordon et al 1998
Leatherback 18 France French Atlantic Coast Cd considered high Stranded, dead Juvenile ND 6.8 0.60 15 Caurant et al 1999
Loggerhead 11 Italy Cesenatico & Sicily
Island, Mediterranean Cd considered background Stranded ND ND 0.53 ND ND † Andreani et al 2008
Loggerhead 4 Cyprus Northern Cyprus,
Mediterranean
Generally contaminated,
presence of natural Hg bed
Stranded
specimens Juveniles ND 1.9 1.1 2.9 * Godley et al 1999
Loggerhead 32 Turkey Southwest
Mediterranean
Generally considered
relatively contaminated
Stranded
specimens from
nesting population,
mainly fishing
related deaths
Adults
and
subadults
ND 2.4 0.7502 4.2 † Kaska et al 2004
Loggerhead 78 Spain Canary Islands,
Mediterranean Generally considered
relatively contaminated Stranded Juveniles
and
Mainly
females 2.5 0.040 22 Torrent et al 2004

Investigation of contaminant levels in green turtles from Gladstone
109
areas subadults (n=67)
Loggerhead 7 France French Atlantic Coast Cd considered high Stranded, dead Juvenile ND 2.6 0.30 12 Caurant et al 1999
Loggerhead 19 Italy Adreaiatic and Ionian
Seas, Mediterranean
Generally considered
contaminated; Cd
considered high enough to
affect health
Stranded Mainly
juvenile
Unknown
gender 3.4 1.1 7 Storelli et al 2005
Loggerhead 7 Japan Cape Ashizuri, Kochi
Highest Cd in specimens
with symptoms of kidney
congestion
Fishing net
entanglement
Adults
(SCL 76-
92)
Females
(n=6) and
n=1 male
9.3 5.7 15 Sakai et al 1995
Sakai et al 2000a
Loggerhead 8 Australia
Moreton Bay, QLD (incl.
n=2 Shoalwater &
Hervey Bays)
Urbanised port estuary; Cd
among the highest
recorded for marine
vertebrates
Stranded
specimens; mainly
unhealthy
Juveniles
and adults ND 16 7.3 35 Gordon et al 1998
Olive Ridley 1 Australia Moreton Bay, QLD
Urbanised port estuary; Cd
among the highest
recorded for marine
vertebrates
Stranded
specimens; mainly
unhealthy
Unknown ND 6.4 ND ND Gordon et al 1998

Investigation of contaminant levels in green turtles from Gladstone
110
8.2.4 Chromium (Cr)
Turtle
species n Country Location
Location/source
information Health & other information Age class Gender Mean Min Max Reference
Blood (ppb ww)
Green 40 Australia Gladstone Industrialised port estuary Unhealthy, incl. moribund and
healthy Juveniles
Males and
females 16 1.3 340 This study
Kidney (ppm ww)
Green 40 Australia Gladstone Industrialised port estuary Unhealthy, incl. moribund and
healthy Juveniles
Males and
females 0.32 0.17 0.62 This study
Green 2 Hong Kong,
China South China Sea
Urban and industrial area;
exposed to relatively high
levels of Se
Stranded specimens Juveniles ND 0.13 ND ND † Lam et al
2004
Green 14 Turkey Southwest
Mediterranean
Generally considered
relatively contaminated
Stranded specimens from
nesting population, mainly
fishing related deaths
Adults and
subadults
Mostly
females 0.31 0.079 1.4 †
Kaska et al
2004
Green 1 USA Control, Captive Agricultural areas Captive specimen ND Female 0.40 ND ND Aguirre et al
1994
Green 25 Japan Yaeyama Islands,
Okinawa Prefecture
Renal Cd levels considered
extremely high Fishing nets
Mostly
juveniles
Males and
females 0.43 0.27 0.74 ‡
Anan et al
2001
Hawksbill 19 Japan Yaeyama Islands,
Okinawa Prefecture
Renal Cd levels considered
extremely high Fishing nets
Mostly
juveniles
Males and
females 0.31 0.059 0.57 ‡
Anan et al
2001
Loggerhead 20 Turkey Southwest
Mediterranean
Generally considered
relatively contaminated
Stranded specimens from
nesting population, mainly
fishing related deaths
Adults and
subadults ND 0.25 0.14 0.34 †
Kaska et al
2004
Liver (ppm ww)
Green 40 Australia Gladstone Industrialised port estuary Unhealthy, incl. moribund and Juveniles Males and 0.18 0.092 0.293 This study
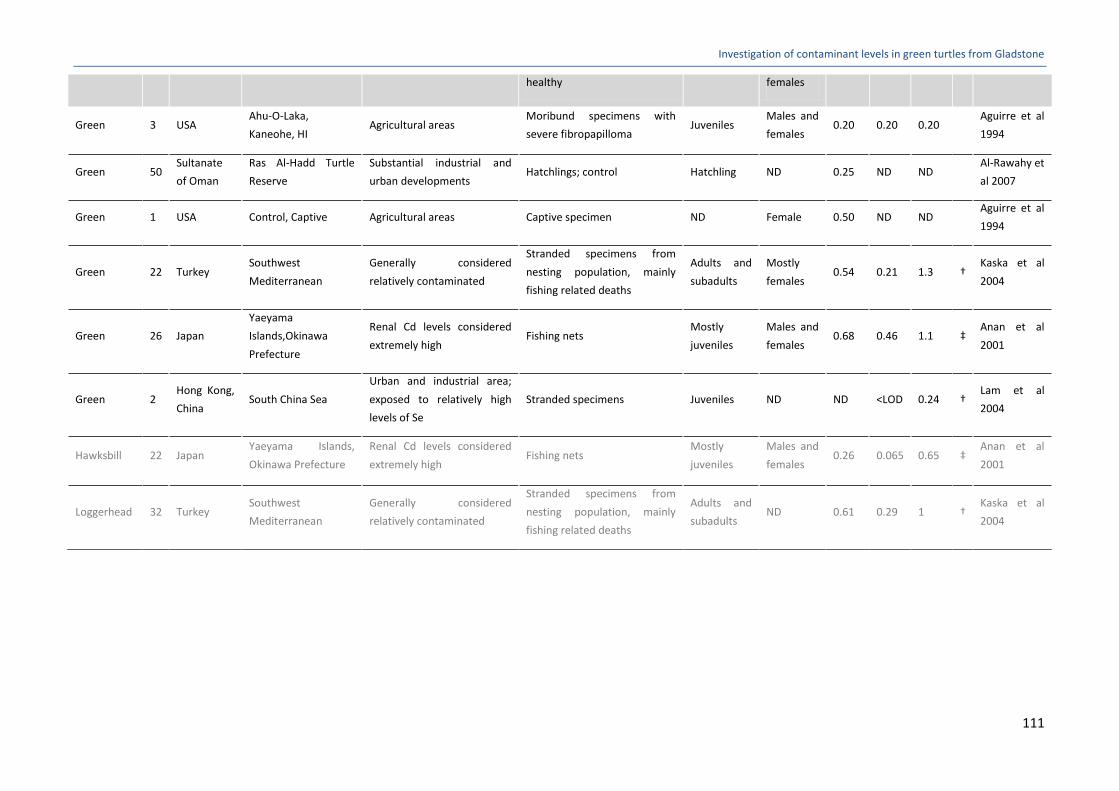
Investigation of contaminant levels in green turtles from Gladstone
111
healthy females
Green 3 USA Ahu-O-Laka,
Kaneohe, HI Agricultural areas
Moribund specimens with
severe fibropapilloma Juveniles
Males and
females 0.20 0.20 0.20
Aguirre et al
1994
Green 50 Sultanate
of Oman
Ras Al-Hadd Turtle
Reserve
Substantial industrial and
urban developments Hatchlings; control Hatchling ND 0.25 ND ND
Al-Rawahy et
al 2007
Green 1 USA Control, Captive Agricultural areas Captive specimen ND Female 0.50 ND ND Aguirre et al
1994
Green 22 Turkey Southwest
Mediterranean
Generally considered
relatively contaminated
Stranded specimens from
nesting population, mainly
fishing related deaths
Adults and
subadults
Mostly
females 0.54 0.21 1.3 †
Kaska et al
2004
Green 26 Japan
Yaeyama
Islands,Okinawa
Prefecture
Renal Cd levels considered
extremely high Fishing nets
Mostly
juveniles
Males and
females 0.68 0.46 1.1 ‡
Anan et al
2001
Green 2 Hong Kong,
China South China Sea
Urban and industrial area;
exposed to relatively high
levels of Se
Stranded specimens Juveniles ND ND <LOD 0.24 † Lam et al
2004
Hawksbill 22 Japan Yaeyama Islands,
Okinawa Prefecture
Renal Cd levels considered
extremely high Fishing nets
Mostly
juveniles
Males and
females 0.26 0.065 0.65 ‡
Anan et al
2001
Loggerhead 32 Turkey Southwest
Mediterranean
Generally considered
relatively contaminated
Stranded specimens from
nesting population, mainly
fishing related deaths
Adults and
subadults ND 0.61 0.29 1 †
Kaska et al
2004
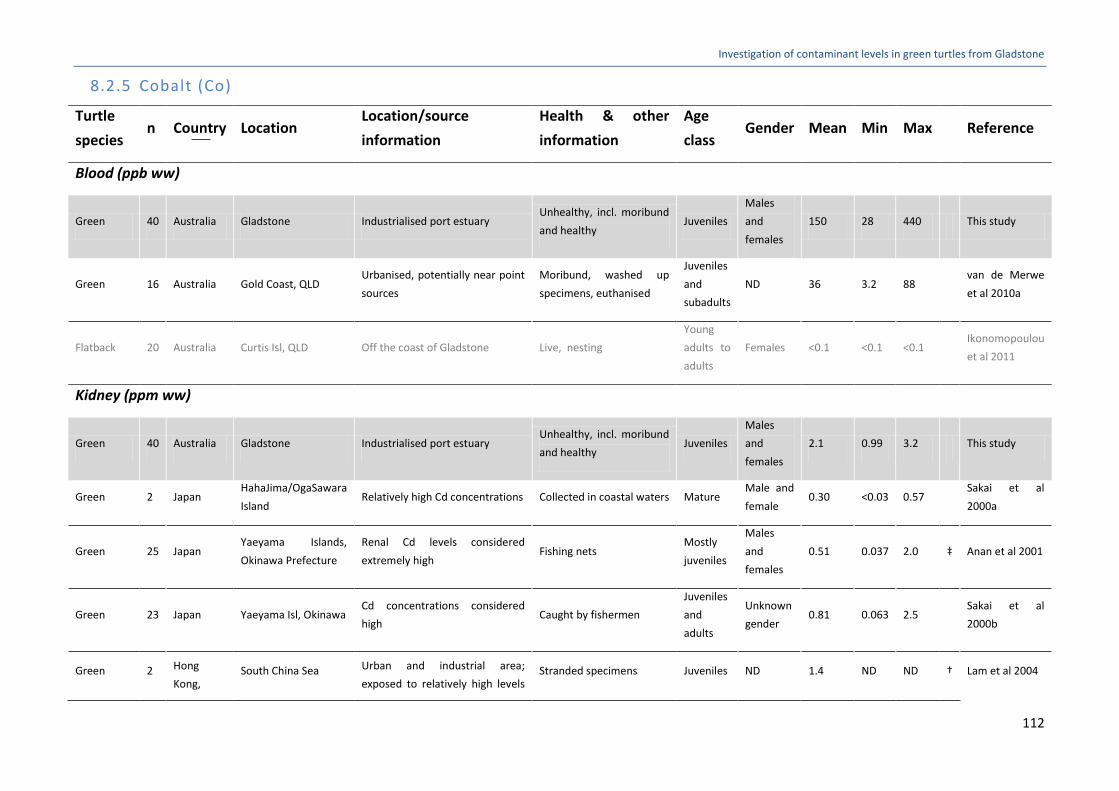
Investigation of contaminant levels in green turtles from Gladstone
112
8.2.5 Cobalt (Co)
Turtle
species n Country Location
Location/source
information
Health & other
information
Age
class Gender Mean Min Max Reference
Blood (ppb ww)
Green 40 Australia Gladstone Industrialised port estuary Unhealthy, incl. moribund
and healthy Juveniles
Males
and
females
150 28 440 This study
Green 16 Australia Gold Coast, QLD Urbanised, potentially near point
sources
Moribund, washed up
specimens, euthanised
Juveniles
and
subadults
ND 36 3.2 88 van de Merwe
et al 2010a
Flatback 20 Australia Curtis Isl, QLD Off the coast of Gladstone Live, nesting
Young
adults to
adults
Females <0.1 <0.1 <0.1 Ikonomopoulou
et al 2011
Kidney (ppm ww)
Green 40 Australia Gladstone Industrialised port estuary Unhealthy, incl. moribund
and healthy Juveniles
Males
and
females
2.1 0.99 3.2 This study
Green 2 Japan HahaJima/OgaSawara
Island Relatively high Cd concentrations Collected in coastal waters Mature
Male and
female 0.30 <0.03 0.57
Sakai et al
2000a
Green 25 Japan Yaeyama Islands,
Okinawa Prefecture
Renal Cd levels considered
extremely high Fishing nets
Mostly
juveniles
Males
and
females
0.51 0.037 2.0 ‡ Anan et al 2001
Green 23 Japan Yaeyama Isl, Okinawa Cd concentrations considered
high Caught by fishermen
Juveniles
and
adults
Unknown
gender 0.81 0.063 2.5
Sakai et al
2000b
Green 2 Hong
Kong, South China Sea Urban and industrial area;
exposed to relatively high levels Stranded specimens Juveniles ND 1.4 ND ND † Lam et al 2004

Investigation of contaminant levels in green turtles from Gladstone
113
China of Se
Green 16 Australia Gold Coast, QLD Urbanised, potentially near point
sources
Moribund, washed up
specimens, euthanised
Juveniles
and
subadults
ND 1.5 0.13 5.5 van de Merwe
et al 2010a
Hawksbill 19 Japan Yaeyama Islands,
Okinawa Prefecture
Renal Cd levels considered
extremely high Fishing nets
Mostly
juveniles
Males
and
females
0.60 0.18 1.9 ‡ Anan et al 2001
Loggerhead 7 Japan Cape Ashizuri, Kochi Highest Cd in specimens with
symptoms of kidney congestion Fishing net entanglement
Adults
(SCL 76-
92)
Females
(n=6) and
n=1 male
0.20 0.13 0.26
Sakai et al 1995
Sakai et al
2000a
Liver (ppm ww)
Green 40 Australia Gladstone Industrialised port estuary Unhealthy, incl. moribund
and healthy Juveniles
Males
and
females
1.4 0.93 2.3 This study
Green 2 Japan HahaJima/OgaSawara
Island Relatively high Cd concentrations Collected in coastal waters Mature
Male and
female <0.03 <0.03 <0.03
Sakai et al
2000a
Green 50 Japan Yaeyama Isl, Okinawa Cd concentrations considered
high Caught by fishermen
Juveniles
and
adults
Unknown
gender 0.067 0.067 0.067
Sakai et al
2000b
Green 26 Japan Yaeyama Islands,
Okinawa Prefecture
Renal Cd levels considered
extremely high Fishing nets
Mostly
juveniles
Males
and
females
0.077 0.023 0.40 ‡ Anan et al 2001
Green 50 Sultanate
of Oman
Ras Al-Hadd Turtle
Reserve
Substantial industrial and urban
developments Hatchlings; control Hatchling ND 0.11 ND ND
Al-Rawahy et al
2007
Green 2
Hong
Kong,
China
South China Sea
Urban and industrial area;
exposed to relatively high levels
of Se
Stranded specimens Juveniles ND 0.13 ND ND † Lam et al 2004
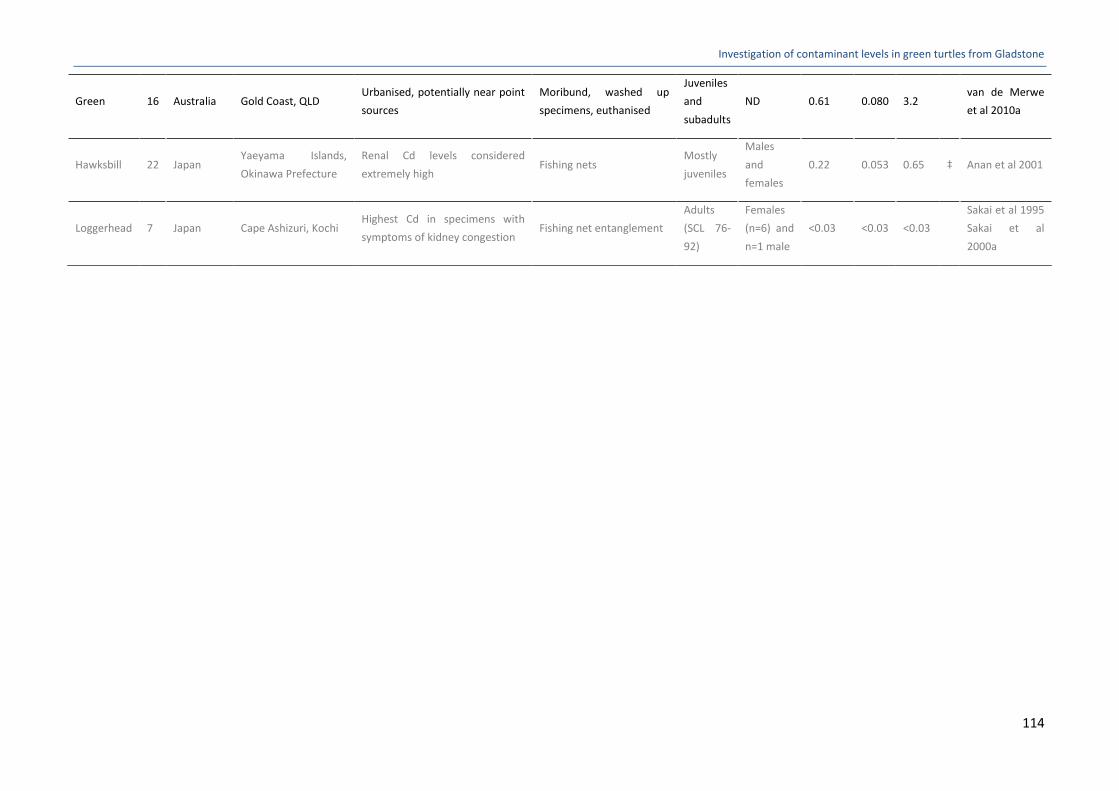
Investigation of contaminant levels in green turtles from Gladstone
114
Green 16 Australia Gold Coast, QLD Urbanised, potentially near point
sources
Moribund, washed up
specimens, euthanised
Juveniles
and
subadults
ND 0.61 0.080 3.2 van de Merwe
et al 2010a
Hawksbill 22 Japan Yaeyama Islands,
Okinawa Prefecture
Renal Cd levels considered
extremely high Fishing nets
Mostly
juveniles
Males
and
females
0.22 0.053 0.65 ‡ Anan et al 2001
Loggerhead 7 Japan Cape Ashizuri, Kochi Highest Cd in specimens with
symptoms of kidney congestion Fishing net entanglement
Adults
(SCL 76-
92)
Females
(n=6) and
n=1 male
<0.03 <0.03 <0.03
Sakai et al 1995
Sakai et al
2000a
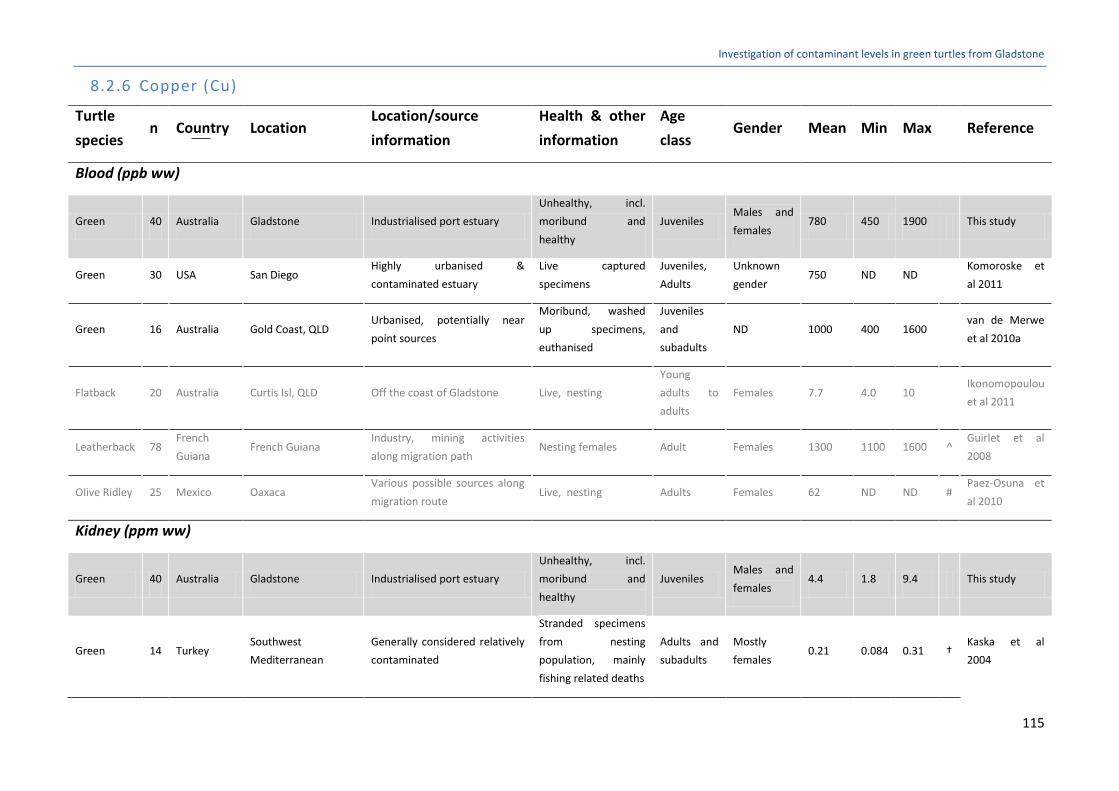
Investigation of contaminant levels in green turtles from Gladstone
115
8.2.6 Copper (Cu)
Turtle
species n Country Location
Location/source
information
Health & other
information
Age
class Gender Mean Min Max Reference
Blood (ppb ww)
Green 40 Australia Gladstone Industrialised port estuary
Unhealthy, incl.
moribund and
healthy
Juveniles Males and
females 780 450 1900 This study
Green 30 USA San Diego Highly urbanised &
contaminated estuary
Live captured
specimens
Juveniles,
Adults
Unknown
gender 750 ND ND
Komoroske et
al 2011
Green 16 Australia Gold Coast, QLD Urbanised, potentially near
point sources
Moribund, washed
up specimens,
euthanised
Juveniles
and
subadults
ND 1000 400 1600 van de Merwe
et al 2010a
Flatback 20 Australia Curtis Isl, QLD Off the coast of Gladstone Live, nesting
Young
adults to
adults
Females 7.7 4.0 10 Ikonomopoulou
et al 2011
Leatherback 78 French
Guiana French Guiana
Industry, mining activities
along migration path Nesting females Adult Females 1300 1100 1600 ˄
Guirlet et al
2008
Olive Ridley 25 Mexico Oaxaca Various possible sources along
migration route Live, nesting Adults Females 62 ND ND #
Paez-Osuna et
al 2010
Kidney (ppm ww)
Green 40 Australia Gladstone Industrialised port estuary
Unhealthy, incl.
moribund and
healthy
Juveniles Males and
females 4.4 1.8 9.4 This study
Green 14 Turkey Southwest
Mediterranean
Generally considered relatively
contaminated
Stranded specimens
from nesting
population, mainly
fishing related deaths
Adults and
subadults
Mostly
females 0.21 0.084 0.31 †
Kaska et al
2004

Investigation of contaminant levels in green turtles from Gladstone
116
Green 8 Mexico Magdalena Bay, Baja
California
19th century mining - Cd, Zn,
Cu and Pb in sediments above
those in industrialised regions;
Cd considered elevated
Specimens drowned
in fishing nets
SCL 47-77
cm
Unknown
gender 0.70 0.24 1.4 †
Talavera-Saenz
et al 2007
Green 33 Costa Rica Tortuguero National
Park, North Carribean Cd considered background
Dead, nesting turtles,
killed by jaguars ND ND 1.0 ND ND †
Andreani et al
2008
Green 2 Japan HahaJima/OgaSawara
Isl
Relatively high Cd
concentrations
Collected in coastal
waters Mature
Male and
female 1.5 1.3 1.7
Sakai et al
2000a
Green 30 Brazil Cananeia Estuary
Pollution considered negligible
(but 200 km south of major
industrial area of Brazil)
Stranded Juvenile ND 1.5 ND ND † Barbieri et al
2009
Green 30 Brazil Cananeia Estuary
Pollution considered negligible
(but 200 km south of major
industrial area of Brazil)
Stranded Adult ND 1.6 ND ND † Barbieri et al
2009
Green 25 Japan Yaeyama Islands,
Okinawa Prefecture
Renal Cd levels considered
extremely high Fishing nets
Mostly
juveniles
Males and
females 1.6 0.47 3.7 ‡ Anan et al 2001
Green 2 Hong Kong,
China South China Sea
Urban and industrial area;
exposed to relatively high
levels of Se
Stranded specimens Juveniles ND 1.8 ND ND † Lam et al 2004
Green 23 Japan Yaeyama Isl, Okinawa Cd concentrations considered
high Caught by fishermen
Juveniles
and adults
Unknown
gender 2.2 0.95 3.9
Sakai et al
2000b
Green 16 Australia Gold Coast, QLD Urbanised, potentially near
point sources
Moribund, washed
up specimens,
euthanised
Juveniles
and
subadults
ND 2.6 1.4 4.6 van de Merwe
et al 2010a
Green 6 USA Ahu-O-Laka,
Kaneohe, HI
Agricultural areas; Se levels
considered "normal"
Moribund specimens
with severe
fibropapilloma
Juveniles Males and
females 2.9 1.8 4.4
Aguirre et al
1994
Green 5 USA Pelagic, Hawaii Agricultural areas; relatively
high Se in one pelagic Stranded specimens ND
Males and
females 3.1 1.1 6.9
Aguirre et al
1994

Investigation of contaminant levels in green turtles from Gladstone
117
specimen, but otherwise
considered "normal"
Green 7 Australia Waru, Torres Strait Remote, very high Cd, elevated
Co, Hg, Se Caught alive ND ND 7.4 0.81 45 Gladstone 1996
Green 7 Italy Adreaiatic and Ionian
Seas, Mediterranean
Generally considered
contaminated Stranded Juveniles
Unknown
gender 8.2 4.8 14
Storelli et al
2008
Green 1 USA Control, Captive Agricultural areas; Se levels
considered "normal" Captive specimen ND Female 11 ND ND
Aguirre et al
1994
Hawksbill 19 Japan Yaeyama Islands,
Okinawa Prefecture
Renal Cd levels considered
extremely high Fishing nets
Mostly
juveniles
Males and
females 1.4 0.95 3.5 ‡ Anan et al 2001
Leatherback 5 France French Atlantic Coast Cd considered high Stranded, dead Juvenile ND 2.7 2.4 3.0 Caurant et al
1999
Loggerhead 20 Turkey Southwest
Mediterranean
Generally considered relatively
contaminated
Stranded specimens
from nesting
population, mainly
fishing related deaths
Adults and
subadults
Mostly
females 0.25 0.14 0.37 †
Kaska et al
2004
Loggerhead 9 Italy
Cesenatico & Sicily
Island,
Mediterranean
Cd considered background Stranded ND ND 0.67 ND ND † Andreani et al
2008
Loggerhead 7 Japan Cape Ashizuri, Kochi
Highest Cd in specimens with
symptoms of kidney
congestion
Fishing net
entanglement
Adults (SCL
76-92)
Females
(n=6) and
n=1 male
1.3 0.99 1.6
Sakai et al 1995
Sakai et al
2000a
Loggerhead 5 France French Atlantic Coast Cd considered high Stranded, dead Juvenile ND 2.2 1.8 2.8 Caurant et al
1999
Loggerhead 78 Spain Canary Islands,
Mediterranean
Generally considered relatively
contaminated areas Stranded
Juveniles
and
subadults
Mainly
females
(n=67)
4.6 0.13 49 Torrent et al
2004
Liver (ppm ww)

Investigation of contaminant levels in green turtles from Gladstone
118
Green 40 Australia Gladstone Industrialised port estuary
Unhealthy, incl.
moribund and
healthy
Juveniles Males and
females 84 67 100 This study
Green 22 Turkey Southwest
Mediterranean
Generally considered relatively
contaminated
Stranded specimens
from nesting
population, mainly
fishing related deaths
Adults and
subadults
Mostly
females 0.38 0.12 0.66 †
Kaska et al
2004
Green 50 Sultanate of
Oman
Ras Al-Hadd Turtle
Reserve
Substantial industrial and
urban developments Hatchlings; control Hatchling ND 2.2 ND ND
Al-Rawahy et al
2007
Green 30 Brazil Cananeia Estuary
Pollution considered negligible
(but 200 km south of major
industrial area of Brazil)
Stranded Juvenile ND 4.6 ND ND † Barbieri et al
2009
Green 30 Brazil Cananeia Estuary
Pollution considered negligible
(but 200 km south of major
industrial area of Brazil)
Stranded Adult ND 8.8 ND ND † Barbieri et al
2009
Green 2 Japan HahaJima/OgaSawara
Isl
Relatively high Cd
concentrations
Collected in coastal
waters Mature
Male and
female 11 8.7 14
Sakai et al
2000a
Green 8 Mexico Magdalena Bay, Baja
California
19th century mining - Cd, Zn,
Cu and Pb in sediments above
those in industrialised regions;
Cd considered elevated
Specimens drowned
in fishing nets
SCL 47-77
cm
Unknown
gender 17 1.5 28 †
Talavera-Saenz
et al 2007
Green 34 Costa Rica Tortuguero National
Park, North Carribean Cd considered background
Dead, nesting turtles,
killed by jaguars ND ND 22 ND ND †
Andreani et al
2008
Green 2 Hong Kong,
China South China Sea
Urban and industrial area;
exposed to relatively high
levels of Se
Stranded specimens Juveniles ND 29 ND ND † Lam et al 2004
Green 7 Italy Adreaiatic and Ionian
Seas, Mediterranean
Generally considered
contaminated Stranded Juveniles
Unknown
gender 33 18 59
Storelli et al
2008

Investigation of contaminant levels in green turtles from Gladstone
119
Green 26 Japan Yaeyama Islands,
Okinawa Prefecture
Renal Cd levels considered
extremely high Fishing nets
Mostly
juveniles
Males and
females 43 11 110 ‡ Anan et al 2001
Green 50 Japan Yaeyama Isl, Okinawa Cd concentrations considered
high Caught by fishermen
Juveniles
and adults
Unknown
gender 50 4.3 110
Sakai et al
2000b
Green 1 USA Pelagic, Hawaii
Agricultural areas; relatively
high Se in one pelagic
specimen, but otherwise
considered "normal"
Stranded specimens ND Males and
females 56 1.3 130
Aguirre et al
1994
Green 7 Australia Waru, Torres Strait Remote, very high Cd, elevated
Co, Hg, Se Caught alive ND ND 59 0.84 180 Gladstone 1996
Green 16 Australia Gold Coast, QLD Urbanised, potentially near
point sources
Moribund, washed
up specimens,
euthanised
Juveniles
and
subadults
ND 91 38 150 van de Merwe
et al 2010a
Green 6 USA Ahu-O-Laka,
Kaneohe, HI
Agricultural areas; Se levels
considered "normal"
Moribund specimens
with severe
fibropapilloma
Juveniles Males and
females 120 36 190
Aguirre et al
1994
Green 1 USA Control, Captive Agricultural areas; Se levels
considered "normal" Captive specimen ND Female 120 ND ND
Aguirre et al
1994
Hawksbill 22 Japan Yaeyama Islands,
Okinawa Prefecture
Renal Cd levels considered
extremely high Fishing nets
Mostly
juveniles
Males and
females 17 2.6 180 ‡ Anan et al 2001
Leatherback 18 France French Atlantic Coast Cd considered high Stranded, dead Juvenile ND 8.6 1.1 20 Caurant et al
1999
Loggerhead 32 Turkey Southwest
Mediterranean
Generally considered relatively
contaminated
Stranded specimens
from nesting
population, mainly
fishing related deaths
Adults and
subadults
Mostly
females 0.66 0.059 0.92 †
Kaska et al
2004
Loggerhead 1 USA Pelagic, Hawaii Fishing net entanglement Stranded specimens ND Female 2.8 ND ND Aguirre et al
1994

Investigation of contaminant levels in green turtles from Gladstone
120
Loggerhead 11 Italy
Cesenatico & Sicily
Island,
Mediterranean
Cd considered background Stranded ND ND 3.9 ND ND † Andreani et al
2008
Loggerhead 7 France French Atlantic Coast Cd considered high Stranded, dead Juvenile ND 8.3 2.3 21 Caurant et al
1999
Loggerhead 78 Spain Canary Islands,
Mediterranean
Generally considered relatively
contaminated areas Stranded
Juveniles
and
subadults
Mainly
females
(n=67)
15 0.010 66 Torrent et al
2004
Loggerhead 7 Japan Cape Ashizuri, Kochi
Highest Cd in specimens with
symptoms of kidney
congestion
Fishing net
entanglement
Adults (SCL
76-92)
Females
(n=6) and
n=1 male
18 6.5 34
Sakai et al 1995
Sakai et al
2000a
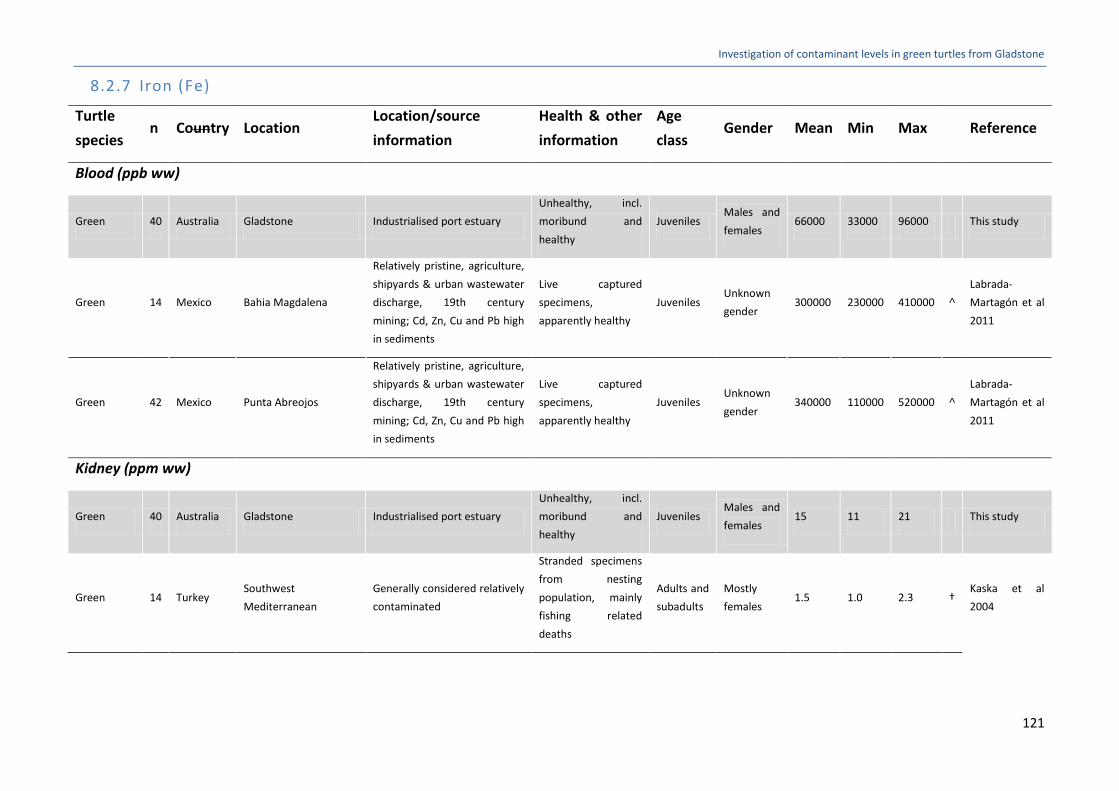
Investigation of contaminant levels in green turtles from Gladstone
121
8.2.7 Iron (Fe)
Turtle
species n Country Location
Location/source
information
Health & other
information
Age
class Gender Mean Min Max Reference
Blood (ppb ww)
Green 40 Australia Gladstone Industrialised port estuary
Unhealthy, incl.
moribund and
healthy
Juveniles Males and
females 66000 33000 96000 This study
Green 14 Mexico Bahia Magdalena
Relatively pristine, agriculture,
shipyards & urban wastewater
discharge, 19th century
mining; Cd, Zn, Cu and Pb high
in sediments
Live captured
specimens,
apparently healthy
Juveniles Unknown
gender 300000 230000 410000 ˄
Labrada-
Martagón et al
2011
Green 42 Mexico Punta Abreojos
Relatively pristine, agriculture,
shipyards & urban wastewater
discharge, 19th century
mining; Cd, Zn, Cu and Pb high
in sediments
Live captured
specimens,
apparently healthy
Juveniles Unknown
gender 340000 110000 520000 ˄
Labrada-
Martagón et al
2011
Kidney (ppm ww)
Green 40 Australia Gladstone Industrialised port estuary
Unhealthy, incl.
moribund and
healthy
Juveniles Males and
females 15 11 21 This study
Green 14 Turkey Southwest
Mediterranean
Generally considered relatively
contaminated
Stranded specimens
from nesting
population, mainly
fishing related
deaths
Adults and
subadults
Mostly
females 1.5 1.0 2.3 †
Kaska et al
2004

Investigation of contaminant levels in green turtles from Gladstone
122
Green 8 Mexico Magdalena Bay, Baja
California
19th century mining - Cd, Zn,
Cu and Pb in sediments above
those in industrialised regions;
Cd considered elevated
Specimens drowned
in fishing nets
SCL 47-77
cm
Unknown
gender 11 ND 66 †
Talavera-Saenz
et al 2007
Green 6 USA Hawaii Agricultural areas
Moribund specimens
with severe
fibropapilloma
Juveniles Males and
females 12 8.8 15
Aguirre et al
1994
Green 2 Japan HahaJima/OgaSawara
Isl
Relatively high Cd
concentrations
Collected in coastal
waters Mature
Male and
female 14 13 15
Sakai et al
2000a
Green 1 USA Control, Captive Agricultural areas Captive specimen Female 16 ND ND Aguirre et al
1994
Green 23 Japan Yaeyama Isl, Okinawa Cd concentrations considered
high Caught by fishermen
Juveniles
and adults
Unknown
gender 23 11 59
Sakai et al
2000b
Green 33 Costa Rica Tortuguero National
Park, North Carribean Cd considered background
Dead, nesting
turtles, killed by
jaguars
ND ND 36 ND ND † Andreani et al
2008
Green 5 USA Hawaii Agricultural areas Stranded specimens Males and
females 87 23 180
Aguirre et al
1994
Loggerhead 20 Turkey Southwest
Mediterranean
Generally considered relatively
contaminated
Stranded specimens
from nesting
population, mainly
fishing related
deaths
Adults and
subadults ND 1.8 1.1 2.5 †
Kaska et al
2004
Loggerhead 7 Japan Cape Ashizuri, Kochi
Highest Cd in specimens with
symptoms of kidney
congestion
Fishing net
entanglement
Adults
(SCL 76-
92)
Females
(n=6) and
n=1 male
36 11 51
Sakai et al
1995Sakai et al
2000a
Loggerhead 78 Spain Canary Islands,
Mediterranean
Generally considered relatively
contaminated areas Stranded
Juveniles
and
subadults
Mainly
females
(n=67)
38 0.29 270 Torrent et al
2004

Investigation of contaminant levels in green turtles from Gladstone
123
Loggerhead 9 Italy Cesenatico & Sicily
Island, Mediterranean Cd considered background Stranded ND ND 92 ND ND †
Andreani et al
2008
Liver (ppm ww)
Green 40 Australia Gladstone Industrialised port estuary
Unhealthy, incl.
moribund and
healthy
Juveniles Males and
females 1939 1090 2821 This study
Green 22 Turkey Southwest
Mediterranean
Generally considered relatively
contaminated
Stranded specimens
from nesting
population, mainly
fishing related
deaths
Adults and
subadults
Mostly
females 1.5 0.45 2.1 †
Kaska et al
2004
Green 8 Mexico Magdalena Bay, Baja
California
19th century mining - Cd, Zn,
Cu and Pb in sediments above
those in industrialised regions;
Cd considered elevated
Specimens drowned
in fishing nets
SCL 47-77
cm
Unknown
gender 42 ND 81 †
Talavera-Saenz
et al 2007
Green 2 Japan HahaJima/OgaSawara
Isl
Relatively high Cd
concentrations
Collected in coastal
waters Mature
Male and
female 140 13 15
Sakai et al
2000a
Green 34 Costa Rica Tortuguero National
Park, North Carribean Cd considered background
Dead, nesting
turtles, killed by
jaguars
ND ND 300 ND ND † Andreani et al
2008
Green 50 Japan Yaeyama Isl, Okinawa Cd concentrations considered
high Caught by fishermen
Juveniles
and adults
Unknown
gender 460 33 1300
Sakai et al
2000b
Green 1 USA Control, Captive Agricultural areas Captive specimen Female 770 Aguirre et al
1994
Green 6 USA Hawaii Agricultural areas Stranded specimens Males and
females 840 93 1700
Aguirre et al
1994
Green 6 USA Hawaii Agricultural areas
Moribund specimens
with severe
fibropapilloma
Juveniles Males and
females 1600 450 2500
Aguirre et al
1994
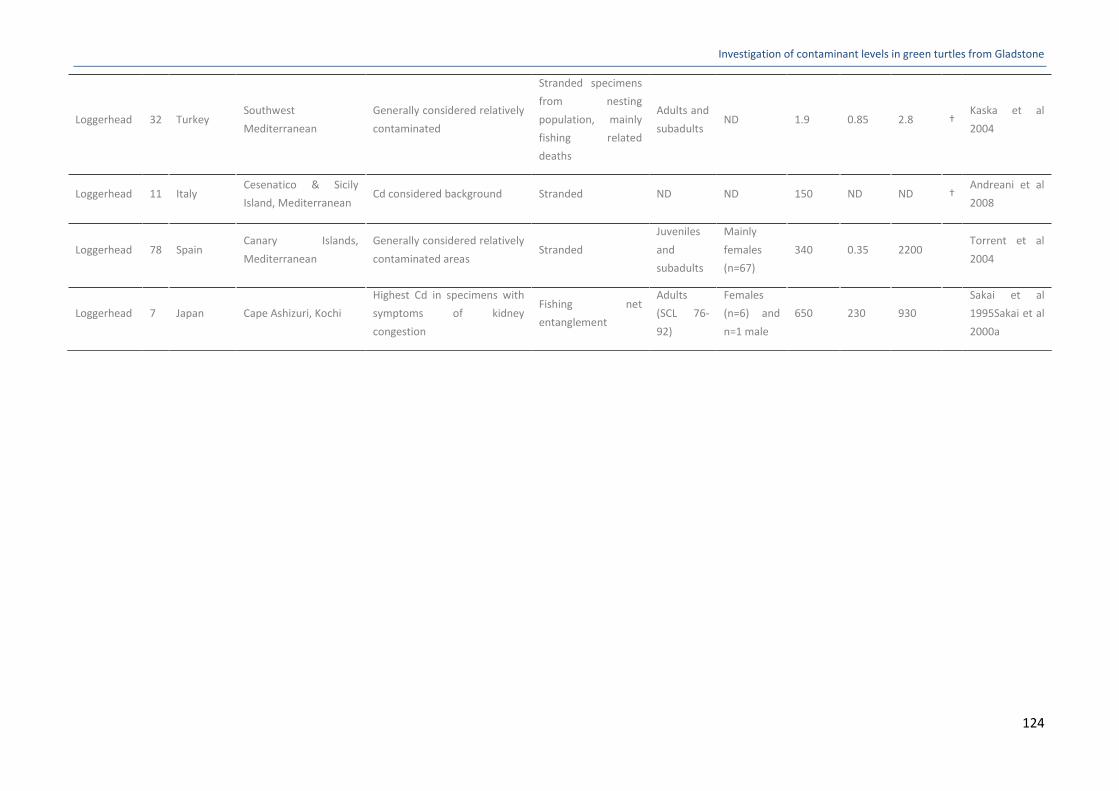
Investigation of contaminant levels in green turtles from Gladstone
124
Loggerhead 32 Turkey Southwest
Mediterranean
Generally considered relatively
contaminated
Stranded specimens
from nesting
population, mainly
fishing related
deaths
Adults and
subadults ND 1.9 0.85 2.8 †
Kaska et al
2004
Loggerhead 11 Italy Cesenatico & Sicily
Island, Mediterranean Cd considered background Stranded ND ND 150 ND ND †
Andreani et al
2008
Loggerhead 78 Spain Canary Islands,
Mediterranean
Generally considered relatively
contaminated areas Stranded
Juveniles
and
subadults
Mainly
females
(n=67)
340 0.35 2200 Torrent et al
2004
Loggerhead 7 Japan Cape Ashizuri, Kochi
Highest Cd in specimens with
symptoms of kidney
congestion
Fishing net
entanglement
Adults
(SCL 76-
92)
Females
(n=6) and
n=1 male
650 230 930
Sakai et al
1995Sakai et al
2000a
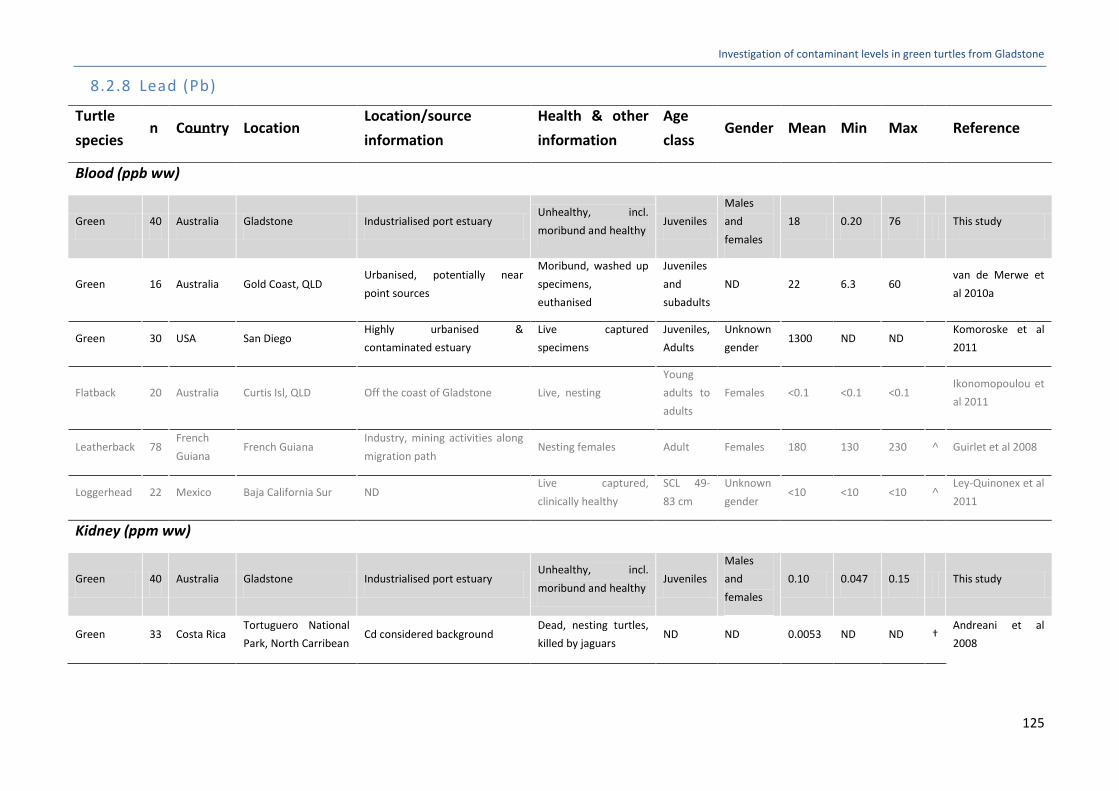
Investigation of contaminant levels in green turtles from Gladstone
125
8.2.8 Lead (Pb)
Turtle
species n Country Location
Location/source
information
Health & other
information
Age
class Gender Mean Min Max Reference
Blood (ppb ww)
Green 40 Australia Gladstone Industrialised port estuary Unhealthy, incl.
moribund and healthy Juveniles
Males
and
females
18 0.20 76 This study
Green 16 Australia Gold Coast, QLD Urbanised, potentially near
point sources
Moribund, washed up
specimens,
euthanised
Juveniles
and
subadults
ND 22 6.3 60 van de Merwe et
al 2010a
Green 30 USA San Diego Highly urbanised &
contaminated estuary
Live captured
specimens
Juveniles,
Adults
Unknown
gender 1300 ND ND
Komoroske et al
2011
Flatback 20 Australia Curtis Isl, QLD Off the coast of Gladstone Live, nesting
Young
adults to
adults
Females <0.1 <0.1 <0.1 Ikonomopoulou et
al 2011
Leatherback 78 French
Guiana French Guiana
Industry, mining activities along
migration path Nesting females Adult Females 180 130 230 ˄ Guirlet et al 2008
Loggerhead 22 Mexico Baja California Sur ND Live captured,
clinically healthy
SCL 49-
83 cm
Unknown
gender <10 <10 <10 ˄
Ley-Quinonex et al
2011
Kidney (ppm ww)
Green 40 Australia Gladstone Industrialised port estuary Unhealthy, incl.
moribund and healthy Juveniles
Males
and
females
0.10 0.047 0.15 This study
Green 33 Costa Rica Tortuguero National
Park, North Carribean Cd considered background
Dead, nesting turtles,
killed by jaguars ND ND 0.0053 ND ND †
Andreani et al
2008

Investigation of contaminant levels in green turtles from Gladstone
126
Green 8 Mexico Magdalena Bay, Baja
California
19th century mining - Cd, Zn, Cu
and Pb in sediments above
those in industrialised regions;
Cd considered elevated
Specimens drowned in
fishing nets
SCL 47-
77 cm
Unknown
gender 0.0060 ND 0.21 †
Talavera-Saenz et
al 2007
Green 2
Hong
Kong,
China
South China Sea
Urban and industrial area;
exposed to relatively high levels
of Se
Stranded specimens Juveniles ND 0.037 ND ND † Lam et al 2004
Green 7 Australia Waru, Torres Strait Remote, very high Cd, elevated
Co, Hg, Se Caught alive Unknown ND 0.070 0.050 0.15 Gladstone 1996
Green 2 Japan HahaJima/OgaSawara
Isl
Relatively high Cd
concentrations
Collected in coastal
waters Mature
Male and
female 0.085 <0.03 0.14 Sakai et al 2000a
Green 16 Australia Gold Coast, QLD Urbanised, potentially near
point sources
Moribund, washed up
specimens,
euthanised
Juveniles
and
subadults
ND 0.090 <LOR 0.12 van de Merwe et
al 2010a
Green 25 Japan Yaeyama Islands,
Okinawa Prefecture
Renal Cd levels considered
extremely high Fishing nets
Mostly
juveniles
Males
and
females
0.16 0.031 0.46 ‡ Anan et al 2001
Green 23 Japan Yaeyama Isl, Okinawa Cd concentrations considered
high Caught by fishermen
Juveniles
and
adults
Unknown
gender 0.18 0.050 0.28 Sakai et al 2000b
Green 14 Turkey Southwest
Mediterranean
Generally considered relatively
contaminated
Stranded specimens
from nesting
population, mainly
fishing related deaths
Adults
and
subadults
Mostly
females 0.24 0.076 0.81 † Kaska et al 2004
Hawksbill 19 Japan Yaeyama Islands,
Okinawa Prefecture
Renal Cd levels considered
extremely high Fishing nets
Mostly
juveniles
Males
and
females
0.053 0.017 0.22 ‡ Anan et al 2001
Loggerhead 1 Japan Cape Ashizuri, Kochi ND Fishing net ND M <0.03 ND ND Sakai et al 2000a

Investigation of contaminant levels in green turtles from Gladstone
127
Loggerhead 9 Italy
Cesenatico & Sicily
Island,
Mediterranean
Cd considered background Stranded ND ND 0.012 ND ND † Andreani et al
2008
Loggerhead 6 Japan Cape Ashizuri, Kochi ND Fishing net ND F 0.16 ND ND Sakai et al 2000a
Loggerhead 20 Turkey Southwest
Mediterranean
Generally considered relatively
contaminated
Stranded specimens
from nesting
population, mainly
fishing related deaths
Adults
and
subadults
ND 0.48 0.11 1.3 † Kaska et al 2004
Loggerhead 78 Spain Canary Islands,
Mediterranean
Generally considered relatively
contaminated areas Stranded
Juveniles
and
subadults
Mainly
females
(n=67)
2.4 0.020 17 Torrent et al 2004
Loggerhead 2 Cyprus Northern Cyprus,
Mediterranean
Generally contaminated,
presence of natural Hg bed Stranded specimens Juveniles ND ND <LOD 1.4 * Godley et al 1999
Liver (ppm ww)
Green 40 Australia Gladstone Industrialised port estuary Unhealthy, incl.
moribund and healthy Juveniles
Males
and
females
0.16 0.12 0.20 This study
Green 50 Japan Yaeyama Isl, Okinawa Cd concentrations considered
high Caught by fishermen
Juveniles
and
adults
Unknown
gender <0.03 <0.03 <0.03 Sakai et al 2000b
Green 34 Costa Rica Tortuguero National
Park, North Carribean Cd considered background
Dead, nesting turtles,
killed by jaguars ND ND 0.015 ND ND †
Andreani et al
2008
Green 2
Hong
Kong,
China
South China Sea
Urban and industrial area;
exposed to relatively high levels
of Se
Stranded specimens Juveniles ND 0.033 ND ND † Lam et al 2004
Green 2 Japan HahaJima/OgaSawara
Isl
Relatively high Cd
concentrations
Collected in coastal
waters Mature
Male and
female 0.075 <0.03 0.12 Sakai et al 2000a
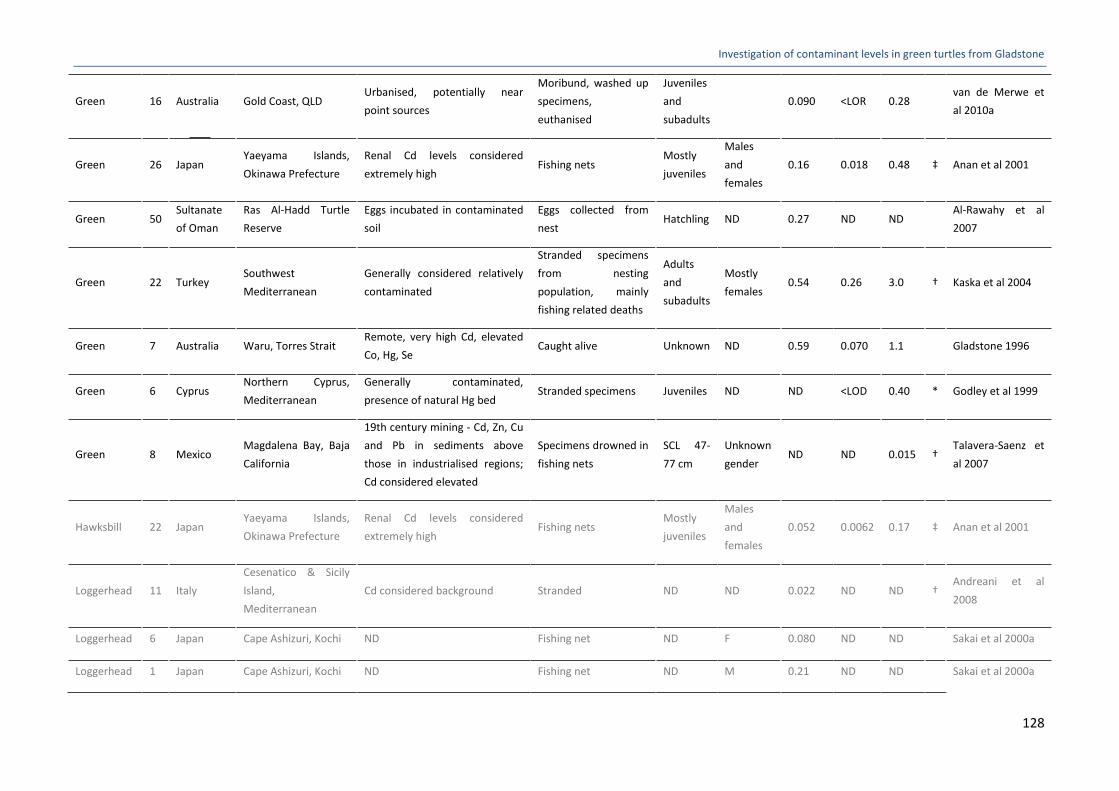
Investigation of contaminant levels in green turtles from Gladstone
128
Green 16 Australia Gold Coast, QLD Urbanised, potentially near
point sources
Moribund, washed up
specimens,
euthanised
Juveniles
and
subadults
0.090 <LOR 0.28 van de Merwe et
al 2010a
Green 26 Japan Yaeyama Islands,
Okinawa Prefecture
Renal Cd levels considered
extremely high Fishing nets
Mostly
juveniles
Males
and
females
0.16 0.018 0.48 ‡ Anan et al 2001
Green 50 Sultanate
of Oman
Ras Al-Hadd Turtle
Reserve
Eggs incubated in contaminated
soil
Eggs collected from
nest Hatchling ND 0.27 ND ND
Al-Rawahy et al
2007
Green 22 Turkey Southwest
Mediterranean
Generally considered relatively
contaminated
Stranded specimens
from nesting
population, mainly
fishing related deaths
Adults
and
subadults
Mostly
females 0.54 0.26 3.0 † Kaska et al 2004
Green 7 Australia Waru, Torres Strait Remote, very high Cd, elevated
Co, Hg, Se Caught alive Unknown ND 0.59 0.070 1.1 Gladstone 1996
Green 6 Cyprus Northern Cyprus,
Mediterranean
Generally contaminated,
presence of natural Hg bed Stranded specimens Juveniles ND ND <LOD 0.40 * Godley et al 1999
Green 8 Mexico Magdalena Bay, Baja
California
19th century mining - Cd, Zn, Cu
and Pb in sediments above
those in industrialised regions;
Cd considered elevated
Specimens drowned in
fishing nets
SCL 47-
77 cm
Unknown
gender ND ND 0.015 †
Talavera-Saenz et
al 2007
Hawksbill 22 Japan Yaeyama Islands,
Okinawa Prefecture
Renal Cd levels considered
extremely high Fishing nets
Mostly
juveniles
Males
and
females
0.052 0.0062 0.17 ‡ Anan et al 2001
Loggerhead 11 Italy
Cesenatico & Sicily
Island,
Mediterranean
Cd considered background Stranded ND ND 0.022 ND ND † Andreani et al
2008
Loggerhead 6 Japan Cape Ashizuri, Kochi ND Fishing net ND F 0.080 ND ND Sakai et al 2000a
Loggerhead 1 Japan Cape Ashizuri, Kochi ND Fishing net ND M 0.21 ND ND Sakai et al 2000a

Investigation of contaminant levels in green turtles from Gladstone
129
Loggerhead 32 Turkey Southwest
Mediterranean
Generally considered relatively
contaminated
Stranded specimens
from nesting
population, mainly
fishing related deaths
Adults
and
subadults
ND 0.78 0.26 1.2 † Kaska et al 2004
Loggerhead 78 Spain Canary Islands,
Mediterranean
Generally considered relatively
contaminated areas Stranded
Juveniles
and
subadults
Mainly
females
(n=67)
2.9 0.050 33 Torrent et al 2004
Loggerhead 4 Cyprus Northern Cyprus,
Mediterranean
Generally contaminated,
presence of natural Hg bed Stranded specimens Juveniles ND ND <LOD 1.1 * Godley et al 1999

Investigation of contaminant levels in green turtles from Gladstone
130
8.2.9 Manganese (Mn)
Turtle
species n Country Location
Location/source
information
Health & other
information
Age
class Gender
Mea
n Min
Ma
x Reference
Blood (ppb ww)
Green 40 Australia Gladstone Industrialised port estuary Unhealthy, incl. moribund
and healthy
Juvenil
es
Males and
females 35 16 92 This study
Green 30 USA San Diego Highly urbanised &
contaminated estuary Live captured specimens
Juvenil
es,
Adults
Unknown
gender 460 ND ND
Komoroske et
al 2011
Kidney (ppm ww)
Green 40 Australia Gladstone Industrialised port estuary Unhealthy, incl. moribund
and healthy
Juvenil
es
Males and
females 0.87 0.66 0.48 This study
Green 8 Mexico Magdalena Bay, Baja
California
19th century mining - Cd, Zn,
Cu and Pb in sediments above
those in industrialised
regions; Cd considered
elevated
Specimens drowned in
fishing nets
SCL
47-77
cm
Unknown
gender 0.18 ND 0.93 †
Talavera-Saenz
et al 2007
Green 30 Brazil Cananeia Estuary
Pollution considered
negligible (but 200 km south
of major industrial area of
Brazil)
Stranded Juvenil
e ND 0.46 ND ND †
Barbieri et al
2009
Green 30 Brazil Cananeia Estuary
Pollution considered
negligible (but 200 km south
of major industrial area of
Brazil)
Stranded Adult ND 0.50 ND ND † Barbieri et al
2009
Green 33 Costa Rica Tortuguero National
Park, North Carribean n=35
Dead, nesting turtles,
killed by jaguars ND
Pooled
sample 0.69 ND ND †
Andreani et al
2008
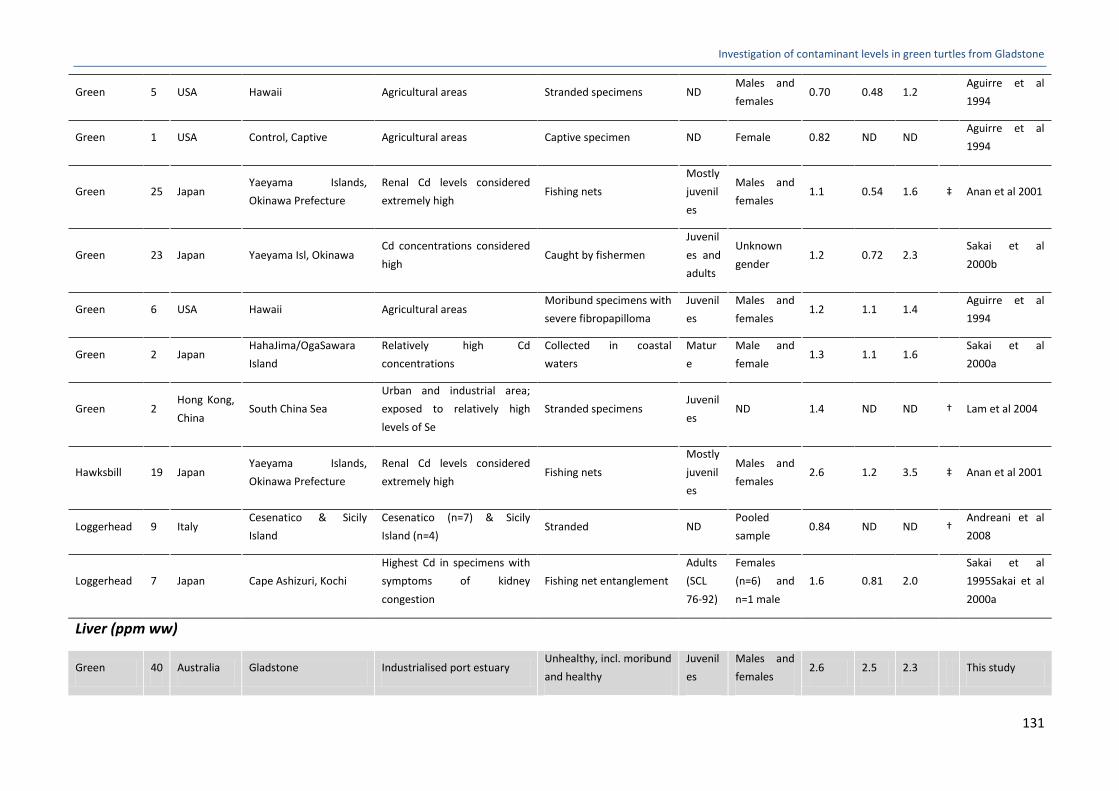
Investigation of contaminant levels in green turtles from Gladstone
131
Green 5 USA Hawaii Agricultural areas Stranded specimens ND Males and
females 0.70 0.48 1.2
Aguirre et al
1994
Green 1 USA Control, Captive Agricultural areas Captive specimen ND Female 0.82 ND ND Aguirre et al
1994
Green 25 Japan Yaeyama Islands,
Okinawa Prefecture
Renal Cd levels considered
extremely high Fishing nets
Mostly
juvenil
es
Males and
females 1.1 0.54 1.6 ‡ Anan et al 2001
Green 23 Japan Yaeyama Isl, Okinawa Cd concentrations considered
high Caught by fishermen
Juvenil
es and
adults
Unknown
gender 1.2 0.72 2.3
Sakai et al
2000b
Green 6 USA Hawaii Agricultural areas Moribund specimens with
severe fibropapilloma
Juvenil
es
Males and
females 1.2 1.1 1.4
Aguirre et al
1994
Green 2 Japan HahaJima/OgaSawara
Island
Relatively high Cd
concentrations
Collected in coastal
waters
Matur
e
Male and
female 1.3 1.1 1.6
Sakai et al
2000a
Green 2 Hong Kong,
China South China Sea
Urban and industrial area;
exposed to relatively high
levels of Se
Stranded specimens Juvenil
es ND 1.4 ND ND † Lam et al 2004
Hawksbill 19 Japan Yaeyama Islands,
Okinawa Prefecture
Renal Cd levels considered
extremely high Fishing nets
Mostly
juvenil
es
Males and
females 2.6 1.2 3.5 ‡ Anan et al 2001
Loggerhead 9 Italy Cesenatico & Sicily
Island
Cesenatico (n=7) & Sicily
Island (n=4) Stranded ND
Pooled
sample 0.84 ND ND †
Andreani et al
2008
Loggerhead 7 Japan Cape Ashizuri, Kochi
Highest Cd in specimens with
symptoms of kidney
congestion
Fishing net entanglement
Adults
(SCL
76-92)
Females
(n=6) and
n=1 male
1.6 0.81 2.0
Sakai et al
1995Sakai et al
2000a
Liver (ppm ww)
Green 40 Australia Gladstone Industrialised port estuary Unhealthy, incl. moribund
and healthy
Juvenil
es
Males and
females 2.6 2.5 2.3 This study

Investigation of contaminant levels in green turtles from Gladstone
132
Green 30 Brazil Cananeia Estuary
Pollution considered
negligible (but 200 km south
of major industrial area of
Brazil)
Stranded Adult ND 0.95 ND ND † Barbieri et al
2009
Green 50 Sultanate
of Oman
Ras Al-Hadd Turtle
Reserve
Substantial industrial and
urban developments Hatchlings; control
Hatchli
ng ND 1.5 ND ND
Al-Rawahy et al
2007
Green 6 USA Hawaii Agricultural areas Stranded specimens ND Males and
females 1.6 0.15 2.8
Aguirre et al
1994
Green 6 USA Hawaii Agricultural areas Moribund specimens with
severe fibropapilloma
Juvenil
es
Males and
females 1.6 1.2 2.0
Aguirre et al
1994
Green 50 Japan Yaeyama Isl, Okinawa Cd concentrations considered
high Caught by fishermen
Juvenil
es and
adults
Unknown
gender 1.9 0.70 5.4
Sakai et al
2000b
Green 2 Japan HahaJima/OgaSawara
Island
Relatively high Cd
concentrations
Collected in coastal
waters
Matur
e
Male and
female 1.9 1.9 1.9
Sakai et al
2000a
Green 34 Costa Rica Tortuguero National
Park, North Carribean Cd considered background
Dead, nesting turtles,
killed by jaguars ND
Pooled
sample 2.0 ND ND †
Andreani et al
2008
Green 1 USA Control, Captive Agricultural areas Captive specimen ND Female 2.1 ND ND Aguirre et al
1994
Green 26 Japan Yaeyama Islands,
Okinawa Prefecture
Renal Cd levels considered
extremely high Fishing nets
Mostly
juvenil
es
Males and
females ND 0.70 3.4 ‡ Anan et al 2001
Green 8 Mexico Magdalena Bay, Baja
California
19th century mining - Cd, Zn,
Cu and Pb in sediments above
those in industrialised
regions; Cd considered
elevated
Specimens drowned in
fishing nets
SCL
47-77
cm
Unknown
gender ND ND 1.2 †
Talavera-Saenz
et al 2007
Hawksbill 22 Japan Yaeyama Islands,
Okinawa Prefecture
Renal Cd levels considered
extremely high Fishing nets Mostly
juvenil
Males and
females 2.6 1.2 5.5 ‡ Anan et al 2001

Investigation of contaminant levels in green turtles from Gladstone
133
es
Loggerhead 11 Italy Cesenatico & Sicily
Island, Mediterranean Cd considered background Stranded ND
Pooled
sample 1.6 ND ND †
Andreani et al
2008
Loggerhead 7 Japan Cape Ashizuri, Kochi
Highest Cd in specimens with
symptoms of kidney
congestion
Fishing net entanglement
Adults
(SCL
76-92
cm)
Females
(n=6) and
n=1 male
2.1 1.4 2.9
Sakai et al 1995
Sakai et al
2000a

Investigation of contaminant levels in green turtles from Gladstone
134
8.2.10 Mercury (Hg)
Turtle
species n Country Location
Location/source
information
Health & other
information
Age
class Gender Mean Min Max Reference
Blood (ppb ww)
Green 40 Australia Gladstone Industrialised port estuary Unhealthy, incl.
moribund and healthy Juveniles
Males
and
females
9.3 <0.22 38 This study
Green 30 USA San Diego Highly urbanised &
contaminated estuary
Live captured
specimens
Juveniles,
Adults
Unknown
gender 1.0 ND ND
Komoroske et al
2011
Green 16 Australia Gold Coast, QLD Urbanised, potentially near
point sources
Moribund, washed up
specimens, euthanised
Juveniles
and
subadults
ND 2.5 0.25 7.1 van de Merwe
et al 2010a
Flatback 20 Australia Curtis Isl, QLD Off the coast of Gladstone Live, nesting
Young
adults to
adults
Females <0.1 <0.1 <0.1 Ikonomopoulou
et al 2011
Loggerhead 13 USA South Carolina &
Florida
Widespread Hg impaired
waterways, incl. superfund sites
Emaciated, moribund
specimens, stranded ND ND 6.4 ND ND Day et al 2010
Leatherback 78 French
Guiana French Guiana
Industry, mining activities along
migration path Nesting females Adult Females 11 8.0 14 ˄
Guirlet et al
2008
Loggerhead 34 USA South Carolina &
Florida
Widespread Hg impaired
waterways, incl. superfund sites
Live specimens, some
highly contaminated
individuals, correlated
to point sources
Adults
Males
and
females
29 5.0 190 Day et al 2005
Loggerhead 66 USA South Carolina &
Florida
Widespread Hg impaired
waterways, incl. superfund sites
Free ranging specimens,
high Hg
Subadults
and
adults
ND 29 6.0 77 Day et al 2007
Loggerhead 100 USA South Carolina &
Florida
Widespread Hg impaired
waterways, incl. superfund sites
Live-captured,
apparently healthy ND ND 30 ND ND Day et al 2010

Investigation of contaminant levels in green turtles from Gladstone
135
Loggerhead 34 USA South Carolina &
Florida
Widespread Hg impaired
waterways, incl. superfund sites
Stranded specimens,
very high Hg levels,
point sources present in
area
Adults
Males
and
females
99 40.0 310 Day et al 2005
Olive Ridley 25 Mexico Oaxaca Near pristine environment Apparently healthy Adults Nesting
females 0.15 ND ND !
Paez-Osuna et
al 2011
Kidney (ppm ww)
Green 40 Australia Gladstone Industrialised port estuary Unhealthy, incl.
moribund and healthy Juveniles
Males
and
females
0.42 0.15 0.72 This study
Green 7 Australia Waru, Torres Strait Remote, very high Cd, elevated
Co, Hg, Se Caught alive Unknown ND 0.020 0.010 0.040 Gladstone 1996
Green 23 Australia
Moreton Bay, QLD
(incl. n=1 each from
Shoalwater and
Hervey Bays)
Urbanised port estuary; Cd
among the highest recorded for
marine vertebrates
Stranded specimens;
mainly unhealthy
Juveniles
and
adults
ND 0.020 ND 0.049 Gordon et al
1998
Green 2
Hong
Kong,
China
South China Sea
Urban and industrial area;
exposed to relatively high levels
of Se
Stranded specimens Juveniles ND 0.041 ND ND † Lam et al 2004
Green 2 Japan HahaJima/OgaSawara
Island
Relatively high Cd
concentrations
Collected in coastal
waters Mature
Male and
female 0.045 0.042 0.048
Sakai et al
2000a
Green 25 Japan Yaeyama Islands,
Okinawa Prefecture
Renal Cd levels considered
extremely high Fishing nets
Mostly
juveniles
Males
and
females
0.059 0.064 0.11 ‡ Anan et al 2001
Green 16 Australia Gold Coast, QLD Urbanised, potentially near
point sources
Moribund, washed up
specimens, euthanised
Juveniles
and
subadults
ND 0.060 <LOR 0.20 van de Merwe
et al 2010a
Green 10 Mexico Gulf of California &
Magdalena Bay Near pristine environment Healthy Juveniles ND 0.089 0.0030 0.31
Kampalath et al
2006

Investigation of contaminant levels in green turtles from Gladstone
136
Green 21 Japan Yaeyama Isl, Okinawa Cd concentrations considered
high Caught by fishermen
Juveniles
and
adults
Unknown
gender 0.13 0.029 0.25
Sakai et al
2000b
Hawksbill 19 Japan Yaeyama Islands,
Okinawa Prefecture
Renal Cd levels considered
extremely high Fishing nets
Mostly
juveniles
Males
and
females
0.25 0.016 0.98 ‡ Anan et al 2001
Hawksbill 2 Australia Moreton Bay, QLD
Urbanised port estuary; Cd
among the highest recorded for
marine vertebrates
Stranded specimens;
mainly unhealthy Unknown ND ND 0.034 0.038
Gordon et al
1998
Loggerhead 78 Spain Canary Islands,
Mediterranean
Generally considered relatively
contaminated areas Stranded
Juveniles
and
subadults
Mainly
females
(n=67)
0.040 0.010 0.33 Torrent et al
2004
Loggerhead 3 Australia Moreton Bay, QLD
Urbanised port estuary; Cd
among the highest recorded for
marine vertebrates
Stranded specimens;
mainly unhealthy Unknown ND 0.045 0.033 0.067
Gordon et al
1998
Loggerhead 2 Mexico Gulf of California &
Magdalena Bay Near pristine environment Healthy Juveniles ND 0.10 0.064 0.14
Kampalath et al
2006
Loggerhead 7 Japan Cape Ashizuri, Kochi Highest Cd in specimens with
symptoms of kidney congestion
Fishing net
entanglement
Adults
(SCL 76-
92)
Females
(n=6) and
n=1 male
0.25 0.040 0.44
Sakai et al 1995
Sakai et al
2000a
Loggerhead 2 Cyprus Northern Cyprus,
Mediterranean
Generally contaminated,
presence of natural Hg bed Stranded specimens Juveniles ND ND 0.036 0.22 ‡
Godley et al
1999
Olive Ridley 3 Mexico Gulf of California &
Magdalena Bay Near pristine environment Healthy Juveniles 0.14 0.028 0.37
Kampalath et al
2006
Liver (ppm ww)
Green 40 Australia Gladstone Industrialised port estuary Unhealthy, incl.
moribund and healthy Juveniles
Males
and
females
1.3 0.86 1.6 This study

Investigation of contaminant levels in green turtles from Gladstone
137
Green 23 Australia
Moreton Bay, QLD
(incl. n=1 each from
Shoalwater and
Hervey Bays)
Urbanised port estuary; Cd
among the highest recorded for
marine vertebrates
Stranded specimens;
mainly unhealthy
Juveniles
and
adults
ND 0.021 ND 0.052 Gordon et al
1998
Green 7 Australia Waru, Torres Strait Remote, very high Cd, elevated
Co, Hg, Se Caught alive Unknown ND 0.080 0.020 0.17 Gladstone 1996
Green 11 Mexico Gulf of California &
Magdalena Bay Near pristine environment Healthy Juveniles ND 0.091 0.026 0.17
Kampalath et al
2006
Green 26 Japan Yaeyama Islands,
Okinawa Prefecture
Renal Cd levels considered
extremely high Fishing nets
Mostly
juveniles
Males
and
females
0.13 0.071 0.27 ‡ Anan et al 2001
Green 2
Hong
Kong,
China
South China Sea
Urban and industrial area;
exposed to relatively high levels
of Se
Stranded specimens Juveniles ND 0.17 ND ND † Lam et al 2004
Green 16 Australia Gold Coast, QLD Urbanised, potentially near
point sources
Moribund, washed up
specimens, euthanised
Juveniles
and
subadults
ND 0.19 <LOR 0.54 van de Merwe
et al 2010a
Green 2 Japan HahaJima/OgaSawara
Isl
Relatively high Cd
concentrations
Collected in coastal
waters Mature
Male and
female 0.19 0.077 0.30
Sakai et al
2000a
Green 50 Sultanate
of Oman
Ras Al-Hadd Turtle
Reserve
Substantial industrial and urban
developments Hatchlings; control Hatchling 0.22
Al-Rawahy et al
2007
Green 46 Japan Yaeyama Isl, Okinawa Cd concentrations considered
high Caught by fishermen
Juveniles
and
adults
Unknown
gender 0.29 0.053 0.64
Sakai et al
2000b
Green 6 Cyprus Northern Cyprus,
Mediterranean
Generally contaminated,
presence of natural Hg bed Stranded specimens Juveniles ND ND 0.059 0.30 ‡
Godley et al
1999
Hawksbill 22 Japan Yaeyama Islands,
Okinawa Prefecture
Renal Cd levels considered
extremely high Fishing nets
Mostly
juveniles
Males
and
females
0.27 0.015 2.7 ‡ Anan et al 2001

Investigation of contaminant levels in green turtles from Gladstone
138
Hawksbill 2 Australia Moreton Bay, QLD
Urbanised port estuary; Cd
among the highest recorded for
marine vertebrates
Stranded specimens;
mainly unhealthy Unknown ND ND 0.036 0.048
Gordon et al
1998
Loggerhead 6 Australia Moreton Bay, QLD
Urbanised port estuary; Cd
among the highest recorded for
marine vertebrates
Stranded specimens;
mainly unhealthy Unknown ND 0.015 ND 0.032
Gordon et al
1998
Loggerhead 78 Spain Canary Islands,
Mediterranean
Generally considered relatively
contaminated areas Stranded
Juveniles
and
subadults
Mainly
females
(n=67)
0.040 0.0010 0.47 Torrent et al
2004
Loggerhead 4 Mexico Gulf of California &
Magdalena Bay Near pristine environment Healthy Juveniles ND 0.15 0.12 0.18
Kampalath et al
2006
Loggerhead 7 Japan Cape Ashizuri, Kochi Highest Cd in specimens with
symptoms of kidney congestion
Fishing net
entanglement
Adults
(SCL 76-
92)
Females
(n=6) and
n=1 male
1.5 0.25 8.2
Sakai et al 1995
Sakai et al
2000a
Loggerhead 5 Cyprus Northern Cyprus,
Mediterranean
Generally contaminated,
presence of natural Hg bed Stranded specimens Juveniles ND ND 0.18 1.7 †
Godley et al
1999
Olive Ridley 6 Mexico Gulf of California &
Magdalena Bay Near pristine environment Healthy Juveniles ND 0.21 0.057 0.80
Kampalath et al
2006

Investigation of contaminant levels in green turtles from Gladstone
139
8.2.11 Molybdenum (Mo)
Turtle
species n Country Location
Location/source
information
Health & other
information Age class Gender Mean Min Max Reference
Blood (ppb ww)
Green 40 Gladstone Australia Industrialised port estuary Unhealthy, incl.
moribund and healthy Juveniles
Males and
females 11 4.6 83 This study
Flatback 20 Curtis Isl, QLD Australia Off the coast of Gladstone Live, nesting
Young
adults to
adults
Females <0.1 <0.1 <0.1 Ikonomopoulou
et al 2011
Kidney (ppm ww)
Green 40 Gladstone Australia Industrialised port estuary Unhealthy, incl.
moribund and healthy Juveniles
Males and
females 0.16 0.062 0.30 This study
Green 2 South China Sea Hong Kong,
China
Urban and industrial area;
exposed to relatively high
levels of Se
Stranded specimens Juveniles ND 0.094 ND ND † Lam et al 2004
Green 1 Control, Captive USA Agricultural areas Captive specimen ND Female 0.10 Aguirre et al
1994
Green 3 Hawaii USA Agricultural areas Stranded specimens ND Males and
females 0.13 0.10 0.20
Aguirre et al
1994
Green 25
Yaeyama Islands,
Okinawa
Prefecture
Japan Renal Cd levels considered
extremely high Fishing nets
Mostly
juveniles
Males and
females 0.13 0.053 0.30 ‡ Anan et al 2001
Green 6 Hawaii USA Agricultural areas
Moribund specimens
with severe
fibropapilloma
Juveniles Males and
females 0.25 0.20 0.30
Aguirre et al
1994
Hawksbill 19 Yaeyama Islands,
Okinawa Japan
Renal Cd levels considered
extremely high Fishing nets
Mostly
juveniles
Males and
females 0.28 0.084 0.58 ‡ Anan et al 2001

Investigation of contaminant levels in green turtles from Gladstone
140
Prefecture
Liver (ppm ww)
Green 40 Gladstone Australia Industrialised port estuary Unhealthy, incl.
moribund and healthy Juveniles
Males and
females 0.54 0.39 0.83 This study
Green 1 Control, Captive USA Agricultural areas Captive specimen ND Female 0.10 ND ND Aguirre et al
1994
Green 26
Yaeyama Islands,
Okinawa
Prefecture
Japan Renal Cd levels considered
extremely high Fishing nets
Mostly
juveniles
Males and
females 0.17 0.024 0.37 ‡ Anan et al 2001
Green 2 Hawaii USA Agricultural areas Stranded specimens ND Males and
females 0.25 0.20 0.30
Aguirre et al
1994
Green 2 South China Sea Hong Kong,
China
Urban and industrial area;
exposed to relatively high
levels of Se
Stranded specimens Juveniles ND 0.27 ND ND † Lam et al 2004
Green 6 Hawaii USA Agricultural areas
Moribund specimens
with severe
fibropapilloma
Juveniles Males and
females 0.30 0.20 0.60
Aguirre et al
1994
Hawksbill 22
Yaeyama Islands,
Okinawa
Prefecture
Japan Renal Cd levels considered
extremely high Fishing nets
Mostly
juveniles
Males and
females 0.36 0.061 1.3 ‡ Anan et al 2001

Investigation of contaminant levels in green turtles from Gladstone
141
8.2.12 Nickel (Ni)
Turtle
species n Country Location
Location/source
information
Health & other
information
Age
class Gender Mean Min Max Reference
Blood (ppb ww)
Green 40 Australia Gladstone Industrialised port estuary Unhealthy, incl.
moribund and healthy Juveniles
Males
and
females
5.2 0.67 17 This study
Flatback 20 Australia Curtis Isl, QLD Off the coast of Gladstone Live, nesting
Young
adults to
adults
Females <0.1 <0.1 <0.1 Ikonomopoulou
et al 2011
Olive
Ridley 25 Mexico Oaxaca
Various possible sources along
migration route Live, nesting Adults Females 76 ND ND #
Paez-Osuna et al
2010
Kidney (ppm ww)
Green 40 Australia Gladstone Industrialised port estuary Unhealthy, incl.
moribund and healthy Juveniles
Males
and
females
9.0 0.42 26 This study
Green 30 Brazil Cananeia Estuary
Pollution considered negligible
(but 200 km south of major
industrial area of Brazil)
Stranded Juvenile ND 0.011 ND ND † Barbieri et al
2009
Green 30 Brazil Cananeia Estuary
Pollution considered negligible
(but 200 km south of major
industrial area of Brazil)
Stranded Adult ND 0.023 ND ND † Barbieri et al
2009
Green 2
Hong
Kong,
China
South China Sea Urban and industrial area; exposed
to relatively high levels of Se Stranded specimens Juveniles ND 0.024 ND ND † Lam et al 2004
Green 8 Mexico Magdalena Bay, Baja
California
19th century mining - Cd, Zn, Cu
and Pb in sediments above those in
industrialised regions; Cd
Specimens drowned in
fishing nets
SCL 47-
77 cm
Unknown
gender 0.38 0.14 3.0 †
Talavera-Saenz
et al 2007

Investigation of contaminant levels in green turtles from Gladstone
142
considered elevated
Green 2 Japan HahaJima/OgaSawara
Isl Relatively high Cd concentrations
Collected in coastal
waters Mature
Male and
female 0.51 0.46 0.56 Sakai et al 2000a
Green 23 Japan Yaeyama Isl, Okinawa Cd concentrations considered high Caught by fishermen
Juveniles
and
adults
Unknown
gender 0.62 0.12 1.3 Sakai et al 2000b
Green 5 USA Ahu-O-Laka,
Kaneohe, HI Agricultural areas
Moribund specimens
with severe
fibropapilloma
Juveniles
Males
and
females
0.78 0.50 0.90 Aguirre et al
1994
Green 1 USA Pelagic, Hawaii Agricultural areas Stranded specimen ND Female 0.80 ND ND Aguirre et al
1994
Green 14 Turkey Southwest
Mediterranean
Generally considered relatively
contaminated
Stranded specimens
from nesting
population, mainly
fishing related deaths
Adults
and
subadults
Mostly
females 1.2 0.51 1.7 † Kaska et al 2004
Loggerhead 7 Japan Cape Ashizuri, Kochi Highest Cd in specimens with
symptoms of kidney congestion
Fishing net
entanglement
Adults
(SCL 76-
92)
Females
(n=6) and
n=1 male
0.16 <0.03 0.27 Sakai et al 1995
Sakai et al 2000a
Loggerhead 20 Turkey Southwest
Mediterranean
Generally considered relatively
contaminated
Stranded specimens
from nesting
population, mainly
fishing related deaths
Adults
and
subadults
ND 1.2 0.52 1.5 † Kaska et al 2004
Loggerhead 78 Spain Canary Islands,
Mediterranean
Generally considered relatively
contaminated areas; high Ni levels Stranded
Juveniles
and
subadults
Mainly
females
(n=67)
5.8 0.040 48 Torrent et al
2004
Liver (ppm ww)
Green 40 Australia Gladstone Industrialised port estuary Unhealthy, incl.
moribund and healthy Juveniles Males
and 0.20 0.17 0.23 This study

Investigation of contaminant levels in green turtles from Gladstone
143
females
Green 30 Brazil Cananeia Estuary
Pollution considered negligible
(but 200 km south of major
industrial area of Brazil)
Stranded Juvenile ND 0.029 ND ND † Barbieri et al
2009
Green 2
Hong
Kong,
China
South China Sea Urban and industrial area; exposed
to relatively high levels of Se Stranded specimens Juveniles ND 0.059 ND ND † Lam et al 2004
Green 30 Brazil Cananeia Estuary
Pollution considered negligible
(but 200 km south of major
industrial area of Brazil)
Stranded Adult ND 0.062 ND ND † Barbieri et al
2009
Green 50 Japan Yaeyama Isl, Okinawa Cd concentrations considered high Caught by fishermen
Juveniles
and
adults
Unknown
gender ND 0.060 0.31 Sakai et al 2000b
Green 1 Japan HahaJima/OgaSawara
Isl Relatively high Cd concentrations
Collected in coastal
waters Mature
Male and
female 0.065 0.059 0.071 Sakai et al 2000a
Green 50 Sultanate
of Oman
Ras Al-Hadd Turtle
Reserve
Substantial industrial and urban
developments Hatchlings; control Hatchling ND 0.090 ND ND
Al-Rawahy et al
2007
Green 22 Turkey Southwest
Mediterranean
Generally considered relatively
contaminated
Stranded specimens
from nesting
population, mainly
fishing related deaths
Adults
and
subadults
Mostly
females 2.0 1.3 2.8 † Kaska et al 2004
Green 8 Mexico Magdalena Bay, Baja
California
19th century mining - Cd, Zn, Cu
and Pb in sediments above those in
industrialised regions; Cd
considered elevated
Specimens drowned in
fishing nets
SCL 47-
77 cm
Unknown
gender ND ND 6.8 †
Talavera-Saenz
et al 2007
Loggerhead 7 Japan Cape Ashizuri, Kochi Highest Cd in specimens with
symptoms of kidney congestion
Fishing net
entanglement
Adults
(SCL 76-
92)
Females
(n=6) and
n=1 male
<0.03 ND ND Sakai et al 1995
Sakai et al 2000a

Investigation of contaminant levels in green turtles from Gladstone
144
Loggerhead 32 Turkey Southwest
Mediterranean
Generally considered relatively
contaminated
Stranded specimens
from nesting
population, mainly
fishing related deaths
Adults
and
subadults
ND 2.5 1.2 3.7 † Kaska et al 2004
Loggerhead 78 Spain Canary Islands,
Mediterranean
Generally considered relatively
contaminated areas Stranded
Juveniles
and
subadults
Mainly
females
(n=67)
2.9 0.010 14 Torrent et al
2004

Investigation of contaminant levels in green turtles from Gladstone
145
8.2.13 Selenium (Se)
Turtle
species n Country Location
Location/source
information
Health & other
information
Age
class Gender Mean Min Max Reference
Blood (ppb ww)
Green 40 Australia Gladstone Industrialised port estuary Unhealthy, incl.
moribund and healthy Juveniles
Males
and
females
1900 84 8600 This study
Green 30 USA San Diego Highly urbanised & contaminated
estuary
Live captured
specimens
Juveniles,
Adults
Unknown
gender 780 ND ND Komoroske et al 2011
Green 40 Mexico Punta Abreojos
Relatively pristine, agriculture,
shipyards & urban wastewater
discharge, 19th century mining;
Cd, Zn, Cu and Pb high in
sediments
Live captured
specimens,
apparently healthy
Juveniles Unknown
gender 1600 30 5700 ˄
Labrada-Martagón et
al 2011
Green 14 Mexico Bahia Magdalena
Relatively pristine, agriculture,
shipyards & urban wastewater
discharge, 19th century mining;
Cd, Zn, Cu and Pb high in
sediments
Live captured
specimens,
apparently healthy
Juveniles Unknown
gender 1800 150 4700 ˄
Labrada-Martagón et
al 2011
Green 16 Australia Gold Coast, QLD Urbanised, potentially near point
sources
Moribund, washed up
specimens,
euthanised
Juveniles
and
subadults
ND 2400 68 9100 Van de Merwe et al
2010a
Kidney (ppm ww)
Green 40 Australia Gladstone Industrialised port estuary Unhealthy, incl.
moribund and healthy Juveniles
Males
and
females
1.3 0.62 2.4 This study
Green 6 USA Ahu-O-Laka,
Kaneohe, HI
Agricultural areas; Se levels
considered "normal" Moribund specimens
with severe Juveniles Males
and 0.42 0.21 0.96 Aguirre et al 1994

Investigation of contaminant levels in green turtles from Gladstone
146
fibropapilloma females
Green 7 Australia Waru, Torres Strait Remote, very high Cd, elevated
Co, Hg, Se Caught alive ND ND 0.45 0.16 1.3 Gladstone 1996
Green 23 Australia
Moreton Bay, QLD
(incl. n=1 each
from Shoalwater
and Hervey Bays)
Urbanised port estuary; Cd among
the highest recorded for marine
vertebrates
Stranded specimens;
mainly unhealthy
Juveniles
and
adults
ND 0.59 0.090 1.9 Gordon et al 1998
Green 1 USA Control, Captive Agricultural areas; Se levels
considered "normal" Captive specimen ND Female 0.70 ND ND Aguirre et al 1994
Green 2
Hong
Kong,
China
South China Sea
Urban and industrial area;
exposed to relatively high levels of
Se
Stranded specimens Juveniles ND 0.71 ND ND † Lam et al 2004
Green 5 USA Pelagic, Hawaii
Agricultural areas; relatively high
Se in one pelagic specimen, but
otherwise considered "normal"
Stranded specimens ND
Males
and
females
0.75 0.19 1.6 Aguirre et al 1994
Green 14 Turkey Southwest
Mediterranean
Generally considered relatively
contaminated
Stranded specimens
from nesting
population, mainly
fishing related deaths
Adults
and
subadults
Mostly
females 0.94 0.31 1.4 † Kaska et al 2004
Green 25 Japan
Yaeyama Islands,
Okinawa
Prefecture
Renal Cd levels considered
extremely high Fishing nets
Mostly
juveniles
Males
and
females
1.0 0.41 2.1 ‡ Anan et al 2001
Green 16 Australia Gold Coast, QLD Urbanised, potentially near point
sources
Moribund, washed up
specimens,
euthanised
Juveniles
and
subadults
ND 1.7 0.29 5.1 Van de Merwe et al
2010a
Hawksbill 2 Australia Moreton Bay, QLD
Urbanised port estuary; Cd among
the highest recorded for marine
vertebrates
Stranded specimens;
mainly unhealthy Unknown ND ND 2.2 2.5 Gordon et al 1998
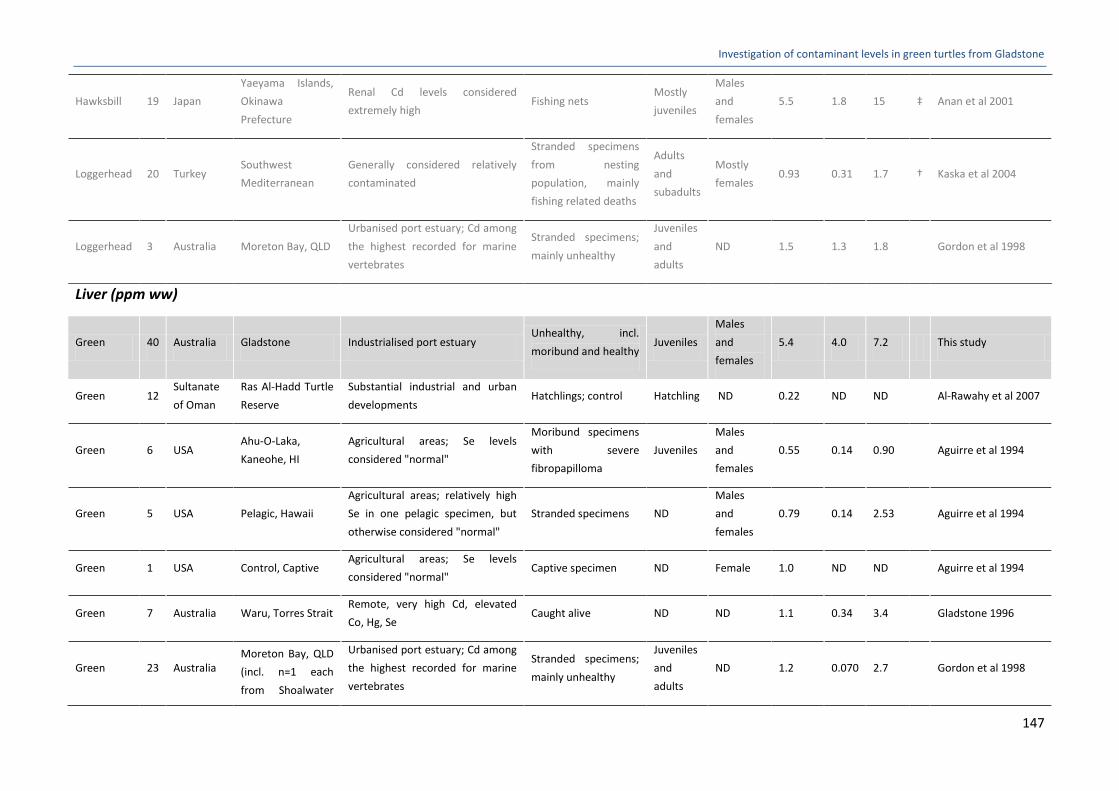
Investigation of contaminant levels in green turtles from Gladstone
147
Hawksbill 19 Japan
Yaeyama Islands,
Okinawa
Prefecture
Renal Cd levels considered
extremely high Fishing nets
Mostly
juveniles
Males
and
females
5.5 1.8 15 ‡ Anan et al 2001
Loggerhead 20 Turkey Southwest
Mediterranean
Generally considered relatively
contaminated
Stranded specimens
from nesting
population, mainly
fishing related deaths
Adults
and
subadults
Mostly
females 0.93 0.31 1.7 † Kaska et al 2004
Loggerhead 3 Australia Moreton Bay, QLD
Urbanised port estuary; Cd among
the highest recorded for marine
vertebrates
Stranded specimens;
mainly unhealthy
Juveniles
and
adults
ND 1.5 1.3 1.8 Gordon et al 1998
Liver (ppm ww)
Green 40 Australia Gladstone Industrialised port estuary Unhealthy, incl.
moribund and healthy Juveniles
Males
and
females
5.4 4.0 7.2 This study
Green 12 Sultanate
of Oman
Ras Al-Hadd Turtle
Reserve
Substantial industrial and urban
developments Hatchlings; control Hatchling ND 0.22 ND ND Al-Rawahy et al 2007
Green 6 USA Ahu-O-Laka,
Kaneohe, HI
Agricultural areas; Se levels
considered "normal"
Moribund specimens
with severe
fibropapilloma
Juveniles
Males
and
females
0.55 0.14 0.90 Aguirre et al 1994
Green 5 USA Pelagic, Hawaii
Agricultural areas; relatively high
Se in one pelagic specimen, but
otherwise considered "normal"
Stranded specimens ND
Males
and
females
0.79 0.14 2.53 Aguirre et al 1994
Green 1 USA Control, Captive Agricultural areas; Se levels
considered "normal" Captive specimen ND Female 1.0 ND ND Aguirre et al 1994
Green 7 Australia Waru, Torres Strait Remote, very high Cd, elevated
Co, Hg, Se Caught alive ND ND 1.1 0.34 3.4 Gladstone 1996
Green 23 Australia Moreton Bay, QLD
(incl. n=1 each
from Shoalwater
Urbanised port estuary; Cd among
the highest recorded for marine
vertebrates
Stranded specimens;
mainly unhealthy
Juveniles
and
adults
ND 1.2 0.070 2.7 Gordon et al 1998

Investigation of contaminant levels in green turtles from Gladstone
148
and Hervey Bays)
Green 26 Japan
Yaeyama Islands,
Okinawa
Prefecture
Renal Cd levels considered
extremely high Fishing nets
Mostly
juveniles
Males
and
females
1.6 0.62 3.1 ‡ Anan et al 2001
Green 22 Turkey Southwest
Mediterranean
Generally considered relatively
contaminated
Stranded specimens
from nesting
population, mainly
fishing related deaths
Adults
and
subadults
ND 2.3 0.22 4.2 † Kaska et al 2004
Green 16 Australia Gold Coast, QLD Urbanised, potentially near point
sources
Moribund, washed up
specimens,
euthanised
Juveniles
and
subadults
ND 4.0 0.52 10 Van de Merwe et al
2010a
Green 2
Hong
Kong,
China
South China Sea
Urban and industrial area;
exposed to relatively high levels of
Se
Stranded specimens Juveniles ND 5.6 ND ND † Lam et al 2004
Hawksbill 2 Australia Moreton Bay, QLD
Urbanised port estuary; Cd among
the highest recorded for marine
vertebrates
Stranded specimens;
mainly unhealthy Unknown ND ND 2.7 3.7 Gordon et al 1998
Hawksbill 22 Japan
Yaeyama Islands,
Okinawa
Prefecture
Renal Cd levels considered
extremely high Fishing nets
Mostly
juveniles
Males
and
females
15 3.7 46 ‡ Anan et al 2001
Loggerhead 6 Australia Moreton Bay, QLD
Urbanised port estuary; Cd among
the highest recorded for marine
vertebrates
Stranded specimens;
mainly unhealthy
Juveniles
and
adults
ND 2.2 1.4 2.7 Gordon et al 1998
Loggerhead 32 Turkey Southwest
Mediterranean
Generally considered relatively
contaminated
Stranded specimens
from nesting
population, mainly
fishing related deaths
Adults
and
subadults
Mostly
females 2.8 0.70 4.9 † Kaska et al 2004

Investigation of contaminant levels in green turtles from Gladstone
149
8.2.14 Silver (Ag)
Turtle
species n Country Location
Location/source
information
Health & other
information
Age
class Gender Mean Min Max Reference
Blood (ppb ww)
Green 40 Australia Gladstone Industrialised port estuary Unhealthy, incl.
moribund and healthy Juveniles
Males and
females 0.66 0.011 7.1 This study
Green 30 USA San Diego Highly urbanised & contaminated
estuary
Live captured
specimens
Juveniles,
Adults
Unknown
gender 1.6 ND ND
Komoroske et
al 2011
Kemp's
Ridley 106 USA USA Texas and Louisiana
Live captured
specimens ND
Males and
females 0.94 0 3
Kenyon et al
2001
Kidney (ppm ww)
Green 3 Australia Gladstone Industrialised port estuary Unhealthy, incl.
moribund and healthy Juveniles
Males and
females ND ND ND This study
Green 25 Japan
Yaeyama Islands,
Okinawa
Prefecture
Renal Cd levels considered
extremely high Fishing nets
Mostly
juveniles
Males and
females 0.0035 0.00036 0.014 ‡
Anan et al
2001
Green 2
Hong
Kong,
China
South China Sea Urban and industrial area; exposed
to relatively high levels of Se Stranded specimens Juveniles ND 0.007 ND ND † Lam et al 2004
Hawksbill 19 Japan
Yaeyama Islands,
Okinawa
Prefecture
Renal Cd levels considered
extremely high Fishing nets
Mostly
juveniles
Males and
females 0.0023 0.0011 0.0046 ‡
Anan et al
2001
Liver (ppm ww)
Green 3 Australia Gladstone Industrialised port estuary Unhealthy, incl.
moribund and healthy Juveniles
Males and
females ND ND ND This study
Green 26 Japan Yaeyama Islands,
Okinawa Renal Cd levels considered Fishing nets Mostly Males and 0.70 0.15 2.0 ‡ Anan et al
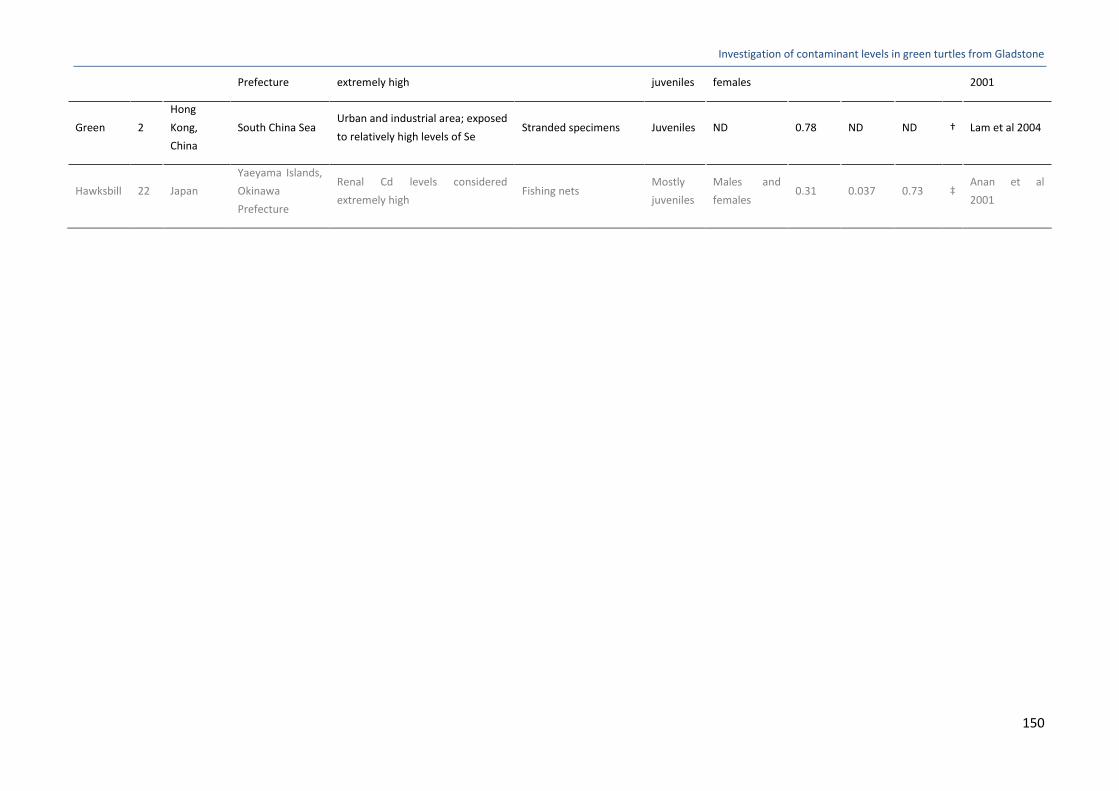
Investigation of contaminant levels in green turtles from Gladstone
150
Prefecture extremely high juveniles females 2001
Green 2
Hong
Kong,
China
South China Sea Urban and industrial area; exposed
to relatively high levels of Se Stranded specimens Juveniles ND 0.78 ND ND † Lam et al 2004
Hawksbill 22 Japan
Yaeyama Islands,
Okinawa
Prefecture
Renal Cd levels considered
extremely high Fishing nets
Mostly
juveniles
Males and
females 0.31 0.037 0.73 ‡
Anan et al
2001

Investigation of contaminant levels in green turtles from Gladstone
151
8.2.15 Vanadium (V)
Turtle
species n Country Location
Location/source
information
Health & other
information Age class Gender Mean Min Max Reference
Blood (ppb ww)
Green 40 Australia Gladstone Industrialised port estuary Unhealthy, incl.
moribund and healthy Juveniles
Males and
females 12 3.5 38 This study
Green 9 Australia Moreton Bay Urbanised, potentially near
point sources Live captured Juveniles
Males and
females 2.8 0.29 8.5 Unpublished data
Kidney (ppm ww)
Green 40 Australia Gladstone Industrialised port estuary Unhealthy, incl.
moribund and healthy Juveniles
Males and
females 0.30 0.23 0.34 This study
Green 2
Hong
Kong,
China
South China Sea
Urban and industrial area;
exposed to relatively high
levels of Se
Stranded specimens Juveniles ND 0.058 ND ND † Lam et al 2004
Green 25 Japan
Yaeyama Islands,
Okinawa
Prefecture
Renal Cd levels considered
extremely high Fishing nets
Mostly
juveniles
Males and
females 0.31 0.045 0.70 ‡ Anan et al 2001
Green 2 USA Hawaii Agricultural areas
Moribund specimens
with severe
fibropapilloma
Juveniles Males and
females 0.50 0.30 0.70 Aguirre et al 1994
Green 1 USA Hawaii Agricultural areas Stranded specimens ND Males and
females 2.5 ND ND Aguirre et al 1994
Hawksbill 19 Japan
Yaeyama Islands,
Okinawa
Prefecture
Renal Cd levels considered
extremely high Fishing nets
Mostly
juveniles
Males and
females 0.090 0.019 0.23 ‡ Anan et al 2001
Liver (ppm ww)

Investigation of contaminant levels in green turtles from Gladstone
152
Green 40 Australia Gladstone Industrialised port estuary Unhealthy, incl.
moribund and healthy Juveniles
Males and
females 0.45 0.23 0.79 This study
Green 2
Hong
Kong,
China
South China Sea
Urban and industrial area;
exposed to relatively high
levels of Se
Stranded specimens Juveniles ND 0.13 ND ND † Lam et al 2004
Green 26 Japan
Yaeyama Islands,
Okinawa
Prefecture
Renal Cd levels considered
extremely high Fishing nets
Mostly
juveniles
Males and
females 0.29 0.020 0.74 ‡ Anan et al 2001
Green 1 USA Control, Captive Agricultural areas Captive specimen Female 0.30 ND ND Aguirre et al 1994
Green 50 Sultanate
of Oman
Ras Al-Hadd
Turtle Reserve
Substantial industrial and
urban developments Hatchlings; control Hatchling ND 0.36 ND ND
Al-Rawahy et al
2007
Green 4 USA Hawaii Agricultural areas Stranded specimens ND Males and
females 0.53 0.20 0.90 Aguirre et al 1994
Green 6 USA Hawaii Agricultural areas
Moribund specimens
with severe
fibropapilloma
Juveniles Males and
females 0.83 0.30 1.5 Aguirre et al 1994
Hawksbill 22 Japan
Yaeyama Islands,
Okinawa
Prefecture
Renal Cd levels considered
extremely high Fishing nets
Mostly
juveniles
Males and
females 0.11 0.017 0.34 ‡ Anan et al 2001

Investigation of contaminant levels in green turtles from Gladstone
153
8.2.16 Zinc (Zn)
Turtle
species n Country Location
Location/source
information
Health & other
information
Age
class Gender Mean Min Max Reference
Blood (ppb ww)
Green 40 Australia Gladstone Industrialised port estuary
Unhealthy, incl.
moribund and
healthy
Juveniles
Males
and
females
8400 3800 12000 This study
Green 42 Mexico Punta Abreojos
Relatively pristine, agriculture,
shipyards & urban wastewater
discharge, 19th century mining; Cd,
Zn, Cu and Pb high in sediments
Live captured
specimens,
apparently healthy
Juveniles Unknown
gender 14000 460 20000 ˄
Labrada-
Martagón et al
2011
Green 14 Mexico Bahia Magdalena
Relatively pristine, agriculture,
shipyards & urban wastewater
discharge, 19th century mining; Cd,
Zn, Cu and Pb high in sediments
Live captured
specimens,
apparently healthy
Juveniles Unknown
gender 14000 11000 19000 ˄
Labrada-
Martagón et al
2011
Green 16 Australia Gold Coast, QLD Urbanised, potentially near point
sources
Moribund, washed
up specimens,
euthanised
Juveniles
and
subadults
ND 7900 3500 12000 van de Merwe
et al 2010a
Flatback 20 Australia Curtis Isl, QLD Off the coast of Gladstone Live, nesting
Young
adults to
adults
Females 150 98 210 Ikonomopoulou
et al 2011
Leatherback 78 French
Guiana French Guiana
Industry, mining activities along
migration path Nesting females Adult Females 11000 11000 11000 ˄
Guirlet et al
2008
Kidney (ppm ww)
Green 40 Australia Gladstone Industrialised port estuary
Unhealthy, incl.
moribund and
healthy
Juveniles
Males
and
females
33 20 40 This study

Investigation of contaminant levels in green turtles from Gladstone
154
Green 2 Japan HahaJima/OgaSawara
Isl Relatively high Cd concentrations
Collected in coastal
waters Mature
Male and
female 34 33 35
Sakai et al
2000a
Green 1 USA Control, Captive Agricultural areas Captive specimen ND Female 32 ND ND Aguirre et al
1994
Green 6 USA Hawaii Agricultural areas
Moribund
specimens with
severe
fibropapilloma
Juveniles
Males
and
females
26 20 38 Aguirre et al
1994
Green 8 Mexico Magdalena Bay, Baja
California
19th century mining - Cd, Zn, Cu and
Pb in sediments above those in
industrialised regions; Cd considered
elevated
Specimens drowned
in fishing nets
SCL 47-
77 cm
Unknown
gender 23 12 34 †
Talavera-Saenz
et al 2007
Green 2
Hong
Kong,
China
South China Sea Urban and industrial area; exposed to
relatively high levels of Se Stranded specimens Juveniles ND 17 ND ND † Lam et al 2004
Green 5 USA Hawaii Agricultural areas Stranded specimens ND
Males
and
females
16 16 16 Aguirre et al
1994
Green 33 Costa Rica Tortuguero National
Park, North Carribean Cd considered background
Dead, nesting
turtles, killed by
jaguars
ND ND 9.3 ND ND † Andreani et al
2008
Green 23 Japan Yaeyama Isl, Okinawa Cd concentrations considered high Caught by fishermen
Juveniles
and
adults
Unknown
gender 30 18 45
Sakai et al
2000b
Green 16 Australia Gold Coast, QLD Urbanised, potentially near point
sources
Moribund, washed
up specimens,
euthanised
Juveniles
and
subadults
ND 29 18 48 van de Merwe
et al 2010a
Green 7 Italy Adreaiatic and Ionian
Seas, Mediterranean Generally considered contaminated Stranded Juveniles
Unknown
gender 26 15 38
Storelli et al
2008

Investigation of contaminant levels in green turtles from Gladstone
155
Green 7 Australia Waru, Torres Strait Remote, very high Cd, elevated Co,
Hg, Se Caught alive Unknown ND 24 19 28 Gladstone 1996
Green 30 Australia
Moreton Bay, QLD
(incl. n=1 each from
Shoalwater and
Hervey Bays)
Urbanised port estuary; Cd among
the highest recorded for marine
vertebrates
Stranded specimens;
mainly unhealthy
Juveniles
and
adults
ND 21 15 32 Gordon et al
1998
Hawksbill 19 Japan Yaeyama Islands,
Okinawa Prefecture
Renal Cd levels considered extremely
high Fishing nets
Mostly
juveniles
Males
and
females
23 16 39 ‡ Anan et al 2001
Hawksbill 3 Australia Moreton Bay, QLD
Urbanised port estuary; Cd among
the highest recorded for marine
vertebrates
Stranded specimens;
mainly unhealthy Unknown ND ND 13 21
Gordon et al
1998
Leatherback 5 France French Atlantic Coast Cd considered high Stranded, dead Juvenile ND 26 19 34 Caurant et al
1999
Loggerhead 7 Japan Cape Ashizuri, Kochi Highest Cd in specimens with
symptoms of kidney congestion
Fishing net
entanglement
Adults
(SCL 76-
92)
Females
(n=6) and
n=1 male
26 19 30
Sakai et al 1995
Sakai et al
2000a
Loggerhead 5 France French Atlantic Coast Cd considered high Stranded, dead Juvenile ND 24 17 34 Caurant et al
1999
Loggerhead 9 Italy
Cesenatico & Sicily
Island,
Mediterranean
Cd considered background Stranded ND ND 14 ND ND † Andreani et al
2008
Loggerhead 78 Spain Canary Islands,
Mediterranean
Generally considered relatively
contaminated areas Stranded
Juveniles
and
subadults
Mainly
females
(n=67)
9.1 0.070 39 Torrent et al
2004
Loggerhead 5 Australia Moreton Bay, QLD
Urbanised port estuary; Cd among
the highest recorded for marine
vertebrates
Stranded specimens;
mainly unhealthy Unknown ND 18 17 21
Gordon et al
1998
Olive Ridley 1 Australia Moreton Bay, QLD Urbanised port estuary; Cd among
the highest recorded for marine Stranded specimens; Unknown ND 19 ND ND Gordon et al

Investigation of contaminant levels in green turtles from Gladstone
156
vertebrates mainly unhealthy 1998
Liver (ppm ww)
Green 40 Australia Gladstone Industrialised port estuary
Unhealthy, incl.
moribund and
healthy
Juveniles
Males
and
females
46 41 51 This study
Green 34 Costa Rica Tortuguero National
Park, North Carribean Cd considered background
Dead, nesting
turtles, killed by
jaguars
ND ND 18 ND ND † Andreani et al
2008
Green 8 Mexico Magdalena Bay, Baja
California
19th century mining - Cd, Zn, Cu and
Pb in sediments above those in
industrialised regions; Cd considered
elevated
Specimens drowned
in fishing nets
SCL 47-
77 cm
Unknown
gender 20 9.2 24 †
Talavera-Saenz
et al 2007
Green 6 USA Hawaii Agricultural areas Stranded specimens ND
Males
and
females
23 15 40 Aguirre et al
1994
Green 50 Sultanate
of Oman
Ras Al-Hadd Turtle
Reserve
Substantial industrial and urban
developments Hatchlings; control Hatchling ND 23 ND ND
Al-Rawahy et al
2007
Green 26 Japan Yaeyama Islands,
Okinawa Prefecture
Renal Cd levels considered extremely
high Fishing nets
Mostly
juveniles
Males
and
females
27 13 51 ‡ Anan et al 2001
Green 2
Hong
Kong,
China
South China Sea Urban and industrial area; exposed to
relatively high levels of Se Stranded specimens Juveniles ND 28 ND ND † Lam et al 2004
Green 50 Japan Yaeyama Isl, Okinawa Cd concentrations considered high Caught by fishermen
Juveniles
and
adults
Unknown
gender 30 18 47
Sakai et al
2000b
Green 25 Japan Yaeyama Islands,
Okinawa Prefecture
Renal Cd levels considered extremely
high Fishing nets
Mostly
juveniles
Males
and
females
33 17 69 ‡ Anan et al 2001

Investigation of contaminant levels in green turtles from Gladstone
157
Green 7 Italy Adreaiatic and Ionian
Seas, Mediterranean Generally considered contaminated Stranded Juveniles
Unknown
gender 35 19 54
Storelli et al
2008
Green 16 Australia Gold Coast, QLD Urbanised, potentially near point
sources
Moribund, washed
up specimens,
euthanised
Juveniles
and
subadults
ND 36 21 47 van de Merwe
et al 2010a
Green 6 USA Hawaii Agricultural areas
Moribund
specimens with
severe
fibropapilloma
Juveniles
Males
and
females
37 25 46 Aguirre et al
1994
Green 1 USA Control, Captive Agricultural areas Captive specimen ND Female 38 ND ND Aguirre et al
1994
Green 7 Australia Waru, Torres Strait Remote, very high Cd, elevated Co,
Hg, Se Caught alive Unknown ND 39 24 52 Gladstone 1996
Green 30 Australia
Moreton Bay, QLD
(incl. n=1 each from
Shoalwater and
Hervey Bays)
Urbanised port estuary; Cd among
the highest recorded for marine
vertebrates
Stranded specimens;
mainly unhealthy
Juveniles
and
adults
ND 40 17 93 Gordon et al
1998
Green 2 Japan HahaJima/OgaSawara
Isl Relatively high Cd concentrations
Collected in coastal
waters Mature
Male and
female 58 57 60
Sakai et al
2000a
Hawksbill 3 Australia Moreton Bay, QLD
Urbanised port estuary; Cd among
the highest recorded for marine
vertebrates
Stranded specimens;
mainly unhealthy Unknown ND ND 18 30
Gordon et al
1998
Hawksbill 22 Japan Yaeyama Islands,
Okinawa Prefecture
Renal Cd levels considered extremely
high Fishing nets
Mostly
juveniles
Males
and
females
34 16 95 ‡ Anan et al 2001
Leatherback 18 France French Atlantic Coast Cd considered high Stranded, dead Juvenile ND 29 22 37 Caurant et al
1999
Loggerhead 78 Spain Canary Islands,
Mediterranean
Generally considered relatively
contaminated areas Stranded Juveniles
and
Mainly
females 13 0.090 91
Torrent et al
2004

Investigation of contaminant levels in green turtles from Gladstone
158
subadults (n=67)
Loggerhead 11 Italy
Cesenatico & Sicily
Island,
Mediterranean
Cd considered background Stranded ND ND 23 ND ND † Andreani et al
2008
Loggerhead 5 Australia Moreton Bay, QLD
Urbanised port estuary; Cd among
the highest recorded for marine
vertebrates
Stranded specimens;
mainly unhealthy Unknown ND 23 14 33
Gordon et al
1998
Loggerhead 7 France French Atlantic Coast Cd considered high Stranded, dead Juvenile ND 25 15 38 Caurant et al
1999
Loggerhead 7 Japan Cape Ashizuri, Kochi Highest Cd in specimens with
symptoms of kidney congestion
Fishing net
entanglement
Adults
(SCL 76-
92)
Females
(n=6) and
n=1 male
28 23 35
Sakai et al 1995
Sakai et al
2000a
Olive Ridley 1 Australia Moreton Bay, QLD
Urbanised port estuary; Cd among
the highest recorded for marine
vertebrates
Stranded specimens;
mainly unhealthy Unknown ND 15 ND ND
Gordon et al
1998

Investigation of contaminant levels in green turtles from Gladstone
159
8.2.17 Dioxins
Turtle
species n Country Location
Location/source
information
Health & other
information
Age
class Gender Mean Min Max Reference
Blood (ppt lw)
Green 21 Australia Gladstone Industrialised port estuary Unhealthy, incl. moribund
and healthy Juveniles
Males and
females 19 <7.1 39 This study
Green 1 Australia Gladstone Industrialised port estuary Unhealthy Adult Unknown 130 This study
Green 4 Australia Shoalwater Distant to urban and port
development
Live captured specimens,
mostly apparently healthy Adults
Males and
females 14 9.0 21
Hermanussen
2009
Green 14 Australia Eastern
Moreton Bay
Relatively distant to urban and
port development
Live captured specimens,
mostly apparently healthy Adults
Males and
females 15 5.4 24
Hermanussen
2009
Green 6 Australia Eastern
Moreton Bay
Relatively distant to urban and
port development
Live captured specimens,
mostly apparently healthy Juveniles Females 17 6.0 22
Hermanussen
2009
Green 2 Australia Shoalwater Distant to urban and port
development
Live captured specimens,
mostly apparently healthy Juveniles Unknown 27 24 29
Hermanussen
2009
Green 6 Australia Hervey Bay Relatively close to urban and
port development
Live captured specimens,
mostly apparently healthy Adults
Males and
females 33 9.6 71
Hermanussen
2009
Green 10 Australia Western
Moreton Bay
Close to urban and port
development
Live captured specimens,
mostly apparently healthy Juveniles
Males and
females 40 22 79
Hermanussen
2009
Green 9 Australia Hervey Bay Relatively close to urban and
port development
Live captured specimens,
mostly apparently healthy Juveniles
Males and
females 78 37 120
Hermanussen
2009
Green 4 Australia Western
Moreton Bay
Close to urban and port
development
Live captured specimens,
mostly apparently healthy Adults
Males and
females 130 16 290
Hermanussen
2009

Investigation of contaminant levels in green turtles from Gladstone
160
† Converted x0.12 (kidney) x0.22 (liver) according to values of this study
‡ Converted x0.195 (kidney) x0.309 (liver) according to Anan et al 2001
# Converted x0.027 (blood) according to Paez-Osuna et al 2010
* Converted x0.28 (kidney) x0.22 (liver) according to Godley et al 1998
! Converted x0.251 (blood) according to Paez-Osuna et al 2011
˄ Converted from ppm (originally reported on mass basis)
ND No data