INVESTIGATION OF APPROACHES FOR OVERCOMING …
192
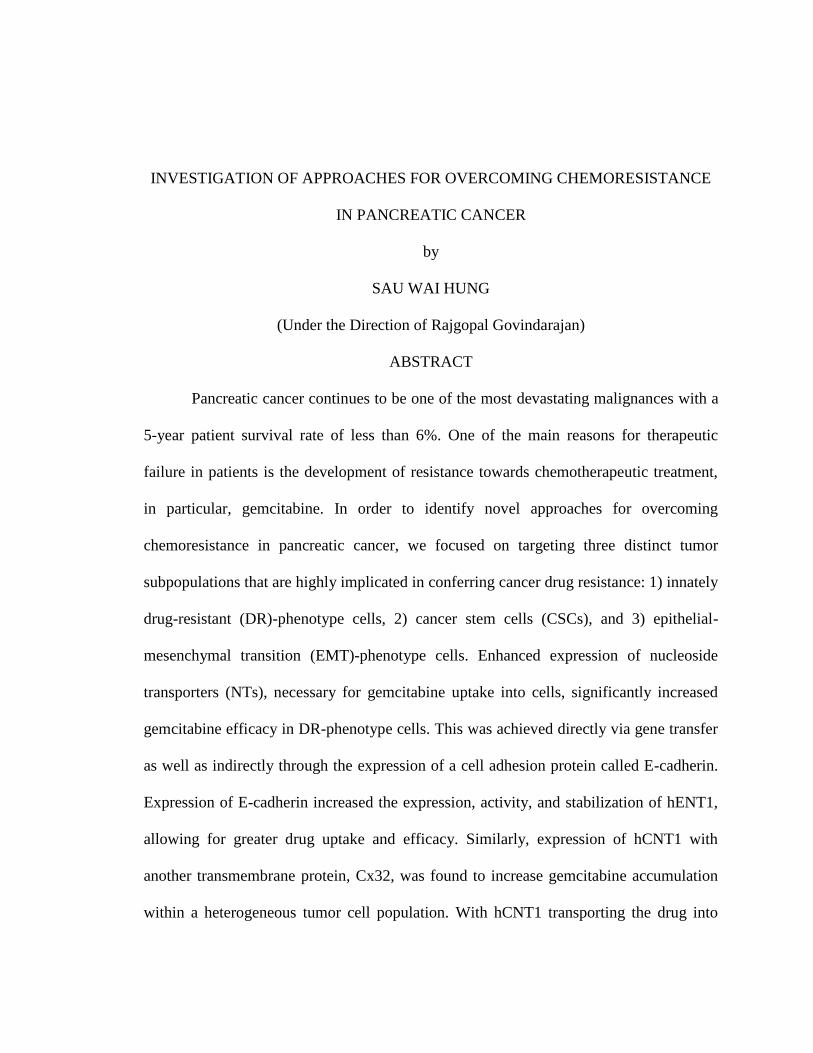
INVESTIGATION OF APPROACHES FOR OVERCOMING CHEMORESISTANCE IN PANCREATIC CANCER by SAU WAI HUNG (Under the Direction of Rajgopal Govindarajan) ABSTRACT Pancreatic cancer continues to be one of the most devastating malignances with a 5-year patient survival rate of less than 6%. One of the main reasons for therapeutic failure in patients is the development of resistance towards chemotherapeutic treatment, in particular, gemcitabine. In order to identify novel approaches for overcoming chemoresistance in pancreatic cancer, we focused on targeting three distinct tumor subpopulations that are highly implicated in conferring cancer drug resistance: 1) innately drug-resistant (DR)-phenotype cells, 2) cancer stem cells (CSCs), and 3) epithelial- mesenchymal transition (EMT)-phenotype cells. Enhanced expression of nucleoside transporters (NTs), necessary for gemcitabine uptake into cells, significantly increased gemcitabine efficacy in DR-phenotype cells. This was achieved directly via gene transfer as well as indirectly through the expression of a cell adhesion protein called E-cadherin. Expression of E-cadherin increased the expression, activity, and stabilization of hENT1, allowing for greater drug uptake and efficacy. Similarly, expression of hCNT1 with another transmembrane protein, Cx32, was found to increase gemcitabine accumulation within a heterogeneous tumor cell population. With hCNT1 transporting the drug into
Transcript of INVESTIGATION OF APPROACHES FOR OVERCOMING …
INVESTIGATION OF APPROACHES FOR OVERCOMING CHEMORESISTANCE
IN PANCREATIC CANCER
by
SAU WAI HUNG
(Under the Direction of Rajgopal Govindarajan)
ABSTRACT
Pancreatic cancer continues to be one of the most devastating malignances with a
5-year patient survival rate of less than 6%. One of the main reasons for therapeutic
failure in patients is the development of resistance towards chemotherapeutic treatment,
in particular, gemcitabine. In order to identify novel approaches for overcoming
chemoresistance in pancreatic cancer, we focused on targeting three distinct tumor
subpopulations that are highly implicated in conferring cancer drug resistance: 1) innately
drug-resistant (DR)-phenotype cells, 2) cancer stem cells (CSCs), and 3) epithelial-
mesenchymal transition (EMT)-phenotype cells. Enhanced expression of nucleoside
transporters (NTs), necessary for gemcitabine uptake into cells, significantly increased
gemcitabine efficacy in DR-phenotype cells. This was achieved directly via gene transfer
as well as indirectly through the expression of a cell adhesion protein called E-cadherin.
Expression of E-cadherin increased the expression, activity, and stabilization of hENT1,
allowing for greater drug uptake and efficacy. Similarly, expression of hCNT1 with
another transmembrane protein, Cx32, was found to increase gemcitabine accumulation
within a heterogeneous tumor cell population. With hCNT1 transporting the drug into

cells and Cx32 transferring the drug between cells, the so-called bystander cytotoxic
effect could be enhanced. Using a novel epigenetic (i.e., histone methylation) reversal
agent, DZNep, we reduced stemness in pancreatic cancer, sensitizing the resistant cancer
cell population to gemcitabine without compromising for toxicity in normal pancreatic
cells. After drug optimizations, we synthesized novel nanoparticle formulations to deliver
the epigenetic-chemotherapeutic combination while mimicking the best dose and
schedule. Lastly, we investigated the role of a novel oncoprotein, SET, in conferring
EMT and chemoresistance. SET isoform 2 expression promoted EMT through cadherin
switching (i.e., from E-cadherin to N-cadherin) via the Rac1/JNK/c-Jun/AP-1 and
SPARC/Slug pathways. Overexpression of SET and cadherin switching were also
observed in human pancreatic ductal adenocarcinoma tissues. In an orthotopic mouse
model of human pancreatic cancer, SET isoform 2 expression facilitated metastasis
whereas SET knockdown reduced metastatic tumor burden. These investigational
approaches have vital therapeutic implications and may lead to the successful
development of new therapeutic strategies for enhancing treatment efficacy in patients.
INDEX WORDS: Pancreatic cancer, Chemoresistance, Metastasis, Nucleoside
transporter, Nucleoside analog, Gemcitabine, Cadherin, Gap
junction, Connexin, Deazaneplanocin (DZNep), SET, Epithelial-
mesenchymal transition (EMT), Nanoparticles

INVESTIGATION OF APPROACHES FOR OVERCOMING CHEMORESISTANCE
IN PANCREATIC CANCER
by
SAU WAI HUNG
BS, University of New Hampshire, 2009
A Dissertation Submitted to the Graduate Faculty of The University of Georgia in Partial
Fulfillment of the Requirements for the Degree
DOCTOR OF PHILOSOPHY
ATHENS, GEORGIA
2014

© 2014
Sau Wai Hung
All Rights Reserved

INVESTIGATION OF APPROACHES FOR OVERCOMING CHEMORESISTANCE
IN PANCREATIC CANCER
by
SAU WAI HUNG
Major Professor: Rajgopal Govindarajan
Committee: Huabei Guo
Shelley Hooks
Mandi Murph
Jason Zastre
Electronic Version Approved:
Julie Coffield
Interim Dean of the Graduate School
The University of Georgia
August 2014

iv
DEDICATION
To my family and loved ones.

v
ACKNOWLEDGEMENTS
I present my utmost gratitude and appreciation to my mentor, Dr. Rajgopal
Govindarajan, for taking me on as his first graduate student, exposing me to the field of
cancer biology, and providing financial support. I am sincerely grateful for the
opportunity to work in his lab, learn under his expert guidance, and truly grow as an
independent scientist. I would like to thank the other members of my graduate committee,
Dr. Shelley Hooks, Dr. Mandi Murph, Dr. Jason Zastre, and Dr. Huabei Guo, for their
perpetual support and valuable suggestions throughout my graduate career. I would also
like to thank our collaborators, Dr. Shanta Dhar, her graduate student, Sean Marrache,
Dr. Chung K. Chu, Dr. Michael Thomson, and Dr. Tamas Nagy for their expertise and
contributions towards shared projects. I would like to acknowledge Dr. Isaiah Fidler, Dr.
Keith Johnson, Dr. Parmender Mehta, Dr. Ming Tsao, and Dr. Chung-Ming Tse for
providing me with research materials and assistance. I thank the past and present
members of the Govindarajan Laboratory - Hardik Mody, Shannon Cummins, Dylan
Lovin, Bhavi Patel, Dimal Patel, and Franky Davis for their scientific assistance, and
especially Dr. Yangzom Bhutia for teaching me all the scientific methods from when I
first walked in as a blank slate. I am exceedingly grateful for my undergraduate mentees,
Kimberly Proctor, Maddy Krentz, Haesung Lee, Caitlin Gilbert, Toan Hoang, and Kineta
Naidu, for going above and beyond in their efforts to propel my research projects. Their
independence and abilities astounded me, and I am very appreciative for their devotion to
my studies. Special thanks go to my family for their unconditional encouragement and
vi
continual support. I am so grateful to the love of my life for being there for me every day,
listening to all my tribulations and celebrating all my victories. Lastly, I’d like to
acknowledge my financial support from the University of Georgia Department of
Pharmaceutical and Biomedical Sciences, the University of Georgia College of
Pharmacy, the University of Georgia Graduate School, the ARCS Foundation Atlanta
Chapter, the American Foundation for Pharmaceutical Education (AFPE), the American
Association of Pharmaceutical Scientists (AAPS), and the American Society for
Biochemistry and Molecular Biology (ASBMB).

vii
TABLE OF CONTENTS
Page
ACKNOWLEDGEMENTS .................................................................................................v
LIST OF TABLES ...............................................................................................................x
LIST OF FIGURES ........................................................................................................... xi
LIST OF ABBREVIATIONS .......................................................................................... xiv
CHAPTERS
1 INTRODUCTION AND LITERATURE REVIEW .........................................1
Literature Review.........................................................................................4
Purpose and Rationale of Study .................................................................30
Objective and Hypothesis of Study............................................................31
Expected Results and Significance of Study .............................................31
Section and Chapter Summaries ................................................................32
Scope of Work and Limitations .................................................................35
DRUG RESISTANT-PHENOTYPE CELLS AND CHEMOSENSITIVITY
2 E-CADHERIN INCREASES CHEMOSENSITIVITY THROUGH HUMAN
EQUILIBRATIVE NUCLEOSIDE TRANSPORTER 1 (HENT1) ACTIVITY
AND STABILIZATION ..................................................................................42
Abstract ......................................................................................................43
Introduction ................................................................................................44
Materials and Methods ...............................................................................46

viii
Results ........................................................................................................50
Discussion ..................................................................................................56
3 CO-EXPRESSION OF HCNT1 WITH CX32 INCREASES NUCLEOSIDE
ANALOG TRANSPORT ................................................................................59
Abstract ......................................................................................................60
Introduction ................................................................................................61
Materials and Methods ...............................................................................64
Results ........................................................................................................66
Discussion ..................................................................................................71
CANCER STEM CELLS AND CHEMOSENSITIVITY
4 PHARMACOLOGICAL REVERSAL OF HISTONE METHYLATION
PRESENSITIZES PANCREATIC CANCER CELLS TO NUCLEOSIDE
DRUGS: IN VITRO OPTIMIZATION AND NOVEL NANOPARTICLE
DELIVERY STUDIES ....................................................................................76
Abstract ......................................................................................................77
Introduction ................................................................................................78
Materials and Methods ...............................................................................80
Results ........................................................................................................88
Discussion ................................................................................................101
EMT-PHENOTYPE CELLS AND CHEMOSENSITIVITY
5 EXPRESSION OF THE SET ONCOPROTEIN CONTRIBUTES TO THE
EPITHELIAL-MESENCHYMAL TRANSITION (EMT) OF PANCREATIC
CANCER .......................................................................................................111

ix
Abstract ....................................................................................................112
Introduction ..............................................................................................113
Materials and Methods .............................................................................115
Results ......................................................................................................120
Discussion ................................................................................................133
6 DISCUSSION ................................................................................................137
Major Conclusions and Future Directions ...............................................137
Therapeutic Challenges in Overcoming Chemoresistance ......................139
REFERENCES ................................................................................................................144

x
LIST OF TABLES
Page
Table 4.1: Restriction sites and sequences of primers used for cloning ............................82
Table 4.2: Physiochemical characterization of NPs ........................................................100

xi
LIST OF FIGURES
Page
Figure 1.1: The links between drug resistant (DR)-phenotype cells, cancer stem cells
(CSCs), and epithelial-mesenchymal transition (EMT)-phenotype cells ................3
Figure 1.2: Novel therapeutic approaches for overcoming limitations in the gemcitabine
pathway ..................................................................................................................17
Figure 2.1: E-cadherin expression increases gemcitabine sensitivity in pancreatic cancer
cells ........................................................................................................................50
Figure 2.2: MIA PaCa-2/E-cad showed an increase in hENT1 expression, transport, and –
dependent gemcitabine cytotoxicity ......................................................................52
Figure 2.3: Expression of E-cadherin increased hENT1 expression, function, and
stabilization in a clean cadherin model cell line ....................................................54
Figure 3.1: Stable expression of NTs and Cxs in MDCK cells increased total 3H-
thymidine cellular transport and gemcitabine cytotoxicity ....................................67
Figure 3.2: Stable expression of a combination of NTs and Cxs in MDCK cells altered
total 3H-thymidine cellular transport .....................................................................68
Figure 3.3: Statuses of each hENT1, hCNT1, Cx32, and Cx43 were identified in a panel
of pancreatic cell lines ...........................................................................................69
Figure 3.4: Proposed model of intracellular and intercellular nucleoside transport and
movement within a cell population ........................................................................70

xii
Figure 4.1: DZNep and gemcitabine sensitivity, singly or in combination, and interactions
within a panel of pancreatic cell lines ....................................................................90
Figure 4.2: DZNep partially competes with the uptake of purine nucleosides by hENT1
and hCNT3 .............................................................................................................92
Figure 4.3: Acyl modifications of DZNep further enhance cytotoxicity ...........................94
Figure 4.4: DZNep alters histone lysine methylation and methyltransferase and
demethylase expressions in pancreatic cancer .......................................................96
Figure 4.5: Short priming of DZNep demonstrated superior cytotoxicity and synergy with
gemcitabine than co-exposure of the two drugs ....................................................98
Figure 4.6: Spatiotemporal release of DZNep and gemcitabine using engineered
nanoparticles reduced drug dose while potentiated chemosensitivity .................102
Figure 5.1: SET isoform 2 is highly overexpressed in pancreatic cancer cells ...............122
Figure 5.2: SET isoform 2 is localized in the nucleus and at the cell surface in poorly-
differentiated pancreatic cancer cells ...................................................................124
Figure 5.3: SET isoform 2 induces EMT and promotes growth, migration, and invasion of
pancreatic cancer cells .........................................................................................126
Figure 5.4: SET isoform 2 promotes cadherin switching from E-cadherin to N-cadherin to
undergo EMT .......................................................................................................127
Figure 5.5: SET-induced cadherin switching involves the Rac1/JNK/c-Jun/AP-1 and
SPARC/Slug signaling pathways .........................................................................129
Figure 5.6: SET isoform 2 overexpression at the cell surface and cadherin switching were
identified in patient-derived, poorly-differentiated pancreatic cancer tissues .....131

xiii
Figure 5.7: SET isoform 2 expression increases tumor volume ......................................133
xiv
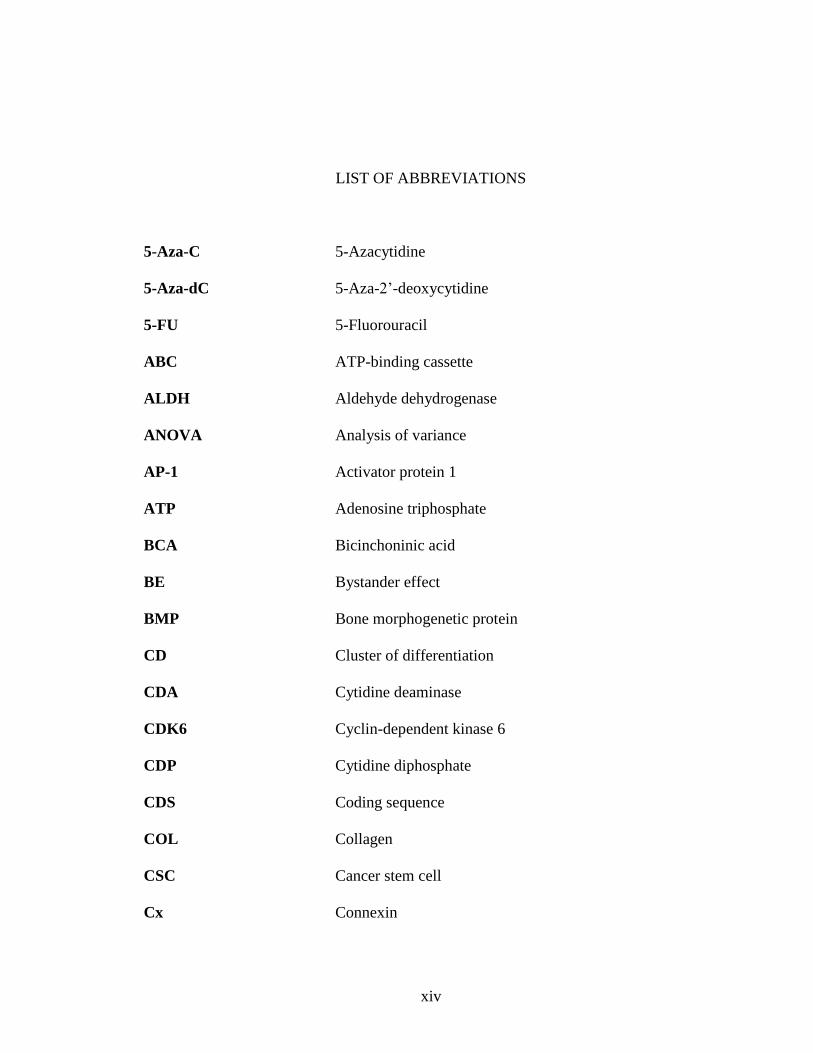
LIST OF ABBREVIATIONS
5-Aza-C 5-Azacytidine
5-Aza-dC 5-Aza-2’-deoxycytidine
5-FU 5-Fluorouracil
ABC ATP-binding cassette
ALDH Aldehyde dehydrogenase
ANOVA Analysis of variance
AP-1 Activator protein 1
ATP Adenosine triphosphate
BCA Bicinchoninic acid
BE Bystander effect
BMP Bone morphogenetic protein
CD Cluster of differentiation
CDA Cytidine deaminase
CDK6 Cyclin-dependent kinase 6
CDP Cytidine diphosphate
CDS Coding sequence
COL Collagen
CSC Cancer stem cell
Cx Connexin

xv
CXCR4 CXC chemokine receptor type 4
DAPI 4’6-Diamidino-2-phenylindole
dCDP Deoxycytidine diphosphate
dCK Deoxycytidine kinase
dCTP Deoxycytidine triphosphate
dFdC Gemcitabine / 2’,2’-Difluorodeoxycytidine
dFdCDP Gemcitabine diphosphate
dFdCMP Gemcitabine monophosphate
dFdCTP Gemcitabine triphosphate
dFdU 2’,2’-Difluorodeoxyuridine
DLS Dynamic light scattering
DM Dimethylation
DMEM Dulbecco’s modified Eagle medium
DMSO Dimethyl sulfoxide
DNA Deoxyribonucleic acid
dNTP Deoxynucleotide triphosphate
DR Drug resistant
DSPE 1,2-Distearoyl-sn-glycero-3-phosphoethanolamine
DTT Dithiothreitol
DZNep 3-Deazaneplanocin A
E-cad / E-cadherin Epithelial cadherin
EED Embryonic ectoderm development
EGFR Epidermal growth factor receptor
xvi
EGTA Ethylene glycol tetraacetic acid
EMT Epithelial-mesenchymal transition
EPR Enhanced permeability and retention
ERK Extracellular signal-regulated kinase
ESA Epithelial-specific antigen
EZH2 Histone-lysine N-methyltransferase
FBS Fetal bovine serum
FDA Food and Drug Administration
FDR Fixed dose rate
FEM Field emission microscopy
GCV Ganciclovir
GJ Gap junction
GPC Gel permeation chromatography
H3K27 Histone H3 lysine 27
H3K4 Histone H3 lysine 4
H3K9 Histone H3 lysine 9
H4K20 Histone H4 lysine 20
HA Hemagglutinin
HAT Histone acetyltransferase
HBSS Hank’s balanced salt solution
hCNT Human concentrative nucleoside transporter
HDAC Histone deacetylase
hENT Human equilibrative nucleoside transporter

xvii
HER2 Human epidermal growth factor receptor 2
HPDE Human pancreatic ductal epithelial
HPLC High performance liquid chromatography
HSV Herpes simplex virus
HSV-TK Herpes simplex virus thymidine kinase
HuR Human antigen R
I2PP2A Inhibitor of protein phosphatase 2A
IACUC Institutional Animal Care and Use Committee
IMAGE Integrated molecular analysis of genomes and their
expression
INHAT Inhibitor of histone acetyltransferase
JMJD Jumonji domain
JNK c-Jun N-terminal kinase
KPC KrasLSL-G12D/+
;Trp53LSL-R172H/+
;Cre
KRAS Kirsten rat sarcoma viral oncogene homolog
MAPK Mitogen-activated protein kinase
MDCK Madin-Darby canine kidney
MEK Mitogen-activated protein kinase kinase
MEM Minimum essential medium
miRNA Micro-ribonucleic acid
MM Monomethylation
MMP Matrix metalloproteinase
mRNA Messenger ribonucleic acid

xviii
MRP Multidrug resistance-associated protein
MTD Maximum tolerated dose
mtDNA Mitochondrial deoxyribonucleic acid
MTT 3-(4,5-Dimethylthiazol-2-yl)-2,5-diphenyltetrazolium
bromide
MW Molecular weight
Na2VO4 Sodium orthovanadate
NBMPR Nitrobenzylthioinosine
N-cad / N-cadherin Neural cadherin
NDRI National disease research interchange
NEM N-Ethylmaleimide
NFκB Nuclear factor kappa B
NMR Nuclear magnetic resonance
NP Nanoparticle
NT Nucleoside transporter
PBS Phosphate buffered saline
PcG Polycomb group
PCR Polymerase chain reaction
PDAC Pancreatic ductal adenocarcinoma
PDI Polydispersity index
PEG Polyethylene glycol
PEI Polyethylenimine
PET Polyethylene terephthalate
xix
PI3K Phosphoinositide 3-kinase
PLGA Poly(lactic-co-glycolic acid)
PMSF Phenylmethylsulfonyl fluoride
PP2A Protein phosphatase 2A
PPAR-γ Peroxisome proliferator-activated receptor gamma
PRC2 Polycomb repressive complex 2
PTEN Phosphatase and tensin homolog
PVA Polyvinyl alcohol
Rac1 Ras-related C3 botulinum toxin substrate 1
Ras Rat sarcoma
RNA Ribonucleic acid
RPM Revolutions per minute
RR Ribonucleotide reductase
SDS Sodium dodecyl sulfate
SDS-PAGE Sodium dodecyl sulfate polyacrylamide gel electrophoresis
SHH Sonic hedgehog
shRNA Short hairpin ribonucleic acid
siRNA Small interfering ribonucleic acid
SLC Solute carrier
SPARC Secreted protein acidic and rich in cysteine
STAT3 Signal transducer and activator of transcription 3
SUZ12 Suppressor of zeste 12 homolog
TAF-I Template activating factor I

xx
TBAF Tetra-n-butylammonium fluoride
TBS Tris buffered saline
TEM Transmission electron microscopy
TGF Transforming growth factor
THU Tetrahydrouridine
TM Trimethylation
TPP Triphenylphosphonium
TS Thymidylate synthase
TSA Trichostatin A
UMK Uridine monophosphate kinase
ZEB Zinc finger E-box binding

1
CHAPTER 1
INTRODUCTION AND LITERATURE REVIEW
Cancer is the second most common cause of death in the United States [1], and
the current risk of an American developing this condition is 44% and 38% in men and
women, respectively [2]. Hence, approximately 1.7 million Americans are expected to be
diagnosed this year with about 585,720 expected to die – almost 1,600 people per day [1].
In particular, pancreatic cancer continues to be one of the most devastating
malignances with a 5-year patient survival rate of less than 6% [1]. Two main reasons for
therapeutic failure in these patients are: (1) late diagnosis of the disease, when the cancer
has already spread to distant sites, i.e., metastasized, and (2) the lack of effective
treatment, including difficulties with drug delivery and the development of resistance
towards chemotherapeutics. While chemotherapeutic drugs show initial efficacy by tumor
shrinkage, their consistent use and exposure frequently causes the cancerous cells to
adapt by changing their characteristics and becoming increasingly resistant to the drugs’
cytotoxic effects, otherwise known as chemotherapeutic refractoriness. This leads to the
evolution of fully-resistant cancer cell colonies resulting in total chemotherapeutic
failure, new cancer remissions, and deadly consequences.
Although new strategies against pancreatic cancer have recently emerged, there
remains a heavy dependence on the use of gemcitabine (2’,2’-difluorodeoxycytidine,
dFdC) in patients. Gemcitabine is often used as part of the first-line therapy, and it
2
remains the standard of care for adjuvant therapy [3, 4]. Nonetheless, the innate and
acquired chemoresistance of patients to the drug has emerged as a major concern as
observed by a very low patient response rate [5]. Innumerable clinical trials have ensued
over the past decade investigating the efficacy of gemcitabine in chemotherapeutic
combinations [6]. Unfortunately, this strategy has proven largely unsuccessful, leading to
further evaluation of the molecular aspects of the disease biology as well as approaches
for overcoming chemoresistance. Ultimately, a better understanding of cellular
chemoresistance could lead to the successful development of new therapeutic strategies
for enhancing treatment efficacy in patients.
The chemoresistance of gemcitabine in pancreatic cancer can be attributed to
several anatomical (e.g., dense desmoplastic stroma), pathophysiological (e.g.,
amplification of growth, cell survival, and anti-apoptotic pathways), and pharmacological
(e.g., requirement of phosphorylation for drug activation) barriers. In order to identify
novel approaches for overcoming chemoresistance in pancreatic cancer, this dissertation
focuses on targeting three distinct tumor subpopulations that are highly implicated in
conferring cancer drug resistance: 1) innately drug-resistant (DR)-phenotype cells, 2)
cancer stem cells (CSCs), and 3) epithelial-mesenchymal transition (EMT)-phenotype
cells (Fig. 1.1) [7, 8]. DR-phenotype cells are inherently chemoresistant due to cellular
alterations limiting the transport, activation, and overall efficacy of chemotherapeutic
agents. Among the various intrinsic and extrinsic factors implicated in determining drug
efficacy, the reduction or complete loss of nucleoside drug transporters is thought to be
critical for gemcitabine resistance. Aberrant expression of nucleoside transporters has
been noted in pancreatic ductal adenocarcinomas as well as advanced-stage, metastatic

3
tumors, and it is now clear that the extent of cancer cell transportability often decides the
preliminary response to nucleoside analog chemotherapy [9-14]. Pluripotent CSCs have
the ability to renew into any cancer cell subtype and essentially repopulate the entire
tumor upon initial eradication of the bulk of the cancerous cells by neoadjuvant
chemotherapy [15-17]. This allows for subsequent clonal selection and development of
chemoresistant cell populations. Indicative of advanced, metastatic cancer, EMT-
phenotype cells have acquired morphological and structural changes that allow them to
invade through the basement membrane and spread to distant parts of the body. Large
scale tumor genomic studies have identified that these metastasized cells carry several
genetic and epigenetic changes that occur during carcinogenesis as well as subclonal
evolution [18-20].
Figure 1.1. The links between drug resistant (DR)-phenotype cells, cancer stem
cells (CSCs), and epithelial-mesenchymal transition (EMT)-phenotype cells. These
three cancer subpopulations are known to confer chemoresistance in tumors. They
share many similar features and demonstrate plasticity for interconversions [21]. Figure
modified from Wang, et al. [7].
4
Literature Review 1
For the purposes of this dissertation, the following Literature Review comprises
of excerpts from the review paper, “Overcoming Nucleoside Analog Chemoresistance of
Pancreatic Cancer: A Therapeutic Challenge” published in Cancer Letters as well as
additional background information not found in the review. Supplemental information
was necessary to comprehensively introduce all the material presented in this dissertation.
Chemoresistant Pancreatic Cancer Cell Populations:
Since chemotherapy is often the first-line treatment strategy for pancreatic cancer
patients, drug resistance is a major obstacle that needs further understanding. Drug
resistance can be classified into two categories: intrinsic (or innate) and acquired. In
patients with intrinsic drug resistance, chemotherapy is ineffective from the start of
treatment because the cancer cells already exhibit a drug-resistant phenotype, preventing
drugs from being transported, activated, or in general, effective. Acquired resistance
develops only after prolonged exposure of anticancer drugs to the tumor cells. This
continued treatment puts selective pressure on the tumor cells to survive and adapt,
leading to recurrence and metastasis. The use of targeted therapies attempts to overcome
these resistance mechanisms by specifically targeting an oncoprotein or aberrant
signaling pathway contributing to drug resistance [8]. Throughout the past decade,
studies have increasingly shown the critical roles of two pancreatic cancer cell
populations, CSCs and EMT-phenotype cells, in conferring drug resistance.
1 SW Hung, H Mody, and R Govindarajan. 2012. Overcoming Nucleoside Analog Chemoresistance of
Pancreatic Cancer: A Therapeutic Challenge. Cancer Letters. 320: 138-149.
Reprinted here with permission of the publisher.

5
Cancer Stem Cells (CSCs) and Chemoresistance
Most current chemotherapies target and kill differentiated cancer cells, while
neglecting a small but influential population of cells known as CSCs. CSCs have the
ability to self-renew and produce differentiated cells to repopulate a tumor with invasive
and metastatic properties. In other words, they are able to continually sustain
tumorigenesis [16]. These stem cells have been identified and isolated from solid
pancreatic tumors, with high expression of defining cell surface markers CD44, CD24,
epithelial-specific antigen (ESA), CD133, and CXCR4 [7, 22, 23]. Elevated levels of
aldehyde dehydrogenase (ALDH), another key indicator of CSCs, were also found [7,
22]. Human pancreatic CSCs have been shown to be exclusively tumorigenic and highly
resistant to standard chemotherapy [24]. With greater tumorigenicity as well as metastatic
potential, few current therapies can eliminate these cells [7]. These stem cells have also
been shown to be highly gemcitabine-resistant and share many features with
gemcitabine-resistant cancer cells such as high sphere-forming activity [7]. However, the
mechanisms behind this connection remain unclear.
Epithelial-mesenchymal Transition (EMT)-phenotype Cells and Chemoresistance
During EMT, cells lose their epithelial cell-cell junctions and polarity and instead
acquire the expressions of mesenchymal markers such as vimentin, fibronectin, and N-
cadherin. They also have increased matrix metalloproteinase (MMP) activity which
confers an invasive phenotype [7]. Several other gene families are also implicated in the
EMT process: BMP, COL, NOTCH, NODAL, SNAI, TGF, WNT, and ZEB, among
others. Numerous studies have identified the close relationship between EMT and drug
resistance in pancreatic cancer cells. Many of the pancreatic cancer cell lines that have

6
high expression of the epithelial marker, E-cadherin, and low expression of the
mesenchymal marker, ZEB1, are sensitive to common chemotherapeutic agents [7]. In
contrast, cell lines with opposite expression levels are chemoresistant [7]. Similarly, cell
lines with acquired resistance to gemcitabine by continuous exposure exhibited increased
expression of mesenchymal Snail and Twist [23]. Furthermore, downregulation of the
Notch signaling pathway was found to revert the EMT phenotype by decreasing the
expressions of mesenchymal markers vimentin, ZEB1, Snail (SNAI1), Slug (SNAI2), and
NFκB, indicating a mechanistic tie between EMT and chemoresistance in pancreatic
cancer cells [7]. Therefore, it is likely that EMT can lead to multidrug resistance as well
as the rapid progression of the tumor [23].
Links between CSCs and EMT
EMT-phenotype cells share many key molecular characteristics with CSCs, and
CSCs exhibit a mesenchymal phenotype, suggesting the two drug-resistant populations
are closely related [7]. For example, pancreatic CSCs have high tumorigenic potential
and exhibit morphological features similar to that of EMT [7]. Treatment with
transforming growth factor (TGF)-β can even induce pancreatic CSCs to undergo EMT
[7]. On the other hand, it has been shown that gemcitabine-resistant EMT-phenotype cells
as well as metastatic cancer cells also exhibit CSC features and markers [7, 8]. For
example, Mani et al. demonstrated that human mammary epithelial cells undergoing
EMT acquired both a fibroblastic mesenchymal phenotype as well as CSC characteristics
including CD44high
/CD24low
, self-renewal, and the ability to form mammospheres [25].
The discovery of metastatic CSCs truly illustrates the close relationship between
CSCs and EMT. In 2007, Hermann et al. identified a distinct population of
7
CD133+/CXCR4
+ cells that localized at the invasive edge of pancreatic carcinomas and
exhibited strong migratory activity in vitro as well as metastatic activity in vivo [24]. It
has also been proposed that under hypoxic conditions, cancer cells can both undergo
EMT as well as acquire CSC properties, suggesting a crossover between the roles of
EMT and CSCs in determining the properties of chemoresistance, invasiveness,
metastasis, and recurrence [23].
Strategies for Overcoming Chemoresistance in These Populations
Selective, targeted elimination of these two cell populations could improve patient
response to currently used drugs [7]. Novel inhibitors of EMT or even compounds that
could revert the EMT phenotype could increase the drug sensitivity of pancreatic cancer
cells [7]. This could be accomplished by targeting epigenetic regulators, specific non-
coding RNAs, or signaling pathways that control this process. For example, several EMT
transcription factors are controlled at the epigenetic level. E-cadherin (CDH1) is
epigenetically regulated by Snail, Slug, zinc finger proteins (ZEB1 and ZEB2), and Twist
[18, 23]. SOX4 expression transcriptionally activates EZH2 which then trimethylates
specific genes to promote EMT [18]. A recent burst of studies have shown microRNAs
(miRNAs) to be highly involved in the EMT process as well as in conferring gemcitabine
resistance in pancreatic cancer. Among the most notable include the miR-200 family,
miR-21, miR-221, and miR-126 [7, 26]. Furthermore, key signaling pathways known to
be highly involved in EMT in pancreatic cancer (e.g., TGF-β, Ras/Raf/MEK/ERK, the
Wnt cascade, PI3K/Akt, Notch, and sonic hedgehog (SHH)) can also be targeted to alter
the EMT process and induce chemosensitivity [23, 26].

8
The tumor microenvironment is also partly responsible for inducing and/or
maintaining EMT. Conditions in the tumor microenvironment, such as hypoxia, may
exert both EMT- and CSC-promoting effects [23, 26]. Other components, including the
extracellular matrix, cancer-associated fibroblasts, immune cells, and soluble factors,
may also be targeted to indirectly impair the EMT-phenotype and CSC populations and
overcome chemoresistance [23].
Direct elimination of EMT-phenotype cells and CSCs from the tumor population
is another viable approach for overcoming drug resistance, metastasis, and tumor
recurrence. However, it may be difficult to effectively target CSCs without annihilating
normal somatic stem cells as well. Likewise, molecular differences between EMT in
embryological development and cancer progression will need to be better defined for
specific targeting. These strategies will most likely require the use of combination
therapy, with separate agents targeting the bulk tumor population, EMT-phenotype
population, and the CSC population. This strategy will need to utilize the molecular
differences between these populations of cells. Targeting specific transporters, cell
surface markers, aberrant signaling pathways, or epigenetic processes may be useful [8].
Determinants of Chemoresistance in the Gemcitabine Pathway:
Transporters and Metabolic Enzymes
Due to its hydrophilicity (log P of -1.33) [27], gemcitabine relies on numerous
transporters to pass through the cellular lipid bilayer and exert its cytotoxicity. Earlier
studies by Mackey et al. identified key transporters involved in the uptake of gemcitabine
and demonstrated the need for their activity in order to confer gemcitabine sensitivity [28,
29]. While they found that the human equilibrative transporters 1 and 2 (hENT1 and
9
hENT2) were able to mediate gemcitabine transport (Km of 160 and 740, respectively),
the human concentrative nucleoside transporter 1 (hCNT1) had the greatest intrinsic
transport activity (Vmax:Km of 0.24) [29]. Since then, both hENT1 and hCNT1 have been
highly implicated in gemcitabine chemoresistance as well as patient outcome. Although
the clinical correlation between hENT1 expression, both transcriptionally and
immunohistochemically, and disease-free as well as overall survival of pancreatic cancer
patients has been well-established [10-14], the correlation between hENT1 expression
and innate and acquired chemoresistance in cultured pancreatic cancer cells remains
somewhat incongruous and context-dependent [28, 30-33]. This may be due to the
bidirectional nature of the transporter resulting in drug efflux at higher concentrations,
the relative role of the transporter among the presence of other nucleoside transporters,
and the expression characteristics of the transporter in normal versus tumor cells [31]
including variations in cell cycle characteristics [9]. In pancreatic cells, mislocalization of
hENT2, rather than changes in expression levels, proposes an alternative mechanism for
gemcitabine chemoresistance [34]. Our lab has demonstrated that the loss of hCNT1 cell
surface expression and activity frequently observed in pancreatic cancer cells was found
to correlate directly with high gemcitabine chemoresistance [9, 31]. Structure-activity
characterization of hCNT3 revealed electrostatic interaction by the 3’-hydroxyl position
to play a major role in the transport of substrates, including gemcitabine [35]. While the
exact role of hCNT3 in gemcitabine chemoresistance has yet to be evaluated, patients
with elevated immunocytochemical expression of the transporter were observed to
experience a lower risk of disease recurrence and longer overall survival [12].

10
In addition to influx transporters, a few efflux transporters have also been
implicated in gemcitabine resistance of pancreatic cancer including the ATP-binding
cassette (ABC) family of multidrug resistance-associated proteins (MRPs). Increased
expression of MRP2 mRNA and protein in pancreatic cancer tissues has been associated
with both intrinsic and acquired resistance to a regimen of gemcitabine plus cisplatin
[36]. Likewise, MRP7, expressed in both normal pancreas [37] and most established
pancreatic carcinoma cell lines [38], has been demonstrated to be able to transport
gemcitabine, although direct correlations with cytotoxicity have not yet been
demonstrated [39]. This may be in part due to the ability of MRPs to efflux the active
metabolite of gemcitabine, allowing for reduction of drug concentrations inside the cell
[40]. Although the overall significance of transporters in determining gemcitabine
chemosensitivity has been well demonstrated, the precise mechanisms and alterations that
occur in pancreatic tumors resulting in chemoresistance remain unclear.
Once inside the cell, gemcitabine is monophosphorylated by deoxycytidine kinase
(dCK) before further phosphorylation into its active diphosphate (dFdC-DP) and
triphosphate (dFdC-TP) forms. Activated gemcitabine, in the form of dFdC-TP, induces
masked chain termination during which the nucleotide is incorporated into DNA,
followed by another deoxynucleotide, prohibiting further DNA polymerase action [41].
Since involved in the rate-limiting step for gemcitabine cellular activation, a deficiency in
dCK expression and activity has been shown to be associated with gemcitabine resistance
in pancreatic cancer. Loss of dCK mRNA in highly-resistant pancreatic cancer cells has
been observed [30, 42, 43], and a clear correlation between dCK activity and gemcitabine
sensitivity in murine and human pancreatic tumor xenografts has been demonstrated [44].

11
Overexpression of dCK was found to significantly enhance gemcitabine sensitivity in two
of three pancreatic cancer cell lines [45]. Furthermore, simultaneous expression of dCK
and p8 in a gemcitabine-resistant pancreatic cancer cell line, PANC-1, significantly
decreased the cytotoxic IC50 of gemcitabine and enhanced apoptosis and caspase-3
activity; tumor growth inhibition was also noticeably improved in nude mice [46].
Clinically, low immunohistochemical expression of dCK was correlated with both
decreased overall survival as well as older age of patients, suggesting a role of age-
related methylation in patients [47]. Low expression of the RNA-binding protein HuR
has also been shown to correlate with a 7-fold increase in the risk of mortality for
pancreatic cancer patients due to its ability to regulate dCK protein levels and confer
gemcitabine chemoresistance [48, 49].
Gemcitabine is rendered inactive by cytidine deaminase (CDA), which removes
the NH2 group from the pyrimidine [50], allowing the uracil metabolite to be exported
from the cell. Interestingly, gemcitabine-induced inhibition of cytidine deaminase activity
leads to a decrease in dFdC-TP catabolism, hence propelling the self-potentiation of
gemcitabine activity [51]. Although the focus of most studies involving CDA and
gemcitabine in pancreatic cancer has been on generalized adverse effects (i.e., high-grade
neutropenia) due to genetic polymorphisms rather than cancer cell cytotoxicity [52-56], a
few studies have identified a dramatic increase in chemosensitivity, up to 54-fold, of cell
lines with the inhibition of CDA [45, 57]. Although further studies are necessary,
alterations in CDA expression levels in tumors could be a promising mechanism for
improving gemcitabine sensitivity.

12
Other Molecular Targets
Additional candidates of interest for the manipulation of gemcitabine cytotoxicity
include effectors of DNA synthesis and repair. In particular, ribonucleotide reductase
subunits 1 and 2 (RRM1 and RRM2) are inhibited by dFdC-DP and dFdC-TP and are
hindered from repairing flawed DNA. In addition to impeding DNA repair, inhibition of
RR, the rate-limiting enzyme in deoxyribonucleoside triphosphate (dNTP) synthesis,
reduces the endogenous dNTP pool, lessening competition and indirectly facilitating
dFdC-TP incorporation into DNA [58]. This secondary mechanism also contributes to the
unique self-potentiating ability of gemcitabine. The transcriptional upregulation of the
larger subunit, RRM1, has been consistently observed as pancreatic cancer cell lines
acquire gemcitabine resistance [30, 59]. Consistently, low expression of RRM1 in tumors
is correlated with enhanced response to gemcitabine specifically in recurrent cases [59,
60]. The subunit appears to have no correlation with disease-free or progression-free
survival, and its correlation with overall survival is variable [60, 61]. Therefore, the
expression of RRM1 seems to be more relevant to acquired rather than innate
gemcitabine resistance in both pancreatic cancer cell lines and patients.
For RRM2, some studies have shown increased transcript and protein expressions
in pancreatic cancer cell lines [30, 62], while others have additionally identified the
significance of the alteration in determining gemcitabine sensitivity in pancreatic cancer.
Specifically, RNA interference of RRM2 attenuated chemoresistance and invasiveness in
cells [42, 63], while it suppressed tumor growth, enhanced apoptosis, and inhibited
metastasis in xenograft models [64]. Moreover, Ohhashi et al. found a reduction in
cellular proliferation with the inhibition of RRM1 and RRM2 even in the absence of

13
gemcitabine treatment [42]. Clinically, low RRM2 mRNA expression levels correlated
with significantly enhanced disease-free, median, and overall survival as well as overall
response rate in gemcitabine-treated patients [65, 66]. Reduction of the dNTP pool by
gemcitabine inhibition of RRM2 is clear in its effects on nuclear DNA (i.e., facilitating
the incorporation of dFdC-TP into replicating DNA). However, this mechanism may also
hold true for mitochondrial DNA (mtDNA) although evidence has not yet been provided.
Nevertheless, gemcitabine has been shown to directly affect mtDNA by inhibiting its γ-
polymerase [67].
Approaches to Enhancing Gemcitabine Delivery:
Prodrugs by Chemical Modification
An apparent approach for enhancing gemcitabine delivery to cells is to bypass its
dependence on transporters for entering the cell. This can be achieved by chemically
modifying the drug and creating various prodrugs, such as acyl derivatives, with
increased lipophilicity. For example, lipophilic prodrugs of troxacitabine, a nucleoside
analog drug with an unnatural L-configuration, were created with the addition of linear
aliphatic chains to the amino group; sensitivity of pancreatic cancer cells to the modified
drugs was greater than 100-fold compared with troxacitabine [68]. Likewise, lipophilic
prodrugs of gemcitabine were synthesized by linking the 4-amino group with acyl
derivatives (i.e., valeroyl, heptanoyl, lauroyl, and stearoyl) [69, 70]. In addition, by
masking the N-terminus, this modification also protects gemcitabine from rapid
deamination and improves its half-life. In particular, 4-(N)-stearoyl-gemcitabine was
found to decrease the cytotoxic IC50 of a cervix, breast, colorectal, and nasopharyngeal
cell line by 1.5-5-fold [71, 72]. Furthermore, a novel gemcitabine-cardiolipin conjugate

14
was shown to induce cytotoxicity in several gemcitabine-resistant cell lines independent
of nucleoside transporter activity. In vivo, the conjugate demonstrated less adverse effects
compared with gemcitabine as measured by body weight and white blood cell count,
while inhibiting tumor growth by 20% greater than gemcitabine. A high dose of the
treatment increased the median survival of tumor-bearing mice by 73%, while the same
dose and schedule of gemcitabine led to toxic death of all mice [73]. Another lipophilic
prodrug of gemcitabine, CP-4126, was created by esterifying an elaidic fatty acid at the
5’ position. The compound was found to be as effective as gemcitabine in chemoresistant
cell lines, but both were ineffective in cells devoid of dCK activity. However, CP-4126
maintained its efficacy in nucleoside transporter-inhibited cells, while the IC50 for
gemcitabine increased 200-fold. In various xenograft models, both gemcitabine and CP-
4126 were equally effective, but the prodrug was able to be administered orally [74]. The
potential of this approach has extended to a phase I study with a novel oral gemcitabine
prodrug, LY2334737, evaluated in patients with advanced or metastatic solid tumors.
This prodrug protects the amine group of gemcitabine with a covalent bond to valproic
acid, preventing extensive pre-systemic deamination. As the first human clinical trial for
LY2334737, the study demonstrated safe administration of the drug, despite the caveat of
blood-brain barrier effects, with minor adverse effects and observations of anti-tumor
activity [75].
An alternative approach for enhancing efficacy includes the creation of a
phosphoramidate prodrug. By creating a variant of the monophosphate form (i.e., dFdC-
MP), the rate-limiting phosphorylation step is bypassed. Wu et al. demonstrated that a
phosphoramidate prodrug of gemcitabine was approximately 4-fold more effective than

15
gemcitabine in dCK-deficient variants of cancerous cell lines. Furthermore, inhibition of
transporter activity did not diminish the prodrug’s activity in the dCK variants, although
the same did not hold true for the parental cell lines [76]. Similarly, another
phosphoramidate prodrug, GemMP[10], was found to reduce thyroid cancer cell
proliferation by arresting cells in S phase at concentrations 5-10-fold lower than
gemcitabine [77]. In addition to increasing lipophilicity, reducing deamination, and
bypassing the rate-limiting phosphorylation step, chemical modifications of gemcitabine
can also be conducted in order to enhance its interaction with delivery vesicles such as
liposomes [69, 70], which will be further discussed below.
Nanoparticle Drug Delivery
Nanoparticle drug delivery has been shown to be a promising approach for
overcoming several anatomical, pathophysiological, and pharmacological barriers [78]
and attenuating chemoresistance in pancreatic cancer. By encapsulating or adsorbing
gemcitabine in nanoparticles, reduced pre-systemic metabolism, lower dosages, and
sustained release are possible. For example, encapsulation of gemcitabine into chitosan
and albumin nanoparticles produced sustained release profiles as well as improved
antitumor activity in vitro compared with the administration of free drug [79]. Additional
therapeutic advantages of nanoparticle drug delivery include altered pharmacokinetic
parameters (e.g., decreased drug clearance), increased drug concentration in tumor tissues
via the enhanced permeability and retention (EPR) effect (i.e., nanoparticles tend to
greater accumulate in tumor rather than normal tissues) [80], increased local plasma T3
levels, and the potential for targeted delivery.

16
Furthermore, combination therapies can also be utilized with nanotechnology.
One study reported that a combination of gemcitabine and curcumin in nanoparticles
enhanced the inhibition of tumor growth, abolished systemic metastases, and reduced the
activation of NFκB in a pancreatic cancer xenograft model as compared with either agent
alone [81]. Similarly, gemcitabine and paclitaxel preconjugated with a hydrolysable
linker and subsequently loaded into a drug carrier were found to significantly improve the
chemotherapeutic activity as compared with their free form [82].
As previously noted, decreasing the hydrophilicity of gemcitabine aids in the
incorporation of the drug into liposomal formulations. In particular, stearoyl gemcitabine
nanoparticles better managed tumor growth as compared with free gemcitabine, and
results were further enhanced by PEGylation which increases drug half-life [83]. Such
nanoparticles were also shown to overcome gemcitabine resistance related to the
overexpression of RRM1 in both cell culture and mice. Furthermore, the enhanced
cytotoxicity of these nanoparticles was additionally observed in dCK-deficient tumor
cells with the induction of apoptosis through caspase activation [84]. Similarly,
conjugation of gemcitabine with squalene, a precursor to cholesterol synthesis, resulted in
amphiphilic molecules that were shown to have enhanced anticancer activity due to
protection of the drug from rapid deamination [85]. Such nanoparticles were
demonstrated to possess greater ability to induce S phase arrest and apoptosis of cancer
cells as compared with free gemcitabine [86]. Furthermore, it has been reported that
albumin enhanced the passive diffusion of squalenoyl gemcitabine nanoparticles rather
than relying on membrane transporters [87]. This was confirmed by higher activity of the
nanoparticles than free gemcitabine in transporter-deficient, gemcitabine-resistant tumor

17
Figure 1.2. Novel therapeutic approaches for overcoming limitations in the
gemcitabine pathway. Gemcitabine enters the cell via nucleoside transporters (i.e.,
CNT1, CNT3, ENT1, ENT2). The drug is either phosphorylated into its active form
(i.e., dFdC-phosphate) by dCK or deaminated into dFdU by CDA and eliminated from
the cell. Activated gemcitabine can then terminate the cell by directly targeting DNA or
inhibiting RRM1 and RRM2 to deplete the dNTP pool necessary for DNA replication.
Descriptions in boxes (red) indicate known methods for targeting a particular
determinant (green) of gemcitabine chemosensitivity in pancreatic cancer.
Abbreviations: CNT, concentrative nucleoside transporter; ENT, equilibrative
nucleoside transporter; dCK, deoxycytidine kinase; CDA, cytidine deaminase; RR,
ribonucleotide reductase; dFdC, 2’,2’-difluorodeoxycytidine; dFdU, 2’,2’-
difluorodeoxyuridine; CDP, cytidine diphosphate; dCDP, deoxycytidine diphosphate;
dCTP, deoxycytidine triphosphate.
cells [88]. Furthermore, the penetration of the gemcitabine-squalene molecules was
increased due to the presence of cholesterol in the monolayer, which may contribute to
the increased anticancer activity since cancer cell membranes are rich in cholesterol [89].
Squalenoyl-based gemcitabine nanoparticles were found to overcome gemcitabine

18
resistance with increased cytotoxicity in gemcitabine-resistant cell lines deficient in both
dCK and hENT1 [86].
Nanoparticles can also be modified for targeted delivery of gemcitabine to
pancreatic cancer cells. The addition of monoclonal antibodies has been utilized as a
targeting moiety for pancreatic tumors. A recent study demonstrated that Herceptin
(HER2)-conjugated chitosan nanoparticles loaded with gemcitabine led to an increase in
antiproliferative activity in vitro along with enhanced S-phase arrest as compared with
free gemcitabine. In addition, the targeted nanoparticles were efficiently taken up by the
cells and prolonged intracellular retention was obtained. Sustained in vitro release of the
drug from the nanoparticulate system indicated proper diffusion of the drug from the
polymeric matrix [90]. Likewise, gold nanoparticles with anti-epidermal growth receptor
antibodies demonstrated that a lower dose of gemcitabine was able to inhibit the
proliferation of pancreatic cancer cells as well as orthotopic tumor growth [91].
An additional method for targeting includes the use of magnets which are directed
to the desired site upon application of an external magnetic field. The drug can then be
released with the help of various triggering factors like ultrasound or changes in
physiological conditions (e.g., pH, temperature) or by simple diffusion [92, 93]. Such
systems prepared by the inclusion of magnetic nanocrystals into squalenoyl gemcitabine
bioconjugates have been reported. Upon injection into a mouse tumor model,
magnetically-guided nanoparticles showed enhanced anticancer activity [94].
Nanogel formulations with tumor-specific molecules were also efficient in
overcoming resistance by enhancing tumor growth inhibition with stable release of the
drug over several days in nucleoside transporter-deficient and dCK-deficient

19
lymphogenic cancer cells [95]. Such nanogel formulations containing the active form of
the nucleoside analog (i.e., dFdC-TP) demonstrated greater cytotoxicity and reduced
resistance as compared with nucleoside analog prodrugs. The drug delivery systems aid
in the protection of the active drugs and enhance intracellular retention [96, 97].
Dosage and Schedule Modifications
The mechanism of action of gemcitabine is atypical since the drug depends on the
cell cycle and only a few key proteins for efficacy. The importance of these key players
for gemcitabine is unique and evident by the significant influence on active metabolite
concentration and drug efficacy with the modification of only a single target. Therefore,
the efficacy of gemcitabine is dependent on a balance of both dosage and schedule.
Gemcitabine pharmacokinetics can be described by a linear, 2-compartment
model with a half-life of 42-94 min (short infusion of <70 min) depending on age and
gender. While the rate of clearance varies with age and gender, 92-98% of a typical
gemcitabine dose (i.e., 1000 mg/m2/30 min infusion) is excreted, predominantly in the
urine. The volume of distribution of gemcitabine is highly affected by infusion duration
and gender, while effects of plasma protein binding are negligible [98].
Currently, the standard regimen consists of 1000 mg/m2 gemcitabine given
weekly as a 30 min infusion for 3 weeks followed by one week of rest. While that dosage
is believed to saturate dCK activity, pharmacokinetic studies have determined that a 1000
mg/m2/h infusion rate was optimum for intracellular phosphorylation of gemcitabine
[99]. Nonetheless, several studies have shown 1500 mg/m2 as the maximum tolerated
dose (MTD), with high-grade neutropenia, granulocytopenia, and thrombocytopenia
being dose-limiting factors [100, 101]. Trials comparing a fixed dose rate (FDR) of

20
gemcitabine (1500 mg/m2 at a rate of 10 mg/m
2/min weekly for 3 weeks out of a 4-week
cycle) with standard gemcitabine treatment indicated increased efficacy of the FDR but
with much greater hematological toxicities (i.e., neutropenia, anemia, and
thrombocytopenia) in patients [102-104]. Furthermore, although one study established
the MTD of gemcitabine at 6500 mg/m2 with hematopoietic progenitor support, its
efficacy was not superior than that reported with lower-dosage FDR schedules [105]. A
high dose of gemcitabine was also investigated with 2200 mg/m2 administered as an
infusion for 30 min on days 1 and 15 for 6 months. The regimen was deemed safe,
tolerable, and effective for palliative treatment of advanced pancreatic cancer patients
[106]. Collectively, these data indicate that altering the exposure level of gemcitabine in
patients is vital for obtaining specific desired effects.
When comparing schedules, 1000 mg/m2
gemcitabine as a 30 min infusion given
weekly for either 3 consecutive weeks every 4 weeks or 2 consecutive weeks every 3
weeks indicated comparable efficacy although the 3-week schedule produced lower
toxicity in patients [107]. Another schedule of 1000 mg/m2 gemcitabine given for 7
consecutive weeks followed by a week of rest and then weekly for 3 weeks out of 4
identified increased toxicities compared with the conventional regimen [108].
Metronomic dosing, or continuous and timed administration of low dosage, of
gemcitabine (1 mg/kg/d for a month) was found to exert equal cytotoxicity in orthotopic
models of human pancreatic carcinoma in nude mice compared with the conventional
schedule of 100 mg/kg/days 0, 3, 6, and 9 post-implantation. However, an anti-
angiogenic effect was additionally observed with the metronomic regimen [109].

21
Infusion duration has also been identified as a key factor that influences
gemcitabine efficacy. One study demonstrated that the chemotherapeutic retained its
antitumor activity at doses as low as 300 mg/m2 when infusion time was prolonged [110].
Other trials increased the infusion rate of 100 mg/m2 to 24 h weekly for 3 weeks in a 28-
day cycle and found an improvement in the quality of life of patients but also only
marginal antitumor activity [111]. Furthermore, an investigational method of hypoxic
abdominal stop-flow perfusion demonstrated increased efficacy of gemcitabine in
patients compared with the standard treatment at doses up to 1125 mg/m2. However, this
complicated modality remains in its infancy, and further studies are needed for its
complete assessment [112].
Approaches to Directly Modifying Determinants of Gemcitabine Cytotoxicity:
Gene Therapy
Even though gene therapy has not yet been well-developed for the application of
cancer (as compared with other disorders such as cystic fibrosis), the approach has
become appealing for altering specific targets with its potential for producing a bystander
effect within heterogeneous tumors. A fusion gene of dCK and uridine monophosphate
kinase (UMK) (dCK::UMK) was found to sensitize pancreatic cancer cells to
gemcitabine by markedly decreasing viability. Tumor volume was also reduced as an
antitumoral bystander effect was observed due to apoptosis of untransduced cells.
Additionally, the use of a synthetic carrier (i.e., polyethyleneimine (PEI)) further induced
tumor regression [113]. A combination of dCK::UMK with siRNA against RRM2 and
thymidylate synthase (TS), whose inhibition activates hENT1, and gemcitabine promoted
chemosensitivity even more with a 40-fold decrease in cytotoxic IC50 in PANC-1 cells.
22
Tumor volume was reduced dramatically and mouse survival prolonged significantly due
to an increase in apoptosis and decrease in cellular proliferation [114]. Recently, it has
also been found that the overexpression of dCK and knockdown of p8 with recombinant
adenoviral vectors also significantly decreased gemcitabine resistance in PANC-1 cells
and inhibited tumor growth with enhanced apoptosis and caspase-3 activity [46].
The herpes simplex virus 1 thymidine kinase (HSV-TK)/ganciclovir (GCV)
strategy has thus far been successful up to the clinical level, and the same technique may
be adapted to target increased RR in cancer cells. RR has been a target of interest with
gene therapy since its overexpression is an attribute of mitotic cancerous cells. Therefore,
vectors lacking the RR gene are attractive options due to their ability to complement with
overexpressed mammalian RR and selectively target rapidly dividing cells. For example,
a herpes simplex virus (HSV) with an RRM1 deletion mutant (i.e., ICP6Δ) was found to
enhance the expression of adeno-associated viruses along with their kinase genes both in
pancreatic cancer cells and xenografts, demonstrating potential for the combination
therapy [115]. Similarly, an HSV vector lacking the RR gene (i.e., hrR3) was found to
extend survival in 70% of mice receiving both the vector and ganciclovir, 40% of mice
receiving the vector alone, and 0% of untreated mice [116].
Overexpression of hENT1 has also been conducted with a recombinant
adenovirus (i.e., Ad-hENT1) in human pancreatic cancer cells. Although expression of
the transporter is known to vary with cell cycle and cell type, treatment with the vector
improved response to gemcitabine [117]. Other targets of gene therapy in pancreatic
cancer include p53 and p16 [118] and Bax [119], although they are not directly related to
gemcitabine metabolism.

23
Epigenetic Approaches
The field of epigenetics has been rapidly emerging since the identification of its
influence on the initiation, progression, and resistance of various cancers. The ability to
reverse aberrant epigenetic alterations renders this targeted approach highly attractive.
Among the various mechanisms, DNA methylation has been the most widely studied.
Abnormal promoter hypermethylation can silence tumor suppressor genes and have been
implicated in the clinicopathological features and promotion of tumorigenic properties of
pancreatic cancer. One study identified that low expression of dCK in pancreatic cancer
patients correlated with overall survival as well as age, suggesting a role of age-related
methylation of the dCK gene [47]. It was also found that the CDA gene was methylated
in an entire cohort of colorectal cancer patient samples, although no correlation was
observed between methylation status and clinicopathological parameters [120]. By
utilizing microarrays, countless other aberrantly methylated genes have been identified in
pancreatic cancer, particularly those related to growth, differentiation, angiogenesis, and
apoptotic signaling [121-124]. However, further information about the methylation status
of the targets of the gemcitabine pathway is limited.
FDA-approved inhibitors of DNA methylation are currently available with several
more under investigation. For example, the nucleoside analogs 5-azacytidine (5-aza-C)
and 5-aza-2’-deoxycytidine (5-aza-dC) have been approved for the treatment of high risk
myelodysplastic syndromes [125] and are currently under study for acute and chronic
myeloid leukemias and ovarian cancer [126]. Both compounds have been found to be
substrates for hCNT1 [127] and rely on dCK for their phosphorylation [128].
Combination of 5-aza-dC with gemcitabine was shown to inhibit pancreatic cancer cell
24
growth to a greater extent than with gemcitabine alone [129]. The DNA methylation
inhibitor cladribine, also a nucleoside analog, has been studied in conjunction with
rituximab for the treatment of mantle cell lymphoma; high levels of activity with minimal
toxicity were found [130].
In addition to DNA, epigenetic modifications, namely methylation and
acetylation, can also occur at the histone level. Unlike DNA methylation, histone
methylation is a mechanism that has yet to be thoroughly studied in the context of cancer.
Histone acetylation, on the other hand, is a mechanism well-studied in the development
and progression of cancer since aberrant activity promotes the expression of various
oncogenes. This process is reversibly catalyzed by histone acetyltransferases (HATs) and
histone deacetylases (HDACs). Currently, FDA-approved HDAC inhibitors include
vorinostat and romidepsin for the treatment of T cell lymphoma, although many others
remain under study in clinical trials [126]. Romidepsin has also been demonstrated to
have antiproliferative activity in five human pancreatic cancer cell lines (IC50: 1-500 nM)
via cell cycle arrest at both G1 and G2/M phases followed by apoptosis [131].
Additionally, the HDAC inhibitor MS-27-275 was shown to decrease cells in S phase
cells while increasing G1-phase cells. Antitumor efficacy was observed in both Capan-1
cells and mouse xenograft [132]. Trichostatin A (TSA) [133], another HDAC inhibitor,
has been widely studied and shown to induce antitumor effects in pancreatic cancer cell
lines at submicromolar concentrations [134, 135]. Furthermore, a novel compound
derived from both MS-27-275 and TSA was shown to cause cell cycle arrest and
subsequent apoptosis in pancreatic cancer cell lines [136]. Several studies have shown the
increased efficacy of combining an HDAC inhibitor with gemcitabine in pancreatic

25
cancer cell lines including the synergistic apoptotic effects of TSA with gemcitabine in
pancreatic ductal carcinoma cells [137-141]. With 50% reduction of pancreatic cancer
xenografts and no observed toxicity, Donadelli et al. further identified that TSA did not
affect the gene expressions of targets in the gemcitabine pathway [138]. Nonetheless, a
phase II trial of CI994 (n-acetyl dinaline), an HDAC inhibitor, with gemcitabine
demonstrated no additional advantage in survival rate compared with gemcitabine alone
[142], warranting further studies for the better understanding of this therapeutic approach.
The rapidly expanding field of miRNAs, short (~22 nt) RNA sequences that post-
transcriptionally regulate gene expression by binding to complementary mRNA, is also
appealing for its potential to influence cancer epigenetic therapy. Their ability to regulate
expression of canonical oncogenes and tumor suppressor genes as well as the recent
demonstration of their direct involvement in oncogenic processes emphasizes their
potential to intervene in dysfunctional cancer pathways. There is also increasing evidence
demonstrating that miRNAs are critical regulators of drug resistance in pancreatic cancer.
For example, re-expression of the miR-200 family or downregulation of miR-21 in
gemcitabine-resistant cells led to sensitization of the cells to gemcitabine [7]. Since
miRNA expression patterns are unique to each tumor type, aberrant expression profiles
(e.g., the downregulation of the let-7 family) have been shown to contribute to cancer
pathogenesis and tumor development and progression [7, 143]. In addition to being
epigenetic targets, miRNA activity can also be modulated by inhibition with antisense
oligonucleotides or overexpression with synthetic miRNAs, as reviewed recently [7,
143]. The development of curcumin as a potential therapeutic for pancreatic cancer
patients has been under investigation due to its interactions with DNA methyltransferase,

26
HDACs, and HATs and ability to alter miRNA expression, including upregulation of
miR-200 and downregulation of miR-21 [144]. In this regard, several recent reviews
identify key growth, proliferation, and differentiation (e.g., PI3K/Akt, MAPK, K-ras,
STAT-3, Notch-1, Notch-2), invasion (e.g., ABCG2, cadherin, ZEB1, vimentin), and
apoptosis (e.g., CDK6, p53, caspase 3) proteins altered by miRNAs [7, 143, 145].
Therefore, targeting miRNAs offers great promise for tackling pancreatic cancer
chemoresistance and providing diagnostic and therapeutic values.
Studies from our laboratory show miRNAs influencing the expression of direct
targets of the gemcitabine pathway. We have identified that miR-214, miR-339-3p, and
miR-650 overexpression significantly reduced hCNT1, but not hENT1, protein levels.
Furthermore, several miRNAs were found to markedly reduce both hCNT1 transport
activity as well as gemcitabine cytotoxicity in a pancreatic cancer cell line [9]. Likewise,
our recent study showed that the differential processing of the let-7 family of miRNAs
altered gemcitabine chemosensitivity in pancreatic cancer cells through its activity on RR
(unpublished data). Both studies identify the potential for modulating miRNA expression
to enhance the efficacy of gemcitabine, although the ability of pancreatic cancer cells to
process miRNA precursors should be carefully considered while choosing precursor
miRNA-based therapies. In addition to overcoming chemoresistance, epigenetic and
miRNA alterations also have the potential to act as prognostic and predictive biomarkers
for the guidance of therapy.
Molecular Therapeutic Agents
Several small and large molecule inhibitors demonstrate potential as therapeutic
agents. For example, proteasomal inhibitors, such as bortezomib, have been shown to

27
increase cytotoxicity in combination with gemcitabine [9, 146]. Similarly,
tetrahydrouridine (ThU), a competitive inhibitor of CDA, has been shown to sensitize
pancreatic cancer cells to gemcitabine up to 54-fold [45]. Although pharmacokinetic
studies have been performed on the compound, its therapeutic value as well as safety and
toxicity profiles remain under study in humans [147]. RNA interference has also been
commonly used for the study of specific targets in pancreatic cancer chemosensitivity.
While Ohhashi et al. noticed no change in gemcitabine sensitivity or cellular proliferation
with hENT1-targeted siRNA [42], others found that knockout of TS with siRNA
decreased chemoresistance in pancreatic cancer cell lines [148]. Furthermore, shRNA
against hENT1 combined with 5-fluorouracil (5-FU) treatment attenuated cell viability
and gemcitabine cytotoxic IC50 values. Given the dual treatment, cells were arrested in
G0/G1 phase, while mouse xenografts had diminished tumor volumes [35]. Furthermore,
modulation of transporter activity and, consequently, gemcitabine uptake was recently
conducted with siRNA against hCNT1 [9]. Similarly, silencing of dCK with siRNA in
gemcitabine-resistant cells further reduced gemcitabine sensitivity without affecting
cellular proliferation [42]. Treatment of gemcitabine-resistant PANC-1 cells with
hydroxyurea led to a 4-fold increase in chemosensitivity [149]. RRM1- and RRM2-
targeted siRNA in pancreatic carcinoma cell lines increased gemcitabine sensitivity,
apoptosis, and caspase-3 activity while lessened cell proliferation and invasiveness [42,
63, 64, 150]. In an orthotopic xenograft model, synergism was observed between RRM2
silencing and gemcitabine, leading to reduced tumor growth, enhanced tumor apoptosis,
and inhibition of metastasis [64].
28
Novel Therapeutic Combinations with Gemcitabine
In addition to radiosensitization, potentiating chemosensitization of gemcitabine
by other pharmaceutical agents has been a longstanding area of interest. Although
combination therapies with gemcitabine have been studied extensively both in vitro and
in clinical trials, only a few have consistently resulted with significant improvements in
patient survival. Since several mechanisms of drug resistance exist, combination therapy
can simultaneously undertake multiple mechanisms and pathways, allowing the drugs to
act in concert. This rationale is well-illustrated by the current approach towards breast
cancer treatment. Nonetheless, combinations of gemcitabine with other
chemotherapeutics such as other nucleoside analogs (i.e., 5-FU, capecitabine), platins
(i.e., cisplatin, oxaliplatin), and taxoids (i.e., docetaxel [133, 151], paclitaxel [152]) have
shown variable results with no significant enhancement of patient survival [6].
With the interests geared towards targeted therapy, numerous novel therapeutics
have been studied with gemcitabine: antibodies (i.e., bevacizumab, cetuximab), growth
factor inhibitors (i.e., erlotinib, aflibercept, axitinib [153], saracatinib [154]),
topoisomerase I inhibitors (i.e., irinotecan, exatecan, rubitecan), MMP inhibitors (i.e.,
marimastat, BAY 12-9566), tyrosine kinase inhibitors (i.e., masitinib, sorafenib, sunitinib
[155], ARQ 197 [156]), and other inhibitors (i.e., pemetrexed, tipifarnib, celecoxib,
imitinib [157], PX-12 (a novel inhibitor of thioredoxin) [152] and enzastaurin [158]) [6].
Among the sizeable list, several agents show promise. However, erlotinib has been the
only agent thus far to have consistently demonstrated equal or significantly enhanced
median overall survival compared with gemcitabine (1-year survival rates of 23% and
17%, respectively) [6]. Therefore, the EGFR inhibitor is currently FDA-approved for use

29
in combination with gemcitabine for the treatment of pancreatic cancer. Other agents of
interest include curcumin (a natural product) [6], leucovorin (an adjuvant agent) [6],
tegafur (a prodrug of 5-FU) [98, 159], and MGCD0103 and valproic acid (HDAC
inhibitors) [160]. In particular, notable combinations under study include GTX
(gemcitabine, docetaxel, and capecitabine) [161, 162], GemOx (gemcitabine, oxaliplatin)
[163], GemOxCet (gemcitabine, oxaliplatin, cetuximab), and Gemoxel (gemcitabine,
oxaliplatin, capecitabine) [164]. Nonetheless, novel combinations not including
gemcitabine such as Xeliri (capecitabine, irinotecan) [165], Folfiri (leucovorin, 5-FU,
irinotecan) [165], and Folfirinox (leucovorin, 5-FU, irinotecan, oxaliplatin) [166] have
also shown promise in combating pancreatic cancer, although more studies are needed to
determine toxicity and efficacy profiles.
An alternative approach studied is the use of agents for modulating the tumor
microenvironment. Several clinical trials have been conducted with prophylactic
anticoagulants (i.e., nadroparin, enoxaparin, dalteparin) with gemcitabine, although
minimal significant results for the advancement of pancreatic cancer therapy were
obtained [6]. Similarly, the use of pomalidomide, an investigational immunomodulating
drug that both inhibits angiogenesis as well as exerts antitumoral effects, was found to be
feasible and safe in most patients [27]. When co-administered with gemcitabine, a drug
depleting tumor-associated stromal tissue via inhibition of the Hedgehog cellular
signaling pathway, IPI-926, was found to facilitate gemcitabine intratumoral delivery and
extend survival of a spontaneous mouse pancreatic tumor model [167]. Furthermore, a
novel ceramide analog, AL6, has been shown to increase the dCK/CDA gene expression
ratio, leading to increased apoptosis in two pancreatic ductal adenocarcinoma cell lines

30
[168]. A study of gemcitabine in combination with imexon, a pro-oxidant small
molecule, was found to significantly increase chemotherapeutic efficacy in PANC-1
xenograft tumors. This is thought to be due to the inhibition of RR by imexon, with
inhibition effects even greater with the addition of gemcitabine [169]. Overall,
combinations of a targeting agent with gemcitabine have shown to be well-tolerated with
promise for enhanced efficacy. Further studies as well as meta-analysis of data from
clinical trials are warranted for consistent efficacy results.
Summary
Gemcitabine is predicted to remain as a key treatment option for pancreatic cancer
patients for the near future. Determinants of chemoresistance in the gemcitabine pathway
are well-known, yet many challenges remain in pursuing the targets of interest to improve
efficacy. Furthermore, other than the gemcitabine pathway, numerous other cellular and
tumoral determinants pose as obstacles in overcoming chemoresistance. Nonetheless,
novel therapeutic approaches are currently underway to circumvent limitations in
gemcitabine transport, phosphorylation, and overall efficacy. Although therapeutic
challenges are clear and present, countless studies, both at the benchtop and clinical
levels, continue to provide clues for maximizing chemotherapeutic efficacy in patients.
Purpose and Rationale of Study
The purpose of this dissertation is to better understand how pancreatic cancer cells
acquire chemoresistance and the ability to metastasize. Specifically, the study focuses on
identifying key cellular, molecular, and epigenetic changes that allow these cells to
survive in the presence of chemotherapeutics such as gemcitabine as well as spread to

31
distant sites in the body. The rationale of this dissertation is that the identification of
determinants contributing to chemoresistance could lead to the discovery of novel drug
targets for improved therapeutic management of pancreatic cancer.
Objective and Hypothesis of Study
The overall goal of the lab is to improve the chemotherapeutic management of
pancreatic cancer. The overall objective of this dissertation is to determine ways to
exploit the key characteristics that allow cancer cells to become chemoresistant and
metastatic for improved sensitivity to therapeutics. The hypothesis is that targeting these
cellular changes may lead to the discovery of novel treatment avenues that may be
utilized in combination with current chemotherapies to enhance efficacy and reduce
toxicity in pancreatic cancer patients.
Expected Results and Significance of Study
The expected results of this dissertation are the better understanding of cellular
changes leading to chemoresistance, the investigation of key cancer genes and pathways
as ‘druggable’ targets, and the evaluation of potential treatment approaches by utilizing
improved pharmacological agents and novel drug delivery. These expected results are
significant because they could lead to further clinical studies for a novel approach in
treating pancreatic cancer. Moreover, these changes may be applicable to other solid
tumors in which similar characteristics are found and the same chemotherapeutic drugs
are used.

32
Section and Chapter Summaries
This manuscript-style dissertation consists of three sections with five research
projects, each presented as a separate chapter. The first section focuses on targeting DR-
phenotype cells in order to improve chemosensitivity. These cells include, but are not
limited to, populations that have lost expression of nucleoside transporters necessary for
drug uptake, intracellular connections necessary for drug transfer between cells, and drug
metabolizing enzymes necessary for prodrug activation [7, 8].
Chapter 2 studies whether the expression of epithelial (E)-cadherin, a
transmembrane protein that mediates cell-cell adhesion, can restore the gemcitabine
activation pathway in order to improve chemosensitivity. We examined changes in the
expression of gemcitabine transporters, gemcitabine phosphorylating and metabolizing
enzymes, as well as other DNA replication and repair enzymes that affect gemcitabine
cytotoxicity. We found that E-cadherin enhanced gemcitabine efficacy predominantly
through increasing hENT1 expression and activity, leading to increased cellular transport
and cytotoxicity of the drug. These results show that cell adhesion molecules, such as E-
cadherin, can stabilize drug transport proteins at the cell surface in order to modulate
drug sensitivity in pancreatic cancer. This study also shows potential for using E-cadherin
as a biomarker for guiding nucleoside analog therapy in pancreatic cancer patients.
The aim of Chapter 3 is to characterize the intracellular (within the cell) and
intercellular (cell-to-cell) movements of nucleosides in order to identify ways of
improving drug targeting and chemotherapeutic efficacy. Our approach was to
manipulate the expressions of nucleoside transporters, gap junctions (intracellular
channels composed of connexins (Cxs)), or both to increase nucleoside drug

33
concentration within tumor cells, resulting in greater cytotoxicity. We found that
increasing the expression of hCNT1 and Cx32, but not hENT1 and Cx43, resulted in
greater nucleoside analog concentration within the cell population. However, no
significant change was observed for gemcitabine cytotoxicity. These results indicate that
different members of the nucleoside transporter and gap junction families can have
disparate roles in nucleoside analog transport and efficacy in cells. Further studies are
warranted to understand which combination of members can confer both enhanced drug
uptake as well as efficacy.
The second section focuses on decreasing the stemness of advanced pancreatic
cancer cells using pharmacological means. As a drug-resistant subpopulation, these
pluripotent cells can survive chemotherapy and renew the tumor [15-17]. By targeting the
stem cell characteristic, pancreatic cancer cells may become sensitized to chemotherapy
before renewal can occur. In other words, it may be possible to overturn the
chemotherapeutic refractoriness that tumors with CSC populations exhibit.
Chapter 4 evaluates the potential of an investigational histone methylation
reversal agent, 3-deazaneplanocin A (DZNep), for decreasing the stemness associated
with pancreatic cancer and improving the sensitivity of pancreatic cancer to gemcitabine.
Cellular proliferation assays identified that co-treatment of DZNep and gemcitabine
enhanced cytotoxic effects in the cancerous pancreatic cell lines, while DZNep exerted
antagonism with gemcitabine against the normal pancreatic cell line, HPDE. Further
optimization studies revealed that short priming with DZNep followed by gemcitabine
treatment, rather than co-treatment, produced a maximal chemosensitization response in
the pancreatic cancer cells. Drug delivery using engineered nanoparticles that mimicked

34
this short priming further enhanced cytotoxicity. Ultimately, we found that histone
methylation reversal by DZNep presensitizes pancreatic cancer cells to gemcitabine.
The third section examines whether reverting the EMT phenotype in cells could
restore chemosensitivity. The epithelial-mesenchymal transition is a process by which
epithelial cells lose their cell-cell contacts, polarity, and cuboidal shape to become
mesenchymal cells with a spindle-like shape and migratory and invasive properties. As
the cells gain metastatic ability, their response to chemotherapy decreases. This process
has been well-characterized with several markers indicating an epithelial (e.g., E-
cadherin, claudins, occludins) versus mesenchymal (e.g., N-cadherin, vimentin,
fibronectin) phenotype [20, 170, 171]. In addition to cellular markers, epigenetic states
have also been implicated in EMT [18, 19, 21, 172].
Chapter 5 describes how expression of the SET oncoprotein contributes to the
progression of pancreatic cancer, particularly by regulating the EMT-phenotype
subpopulation of tumor cells. This study was derived from a previous project in our lab
which identified SET as a novel regulator of the let-7 miRNA family [173]. Let-7 is a
tumor suppressor involved in differentiation and chemosensitivity. Among the two major
isoforms of SET, we found that overexpressing the cell-surface isoform 2, rather than the
better-known nuclear isoform 1, in the epithelial PANC-1 cell line induced EMT by
causing a spindle-like, mesenchymal morphology and promoting cellular proliferation,
colony formation, migration, and invasion. The induction of EMT in cells was
determined to be a result of cadherin switching (i.e., from expressing epithelial E-
cadherin to mesenchymal N-cadherin). Further mechanistic studies identified that SET-
induced cadherin switching involved the SPARC/Slug and Rac1/JNK/c-Jun/AP-1

35
signaling pathways which inhibit E-cadherin and promote N-cadherin, respectively.
These findings have implications for the design and targeting of SET and its associated
pathways for intervening pancreatic tumor progression.
The last chapter consists of a general discussion of the overall results as well as
potential future directions.
Scope of Work and Limitations
The earlier chapters support the potential of E-cad to be used as a biomarker for
early diagnosis, drug targeting, and guiding treatment. With the use of
chemotherapeutics, this biomarker may avoid unnecessary gemcitabine usage and
toxicities in gemcitabine-refractory pancreatic cancer patients and instead use an
alternative medicine such as tyrosine kinase inhibitors or other molecular therapies
currently approved for pancreatic cancer therapy. E-cad shows promise as a biomarker
because of its role in regulating hENT1, an already employed biomarker for staging of
differentiation and prediction of patient survival. Therefore, E-cad can be used as a
surrogate marker and/or as part of a biomarker index to indicate preliminary patient
response to nucleoside analog therapeutics.
Nonetheless, several limitations exist in our study. Firstly, there is not a perfect
correlation between E-cad expression and hENT1 expression and activity. In fact, in
cadherin-null A431D cells, we found hENT1 expressed at the cell surface and functional,
suggesting that E-cad is not a requirement or absolute marker for hENT1 (see details in
Chapter 2). However, E-cad does augment hENT1 cell surface expression and activity
and reduce the rate of degradation of the transporter. In a pancreatic cancer system,

36
numerous cadherins are expressed. Currently, most of their roles in conferring
chemoresistance remain unknown, and it is possible that they are able to compensate for
the loss of E-cad. Likewise, there are numerous transporters involved in gemcitabine
uptake. In this study, we identified significant changes in hENT3 and hCNT1 transcript
levels with E-cad expression. In a previous study, we found that hCNT1 correlates with
differentiation and influences chemosensitivity [9]. Another limitation of this study is that
we used pancreatic cancer cell lines as models for pancreatic cancer. While we focused
on these parenchymal cells, there are several other cell types involved in pancreatic
cancer: stromal cells, stellate cells, endothelial cells (blood vessels), and immune cells
(e.g., macrophages). The status of E-cad in these other cell types as well as their response
to nucleoside analogs remains unknown. Furthermore, for this study, we were not able to
acquire a large number of pancreatic ductal adenocarcinoma (PDAC) tissues, so we were
not able to study the E-cad/hENT1 correlation with high statistical power. Overall,
further studies are warranted - both retrospective (using human tissue samples) and
prospective (conducting human clinical trials).
The study in Chapter 3 focuses on two key transporters of gemcitabine (hCNT1
and hENT1) and two prototypic Cxs (Cx32 and Cx43). Since Cxs can form hemichannels
at the cell surface as well as GJs at cell-cell contacts, these proteins are fundamental
determinants of preliminary response towards gemcitabine. With determinants of both
nucleoside analog transport into cells and transfer between cells, these candidates can
contribute to a meaningful biomarker index by compensating for inherent defects and
eliciting a bystander effect. The NT/Cx combination can perhaps provide more valuable
predictions than a single biomarker.

37
Similar to the previous study, there are more than 20 types of Cxs and not all are
characterized or well-understood in pancreatic cancer. However, one recent study
demonstrated the significant role of Cx26 in enhancing the gemcitabine bystander effect
in pancreatic cancer [174]. In addition to Cxs, the role of pannexins, a family of proteins
that form large transmembrane channels similar to GJs, has recently come under study in
relation to cancer [175, 176].
Overall, our studies in the innately DR-phenotype pancreatic cancer cell
population only focus on a few key determinants of gemcitabine. There are many other
kinases, replication repair enzymes, etc. that together control the chemosensitivity
process. Many of these candidates were profiled in Chapter 2, but not studied in-depth. It
is likely that the collective roles of all these players will provide a more significant effect
for overcoming chemoresistance than modulating only one determinant alone. In our
studies, we found transporters to play a dominant role, and so we focused on the uptake
aspect of gemcitabine efficacy. However, transporters are only the first rate-limiting step
in the gemcitabine activation process; dCK is also a rate-limiting step due to its exclusive
role in phosphorylating the gemcitabine prodrug. Currently, an increasing amount of
studies are identifying the key role of dCK in the nucleoside salvage process (e.g., in
lymphocyte development [177, 178], leukemia [179-185], and gynecological cancers
[186, 187]). Although alterations in dCK levels are not commonly seen in pancreatic
cancer, it may be a candidate to be further studied in detail.
The focus of the work in Chapter 4 is sensitizing pancreatic cancer cells to
gemcitabine by reverting stemness. This is a novel area in which we attempted to reduce
stemness in pancreatic tumors and force them to respond to chemotherapeutics. This

38
approach, epigenetic modification plus the use of current chemotherapeutics, is quickly
becoming of interest. In this study, we tested a drug candidate called DZNep. While this
drug is not perfect, it showed potential in reverting histone methylation exclusively in
cancer cells, increasing chemotherapeutic efficacy without compromising for toxicity. To
optimize this drug candidate, we identified the most favorable time, dose, and exposure
conditions. We found that priming the pancreatic cancer cells with DZNep for 8 h before
gemcitabine treatment resulted in the greatest efficacy. Subsequently, we devised novel
formulations to mimic this sequence of exposure and enhanced the delivery strategy to
administer both drugs together with different time points for release.
The global effects of DZNep constitute some of its major limitations. Both our
own studies as well as studies recently published implicate the possible role of DZNep on
early embryonic and neural progenitor cells [188-190], which is expected since advanced
cancers are a simple recapitulation of early embryonic development. Another study
demonstrated that DZNep produces developmental and neuronal disorders in a zebrafish
model (personal communications). To overcome these limitations, the subsequent
research objective is to optimize the applicability of these investigational histone
methylation reversal agents. One approach is to better understand the precise mechanisms
of action of DZNep. A current fellow graduate student is now following up on this work,
determining DZNep control of miRNAs. Preliminary results show that although DZNep
has an enormous effect on reprogramming miRNA transcripts and is likely to reprogram
other non-coding RNAs (e.g., lncRNA) as well as control determinants of
chemosensitivity. A second approach is to identify the precise effectors of DZNep and
design new molecules to target those effectors directly for only the intended benefits.
39
Another similar approach would be to synthesize novel DZNep analogs and test them in
experimental systems. Although it poses as a difficult challenge, identifying cellular
pathways unique to the carcinogenesis and tumorigenesis process but not to early
embryonic development would be another strategy. This would segregate the two
populations for exclusive drug targeting. Perhaps the most promising approach thus far is
the use a polymeric delivery system to target compounds directly to cancer cells.
Significant advances in this strategy have been made recently, and the precise delivery of
cytotoxic agents to cancer cells could very soon become a reality.
Our work in Chapter 5 was the first to identify SET overexpression in pancreatic
tumors; a recent independent study corroborated our results [191]. In-depth analyses
identified SET isoform 2 as the major form found at the cell surface, and that it facilitated
EMT through the switching of E-cad expression to N-cad. SET was also found to
promote metastasis, suggesting it can be utilized as a biomarker for early diagnosis or for
early prediction of metastasis. However, it is currently unclear when during the
tumorigenic process the switch in cadherins occurs. Nonetheless, since SET isoform 2 is
expressed at the cell surface, it could be an ideal candidate for easy drug targeting. If SET
can be successfully inhibited, there is potential for anti-metastatic intervention in patients.
Manipulation of SET in our studies revealed that the oncoprotein reprograms a
number of EMT genes (see details in Chapter 5). Therefore, it seems that SET could be a
master regulator of genes involved in EMT. Additional studies need to be completed in
order to identify exactly how SET regulates these genes. However, since the protein has
been identified as part of the inhibitor of histone acetyltransferase (INHAT) complex
[192], it is possible that it exerts a chromatin effect on these EMT genes. More studies are

40
required to understand this potential chromatin remodeling process. Furthermore, the role
of SET in directly determining chemosensitivity is not clear at this point. We only know
that it is involved in metastasis and the regulation of let-7 which influences
chemosensitivity [173]. Lastly, it may be possible that SET can be targeted by a different
set of chemotherapeutics, other than nucleoside analogs, to produce a therapeutic
response.
In summary, the scope of my work opens up both direct applicability (i.e., more
therapeutic and diagnostic avenues) as well as more basic questions (e.g., how SET
regulates genes). Although work up to the animal level (i.e., an orthotopic mouse model)
was completed, there remains a large translational barrier that can only be overcome by
further clinical studies. Overall, there remain several therapeutic challenges in
overcoming chemoresistance in pancreatic cancer. While this dissertation attempts to
examine the key characteristics of chemoresistance in three distinct tumor
subpopulations, there may be additional subpopulations that also exist and need
investigation. While the focus of this dissertation is on improving the gemcitabine
treatment of pancreatic cancer, results may extend to other cancers with similar cellular
and tumoral features and in which nucleoside analog therapy is used.

41
DRUG RESISTANT-PHENOTYPE CELLS AND CHEMOSENSITIVITY

42
CHAPTER 2
E-CADHERIN INCREASES CHEMOSENSITIVITY THROUGH HUMAN
EQUILIBRATIVE NUCLEOSIDE TRANSPORTER 1 (HENT1) ACTIVITY AND
STABILIZATION 2
2 SW Hung, YD Bhutia, K Naidu, B Patel, and R Govindarajan. To be submitted to Biochemical Journal.

43
Abstract
E-cadherin (E-cad), a cell-cell adhesion molecule expressed in well-differentiated
epithelial cells, was shown to increase the cytotoxic response of gemcitabine (2’,2’-
difluoro-2’-deoxycytidine). Since the precise mechanisms of this response are unclear,
we hypothesized that E-cad acts on the gemcitabine activation pathway to improve
chemosensitivity. To address this, we analyzed changes in expression of gemcitabine
transporters, gemcitabine phosphorylating and metabolizing enzymes, and other DNA
replication and repair enzymes that affect gemcitabine cytotoxicity in pancreatic cancer
cells. Retroviral expression of human E-cad into MIA PaCa-2, a poorly-differentiated, E-
cad-null pancreatic cancer cell line, showed maximal increase in human equilibrative
nucleoside transporter 1 (hENT1) protein compared with the other players studied.
Consistently, E-cad expression steeply augmented hENT1-mediated 3H-gemcitabine
cellular transport and cytotoxicity, which were ablated by pharmacological inhibition of
hENT1 activity. Further mechanistic studies in A431D, a cadherin-null skin carcinoma
cell line, showed that the increase in hENT1 transport activity was due to increased total
cell hENT1 content as well as cell surface hENT1 expression and decreased protein
degradation. These results suggest that E-cad enhancement of gemcitabine efficacy
occurs at least in part through increased hENT1 expression, stability, and activity, leading
to increased cellular transport and cytotoxicity of gemcitabine. These data demonstrate
that E-cad may be a prospective biomarker for guiding nucleoside analog treatment in
pancreatic cancer patients.

44
Introduction
Cadherins are homophilic, calcium-dependent transmembrane proteins vital for
cell-cell adhesion, cellular morphology, and cell-cell recognition events. Of all cadherins,
epithelial cadherin (E-cadherin or E-cad) has received the greatest attention over the
years as its expression is often diminished or lost in cancer cells leading to cell
dedifferentiation, epithelial-to-mesenchymal transition (EMT), and cell migration.
Currently, a large body of evidence in literature demonstrates E-cad as a suppressor of
EMT and metastasis and therefore a potential biomarker for the progression of cancer. In
addition to these well-established roles, E-cad has also been shown to influence
chemosensitization of cancer cells. Decreased E-cad expression is associated with poorer
survival in several cancer types. As shown in pancreatic, breast, colon, and prostate
cancer cell lines, this strong association occurs mainly via decreased sensitivity to
chemotherapeutic agents [193-200]. On the other hand, overexpression or endogenous
stimulation of E-cad expression has been shown to improve the chemosensitivity of anti-
cancer agents including platinum drugs (e.g. cisplatin, oxaliplatin) [194, 200, 201],
taxanes (e.g. paclitaxel, docetaxel) [200], and anthracyclines (e.g. doxorubicin,
epirubicin) [200]. Naturally occurring cancer chemopreventive agents such as 3,3’-
diindolylmethane (DIM), isoflavone, and retinoic acid [195, 202] have also been shown
to improve E-cad expression, whereas several molecularly-targeted anti-cancer
therapeutic agents have been shown to mediate its effects, at least partially, by increased
E-cad expression. The latter group include epithelial growth factor receptor (EGFR)
inhibitors (e.g. cetuximab, sulindac sulfide, erlotinib) [197, 203-205], peroxisome
proliferator-activated receptor-γ (PPAR-γ) activators (e.g. thiazolidinediones, ciglitazone)

45
[204], Hedgehog inhibitors (cyclopamine) [206], and topoisomerase II inhibitors
(etoposide) [207]. While it is likely that E-cad’s effect on cellular genes and signaling
networks associated with growth, proliferation, and differentiation (MAPK,
PTEN/PI3K/Akt, Src, p53) [208-214] could enhance anti-cancer efficacy of
chemotherapeutics, revealing the precise mechanisms by which E-cad improves
chemosensitivity has proven to be difficult.
Recently, several reports have shown E-cad to potentiate the efficacy of a
synthetic nucleoside analog 2’,2’-difluoro-2’-deoxycytidine (gemcitabine; dFdC) used in
first-line treatment of pancreatic cancer [215, 216]. Although the relationship between E-
cad expression and gemcitabine chemosensitivity in pancreatic cancer cells has been
compelling [193-198], the mechanisms linking the two have not yet been understood.
Identifying such mechanisms could facilitate further improvement in chemo- or
radiosensitization of pancreatic cancer cells or guide treatment by way of selection of
patient groups and specific nucleoside analogs used in treatment (gemcitabine,
troxacitabine, capecitabine etc.). Gemcitabine is a hydrophilic pro-drug that enters the
cell via five primary nucleoside transporters: the Na+-independent human equilibrative
nucleoside transporters (hENT1-3) and the Na+-dependent human concentrative
nucleoside transporters (hCNT1 and hCNT3). Once inside the cell, gemcitabine is
activated upon rate-limiting phosphorylation by deoxycytidine kinase (dCK).
Nonetheless, intracellular gemcitabine can also be deactivated into harmless compounds
by cytidine deaminase (CDA). Further along, the active forms of gemcitabine can either
halt DNA replication directly by incorporation into DNA or inhibit ribonucleotide
reductase subunits M1 (RRM1) and M2 (RRM2) essential for the synthesis and

46
maintenance of deoxyribonucleotide pools. Inhibition of these two enzymes, critical for
DNA synthesis and repair, also contributes to suppression of cancer cell proliferation
[216-218]. We hypothesized that E-cad may increase chemosensitivity of nucleoside
analogs in cancer cells through potentiating drug activation mechanisms by affecting one
or more of the aforementioned players of gemcitabine transport, phosphorylation, and
catabolism. Here we demonstrate that E-cad enhances gemcitabine efficacy in pancreatic
cancer cells primarily through increasing hENT1 expression and activity, leading to
increased cellular transport of gemcitabine and cytotoxicity. Further our data support that
signaling through cell adhesion molecules can induce and recruit drug transport proteins
to the cell surface in order to increase nucleoside drug sensitivity.
Materials and Methods
Materials. Gemcitabine, 3H-gemcitabine,
3H-adenosine, and
3H-thymidine were
obtained from Chemie Tek (Indianapolis, IN), while 35
S-labeled L-methionine was
obtained from Moravek Radiochemicals (Brea, CA). FBS was acquired from PAA
Laboratories Inc. (Etobicoke, Ontario). Uridine, DAPI, DMSO, nitrobenzyl
mercaptopurine riboside (NBMPR), and 3-(4,5-dimethylthiazol-2-yl)-2,5-
diphenyltetrazolium bromide (MTT) were obtained from Sigma-Aldrich (St. Louis, MO).
The bicinchoninic acid (BCA) protein assay reagent was from Pierce Chemical
(Rockford, IL). The fluorescent anti-fade mounting reagent was obtained from Molecular
Probes (Invitrogen). All plastic wares for cell culture were obtained from Corning
(Corning, NY).

47
Cell Culture. All cell lines were obtained and cultured as previously described
[219]. The A431D and A431DE cell lines were kindly provided by Dr. Parmender Mehta
at the University of Nebraska Medical Center (Omaha, NE), maintained in DMEM
supplemented with 10% FBS, 100 units of penicillin/ml, and 2 µg streptomycin/ml
(Sigma-Aldrich), and subcultured at a 1:4 ratio.
Retroviral Expressions in Cell Lines. The retroviral expression of E-cadherin in
the MIA PaCa-2 cell line was conducted with the expression vector (LZBOB-pac-E-cad),
a kind gift from Dr. Keith Johnson at the University of Nebraska Medical Center. Control
and E-cadherin-harboring retroviruses were generated as described previously [220], and
MIA PaCa-2 cells were infected. Clones expressing E-cad were selected with and
maintained in 5 and 2.5 µg/ml of puromycin, respectively.
Western Blotting. Western blotting was conducted as previously described [219].
The monoclonal E-cad G10 (mouse), polyclonal hENT1 N-12 (goat), polyclonal hCNT1
H-70 (rabbit), polyclonal dCK L-19 (goat), and polyclonal RRM1 T-16 (goat) and RRM2
E-16 (goat) anti-human antibodies used were obtained from Santa Cruz Biotechnology
(Santa Cruz, CA). The polyclonal rabbit anti-human CDA antibody was from Abcam
(Cambridge, MA). The polyclonal rabbit anti-human Na+/K
+-ATPase antibody was from
Cell Signaling Technology (Danvers, MA). The monoclonal mouse β-actin antibody was
from Sigma-Aldrich. All secondary antibodies were purchased from Bethyl Laboratories
(Montgomery, TX).
MTT Cytotoxicity Assay. The MTT assays were performed as described earlier
[219]. Cytotoxic IC50 values were calculated using GraphPad Prism 5 software.

48
3H-Nucleoside Transport Study. Cells were seeded in 24-well culture plates
(5x10⁴ cells/well) and cultured until cells reached 90-95% confluency. After aspirating
the media, cells were incubated with Na+-free buffer [221] containing 0.02 µM of the
3H-
nucleoside in the presence or absence of 10 nM NBMPR. Diffusional uptake was
measure in the presence of 10 µM NBMPR and 20 mM uridine. Transport was arrested
by immediately washing the cells with Na+-free buffer containing 20 mM cold uridine.
Cells were then lysed with 500 µL of 1% SDS and agitated in a cell shaker for 30 min.
Each well’s lysate was added to 5 mL of ScintiSafe Econo 1 (Fisher Scientific). The
mixture was vortexed and counted using an LS 6500 Multipurpose Scintillation Counter.
An additional well for each cell type was cultured in parallel and subjected to protein
estimation.
Real-time PCR. Real-time PCR methods were performed as described earlier
[219]. Validated TaqMan primers and probes for hENT1 (Hs00191940_m1), hENT2
(Hs00155426_m1), hENT3 (Hs00983219_m1), hCNT1 (Hs00188418_m1), hCNT3
(Hs00223220_m1), RRM1 (Hs01040698_m1), RRM2 (Hs01072069_m1), CDA
(Hs001560401_m1), dCK (Hs001040726_m1), and human GusB (internal control)
(Hs9999908_m1) were used (Applied Biosystems, Foster City, CA).
35S-Labeled Pulse-Chase Assay. The experiments were performed as described
earlier [220], and hENT1 immunoprecipitation was performed using a rabbit anti-hENT1
antibody from Dr. Chung-Ming Tse at the Johns Hopkins School of Medicine (Baltimore,
MD) [221].
Cell Surface Protein Isolation. Isolation of the cell surface fraction of proteins
was conducted using the Pierce® Cell Surface Protein Isolation Kit (Thermo Scientific,

49
Waltham, MA) as per the manufacturer’s instructions. Briefly, cells were washed twice
with ice-cold PBS and subsequently biotinylated with 0.25 mg/ml Sulfo-NHS-SS-Biotin
for 30 minutes on an orbital shaker at 4°C. The reaction was quenched, and cells were
collected by scraping followed by centrifugation. Cells were lysed with 500 µl of Lysis
Buffer containing a protease inhibitor cocktail (Roche) for 30 minutes on ice with
intermittent homogenization using a 23G needle and syringe. A sample of the total lysate
was retained for analysis of total proteins. The biotinylated proteins were then bound to
immobilized streptavidin-agarose beads (NeutrAvidin Agarose slurry) by a one-hour
incubation at room temperature using an end-over-end rotator. The unbound proteins
were then collected by centrifugation of the column at 1,000 x g for 2 minutes and
retained for analysis of intracellular proteins. The biotinylated proteins were eluted form
the beads using SDS-PAGE buffer containing 50 mM DTT. The collected samples were
then separated on SDS-PAGE for immunoblot analysis.
Immunocytochemical Analysis. Immunostaining analysis was conducted as
previously described [219] using the aforementioned antibodies. Immunostained cells
were viewed with a Nikon Eclipse Ti fluorescence microscope and analyzed using NIS-
Elements AR 3.0 software.
Statistical Analysis. All experiments were performed in triplicate and repeated at
least three times. Statistical significance was identified using the Student’s t test with
*p<0.05 and **p<0.01.
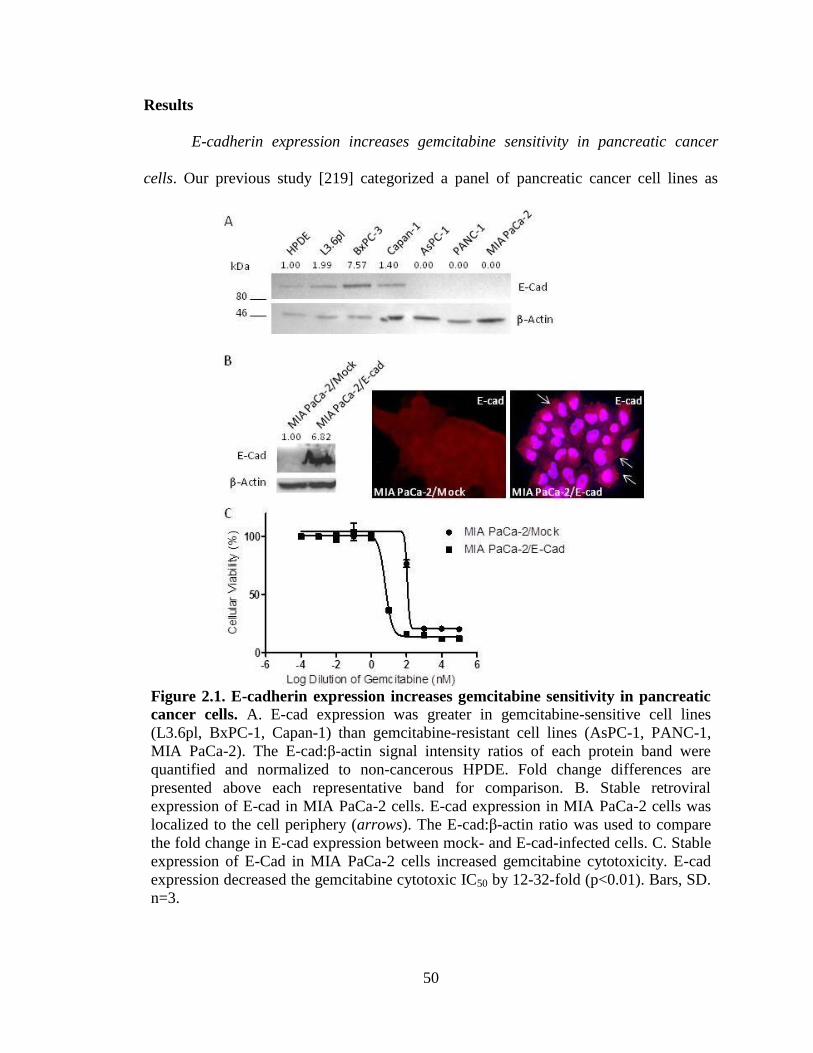
50
Results
E-cadherin expression increases gemcitabine sensitivity in pancreatic cancer
cells. Our previous study [219] categorized a panel of pancreatic cancer cell lines as
Figure 2.1. E-cadherin expression increases gemcitabine sensitivity in pancreatic
cancer cells. A. E-cad expression was greater in gemcitabine-sensitive cell lines
(L3.6pl, BxPC-1, Capan-1) than gemcitabine-resistant cell lines (AsPC-1, PANC-1,
MIA PaCa-2). The E-cad:β-actin signal intensity ratios of each protein band were
quantified and normalized to non-cancerous HPDE. Fold change differences are
presented above each representative band for comparison. B. Stable retroviral
expression of E-cad in MIA PaCa-2 cells. E-cad expression in MIA PaCa-2 cells was
localized to the cell periphery (arrows). The E-cad:β-actin ratio was used to compare
the fold change in E-cad expression between mock- and E-cad-infected cells. C. Stable
expression of E-Cad in MIA PaCa-2 cells increased gemcitabine cytotoxicity. E-cad
expression decreased the gemcitabine cytotoxic IC50 by 12-32-fold (p<0.01). Bars, SD.
n=3.

51
gemcitabine-sensitive (L3.6pl, BxPC-3, Capan-1) or -resistant (AsPC-1, PANC-1, MIA
PaCa-2). E-cad protein expression levels were found to correlate with the cell lines’
gemcitabine responsiveness (Fig. 2.1A), prompting us to investigate whether forced
overexpression of E-cad in gemcitabine-resistant cell lines would significantly improve
gemcitabine sensitivity. We chose the PANC-1 and MIA PaCa-2 cell lines since they are
highly resistant to gemcitabine (IC50s >10 μM). Furthermore, PANC-1 expresses low
levels of endogenous E-cad, while MIA PaCa-2 has undetectable levels of the cadherin
via Western blotting. Stable retroviral gene transfer of E-cad in PANC-1 and MIA PaCa-
2 cells showed increased expression of E-cad protein as judged by Western blotting
analysis. Further, E-cad was localized to the cell periphery in both cell lines as
determined by immunocytochemical analysis. Data for MIA PaCa-2 were shown in Fig.
2.1B. MTT cytotoxicity analyses indicated that unlike control cells, PANC-1/E-cad and
MIA PaCa-2/E-cad exhibited profound increases in gemcitabine sensitivity (PANC-1 ~4-
8-fold and MIA PaCa-2 ~12-32-fold decrease in IC50) (Fig. 2.1C). These results
demonstrate that exogenous E-cad expression can vastly increase gemcitabine sensitivity
in normally resistant cells.
E-cadherin increases hENT1 expression and transport activity to influence
gemcitabine sensitivity. In order to determine the mechanistic rationale for how E-cad
expression increases gemcitabine sensitivity, the influence of E-cad expression on
various players of gemcitabine transport, phosphorylation (activation), and catabolism
was examined. By Western blotting, it was found that E-cad expression in the drug-
resistant MIA PaCa-2 increased hENT1 levels the greatest (8.18-fold) followed by RRM2
(7.45-fold), dCK (6.94-fold), and CDA (1.82-fold); hCNT1 and RRM1 expressions

52
Figure 2.2. MIA PaCa-2/E-cad showed an increase in hENT1 expression,
transport, and –dependent gemcitabine cytotoxicity. A. Compared with mock-
infected MIA PaCa-2, MIA PaCa-2/E-cad displayed the highest fold increase in
hENT1 protein expression followed by RRM2, dCK, and CDA. The mock to E-cad
fold changes averaged from three independent experiments are presented above each
representative band for comparison. B. MIA PaCa-2/E-cad displayed a moderate but
significant increase in hENT1 mRNA levels (~2.5-fold). Changes in the other
candidate genes are also shown. C. MIA PaCa-2/E-cad increased hENT1-mediated 3H-
pyrimidine cellular transport. MIA PaCa-2/E-cad cells steeply augmented 3H-
gemcitabine and 3H-thymidine cellular transport by hENT1 by 13-fold and 2-fold,
respectively, compared with MIA PaCa-2/Mock. D. Pharmacological inhibition of
hENT1 significantly reduced gemcitabine cytotoxicity in MIA PaCa-2/E-cad.
Treatment of MIA PaCa-2/E-cad cells with 10 nM NBMPR, a selective inhibitor of
hENT1, for 72 h reduced gemcitabine cytotoxicity by 5-27-fold (p<0.05). MIA PaCa-
2/Mock treated with 10 nM NBMPR or vehicle alone are shown as controls. Bars, SD.
n=3. *p<0.05, **p<0.01.

53
decreased (0.61- and 0.15-fold, respectively) (Fig. 2.2A). Further investigation into the
transcriptional levels of each gemcitabine candidate revealed significantly increased
levels of hENT1 mRNA by approximately 2.5-fold (Fig. 2.2B). Significant changes in
transcript levels were also noticed for hENT3 (1.926-fold; p<0.05), hCNT1 (0.455-fold;
p<0.01), dCK (2.390-fold; p<0.05), and RRM1 (2.098-fold; p<0.05) (Fig. 2.2B). The
transport activity of hENT1 was also increased with E-cad expression in MIA PaCa-2 as
3H-gemcitabine and
3H-thymidine cellular transport augmented by approximately 13-fold
and 2-fold, respectively, after 10 min (p<0.01) (Fig. 2.2C). Similar results were found
with 3H-adenosine uptake (~7-fold increase at 10 min; data not shown). Furthermore,
pharmacological inhibition of hENT1 transport activity with 10 nM
nitrobenzylthioinosine (NBMPR), a selective inhibitor of hENT1, abrogated the E-
cadherin-mediated increase in gemcitabine sensitivity. In MIA PaCa-2/E-cad cells,
gemcitabine IC50 was reduced by 5-27-fold (p<0.05) (Fig. 2.2D). MIA PaCa-2/Mock
treated with 10 nM NBMPR or vehicle alone were used as controls. While we cannot
disregard the effects of E-cad expression on several of the other gemcitabine players, the
data suggest that E-cad enhances gemcitabine sensitivity partly through increasing
hENT1 expression and activity, leading to increased cellular transport of gemcitabine
and, ultimately, cytotoxicity.
E-cadherin increases hENT1 expression, function, and stabilization. In order to
investigate the mechanisms by which E-cad expression increases hENT1 activity, we
used a variant of a skin carcinoma cell line, A431D, and a subclone which exogenously
expresses only E-cadherin, A431DE. Using this cadherin-null model system, we found
that E-cad augments, but is not an absolute requirement for, hENT1 expression. While

54
Figure 2.3. Expression of E-cadherin increased hENT1 expression, function, and
stabilization in a clean cadherin model cell line. A. E-cad expression augmented, but
was not an absolute requirement for, hENT1 expression. While hENT1 protein was
present in the cadherin-null A431D cells, its expression was further increased in the E-
cad-expressing A431DE cells. Densitometry fold change differences are presented
above each representative band for comparison. B. A431DE cells had increased total
uptake as well as uptake by hENT1 of gemcitabine, thymidine, and adenosine
compared with A431D cells. In particular, hENT1 uptake of gemcitabine increased
over 18-fold with expression of E-cad. C. E-cad expression (red) led to greater hENT1
(green) expression in the cell, and particularly, at the cell surface. The two proteins co-
localized at the cell surface (yellow). D. E-cad expression increased hENT1 stability at
the cell surface and decreased hENT1 turnover compared with A431D cells. The rate
of degradation of radiolabeled hENT1 was highly decreased in cells expressing E-cad.

55
hENT1 protein was expressed in the cadherin-null A431D cells, its expression was
increased with E-cad in the A431DE cells (Fig. 2.3A). E-cad expression also increased
total uptake as well as uptake by hENT1 of radiolabeled gemcitabine, thymidine, and
adenosine compared with A431D cells (Fig. 2.3B). In particular, uptake by hENT1
increased transport by approximately 19-, 2-, and 3-folds, respectively (Fig. 2.3B). By
immunocytochemistry, we confirmed that E-cad (red) was not an absolute requirement
for the cell surface expression of hENT1 (green), but rather augmented both total cellular
expression levels as well as cell surface expression levels of the transporter (Fig. 2.3C).
In A431D cells, hENT1 is predominantly cytoplasmic; with E-cad expression, greater
membrane staining of hENT1 is evident, and the immunoreactivities of these two
proteins overlapped at the cell surface (yellow) (Fig. 2.3C). Seeing that hENT1 staining
was brighter in A431DE cells compared with A431D, we hypothesized that E-cad may
increase the steady-state levels of the transporter either by increasing protein expression
or decreasing protein turnover. Since hENT1 is expressed by the CMV promoter, the
possibility of alterations in protein synthesis was unlikely, and we focused on changes in
hENT1 degradation. Testing this hypothesis, we found that E-cad expression stabilized
hENT1 at the cell surface and decreased its turnover. With E-cad expression, the rate of
degradation of hENT1 decreased compared with A431D cells. At 14 hours, the
approximate half-life of hENT1 [222], nearly 30% of the radiolabeled hENT1 population
was degraded in the A431D cells, while only about 80% was degraded in A431DE cells
(Fig. 2.3D).

56
Discussion
E-cadherin is a cell-cell adhesion molecule that is highly expressed in well-
differentiated epithelial cells. It has been highly implicated as a suppressor of EMT and
metastasis, a potential biomarker for the progression of cancer, and a key factor in the
chemosensitization of cancer cells. However, it has yet to be revealed the precise
mechanisms by which E-cad improves chemosensitivity. While we and others [193-198]
have found the relationship between E-cad expression and gemcitabine cytotoxicity, the
precise mechanisms linking the two remain unclear. Therefore, this study attempts to
determine the mechanisms behind E-cad’s influence on gemcitabine efficacy.
Since E-cad expression was found to enhance the cytotoxic response of two
poorly-differentiated, drug-resistant pancreatic cancer cell lines to gemcitabine, we
hypothesized that E-cad acted on the gemcitabine activation pathway to improve
chemosensitivity. Stable expression of E-cad in the E-cad-null MIA PaCa-2 pancreatic
cancer cell line identified hENT1 as a key player altered by E-cad expression. Both
transcriptional and post-translational increases in hENT1 expression were found. Other
genes that were modulated by E-cad and may have an effect on gemcitabine sensitivity
included hCNT3, dCK, CDA, RRM1, and RRM2. Further studies are needed to identify
whether these additional candidates, as well as other transporters that may be involved or
affected, play a significant role in E-cad-mediated gemcitabine efficacy. hENT1 activity
was also increased with E-cad expression, further supporting the functional involvement
of the transporter in conferring chemosensitivity in MIA PaCa-2. Interestingly, hENT1
uptake of radiolabeled gemcitabine was much greater than that of radiolabeled thymidine.
That is, a moderate increase in protein expression led to a >18-fold increase in

57
gemcitabine uptake. To explain, previous reports have noted hENT1’s high affinity for
gemcitabine (Km = 160 μM) [223, 224] and lower affinity for thymidine (Km = 240 μM)
[225]. While this property may contribute to the difference in substrate uptake, it may
also be possible that expression of E-cad can change the parameters of the hENT1,
although further studies are warranted.
Further mechanistic studies in a cadherin-null cell line, A431D, revealed that the
increase in hENT1 transport activity was due to increased total cell hENT1 content as
well as cell surface hENT1 expression concomitant to decreased protein degradation. It
was also found that E-cadherin was not an absolute requirement for either hENT1
expression in general or hENT1 expression at the cell surface; instead, the cadherin
simply augmented both those aspects. At this point, it remains unclear whether E-cad
expression directly increases the recruitment, trafficking, and basolateral membrane
insertion of hENT1. It is also unknown whether the lysosomal or proteasomal
degradation pathway is inhibited via E-cad, although Nivillac et al. has shown the
predominant involvement of lysosomes in normal hENT1 degradation [222].
Furthermore, whether E-cad prevents global turnover of membrane proteins needs to be
investigated. For example, proteasomal inhibitors, such as the ground-breaking
Bortezomib, are currently used in clinics [226-228], and lysosomal inhibitors are
becoming increasingly under study as anticancer agents [229-231].
This study suggests that E-cad enhancement of gemcitabine efficacy occurs at
least in part through increased hENT1 expression, stability, and activity, leading to
increased cellular transport and cytotoxicity of gemcitabine. While hENT1 is already
employed as a biomarker for staging of differentiation and prediction of patient survival

58
[10-14], E-cad can be used as a surrogate marker or as part of a biomarker index to
indicate preliminary patient response to nucleoside analog therapeutics, guiding
subsequent treatment and avoiding unnecessary nucleoside analog toxicities. E-cad could
also be used for drug targeting. Small molecule agents that can directly or indirectly
induce E-cad expression could be therapeutically beneficial. For example, since E-cad is
epigenetically silenced in pancreatic cancer, 5-aza-dC, a DNA methylation inhibitor, has
been found to increase E-cad expression and even synergize with gemcitabine [126, 129,
232-238], suggesting that 5-aza-dC action may in part be mediated through hENT1 as
found in this study.
In a pancreatic cancer system, numerous cadherins are expressed. Currently, most
of their roles in conferring chemoresistance remain unknown, and it is possible that they
are able to compensate for the loss of E-cad. It is also unknown whether N-cadherin,
which is highly implicated in EMT and metastasis, plays an opposing role in hENT1-
mediated gemcitabine efficacy. Likewise, there are numerous transporters involved in
gemcitabine uptake. In addition to hENT1, we identified significant changes in hENT3
and hCNT1 transcript levels with E-cad expression. In a previous study, we found that
hCNT1 correlates with differentiation and influences chemosensitivity [9]. Nonetheless,
this study demonstrates that a cell adhesion molecule can induce transcription and
stabilize proteins at the cell surface in order to improve chemotherapeutic drug
sensitivity.

59
CHAPTER 3
CO-EXPRESSION OF HCNT1 WITH CX32 INCREASES NUCLEOSIDE ANALOG
TRANSPORT 3
3 SW Hung, K Proctor, M Krentz, H Lee, D Lovin, and R Govindarajan. To be submitted to Experimental
Cell Research.

60
Abstract
Gemcitabine is a pyrimidine analog drug commonly used for the
chemotherapeutic treatment of cancer. Due to its hydrophilicity, gemcitabine requires
nucleoside transporters (NTs) for its movement across the cell membrane and entry into
the cell. Gap junctions (GJs), composed of channel proteins called connexins (Cxs), have
the ability to potentiate gemcitabine action by transferring the chemotherapeutic agent
between normal and cancer cells, leading to a phenomenon known as the bystander
effect. In order to identify the roles and interplay of NTs and GJs in affecting the
distribution and efficacy of gemcitabine, we studied the contributions of each human
equilibrative nucleoside transporter 1 (hENT1), human concentrative nucleoside
transporter 1 (hCNT1), connexin 32 (Cx32), and connexin 43 (Cx43) both individually
and in combinations. Using polarized MDCK cells as a model system, we found that
Cx32 operated in concert with hCNT1 to increase nucleoside uptake, while Cx43 with
hENT1 decreased both. To relate this to pancreatic cancer, we found hENT1 and Cx43 to
be overexpressed in a panel of pancreatic cancer cell lines known to be more
chemoresistant than the normal pancreatic cell line. From these data, a working model for
the intra- and intercellular transport of nucleosides in cancer chemotherapy was
developed and the NT-GJ interplay in pancreatic cancer cells predicted. This study delves
into the mechanism of action of nucleoside-analog chemotherapeutics as well as explores
the potential for improvements in drug action.

61
Introduction
Nucleoside transporters (NTs), a family of transmembrane proteins at the cell
surface, have diverse functions in the cell including carrying nucleoside substrates for
nucleic acid synthesis [239]. Depending on the type of NT, they are also responsible for
the movement of nucleoside-analog chemotherapeutic drugs in and out of cells. Two
classes of NTs have been identified: the human equilibrative nucleoside transporters
(hENTs; SLC29) and the human concentrative nucleoside transporters (hCNTs; SLC28).
hENTs operate bidirectionally and independent of Na+, while hCNTs operate
unidirectionally and dependent of Na+. The hENT family consists of 4 members (hENT1-
4), and the hCNT family consists of 3 members (hCNT1-3). For gemcitabine, a standard
chemotherapeutic of choice for pancreatic cancer, hENT1 and hCNT1 are the two most
efficient transporters. Since nucleoside analog drugs are hydrophilic and rely on NTs for
entry into cells, the transporters determine the drug’s selectivity, directionality, and rate
of transport across the lipid bilayer [239].
Gap junctions (GJs) are the only intercellular channels that connect the
cytoplasms of adjacent cells, allowing for the free passage of ions and small molecules
between cells, including nucleosides and their analogs. GJs are composed of an
assemblage of channel proteins, called connexins (Cxs), at the cell membrane and enable
direct cell-cell communication [240]. Cxs can also assemble into large pore complexes at
the cell surface, called hemichannels. The type of Cx confers certain properties to the GJ
or hemichannel; for example, it has been recently shown that connexins 32 (Cx32) and 43
(Cx43) demonstrate permselectivity of adenosine (a nucleoside) and ATP (a nucleotide),
respectively [241].

62
With the transport of nucleoside analog drugs into and between cells, there holds
the potential for increasing cytotoxicity within a heterogeneous tumor cell population, a
phenomenon termed as the “bystander effect.” The bystander effect (BE) was originally
established in conjunction with prodrug-activating systems in suicide gene therapy [242,
243]. A BE occurs when a prodrug not only kills the tumor cells in which it has entered,
but also neighboring tumor cells which did not directly take up the drug. In the case of
gene therapy, this powerful event has been shown to produce therapeutically significant
results with even only 1-2% of cells genetically modified [244]. In general, cell-cell
contacts are not required for the BE to occur either in vitro or in vivo. However, purine
and pyrimidine nucleosides and their metabolites are unable to passively diffuse across
cell membranes, so cell-cell connections, specifically gap junctions, are required to elicit
a BE. It has also been shown that pharmacological manipulation of gap junction
expression and communication may be used to alter the BE [245]. Although there seems
to be potential for eliciting a BE with nucleoside analog drug therapy, the precise roles of
NTs and GJs and their interplay in determining cellular chemosensitivity remain to be
elucidated.
With 7 different types of NTs and over 20 types of connexins, the functions and
expressions of each varies between normal and cancerous cells as well as within a range
of cancer stages, leading to complex heterogeneity. Currently, it is known that hENT
expressions increase with a variety of cancers, including gynecological carcinomas
(ovarian, uterine, cervix, and endometrial [246]) and mantle cell lymphoma [247] among
several others. Their expressions have also been found to correlate with gemcitabine
sensitivity and patient survival [247], particularly in pancreatic cancer [14, 248]. Contrary

63
to hENTs, hCNT expressions are decreased in several cancers [246]. For example,
hCNT1 transcript and protein levels are significantly decreased in both pancreatic cancer
cell lines as well as matched pair tissue samples as shown in our recently published paper
[9]. Earlier work conducted by Dr. Govindarajan using a spontaneous epithelial-to-
mesenchymal transition (EMT) model (i.e., rat liver cells), showed that while Cx43
protein is expressed equally in both early and late stage EMT, the GJ protein was
completely internalized during the late stage [249]. These results suggest the inactivation
of Cx43 GJs in metastatic cancer cells that have undergone EMT.
In this study, we identified the roles and interplay of NTs and GJs in affecting the
distribution and efficacy of the nucleoside analog drug, gemcitabine. We studied the
contributions of hENT1 and hCNT1 because they are known to be the most efficient
transporters of gemcitabine. We also chose to study Cx32 and Cx43 since Cx32 can
transport gemcitabine in its inactive nucleoside form, and Cx43 can transport
gemcitabine-triphosphate in its active nucleotide form. We hypothesized that the
manipulation of these naturally occurring cellular channels and transporters will increase
nucleoside drug concentrations in heterogeneous tumor cell populations, resulting in
greater chemotherapeutic efficacy. By expressing these proteins both individually and in
combinations, we hoped to better understand the mechanism of action of nucleoside
analog chemotherapeutics as well as explore the potential for improvements in drug
action.

64
Materials and Methods
Materials. Gemcitabine and 3H-thymidine were obtained from Chemie Tek
(Indianapolis, IN). FBS was acquired from PAA Laboratories Inc. (Etobicoke, Ontario).
Uridine, DAPI, DMSO, nitrobenzyl mercaptopurine riboside (NBMPR), and 3-(4,5-
dimethylthiazol-2-yl)-2,5-diphenyltetrazolium bromide (MTT) were obtained from
Sigma-Aldrich (St. Louis, MO). All secondary antibodies were purchased from Bethyl
(Montgomery, TX). The bicinchoninic acid (BCA) protein assay reagent was from Pierce
Chemical (Rockford, IL). The fluorescent anti-fade mounting reagent and Vybrant
DyeCycle green were both obtained from Molecular Probes (Invitrogen). All plastic
wares for cell culture were obtained from Corning, NY.
Cell Culture. MDCK and all pancreatic cell lines were obtained and cultured as
previously described [9, 190]. HPAF-II was kindly provided by Dr. Parmender Mehta of
the University of Nebraska Medical Center (Omaha, NE), grown and maintained in MEM
supplemented with 10% FBS, and subcultured at a 1:4 ratio.
Expression of Nucleoside Transporters and Connexins in MDCK. Cells stably
expressing each NT or Cx or both were generated by retroviral transduction of respective
cDNAs [9]. Multiple clones expressing the desired protein(s) were selected with and
maintained in 800 and 200 µg/ml of G418 antibiotic, respectively. Final clones for
subsequent experiments were determined based on a preliminary functional transport
assay (hENT1 Cl-2, hCNT1 Cl-3, Cx32 Cl-4, and Cx43 Cl-4 were chosen; data not
shown).
Immunocytochemical Analysis. Immunostaining was conducted as previously
described [9]. Antibodies were the same as those used for Western blotting with the

65
exception of anti-hENT1 (rabbit) which was a kind donation from Dr. Chung-Ming Tse
of the Johns Hopkins University School of Medicine (Baltimore, MD). Immunostained
cells were viewed with a Nikon TM Eclipse fluorescence microscope and analyzed using
Nikon TiE software.
Western Blotting. Western blotting was conducted as previously described [9].
Anti-human Cx43 (rabbit), anti-hENT1 (goat), and anti-hCNT1 (rabbit) antibodies were
used (Santa Cruz Biotechnology; Santa Cruz, CA). The anti-human Cx32 (mouse)
antibody was a generous gift from Dr. Mehta. The monoclonal mouse anti-human β-actin
antibody was from Sigma-Aldrich.
MTT Cytotoxicity Assay. The MTT assays were performed as described earlier
[9]. Briefly, 1x10³ cells/well in a 96-well plate were treated 36 h after seeding with
increasing concentrations of gemcitabine (0.1 nM-100 μM). After 72 h, the percent viable
cells were quantified using an MTT assay. Cytotoxic IC50 values were calculated using
GraphPad Prism 5 software.
3H-Nucleoside Transport Study. The transport assays were performed as
previously described [221]. Briefly, cells were seeded in 24-well culture plates (5x10⁴
cells/well) and cultured until cells reached 90-95% confluency. After aspirating the
media, cells were incubated with sodium buffer (pH 7.4) [221] containing 0.02 µM of 3H-
thymidine in the presence or absence of 10 nM NBMPR. Diffusional uptake was measure
in the presence of 10 µM NBMPR and 20 mM uridine. After 5 min, permeant fluxes
were terminated using 20 mM cold uridine. Cells were then lysed with 1% SDS and
agitated in a cell shaker for 30 min. Each well’s lysate was added to 5 mL of ScintiSafe
Econo 1 (Fisher Scientific). The mixture was vortexed and counted using an LS 6500

66
Multipurpose Scintillation Counter. A parallel cultured well was subjected for protein
estimation.
Statistical Analysis. All experiments were performed in triplicate and repeated at
least three times. Statistical significance was identified using the Student’s t test with
*p<0.05 and **p<0.01.
Results
Stable expression of NTs or Cxs in MDCK cells increased total 3H-thymidine
cellular transport and gemcitabine cytotoxicity. Using retroviral infection, we created
NT- and Cx-null MDCK cells stably expressing only hENT1, hCNT1, Cx32, or Cx43.
Expression of the desired protein was confirmed using immunocytochemistry. hENT1
was seen at the basolateral membrane, hCNT1 at the apical membrane, and the Cxs at the
cell-to-cell contacts (Fig. 3.1A). None of the four proteins were seen in the control
MDCK cells (Fig. 3.1A).
Function of the expressed proteins was validated using a radiolabeled transport
assay. 3H-thymidine uptake was found to be significantly increased in the cells
expressing hENT1, hCNT1, Cx32, or Cx43 compared with control (Fig. 3.1B). As
expected, hCNT1 expression led to the greatest nucleoside uptake, followed by hENT1,
Cx43, and Cx32, correspondingly (Fig. 3.1B). As a consequence of this increase, MDCK
cells with hENT1 or hCNT1 expression also had greater sensitivity towards gemcitabine
(Fig. 3.1C). The cytotoxic IC50 values of the NT-expressing cells were 5-6-fold less than
the control cells (Fig. 3.1C).

67
Figure 3.1. Stable expression of NTs and Cxs in MDCK cells increased total
3H-
thymidine cellular transport and gemcitabine cytotoxicity. A. Stable retroviral
expression of hENT1 (green, top), hCNT1 (red, top), Cx32 (green, bottom), and Cx43
(red, bottom) in MDCK cells. Immunostaining analysis showed strong hENT1,
hCNT1, Cx32, and Cx43 expression in the respective infected cells while the proteins
are barely visible in the WT cells. DAPI, blue. B. Expression of the NTs and Cxs in
MDCK cells increased total radiolabeled thymidine uptake compared with control
MDCK. C. Expression of hENT1 and hCNT1 augmented gemcitabine
chemosensitivity by decreasing the cytotoxic IC50 approximately 6- and 5-fold,
respectively. IC50 values are indicated. *p<0.05, **p<0.01.
Expression of hCNT1 with Cx32 synergistically increased nucleoside uptake,
while hENT1 with Cx43 antagonistically decreased it, in MDCK cells. To determine
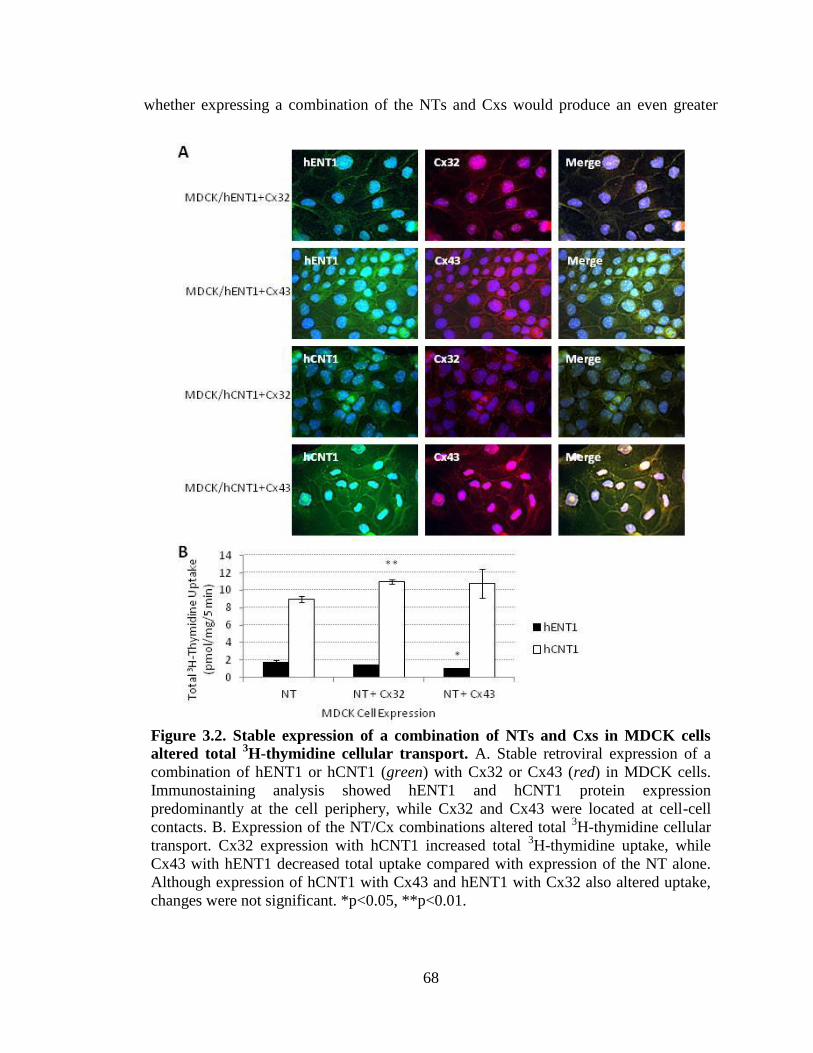
68
whether expressing a combination of the NTs and Cxs would produce an even greater
Figure 3.2. Stable expression of a combination of NTs and Cxs in MDCK cells
altered total 3H-thymidine cellular transport. A. Stable retroviral expression of a
combination of hENT1 or hCNT1 (green) with Cx32 or Cx43 (red) in MDCK cells.
Immunostaining analysis showed hENT1 and hCNT1 protein expression
predominantly at the cell periphery, while Cx32 and Cx43 were located at cell-cell
contacts. B. Expression of the NT/Cx combinations altered total 3H-thymidine cellular
transport. Cx32 expression with hCNT1 increased total 3H-thymidine uptake, while
Cx43 with hENT1 decreased total uptake compared with expression of the NT alone.
Although expression of hCNT1 with Cx43 and hENT1 with Cx32 also altered uptake,
changes were not significant. *p<0.05, **p<0.01.

69
effect, we created MDCK cells that express one NT and one Cx (i.e., hENT1 + Cx32,
hENT1 + Cx43, hCNT1 + Cx32, and hCNT1 + Cx43). Expression of the desired proteins
was confirmed using immunocytochemistry. After merging the immunostained images, it
is clear that the NTs and Cxs were both localized predominantly at the cell-to-cell
contacts (yellow; Fig. 3.2A). Out of the combinations, hCNT1 with Cx32 produced an
even greater, significant increase in 3H-thymidine uptake compared with hCNT1
expression alone (Fig. 3.2B). Interestingly, expression of hENT1 with Cx43 produced a
significantly decreased level of 3H-thymidine uptake compared with the NT alone (Fig.
3.2B).
Overexpression of hENT1 and Cx43 in most pancreatic cancer cell lines. To
translate the preliminary, model-system results to pancreatic cancer, the expressions of
Figure 3.3. Statuses of each hENT1, hCNT1, Cx32, and Cx43 were identified in a
panel of pancreatic cell lines. Most of the pancreatic cancer cell lines overexpressed
hENT1 and Cx43 compared with the normal human pancreatic ductal epithelial
(HPDE) cell line. hCNT1 and Cx32 expressions were also noticed, but at a similar or
lower level compared with HPDE. Western blotting analysis with 75 μg of total cell
lysates was conducted.

70
hENT1, hCNT1, Cx32, and Cx43 were investigated in a panel of pancreatic cell lines.
Compared with the normal human pancreatic ductal epithelial (HPDE) cell line, most of
the cancerous cells showed greater expression of hENT1 and Cx43 (Fig. 3.3). Three of
the cell lines (L3.6pl, Capan-1, and PANC-1) also displayed both hCNT1 and Cx32
expressions (Fig. 3.3).
Proposed model of nucleoside and nucleotide movements within a cell population
via NTs and Cxs. Based on the experimental evidence obtained with various transduced
cell line combinations, we propose the following model for nucleoside analog handling
by Cxs and NTs in tumor cells. Co-expression of hCNT1 and Cx32 leads to increased
nucleoside uptake due to the rapid influx of nucleosides into cells via the high-affinity
hCNT1 (high Km) and Cx32 hemichannels at the cell surface (Fig. 3.4). With a high
Figure 3.4. Proposed model of intracellular and intercellular nucleoside transport
and movement within a cell population. Expression of hCNT1 with Cx32 increases
nucleoside uptake due to the rapid transport of nucleosides into cells via Cx32
hemichannels and the unidirectional hCNT1. Rapid uptake causes less phosphorylation
inside cells, and nucleosides are able to be transported to neighboring cells via Cx32
GJs. Expression of hENT1 with Cx43 decreases uptake due to the slow transport of
nucleosides into cells by the bi-directional hENT1 alone. Slow uptake allows for more
phosphorylation, and nucleotides are released from the cell via Cx43 hemichannels.
Only a few nucleotides are transferred to neighboring cells by Cx43 GJs.

71
maximum velocity (Vmax) of the transporters, an abundance of nucleosides enter the cell,
and the ability of kinases to phosphorylate the nucleosides into their active form becomes
slow and saturated, having achieved their Vmax. The remaining un-phosphorylated
nucleosides are then able to be transported to neighboring cells via Cx32 GJs, propelling
the bystander effect. When hENT1 and Cx43 hemichannels are expressed at the cell
surface, nucleoside uptake is less due to low transporter affinity (low km) and slow influx
of nucleosides (Fig. 3.4). Furthermore, while Cx43 hemichannels are unable to transport
nucleosides into the cell, hENT1 is bi-directional, and nucleosides are able to both enter
and exit the cell. The slow influx of nucleosides causes most to be phosphorylated
quickly into their active form since kinases are not reaching their Vmax. Once converted
into nucleotides, they are then able to be exported from the cell by Cx43 hemichannels
before being transferred to neighboring cells, hindering the bystander effect. Only a few
nucleotides are transported to neighboring cells via Cx43 GJs.
Discussion
With the transport of nucleoside analog drugs into and between cells via NTs and
GJs, there holds potential for increasing the bystander effect. Therefore, this study
attempts to identify the roles and interplay of NTs and GJs in affecting the distribution
and efficacy of the nucleoside analog drug, gemcitabine. We hypothesized that the
manipulation of these naturally occurring cellular channels and transporters will increase
nucleoside drug concentrations in heterogeneous tumor cell populations, resulting in
greater chemotherapeutic efficacy. Among the numerous different types of NTs and Cxs,
we chose to study hCNT1, hENT1, Cx32, and Cx43. They are the prototypic candidates
72
in each respective family, and their expressions were confirmed in normal pancreatic
tissues [31, 250, 251]. Furthermore, high-affinity hCNT1 and hENT1 have been shown to
be key factors in determining gemcitabine efficacy in pancreatic cancer [9, 14, 246-248],
while Cx32 and Cx43 show promise in potentiating their mechanism [241, 249]. By
expressing these proteins both individually and in combinations, we aimed to elucidate
the movements of nucleoside analog chemotherapeutics within tumor cell populations as
well as explore the potential for improvements in drug action.
Since pancreatic cancer cells express one or more of the NTs or Cxs of interest,
we first searched for a cell system that is deficient in these proteins. Our search identified
MDCK cells to possess only minimal levels of endogenous NTs or Cxs. Hence, we used
the cell line to conduct mechanistic studies on the individual effects of the NTs and Cxs
of interest on the distribution of gemcitabine within cell populations before advancing to
pancreatic cancer cell models.
As expected, expression of the unidirectional, high-affinity, and rapid hCNT1 led
to the greatest uptake of radiolabeled nucleosides followed by the bidirectional, lower-
affinity, and slower hENT1. Consequences of this increased uptake were validated when
expression of hENT1 and hCNT1 led to a 6- and 5-fold increase in gemcitabine
cytotoxicity (leading to an IC50 of 13.87 and 17.61 μM), respectively, compared with
control cells. Increased uptake with Cx32 and Cx43 expressions may be due to increased
hemichannel transport or increased movement of radiolabeled thymidine into cells as the
nucleoside is better distributed throughout the cell population by GJs.
Co-expression of hCNT1 with Cx32 led to a synergistically increased level of
nucleoside transport, suggesting that since Cx32 preferentially transfers
73
unphosphorylated molecules (nucleosides), it is acting in cooperation with the
unidirectional hCNT1 to increase uptake of the gemcitabine prodrug. Once entered,
gemcitabine is phosphorylated and unable to exit the cell through Cx32 hemichannels.
On the other hand, cells expressing hENT1 and Cx43 displayed an antagonistically
decreased level of nucleoside transport. Cx43 hemichannels, preferring phosphorylated
molecules, does not aid in the uptake of gemcitabine but rather the expulsion of its
phosphorylated (activated) forms from the cell.
This study provides the first evidence that there is an interplay between NTs and
Cxs. Between expressing hCNT1/Cx32 and hENT1/Cx43, there was a >10-fold
difference in nucleoside uptake in our model cell line. Therefore, it is possible that
nucleoside analog cytotoxicity is regulated by both NTs and Cxs (GJs and hemichannels)
and that their favorable manipulations may provide a mechanism for improving
gemcitabine chemosensitivity in pancreatic cancer cells.
There is a large number of possible combinations involving NT and Cx
expressions, and hence the observed difference in nucleoside uptake in reality could far
exceed the estimated value. Further studies are needed to determine which specific types
and combinations of NTs and Cxs are most effective in heterogeneous cell populations.
For example, it was recently shown that Cx26 significantly contributes to the gemcitabine
bystander effect in pancreatic cancer [174].
In preliminary studies with our cell culture system, we identified some NT/Cx
combinations to produce increased chemosensitivity even with only a slight increase in
transport, whereas other combinations did not improve chemosensitivity even with high
levels of transport. This is likely due to the properties of the transporters and channel
74
proteins as explained by our hypothetical model. In an in vivo context, a small increase in
drug uptake may actually substantially increase cytotoxicity due to the BE in a 3D model.
In future studies, co-culture (i.e., using mixed populations of cells expressing various
NTs and GJs), 3D culture (i.e., cell culture utilizing a 3D matrix), and animal tumors
would need to be employed to mimic the heterogeneity of tumors and for testing the
potential BE in more translational models.
The proposed model of intracellular and intercellular nucleoside transport could
be used to explain current drug exposure limitations in heterogeneous tumor cells and
how they can be manipulated to overcome chemoresistance in pancreatic cancer. This
understanding could bring about diagnostic value and therapeutic guidance (e.g., drug
selection) in patients. Overall, in contrast to the conventional paradigm suggesting that all
transporters and channel proteins aid in drug uptake and chemosensitivity, these findings
for the first time shed light on the remarkable functional selectivities of NTs and Cxs,
which can be utilized for improved cancer treatments and predictions.

75
CANCER STEM CELLS AND CHEMOSENSITIVITY

76
CHAPTER 4
PHARMACOLOGICAL REVERSAL OF HISTONE METHYLATION
PRESENSITIZES PANCREATIC CANCER CELLS TO NUCLEOSIDE DRUGS: IN
VITRO OPTIMIZATION AND NOVEL NANOPARTICLE DELIVERY STUDIES 4
4 SW Hung, H Mody, S Marrache, YD Bhutia, F Davis, JH Cho, J Zastre, S Dhar, CK Chu, and R
Govindarajan. 2013. PLOS ONE. 8(8): e71196.
Reprinted here with permission of the publisher.
77
Abstract
We evaluated the potential of an investigational histone methylation reversal
agent, 3-deazaneplanocin A (DZNep), in improving the chemosensitivity of pancreatic
cancer to nucleoside analogs (i.e., gemcitabine). DZNep brought delayed but selective
cytotoxicity to pancreatic cancer cells without affecting normal human pancreatic ductal
epithelial (HPDE) cells. Co-exposure of DZNep and gemcitabine induced cytotoxic
additivity or synergism in both well- and poorly-differentiated pancreatic cell lines by
increased apoptosis. In contrast, DZNep exerted antagonism with gemcitabine against
HPDE cells with significant reduction in cytotoxicity compared with the gemcitabine-
alone regimen. DZNep marginally depended on purine nucleoside transporters for its
cytotoxicity, but the transport dependence was circumvented by acyl derivatization. Drug
exposure studies revealed that a short priming with DZNep followed by gemcitabine
treatment rather than co-treatment of both agents to produce a maximal
chemosensitization response in both gemcitabine-sensitive and gemcitabine-resistant
pancreatic cancer cells. DZNep rapidly and reversibly decreased trimethylation of histone
H3 lysine 27 but increased trimethylation of lysine 9 in an EZH2- and JMJD1A/2C-
dependent manner, respectively. However, DZNep potentiation of nucleoside analog
chemosensitization was found to be temporally coupled to trimethylation changes in
lysine 27 and not lysine 9. Polymeric nanoparticles engineered to chronologically release
DZNep followed by gemcitabine produced pronounced chemosensitization and dose-
lowering effects. Together, our results identify that an optimized DZNep exposure can
presensitize pancreatic cancer cells to anticancer nucleoside analogs through the reversal
78
of histone methylation, emphasizing the promising clinical utilities of epigenetic reversal
agents in future pancreatic cancer combination therapies.
Introduction
Polycomb group proteins (PcGs) can remodel chromatin by influencing the
degree of compaction, leading to epigenetic gene silencing. Polycomb Repressive
Complex 2 (PRC2), one of the two classes of PcGs, induces histone methyltransferase
activity primarily by trimethylating histone H3 at lysine 27 (H3K27me3), mediating
silencing of tumor suppressor genes. The catalytic subunit of PRC2 is Enhancer of Zeste
Homolog 2 (EZH2), in which the SET domain constitutes the active site for histone
H3K27 methylation [252]. Studies support EZH2 as a key player in the development and
progression of tumors due to its ability to alter gene expressions including those involved
in cell cycle control, cell migration, and DNA repair [253]. EZH2 is crucial in the
chromatin control of genetic reprogramming of cancer stem cell self-renewal and
differentiation that have been implicated in chemoresistance [254-257].
As a marker of advanced and metastatic disease in many solid tumors, EZH2
overexpression has been reported in pancreatic cancers, particularly those that are poorly
differentiated [257, 258]. EZH2 was found to be upregulated by oncogenic RAS through
MEK-ERK signaling, leading to the downregulation of tumor suppressors such as
RUNX3 and p27 (Kip1) [257, 259, 260]. EZH2 depletion led to cell cycle arrest at the
G1/S transition, suggesting the protein may repress the tumor suppressing p27 gene
[261]. Similarly, knockdown of EZH2 resulted in a significant decrease in cellular
proliferation and invasiveness [257, 258, 262] and sensitized pancreatic cancer cells to

79
doxorubicin and gemcitabine, revealing the potential of an EZH2 inhibitor-
chemotherapeutic combination therapy [257]. In vivo, suppressing EZH2 diminished
tumorigenicity and inhibited pancreatic cancer metastasis [258]. Clinically, positive
correlations have been observed between EZH2 expression and advanced pancreatic
cancer stage and grade in patients [262]. In many cases, high levels of EZH2 in cancer
were also significantly associated with decreased E-cadherin expression and highly
aggressive disease. In gemcitabine-treated patients, significantly longer survival was
observed in patients with low rather than high EZH2 expression [263]. Consequently,
EZH2 may be a significant prognostic value for overall survival in pancreatic cancer
patients [264].
Recently, it has been shown that a potent chemical inhibitor of S-
adenosylhomocysteine hydrolase, 3-deazaneplanocin A (DZNep), modulates chromatin
through indirect (i.e., reducing methyl group availability) inhibition of histone
methyltransferases including EZH2 [265, 266]. DZNep, a carbocyclic analog of
adenosine, depletes cellular levels of the PRC2 components while inhibiting the
associated H3K27me3 [267]. While the mechanisms and effects of DZNep have been
studied in numerous solid tumors and leukemia [253, 254, 265, 266, 268-272], less is
known about the potential of this compound for pancreatic cancer treatment.
Nevertheless, its current potential for reducing EZH2 levels, reverting epithelial-to-
mesenchymal transition (EMT), and preventing tumor progression, makes it a highly
promising antimetastatic agent [256]. The therapeutic potential of DZNep in combination
with other agents, such as polyphenols and histone deacetylase inhibitors, has begun to
emerge with encouraging results [265, 266]. Since increasing evidence suggests that
80
future cancer therapies will take advantage of the synergistic effects achieved from
different combinations of epigenetic reversal and conventional antitumor agents [273],
we investigated the potential of the DZNep-gemcitabine combination for improving
anticancer activity in pancreatic cancer. Our results identified that histone methylation
reversal by DZNep presensitizes pancreatic cancer cells to gemcitabine. Optimization of
the drug combination through dosage and delivery methods was further conducted.
Materials and Methods
Reagents. Radiolabeled (3H) gemcitabine, adenosine, thymidine, and guanosine
were obtained from Moravek Biochemicals and Radiochemicals (Brea, CA), while cold
gemcitabine was from ChemieTek (Indianapolis, IN). Adenosine and guanosine were
kindly provided by Dr. Chung K. Chu (University of Georgia). Thymidine, uridine,
nitrobenzyl mercaptopurine riboside (NBMPR), and 3-(4,5-dimethylthiazol-2-yl)-2,5-
diphenyltetrazolium bromide (MTT) were obtained from Sigma-Aldrich (St. Louis, MO).
Dimethylsulfoxide (DMSO) was purchased from Macron Chemicals (Center Valley, PA),
and the bicinchoninic acid (BCA) protein assay reagent was from Thermo Scientific
Pierce (Rockford, IL). Plastic wares for cell culture were obtained from Corning
(Corning, NY).
Cell Culture. The pancreatic cancer cell lines (AsPC-1, BxPC-3, Capan-1, MIA
PaCa- 2, and PANC-1) and MCF-10A cells were received from the American Type
Culture Collection (ATCC; Manassas, VA) cell bank. These cell lines were propagated,
expanded, and frozen immediately after arrival. The cells revived from the frozen stock
were used within 10-20 passages, not exceeding a period of 2-3 months. The ATCC uses

81
morphological, cytogenetic and DNA profile analysis for characterization of cell lines.
Human pancreatic ductal epithelial (HPDE) cells [216] were kindly received from Dr.
Ming Tsao of the Ontario Cancer Institute (Toronto, Canada). The L3.6pl cell line [274]
was kindly received from Dr. Isiah D. Fidler at The University of Texas MD Anderson
Cancer Center (Houston, TX). The HPDE and L3.6pl cell lines were handled as other cell
lines and were genotyped by DNA fingerprinting (PowerPlex 16, Promega, Inc.) as per
the manufacturer’s instructions. The 293T cell line was kindly received from Dr. J.
Michael Thomson of The University of Georgia (Athens, GA). The growth conditions of
cell lines were performed as described previously [275].
MTT Cytotoxicity Assay. Cells were seeded at a density of 3x10³ cells/well in a
96-well microtiter plate and grown to 90-95% confluency. After treatment, 50 μl of MTT
solution (5 mg/ml in PBS) were added to each well, and the plates were incubated for 2 h.
MTT formazan crystals were dissolved in 100 μl/well of DMSO by shaking the plates on
a rocking platform. A 96-well scanner was used to measure the spectrophotometric
absorbance at 490 nm. The absorbance at 650 nm was used for background subtraction.
The 50% inhibitory concentration (IC50) was determined using GraphPad Prism 5.0
software.
Caspase 3 Assay. Apoptosis was measured using the Fluorimetric Caspase 3
Assay Kit from Sigma-Aldrich (Cat. No. CASP3F) as per the manufacturer’s instructions.
Briefly, 104 cells/well in a 96-well plate were treated with DZNep and/or gemcitabine for
72 h. Cells were then lysed and incubated on ice for 15-20 min. After adding assay buffer
containing the Ac-DEVD-AMC substrate, samples were transferred to a black 96-well
plate, and fluorescence was read every 10 min for 1 h at room temperature (360 nm

82
excitation, 460 nm emission). The appropriate blank (reaction mixture), positive control
(caspase 3), and negative control (caspase 3 + caspase 3 inhibitor) were also conducted.
Drug Interaction Studies. The combination index plots for DZNep and
gemcitabine were estimated using the method developed by Chou and Talalay and the
CalcuSyn software [276].
Nucleoside Uptake in Cells and Xenopus Oocytes. These procedures were
performed as previously described [221, 277].
Generation of Xenopus Oocyte Expression Constructs. The full-length IMAGE
cDNA clones of the transporters (hENT1: clone ID 3010092, accession BC008954;
hENT2: clone ID 9051840, accession BC143335; hCNT1: clone ID 8991920, accession
BC 126204; hCNT3: clone ID 7939668, accession BC093823) were obtained from Open
Biosystems (Huntsville, AL). Subcloning of the genes into the Xenopus oocyte
expression vector, pOX, was completed using the primer sets designated in Table 4.1.
Table 4.1. Restriction sites and sequences of primers used for cloning.
Gene Forward Reverse
Restriction
Site
Sequence Restriction
Site
Sequence
pOX-hENT1 SalI 5’-GCACGTCGACCAATA
ATGACAACCAGTCAC-3’
XbaI 5’-CGTGTTCTAGATC
ACACAATTGCCCG-3’
pOX-hENT2 SalI 5’-GATATAGTCGACCAAT
AATGGCGCGAGGAGAC-3’
XbaI 5’-CTATCTCTAGATCAGA
GCAGCGCCTTGAAGAG-3’
pOX-hCNT2 HindIII 5’-GCCCGAAGCTTCAATAA
TGGAGAAAGCAAGTGG-3’
XbaI 5’-CGTCGTCTAGATTAG
GCACAGACGGTATTG-3’
pOX-hCNT3 HindIII 5’-CGCACAAGCTTCAAT AATGGAGCTGAGGAG-3’
SpeI 5’-CCGCGCACTAGTTCAA AATGTATTAGAGATCCC-3’
Western Blotting. Western blotting was conducted as previously described [275].
The rabbit polyclonal anti-histone H3K4TM, H3K9MM, H3K9DM, H3K27MM,
H3K27DM, H4K20DM, and H4K20TM were from Millipore (Billerica, MA), as well as
the rabbit polyclonal anti-EED antibody. Also obtained from Millipore were the mouse

83
monoclonal anti-histone H3K9TM, H3K27TM, and H4K20MM antibodies, as well as the
mouse monoclonal anti-EZH2 (clone BD43) and anti-SUZ12 (clone 3C1.2) antibodies.
The rabbit polyclonal anti-JMJD1A and anti-JMJD2C antibodies were acquired from
Sigma-Aldrich. The mouse monoclonal anti-β-actin antibody was also purchased from
Sigma-Alrich, and the HRP-conjugated secondary antibodies were from Bethyl
Laboratories (Montgomery, TX).
Synthesis of Parent Nucleosides and Derivatives. Troxacitabine and its lipophilic
prodrug, as previously described (compound 2K [278]; compound 6h [279];
C24H41N3O5), were obtained from Dr. Chung K. Chu (University of Georgia). The
synthesis of a DZNep analog began from D-ribose. D-ribose was treated with 2,2-
dimethoxypropane in the presence of a catalytic amount of p-toluenesulfonic acid to give
a isopropylidine derivative, followed by the protection of the primary alcohol with
triphenylmethyl chloride. The protected lactol was then reacted with vinyl magnesium
bromide to give a single diastereomericdiol, which was subsequently protected with
TBDMS only at the allylic hydroxyl position to afford silyldienol. To incorporate another
double bond for the ring-closing metathesis reaction, the protected secondary alcohol was
oxidized to a ketone by Swern oxidation, followed by a Wittig reaction with
methyltriphenylphosphonium bromide and n-BuLi to provide the diene. The silyl group
from the diene was removed with TBAF to give a less sterically demanding dienol, which
was then converted to cyclopentenol with a second-generation Grubbs catalyst in good
yield. In order to carry out the Mitsunobu coupling, bis-Boc-3-deaza-adenine was
prepared. Mitsunobu coupling provided the desired N-9 isomer as a major product.
Removal of protection groups using 2N-HCl in methanol produced DZNep. Three
84
alcohol groups of DZNep were protected with TBS which was substituted to the two
amide prodrugs (carbon chains of C6 to C8) by acylation of the N6-NH2 group. The
compound was finally fully deprotected by TBAF to give the DZNep prodrug 1
(C20H29ClN4O4) and DZNep Prodrug 2 (C18H24N4O4). The syntheses procedures and
physicochemical characterizations of the compounds will be published elsewhere.
Nanoparticle Formulation. All chemicals were purchased from Sigma Aldrich
and used without further purification unless otherwise noted. PLGA-COOH with an
intrinsic viscosity of 0.18 dL/g was purchased from Lactel. The (5-
carboxypentyl)triphenylphosphonium (TPP) cation was synthesized according to
literature methods [280]. HO-PEG-OH with a MW of 3,350 g/mol was purchased from
Sigma Aldrich. DSPE-PEG-COOH with a MW of 2,000 g/mol was purchased from
Avanti Polar Lipids. Polyvinyl alcohol (PVA) with an average molecular weight of
10,000-26,000 was purchased from Alfa Aesar. Distilled water was purified by passage
through a Millipore Milli-Q Biocel water purification system (18.2 MΩ) with a 0.22 μm
filter. HPLC analyses were carried out using an Agilent 1200 series instrument. Size and
zeta potential measurements were carried out on a Malvern Zetasizer Nanoseries
instrument. Gel permeation chromatography (GPC) data was collected on a Shimadzu
LC20-AD Prominence liquid chromatographer. All NMR spectra were recorded on a
Varian 400 MHz NMR. TEM images were taken on a Tecnai 20 FEM microscope.
Ultrasonication was performed on a Misonix S-4000 Ultrasonic liquid processor.
Synthesis of PLGA-b-PEG-OH. Synthesis of PLGA-PEG-b-OH was performed as
previously described [281].

85
Synthesis of PLGA-b-PEG-TPP. Synthesis of PLGA-PEG-b-TPP was performed
as previously described [281].
Synthesis of Gemcitabine Encapsulated Nanoparticles (Gem-PLGA-b-PEG-OH-
NPs). Gemcitabine (10 mg/mL in nanopure H2O) was emulsified with PLGA-b-PEG-OH
(5 mg in CH2Cl2) using probe sonication for one minute (Amplitude: 40% of 600 W
power, Pulse: 1 sec on, 1 sec off). The primary emulsion was emulsified again by adding
the water-in-oil emulsion to 2 mL of nanopure water containing 0.5% polyby 8 mL of
nanopure water containing 0.05% PVA and sonicated using the conditions mentioned
above. Organic solvent was removed by washing three times using an Amicon filtration
membrane with a 100 kDa cut-off. The NPs were resuspended in nanopure water and
stored at 4°C until further use. Dynamic light scattering (DLS) measurements were
carried to determine size, polydispersity index (PDI), and zeta potential of the NPs. NPs
were characterized using TEM at an acceleration voltage of 200 kV. The TEM samples
were prepared by depositing 8 μL of the NPs (5 mg/mL) onto a 200-mesh carbon-coated
copper grid. Samples were blotted away after 15 min and grids were negatively stained
with sterile 2% (w/v) uranyl acetate aqueous solution for 15 min.
Synthesis of DZNep Encapsulated Nanoparticles (DZNep-PLGA-b-PEG-OH-
NPs). DZNep (10 mg/mL in nanopure H2O) was emulsified with PLGA-b-PEG-OH (5
mg in CH2Cl2) using probe sonication for one minute (Amplitude 40 % of 600 W power,
Pulse: 1 sec on, 1 sec off). The primary emulsion was emulsified again by adding the
above formed water-in-oil emulsion to 2 mL of nanopure water containing 0.5% PVA
and sonicated using similar conditions. Finally, this emulsion was re-emulsified using 8
mL of nanopure water containing 0.05% PVA under sonication using the similar

86
conditions as before. Organic solvent was removed by washing three times using an
Amicon filtration membrane with a 100 kDa cut-off. The NPs were resuspended in
nanopure water and stored at 4°C until further use. DLS measurements were carried to
determine size, polydispersity index (PDI), and zeta potential of the NPs. NPs were
characterized using TEM as mentioned above.
Synthesis of Gemcitabine and DZNep Encapsulated NPs (Gem-DZNep-PLGA-b-
PEG-OH-NPs). Gemcitabine and DZNep co-encapsulated PLGA-b-PEG-OH NPs were
following the exact procedure mentioned above except the first step where DZNep (10
mg/mL in nanopure H2O) and Gemcitabine (10 mg/mL in nanopure H2O) was emulsified
with PLGA-PEG-OH (5 mg in CH2Cl2). Organic solvent was removed by washing three
times using an Amicon filtration membrane with a 100 kDa cut-off. The NPs were
resuspended in nanopure water and stored at 4°C until further use. DLS measurements
were carried to determine size, polydispersity index (PDI), and zeta potential of the NPs.
NPs were characterized using TEM as mentioned above.
Synthesis of Controlled Release Gem-DZNep-PLGA-b-PEG-TPP-NPs.
Gemcitabine (10 mg/mL in nanopure H2O) was emulsified with PLGA-b-PEG-TPP (5
mg in CH2Cl2) using probe sonication for one minute (Amplitude: 40% of 600 W power,
Pulse: 1 sec on, 1 sec off). The primary emulsion was emulsified again by adding the
water-in-oil emulsion to 2 mL of nanopure water containing 0.5% PVA and sonicated
using similar conditions. Finally this emulsion was emulsified using 8 mL of nanopure
water containing 0.05% PVA and DZNep (10 mg/mL in nanopure H2O) under sonication
using conditions as mentioned above. Organic solvent was removed by washing three
times using an Amicon filtration membrane with a 100 kDa cut-off. The NPs were

87
resuspended in nanopure water and stored at 4°C until further use. DLS measurements
were carried to determine size, polydispersity index (PDI), and zeta potential of the NPs.
NPs were characterized using TEM as mentioned above.
Synthesis of Controlled Release Gem-DZNep-DSPE-PEG-OH-NPs. Gemcitabine
(10 mg/mL in nanopure H2O) was emulsified with PLGA-b-PEG-OH (5 mg in CH2Cl2)
using probe sonication for one minute (Amplitude: 40% of 600 W power, Pulse: 1 sec on,
1 sec off). The primary emulsion was emulsified again by adding the water-in-oil
emulsion to 2 mL of nanopure water containing 0.5% PVA and sonicated using the
conditions mentioned above. This emulsion was further emulsified using 8 mL of
nanopure water containing 0.05% PVA, 0.1% DSPE-PEG-COOH, and DZNep (10
mg/mL in nanopure H2O) under sonication using the same conditions as mentioned
above. Organic solvent was removed by washing three times using an Amicon filtration
membrane with a 100 kDa cut-off. The NPs were resuspended in nanopure water and
stored at 4°C until further use. DLS measurements were carried to determine size,
polydispersity index (PDI), and zeta potential of the NPs. NPs were characterized using
TEM as mentioned above.
Loading and Encapsulation Efficiency of Gemcitabine and DZNep in NPs.
Gemcitabine and DZNep loading and encapsulation efficiency (EE) were determined by
dissolving the polymeric core in 0.1 M NaOH and quantifying the amount of therapeutic
in the NPs using HPLC (Mobile phase: acetonitrile with 20% H2O and 0.1%
trifluoroacetic acid, Wavelength used: 270 nm.
Release Kinetic Studies of DZNep/Gemcitabine NPs. NPs were placed in Slide-A-
Lyzer®
MINI dialysis units with a MW cutoff of 10,000 g/mol. Samples were dialyzed

88
against 1x PBS (6.0 L) in a constant temperature shaker at 37°C and 35 RPM. At various
pre-determined time points, samples were removed and the gemcitabine/DZNep content
was determined by dissolving the polymeric core in 0.1 mMol NaOH and quantifying by
HPLC analysis (Mobile phase: acetonitrile with 20% H2O and 0.1% trifluoroacetic acid,
Wavelength used: 270 nm).
Statistical Analyses. For instances where only two conditions were compared, the
student's t test was used to identify significant differences. In cases where three or more
conditions were compared, one-way ANOVA was conducted followed by Tukey’s
Multiple Comparison Test. Each experiment was repeated at least three times. Unless
otherwise indicated, p<0.05 and p<0.01 compared with control conditions are represented
by one and two asterisks, respectively.
Results
DZNep selectively augments gemcitabine cytotoxicity in cancerous but not normal
pancreatic cells. We began by studying the cytotoxicity of DZNep on normal and
cancerous pancreatic cell lines. Treatment with increasing concentrations of DZNep (0.1
nM-100 μM) showed a significant reduction in cellular viability in all six pancreatic
cancer cell lines tested (i.e., BxPC-3, Capan-1, L3.6pl, AsPC-1, MIA PaCa-2, PANC-1)
(Fig. 4.1A). Cytotoxicity was observed starting at approximately 0.5-1 μM DZNep,
depending on the cell line, and increased gradually with higher concentrations thereafter.
Cytotoxicity did not begin until ~48 h of treatment (data not shown). Maximal reduction
in cell viability (~50% reduction with 10 μM DZNep for 72 h) was observed in poorly-
differentiated MIA PaCa-2 which is only marginally gemcitabine-sensitive (Fig. 4.1A).

89
In subconfluent cells, the effect of DZNep on MIA PaCa-2 was almost similar to that of
gemcitabine (Fig. 4.1C). DZNep showed much lower cytotoxicity in well-differentiated,
gemcitabine-sensitive pancreatic cancer cell lines (i.e., BxPC-3, Capan-1, L3.6pl) when
compared with gemcitabine (Fig. 4.1C). Of note, no significant changes were observed in
the proliferation and cellular viability of normal human pancreatic ductal epithelial
(HPDE) cells (up to 10 μM DZNep for 72 h) which are highly gemcitabine-sensitive, as
well as two other normal cell lines (293T (human embryonic kidney) and MCF-10A
(human breast epithelial)) (Figs. 4.1A-B; supplemental data in full manuscript [190]).
These results demonstrate that DZNep selectively imparts cytotoxic effects to (poorly-
differentiated) pancreatic cancer cells without significant impairment of proliferation in
normal pancreatic epithelial cells.
Encouraged by the potential ability of DZNep to compensate for nucleoside
analog refractoriness in pancreatic cancer, we co-treated cells with DZNep and
gemcitabine at equimolar ratios and compared the cellular viabilities with those obtained
when cells were treated with either DZNep or gemcitabine alone. Interestingly, the co-
treatment showed significantly higher reductions in cellular viabilities of most of the
gemcitabine-sensitive and -insensitive cancerous cells than when the compounds were
used as stand-alone agents (Fig. 4.1C). Conversely, the co-treatment reduced cytotoxicity
(>2-fold at 100 nM concentration) in HPDE (Fig. 4.1B), suggesting a cytoprotective role
of DZNep only on normal cells.
We estimated the combination index (CI) plots [276] to identify the type of
interaction between DZNep and gemcitabine. These estimations identified a synergistic
or additive interaction between DZNep and gemcitabine (100 nM-10 μM) in all

90
pancreatic cancer cell lines with the only exception of AsPC-1, as well as a stark
antagonistic interaction in normal HPDE (Fig. 4.1C). Co-treatment of DZNep (1 nM-10
µM) with differing gemcitabine concentrations (1-100 nM) showed that DZNep
Figure 4.1. DZNep and gemcitabine sensitivity, singly or in combination, and
interactions within a panel of pancreatic cell lines. A. All cancerous cell lines
excluding the normal HPDE are DZNep-responsive and reduced cellular viability. B.
DZNep and gemcitabine displayed antagonistic effects in HPDE. C. DZNep and
gemcitabine displayed additive or synergistic effects in many of the cancerous
pancreatic cell lines. Twenty-four hours after 3x10³ cells/well were seeded in a 96-well
plate, cells were treated with either DZNep, gemcitabine, or a combination of both at
an equimolar ratio for 72 h. Cellular viability was measured using an MTT assay.
Cytotoxic IC50 values are indicated. Significances between gemcitabine and DZNep as
well as DZNep + Gemcitabine and DZNep were identified using one-way ANOVA
followed by Tukey’s post-hoc test. Combination index (CI) plots (insets) show the
interactions between the two drugs. CI>1, antagonism; CI=1, additivity; CI<1,
synergism. Bar graphs to the right indicate the relative caspase-3 activity (RCA) of
each treatment as measured by fluorescence intensity. Values were background-
subtracted and are presented as fold-change from the control. Significance between a
single drug versus the drug combination was identified via one-way ANOVA followed
by Tukey’s post-hoc analysis. Cells were treated with 1 μM DZNep, 100 nM
gemcitabine, or both. Bars, SD. n=3. *p<0.05, **p<0.01.

91
potentiates cytotoxicity in a gemcitabine dose-dependent fashion in marginally
gemcitabine-sensitive MIA PaCa-2, whereas such a potentiation occurred in a largely
gemcitabine dose-independent fashion in highly gemcitabine-sensitive Capan-1 cells
(supplemental data in full manuscript [190]). HPDE remained cytotoxic to gemcitabine,
confirming antagonism between the two compounds (supplemental data in full
manuscript [190]). Further interaction analysis with various ratios of gemcitabine:DZNep
(1:1, 1:4, 4:1, 1:10, 10:1) identified a maximally synergistic and cytotoxic response in
MIA PaCa-2 using the 1:10 ratio (supplemental data in full manuscript [190]). Finally, in
order to understand the mechanism of reduction in cellular viability, we conducted
caspase-3 based apoptosis assays. These results (Fig. 4.1C) identified a significant
induction of apoptosis as a major contributing mechanism for DZNep-induced increase in
gemcitabine cytotoxicity (Fig. 4.1C).
Nucleoside transporters facilitate cellular entry of DZNep. Since DZNep is a
hydrophilic nucleoside analog with a log P of -1.38 [256], we hypothesized that its entry
into cells would depend on the expression of nucleoside transporters, and therefore, the
lack of sufficient carrier expression would limit its cellular activity. To test this, we
performed a competitive assay by assessing the level of inhibition in the cellular transport
of nucleosides with DZNep. We chose the PANC-1 and MIA PaCa-2 cell lines for these
studies because they have been reported to express multiple nucleoside transporters
[282]. Transport analysis identified a significant inhibition of 3H-adenosine and
3H-
guanosine (purines) transport but not 3H-thymidine (pyrimidine) (Fig. 4.2A).
Gemcitabine transport in both cell types was only inhibited at a higher concentration (200

92
Figure 4.2. DZNep partially competes with the uptake of purine nucleosides by
hENT1 and hCNT3. A. DZNep hindered the uptake of radiolabeled purine
nucleosides in PANC-1 and MIA PaCa-2. Twenty-four hours after 5x10⁴ cells/well
were seeded in a 24-well plate, cells were allowed to uptake the indicated radiolabeled
nucleoside in the presence of DZNep or its respective unlabeled nucleoside. B.
Inhibition of adenosine transport in Xenopus oocytes with DZNep. C. Pharmacological
inhibition of hENT1 and excess uridine decreased the cytotoxicity of DZNep in MIA
PaCa-2. Twenty-four hours after 3x10³ cells/well were seeded in a 96-well plate, cells
were treated with increasing concentrations of DZNep in the presence of DMSO
(control), 10 µM NBMPR, or 200 µM uridine. Cellular viability was measured using
an MTT assay. IC50 values are indicated. Significant differences between the control
and each treatment were determined using the Student’s t test. Bars, SD. n=3. *p<0.05,
**p<0.01.
μM) (Fig. 4.2A). These data suggest that DZNep cellular influx is facilitated by purine,
but not pyrimidine, nucleoside transporters.
To further characterize the identity of the purine nucleoside transporters
mediating DZNep influx, we examined the ability of DZNep to inhibit 3H-adenosine

93
transport in Xenopus oocytes expressing individual transporters. A significant inhibition
of hENT1- and hCNT3-mediated 3H-adenosine transport was observed, whereas a
significant inhibition of hCNT2-mediated 3H-adenosine transport was noticed only at the
higher (200 μM) concentration (Fig. 4.2B). No significant reduction in adenosine
transport by DZNep was observed in hENT2-expressing oocytes.
Next, to study the impact of hENT1 and hCNT3 on DZNep-mediated cytotoxicity
in pancreatic cancer cells, we examined the proliferation of MIA PaCa-2 in the presence
of a pharmacological inhibitor of hENT1 (10 nM NBMPR) or excess uridine (200 μM)
which competitively inhibits all hENTs and hCNTs. Our results show that both
conditions can significantly reduce DZNep cytotoxicity of MIA PaCa-2, as judged by
increases in cytotoxic IC50 estimates (2-8-fold) (Fig. 4.2C).
Acyl derivatization of DZNep augments sensitization of pancreatic cells to
gemcitabine. Since DZNep at least partially utilizes transporters for exerting its fullest
potential, it is likely that transporter-deficient patients may respond poorly to DZNep. To
circumvent this issue, we generated polar acyl derivatives of DZNep (Fig. 4.3A) using a
synthetic procedure described in Materials and Methods. We substituted DZNep at the
N6-NH2 group with acyl side chains to generate two lipophilic prodrugs (Prodrug 1:
C20H29ClN4O4; Prodrug 2: C18H24N4O4). The synthesized prodrugs were evaluated for
their anti-proliferative activities, both alone and in combination with gemcitabine, in a
normal (HPDE), gemcitabine-sensitive (Capan-1), and gemcitabine-resistant (MIA PaCa-
2) cell line. Both prodrugs showed higher cytotoxicity than the parent DZNep in MIA
PaCa-2 (Fig. 4.3B). Further, the levels of cytotoxicity produced by both of the prodrugs
were unaffected in the presence of 10 nM NBMPR or 100 μM uridine since the estimated

94
IC50 values were not significantly different with the treatments. In normal HPDE,
cytotoxicity of the prodrugs did not differ from that of DZNep (>10 µM) (Fig. 4.3B).
When cells were treated with both gemcitabine and a DZNep prodrug at the previously
Figure 4.3. Acyl modifications of DZNep further enhance cytotoxicity. A. The
chemical structures of DZNep and its two acyl prodrugs (Prodrug 1: C20H29ClN4O4,
and Prodrug 2: C18H24N4O4). B. Cytotoxicity of DZNep versus its prodrugs in HPDE
and MIA PaCa-2. IC50 values are designated in each legend. Significance between each
prodrug and DZNep was identified using the Student’s t test. C. Average IC50 values of
the various drug combinations in HPDE, Capan-1, and MIA PaCa-2. Twenty-four
hours after 3x10³ cells/well were seeded in a 96-well plate, cells were treated for 72 h.
Cellular viabilities were measured using MTT assays. IC50 values are plotted.
Significance of each prodrug combination was compared with Gem + DZNep using
one-way ANOVA followed by Tukey’s post-hoc test. Bars, SD. n=3. *p<0.05,
**p<0.01.

95
calibrated 1:10 ratio, both prodrugs showed a distinct potentiation of gemcitabine
cytotoxicity in the cancerous Capan-1 and MIA PaCa-2 (IC50 reduction of 12-fold in
Capan-1 and 7-fold in MIA PaCa-2) (Fig. 4.3C). Despite anticipated inertness, both
prodrug combinations with gemcitabine increased cytotoxicity in HPDE (Fig. 4.3C).
Overall, cytotoxicity increased from gemcitabine as a single agent, to a combination with
DZNep, to a combination with DZNep prodrugs (Fig. 4.3C). Since gemcitabine is well-
known to rely heavily on nucleoside transporters for cellular activity, we examined the
effects of an acyl derivative (C24H41N3O5) of a less hydrophilic nucleoside analog,
troxacitabine (log P of -0.66) [278, 279], in combination with DZNep Prodrug 1 on the
same cell lines. Cytotoxicity was further enhanced with the use of the troxacitabine
prodrug in combination with DZNep Prodrug 1 (Fig. 4.3C). While apoptosis is identified
as a contributing mechanism for DZNep cytotoxicity, other possible mechanisms
including autophagy or senescence may be responsible for the large reduction in cellular
viability with multiple drugs. Taken together, these results indicate that acyl derivatives
of one or both nucleosides can substantially potentiate the anti-proliferative effects of
pancreatic cancer cells by overcoming dependence on cellular transport barriers.
However, these results also indicate that the prodrugs may compromise the selective anti-
proliferative effects seen in parent DZNep since cytotoxicity also increased in HPDE.
DZNep rapidly and reversibly decreases H3K27 and H4K20, but increases H3K9,
trimethylations in pancreatic cancer cells. To investigate whether DZNep influences
chemosensitivity in pancreatic cancer by affecting histone methylation-dependent
chromatin states, we profiled methylation marks in key lysine residues in histones H3 and
H4. Western blotting analyses indicated that in untreated conditions, H3K9 was

96
Figure 4.4. DZNep alters histone lysine methylation and methyltransferase and
demethylase expressions in pancreatic cancer. A. Changes in methylation levels of
H3K4, H3K9, H3K27, and H4K20 in HPDE and MIA PaCa-2 treated with DZNep (0-
100 µM). Cells were treated with DZNep for 24 h, and whole cell lysates (50 µg) were
subjected to Western blotting analysis. β-actin, the internal loading control, is shown
with a representative blot. B. Western blotting analysis of histone lysine
methyltransferases and demethylases in MIA PaCa-2 treated with DZNep (1 µM) for
up to 48 h. C. Histone methylation dynamics in MIA PaCa-2 treated with DZNep (1
µM) for up to 72 h.
predominantly monomethylated, H3K27 was trimethylated, and H4K20 was
dimethylated in MIA PaCa-2 (Fig. 4.4A). Treatment with increasing concentrations of
DZNep (1-100 μM) for 24 h clearly reversed at least two of these marks viz., increased
H3K9me3 and decreased H3K27me3 (Fig. 4.4A). Further, the DZNep-induced increase
in H3K9me3 was accompanied by a decrease in H3K9me1/2 forms; conversely, the
DZNep-induced decrease in H3K27me3 was accompanied by an increase in
H3K27me1/2 forms (Fig. 4.4A). DZNep treatment in MIA PaCa-2 also slightly decreased
H4K20, but not H3K4, trimethylation states. Further time course analyses of the two
distinct changes in the histone trimethylation states (i.e., H3K27 and H3K9) identified
decreases in H3K27me3 to occur as early as 8 h of DZNep treatment, whereas the
increase in H3K9me3 peaked only after 24 h of treatment (Fig. 4.4C). Unlike MIA PaCa-

97
2, DZNep treatment in HPDE cells produced no obvious changes in methylation states of
any of the histone lysines tested, suggesting that DZNep-induced chromatin alterations
were selective to cancerous pancreatic cells (Fig. 4.4A).
To test the mechanisms by which these methylation changes occurred, we profiled
the expressions of putative histone lysine methyltransferases and demethylases
implicated in these processes. Specifically, we tested changes in the levels of the PRC2
subunits (EZH2, SUZ12, and EED) and JMJD histone demethylases (JMJD1A, JMJD1B,
and JMJD2C) which have been reported to selectively target the methylation and
demethylation reactions in H3K27 and H3K9 residues, respectively. Western blotting
analyses of whole cell lysates prepared from DZNep-treated MIA PaCa-2 showed a
moderate decrease in EZH2 histone methyltransferase and significant decreases in
JMJD1A and JMJD2C histone demethylases correlating to changes observed in H3K27
and H3K9 methylations states, respectively (Fig. 4.4B). No significant changes were
observed in SUZ12, EED, and other JMJD subunits upon DZNep treatment (Fig. 4.4B).
Short DZNep priming prior to gemcitabine treatment shows superior
chemosensitizing effects compared with simultaneous exposure of both drugs: Inhibition
of H3K27me3 as a putative mark for DZNep chemosensitization. To test whether the
temporal differences in various lysine trimethylation changes correspond with changes in
gemcitabine chemosensitization, we next performed gemcitabine cytotoxicity analyses
after DZNep priming of Capan-1 and MIA PaCa-2 for various time periods (4, 8, and 12
h). Consistent with early and rapid inhibition of H3K27me3, maximal gemcitabine
chemosensitization was also observed in dosing schedules where the cells were primed
with DZNep for only a short 4-8 h period prior to gemcitabine treatment, and the changes

98
Figure 4.5. Short priming of DZNep demonstrated superior cytotoxicity and
synergy with gemcitabine than co-exposure of the two drugs. A. Short exposure
with DZNep for 4-8 h produced maximal cytotoxic effects. Cells were exposed with
DZNep at 1 µM for varying time intervals followed by increasing concentrations of
gemcitabine (0-0.1 µM). Significance between 0 and 4 h is indicated. B. Superior
cytotoxicity and synergism between gemcitabine and DZNep were observed when cells
were primed with DZNep, as opposed to cotreatment with gemcitabine. Representative
growth inhibition curves are shown. Twenty-four hours after 3x10³ cells/well were
seeded in a 96-well plate, cells were exposed to gemcitabine and DZNep
concentrations at a 1:10 ratio either as a co-treatment for 72 h (C) or a primed treatment
(with DZNep for 8 h followed by gemcitabine for 72 h) (P). Cellular viabilities were
measured using MTT assays. Significance between co-treatment and priming is
indicated. Combination index (CI) plots (insets) show the interactions between the two
drugs. CI>1, antagonism; CI=1, additivity; CI<1, synergism. Bars, SD. n=3. *p<0.05,
**p<0.01. C. Apoptosis levels were significantly greater in Capan-1 and MIA PaCa-2
cells with priming compared with co-treatment, while apoptosis levels in HPDE
decreased with priming. Cells were either co-treated with 10 μM DZNep and 1 μM
gemcitabine or primed with 10 μM DZNep for 8 h followed by 1 μM gemcitabine.
Fluorescence values were background-subtracted and are indicated as fold-change from
co-treatment to priming. Significant differences between co-treatment and priming
were identified using the Student’s t test. Bars, SD. n=3. *p<0.05, **p<0.01. D.
Maximal reduction in H3K27 trimethylation was seen with priming schedules at 1:10
DZNep:gemcitabine. MIA PaCa-2 was treated with vehicle, gemcitabine for 72 h,

99
DZNep for 8 h, DZNep and gemcitabine for 72 h, or DZNep for 8 h followed by
gemcitabine for 72 h. 100 µg of whole cell lysates were subjected to Western blotting
analysis. Blots were stripped and re-probed for β-actin, the internal loading control.
Densitometry ratios are indicated.
did not significantly increase any further with a later priming time (12 h) (Fig. 4.5A).
Such increases in synergistic drug responses with short DZNep priming were also greater
than that observed when DZNep was co-treated with gemcitabine for the entire 72 h (Fig.
4.5B). A decrease in cellular viability in MIA PaCa-2 was evident throughout, but only
statistically significant at the highest concentration. For Capan-1, no statistical
differences were observed; however, synergism was distinctly increased with priming.
Intriguingly, short priming of DZNep for 8 h augmented its antagonistic interaction with
gemcitabine in HPDE causing a further reduction in the extent of cytotoxicity (Fig. 4.5B).
Statistically significant increases in caspase-3 levels further support apoptosis as a major
contributing factor to the observed reduced cellular viability in pancreatic cancer cells
(Fig. 4.5C). Taken together, these data suggest that short DZNep priming rather than
continuous co-treatment may chemosensitize pancreatic cancer cells to gemcitabine both
in an effective and a selective manner.
Finally, we tested the H3K27 and H3K9 trimethylation statuses during the entire
period of treatment with both DZNep and/or gemcitabine at varying schedules (short
priming or co-exposure) and ratios (1:10 or 10:1). Maximal reductions in H3K27me3
were noticed with the DZNep short priming schedule followed by gemcitabine treatment
at a 10:1 ratio (Fig. 4.5D). Although H3K9me3 was increased in the aforementioned
schedule, it was essentially less differentiable from the co-exposure schedule as well as
when the DZNep:gemcitabine ratios were different. Furthermore, the highest increase in

100
H3K9me3 was noted with the gemcitabine-alone schedule for the entire 72 h period,
where cytotoxicity observed was the minimal among all schedules tested (Fig. 4.5D).
These data further provide evidence that the loss of H3K27me3, and not increase in
H3K9me3, is the closest predictor of DZNep potentiation of gemcitabine
chemosensitivity in pancreatic cancer cells.
An engineered nanoparticle for spatiotemporal release of DZNep and
gemcitabine reduces DZNep dose while bringing maximal chemosensitivity. To enhance
tumor cell delivery of the drugs, we encapsulated DZNep and gemcitabine individually
into biodegradable poly(lactide-co-glycolide)-b-polyethyleneglycol (PLGA-b-PEG)
nanoparticle (NP) formulations (Fig. 4.6A). Transmission electron microscopy (TEM)
studies showed a uniform size distribution of both DZNep and gemcitabine NPs ranging
between 100-200 nM (Fig. 4.6B). In vitro release kinetics suggested a similar release
profile for both drugs with almost comparable physicochemical characteristics (Fig. 4.6C;
Table 4.2). Cytotoxicity analyses with drug-encapsulated NPs indicated that DZNep
entrapment within NPs can produce the same level of cytotoxicity as that of free DZNep
Table 4.2. Physiochemical characterization of NPs
Nanoparticle Size (nm) PDI Zeta Potential
(mV)
Loading (%) EE (%)
Gemcitabine DZNep Gemcitabine DZNep
Empty-PLGA-
b-PEG-OH-NPs
172 ± 2 0.13 -23.5 ± 1.3 - - - -
Gem-PLGA-b-
PEG-OH-NPs
200 ± 4 0.16 -27.6 ± 0.7 1.4 ± 0.1 - 6.6 ± 0.2 -
DZNep-PLGA-
b-PEG-OH-NPs
206 ± 2 0.16 -29.6 ± 0.1 - 1.9 ± 0.1 - 9.1 ± 0.6
Gem-DZNep-
PLGA-b-PEG-
OH-NPs
200 ± 2 0.17 -24.3 ± 4.9 1.3 ± 0.1 1.7 ± 0.2 6.2 ± 0.5 8.2 ± 0.7
Gem-DZNep-
PLGA-b-PEG-TPP-NPs
157 ± 1 0.20 16.4 ± 0.9 1.2 ± 0.2 1.6 ± 0.5 5.5 ± 0.8 7.7 ± 2.4
Gem-DZNep-
DSPE-PEG-NPs
167 ± 2 0.23 -17.9 ± 2.8 1.3 ± 0.2 1.9 ± 1.0 6.3 ± 0.8 8.9 ± 4.9

101
although at a much lower (~10-fold) concentration (Fig. 4.6D). A similar reduction in
dose requirement was also obtained with gemcitabine when used in NP formulation (Fig.
4.6D).
Since superior chemosensitization effects were seen when cells were initially
primed with DZNep for a short period of time, we engineered two different NP
formulations such that gemcitabine was encased in the core while DZNep was loaded
within the outer layer (Fig. 4.6A). The first strategy used DSPE-PEG-OH to create a lipid
layer to accommodate DZNep alone, and the second used a PLGA-b-PEG-TPP polymer
to keep the two drugs separated by a cationic charge (Fig. 4.6A). TEM studies once again
showed a uniform size distribution of both NP formulations (Fig. 4.6E). However,
comparison of gemcitabine and DZNep release kinetics showed a much more rapid
release of DZNep (~80% within 8 h) than gemcitabine in the former and a slightly greater
release of DZNep (~50% within 8 h) than gemcitabine in the latter (Fig. 4.6F). Treatment
of MIA PaCa-2 with each controlled-release NP type showed a superior cytotoxicity
response than gemcitabine and DZNep co-encapsulated NPs at the same ratios (IC50
reductions for DSPE formulation of 1.2-2.5-fold (p=0.48) and TPP formulation of 1.5-
4.9-fold (p=0.12)) (Fig. 4.6G). In both cases, a significant induction of apoptosis
consequent to inhibition of H3K27me3 was identified as a key mechanism for the
observed cytotoxicity (Figs. 4.6G-H).
Discussion
Advantages of gemcitabine for pancreatic cancer therapy include its mechanistic
attributes such as self-potentiation and masked chain termination [218], ability to expose

102
Figure 4.6. Spatiotemporal release of DZNep and gemcitabine using engineered
nanoparticles reduced drug dose while potentiating chemosensitivity. A. Spatial
distribution of DZNep and gemcitabine within NPs. Co-encapsulating double-emulsion
formulations were created using PLGA-b-PEG-OH (left), DSPE-PEG-OH (middle),
and PLGA-b-PEG-TPP (right). B and E. TEM illustrates the inner core and outer shell
of all the double-emulsion NPs created. Insets show the NPs at higher magnification.
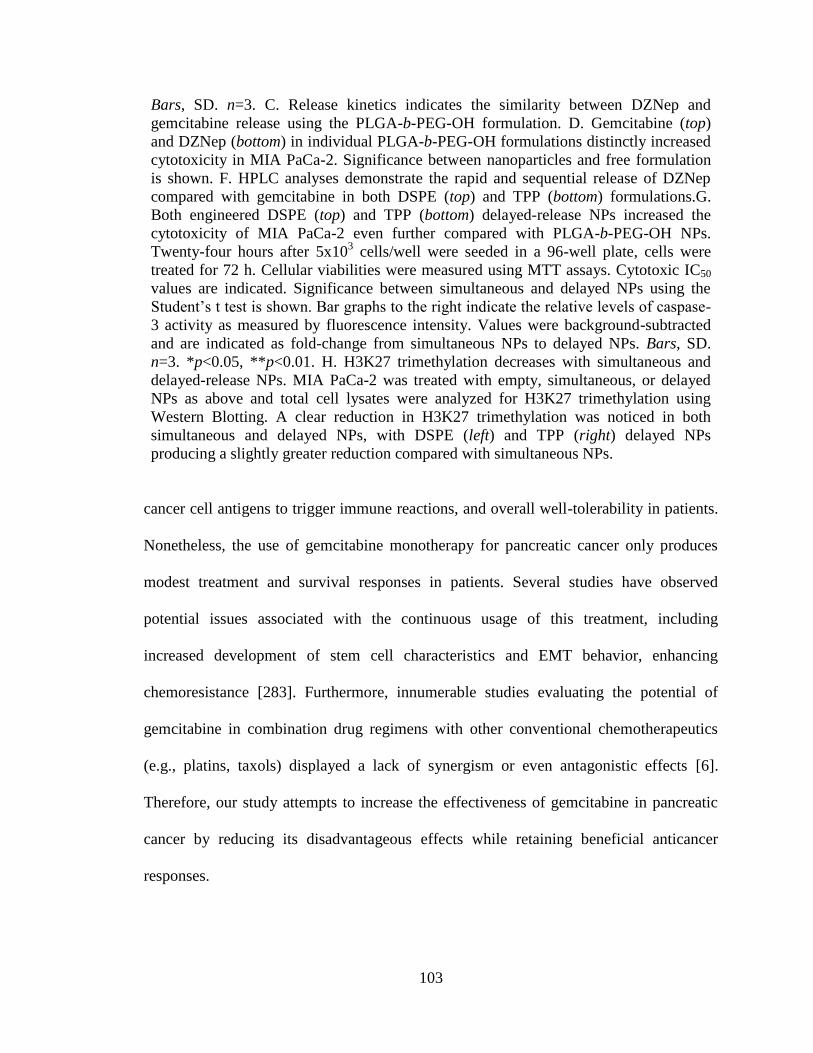
103
Bars, SD. n=3. C. Release kinetics indicates the similarity between DZNep and
gemcitabine release using the PLGA-b-PEG-OH formulation. D. Gemcitabine (top)
and DZNep (bottom) in individual PLGA-b-PEG-OH formulations distinctly increased
cytotoxicity in MIA PaCa-2. Significance between nanoparticles and free formulation
is shown. F. HPLC analyses demonstrate the rapid and sequential release of DZNep
compared with gemcitabine in both DSPE (top) and TPP (bottom) formulations.G.
Both engineered DSPE (top) and TPP (bottom) delayed-release NPs increased the
cytotoxicity of MIA PaCa-2 even further compared with PLGA-b-PEG-OH NPs.
Twenty-four hours after 5x10³ cells/well were seeded in a 96-well plate, cells were
treated for 72 h. Cellular viabilities were measured using MTT assays. Cytotoxic IC50
values are indicated. Significance between simultaneous and delayed NPs using the
Student’s t test is shown. Bar graphs to the right indicate the relative levels of caspase-
3 activity as measured by fluorescence intensity. Values were background-subtracted
and are indicated as fold-change from simultaneous NPs to delayed NPs. Bars, SD.
n=3. *p<0.05, **p<0.01. H. H3K27 trimethylation decreases with simultaneous and
delayed-release NPs. MIA PaCa-2 was treated with empty, simultaneous, or delayed
NPs as above and total cell lysates were analyzed for H3K27 trimethylation using
Western Blotting. A clear reduction in H3K27 trimethylation was noticed in both
simultaneous and delayed NPs, with DSPE (left) and TPP (right) delayed NPs
producing a slightly greater reduction compared with simultaneous NPs.
cancer cell antigens to trigger immune reactions, and overall well-tolerability in patients.
Nonetheless, the use of gemcitabine monotherapy for pancreatic cancer only produces
modest treatment and survival responses in patients. Several studies have observed
potential issues associated with the continuous usage of this treatment, including
increased development of stem cell characteristics and EMT behavior, enhancing
chemoresistance [283]. Furthermore, innumerable studies evaluating the potential of
gemcitabine in combination drug regimens with other conventional chemotherapeutics
(e.g., platins, taxols) displayed a lack of synergism or even antagonistic effects [6].
Therefore, our study attempts to increase the effectiveness of gemcitabine in pancreatic
cancer by reducing its disadvantageous effects while retaining beneficial anticancer
responses.

104
DZNep by itself exerted poor cytotoxicity in pancreatic cancer cells. Delayed and
moderate results were observed with effects at the most equaling gemcitabine only in
poorly-differentiated pancreatic cancer cell types. However, the drug was found to
increase differentiation and E-cadherin expression in other cancer types as well as
potentially reprogram gene expression [253]. Therefore, we predicted that DZNep could
compensate for the refractoriness acquired from gemcitabine treatment. Although the
exact mechanism of DZNep cellular action is unclear, based on its hydrophilicity (log P
of -1.38) [256], we speculated that DZNep cellular entry will depend on a transport
process. As noted in this report, DZNep appears to only partially utilize hENT1 and
hCNT3, which is relatively moderate considering its nucleoside analog structure. This
suggests that the drug may also utilize other classes of transporters capable of
transporting nucleosides in order to gain entry into cells. Whether diffusion also plays a
role is unclear; however, it is likely. Nevertheless, the dependence on transporters for
drug uptake could partially explain a previous study which noted the limited absorption,
reduced biodistribution, and rapid elimination of DZNep in mice [284]. More
importantly, since earlier studies identified that patients with low nucleoside transporter
expressions, especially hENT1 and hCNT3, exhibit poor treatment and survival outcomes
when treated with nucleoside analogs, we synthesized acyl prodrugs of DZNep to
maximize its cytotoxic response. The results support increased lipophilicity as a means to
bypass transport requirements and as a preferred strategy for enhancing nucleoside
analog efficacy in pancreatic cancer cells [278, 279]. Second, unlike gemcitabine, DZNep
is most likely not phosphorylated into an active form. Earlier studies have reported the
drug to be equally effective in cells expressing or lacking adenosine kinase [265],

105
suggesting it unlikely that phosphorylated metabolites of DZNep act as the active units
for cytotoxicity. Furthermore, the structure of DZNep does not indicate the likelihood for
phosphate group addition [285]. Consistently, and as demonstrated in this study,
epigenetic mechanisms such as alterations in histone methylations could aid in the
mechanism of DZNep action in pancreatic cancer cells.
The use of DZNep in combination with gemcitabine was investigated in detail for
potential enhancement of efficacy via advantageous interactions between the two
compounds. Further, since gemcitabine has the ability to enhance chemoresistance, it was
crucial to consider the pattern of dose exposure in pancreatic tumors especially to
minimize clonal expansion of populations with increased stemness. In this study, a prior
short exposure (i.e., priming) of DZNep was found to have pronounced overall cytotoxic
effects with less drug exposure compared with conventional dosing (i.e., co-treatment).
This illustrated the potential of DZNep to act as a potent chemosensitizing agent, rather
than a combination cytotoxic agent, for nucleoside analogs in treating pancreatic cancer.
While the avoidance of transport-based drug interactions (i.e., competition for cellular
entry, especially for broadly specific nucleoside transporters (hENT1, hCNT3)) could
contribute to the superiority of the priming schedule, DZNep also profoundly alters
histone methylation states in cancer cells. Therefore, it is speculated that the genetic
reprogramming consequent to post-translational modifications of histone lysines could
trigger downstream alterations of chemosensitizing factors advantageous to
gemcitabine’s mechanism of action. Consistently, DZNep effects in this study were
observed as early as 4 h, correlating with the approximate time needed for the
transcription of new genes. DZNep-responsive genes have been examined [267, 286];

106
however, their roles in chemosensitivity remain unknown, warranting further studies.
Since gemcitabine is a pyrimidine (cytidine) nucleoside analog and DZNep is a purine
(adenosine) nucleoside analog, it is also likely that the two could impact distinct
endogenous nucleotide pools and cellular targets, allowing their functions to synergize.
Conversely, our studies revealed an antagonistic interaction between DZNep and
gemcitabine in HPDE. While the mechanism for a cytoprotective response in normal
cells is presently unclear, the opposing action of DZNep on normal and cancerous
pancreatic cancer cells presents broader clinical implications for improving
chemotherapeutic efficacy in pancreatic tumors.
We found DZNep to rapidly and reversibly decrease H3K27me3 and increase
H3K9me3. In addition, both events appeared to be temporally separated during DZNep
treatment with the loss of H3K27me3 preceding the gain of H3K9me3. While some
studies show that an increase in H3K9me3 is associated with transcriptional repression,
the significance of the increase during DZNep treatment remains unclear, including
whether it favors or opposes chemosensitivity. However, a study by Rogenhofer et al.
identified overexpressed H3K9 methylation in benign renal tissue when compared with
cancerous, as well as a correlation between H3K9 and H4K20 methylation levels with
renal cell carcinoma progression [287]. Furthermore, the methylation statuses of H3K9
and H3K4 (both shown to be correlated with drug sensitivity [288, 289]) with respect to
DZNep treatment may simply be governed by their mutually-exclusive properties (i.e.,
H3K9 demethylation as a requirement for subsequent H3K4 methylation [290]). Since
both decreased H3K27 and increased H3K9 trimethylations are distinctly noted upon
DZNep treatment [270], we investigated these lysine alterations with cytotoxic response.
107
Clearly, maximal reduction of H3K27me3 was noticed in the DZNep short priming
schedule followed by gemcitabine treatment, corroborating the sustained inhibition of
H3K27me3, and not increase in H3K9me3, as a favorable histone lysine mark for
augmented nucleoside analog chemosensitization of pancreatic cancer cells.
Our data identified inhibition of JMJD1A and JMJD2C with DZNep treatment,
correlating with increased H3K9me3 and consistent with the specificity of these
demethylases to H3K9. However, our investigation into methylation changes in H3K27
demonstrated only moderately inhibited EZH2 protein, since it is known that EZH2
displays highest catalytic activity for the first monomethylation of H3K27 but relatively
weak capability for the subsequent di- and tri-methylations [291]. Despite the common
desire for a specific EZH2 inhibitor (since DZNep is a global methylation inhibitor, not
specific to EZH2) [256, 270], we believe this may actually be an advantage of the drug.
One study observed defects in organ development or function in mice with the
inactivation of EZH2 in adult stem cells [292], suggesting austere side effects in silencing
the protein entirely. In addition, reducing both mRNA and protein levels of EZH2 with
RNAi has been shown to result in different patterns of PRC2 target genes expressed as
compared with the pharmacological effects of DZNep on EZH2 [267]. Since DZNep
alters more than just the silencing of EZH2 (such as the hypomethylation of other genes
[284]), it seems the collective consequences may be what are contributing to its preferred
chemosensitizing effects.
While our studies address many of the concerns previously reviewed (i.e.,
increasing the hydrophilicity of DZNep and investigating its potential in combination
with a conventional chemotherapeutic agent [256]), the effects of DZNep on normal adult
108
stem and progenitor cells, remain unknown [292]. As noted by Crea et al., toxicokinetics
have not yet been conducted in humans, and the drug is still very investigational for its
use in cancer. Further, since some of our treatments were cytotoxic to even HPDE cells
(e.g., Troxacitabine Prodrug + DZNep Prodrug), the utility of DZNep may be best
increased by using a targeted method. In addition, DZNep augmentation of gemcitabine
chemosensitization in pancreatic cancer cell lines occurred only at a very high (≥1-20
μM) dose range. Furthermore, earlier in vivo mouse pharmacokinetic studies have
reported that DZNep is eliminated with a short half-life (12.8 min) and only poorly
distributes into peripheral tissues. Since more favorable pharmacokinetic profiles for
DZNep such as dose reduction, longer circulating half-life, and improved tumor targeting
due to enhanced permeation and retention (EPR) effects could all be obtained with
nanoparticle drug delivery, we further investigated the delivery of DZNep in nanoparticle
formulation into pancreatic cancer cells. As demonstrated in this study, engineered NPs
co-encapsulating both drugs and sequentially releasing DZNep followed by gemcitabine
led to improved efficacy in vitro, revealing the potential of the optimized epigenetic-
chemotherapeutic combination with targeted drug delivery.
In summary, we have developed in vitro optimization procedures for the DZNep-
gemcitabine combination against human pancreatic cancer cells. While gemcitabine alone
only produces modest effects in the cancer, the addition of DZNep synergizes the two
drugs to enhance overall efficacy in poorly-differentiated cancer cells but not normal
epithelial cells. By altering structure (DZNep acyl derivatives), dose (10:1 DZNep to
gemcitabine), exposure (4 h DZNep priming prior to 72 h gemcitabine treatment), and
formulation (engineered NPs), these results demonstrate potential for the use of this

109
epigenetic-chemotherapeutic combination approach for further studies in the treatment of
pancreatic cancer.

110
EMT-PHENOTYPE CELLS AND CHEMOSENSITIVITY

111
CHAPTER 5
EXPRESSION OF THE SET ONCOPROTEIN CONTRIBUTES TO THE
EPITHELIAL-MESENCHYMAL TRANSITION (EMT) OF PANCREATIC CANCER 5
5 SW Hung, K Naidu, H Lee, CA Gilbert, TT Hoang, T Nagy, and R Govindarajan. To be submitted to
Cancer Research.

112
Abstract
One of the key reasons for why pancreatic cancer has such a devastating
prognosis is due to 80-90% of diagnostic cases occurring when metastasis has already
presented. At the cellular level, activation of the epithelial-mesenchymal transition
(EMT) is a prerequisite for metastasis because it allows for the dissemination of primary
tumor cells to distant sites. In this study, we sought to determine the role of a novel
oncoprotein, an inhibitor of protein phosphatase 2A (PP2A) called SET, in EMT and
pancreatic tumor progression. Among the two major isoforms of SET (isoform 1
corresponding to TAFIα or I2PP2Aβ and isoform 2 corresponding to TAFIβ or
I2PP2Aα), higher protein levels of SET isoform 2 were identified in all aggressive
pancreatic cancer cell lines as well as in a subset of pancreatic tumors, especially the
poorly-differentiated pancreatic ductal adenocarcinomas (PDACs). Overexpressing this
cell-surface isoform 2, rather than the better-known nuclear isoform 1, in the epithelial
PANC-1 cell line induced EMT by causing a cuboidal, epithelial morphology and
promoting cellular proliferation, colony formation, migration, and invasion. Consistently,
knockdown of SET isoform 2 in the mesenchymal MIA PaCa-2 cell line reverted EMT
and all associated characteristics. The induction of EMT in cells by SET isoform 2 was
determined to be a result of cadherin switching (i.e., from expressing epithelial E-
cadherin to mesenchymal N-cadherin). Furthermore, mechanistic studies identified SET-
induced cadherin switching involved the SPARC/Slug and Rac1/JNK/c-Jun/AP-1
signaling pathways which inhibit E-cadherin and promote N-cadherin, respectively. In
vivo, SET isoform 2 overexpression in an orthotopic tumor model led to increased tumor
volume and metastatic ability, while SET isoform 2 knockdown reduced both features.

113
These findings have implications for the design and targeting of SET and its associated
pathways for intervening pancreatic tumor progression.
Introduction
Pancreatic cancer is currently the fourth leading cause of cancer-related deaths in
the U.S. [1] and is expected to become the second leading cause by as early as 2020
[293]. In other words, the annual incidence of pancreatic cancer is almost equal to the
mortality rate [1]. One of the key reasons for why pancreatic cancer has such a poor
prognosis is due to 80-90% of diagnostic cases occurring at stage IV, when metastasis
has already occurred and the median survival is only 4.5 months [1]. Metastasis is an
early event in pancreatic cancer and occurs after cells have undergone the epithelial-
mesenchymal transition (EMT). Activation of EMT allows for the dissemination of
primary tumor cells; hence, EMT is a prerequisite for metastasis [294]. EMT is a well-
characterized event in cancer progression during which cells transform from a cuboidal
shape with polarity to a squamous shape lacking polarity. This de-differentiation allows
cells to invade into the bloodstream and cause metastasis by forming a secondary tumor
on a distant site. Previously, we have shown that the SET oncoprotein is involved in
cellular differentiation [173]. SET expression was found to lead to a poorly-
differentiated, mesenchymal phenotype in cells, while knockdown of the protein in a
pancreatic cancer cell line, MIA PaCa-2, led to profound reductions in cellular
proliferation and colony-forming capacities.
Overexpression of the SET oncoprotein has been observed in numerous cancers,
including leukemias, lymphomas, nephroblastoma, hepatoma, and choriocarcinoma, with

114
poor patient outcome also correlating with the protein’s expression [295-301]. SET was
first discovered as template-activating factor-I (TAF-I) [295] and is also known as an
inhibitor of the tumor suppressor protein phosphatase 2A (PP2A); hence, SET is also
known as I2PP2A [302]. Although there are four protein isoforms of SET (Accessions:
(1) NP_001116293, (2) NP_003002, (3) NP_001234929, and (4) NP_001234930), each
differing only at the N-terminus (Fig. 5.1A), isoforms 1 and 2 are the most well-known
and correspond to I2βPP2A or TAF-1α and I2αPP2A or TAF-Iβ, respectively. In this
study, we investigated all SET isoforms as a whole as well as isoforms 1 and 2 alone.
While the numerous roles of SET are still being explored, it is known that SET is also an
inhibitor of histone H4 acetylation [303]. Additional roles of SET include its
relationships with Rac1 (i.e., Rac1 signaling is required for membrane recruitment of
SET leading to increased cell migration [304, 305]), the MEK/ERK pathway (i.e., SET
negatively regulates cellular proliferation via this pathway [306]), and the JNK pathway
(i.e., SET induces c-Jun/AP-1 activity through changes in c-Jun phosphorylation [307]).
Furthermore, both Shintani et al. and Park et al. have independently shown that inhibition
of JNK increases PP2A expression and decreases N-cadherin (N-cad) expression, a key
protein involved in promoting the mesenchymal phenotype in cells [308, 309].
Meanwhile, direct inhibition of PP2A through pharmaceutical means has already shown
promise in pancreatic cancer cells, with inhibition leading to overactivation of the c-Jun
N-terminal kinase pathway and inducing apoptosis [310-312].
With the numerous and various roles of SET in cancer development, the
oncoprotein may be a viable target for discovering a multi-pathway approach towards
cancer therapy [313]. With some clues about this novel protein, we sought to determine

115
the exact role of SET in pancreatic tumor development and progression. Here, we
elucidated a novel role for SET isoform 2 in inducing EMT through cadherin switching
and revealed the molecular pathways involved. SET isoform 2 expression also had
significant consequences on the metastatic ability of pancreatic cancer cells in vivo.
Materials and Methods
Cell Culture. The pancreatic cancer cell lines AsPC-1, BxPC-3, Capan-1, HPAF-
II, MIA PaCa-2, and PANC-1 were received from the American Type Culture Collection
(ATCC; Manassas, VA) cell bank. These cell lines were propagated, expanded, and
frozen immediately after arrival. The cells revived from the frozen stock were used
within 10-20 passages, not exceeding a period of 2-3 months. The ATCC uses
morphological, cytogenetic, and DNA profile analyses for characterization of cell lines.
Human pancreatic ductal epithelial (HPDE) cells were kindly received from Dr. Ming
Tsao of the Ontario Cancer Institute (Toronto, Canada). The L3.6pl cell line was kindly
received from Dr. Isiah D. Fidler at The University of Texas MD Anderson Cancer
Center (Houston, TX). Both HPDE and L3.6pl cell lines were handled as other cell lines
and were genotyped by DNA fingerprinting (PowerPlex 16; Promega, Madison, WI) as
per the manufacturer’s instructions. The growth conditions of all cell lines were
performed as described previously [219].
Reagents and Antibodies. Fetal bovine serum (FBS), 4′,6′-diamidino-2-
phenylindole (DAPI), propidium iodide, ethylene glycol bis(2-aminoethyl ether)
tetraacetic acid (EGTA), phenylmethanesulfonyl fluoride (PMSF), N-ethyl maleimide
(NEM), sodium orthovanadate (Na2VO4), and iodoacetamide were obtained from Sigma
116
Aldrich (St. Louis, MO). The bicinchoninic acid (BCA) protein assay reagent and West
Pico Chemiluminiscent substrate were from Pierce Chemical (Rockford, IL). Fluorescent
anti-fade mounting reagent was obtained from Molecular Probes (Invitrogen, Life
Technologies, Carlsbad, CA). Plasticware for cell culture was obtained from Corning
(Corning, NY). All cell culture media were purchased from Mediatech (Manassas, VA)
except for the human keratinocyte basal medium which was procured from Molecular
Probes.
The anti-human goat polyclonal I2PP2A (E-15), rabbit polyclonal N-cad (H-63)
for immunocytochemistry, c-Jun (H-79), and JNK2 (N-18), and mouse monoclonal JNK1
(F-3) and p-c-Jun (KM-1) antibodies were obtained from Santa Cruz Biotechnology
(Santa Cruz, CA). The anti-human rabbit polyclonal E-cad for Western blotting
(ab53033), SET isoform 1 (ab97596), SET isoform 2 (ab1183), and AP-1+2β (ab97434)
antibodies were from Abcam (Cambridge, MA). The anti-human rabbit polyclonal
SPARC (5420) and Na+/K
+ ATPase (3010) and rabbit monoclonal Slug (C19G7; 9585),
phospho-SAPK/JNK (Thr183/Tyr185; 81E11; 4668), vimentin (D21H3; 5741), and
lamin B1 (D9V6H; 13435) antibodies were purchased from Cell Signaling Technology
(Danvers, MA). The anti-human mouse N-cad for Western blotting (610920) and Rac1
(610651) antibodies were obtained from BD Biosciences (San Jose, CA). The mouse
monoclonal anti-β-actin antibody (A1978) was purchased from Sigma-Aldrich. The
rabbit polyclonal anti-HA antibody and HRP-conjugated secondary antibodies were from
Bethyl Laboratories (Montgomery, TX). The anti-human mouse monoclonal E-cad
antibody for immunocytochemistry was kindly provided by Dr. Parmender Mehta of the
University of Nebraska Medical Center (Omaha, NE).

117
Tumor RNA and Tissues. Total RNA from 19 PDAC tissues and 4 normal
pancreatic tissues were acquired from OriGene (Rockville, MD). Five PDAC tissue
samples along with their matched normal adjacent tissues were procured from the
National Disease Research Interchange (Philadelphia, PA) [219]. The NDRI obtains
written consents from the sources. The procurement and use of these human tissues was
done in accordance with the University of Georgia Institutional Review Board. The
Board has determined that the use of human biological tissues in this research does not
meet the criteria for research involving human subjects per 45 CFR 46.102, and therefore
does not require human subject approval by the Board.
Quantitative Real-time PCR, Western Blot Analysis, Immunocytochemistry,
Cellular Proliferation Assay, and Colony Formation Assay. These procedures were
performed as described earlier [173, 219, 221]. TaqMan primers and probes for SET
(Hs00853870_g1), SET isoform 1 (custom synthesized to nucleotides 28-49 of the CDS),
SET isoform 2 (Hs01118851_m1), CDH1 (Hs01013959_m1), CDH2 (Hs00983062_m1),
SPARC (Hs00234160_m1), SNAI2 (Hs00950344_m1), and GusB (Hs99999908_m1)
were obtained from Applied Biosystems (Life Technologies).
Plasmid Construction and Retroviral Gene Transfer. The GIPZ Lentiviral Mouse
SET shRNA construct (Thermo Scientific, Waltham, MA) was obtained and utilized as
previously described [173]. The pcDNA-SET-FLAG-HA construct was obtained from
Dr. Judy Lieberman via AddGene (Plasmid 24998). The insert was then subsequently cut
out of the pcDNA3.1 vector using BamHI and XhoI and ligated to the pLNCX2 vector at
the BglII and SalI sites. The empty vector was used as a control. Transfection into the
packaging cell line, Phoenix-H, and subsequent infection of the viral particles into

118
PANC-1 were performed as described earlier [219]. Cells were selected and maintained
with G418 (800 and 200 µg/ml, respectively).
Cell Surface Protein Isolation. Isolation of the cell surface fraction of proteins
was conducted using the Pierce® Cell Surface Protein Isolation Kit (Thermo Scientific)
as per the manufacturer’s instructions and as previously described [219]. Briefly, cells
were washed twice with ice-cold PBS and subsequently biotinylated with 0.25 mg/ml
Sulfo-NHS-SS-Biotin for 30 minutes on an orbital shaker at 4°C. The reaction was
quenched, and cells were collected by scraping followed by centrifugation. Cells were
lysed with 500 µl of Lysis Buffer containing a protease inhibitor cocktail (Roche) for 30
minutes on ice with intermittent homogenization using a 23G needle and syringe. A
sample of the total lysate was retained for analysis of total proteins. The biotinylated
proteins were then bound to immobilized streptavidin-agarose beads (NeutrAvidin
Agarose slurry) by a one-hour incubation at room temperature using an end-over-end
rotator. The unbound proteins were then collected by centrifugation of the column at
1,000 x g for 2 minutes and retained for analysis of intracellular proteins. The
biotinylated proteins were eluted form the beads using SDS-PAGE buffer containing 50
mM DTT. The collected samples were then separated on SDS-PAGE for immunoblot
analysis.
Wound Healing Assay. 30x104 cells were seeded in a 6 cm dish and grown until
90-95% confluency. A single scratch across the dish was then made using a 200 µl
pipette tip. Images of the wound were taken at 0, 24, 48, and 72 h at 8x magnification
using a Nikon AZ100 Multizoom microscope.

119
EMT PCR Array Analysis. The human Epithelial to Mesenchymal Transition RT2
ProfilerTM
PCR Array (PAHS-090ZC-2) was purchased from Qiagen (Venlo,
Netherlands). The recommended RT2 First Strand Kit (330401) and RT
2 SYBR® Green
ROCTM
qPCR Mastermix (330520) were used as per the manufacturer’s instructions.
Transwell Assay. 2.5x10⁴ cells in serum-free medium were seeded into the upper
chamber of a 24-well transwell insert with 8.0 μm PET membrane pores and a BD
BioCoatTM
MatrigelTM
coating (Corning). Bottom wells were filled with complete
medium. Cells were allowed to invade through the pores for 48 h under cell culture
conditions. After incubation, the invaded cells that adhered to the bottom of the
membrane were then fixed with methanol and stained with crystal violet. Cells from the
upper surface of the filter were removed by scraping with a cotton swab. The number of
cells that penetrated the membrane was determined by counting the mean cell number of
five randomly selected high-power fields.
Animal Studies. All animal experiments were performed in accordance with the
Animal Care and Use Procedures at the University of Georgia, and the experimental
protocol was approved by the Institutional Animal Care and use Committee (IACUC) at
the University of Georgia. Immunocompromised mice were maintained in sterile
conditions, housed four to a cage, and allowed to acclimate for one week before the start
of the study. Food and water were provided ad libitum at all times. Mice were handled
under aseptic conditions including the wearing of gloves, gowns, and shoe coverings.
Eight-week old female NU/J athymic nude mice were purchased from The
Jackson Laboratory (Bar Harbor, ME). The mice underwent an established surgical
method for an orthotopic injection into the pancreas [314]. In brief, mice were

120
anesthetized with ketamine-xylazine (100 and 20 mg/kg, respectively), and the abdominal
skin and muscle layers were incised (approximately 1 cm) slightly medial to the splenic
silhouette. The pancreas was gently retracted and positioned to allow for the injection of
5x10⁶ cells in 50 µl of sterile HBSS containing 1% (v/v) Matrigel. After solidification of
the Matrigel (approximately 2 min), the pancreas was placed back into the abdominal
cavity, and both the muscle and skin layers were closed with interrupted sutures.
Following recovery from surgery, mice were monitored daily for 45 days.
As per the protocol, tumor volumes were measured and calculated as the mean of
the three dimensions (length x width x depth). Signs of macrometastases were observed,
and the primary tumor, liver, and spleen were harvested for micrometastic identification.
All tissues were snap frozen, sectioned for slide preparation, and examined histologically.
Statistical Analysis. The student's t test was used to identify significant
differences, and each experiment was repeated at least three times. Unless otherwise
indicated, p<0.05 and p<0.01 compared with control conditions were represented by one
and two asterisks, respectively.
Results
SET isoform 2 is highly overexpressed in poorly-differentiated pancreatic cancer
cells. Since our earlier study showed involvement of SET in pancreatic cancer cellular
growth suppression [173], we evaluated in further detail the role of SET in pancreatic
cancer tumor progression in this study. We began by identifying total SET expression in
a panel of pancreatic cancer cell lines which we have previously categorized based on
drug sensitivity and extent of differentiation [219]. Total SET expression was

121
investigated using a TaqMan probe for a 100 nt region in exon 8 as well as an antibody
(E-15) which binds to an internal region of SET, both tools common to all SET isoforms.
The results showed total SET transcript and protein levels increased in the majority of
pancreatic cancer cell lines (4/7 at the transcript level; 5/7 at the protein level) compared
with normal human pancreatic ductal epithelial cells (HPDE) (Fig. 5.1B-C). In particular,
significant increases were seen in the highly metastatic L3.6pl (transcript) as well as the
poorly-differentiated PANC-1 (protein) and MIA PaCa-2 (transcript and protein).
To investigate the precise isoform involvement, we utilized additional TaqMan
probes: one custom synthesized to probe a 22 nt region (nts 28-49 of the coding
sequence) in exon 1 specific to isoform 1 and another pre-synthesized to probe for a 125
nt region (nts 68-193 of the coding sequence) in exons 1-2 specific to isoform 2.
Likewise, antibodies for specific isoforms were used: one with an epitope for amino acids
1-11 of isoform 1 (97596) and another with an epitope for amino acids 3-18 of isoform 2
(1183). The protein levels of isoforms 3 and 4 were not able to be identified since
commercially available antibodies are not available; furthermore, qRT-PCR results
demonstrated them to be minor isoforms (i.e., expressed at much lower levels than
isoforms 1 and 2) with no significant change between normal and cancerous cell lines
(data not shown). Compared with normal HPDE, SET isoform 1 was significant
increased in four cell lines at the transcript level but only in one cell line (L3.6pl) at the
protein level (Fig. 5.1B-C). While SET isoform 2 was significantly increased in only
three cell lines at the transcript level (L3.6pl, Capan-1, and PANC-1), it was significantly
increased in all of the cancerous cell lines at the protein level compared with normal
HPDE (Fig. 5.1B-C).

122
Figure 5.1. SET isoform 2 is highly overexpressed in pancreatic cancer cells. A.
SET isoforms 1 and 2 only differ at the N-terminal end. Both isoforms possess a
putative region towards the N-terminal end for PP2A inhibitory activity and protein
dimerization, a nuclear localization signal sequence in the middle region, and a putative
region towards the C-terminal end for chromatin remodeling activity. The two isoforms
differ only in the first 38 (isoform 1) and 25 (isoform 2) amino acids of the protein. B.
SET transcript levels (all isoforms, isoform 1, and/or isoform 2) are significantly
increased in the L3.6pl, Capan-1, PANC-1, and MIA PaCa-2 cell lines compared with
normal HPDE. C. Protein levels of SET isoform 2 were significantly increased in all
the cancerous cell lines. Total SET was increased in all but one cell line, and SET
isoform 1 showed no significant increases except for L3.6pl. Whole cell lysates (50 µg)
were subjected to Western blotting analysis. β-actin, the internal loading control, is
shown with a representative blot. Bars, SD. n=3. *p<0.05, **p<0.01.
In summary, these results suggest that SET isoform 2 is overexpressed in at least
a subset of pancreatic cancer cell lines, particularly those that are poorly-differentiated
(PANC-1 and MIA PaCa-2) or highly metastatic (L3.6pl) [315-317]. Further, the increase
123
in total SET identified in the cancerous samples is likely due to an increase in isoform 2,
and not isoform 1, expression.
SET isoform 2 is localized in the nucleus and at the cell surface in poorly-
differentiated pancreatic cancer cells. SET was originally identified as a nuclear
oncoprotein. However, recent studies have also shown SET isoform 2 to be able to shuttle
between the nucleus and cell surface in a Rac1-dependent manner to facilitate cellular
migration [304, 305]. Since we found SET isoform 2 overexpressed in many metastatic
pancreatic cancer cell lines, we further investigated the localization of SET in the panel
of cells. Conducting immunocytochemical analysis using the SET E-15 antibody, the
distribution of SET was found to be cell type-dependent. In normal HPDE and two well-
differentiated pancreatic cancer cell lines (L3.6pl and Capan-1), the protein was
predominantly nuclear (Fig. 5.2A). In contrast, SET was located in the nucleus,
cytoplasm, and cell surface in poorly-differentiated PANC-1 and MIA PaCa-2 (Fig.
5.2A).
To investigate differences in isoforms, we used the SET isoform 1 (97596) and
isoform 2 (1183) antibodies for immunocytochemical analysis. SET isoform 1 was found
to be only nuclear in all cell lines, whereas SET isoform 2 was mainly nuclear in HPDE
and other well-differentiated cell lines and mainly at the cell surface in PANC-1 and MIA
PaCa-2 (Fig. 5.2A). Co-localization analysis clearly showed isoform 1 to be
predominantly in the nucleus and isoform 2 to be predominantly at the cell surface (Fig.
5.2A). To further corroborate these findings, we subjected whole cell lysates for cellular
fractionation. With the nuclear and cell surface fractions separated, Western blotting
analysis confirmed the predominant nuclear localization of SET isoform 1 and

124
Figure 5.2. SET isoform 2 is localized in the nucleus and at the cell surface in
poorly-differentiated pancreatic cancer cells. A. The distribution of the two SET
isoforms is cell type-dependent. SET isoform 1 (green) is nuclear in all cell lines, while
isoform 2 (red) is mainly nuclear in HPDE, L3.6pl, and Capan-1 and mainly at the cell
surface in PANC-1 and MIA PaCa-2. Merging with DAPI (blue) clearly indicates the
locations of each isoform as well as their colocalization in HPDE cells (yellow). B.
SET isoform 1 is predominantly located in the nucleus, while SET isoform 2 is
predominantly located in the cytosol and at the cell surface. The nuclear fraction was
separated from whole cell lysates and, along with the cytosolic fraction, subjected to
Western blotting analysis. β-actin was used as the internal loading control, while lamin
B1 was used as the nuclear loading control. n=3.
125
predominant cell surface localization of SET isoform 2 (Fig. 5.2B). These results
illustrate the cell surface localization of SET isoform 2 in poorly-differentiated pancreatic
cancer cell lines.
SET isoform 2 induces EMT and promotes growth, migration, and invasion of
pancreatic cancer cells. To identify the role of SET isoform 2 in poorly-differentiated
pancreatic cancer cells, we retrovirally overexpressed SET isoform 2 in the inherently
epithelial PANC-1 (Fig. 5.3A). We also knocked down endogenous SET expression
using an shRNA construct against mouse SET, which has 85 and 86% protein homology
to human SET isoforms 1 and 2, respectively, in the inherently mesechymal MIA PaCa-2
(Fig. 5.3A). Compared with controls, PANC-1 cells with SET overexpression (PANC-1-
SET-HA) were found to have a more mesenchymal morphology, while MIA PaCa-2 cells
with SET knockdown (MIA PaCa-2-SET-shRNA) were found to have a more epithelial
morphology (Fig. 5.3B). Furthermore, expression of vimentin and the formation of actin
stress fibers were also found to increase with increasing SET expression and
mesenchymal morphology (Fig. 5.3A-B), suggesting the induction and progression of
EMT with SET isoform 2 expression. With further investigation of the effects of SET
isoform 2 on EMT, we found increased SET expression to promote cellular growth,
colony formation, migration, and invasion in PANC-1 (Fig. 5.3C-F). Consistently,
knockdown of SET isoform 2 in MIA PaCa-2 reverted these EMT characteristics (Fig.
5.3C-F).
SET isoform 2 promotes cadherin switching from E-cadherin to N-cadherin to
undergo EMT. With the arrangement of the pancreatic cell panel in decreasing order of
differentiation (HPDE to MIA PaCa-2), we found SET to moderately correlate in the

126
Figure 5.3. SET isoform 2 induces EMT and promotes growth, migration, and
invasion of pancreatic cancer cells. A. Overexpression of SET isoform 2 in PANC-1
increases vimentin protein levels while knockdown of SET in MIA PaCa-2 decreases
vimentin levels. Whole cell lysates (50 µg) were subjected to Western blotting
analysis. β-actin, the internal loading control, is shown with a representative blot. B.
SET isoform 2 expression induces EMT. Cells with overexpression of SET have a
more mesenchymal morphology, and cells with SET knockdown have a more cuboidal,
epithelial morphology. SET isoform 2 expression also correlated with increased actin
stress fibers (red). DAPI is shown (blue). C. SET isoform 2 expression promotes
cellular proliferation. Growth was measured using a colorimetric assay. D. Expression
of SET isoform 2 promotes cellular proliferation and colony formation. Cells were
grown for 96 h. E. SET isoform 2 expression promotes migration. Scratched wounds
were allowed to heal for up to 72 h. F. Expression of SET isoform 2 promotes invasion.
Cells were allowed to invade through the pores of a MatrigelTM
-coated transwell insert
for 48 h. Bars, SD. n=3. *p<0.05, **p<0.01.
reverse order (i.e., SET being highly expressed in the less differentiated cells). Therefore,
we hypothesized that SET expression at the cell surface influenced the expression of
cadherins to control EMT. To test this hypothesis, we first verified E-cad and N-cad

127
transcript levels in the pancreatic panel and found that E-cad levels were indeed higher in
well-differentiated HPDE, BxPC-3, HPAF-II, L3.6pl, and Capan-1, whereas N-cad levels
were highest in poorly-differentiated PANC-1 (Fig. 5.4A). Immunocytochemical analysis
of N-cad expression showed the protein co-localizing with SET at the cell surface in
Figure 5.4. SET isoform 2 promotes cadherin switching from E-cadherin to N-
cadherin to undergo EMT. A. E-cad and N-cad are oppositely expressed at the
transcript level in the pancreatic cell panel. E-cad levels are higher in well-
differentiated cell lines including HPDE, while N-cad levels are higher in poorly-
differentiated cell lines. B. SET isoform 2 expression (red) co-localized with N-cad
expression (green) at the cell surface (yellow). C. Cell surface expression of SET
isoform 2 correlates with N-cad expression and the lack of E-cad expression at the cell
surface. At the protein level, E-cad expression in cells decreases with poorer
differentiation, and N-cad expression is only found in three cell lines. The cell surface
fraction of whole cell lysates was isolated through biotinylation. D. SET isoform 2
expression correlates with increased N-cad (green) and decreased E-cad (red)
expressions. E. Overexpression of SET in PANC-1 increases N-cad and decreases E-
cad protein levels, while knockdown of SET in MIA PaCa-2 shows the opposite.
Whole cell lysates (50 µg) were subjected to Western blotting analysis. β-actin, the
internal loading control, is shown with a representative blot. Bars, SD. n=3. *p<0.05,
**p<0.01.

128
PANC-1 (Fig. 5.4B).
To identify E- and N-cad expression at the cell surface, we isolated cell surface
fractions of lysates and subjected them to Western blotting analysis. This clearly showed
E-cad expression decreasing with poorer differentiation and N-cad expression only in
HPAF-II, Capan-1, and PANC-1 (Fig. 5.4C). While HPAF-II, Capan-1, and PANC-1
expressed both cadherins, MIA PaCa-2 expressed neither cadherin (Fig. 5.4C). With the
cell surface expressions of total SET, SET isoform 1, and SET isoform 2, it was also
found that SET isoform 2 was expressed in N-cad-expressing cell lines (i.e., HPAF-II,
Capan-1, and PANC-1) and the cell surface cadherin-null cell line (i.e., MIA PaCa-2)
(Fig. 5.4C). Some cell surface expression of SET isoform 1 was also noticed in PANC-1
and MIA PaCa-2 (Fig. 5.4C). These studies suggest that the presence of SET at the cell
surface may induce cadherin switching from E-cad to N-cad.
To confirm this, we examined SET overexpression or knockdown, as
aforementioned, in a cell line expressing both E- and N-cad (PANC-1) and neither E- nor
N-cad (MIA PaCa-2). Overexpression of SET isoform 2 in PANC-1 increased N-cad
expression robustly and decreased E-cad (Fig. 5.4D-E). Similarly, knockdown of SET in
MIA PaCa-2 restored E-cad expression (Fig. 5.4D-E). Expressions of both cadherins
were seen at the cell surface (Fig. 5.4D). These studies confirm that expression of SET
isoform 2 at the cell surface promotes cadherin switching for the induction of EMT in
pancreatic cancer cells.
SET-induced cadherin switching involves the Rac1/JNK/c-Jun/AP-1 and
SPARC/Slug signaling pathways. Since N-cad has been shown to act downstream of
Rac1 and JNK1 [308, 318], we hypothesized that SET would act through this pathway to

129
Figure 5.5. SET-induced cadherin switching involves the Rac1/JNK/c-Jun/AP-1
and SPARC/Slug signaling pathways. A. SET isoform 2 expression alters the cellular
organizations and expressions of players in the Rac1/JNK/c-Jun/AP-1 pathway. B. SET
isoform 2 expression alters the protein levels of players in the Rac1/JNK/c-Jun/AP-1
pathway. Oppositely, a reduction in SET led to decreases in Rac1, JNK1, phospho-
JNK, c-Jun, phospho-c-Jun, and AP-1 levels. Whole cell lysates (100 µg) were
subjected to Western blotting analysis. GAPDH, the internal loading control, is shown
with a representative blot. C. In an RT-PCR profiler array for 84 EMT-related genes,
18 genes were up- or down-regulated >0.5-fold in SET knockdown cells compared
with WT. The genes with the greatest fold-change (down-regulated) included SPARC
and SNAI2. D. In independent RT-PCR experiments, significant decreases in both
SPARC and SNAI2 transcript levels were confirmed in MIA PaCa-2-SET-shRNA,
while transcript levels of the two candidates were increased in PANC-1-SET-HA. E.
At the protein level, Slug was also decreased in SET knockdown cells. SPARC was not
detectable via Western blotting. Whole cell lysates (50 µg) were subjected to Western
blotting analysis, and β-actin was used as the internal loading control. F. E-cad and
Slug were oppositely expressed. Slug (red) is expressed in the nucleus, while E-cad
(green) is expressed on the cell surface. Bars, SD. n=3. *p<0.05, **p<0.01.
inhibit N-cad expression. To test this hypothesis, we compared the expression levels of
key players involved in this pathway in both PANC-1-SET-HA and MIA PaCa-2-SET-

130
shRNA compared with control. Along with an increase in SET at the cell surface, Rac1,
JNK1, c-Jun, phospho-c-Jun, and AP-1 were also increased in PANC-1-SET-HA (Fig.
5.5A-B). Only a minor change was observed for JNK2. Oppositely, with SET knockdown
in MIA PaCa-2, Rac1 expression was decreased with significant reorganization as judged
by immunocytochemical analysis (Fig. 5.5A). JNK1, c-Jun, phospho-c-Jun, and AP
expressions were also reduced without significant changes in JNK2 (Fig. 5.5A-B). These
results suggest that SET expression increases N-cad through the Rac1/JNK/c-Jun/AP-1
pathway.
In order to understand SET regulation of E-cad expression, we performed a PCR
array for 84 genes known to be involved in EMT. These included, but were not limited
to, genes involved in cell adhesion, migration, cellular differentiation, morphogenesis,
development, growth, and proliferation. With the knockdown of SET in MIA PaCa-2, we
found 9 genes significantly upregulated and 9 genes significantly downregulated (fold-
change >3) with a maximal change in DSC2 (desmocollin 2; 76-fold downregulation).
Based on this analysis, we also found significant downregulation of both SPARC
(osteonectin; 74-fold) and SNAI2 (slug; 54-fold) (Fig. 5.5C), two transcriptional
repressors of E-cad. These results were validated separately using individual TaqMan
probes for SPARC and SNAI2 (Fig. 5.5D) as well as by Western blotting with protein-
specific antibodies (Fig. 5.5E). Expression of E-cad at the cell surface in contrast to the
expression of the transcription factor Slug in the nucleus was seen by
immunocytochemical analysis (Fig. 5.5F). These results suggest that SET inhibition of E-
cad expression is mediated through transcriptional repression of SPARC and SNAI2.

131
SET isoform 2 overexpression and cadherin switching were identified in patient-
derived, poorly-differentiated pancreatic cancer tissues. To determine the clinical
significance of the results, we looked at 19 pancreatic tumor tissues of varying degrees of
differentiation and compared them with 4 normal pancreatic tissues. SET and N-cad were
Figure 5.6. SET isoform 2 overexpression at the cell surface and cadherin
switching were identified in patient-derived, poorly-differentiated pancreatic
cancer tissues. A. Both SET isoform 2 and N-cad are overexpressed at the transcript
level in most pancreatic cancer tissue samples. SET isoform 1 mRNA was
overexpressed in a few samples, while E-cad mRNA levels were mainly unchanged or
decreased. B. SET transcript levels in the tissue samples correlated well with N-cad
expression (R=0.8). C. SET isoform 1, SET isoform 2, and N-cad transcripts were
overexpressed in all of the PDAC tissue samples. SET isoform 2 and N-cad were also
overexpressed in approximately half of the NET tissue samples. Only a low percentage
of tissue samples had a significantly increased amount of E-cad mRNA. D. SET
isoform 2 transcripts were overexpressed in all five normal-tumor tissue pairs. SET
isoform 1 and N-cad transcript levels either remained unchanged or decreased. PDAC,
pancreatic ductal adenocarcinoma. ACC, acinar cell carcinoma. NET, neuroendocrine
tumor. Bars, SD.

132
both increased while E-cad was decreased in the majority of tumor samples compared
with normal (Fig. 5.6A). Furthermore, overexpression of SET correlated with increased
N-cad expression within the same tumor samples (R=0.8) (Fig. 5.6B). When the tumor
samples were segregated by type, both SET isoforms as well as N-cad were
overexpressed in all pancreatic ductal adenocarcinoma (PDAC) samples (Fig. 5.6C).
Both SET isoforms were also overexpressed in approximately half of the neuroendocrine
tumor (NET) samples (Fig. 5.6C). To corroborate this further, we utilized five matched
normal-tumor tissue pairs from five different patients and examined the expression of
SET as well as the cadherins. Once again, SET isoform 2 transcripts were significantly
increased in all of the tumor samples (Fig. 5.6D).
SET isoform 2 expression promotes pancreatic tumor growth. The ability of SET
isoform 2 expression to influence tumor progression was investigated using orthotopic
mouse models of pancreatic cancer. Tumors were allowed to grow for 45 days, during
which the injected mice gained weight and the control mouse did not (Fig. 5.7A). The
injected mice gained approximately 1-2 g during the course of the experiment (Fig.
5.7A). Ultimately, tumors were identified in two PANC-1/LNCX2 mice (mice #3 and #4)
and one PANC-1/SET+ mouse (mouse #2). Overall, we found primary tumor volume to
increase with SET isoform 2 expression (Fig. 5.7B). The tumor expressing SET was
larger, denser, and 86% heavier than the PANC-1/LNCX2 tumors (Fig. 5.7B). Tumor
diameter also increased with SET expression, by approximately 47% or 5 mm (Fig.
5.7C). These results confirm that SET isoform 2 expression promotes tumor growth in
vivo.

133
Figure 5.7. SET isoform 2 expression increases tumor volume. A. Mice with
orthotopic tumor implantation gained weight post-surgery, whereas the control mouse
did not. The injected mice gained approximately 1-2 g over 45 days. B. The mouse
injected with PANC-1/SET+ cells developed a larger, denser, and heavier tumor than
the PANC-1/LNCX2 mouse. C. SET isoform 2 expression led to a larger tumor in
terms of diameter. The PANC-1/LNCX2 tumors were an average of approximately 5
mm smaller than the PANC-1/SET+ tumor.
Discussion
As a prerequisite for metastasis, the role of EMT in cancer progression is well-
established. However, many aspects regarding the regulation of EMT remain unknown.
Overexpression of the SET oncoprotein has been observed in numerous cancers, and our
previous study suggests its involvement in cellular differentiation and EMT [173]. In this
study, we continued our investigation of SET and elucidated its role in EMT and
pancreatic tumor progression.

134
Although there are four known isoforms of human SET, isoforms 1 and 2 are the
most studied. The two isoforms differ only at the N-terminal end, away from areas
relating to PP2A inhibitory activity or chromatin remodeling activity. In a panel of
pancreatic cell lines, SET isoform 2 was found to be highly overexpressed. Interestingly,
significant changes were seen in the highly metastatic L3.6pl and the poorly-
differentiated PANC-1 and MIA PaCa-2. It was also evident that the isoform was
expressed in the nucleus, in the cytoplasm, and at the cell surface rather than only in the
nucleus and cytoplasm as traditionally described. While SET is often regarded as a
nuclear oncoprotein, recent studies have shown its trafficking between the nucleus and
cell surface in a Rac1-dependent manner [304, 305].
By modulating the expression of SET, we observed the promotion and regression
of EMT in epithelial PANC-1 and mesenchymal MIA PaCa-2 cells, respectively. EMT
was characterized by morphology, the expression of mesenchymal markers, growth, and
colony formation, migration, and invasion abilities. While the relationship was not
absolute, we noticed that SET isoform 2 was expressed at the cell surface in cell lines
with N-cad cell surface expression and also a cell line with neither E-cad nor N-cad at the
cell surface. Therefore, the mechanism behind SET regulation of EMT was identified to
be cadherin switching from E-cad to N-cad. SET regulation of cadherin switching was
determined to be two-fold: the Rac1/JNK/c-Jun/AP-1 pathway promoting N-cad
expression and the SPARC/Slug pathway inhibiting E-cad expression. Significant
upregulation of these genes with SET expression was identified using an EMT PCR
profiling array; however, numerous additional EMT genes were found to be altered by
SET expression as well. Exactly how SET regulates these other genes remains unknown.
135
In a panel of patient-derived pancreatic cancer tissues, we confirmed cadherin
switching and SET isoform 2 overexpression. However, changes were most consistent in
the pancreatic ductal adenocarcinoma (PDAC) samples rather than the neuroendocrine
tumor (NET) samples, suggesting a more predominant role of SET in exocrine rather than
endocrine tumors.
In an orthotopic mouse model, we found SET isoform 2 expression to promote
pancreatic tumor growth. With SET expression, the primary tumor developed larger,
denser, and heavier than the primary tumors of the control counterpart. However, it is
unknown whether SET also promotes pancreatic tumor progression. While
macrometastases were not observed in the animals, further studies are needed to examine
secondary sites for micrometastases. At the cellular level, the expressions and
localizations of SET, N-cad, and E-cad also remain unidentified. Staining of tumor
cryosections will be necessary.
This study elucidates a novel role for SET isoform 2 in inducing EMT through
cadherin switching and revealed the molecular pathways involved. SET isoform 2
expression also had significant consequences on pancreatic primary tumor growth in vivo,
suggesting it can be utilized as a biomarker for early diagnosis or for early prediction of
metastasis, though additional studies are required. It is also unclear when during the
tumorigenic process the activation of SET and the switch in cadherins occur. Moreover,
the role of SET in directly determining chemosensitivity is not clear at this point,
although the oncoprotein is known to regulate the let-7 miRNA which influences
chemosensitivity [173].

136
SET’s involvement in EMT and cancer progression suggests that the oncoprotein
may also be a viable target for discovering a multi-pathway approach towards cancer
therapy. In addition to the genes and pathways examined in this study, SET
reprogrammed a number of additional EMT genes, implicating its role as a master
regulator. Furthermore, since the protein is part of the inhibitor of histone
acetyltransferase (INHAT) complex [192], it is possible that it exerts a chromatin effect
on EMT genes. More studies are required to understand this potential chromatin
remodeling process. Since SET isoform 2 is expressed at the cell surface, it could be an
ideal candidate for simple drug targeting, potentially allowing for anti-metastatic
intervention in pancreatic cancer patients.

137
CHAPTER 6
DISCUSSION
Major Conclusions and Future Directions
Although there are several other determinants, we have identified that E-cad
enhancement of gemcitabine efficacy occurs at least in part through hENT1. Expression
of E-cad in a cadherin-null cell line increased hENT1 expression, activity, and stability,
leading to increased cellular transport and cytotoxicity of gemcitabine. At this point, it
remains unclear whether E-cad expression also increases the recruitment, trafficking, and
basolateral membrane insertion of hENT1. Further, it is unknown whether N-cadherin,
which is highly implicated in EMT and metastasis, plays an opposing role in hENT1-
mediated gemcitabine efficacy. Identifying the direct mechanism between E-cad and
hENT1 as well as the status of N-cad in this scenario are two of our future aims.
The major conclusion from the second study is that co-expression of hCNT1 with
Cx32 increased gemcitabine accumulation within a population of heterogeneous cells.
Although it did not lead to a significantly enhanced gemcitabine response, there is
potential for increasing the bystander effect through favorable manipulations of certain
NTs and Cxs (GJs and hemichannels). However, further studies are needed to determine
which specific types and combinations of NTs and GJs are the most effective in doing so.
One possibility is the manipulation of Cx26 which has been recently shown to
significantly enhance the gemcitabine bystander effect in pancreatic cancer [174]. Our
138
future studies would include the use of co-culture experiments (i.e., using mixed
populations of cells expressing various NTs and GJs) to mimic the heterogeneity of
tumors and for testing the potential bystander effect.
In the third project, we have developed in vitro optimization procedures for the
DZNep-gemcitabine combination exclusively against human pancreatic cancer cells. By
altering structure, dose, exposure, and formulation, these results demonstrate potential for
the use of this epigenetic-chemotherapeutic combination approach for further studies in
the treatment of pancreatic cancer. Future directions will be aimed at identifying and
targeting the miRNA changes induced by DZNep. Since miRNAs have diverse targets,
preliminary studies by a current graduate student using miRNA knockdown models
revealed unprecedented phenotypes. Future studies in the lab will be focused on the
delivery of miRNAs in animals.
The last study elucidated the role of SET isoform 2 in promoting EMT and
metastasis. While we found SET to influence cadherin expression via the Rac1/JNK//c-
Jun/AP-1 and SPARC/Slug pathways, numerous additional EMT genes were found to be
modulated by the oncoprotein as well. Additional studies will be necessary to clarify
exactly how SET regulates these genes. Furthermore, the direct role of SET in
determining chemosensitivity remains unclear. Future aims for this project include
revealing additional genes and pathways altered by SET and the exact connection
between SET, let-7, and chemosensitivity.

139
Therapeutic Challenges in Overcoming Chemoresistance 6
Despite the abundance of common and novel chemotherapies, gemcitabine
remains the superior drug of choice for the treatment of pancreatic cancer due to its
ability to extend survival, although only by a mere few weeks, and improve the quality of
life with better tolerance. As one of the many enduring nucleoside analog drugs,
gemcitabine has been predicted to remain as the drug of choice for pancreatic cancer for
the near future even though its effects are truly suboptimal. In spite of considerable
efforts to improve the drug of choice, several other approaches (e.g., targeting stromal
pathways in tumors) for overcoming chemoresistance in pancreatic cancer have been
underway, bringing with them the new challenges they pose.
It is inarguable the abundance of consistent genetic and molecular alterations
observed in panIN, primary, and metastatic pancreatic neoplasms. Numerous large-scale
genomic sequencings and proteomic screenings have been conducted with novel
discoveries identified from the experiments. However, the direct applicability of these
potential biomarkers in patient populations remains unknown. For example, perhaps the
most recognized alteration noted in pancreatic cancer is the mutation of Kras. Although
targeting this player has thus far been unsuccessful due to the redundancy of cellular
signaling pathways and perhaps also the lessened dependency of cells on this pathway as
the disease progresses, a novel small molecule inhibitor of the Ras oncoprotein may
develop with promise [319]. While the utilization and targeting of such genetic and
molecular modifications remain a challenge in overcoming chemoresistance, the
identification of precise biomarkers is vital since they may be used for targeting tumor
6 SW Hung, H Mody, and R Govindarajan. 2012. Overcoming Nucleoside Analog Chemoresistance of
Pancreatic Cancer: A Therapeutic Challenge. Cancer Letters. 320: 138-149.
Reprinted here with permission of the publisher.

140
cells and for guiding therapy. Identifying cell surface markers could allow for the
targeting of tumor cells alone, leaving surrounding healthy cells in the heterogeneous
tumor microenvironment to thrive. Also, utilizing these markers could stratify patient
groups for individualized and tailored treatments. In addition to earlier diagnosis,
biomarkers also have the potential for therapeutic monitoring of patients, especially since
pancreatic cancer is known to undergo genetic mutations at a high frequency and rapid
changes in disease biology. Currently, challenges arise in both identifying appropriate
biomarkers for use in patient populations as well as in the practicality of screening a
patient in the narrow time period between initial diagnosis and start of treatment. Clinical
trial inconsistencies pose another challenge as the patient populations are often low in
number and heterogeneous (e.g., with some patients already under treatment and some
chemo-naïve). Well-annotated, patient-derived tumor samples remain a poorly available
resource for further research.
In addition to identifying genetic and molecular alterations, it is crucial to
understand when the changes occur during the progression of the disease. Pancreatic
cancer, like any other solid tumor, consists of multiple defined stages, yet all patients are
treated with the same drug (mainly due to diagnoses occurring at advance-stage disease).
With better comprehension of the changes that occur throughout the cancer, including
variations between the primary and secondary tumors and the primary and recurrent
tumors, tailored drug therapies can be developed. Furthermore, management of genetic
and molecular changes and disease monitoring are vital with disease progression.
Identification of genetic and molecular signatures that can segregate pancreatic tumors
into categories, such as those from Collison et al. (i.e., classical, quasimesenchymal, and

141
exocrine-like) [320], could lead to separate and appropriate treatment and management
strategies. Therefore, it is imperative to understand how the chemotherapeutic drugs exert
their efficacy as this information may be particularly useful when considering the
heterogeneity of pancreatic tumors.
Pancreatic tumors are well-known for their dense desmoplastic stroma and sparse,
collapsed vasculature, all characteristics impeding effective chemotherapy. Although the
tumors consist of both stromal and epithelial tissues, most earlier studies have focused
mainly on epithelial components. However, currently, an increased number of studies are
investigating the stroma of pancreatic tumors, including methods to target eminent
stromal pathways such as Hedgehog, TGF-β, and Wnt/PI3K as well as deplete stromal
tissues in order to stimulate angiogenesis and increase drug delivery. The former
approach (targeting the TGF-β pathway using the histone methylation reversal agent,
DZNep) is currently under investigation by a fellow graduate student in the lab, while the
latter is already being studied in numerous Phase I-III clinical trials. Furthermore, our
collaborative work with engineered nanoparticles attempts to overcome the many drug
delivery and exposure limitations in pancreatic cancer. Enhanced knowledge of the
heterogeneity of pancreatic tumors may lead to improved methods for overcoming
chemoresistance due to tumor diversity. Furthermore, accurate methods for diagnosis as
well as disease and therapeutic monitoring can be developed.
Significant advances have been made in the study of pancreatic cancer, including
the development of in vitro cell lines and in vivo mouse models. Although a plethora of
pancreatic cancer cell lines exist for study, their ability to mimic the wide range of
pancreatic tumor characteristics is lacking. For example, Collison et al. identified cells

142
lines that represented the classical and quasimesenchymal subtypes of pancreatic cancer
but not the exocrine-like subtype [320]. Although the use of cell lines for cancer study
remains valid, it is important to note the potential flaws of the model systems.
Furthermore, although novel mouse models such as the orthotopic and K-rasLSL-
G12D/+;Trp53
LSL-R172H/+;Cre (KPC) have been developed, there remains the issue of
interspecies differences in the development of chemoresistance. It is not yet fully
determined how well these murine models represent human pancreatic tumors in both
development and treatment outcomes. For example, the orthotopic model does not
generate enough stroma to mimic human tumors, and the KPC model does not contain
the entire spectrum of genetic mutations observed in human tumors. Although
developmental issues are evident, the relative significance of these differences on
influencing therapeutic outcome remains unknown. Ultimately, although great strides
have been made with the development and use of novel mouse models, there remains a
lack of model that has the ability to completely recapitulate human disease.
In addition to identifying new and far more improved drugs, an integrated
approach is needed to overcome chemoresistance. For example, the rational combinations
of the aforementioned therapies (Fig. 1.2), such as epigenetic agents, gene therapy,
antibodies, and signaling inhibitors, along with the use of chemotherapeutics still need
further explication. Our work with combining the epigenetic agent, DZNep, with the
chemotherapeutic, gemcitabine, attempts to delve into this unknown. Still, the direct
applicability of these therapies in combination (e.g., precise biomarker combinations to
target cancer cells of all stages) in guiding treatment remains unknown. Furthermore,
disconnect between benchtop, clinical, and regulatory science propels an additional,

143
complex challenge in overcoming pancreatic cancer. Currently, numerous clinical trials
remain at early investigational stages and are difficult to escalate to the level of approved
patient-use. Although divisions between specialized fields still exist, the process of
streamlining translational research is gaining momentum, and its persistence may
ultimately lead to overcoming the therapeutic challenges of pancreatic cancer.

144
REFERENCES
1. Cancer Facts & Figures 2014. 2014, American Cancer Society: Atlanta.
2. Cancer Basics: Lifetime Risk of Developing or Dying from Cancer. 2013;
Available from: http://www.cancer.org/cancer/cancerbasics/lifetime-probability-
of-developing-or-dying-from-cancer.
3. Stage IV Pancreatic Cancer Treatment. 2014; Available from:
http://www.cancer.gov/cancertopics/pdq/treatment/pancreatic/HealthProfessional/
page7.
4. Oettle, H., Neuhaus, P., et al., Adjuvant chemotherapy with gemcitabine and long-
term outcomes among patients with resected pancreatic cancer: the CONKO-001
randomized trial. Journal of the American Medical Association, 2013. 310(14): p.
1473-81.
5. Burris, H.A., Moore, M.J., et al., Improvements in survival and clinical benefit
with gemcitabine as first-line therapy for patients with advanced pancreas
cancer: a randomized trial. Journal of Clinical Oncology, 1997. 15(6): p. 2403.
6. Stathis, A. and Moore, M.J., Advanced pancreatic carcinoma: current treatment
and future challenges. Nature Reviews Clinical Oncology, 2010. 7(3): p. 163-172.
7. Wang, Z., Li, Y., et al., Pancreatic cancer: understanding and overcoming
chemoresistance. Nature Reviews Gastroenterology and Hepatology, 2011. 8(1):
p. 27-33.
8. Singh, A. and Settleman, J., EMT, cancer stem cells and drug resistance: an
emerging axis of evil in the war on cancer. Oncogene, 2010. 29(34): p. 4741-
4751.
9. Bhutia, Y.D., Hung, S.W., et al., CNT1 Expression Influences Proliferation and
Chemosensitivity in Drug-Resistant Pancreatic Cancer Cells. Cancer Research,
2011. 71(5): p. 1825.
10. Farrell, J., Garcia, M., et al., Human ENT1 Is Predictive of Response in Patients
With Pancreatic Cancer Treated With Gemcitabine: Results From the Rtog 9704
Prospective Randomized Trial. Pancreas, 2007. 35(4): p. 401.
11. Giovannetti, E., Del Tacca, M., et al., Transcription analysis of human
equilibrative nucleoside transporter-1 predicts survival in pancreas cancer
patients treated with gemcitabine. Cancer Research, 2006. 66(7): p. 3928.

145
12. Maréchal, R., Mackey, J.R., et al., Human equilibrative nucleoside transporter 1
and human concentrative nucleoside transporter 3 predict survival after adjuvant
gemcitabine therapy in resected pancreatic adenocarcinoma. Clinical Cancer
Research, 2009. 15(8): p. 2913.
13. Robins, M.J., Peng, Y., et al., Improved Syntheses of 5′-S-(2-Aminoethyl)-6-N-(4-
nitrobenzyl)-5′-thioadenosine (SAENTA), Analogues, and Fluorescent Probe
Conjugates: Analysis of Cell-Surface Human Equilibrative Nucleoside
Transporter 1 (hENT1) Levels for Prediction of the Antitumor Efficacy of
Gemcitabine. Journal of Medicinal Chemistry, 2010.
14. Spratlin, J., Sangha, R., et al., The absence of human equilibrative nucleoside
transporter 1 is associated with reduced survival in patients with gemcitabine-
treated pancreas adenocarcinoma. Clinical Cancer Research, 2004. 10(20): p.
6956.
15. Dean, M., Fojo, T., et al., Tumour stem cells and drug resistance. Nature Reviews
Cancer, 2005. 5(4): p. 275-284.
16. Visvader, J.E. and Lindeman, G.J., Cancer stem cells in solid tumours:
accumulating evidence and unresolved questions. Nature Reviews Cancer, 2008.
8(10): p. 755-68.
17. Easwaran, H., Tsai, H.C., et al., Cancer Epigenetics: Tumor Heterogeneity,
Plasticity of Stem-like States, and Drug Resistance. Molecular Cell, 2014. 54(5):
p. 716-727.
18. Bedi, U., Mishra, V.K., et al., Epigenetic plasticity: A central regulator of
epithelial-to-mesenchymal transition in cancer. Oncotarget, 2014. 5(8): p. 2016-
29.
19. Cheng, H., Shi, S., et al., microRNA signature for human pancreatic cancer
invasion and metastasis. Experimental and Therapeutic Medicine, 2012. 4(2): p.
181-187.
20. Meng, F. and Wu, G., The rejuvenated scenario of epithelial-mesenchymal
transition (EMT) and cancer metastasis. Cancer and Metastasis Reviews, 2012.
31(3-4): p. 455-67.
21. Tam, W.L. and Weinberg, R.A., The epigenetics of epithelial-mesenchymal
plasticity in cancer. Nature Medicine, 2013. 19(11): p. 1438-49.
22. Fitzgerald, T.L. and McCubrey, J.A., Pancreatic cancer stem cells: Association
with cell surface markers, prognosis, resistance, metastasis and treatment.
Advances in Biological Regulation, 2014.
23. Iwatsuki, M., Mimori, K., et al., Epithelial-mesenchymal transition in cancer
development and its clinical significance. Cancer Science, 2010. 101(2): p. 293-9.

146
24. Hermann, P.C., Huber, S.L., et al., Distinct populations of cancer stem cells
determine tumor growth and metastatic activity in human pancreatic cancer. Cell
Stem Cell, 2007. 1(3): p. 313-23.
25. Mani, S.A., Guo, W., et al., The epithelial-mesenchymal transition generates cells
with properties of stem cells. Cell, 2008. 133(4): p. 704-15.
26. Hamada, S., Satoh, K., et al., Regulators of epithelial mesenchymal transition in
pancreatic cancer. Frontiers in Physiology, 2012. 3: p. 254.
27. Infante, J.R., Jones, S.F., et al., A phase I, dose-escalation study of pomalidomide
(CC-4047) in combination with gemcitabine in metastatic pancreas cancer.
European Journal of Cancer, 2011. 47(2): p. 199-205.
28. Mackey, J.R., Mani, R.S., et al., Functional nucleoside transporters are required
for gemcitabine influx and manifestation of toxicity in cancer cell lines. Cancer
Research, 1998. 58(19): p. 4349.
29. Mackey, J.R., Yao, S.Y.M., et al., Gemcitabine transport in xenopus oocytes
expressing recombinant plasma membrane mammalian nucleoside transporters.
Journal of the National Cancer Institute, 1999. 91(21): p. 1876.
30. Nakano, Y., Tanno, S., et al., Gemcitabine chemoresistance and molecular
markers associated with gemcitabine transport and metabolism in human
pancreatic cancer cells. British Journal of Cancer, 2007. 96(3): p. 457-463.
31. Garcia-Manteiga, J., Molina-Arcas, M., et al., Nucleoside transporter profiles in
human pancreatic cancer cells: role of hCNT1 in 2', 2'-difluorodeoxycytidine-
induced cytotoxicity. Clinical Cancer Research, 2003. 9(13): p. 5000-5008.
32. Rauchwerger, D.R., Firby, P.S., et al., Equilibrative-sensitive nucleoside
transporter and its role in gemcitabine sensitivity. Cancer Research, 2000. 60(21):
p. 6075.
33. Murata, Y., Hamada, T., et al., Human equilibrative nucleoside transporter 1
expression is a strong independent prognostic factor in UICC T3–T4 pancreatic
cancer patients treated with preoperative gemcitabine-based chemoradiotherapy.
Journal of Hepato-Biliary-Pancreatic Sciences, 2011: p. 1-13.
34. Nishio, R., Tsuchiya, H., et al., Disrupted plasma membrane localization of
equilibrative nucleoside transporter 2 in the chemoresistance to gemcitabine
(dFdCyd) of human pancreatic cancer cells. Cancer Science, 2011. 102(3): p.
622-9.
35. Hu, X., Chen, W., et al., Downregulation of Human Equilibrative Nucleoside
Transporter 1 by RNAi Enhances 5--fluorouracil Response in Pancreatic Cancer.
Hepato-Gastroenterology, 2010. 57(104): p. 1567-1572.

147
36. Noma, B., Sasaki, T., et al., Expression of multidrug resistance-associated protein
2 is involved in chemotherapy resistance in human pancreatic cancer.
International Journal of Oncology, 2008. 33(6): p. 1187.
37. Kruh, G.D., Guo, Y., et al., ABCC10, ABCC11, and ABCC12. Pflügers Archiv -
European Journal of Physiology, 2007. 453(5): p. 675-684.
38. Hagmann, W., Jesnowski, R., et al., ATP-binding cassette C transporters in
human pancreatic carcinoma cell lines. Pancreatology, 2008. 9(1-2): p. 136-144.
39. Hopper-Borge, E., Xu, X., et al., Human multidrug resistance protein 7
(ABCC10) is a resistance factor for nucleoside analogues and epothilone B.
Cancer Research, 2009. 69(1): p. 178.
40. Rudin, D., Li, L., et al., Gemcitabine Cytotoxicity: Interaction of Efflux and
Deamination. Journal of Drug Metabolism and Toxicology, 2011. 2(107): p. 1.
41. Huang, P. and Plunkett, W., Induction of apoptosis by gemcitabine. Seminars in
Oncology, 1995. 22(4 Suppl 11): p. 19-25.
42. Ohhashi, S., Ohuchida, K., et al., Down-regulation of deoxycytidine kinase
enhances acquired resistance to gemcitabine in pancreatic cancer. Anticancer
Research, 2008. 28(4B): p. 2205.
43. Yao, J., Feng, F., et al., The mechanism of resistance to 2', 2'-
difluorodeoxycytidine (gemcitabine) in a pancreatic cancer cell line. Chinese
Journal of Oncology, 2005. 27(12): p. 721.
44. Kroep, J.R., Loves, W.J.P., et al., Pretreatment Deoxycytidine Kinase Levels
Predict in Vivo Gemcitabine Sensitivity. Molecular Cancer Therapeutics, 2002.
1(6): p. 371.
45. Funamizu, N., Okamoto, A., et al., Is the resistance of gemcitabine for pancreatic
cancer settled only by overexpression of deoxycytidine kinase? Oncology Reports,
2010. 23(2): p. 471-475.
46. Tang, K., Zhang, Z., et al., Enhancement of gemcitabine sensitivity in pancreatic
cancer by co-regulation of dCK and p8 expression. Oncology Reports, 2011.
25(4): p. 963-970.
47. Sebastiani, V., Ricci, F., et al., Immunohistochemical and genetic evaluation of
deoxycytidine kinase in pancreatic cancer: relationship to molecular mechanisms
of gemcitabine resistance and survival. Clinical Cancer Research, 2006. 12(8): p.
2492.
48. Williams, T.K., Costantino, C.L., et al., pp32 (ANP32A) Expression Inhibits
Pancreatic Cancer Cell Growth and Induces Gemcitabine Resistance by
Disrupting HuR Binding to mRNAs. PloS One, 2010. 5(11): p. e15455.
148
49. Costantino, C.L., Witkiewicz, A.K., et al., The role of HuR in gemcitabine
efficacy in pancreatic cancer: HuR up-regulates the expression of the gemcitabine
metabolizing enzyme deoxycytidine kinase. Cancer Research, 2009. 69(11): p.
4567.
50. Shipley, L.A., Brown, T.J., et al., Metabolism and disposition of gemcitabine, and
oncolytic deoxycytidine analog, in mice, rats, and dogs. Drug Metabolism and
Disposition, 1992. 20(6): p. 849-855.
51. Heinemann, V., Xu, Y.Z., et al., Cellular elimination of 2′, 2′-
difluorodeoxycytidine 5′-triphosphate: a mechanism of self-potentiation. Cancer
Research, 1992. 52(3): p. 533.
52. Mercier, C., Raynal, C., et al., Toxic death case in a patient undergoing
gemcitabine-based chemotherapy in relation with cytidine deaminase
downregulation. Pharmacogenetics and Genomics, 2007. 17(10): p. 841.
53. Farrell, J., Bae, K., et al., Cytidine deaminase single-nucleotide polymorphism is
predictive of toxicity from gemcitabine in patients with pancreatic cancer: RTOG
9704. The Pharmacogenomics Journal, 2011.
54. Tanaka, M., Javle, M., et al., Gemcitabine metabolic and transporter gene
polymorphisms are associated with drug toxicity and efficacy in patients with
locally advanced pancreatic cancer. Cancer, 2010. 116(22): p. 5325-5335.
55. Sugiyama, E., Kaniwa, N., et al., Population pharmacokinetics of gemcitabine
and its metabolite in Japanese cancer patients: impact of genetic polymorphisms.
Clinical Pharmacokinetics, 2010. 49(8): p. 549-558.
56. Ueno, H., Kaniwa, N., et al., Homozygous CDA*3 is a major cause of life-
threatening toxicities in gemcitabine-treated Japanese cancer patients. British
Journal of Cancer, 2009. 100(6): p. 870-873.
57. Eda, H. and Ura, M., The antiproliferative activity of DMDC is modulated by
inhibition of cytidine deaminase. Cancer Research, 1998. 58(6): p. 1165.
58. Pereira, S., Fernandes, P.A., et al., Mechanism for ribonucleotide reductase
inactivation by the anticancer drug gemcitabine. Journal of Computational
Chemistry, 2004. 25(10): p. 1286-1294.
59. Nakahira, S., Nakamori, S., et al., Involvement of ribonucleotide reductase M1
subunit overexpression in gemcitabine resistance of human pancreatic cancer.
International Journal of Cancer, 2007. 120(6): p. 1355-1363.
60. Akita, H., Zheng, Z., et al., Significance of RRM1 and ERCC1 expression in
resectable pancreatic adenocarcinoma. Oncogene, 2009. 28(32): p. 2903-2909.
149
61. Kim, R., Tan, A., et al., Prognostic roles of human equilibrative transporter 1
(hENT1) and ribonucleoside reductase subunit M1 (RRM1) in resected pancreatic
cancer. Cancer, 2011.
62. Duxbury, M.S., Ito, H., et al., Inhibition of SRC tyrosine kinase impairs inherent
and acquired gemcitabine resistance in human pancreatic adenocarcinoma cells.
Clinical Cancer Research, 2004. 10(7): p. 2307.
63. Duxbury, M.S., Ito, H., et al., Retrovirally mediated RNA interference targeting
the M2 subunit of ribonucleotide reductase: A novel therapeutic strategy in
pancreatic cancer. Surgery, 2004. 136(2): p. 261-269.
64. Duxbury, M.S., Ito, H., et al., RNA interference targeting the M2 subunit of
ribonucleotide reductase enhances pancreatic adenocarcinoma chemosensitivity
to gemcitabine. Oncogene, 2004. 23(8): p. 1539-1548.
65. Fujita, H., Ohuchida, K., et al., Gene expression levels as predictive markers of
outcome in pancreatic cancer after gemcitabine-based adjuvant chemotherapy.
Neoplasia, 2010. 12(10): p. 807.
66. Itoi, T., Sofuni, A., et al., Ribonucleotide reductase subunit M2 mRNA expression
in pretreatment biopsies obtained from unresectable pancreatic carcinomas.
Journal of Gastroenterology, 2007. 42(5): p. 389-394.
67. Fowler, J.D., Brown, J.A., et al., Kinetic investigation of the inhibitory effect of
gemcitabine on DNA polymerization catalyzed by human mitochondrial DNA
polymerase. Journal of Biological Chemistry, 2008. 283(22): p. 15339.
68. Adema, A., Radi, M., et al., Troxacitabine prodrugs for pancreatic cancer.
Nucleosides, Nucleotides, and Nucleic Acids, 2007. 8(9): p. 1073-1077.
69. Castelli, F., Sarpietro, M.G., et al., Characterization of lipophilic gemcitabine
prodrug-liposomal membrane interaction by differential scanning calorimetry.
Molecular Pharmaceutics, 2006. 3(6): p. 737-744.
70. Brusa, P., Immordino, M.L., et al., Antitumor activity and pharmacokinetics of
liposomes containing lipophilic gemcitabine prodrugs. Anticancer Research,
2007. 27(1A): p. 195.
71. Stella, B., Arpicco, S., et al., Encapsulation of gemcitabine lipophilic derivatives
into polycyanoacrylate nanospheres and nanocapsules. International Journal of
Pharmaceutics, 2007. 344(1-2): p. 71-77.
72. Immordino, M.L., Brusa, P., et al., Preparation, characterization, cytotoxicity and
pharmacokinetics of liposomes containing lipophilic gemcitabine prodrugs.
Journal of Controlled Release, 2004. 100(3): p. 331-346.

150
73. Chen, P., Chien, P.Y., et al., In-vitro and in-vivo anti-cancer activity of a novel
gemcitabine-cardiolipin conjugate. Anti-Cancer Drugs, 2006. 17(1): p. 53.
74. Bergman, A.M., Adema, A.D., et al., Antiproliferative activity, mechanism of
action and oral antitumor activity of CP-4126, a fatty acid derivative of
gemcitabine, in in vitro and in vivo tumor models. Investigational New Drugs,
2011: p. 1-11.
75. Koolen, S., Witteveen, P., et al., Phase I study of oral gemcitabine prodrug
(LY2334737) alone and in combination with erlotinib in patients with advanced
solid tumors. Clinical Cancer Research, 2011. 17(18): p. 6071-82.
76. Wu, W., Sigmond, J., et al., Synthesis and biological activity of a gemcitabine
phosphoramidate prodrug. Journal of Medicinal Chemistry, 2007. 50(15): p.
3743-3746.
77. Kotchetkov, R., Groschel, B., et al., Antineoplastic activity of a novel multimeric
gemcitabine-monophosphate prodrug against thyroid cancer cells in vitro.
Anticancer Research, 2000. 20(5A): p. 2915-2922.
78. Jain, R.K. and Stylianopoulos, T., Delivering nanomedicine to solid tumors.
Nature Reviews Clinical Oncology, 2010. 7(11): p. 653-664.
79. Arias, J.L., Reddy, L.H., et al., Superior preclinical efficacy of gemcitabine
developed as chitosan nanoparticulate system. Biomacromolecules, 2011. 12(1):
p. 97-104.
80. Maeda, H., Tumor-selective delivery of macromolecular drugs via the EPR effect:
background and future prospects. Bioconjugate Chemistry, 2010. 21(5): p. 797-
802.
81. Bisht, S., Mizuma, M., et al., Systemic administration of polymeric nanoparticle-
encapsulated curcumin (NanoCurc) blocks tumor growth and metastases in
preclinical models of pancreatic cancer. Molecular Cancer Therapeutics, 2010.
9(8): p. 2255-64.
82. Aryal, S., Hu, C.M., et al., Combinatorial drug conjugation enables nanoparticle
dual-drug delivery. Small, 2010. 6(13): p. 1442-8.
83. Sloat, B.R., Sandoval, M.A., et al., In vitro and in vivo anti-tumor activities of a
gemcitabine derivative carried by nanoparticles. International Journal of
Pharmaceutics, 2011. 409(1-2): p. 278-88.
84. Chung, W.G., Sandoval, M.A., et al., Stearoyl gemcitabine nanoparticles
overcome resistance related to the over-expression of ribonucleotide reductase
subunit M1. Journal of Controlled Release, 2011.

151
85. Rejiba, S., Reddy, L.H., et al., Squalenoyl gemcitabine nanomedicine overcomes
the low efficacy of gemcitabine therapy in pancreatic cancer. Nanomedicine,
2011.
86. Reddy, L.H., Dubernet, C., et al., A new nanomedicine of gemcitabine displays
enhanced anticancer activity in sensitive and resistant leukemia types. Journal of
Controlled Release, 2007. 124(1-2): p. 20-7.
87. Reddy, L.H., Khoury, H., et al., Squalenoylation favorably modifies the in vivo
pharmacokinetics and biodistribution of gemcitabine in mice. Drug Metabolism
and Disposition, 2008. 36(8): p. 1570-7.
88. Bildstein, L., Dubernet, C., et al., Transmembrane diffusion of gemcitabine by a
nanoparticulate squalenoyl prodrug: an original drug delivery pathway. Journal
of Controlled Release, 2010. 147(2): p. 163-70.
89. Ambike, A., Rosilio, V., et al., Interaction of self-assembled squalenoyl
gemcitabine nanoparticles with phospholipid-cholesterol monolayers mimicking a
biomembrane. Langmuir, 2011. 27(8): p. 4891-9.
90. Arya, G., Vandana, M., et al., Enhanced antiproliferative activity of Herceptin
(HER2)-conjugated gemcitabine-loaded chitosan nanoparticle in pancreatic
cancer therapy. Nanomedicine, 2011.
91. Patra, C.R., Bhattacharya, R., et al., Targeted delivery of gemcitabine to
pancreatic adenocarcinoma using cetuximab as a targeting agent. Cancer
Research, 2008. 68(6): p. 1970-8.
92. Brigger, I., Dubernet, C., et al., Nanoparticles in cancer therapy and diagnosis.
Advanced Drug Delivery Reviews, 2002. 54(5): p. 631-51.
93. Arias, J.L., Reddy, L.H., et al., Magnetoresponsive squalenoyl gemcitabine
composite nanoparticles for cancer active targeting. Langmuir, 2008. 24(14): p.
7512-9.
94. Arias, J.L., Reddy, L.H., et al., Squalene based nanocomposites: a new platform
for the design of multifunctional pharmaceutical theragnostics. ACS Nano, 2011.
5(2): p. 1513-21.
95. Galmarini, C.M., Warren, G., et al., Efficient overcoming of drug resistance to
anticancer nucleoside analogs by nanodelivery of active phosphorylated drugs.
International Journal of Pharmaceutics, 2010. 395(1-2): p. 281-9.
96. Hillaireau, H., Le Doan, T., et al., Hybrid polymer nanocapsules enhance in vitro
delivery of azidothymidine-triphosphate to macrophages. Journal of Controlled
Release, 2006. 116(3): p. 346-52.
152
97. Saiyed, Z.M., Gandhi, N.H., et al., AZT 5'-triphosphate nanoformulation
suppresses human immunodeficiency virus type 1 replication in peripheral blood
mononuclear cells. Journal of NeuroVirology, 2009. 15(4): p. 343-7.
98. Nakamori, S., Endo, W., et al., Multicenter Phase II Study of Pre-Administered
Uracil/Tegafur (UFT) Plus Gemcitabine for Unresectable/Recurrent Pancreatic
Cancer. Japanese Journal of Cancer and Chemotherapy, 2011. 38(5): p. 789.
99. Rivera, F., López-Tarruella, S., et al., Treatment of advanced pancreatic cancer:
from gemcitabine single agent to combinations and targeted therapy. Cancer
Treatment Reviews, 2009. 35(4): p. 335-339.
100. Furuse, J., Ishii, H., et al., Phase I study of fixed dose rate infusion of gemcitabine
in patients with unresectable pancreatic cancer. Japanese Journal of Clinical
Oncology, 2005. 35(12): p. 733.
101. Brand, R., Capadano, M., et al., A phase I trial of weekly gemcitabine
administered as a prolonged infusion in patients with pancreatic cancer and other
solid tumors. Investigational New Drugs, 1997. 15(4): p. 331-341.
102. Tempero, M., Plunkett, W., et al., Randomized phase II comparison of dose-
intense gemcitabine: thirty-minute infusion and fixed dose rate infusion in
patients with pancreatic adenocarcinoma. Journal of Clinical Oncology, 2003.
21(18): p. 3402.
103. Poplin, E., Levy, D., et al., Phase III trial of gemcitabine (30-minute infusion)
versus gemcitabine (fixed-dose-rate infusion [FDR]) versus gemcitabine+
oxaliplatin (GEMOX) in patients with advanced pancreatic cancer (E6201).
Journal of Clinical Oncology, 2006. 24(18 suppl): p. 4004.
104. Mané, J.M., Sancho, A., et al., Fixed-dose-rate gemcitabine infusion in patients
with advanced pancreatic or biliary tree adenocarcinoma. Tumori, 2010. 96(3):
p. 405-410.
105. Bengala, C., Guarneri, V., et al., Prolonged fixed dose rate infusion of
gemcitabine with autologous haemopoietic support in advanced pancreatic
adenocarcinoma. British Journal of Cancer, 2005. 93(1): p. 35-40.
106. Ulrich Pur, H., Kornek, G.V., et al., A phase II trial of biweekly high dose
gemcitabine for patients with metastatic pancreatic adenocarcinoma. Cancer,
2000. 88(11): p. 2505-2511.
107. Hirao, K., Kawamoto, H., et al., A 4-week versus a 3-week schedule of
gemcitabine monotherapy for advanced pancreatic cancer: a randomized phase II
study to evaluate toxicity and dose intensity. International Journal of Clinical
Oncology, 2011: p. 1-9.

153
108. Okada, S., Ueno, H., et al., Phase I trial of gemcitabine in patients with advanced
pancreatic cancer. Japanese Journal of Clinical Oncology, 2001. 31(1): p. 7.
109. Laquente, B., Lacasa, C., et al., Antiangiogenic effect of gemcitabine following
metronomic administration in a pancreas cancer model. Molecular Cancer
Therapeutics, 2008. 7(3): p. 638.
110. Pollera, C.F., Ceribelli, A., et al., Prolonged infusion gemcitabine: a clinical
phase I study at low-(300 mg/m 2) and high-dose (875 mg/m 2) levels.
Investigational New Drugs, 1997. 15(2): p. 115-121.
111. Eckel, F., Schmelz, R., et al., Phase II trial of a 24-hour infusion of gemcitabine
in previously untreated patients with advanced pancreatic adenocarcinoma.
Cancer Investigation, 2003. 21(5): p. 690-694.
112. Kuemmerle, A., Decosterd, L.A., et al., A phase I pharmacokinetic study of
hypoxic abdominal stop-flow perfusion with gemcitabine in patients with
advanced pancreatic cancer and refractory malignant ascites. Cancer
Chemotherapy and Pharmacology, 2009. 63(2): p. 331-341.
113. Vernejoul, F., Ghénassia, L., et al., Gene therapy based on gemcitabine
chemosensitization suppresses pancreatic tumor growth. Molecular Therapy,
2004. 14(6): p. 758-767.
114. Réjiba, S., Bigand, C., et al., Gemcitabine-based chemogene therapy for
pancreatic cancer using Ad-dCK:: UMK GDEPT and TS/RR siRNA strategies.
Neoplasia, 2009. 11(7): p. 637.
115. Kasuya, H., Mizuno, M., et al., Combined effects of adeno associated virus vector
and a herpes simplex virus mutant as neoplastic therapy. Journal of Surgical
Oncology, 2000. 74(3): p. 214-218.
116. Kasuya, H., Nishiyama, Y., et al., Intraperitoneal delivery of hrR3 and
ganciclovir prolongs survival in mice with disseminated pancreatic cancer.
Journal of Surgical Oncology, 1999. 72(3): p. 136-141.
117. Pérez-Torras, S., Garcia-Manteiga, J., et al., Adenoviral-mediated overexpression
of human equilibrative nucleoside transporter 1 (hENT1) enhances gemcitabine
response in human pancreatic cancer. Biochemical Pharmacology, 2008. 76(3):
p. 322-329.
118. Halloran, C.M., Ghaneh, P., et al., 5 Fluorouracil or gemcitabine combined with
adenoviral mediated reintroduction of p16INK4A greatly enhanced cytotoxicity in
Panc 1 pancreatic adenocarcinoma cells. The Journal of Gene Medicine, 2004.
6(5): p. 514-525.

154
119. Xu, Z.W., Friess, H., et al., Overexpression of Bax sensitizes human pancreatic
cancer cells to apoptosis induced by chemotherapeutic agents. Cancer
Chemotherapy and Pharmacology, 2002. 49(6): p. 504-510.
120. Prabhu, J.S., Korlimarla, A., et al., Gene-specific methylation: potential markers
for colorectal cancer. The International Journal of Biological Markers, 2009.
24(1): p. 57-62.
121. Iacobuzio-Donahue, C.A., Maitra, A., et al., Exploration of global gene
expression patterns in pancreatic adenocarcinoma using cDNA microarrays.
American Journal of Pathology, 2003. 162(4): p. 1151.
122. Fry, L.C., Mönkemüller, K., et al., Molecular markers of pancreatic cancer:
development and clinical relevance. Langenbeck's Archives of Surgery, 2008.
393(6): p. 883-890.
123. Habbe, N., Bert, T., et al., Identification of Methylation-Associated Gene
Expression in Neuroendocrine Pancreatic Tumor Cells. Pancreatology, 2007.
7(4): p. 352-359.
124. Yu, X.J., Long, J., et al., Analysis of gene expression profiles in pancreatic
carcinoma by using cDNA microarray. Hepatobiliary and Pancreatic Diseases
Internaional, 2003. 2(3): p. 467-470.
125. Qin, T., Castoro, R., et al., Mechanisms of Resistance to Decitabine in the
Myelodysplastic Syndrome. PloS One, 2011. 6(8): p. e23372.
126. Kelly, T.K., De Carvalho, D.D., et al., Epigenetic modifications as therapeutic
targets. Nature Biotechnology, 2010. 28(10): p. 1069-1078.
127. Rius, M., Stresemann, C., et al., Human concentrative nucleoside transporter 1-
mediated uptake of 5-azacytidine enhances DNA demethylation. Molecular
Cancer Therapeutics, 2009. 8(1): p. 225.
128. Geutjes, E.J., Tian, S., et al., Deoxycytidine kinase is overexpressed in poor
outcome breast cancer and determines responsiveness to nucleoside analogs.
Breast Cancer Research and Treatment, 2012: p. 1-10.
129. Missiaglia, E., Donadelli, M., et al., Growth delay of human pancreatic cancer
cells by methylase inhibitor 5-aza-2-deoxycytidine treatment is associated with
activation of the interferon signalling pathway. Oncogene, 2005. 24(1): p. 199-
211.
130. Yu, M. and Epner, E., The epigenetics of mantle cell lymphoma. Current
Treatment Options in Oncology, 2007. 8(5): p. 375-381.

155
131. Sato, N., Ohta, T., et al., FR901228, a novel histone deacetylase inhibitor, induces
cell cycle arrest and subsequent apoptosis in refractory human pancreatic cancer
cells. International Journal of Oncology, 2004. 24(3): p. 679-685.
132. Saito, A., Yamashita, T., et al., A synthetic inhibitor of histone deacetylase, MS-
27-275, with marked in vivo antitumor activity against human tumors.
Proceedings of the National Academy of Sciences, 1999. 96(8): p. 4592.
133. Xenidis, N., Chelis, L., et al., Docetaxel plus gemcitabine in combination with
capecitabine as treatment for inoperable pancreatic cancer: a phase II study.
Cancer Chemotherapy and Pharmacology, 2011: p. 1-8.
134. Donadelli, M., Costanzo, C., et al., Trichostatin A, an inhibitor of histone
deacetylases, strongly suppresses growth of pancreatic adenocarcinoma cells.
Molecular Carcinogenesis, 2003. 38(2): p. 59-69.
135. Moore, P.S., Barbi, S., et al., Gene expression profiling after treatment with the
histone deacetylase inhibitor trichostatin A reveals altered expression of both
pro-and anti-apoptotic genes in pancreatic adenocarcinoma cells. Biochimica et
Biophysica Acta (BBA) - Molecular Cell Research, 2004. 1693(3): p. 167-176.
136. Ryu, J.K., Lee, W.J., et al., SK-7041, a new histone deacetylase inhibitor, induces
G2-M cell cycle arrest and apoptosis in pancreatic cancer cell lines. Cancer
Letters, 2006. 237(1): p. 143-154.
137. Cecconi, D., Donadelli, M., et al., Proteomic analysis of pancreatic endocrine
tumor cell lines treated with the histone deacetylase inhibitor trichostatin A.
Proteomics, 2007. 7(10): p. 1644-1653.
138. Donadelli, M., Costanzo, C., et al., Synergistic inhibition of pancreatic
adenocarcinoma cell growth by trichostatin A and gemcitabine. Biochimica et
Biophysica Acta (BBA) - Molecular Cell Research, 2007. 1773(7): p. 1095-1106.
139. Gahr, S., Ocker, M., et al., The combination of the histone-deacetylase inhibitor
trichostatin A and gemcitabine induces inhibition of proliferation and increased
apoptosis in pancreatic carcinoma cells. International Journal of Oncology, 2007.
31(3): p. 567-576.
140. Piacentini, P., Donadelli, M., et al., Trichostatin A enhances the response of
chemotherapeutic agents in inhibiting pancreatic cancer cell proliferation.
Virchows Archiv, 2006. 448(6): p. 797-804.
141. Arnold, N.B., Arkus, N., et al., The histone deacetylase inhibitor suberoylanilide
hydroxamic acid induces growth inhibition and enhances gemcitabine-induced
cell death in pancreatic cancer. Clinical Cancer Research, 2007. 13(1): p. 18.
142. Richards, D., Boehm, K., et al., Gemcitabine plus CI-994 offers no advantage
over gemcitabine alone in the treatment of patients with advanced pancreatic
156
cancer: results of a phase II randomized, double-blind, placebo-controlled,
multicenter study. Annals of Oncology, 2006. 17(7): p. 1096.
143. Rachagani, S., Kumar, S., et al., MicroRNA in pancreatic cancer: pathological,
diagnostic and therapeutic implications. Cancer Letters, 2010. 292(1): p. 8-16.
144. Fu, S. and Kurzrock, R., Development of curcumin as an epigenetic agent.
Cancer, 2010. 116(20): p. 4670-4676.
145. Dhayat, S., Mardin, W.A., et al., Epigenetic markers for chemosensitivity and
chemoresistance in pancreatic cancer—A review. International Journal of Cancer,
2011.
146. Fahy, B.N., Schlieman, M.G., et al., Schedule-dependent molecular effects of the
proteasome inhibitor bortezomib and gemcitabine in pancreatic cancer. Journal
of Surgical Research, 2003. 113(1): p. 88-95.
147. Beumer, J.H., Eiseman, J.L., et al., Plasma pharmacokinetics and oral
bioavailability of 3, 4, 5, 6-tetrahydrouridine, a cytidine deaminase inhibitor, in
mice. Cancer Chemotherapy and Pharmacology, 2008. 62(3): p. 457-464.
148. Komori, S., Osada, S., et al., Contribution of thymidylate synthase to gemcitabine
therapy for advanced pancreatic cancer. Pancreas, 2010. 39(8): p. 1284.
149. Funamizu, N., Kamata, Y., et al., Hydroxyurea Decreases Gemcitabine
Resistance in Pancreatic Carcinoma Cells With Highly Expressed Ribonucleotide
Reductase. Pancreas, 2011.
150. Mitsuno, M., Kitajima, Y., et al., Tranilast strongly sensitizes pancreatic cancer
cells to gemcitabine via decreasing protein expression of ribonucleotide
reductase 1. International Journal of Oncology, 2010. 36(2): p. 341-349.
151. Binder, D., Hübner, R.H., et al., Pulmonary toxicity among cancer patients
treated with a combination of docetaxel and gemcitabine: A meta-analysis of
clinical trials. Cancer Chemotherapy and Pharmacology, 2011: p. 1-9.
152. Von Hoff, D.D., Ramanathan, R.K., et al., Gemcitabine Plus nab-Paclitaxel Is an
Active Regimen in Patients With Advanced Pancreatic Cancer: A Phase I/II Trial.
Journal of Clinical Oncology, 2011.
153. Spano, J.P., Moore, M.J., et al., Phase I study of axitinib (AG-013736) in
combination with gemcitabine in patients with advanced pancreatic cancer.
Investigational New Drugs, 2011: p. 1-9.
154. Renouf, D.J., Moore, M.J., et al., A phase I/II study of the Src inhibitor
saracatinib (AZD0530) in combination with gemcitabine in advanced pancreatic
cancer. Investigational New Drugs, 2010: p. 1-8.

157
155. Awasthi, N., Schwarz, M.A., et al., Antitumour activity of sunitinib in
combination with gemcitabine in experimental pancreatic cancer. HPB, 2011.
156. Adjei, A.A., Schwartz, B., et al., Early Clinical Development of ARQ 197, a
Selective, Non–ATP-Competitive Inhibitor Targeting MET Tyrosine Kinase for
the Treatment of Advanced Cancers. The Oncologist, 2011. 16(6): p. 788-799.
157. Starling, N., Hawkes, E., et al., A dose escalation study of gemcitabine plus
oxaliplatin in combination with imatinib for gemcitabine-refractory advanced
pancreatic adenocarcinoma. Annals of Oncology, 2011.
158. Richards, D.A., Kuefler, P.R., et al., Gemcitabine plus enzastaurin or single-agent
gemcitabine in locally advanced or metastatic pancreatic cancer: results of a
phase II, randomized, noncomparative study. Investigational New Drugs, 2011.
29(1): p. 144-153.
159. Pericay Pijaume, C., Escudero Emperador, P., et al., Open-label trial on efficacy
and security of treatment with gemcitabine and oral modulation with tegafur and
levofolinic acid (GEMTG) in patients with advanced pancreatic cancer. Clinical
and Translational Oncology, 2011. 13(1): p. 61-66.
160. Sung, V., Richard, N., et al., Histone deacetylase inhibitor MGCD0103 synergizes
with gemcitabine in human pancreatic cells. Cancer Science, 2011.
161. De Jesus-Acosta, A., Oliver, G.R., et al., A multicenter analysis of GTX
chemotherapy in patients with locally advanced and metastatic pancreatic
adenocarcinoma. Cancer Chemotherapy and Pharmacology, 2011: p. 1-10.
162. Hill, M.E., Li, X., et al., A phase I study of the biomodulation of capecitabine by
docetaxel and gemcitabine (mGTX) in previously untreated patients with
metastatic adenocarcinoma of the pancreas. Cancer Chemotherapy and
Pharmacology, 2011. 67(3): p. 511-517.
163. Sahora, K., Kuehrer, I., et al., NeoGemOx: Gemcitabine and oxaliplatin as
neoadjuvant treatment for locally advanced, nonmetastasized pancreatic cancer.
Surgery, 2011. 149(3): p. 311-320.
164. Hess, V., Pratsch, S., et al., Combining gemcitabine, oxaliplatin and capecitabine
(GEMOXEL) for patients with advanced pancreatic carcinoma (APC): a phase
I/II trial. Annals of Oncology, 2010. 21(12): p. 2390.
165. Cereda, S., Reni, M., et al., XELIRI or FOLFIRI as Salvage Therapy in Advanced
Pancreatic Cancer. Anticancer Research, 2010. 30(11): p. 4785.
166. Conroy, T., Desseigne, F., et al., FOLFIRINOX versus gemcitabine for metastatic
pancreatic cancer. New England Journal of Medicine, 2011. 364(19): p. 1817-
1825.

158
167. Olive, K.P., Jacobetz, M.A., et al., Inhibition of Hedgehog signaling enhances
delivery of chemotherapy in a mouse model of pancreatic cancer. Science, 2009.
324(5933): p. 1457.
168. Giovannetti, E., Leon, L., et al., Study of Apoptosis Induction and Deoxycytidine
Kinase/Cytidine Deaminase Modulation in the Synergistic Interaction of a Novel
Ceramide Analog and Gemcitabine in Pancreatic Cancer Cells. Nucleosides,
Nucleotides and Nucleic Acids, 2010. 29(4-6): p. 419-426.
169. Roman, N.O., Samulitis, B.K., et al., Imexon enhances gemcitabine cytotoxicity
by inhibition of ribonucleotide reductase. Cancer Chemotherapy and
Pharmacology, 2011. 67(1): p. 183-192.
170. Maier, H.J., Wirth, T., et al., Epithelial-mesenchymal transition in pancreatic
carcinoma. Cancers, 2010. 2(4): p. 2058-83.
171. Thiery, J.P. and Sleeman, J.P., Complex networks orchestrate epithelial-
mesenchymal transitions. Nature Reviews Molecular Cell Biology, 2006. 7(2): p.
131-42.
172. Kiesslich, T., Pichler, M., et al., Epigenetic control of epithelial-mesenchymal-
transition in human cancer. Molecular and Clinical Oncology, 2013. 1(1): p. 3-
11.
173. Bhutia, Y.D., Hung, S.W., et al., Differential processing of let-7a precursors
influences RRM2 expression and chemosensitivity in pancreatic cancer: Role of
LIN-28 and SET oncoprotein. PLOS ONE, 2013. 8(1): p. e53436.
174. Garcia-Rodriguez, L., Perez-Torras, S., et al., Connexin-26 is a key factor
mediating gemcitabine bystander effect. Molecular Cancer Therapeutics, 2011.
10(3): p. 505-17.
175. Lai, C.P., Bechberger, J.F., et al., Tumor-suppressive effects of pannexin 1 in C6
glioma cells. Cancer Research, 2007. 67(4): p. 1545-54.
176. Penuela, S., Gyenis, L., et al., Loss of pannexin 1 attenuates melanoma
progression by reversion to a melanocytic phenotype. Journal of Biological
Chemistry, 2012. 287(34): p. 29184-93.
177. Choi, O., Heathcote, D.A., et al., A deficiency in nucleoside salvage impairs
murine lymphocyte development, homeostasis, and survival. Journal of
Immunology, 2012. 188(8): p. 3920-7.
178. Toy, G., Austin, W.R., et al., Requirement for deoxycytidine kinase in T and B
lymphocyte development. Proceedings of the National Academy of Sciences,
2010. 107(12): p. 5551-6.

159
179. Bhalla, K. and Grant, S., Effect of deoxycytidine on the in vitro response of human
leukemia cells to inhibitors of de novo pyrimidine biosynthesis. Cancer
Chemotherapy and Pharmacology, 1987. 19(3): p. 226-32.
180. Colly, L.P., Richel, D.J., et al., Increase in Ara-C sensitivity in Ara-C sensitive
and -resistant leukemia by stimulation of the salvage and inhibition of the de novo
pathway. Annals of Hematology, 1992. 65(1): p. 26-32.
181. Eriksson, S., Arner, E., et al., Properties and levels of deoxynucleoside kinases in
normal and tumor cells; implications for chemotherapy. Advances in Enzyme
Regulation, 1994. 34: p. 13-25.
182. Nathanson, D.A., Armijo, A.L., et al., Co-targeting of convergent nucleotide
biosynthetic pathways for leukemia eradication. Journal of Experimental
Medicine, 2014. 211(3): p. 473-86.
183. Smal, C., Cardoen, S., et al., Activation of deoxycytidine kinase by protein kinase
inhibitors and okadaic acid in leukemic cells. Biochemical Pharmacology, 2004.
68(1): p. 95-103.
184. White, J.C. and Capizzi, R.L., A critical role for uridine nucleotides in the
regulation of deoxycytidine kinase and the concentration dependence of 1-beta-D-
arabinofuranosylcytosine phosphorylation in human leukemia cells. Cancer
Research, 1991. 51(10): p. 2559-65.
185. Stegmann, A.P., Honders, M.W., et al., Role of deoxycytidine kinase in an in vitro
model for AraC- and DAC-resistance: substrate-enzyme interactions with
deoxycytidine, 1-beta-D-arabinofuranosylcytosine and 5-aza-2'-deoxycytidine.
Leukemia, 1993. 7(7): p. 1005-11.
186. Kunos, C.A., Ferris, G., et al., Deoxynucleoside salvage facilitates DNA repair
during ribonucleotide reductase blockade in human cervical cancers. Radiation
Research, 2011. 176(4): p. 425-33.
187. Singhal, R.L., Yeh, Y.A., et al., Increased deoxycytidine kinase activity in cancer
cells and inhibition by difluorodeoxycytidine. Oncology Research, 1992. 4(11-
12): p. 517-22.
188. Azghadi, S. and Clark, A.T., Epigenetically reprogramming of human embryonic
stem cells by 3-deazaneplanocin a and sodium butyrate. International Journal of
Preventative Medicine, 2011. 2(2): p. 73-8.
189. Diaz Perez, S.V., Kim, R., et al., Derivation of new human embryonic stem cell
lines reveals rapid epigenetic progression in vitro that can be prevented by
chemical modification of chromatin. Human Molecular Genetics, 2012. 21(4): p.
751-64.

160
190. Hung, S.W., Mody, H., et al., Pharmacological Reversal of Histone Methylation
Presensitizes Pancreatic Cancer Cells to Nucleoside Drugs: In Vitro
Optimization and Novel Nanoparticle Delivery Studies. PLoS One, 2013. 8(8): p.
e71196.
191. Farrell, A.S., Allen-Petersen, B., et al., Targeting Inhibitors of the Tumor
Suppressor PP2A for the Treatment of Pancreatic Cancer. Molecular Cancer
Research, 2014. 12(6): p. 924-39.
192. Seo, S.B., McNamara, P., et al., Regulation of histone acetylation and
transcription by INHAT, a human cellular complex containing the set
oncoprotein. Cell, 2001. 104(1): p. 119-30.
193. Shah, A., Summy, J., et al., Development and characterization of gemcitabine-
resistant pancreatic tumor cells. Annals of Surgical Oncology, 2007. 14(12): p.
3629-3637.
194. Arumugam, T., Ramachandran, V., et al., Epithelial to mesenchymal transition
contributes to drug resistance in pancreatic cancer. Cancer Research, 2009.
69(14): p. 5820.
195. Li, Y., VandenBoom, T., et al., Up-regulation of miR-200 and let-7 by natural
agents leads to the reversal of epithelial-to-mesenchymal transition in
gemcitabine-resistant pancreatic cancer cells. Cancer Research, 2009. 69(16): p.
6704.
196. Schaeffer, D., Assi, K., et al., Tumor expression of Integrin-linked kinase (ILK)
correlates with the expression of the E-cadherin repressor Snail: an
immunohistochemical study in ductal pancreatic adenocarcinoma. Virchows
Archiv, 2010: p. 1-8.
197. Wang, F., Sloss, C., et al., Membrane-bound heparin-binding epidermal growth
factor like growth factor regulates E-cadherin expression in pancreatic
carcinoma cells. Cancer Research, 2007. 67(18): p. 8486.
198. Yin, T., Wang, C., et al., Expression of snail in pancreatic cancer promotes
metastasis and chemoresistance. Journal of Surgical Research, 2007. 141(2): p.
196-203.
199. Nakamura, T., Kato, Y., et al., E-cadherin-dependent intercellular adhesion
enhances chemoresistance. International Journal of Molecular Medicine, 2003.
12(5): p. 693.
200. Koo, J., Jung, W., et al., The Predictive Role of E-cadherin and Androgen
Receptor on In Vitro Chemosensitivity in Triple-negative Breast Cancer. Japanese
Journal of Clinical Oncology, 2009.

161
201. Yang, A., Fan, F., et al., Chronic oxaliplatin resistance induces epithelial-to-
mesenchymal transition in colorectal cancer cell lines. Clinical Cancer Research,
2006. 12(14): p. 4147.
202. Matarrese, P., Giandomenico, V., et al., Antiproliferative activity of interferon
&agr; and retinoic acid in SiHa carcinoma cells: The role of cell adhesion.
International Journal of Cancer, 1998. 76(4): p. 531-540.
203. Black, P., Brown, G., et al., Sensitivity to epidermal growth factor receptor
inhibitor requires E-cadherin expression in urothelial carcinoma cells. Clinical
Cancer Research, 2008. 14(5): p. 1478.
204. Wick, M., Hurteau, G., et al., Peroxisome proliferator-activated receptor-gamma
is a target of nonsteroidal anti-inflammatory drugs mediating cyclooxygenase-
independent inhibition of lung cancer cell growth. Molecular Pharmacology,
2002. 62(5): p. 1207.
205. Witta, S., Gemmill, R., et al., Restoring E-cadherin expression increases
sensitivity to epidermal growth factor receptor inhibitors in lung cancer cell lines.
Cancer Research, 2006. 66(2): p. 944.
206. Feldmann, G., Dhara, S., et al., Blockade of hedgehog signaling inhibits
pancreatic cancer invasion and metastases: a new paradigm for combination
therapy in solid cancers. Cancer Research, 2007. 67(5): p. 2187.
207. Sasaki, C., Lin, H., et al., Expression of E-cadherin reduces bcl-2 expression and
increases sensitivity to etoposide-induced apoptosis. International Journal of
Cancer, 2000. 86(5): p. 660-666.
208. Aleskandarany, M.A., Negm, O.H., et al., Epithelial mesenchymal transition in
early invasive breast cancer: an immunohistochemical and reverse phase protein
array study. Breast Cancer Research and Treatment, 2014. 145(2): p. 339-48.
209. Calvisi, D.F., Pascale, R.M., et al., Dissection of signal transduction pathways as
a tool for the development of targeted therapies of hepatocellular carcinoma.
Reviews on Recent Clinical Trials, 2007. 2(3): p. 217-36.
210. Dong, H.M., Liu, G., et al., Dominant-negative E-cadherin inhibits the
invasiveness of inflammatory breast cancer cells in vitro. Journal of Cancer
Research and Clinical Oncology, 2007. 133(2): p. 83-92.
211. Han, L., Peng, B., et al., Indometacin ameliorates high glucose-induced
proliferation and invasion via modulation of e-cadherin in pancreatic cancer
cells. Current Medicinal Chemistry, 2013. 20(33): p. 4142-52.
212. Miotti, S., Tomassetti, A., et al., Simultaneous expression of caveolin-1 and E-
cadherin in ovarian carcinoma cells stabilizes adherens junctions through

162
inhibition of src-related kinases. American Journal of Pathology, 2005. 167(5): p.
1411-27.
213. Wang, D., Su, L., et al., Downregulation of E-Cadherin enhances proliferation of
head and neck cancer through transcriptional regulation of EGFR. Molecular
Cancer, 2011. 10: p. 116.
214. Wang, Y., Zhang, Y.X., et al., Loss of P53 facilitates invasion and metastasis of
prostate cancer cells. Molecular and Cellular Biochemistry, 2013. 384(1-2): p.
121-7.
215. Mini, E., Nobili, S., et al., Cellular pharmacology of gemcitabine. Annals of
Oncology, 2006. 17(Supplement 5): p. v7.
216. Wong, A., Soo, R.A., et al., Clinical pharmacology and pharmacogenetics of
gemcitabine. Drug Metabolism Reviews, 2009. 41(2): p. 77-88.
217. Lu, J., Getz, G., et al., MicroRNA expression profiles classify human cancers.
Nature, 2005. 435(7043): p. 834-838.
218. Plunkett, W., Huang, P., et al., Gemcitabine: metabolism, mechanisms of action,
and self-potentiation. Seminars in Oncology, 1995. 22.
219. Bhutia, Y.D., Hung, S.W., et al., CNT1 expression influences proliferation and
chemosensitivity in drug-resistant pancreatic cancer cells. Cancer Research,
2011. 71(5): p. 1825-1835.
220. Kang, N., Jun, A.H., et al., Human Equilibrative Nucleoside Transporter-3
(hENT3) Spectrum Disorder Mutations Impair Nucleoside Transport, Protein
Localization, and Stability The Journal of Biological Chemistry, 2010. 285(36): p.
28343-28352.
221. Govindarajan, R., Endres, C.J., et al., Expression and hepatobiliary transport
characteristics of the concentrative and equilibrative nucleoside transporters in
sandwich-cultured human hepatocytes. American Journal of Physiology -
Gastrointestinal and Liver Physiology, 2008(295): p. G570-G580.
222. Nivillac, N.M., Bacani, J., et al., The life cycle of human equilibrative nucleoside
transporter 1: from ER export to degradation. Experimental Cell Research, 2011.
317(11): p. 1567-79.
223. Mackey, J.R., Yao, S.Y.M., et al., Gemcitabine Transport in Xenopus Oocytes
Expressing Recombinant Plasma Membrane Mammalian Nucleoside
Transporters. Journal of the National Cancer Institute, 1999. 91(21): p. 1876-
1881.
163
224. Young, J.D., Yao, S.Y.M., et al., The human concentrative and equilibrative
nucleoside transporter families, SLC28 and SLC29. Molecular Aspects of
Medicine, 2013. 34(2–3): p. 529-547.
225. Ward, J.L., Sherali, A., et al., Kinetic and Pharmacological Properties of Cloned
Human Equilibrative Nucleoside Transporters, ENT1 and ENT2, Stably
Expressed in Nucleoside Transporter-deficient PK15 Cells: ENT2 EXHIBITS A
LOW AFFINITY FOR GUANOSINE AND CYTIDINE BUT A HIGH AFFINITY
FOR INOSINE. Journal of Biological Chemistry, 2000. 275(12): p. 8375-8381.
226. Crawford, L.J., Walker, B., et al., Proteasome inhibitors in cancer therapy.
Journal of Cell Communication and Signaling, 2011. 5(2): p. 101-110.
227. Goldberg, A.L., Development of proteasome inhibitors as research tools and
cancer drugs. The Journal of Cell Biology, 2012. 199(4): p. 583-588.
228. Joazeiro, C.A., Anderson, K.C., et al., Proteasome inhibitor drugs on the rise.
Cancer Research, 2006. 66(16): p. 7840-2.
229. Fehrenbacher, N. and Jäättelä, M., Lysosomes as Targets for Cancer Therapy.
Cancer Research, 2005. 65(8): p. 2993-2995.
230. Maclean, K.H., Dorsey, F.C., et al., Targeting lysosomal degradation induces
p53-dependent cell death and prevents cancer in mouse models of
lymphomagenesis. The Journal of Clinical Investigation, 2008. 118(1): p. 79-88.
231. Yang, Z.J., Chee, C.E., et al., The Role of Autophagy in Cancer: Therapeutic
Implications. Molecular Cancer Therapeutics, 2011. 10(9): p. 1533-1541.
232. Cheng, J.C., Auersperg, N., et al., Inhibition of p53 represses E-cadherin
expression by increasing DNA methyltransferase-1 and promoter methylation in
serous borderline ovarian tumor cells. Oncogene, 2011. 30(37): p. 3930-42.
233. Hong, C.Q., Ran, Y.G., et al., Study on promoter methylation status of E-cadherin
gene in nasopharyngeal carcinoma cell lines. Chinese Journal of Pathology,
2010. 39(8): p. 532-6.
234. Liu, Y.Y., Han, J.Y., et al., Effect of CDH1 gene methylation on transforming
growth factor (TGF-beta)-induced epithelial-mesenchymal transition in alveolar
epithelial cell line A549. Genetic and Molecular Research, 2014. 13(Aop).
235. Manavalan, T.T., Teng, Y., et al., Reduced expression of miR-200 family members
contributes to antiestrogen resistance in LY2 human breast cancer cells. PLoS
One, 2013. 8(4): p. e62334.
236. Nalls, D., Tang, S.N., et al., Targeting epigenetic regulation of miR-34a for
treatment of pancreatic cancer by inhibition of pancreatic cancer stem cells.
PLoS One, 2011. 6(8): p. e24099.

164
237. Ran, Y., Wu, S., et al., Demethylation of E-cadherin gene in nasopharyngeal
carcinoma could serve as a potential therapeutic strategy. The Journal of
Biochemistry, 2011. 149(1): p. 49-54.
238. Wang, G., Hu, X., et al., Promoter-hypermethylation associated defective
expression of E-cadherin in primary non-small cell lung cancer. Lung Cancer,
2008. 62(2): p. 162-72.
239. Baldwin, S.A., Mackey, J.R., et al., Nucleoside transporters: molecular biology
and implications for therapeutic development. Molecular Medicine Today, 1999.
5(5): p. 216-224.
240. Beyer, E.C., Paul, D.L., et al., Connexin family of gap junction proteins. Journal
of Membrane Biology, 1990. 116(3): p. 187-194.
241. Goldberg, G.S., Moreno, A.P., et al., Gap junctions between cells expressing
connexin 43 or 32 show inverse permselectivity to adenosine and ATP. Journal of
Biological Chemistry, 2002. 277(39): p. 36725.
242. Mesnil, M. and Yamasaki, H., Bystander Effect in Herpes Simplex Virus-
Thymidine Kinase/Ganciclovir Cancer Gene Therapy: Role of Gap-junctional
Intercellular Communication1. Cancer Research, 2000. 60(15): p. 3989.
243. Fick, J., Barker, F., et al., The extent of heterocellular communication mediated by
gap junctions is predictive of bystander tumor cytotoxicity in vitro. Proceedings of
the National Academy of Sciences, 1995. 92(24): p. 11071.
244. Tanaka, T., Duflot-Dancer, A., et al., Bystander effect from cytosine deaminase
and uracil phosphoribosyl transferase genes in vitro: A partial contribution of
gap junctions. Cancer Letters, 2009. 282(1): p. 43-47.
245. He, B., Tong, X., et al., Tramadol and Flurbiprofen Depress the Cytotoxicity of
Cisplatin via Their Effects on Gap Junctions. Clinical Cancer Research, 2009.
15(18): p. 5803.
246. Farré, X., Guillén Gómez, E., et al., Expression of the nucleoside derived drug
transporters hCNT1, hENT1 and hENT2 in gynecologic tumors. International
Journal of Cancer, 2004. 112(6): p. 959-966.
247. Marcé, S., Molina-Arcas, M., et al., Expression of human equilibrative nucleoside
transporter 1 (hENT1) and its correlation with gemcitabine uptake and
cytotoxicity in mantle cell lymphoma. Haematologica, 2006. 91(7): p. 895.
248. Farrell, J.J., Elsaleh, H., et al., Human equilibrative nucleoside transporter 1
levels predict response to gemcitabine in patients with pancreatic cancer.
Gastroenterology, 2009. 136(1): p. 187-195.
165
249. Govindarajan, R., Chakraborty, S., et al., Assembly of connexin43 into gap
junctions is regulated differentially by E-cadherin and N-cadherin in rat liver
epithelial cells. Molecular Biology of the Cell, 2010. 21(23): p. 4089-107.
250. Neuhaus, I.M., Bone, L., et al., The human connexin32 gene is transcribed from
two tissue-specific promoters. Bioscience Reports, 1996. 16(3): p. 239-48.
251. Tai, M.H., Olson, L.K., et al., Characterization of gap junctional intercellular
communication in immortalized human pancreatic ductal epithelial cells with
stem cell characteristics. Pancreas, 2003. 26(1): p. e18-26.
252. Simon, J.A. and Kingston, R.E., Mechanisms of polycomb gene silencing: knowns
and unknowns. Nature Reviews Molecular Cell Biology, 2009. 10(10): p. 697-
708.
253. Crea, F., Fornaro, L., et al., EZH2 inhibition: targeting the crossroad of tumor
invasion and angiogenesis. Cancer and Metastasis Reviews, 2012: p. 1-9.
254. Suvà, M.L., Riggi, N., et al., EZH2 is essential for glioblastoma cancer stem cell
maintenance. Cancer Research, 2009. 69(24): p. 9211-9218.
255. Bao, B., Ali, S., et al., Curcumin Analogue CDF Inhibits Pancreatic Tumor
Growth by Switching on Suppressor microRNAs and Attenuating EZH2
Expression. Cancer Research, 2012. 72(1): p. 335-345.
256. Crea, F., Paolicchi, E., et al., Polycomb genes and cancer: Time for clinical
application? CRC Critical Reviews in Oncology/Hematology, 2012. 83(2): p.
184-193.
257. Ougolkov, A.V., Bilim, V.N., et al., Regulation of pancreatic tumor cell
proliferation and chemoresistance by the histone methyltransferase enhancer of
zeste homologue 2. Clinical Cancer Research, 2008. 14(21): p. 6790-6796.
258. Chen, Y., Xie, D., et al., RNAi targeting EZH2 inhibits tumor growth and liver
metastasis of pancreatic cancer in vivo. Cancer Letters, 2010. 297(1): p. 109-116.
259. Fujii, S., Fukamachi, K., et al., RAS oncogenic signal upregulates EZH2 in
pancreatic cancer. Biochemical and Biophysical Research Communications,
2012. 417(3): p. 1074-1079.
260. Fujii, S., Ito, K., et al., Enhancer of zeste homologue 2 (EZH2) down-regulates
RUNX3 by increasing histone H3 methylation. Journal of Biological Chemistry,
2008. 283(25): p. 17324-17332.
261. Fussbroich, B., Wagener, N., et al., EZH2 depletion blocks the proliferation of
colon cancer cells. PLoS One, 2011. 6(7): p. e21651.
166
262. Qazi, A.M., Aggarwal, S., et al., Laser Capture Microdissection of Pancreatic
Ductal Adeno-Carcinoma Cells to Analyze EzH2 by Western Blot Analysis.
Methods in Molecular Biology, 2011. 755(1): p. 245-256.
263. Toll, A.D., Dasgupta, A., et al., Implications of enhancer of zeste homologue 2
expression in pancreatic ductal adenocarcinoma. Human Pathology, 2010. 41(9):
p. 1205-1209.
264. Wei, Y., Xia, W., et al., Loss of trimethylation at lysine 27 of histone H3 is a
predictor of poor outcome in breast, ovarian, and pancreatic cancers. Molecular
Carcinogenesis, 2008. 47(9): p. 701-706.
265. Hayden, A., Johnson, P.W.M., et al., S-adenosylhomocysteine hydrolase
inhibition by 3-deazaneplanocin A analogues induces anti-cancer effects in breast
cancer cell lines and synergy with both histone deacetylase and HER2 inhibition.
Breast Cancer Research and Treatment, 2011. 127(1): p. 109-119.
266. Choudhury, S.R., Balasubramanian, S., et al., (-)-Epigallocatechin-3-gallate and
DZNep reduce polycomb protein level via a proteasome-dependent mechanism in
skin cancer cells. Carcinogenesis, 2011. 32(10): p. 1525-1532.
267. Tan, J., Yang, X., et al., Pharmacologic disruption of Polycomb-repressive
complex 2-mediated gene repression selectively induces apoptosis in cancer cells.
Genes and Development, 2007. 21(9): p. 1050-1063.
268. Cheng, L.L., Itahana, Y., et al., TP53 Genomic Status Regulates Sensitivity of
Gastric Cancer Cells to the Histone Methylation Inhibitor 3-Deazaneplanocin A
(DZNep). Clinical Cancer Research, 2012. 18(15): p. 4201-4212.
269. Crea, F., Hurt, E.M., et al., Pharmacologic disruption of Polycomb Repressive
Complex 2 inhibits tumorigenicity and tumor progression in prostate cancer.
Molecular Cancer, 2011. 10(1): p. 40.
270. Chase, A. and Cross, N.C.P., Aberrations of EZH2 in cancer. Clinical Cancer
Research, 2011. 17(9): p. 2613-2618.
271. Zhou, J., Bi, C., et al., The histone methyltransferase inhibitor, DZNep, up-
regulates TXNIP, increases ROS production, and targets leukemia cells in AML.
Blood, 2011. 118(10): p. 2830-2839.
272. Puppe, J., Drost, R., et al., BRCA1-deficient mammary tumor cells are dependent
on EZH2 expression and sensitive to Polycomb Repressive Complex 2-inhibitor 3-
deazaneplanocin A. Breast Cancer Research, 2009. 11(4): p. R63.
273. Yang, X., Lay, F., et al., Targeting DNA methylation for epigenetic therapy.
Trends in Pharmacological Sciences, 2010. 31(11): p. 536-546.

167
274. Bayraktar, S., Bayraktar, U.D., et al., Recent developments in palliative
chemotherapy for locally advanced and metastatic pancreas cancer. World
Journal of Gastroenterology, 2010. 16(6): p. 673.
275. Bhutia, Y.D., Hung, S.W., et al., CNT1 expression influences proliferation and
chemosensitivity in drug-resistant pancreatic cancer cells. Cancer Res, 2011.
71(5): p. 1825-1835.
276. Chou, T.C. and Talalay, P., Quantitative analysis of dose-effect relationships: the
combined effects of multiple drugs or enzyme inhibitors. Advances in Enzyme
Regulation, 1984. 22(1): p. 27-55.
277. Kang, N., Jun, A.H., et al., Human equilibrative nucleoside transporter-3
(hENT3) spectrum disorder mutations impair nucleoside transport, protein
localization, and stability. Journal of Biological Chemistry, 2010. 285(36): p.
28343-28352.
278. Adema, A., Radi, M., et al., Troxacitabine prodrugs for pancreatic cancer.
Nucleos Nucleot Nucl, 2007. 26(8-9): p. 1073-1077.
279. Radi, M., Adema, A.D., et al., In vitro optimization of non-small cell lung cancer
activity with troxacitabine, L-1, 3-dioxolane-cytidine, prodrugs. Journal of
Medicinal Chemistry, 2007. 50(9): p. 2249-2253.
280. Deroose, F.D. and Clercq, P.J.D., Novel enantioselective syntheses of (+)-biotin.
Journal of Organic Chemistry, 1995. 60(2): p. 321-330.
281. Marrache, S. and Dhar, S., Engineering of blended nanoparticle platform for
delivery of mitochondria-acting therapeutics. Proceedings of the National
Academy of Sciences, 2012. 109: p. 16288-16293.
282. Paproski, R.J., Ng, A.M.L., et al., The role of human nucleoside transporters in
uptake of 3′-deoxy-3′-fluorothymidine. Molecular Pharmacology, 2008. 74(5): p.
1372-1380.
283. Avan, A., Crea, F., et al., Molecular Mechanisms Involved in the Synergistic
Interaction of the EZH2 Inhibitor 3-Deazaneplanocin A with Gemcitabine in
Pancreatic Cancer Cells. Molecular Cancer Therapeutics, 2012. 11(8): p. 1735-
1746.
284. Coulombe, R.A., Sharma, R., et al., Pharmacokinetics of the antiviral agent 3-
deazaneplanocin A. European Journal of Drug Metabolism and Pharmacokinetics,
1995. 20(3): p. 197-202.
285. Glazer, R.I., Hartman, K.D., et al., 3-Deazaneplanocin: a new and potent
inhibitor of S-adenosylhomocysteine hydrolase and its effects on human
promyelocytic leukemia cell line HL-60. Biochemical and Biophysical Research
Communications, 1986. 135(2): p. 688-694.

168
286. Mallen-St Clair, J., Soydaner-Azeloglu, R., et al., EZH2 couples pancreatic
regeneration to neoplastic progression. Genes and Development, 2012. 26(5): p.
439-444.
287. Rogenhofer, S., Kahl, P., et al., Decreased levels of histone H3K9me1 indicate
poor prognosis in patients with renal cell carcinoma. Anticancer Research, 2012.
32(3): p. 879-886.
288. Hou, J., Wu, J., et al., Genomic amplification and a role in drug-resistance for the
KDM5A histone demethylase in breast cancer. American Journal of Translational
Research, 2012. 4(3): p. 247.
289. Toth, M., Boros, I.M., et al., Elevated level of lysine 9-acetylated histone H3 at
the MDR1 promoter in multidrug-resistant cells. Cancer Science, 2012. 104(4): p.
659-669.
290. Shi, L., Sun, L., et al., Histone demethylase JMJD2B coordinates H3K4/H3K9
methylation and promotes hormonally responsive breast carcinogenesis.
Proceedings of the National Academy of Sciences, 2011. 108(18): p. 7541-7546.
291. Chang, C. and Hung, M., The role of EZH2 in tumour progression. British Journal
of Cancer, 2011. 106(2): p. 243-247.
292. Abdel-Wahab, O. and Levine, R.L., EZH2 mutations: Mutating the epigenetic
machinery in myeloid malignancies. Cancer Cell, 2010. 18(2): p. 105-107.
293. Matrisian, L.M., Aizenberg, R., et al., The Alarming Rise of Pancreatic Cancer
Deaths in the United States: Why We Need to Stem the Tide Today. 2012,
Research and Scientific Affairs Department of the Pancreatic Cancer Action
Network.
294. Rhim, A.D., Mirek, E.T., et al., EMT and dissemination precede pancreatic tumor
formation. Cell, 2012. 148(1–2): p. 349-361.
295. Nagata, K., Kawase, H., et al., Replication factor encoded by a putative oncogene,
set, associated with myeloid leukemogenesis. Proceedings of the National
Academy of Sciences, 1995. 92(10): p. 4279-4283.
296. Christensen, D.J., Chen, Y., et al., SET oncoprotein overexpression in B-cell
chronic lymphocytic leukemia and non-Hodgkin lymphoma: a predictor of
aggressive disease and a new treatment target. Blood, 2011. 118(15): p. 4150-
4158.
297. Cristóbal, I., Garcia-Orti, L., et al., Overexpression of SET is a recurrent event
associated with poor outcome and contributes to protein phosphatase 2A
inhibition in acute myeloid leukemia. Haematologica, 2012. 97(4): p. 543-550.
169
298. Neviani, P., Santhanam, R., et al., The tumor suppressor PP2A is functionally
inactivated in blast crisis CML through the inhibitory activity of the BCR/ABL-
regulated SET protein. Cancer Cell, 2005. 8(5): p. 355-368.
299. Carlson, S.G., Eng, E., et al., Expression of SET, an inhibitor of protein
phosphatase 2A, in renal development and Wilms' tumor. Journal of the American
Society of Nephrology, 1998. 9(10): p. 1873-1880.
300. Fukukawa, C., Shima, H., et al., Up-regulation of I-2PP2A
/SET gene expression in
rat primary hepatomas and regenerating livers. Cancer Letters, 2000. 161(1): p.
89-95.
301. Chao, A., Tsai, C.L., et al., Decreased expression of microRNA-199b increases
protein levels of SET (protein phosphatase 2A inhibitor) in human
choriocarcinoma. Cancer Letters, 2010. 291(1): p. 99-107.
302. Li, M., Makkinje, A., et al., The myeloid leukemia-associated protein SET is a
potent inhibitor of protein phosphatase 2A. Journal of Biological Chemistry,
1996. 271(19): p. 11059-11062.
303. Seo, S.B., McNamara, P., et al., Regulation of histone acetylation and
transcription by INHAT, a human cellular complex containing the set
oncoprotein. Cell, 2001. 104(1): p. 119-130.
304. ten Klooster, J.P., v Leeuwen, I., et al., Rac1-induced cell migration requires
membrane recruitment of the nuclear oncogene SET. The EMBO Journal, 2007.
26(2): p. 336-345.
305. Daniel Lam, B., Anthony, E.C., et al., Cytoplasmic targeting of the proto-
oncogene SET promotes cell spreading and migration. FEBS Letters, 2012.
306. Fukukawa, C., Shima, H., et al., The oncoprotein I-2PP2A/SET negatively
regulates the MEK/ERK pathway and cell proliferation. International Journal of
Oncology, 2005. 26(3): p. 751.
307. Al-Murrani, S., Woodgett, J., et al., Expression of I2PP2A, an inhibitor of protein
phosphatase 2A, induces c-Jun and AP-1 activity. Biochemical Journal, 1999.
341: p. 293-298.
308. Shintani, Y., Hollingsworth, M.A., et al., Collagen I promotes metastasis in
pancreatic cancer by activating c-Jun NH2-terminal kinase 1 and up-regulating
N-cadherin expression. Cancer Research, 2006. 66(24): p. 11745-11753.
309. Park, M.K., You, H.J., et al., Transglutaminase-2 induces N-cadherin expression
in TGF-β1-induced epithelial mesenchymal transition via c-Jun-N-terminal
kinase activation by protein phosphatase 2A down-regulation. European Journal
of Cancer, 2013. 49(7): p. 1692-1705.

170
310. Li, W., Xie, L., et al., Cantharidin, a potent and selective PP2A inhibitor, induces
an oxidative stress-independent growth inhibition of pancreatic cancer cells
through G2/M cell-cycle arrest and apoptosis. Cancer Science, 2010. 101(5): p.
1226-1233.
311. Li, W., Chen, Z., et al., PP2A inhibitors induce apoptosis in pancreatic cancer
cell line PANC-1 through persistent phosphorylation of IKKα and sustained
activation of the NF-κB pathway. Cancer Letters, 2011. 304(2): p. 117-127.
312. Li, W., Chen, Z., et al., Growth of the pancreatic cancer cell line PANC-1 is
inhibited by protein phosphatase 2A inhibitors through overactivation of the c-
Jun N-terminal kinase pathway. European Journal of Cancer, 2011. 47(17): p.
2654-2664.
313. Switzer, C.H., Cheng, R.Y., et al., Targeting SET/I2PP2A oncoprotein functions
as a multi-pathway strategy for cancer therapy. Oncogene, 2011. 30(22): p. 2504-
2513.
314. Kim, M.P., Evans, D.B., et al., Generation of orthotopic and heterotopic human
pancreatic cancer xenografts in immunodeficient mice. Nature Protocols, 2009.
4(11): p. 1670-1680.
315. Lieber, M., Mazzetta, J., et al., Establishment of a continuous tumor-cell line
(panc-1) from a human carcinoma of the exocrine pancreas. International Journal
of Cancer, 1975. 15(5): p. 741-7.
316. Winter, J.M., Ting, A.H., et al., Absence of E-cadherin expression distinguishes
noncohesive from cohesive pancreatic cancer. Clinical Cancer Research, 2008.
14(2): p. 412-8.
317. Bruns, C.J., Harbison, M.T., et al., In vivo selection and characterization of
metastatic variants from human pancreatic adenocarcinoma by using orthotopic
implantation in nude mice. Neoplasia, 1999. 1(1): p. 50-62.
318. Shintani, Y., Wheelock, M.J., et al., Phosphoinositide-3 Kinase–Rac1–c-Jun
NH2-terminal Kinase Signaling Mediates Collagen I–induced Cell Scattering and
Up-Regulation of N-Cadherin Expression in Mouse Mammary Epithelial Cells.
Molecular Biology of the Cell, 2006. 17(7): p. 2963-2975.
319. Maurer, T., Garrenton, L., et al., Drugging the Undruggable: Small-Molecule
Inhibition of the Ras Oncoprotein. Molecular Biology of the Cell, 2011. 22: p.
Abstract No. 24.
320. Collisson, E.A., Sadanandam, A., et al., Subtypes of pancreatic ductal
adenocarcinoma and their differing responses to therapy. Nature Medicine, 2011.
17(4): p. 500-503.