Investigation of acoustically coupled shear layers using ... · Investigation of acoustically...
10
Investigation of acoustically coupled shear layers using particle image velocimetry P. Oshkai, T. Yan & A. Howard University of Victoria, Canada Abstract Quantitative visualization of acoustically coupled shear layers that are formed due to fully turbulent inflow past a coaxial side branch resonator mounted in a duct is performed using a technique of digital particle image velocimetry. Imaging of the flow structure conducted in conjunction with unsteady pressure measurements leads to patterns of velocity, vorticity, and streamline topology at various phases of the acoustic cycle. Global instantaneous images, as well as time-averaged images, are evaluated to provide insight into the flow physics during tone generation. In particular, the effect of the interaction between two shear layers that form across the coaxial side branches on the acoustic power generation is studied for various resonator geometries. Keywords: flow-acoustic coupling, shear layer interaction, coaxial side branch resonators, acoustic power. 1 Introduction Internal flow past a deep cavity (side branch) mounted in a duct is often characterized by the coupling between the self-sustained oscillations of the separated shear layer that forms across the mouth of the cavity and the resonant acoustic modes of the side branch. This resonant phenomenon, which occurs in many industrial processes involving transport of a fluid through a pipeline and is referred to as flow tone generation, involves high-amplitude pressure pulsations and flow oscillations. Flow tone generation past multiple side branches has been a subject of many investigations, as summarized by Ziada and Bühlmann [1]. Classification of side branch resonances as fluid-resonant oscillations was performed by Rockwell and Naudascher [2]. Generally speaking, if the frequency of the shear layer © 2005 WIT Press WIT Transactions on Modelling and Simulation, Vol 41, www.witpress.com, ISSN 1743-355X (on-line) Computational Methods and Experimental Measurements XII 187
-
Upload
vuongthien -
Category
Documents
-
view
219 -
download
0
Transcript of Investigation of acoustically coupled shear layers using ... · Investigation of acoustically...
Investigation of acoustically coupled shear layers using particle image velocimetry
P. Oshkai, T. Yan & A. Howard University of Victoria, Canada
Abstract
Quantitative visualization of acoustically coupled shear layers that are formed due to fully turbulent inflow past a coaxial side branch resonator mounted in a duct is performed using a technique of digital particle image velocimetry. Imaging of the flow structure conducted in conjunction with unsteady pressure measurements leads to patterns of velocity, vorticity, and streamline topology at various phases of the acoustic cycle. Global instantaneous images, as well as time-averaged images, are evaluated to provide insight into the flow physics during tone generation. In particular, the effect of the interaction between two shear layers that form across the coaxial side branches on the acoustic power generation is studied for various resonator geometries. Keywords: flow-acoustic coupling, shear layer interaction, coaxial side branch resonators, acoustic power.
1 Introduction
Internal flow past a deep cavity (side branch) mounted in a duct is often characterized by the coupling between the self-sustained oscillations of the separated shear layer that forms across the mouth of the cavity and the resonant acoustic modes of the side branch. This resonant phenomenon, which occurs in many industrial processes involving transport of a fluid through a pipeline and is referred to as flow tone generation, involves high-amplitude pressure pulsations and flow oscillations. Flow tone generation past multiple side branches has been a subject of many investigations, as summarized by Ziada and Bühlmann [1]. Classification of side branch resonances as fluid-resonant oscillations was performed by Rockwell and Naudascher [2]. Generally speaking, if the frequency of the shear layer
© 2005 WIT Press WIT Transactions on Modelling and Simulation, Vol 41, www.witpress.com, ISSN 1743-355X (on-line)
Computational Methods and Experimental Measurements XII 187
instability matches the resonant acoustic mode of the side branch, the velocity fluctuations in the shear layer are amplified, and large-scale vortical structures develop across the mouth of the cavity. When these vortices impinge upon the downstream corner of the side branch, the energy of the fluctuating shear layer is transferred into the resonant acoustic field. Therefore, the region adjacent to the downstream corner of the side branch is referred to as the acoustic noise source region. Characterization of the acoustic noise source in terms of its shape and the contribution of individual vortices to the generated acoustic power continues to present significant challenges despite the considerable insight provided by recent investigations. Hourigan et al. [3] and Stoneman et al. [4] characterized acoustically coupled shear layer oscillations in terms of the number of vortices formed in the shear layer during a typical oscillation cycle. The theoretical background for these experimental and numerical studies was provided by the aerodynamic sound theory outlined by Howe [5]. More recently, investigations of flow-acoustic coupling mechanisms related to cavity flows were conducted by Rowley et al. [6], Amandolèse et al. [7], and Oshkai et al. [8]. The present study focuses on a coaxial side branch system, which involves two side branches mounted on the opposite sides of a rectangular duct and inline with each other. The objective is to investigate the effect of the main duct width on the structure of the acoustic source region.
2 Experimental system and techniques
2.1 Coaxial side branch resonator
The experiments related were performed using air as a working fluid. A flow facility, which consists of a plenum chamber, a main duct, and a coaxial side branch arrangement, was designed and constructed in order to allow variations of the channel geometry, optical access to the separated flow area(s), as well as ability to perform acoustic pressure measurements. The air was supplied by a compressor and was transmitted through a system of pressure regulators to the main duct, which was located downstream of the inlet plenum. The schematic of the coaxial side branch resonator mounted in the main duct is provided in Fig. 1. Of primary interest in the present investigation is the variation of the main duct width D. In particular, the flow features are compared for the two cases corresponding to a relatively large value of the main duct width (D = 13 mm) and a smaller value of D = 6.5 mm. Dimensions of the individual side branches (L = 483 mm, W = 24.5 mm) were chosen to provide an opportunity for observation of at least two distinct hydrodynamic modes of the shear layer oscillation for both values of the main duct width.
2.2 Pressure measurements
To provide insight into the physical mechanism of flow-acoustic coupling and to quantify the strength of the flow tone lock-on, measurements of unsteady
© 2005 WIT Press WIT Transactions on Modelling and Simulation, Vol 41, www.witpress.com, ISSN 1743-355X (on-line)
188 Computational Methods and Experimental Measurements XII
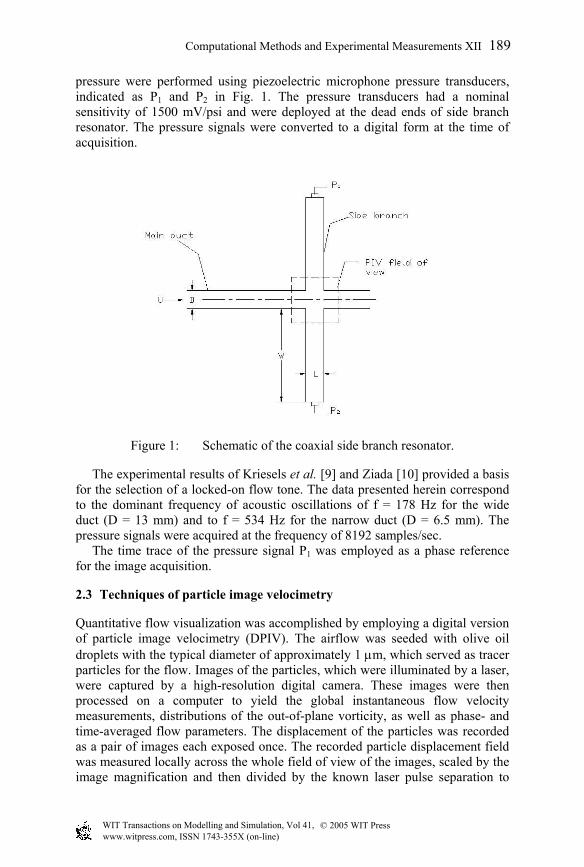
pressure were performed using piezoelectric microphone pressure transducers, indicated as P1 and P2 in Fig. 1. The pressure transducers had a nominal sensitivity of 1500 mV/psi and were deployed at the dead ends of side branch resonator. The pressure signals were converted to a digital form at the time of acquisition.
Figure 1: Schematic of the coaxial side branch resonator.
The experimental results of Kriesels et al. [9] and Ziada [10] provided a basis for the selection of a locked-on flow tone. The data presented herein correspond to the dominant frequency of acoustic oscillations of f = 178 Hz for the wide duct (D = 13 mm) and to f = 534 Hz for the narrow duct (D = 6.5 mm). The pressure signals were acquired at the frequency of 8192 samples/sec. The time trace of the pressure signal P1 was employed as a phase reference for the image acquisition.
2.3 Techniques of particle image velocimetry
Quantitative flow visualization was accomplished by employing a digital version of particle image velocimetry (DPIV). The airflow was seeded with olive oil droplets with the typical diameter of approximately 1 µm, which served as tracer particles for the flow. Images of the particles, which were illuminated by a laser, were captured by a high-resolution digital camera. These images were then processed on a computer to yield the global instantaneous flow velocity measurements, distributions of the out-of-plane vorticity, as well as phase- and time-averaged flow parameters. The displacement of the particles was recorded as a pair of images each exposed once. The recorded particle displacement field was measured locally across the whole field of view of the images, scaled by the image magnification and then divided by the known laser pulse separation to
© 2005 WIT Press WIT Transactions on Modelling and Simulation, Vol 41, www.witpress.com, ISSN 1743-355X (on-line)
Computational Methods and Experimental Measurements XII 189

obtain flow velocity at each point. The CCD camera was positioned perpendicular to the plane of the light as shown in Fig. 2. Depending on the flow velocity and the factor of magnification of the camera lens, the delay of the two pulses was chosen such that adequate displacements of the particle images on the CCD are obtained. From the time delay between the two illuminations and the displacement of the tracers velocity vectors can be calculated.
Figure 2: Schematic of the PIV setup.
For the present study, a lens with a focal length of 60 mm was used in conjunction with a 1376 x 1040 pixel CCD to provide a physical resolution of the velocity vector field of 0.22 x 0.22 mm. The system provided 4.9 cross-correlated images per second. The trigger signal to the laser was recorder together with the acoustic pressure signals. This provided the information regarding the phase of acquisition of each velocity field with respect to a typical acoustic cycle.
2.4 Time- and phase-averaging of PIV images
The PIV images were acquired at a time interval of 0.204 sec, which provided spacing in time appropriate for obtaining random samples for the calculation of averaged turbulence statistics. A total of 100 images were acquired and used in the calculation of the following time-averaged parameters: flow velocity <V>, out-of-plane vorticity <ωz >, streamlines <Ψ>, root-mean-square values of the velocity <urms> and <vrms>, and Reynolds stress correlation <u′v′>. Phase averaging of the PIV images was performed by taking into account the phase difference between the occurrence of zero amplitude of the reference acoustic pressure signal and the acquisition of a PIV image. A typical acoustic cycle was divided into ten phase intervals. All PIV images that were acquired
© 2005 WIT Press WIT Transactions on Modelling and Simulation, Vol 41, www.witpress.com, ISSN 1743-355X (on-line)
190 Computational Methods and Experimental Measurements XII

during a particular interval were averaged to produce a single quantitative visualization of the flow structures that are repeatable between the acoustic cycles.
3 Effect of the main duct width
3.1 Instantaneous flow patterns
Instantaneous images of flow velocity V and out-of-plane vorticity ωz for wide duct (D = 13 mm) are shown in Fig. 3. The images correspond to a phase in the oscillation cycle, which is indicated by a circle in the insert schematic. Instantaneous patterns of velocity and vorticity show that unsteady vortical structures of multiple scales are present in the top and bottom shear layers. The small-scale Kelvin-Helmholtz vortices that initially form in the separated shear layers in the vicinity of the upstream corners of the side branch resonator eventually roll up into larger-scale structures as they are convected downstream along the mouth of the side branch. These large-scale vortices generally have lower peak vorticity than the original Kelvin-Helmholtz vortices, but possess greater energy due to larger circulation values and increased convective speed. When the large-scale vortices impinge upon the downstream corner of the side branch, this energy is released in the form of acoustic sound. Therefore, the region of the shear layer interaction with the downstream corners of the side branch corresponds to the source of the generated acoustic power.
Figure 3: Patterns of instantaneous velocity (left) and vorticity (right) for the case of a wide main duct (D = 13 mm).
When the main duct is relatively wide, as shown in Fig. 3, the two shear layers that form across the top and bottom side branches do not interact with each other and impinge upon the downstream corners of the corresponding side branches. In this case, the coaxial side branch resonator can be represented as two independent single side branches in terms of the structure of the acoustic source.
© 2005 WIT Press WIT Transactions on Modelling and Simulation, Vol 41, www.witpress.com, ISSN 1743-355X (on-line)
Computational Methods and Experimental Measurements XII 191

Figure 4: Patterns of instantaneous velocity (left) and vorticity (right) for the case of a narrow main duct (D = 6.5 mm).
This situation is in marked contrast to the shear layer interaction that occurs at the lower value of the main duct width (D = 6.5 mm) shown in Fig. 4. When the main duct width is sufficiently low, the bottom shear layer can interact with the downstream corner of the top side branch, and, likewise, the top shear layer can interact with the bottom corner. This flow behaviour suggests that the structure of the acoustic power source will change significantly as the main duct width is decreased.
Figure 5: Phase-averaged streamline patterns for the case of the wide main duct (D = 13 mm).
3.2 Phase-averaged flow patterns
Fig. 5 shows the phase averaged flow patterns for the case of the wide main duct. Three successive 60°-wide phase intervals correspond to the three images in Fig. 5. The patterns of the streamline topology correspond to the reference frame moving from left to right with the average convective speed of the vortices in the
© 2005 WIT Press WIT Transactions on Modelling and Simulation, Vol 41, www.witpress.com, ISSN 1743-355X (on-line)
192 Computational Methods and Experimental Measurements XII

shear layers. The case shown in this figure corresponds to the third hydrodynamic mode of the shear layer oscillation, when three large-scale vortices form in the shear layer during a typical oscillation cycle. The phase-averaged flow patterns corresponding to the case of the narrow main duct are shown in Fig. 6. These patterns clearly illustrate the high levels of interaction between the vertical structures in the top and bottom shear layers. Images of Fig. 6 correspond to the first hydrodynamic mode, when a single large-scale vortex forms during each cycle of the shear layer oscillation.
Figure 6: Phase-averaged streamline patterns for the case of the narrow main duct (D = 6.5 mm).
3.3 Time-averaged flow patterns
The distributions of the time-averaged flow parameters for the two values of the main duct width illustrate the increased interaction between the top and bottom shear layers and the change in the structure of the acoustic source as the duct width decreases. For the wide duct, represented in Fig. 7, the patterns of time-averaged flow velocity <V>, out-of-plane vorticity <ωz >, and streamlines <Ψ> indicate no interaction between the shear layers that form across the top and bottom side branches. The shear layers are essentially horizontal. For the narrow channel, shown in Fig. 8, these parameters indicate a more complex hydrodynamic behaviour due to the relative proximity of the shear layers. Moreover, the large excursions of the shear layers into the side branches are evident in Fig. 8. This pattern is characteristic to the first hydrodynamic mode of the shear layer oscillations. The distribution of the time-averaged turbulence statistics, such as the root-mean-square values of the velocity (<urms> and <vrms>) and Reynolds stress correlation (<u′v′>) serves as an indicator of the region of the relative unsteadiness in the flow field. Higher absolute values of these parameters correspond to the regions where the energy is extracted from the large-scale vortical structures and the acoustic noise is generated. Therefore, the plots of the turbulence statistics presented in Figs. 7 and 8 illustrate the structure of the acoustic source for the two values of the main duct width.
© 2005 WIT Press WIT Transactions on Modelling and Simulation, Vol 41, www.witpress.com, ISSN 1743-355X (on-line)
Computational Methods and Experimental Measurements XII 193
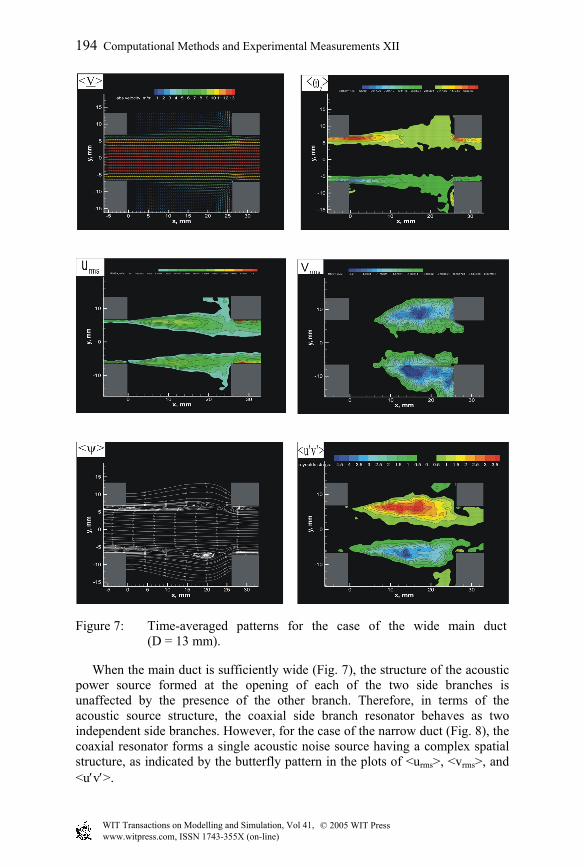
Figure 7: Time-averaged patterns for the case of the wide main duct (D = 13 mm).
When the main duct is sufficiently wide (Fig. 7), the structure of the acoustic power source formed at the opening of each of the two side branches is unaffected by the presence of the other branch. Therefore, in terms of the acoustic source structure, the coaxial side branch resonator behaves as two independent side branches. However, for the case of the narrow duct (Fig. 8), the coaxial resonator forms a single acoustic noise source having a complex spatial structure, as indicated by the butterfly pattern in the plots of <urms>, <vrms>, and <u′v′>.
© 2005 WIT Press WIT Transactions on Modelling and Simulation, Vol 41, www.witpress.com, ISSN 1743-355X (on-line)
194 Computational Methods and Experimental Measurements XII

Figure 8: Time-averaged patterns for the case of the narrow main duct (D = 6.5 mm).
4 Conclusions
Global quantitative images of acoustically-coupled flows through coaxial side branch resonators were obtained using digital particle image velocimetry (PIV). Combination of the PIV imaging with the measurements of unsteady acoustic pressure allowed characterization of the flows in terms of instantaneous, phase- and time-averaged parameters.
© 2005 WIT Press WIT Transactions on Modelling and Simulation, Vol 41, www.witpress.com, ISSN 1743-355X (on-line)
Computational Methods and Experimental Measurements XII 195

The decrease of the main duct width has a pronounced effect on the flow structure due to increased interaction between the unsteady shear layers that form across the side branches. Moreover, the spatial structure of the acoustic power source changes from two independent sources to a single source as the main duct width decreases. Implementation of the PIV imaging in conjunction with acoustic pressure measurements provides a powerful experimental tool capable of detailed characterisation of acoustically-coupled flows and identification of the flow structures directly contributing to the generation of acoustic noise.
References
[1] Ziada, S. & Bühlmann, E.T., Self-excited resonances of two side-branches in close proximity. Journal of Fluids and Structures, 6, pp. 583-601, 1992.
[2] Rockwell, D. & Naudascher, E., Review of self-sustaining oscillations of flow past cavities. ASME Journal of Fluids Engineering, 100, pp. 152-165, 1978.
[3] Hourigan, K., Stokes, A.N., Thompson, M.C. & Welsh, M.C., Flow-induced acoustic resonances for a bluff body in a duct: a numerical study. Proc. of the 9th Australian Fluid Mechanics Conf., Auckland, pp. 504-507, 1986.
[4] Stoneman, S.A.T., Hourigan, K., Stokes, A.N. & Welsh, M.C., Resonant sound caused by flow past two plates in tandem in a duct. Journal of Fluid Mechanics, 192, pp. 455-484, 1988.
[5] Howe, M.S., Contributions to the theory of aerodynamic sound, with applications to excess jet noise and the theory of the flute. Journal of Fluid Mechanics, 71, pp. 625-673, 1975.
[6] Rowley, C.W., Colonius, T. & Basu, A.J., On self-sustained oscillations in two-dimensional compressible flow over rectangular cavities. Journal of Fluid Mechanics, 455, pp. 315-346, 2002.
[7] Amandolèse, X., Hémon, P. & Regardin, C., An experimental study of the acoustic oscillations by flows over cavities. Journal of Vibration and Acoustics, 126, pp. 190-195, 2004.
[8] Oshkai, P., Rockwell, D. & Pollack, M., Shallow cavity flow tones: transformation from large- to small-scale modes", Journal of Sound and Vibration, 280, pp. 777-813, 2005.
[9] Kriesels, P.C., Peters, M.C.A.M., Hirschberg, A., Wijnands, P.J., Iafrati, A., Riccardi, G., Piva, R. & Bruggeman, J.C., High-amplitude vortex-induced pulsations in a gas transport system. Journal of Sound and Vibration, 184, pp. 343-368, 1995.
[10] Ziada, S., A flow visualization study of flow-acoustic coupling at the mouth of a resonant side-branch. Journal of Fluids and Structures, 8, pp. 391-416, 1994.
© 2005 WIT Press WIT Transactions on Modelling and Simulation, Vol 41, www.witpress.com, ISSN 1743-355X (on-line)
196 Computational Methods and Experimental Measurements XII