INVESTIGATING THE EFFECTS OF TANGIBLE AND...
143
INVESTIGATING THE EFFECTS OF TANGIBLE AND INTANGIBLE FACTORS ON CUSTOMERS’ PERCEIVED SERVICE QUALITY AND LOYALTY IN HOTEL INDUSTRY IN AL-LADHIQIYAH, SYRIA OMAR Z. ENIZAN ALSAQRE
Transcript of INVESTIGATING THE EFFECTS OF TANGIBLE AND...

INVESTIGATING THE EFFECTS OF
TANGIBLE AND INTANGIBLE FACTORS ON
CUSTOMERS’ PERCEIVED SERVICE QUALITY
AND LOYALTY IN HOTEL INDUSTRY IN
AL-LADHIQIYAH, SYRIA
OMAR Z. ENIZAN ALSAQRE

ii
INVESTIGATING THE EFFECTS OF TANGIBLE AND INTANGIBLE
FACTORS ON CUSTOMERS’ PERCEIVED SERVICE QUALITY AND
LOYALTY IN HOTEL INDUSTRY IN AL-LADHIQIYAH, SYRIA
By
OMAR Z. ENIZAN ALSAQRE
APRIL 2011

iii
TABLE OF CONTENTS
Acknowledgments ................................................................................... ii
Table of Contents .................................................................................... iii
List of Tables ........................................................................................... vii
List of Figures ......................................................................................... viii
List of Abbreviations ............................................................................... ix
Abstrak ..................................................................................................... x
Abstract .................................................................................................... xii
CHAPTER ONE INTRODUCTION
1.1 Introduction ………….................................................................. 1
1.2 Development and Benefits of Tourism Industry Worldwide ........ 1
1.3 Tourism in the Arab World ........................................................... 5
1.4 Tourism in Syria ............................................................................ 7
1.4. 1 Major Tourists’ Attractions in Syria .................................. 9
1.4.2 Al-Ladhiqiyah ..................................................................... 11
1.4.3 Development of Hotel Industry in Syria ............................ 12
1.5 Hotel Industry and Service Quality ................................................ 14
1.6 Statement of the Problem .............................................................. 18
1.7 Research Objectives ...................................................................... 22
1.8 Research Questions ....................................................................... 23
1.9 Significance of the Study .............................................................. 23
1.10 Definitions of Key Terms .............................................................. 25
1.11 Limitations of the Study ................................................................ 26

iv
1.12 Organization of the Thesis ……………………………………… 27
1.13 Chapter Summary .......................................................................... 28
CHAPTER TWO LITERATURE REVIEW
2.1 Introduction ................................................................................... 29
2.2 Service Quality .............................................................................. 29
2.2.1 Definition of Service Quality …………………………… 30
2.2.2 Conceptualization of Service Quality ………………...… 33
2.2.3 Aspects of Service Quality …............................................ 33
2.2.3.1 Tangible Aspects of Service Quality ……...…..… 34
2.2.3.2 Intangible Aspects of Service Quality …………... 38
2.2.4 Measurement of Service Quality …................................... 39
2.3 Studies on Service Quality in Hotel Industry ................................ 44
2.4 Customer Loyalty ........................................................................... 47
2.4.1 Definition of Customer loyalty ……………………..…… 47
2.4.2 Conceptualization of Customer Loyalty ………………… 48
2.4.3 Measurements of Customer Loyalty ................................. 52
2.4.4 Customer Satisfaction and Loyalty …………………...… 56
2.4.5 Service Quality and Customer Loyalty ............................. 57
2.5 Studies on Service Quality in Arab countries ................................. 61
2.6 The Conceptual Framework ……………………………………… 62
2.7 Chapter Summary ............................................................................. 62
CHAPTER THREE METHODOLOGY
3.1 Introduction ................................................................................... 64

v
3.2 The Design of the Study ................................................................ 64
3.3 Hypotheses of the Research ………………………………...… 65
3.4 Respondents and Sampling Design ............................................... 66
3.5 Data Collection Instrument ........................................................... 69
3.6 Data Analysis ................................................................................ 71
3.7 Pilot Study ..................................................................................... 74
3.8 Reliability and Validity ................................................................. 75
3.9 Chapter Summary .......................................................................... 76
CHAPTER FOUR RESULTS
4.1 Introduction ................................................................................... 78
4.2 Demographic Characteristics of Respondents ............................... 78
4.3 Results of Factor Analysis …………………………………….… 82
4.4 Results of Reliability Tests............................................................ 85
4.5 Results of Regression Models ....................................................... 86
4.5.1 Research Question One ................................................................. 88
4.5.1.1 Hypotheses 1-1, 1-2 and 1-3 Testing ............................. 90
4.5.2 Research Question Two ................................................................ 91
4.5.2.1 Hypotheses 2-1, 2-2, 2-3 and 2-4 Testing .................... 93
4.5.3 Research Question Three............................................................... 94
4.5.3.1 Hypotheses 3-1, 3-2, 3-3, 3-4, 3-5, 3-6 and 3-7 Testing
96
4.6 Summary of the Results ................................................................ 98
4.7 Chapter Summary .......................................................................... 98

vi
CHAPTER FIVE DISCUSSION AND CONCLUSIONS
5.1 Introduction ................................................................................... 101
5.2 Descriptive Results from Respondents ......................................... 102
5.3 Discussion of the Findings of the Study ………………..………. 103
5.3.1 Research Question One ..................................................... 104
5.3.2 Research Question Two .................................................... 105
5.3.3 Research Question Three .................................................. 106
5.4 Practical Implications .................................................................... 108
5.5 Recommendations for Future Research ........................................ 110
5.6 Chapter Summary .......................................................................... 111
References .................................................................................... 112
Appendices
Appendix A: Questionnaire (English Version) ……..…... 126
Appendix B: Questionnaire (Arabic Version) ………….. 129
List of Publications ………………………………………….... 132

vii
LIST OF TABLES
Table 3.1 Number of Items for the Dimensions in the Questionnaire …… 69
Table 4.1 Demographic Characteristics of Respondents ………………… 79
Table 4.2 Factor Analysis of the Items on the dimensions of Tangibles 83
Table 4.3 Factor Analysis of the Items on the dimensions of Intangibles 84
Table 4.4 Factor Analysis of the Items on the dimension of OPSQ ……... 84
Table 4.5 Factor Analysis of the Items on the dimension of Customer
Loyalty ……………………………………………………….…
84
Table 4.6 Results of Reliability Analysis ………………………………... 86
Table 4.7 Regressions Models and Variable …………………………...… 86
Table 4.8 Summary of Regression Model 1 (N=209) …………………… 89
Table 4.9 The Influence of the Three Intangible Variables on OPSQ in
Regression Model 1 ……………………………………………
90
Table 4.10 Summary of Regression Model 2 (N=209) ………………….. 93
Table 4.11 The Influence of the Independent Variables in Regression
Model 2 …………………………………………………….....
93
Table 4.12 Summary of Regression Model 3 (N=209) ………………..… 95
Table 4.13 The Influence of the Independent Variables in Regression
Model 3 ……………………………………….........................
96
Table 4.14 Summary of the Results of all Hypotheses ………………....... 99

viii
LIST OF FIGURES
Figure 1.1 Map of Syria ...................................................................... 7
Figure 2.1 Conceptual Framework of the Study ................................. 63
Figure 3.1 Research Procedures of the Study ..................................... 68
Figure 4.1 Distribution of the Age among the Respondents ............... 80
Figure 4.2 Distribution of Gender among the Respondents ................ 80
Figure 4.3 Distribution of the Annual Income among the
Respondents ……………………………………………...
81
Figure 4.4 Distribution of Number of Visits per a Year among the
Respondents ......................................................................
81
Figure 4.5 Distribution of the Purposes of Visits among the
Respondents .......................................................................
82
Figure 4.6 Modeling the Relationship between Dependent and
independent Variables ……………………………………
100

ix
LIST OF ABBREVIATIONS
OBG Oxford Business Group
OPSQ Overall Perceived Service Quality
PSQ Perceived Service Quality
SERVPERF Service Performance
SERVQUAL Service Quality
UNWTO United Nations World Tourism Organization
USM Universiti Sains Malaysia
WTO World Tourism Organization
WTTC World Travel and Tourism Council

x
INVESTIGATING THE EFFECTS OF TANGIBLE AND INTANGIBLE
FACTORS ON CUSTOMERS’ PERCEIVED SERVICE QUALITY AND
LOYALTY IN HOTEL INDUSTRY IN AL-LADHIQIYAH, SYRIA
ABSTRACT
Service quality in tourism industry has been examined in many different types of
business enterprise. Aspects of service quality can be divided into two: tangible and
intangible. Tangible aspects of service quality include the exterior and interior design
of hotels, the equipment found at hotels and the ambient conditions in the
environment of hotels. On the other hand, the intangible aspects of service quality are
those factors that are not touched; they include reliability, responsiveness, assurance
and empathy. The present study investigated the effects of both tangible and
intangible aspects of service quality at hotels on both customers’ overall perception
of service quality and loyalty. Data were collected from 209 respondents who were
guests at some hotels at Al-Ladhiqiyah, a Syrian coastal city. The instrument used for
data collection was a questionnaire based on Parasuraman, Zeithaml and Berry
(1988, 1991a, 1991b, 1991c); Bitner (1992); Wakefield and Blodgett (1996, 1999);
and Skogland and Siguaw (2004). Data were analyzed using descriptive statistics,
factor analysis and regression analysis. Cronbach’s alpha reliability test was run on
the data collected to determine the reliability of the data. Results of Cronbach’s alpha
reliability test showed that all the values were above 0.75 indicating acceptable
reliability because the values were above 0.70 (Nunnally, 1978). To test the
hypotheses, p ≤ 0.05 and p ≤ 0.01 significance levels were used to accept or reject
the hypotheses. This study showed that design of the hotels, the equipment at hotels
and the ambient conditions at hotels had their effects on customers’ overall

xi
perceptions of service quality at p ≤ 0.01. The results also showed that only
intangible factors of empathy and assurance had their significant influence on
customers’ overall perception of service quality at p ≤ 0.01. In addition, the results
indicated that empathy, assurance and reliability had a high significant influence on
customers’ loyalty at p ≤ 0.01. Accordingly, it is recommended that managers and
owners of hotels should give great attention to all tangible factors of service quality
at their hotels because such factors have their influence on customers’ loyalty and
can bring more profits to hotels. In addition, intangible factors of reliability,
assurance and empathy should be taken into consideration because they play a great
role in customers’ loyalty.

1
CHAPTER ONE
INTRODUCTION
1.1 Introduction
The current introductory chapter presents some background information on
the development of tourism worldwide and in the Arab world. It also provides some
information on Syria, the importance of tourism in Syria, the government policy for
improving tourism in Syria and the most well-known tourists’ attractions in both
Syria and Al-Ladhiqiyah. In addition, the current chapter presents the statement of
problem and the objectives of the study as well as the research questions. The
significance of the study and definitions of the key terms are also provided in this
chapter. This chapter concludes with discussing the limitations of the study and the
organization of the thesis.
1.2 Development and Benefits of Tourism Industry Worldwide
Tourism is a social phenomenon because it is associated with different
activities a tourist does; these activities include business, leisure, pleasure and
education (Page & Ateljevic, 2009). Tourism causes people to change their residence
for a while to provide a kind of recreation in their life; it does not necessarily involve
earning activities. In modern life, tourism has become one of the popular activities.
Tourism can be described as a dynamic interdisciplinary field and it is characterized
by an ever increasing competition. All over the world, tourism has been growing as
one of the major sources of income and employment. Hall and Boyd (2005) state that
tourism includes (1) the temporary movement of people to destinations outside their
normal places of work and residence, (2) the activities undertaken during their stay in

2
those destinations and (3) the facilities created to and provided to them suit their
needs. Due to the variations in tourists’ needs, providers of tourism services face
some difficulties to acquire and keep customers. Over the past several decades, the
sector of travel and tourism has risen significantly worldwide, becoming an
important driver of both growth and employment (Blanke & Mia, 2005).
The growth of tourism is one of the major worldwide economic forces,
offering strong competition to the oil and food industries as well as to the automobile
sector (United Nations World Tourism Organization [UNWTO], 2008). Worldwide
arrivals reached 842 million in 2006, representing a growth of 4.6% per a year. It has
been predicted that by 2020, international arrivals will exceed 1.5 billion people
(Frangialli, 2004). Developing countries are forerunners in tourism growth because
their markets share increased from 34% to 40% between 2000 and 2007. As a result
of considering tourism as the key factor for increasing new economic and social
benefits, investments in tourism infrastructure are rapidly increasing in the Middle
East, Africa, Asia and the Pacific and Central and South America (UNWTO, 2008).
According to the reports in 2004 by World Travel and Tourism Council (hereafter
referred to as WTTC) in the Caribbean, tourism has become one of the main source
for income (Mustafa, 2010). The growing importance of experiential tourism
(including nature, culture and soft adventure) has further heightened the popularity of
areas endowed with natural beauty and diverse cultures.
Tourism contributes effectively to the socio-economic development of both
developed and less developed countries. Furthermore, tourism is increasingly viewed
as an attractive development option for many parts of the developing world. Service

3
industries were given a noticeable attention as an emerging sector of the global
economy in late 1970s. The service sector has become one of the most prominent
elements of world economy as well as the most important focus of business
management strategy (Ghobadian, Speller & Jones, 1994). It has been noticed that
tourism has gained its significance for the economics of developing nations all over
the world (Telfer & Sharpley, 2008). According to World Tourism Organization
[WTO] (2010), the past ten years have witnessed a rapid growth in tourism that
resulted in the arrival of about 880 million international arrivals to different
destinations, accounting for almost US$852 billion of receipts. Moreover, more
growth is predicted to take place, not only for those destinations receiving the highest
numbers of tourists, but also for other ones with small market shares (Mustafa,
2010).
Although developing countries try to support tourism industry, such countries
face some challenges and problems (Telfer & Sharpley, 2008). All over the world,
there have been some incidents that affect tourism development. The events of
September 11 forced hotel industry to reduce expenditures, decrease the number of
employees and reduce services and amenities. Along with this event, the Iraq war
and SARS (Severe Acute Respiratory Syndrome) epidemic also led to a decrease of
the number of hotel guests. The hotel industry has currently recovered from the
sequences of these events and has raised a score of customer satisfaction to 83 in the
third quarter of 2003 from July through September (Barsky & Nash, 2003).
However, the hotel industry needs to consistently maintain and improve service
quality and attractiveness to increase accomplishing customer loyalty and
profitability (ibid).

4
Global hotel industry has received a remarkable attention in the recent few
decades. In leisure firms such as those in tourism industry, service quality is one of
the indicators of customers’ satisfaction, customers’ loyalty and hotels’ profitability
(Kotler, Bowen & Makens, 1996). In the few past decades, there has been a
remarkable increase in the development in the global hotel industry resulting in over-
construction and high competition among hotels and tourism companies (Min &
Min, 1997). In addition, all industries, including the hotel industry, face a highly
competitive environment. The remarkable quick growth in the hotel industry has
forced hotels to begin to seriously recognize the importance of service improvement
(ibid). One of the target aspects of service improvement is service quality that is
necessary to any hotel in order to distinguish itself from competitors and accomplish
customer satisfaction (Kandampully & Suhartanto, 2000). Accordingly, service
quality improvement has become a major focus in hotel industry because improving
service quality is one of recommended strategies for achieving a competitive
advantage and retaining customers (Kandampully, Mok & Sparks, 2001).
This section has provided a brief description of the development of hotel
industry in the world. It also has highlighted the major benefits of tourism as one of
the sources for economic development. The following section deals with the
development of tourism industry in the Arab world.
1.3 Tourism in the Arab World
Tourism in Arab countries is progressing and developing because Arab
countries realize the importance of tourism for their economy development and also

5
for decreasing the rate of unemployment. Due to the recent development and
progress of tourism industries in the globalization era, Arab countries have been
good destinations for western pilgrims, travelers and adventurers (Hazbun, 1997).
Furthermore, developing national plans for tourism in Arab counties is one of the
important aspects in most of Arab countries, such as Saudi Arabia, the Sultanate of
Oman and other Arab countries (Aziz, 2001). Thus, the sector of travel and tourism
in Arab countries has been a significant source for creating new jobs; contributing to
the economic income of these countries (Blanke & Mia, 2005) and becoming an
important concern for policymakers. In addition, over the last decade, Arab countries
have witnessed an impressive growth in the arrivals of international tourists
especially to Syria, Oman and Yemen, providing several job opportunities.
Tourism industry is important for all Arab countries because of some reasons.
First, as Hazbun (2001) admitted that Arab governments are working hard to
promote tourism as a means of building their own economic and to compete the
global marketplace. The second reason is related to the remarkable achievements of
tourism in Arab countries. This is because WTTC reported that economic activities
are indicating a more promising contribution of tourism and travel industry to Arab
countries economies (Mustafa, 2010). In 2009, travel and tourism is expected to post
US$241.9 billions of economic activity (as a total demand), growing to US$529.8
billion by 2019 in the Middle East region. For most Arab countries which try to do
some more progress in tourism because tourism is considered as a major source of
foreign exchange (Ibid). Other factors that have their influence on the tourism
development in Arab countries include “the development of transportation and its
infrastructure; the increase in investment incentives; improvement and diversification

6
of tourism products; the enhancement of marketing activities; the improvement of
electronic technology; and the emergence of new meanings in the experience of
tourism” (ibid, p. 43), just to cite few.
Although there is a growing competition among Arab countries in the sector
of tourism and travel, some problems and difficulties stand as great challenges for
those countries in the region. One of these problems is related to the comparison of
the progress of tourism in Arab countries to that of international tourism. It has been
argued that tourism and travel sector in Arab countries accounts for only about 6 %
of international tourist arrivals showing the growth opportunities that remain for the
sector (Blanke & Mia, 2005). However, tourism in Arab countries is in a good
progress (Al-Hamarneh, 2005). The second problem is related to the tension created
the terrorists’ attacks in some countries, such as Egypt. As a result of this, most
tourists from USA and other European countries visiting Arab countries are warned
to take caution before coming to any Arab country (Bianchi, 2006).
Recently, there have been some new trends in the tourism industry in Arab
world. Al-Hamarneh (2005) mentioned that these new trends include (1)
intraregional tourism in which both Syria and Lebanon are two of the major
destinations; (2) innovation of new types of tourism such as medical, spa, ecological
and sport tourism. Al-Hamarneh added that the third trend in the tourism industry is
“the new interpretation of pilgrimage and other religious spots” which are practiced
in a context similar to the context of tourism (p. 52).

7
Figure 1.1: Map of Syria
Source: http://geography.about.com/library/cia/blcsyria.htm
1.4 Tourism in Syria
As shown in Figure 1.1, Syria is a country in the Middle East and it lies at the
eastern end of the Mediterranean Sea with a coast of about 193 kilometres. It is
bordered by Turkey is on the north, Iraq on the east and southeast, Jordan on the
south, Palestine on the southeast and Lebanon on the west (Ministry of Tourism
[MOT], 2010b). Syria became a country in 1946 because before this date, it had been
a part of the Ottoman Empire. During the World War 1 (1914-1918), the Ottomans

8
fought with the Germans against the Allied Powers who won the war and divided up
the empire of Ottomans. After that, France took Syria in 1920. However, after 20
years of fighting and struggling, Syria won its independence in 1946 (Englar, 2006,
p. 7).
Due to the rich wealth of its ancient civilizations, Syria is considered to be the
largest small country in the world. For travellers, according to Phillips (2010), Syria
is a country that is “blessed with amazing history that can be matched by few other
countries” (p. 8). The location of the country is unique and strategic because it forms
the intersection of Asia, Europe and Africa. In addition, the country is described as a
region of both major historical consequence and a modern state (Antoun & Quataert,
1991). The strategic location of Syria at the crossroads of Europe, Asia and Africa, it
has thousands of years of history and an amazing culture; its capital city, Damascus,
is the world’s oldest continuously inhibited urban centre (Phillips, 2010).
Syria is seriously starting to provide an appropriate environment for better
tourism investment. It has been confirmed that Syria has already invited tenders for
more than 100 tourism sites during the Tourism Investment Market that was held in
Damascus in April, 2005 (Daher, 2007). These investments were for improving
tourism industry in the country. According to a recent study by WTTC, tourism is set
to become one of Syria’s main income earners over the next decade. In its 2008
report on Syria, the WTTC declares that travel and tourism would contribute $4.9
billion to gross domestic product that year, doubling to $9.6 billion by 2018 (Oxford
Business Group [OBG], 2008). By the summer of 2002, many Arab tourists from
countries in the Arabian Gulf shifted their plans of travelling to Europe or the United
9
States to nearer destinations in other Arab countries, such as Syria, Lebanon, Egypt
and Jordan (Hazbun, 2008, p. 196). These destinations are affordable destinations
because they are accessible by land. Accordingly, many families prefer to spend their
summer annual vacation in such accessible counties. Subsequently, tourism firms
and companies in Syria and Lebanon welcomed Arab tourists (ibid).
The previous sections focused on the development of tourism industry
worldwide, in the Arab world and in Syria. The previous sections also showed how
countries in the Middle East have given tourism a great attention as source of
business and investment. The following section deals with the major tourists’
attraction in Syria.
1.4.1 Major Tourists’ Attractions in Syria
There are different tourists’ attractions in Syria because it is known for its
seashores, mountains, forests and highlands and deserts. Syria has a coastline of
about 193 kilometres (Englar, 2006). As one of the major tourists’ destinations
among countries in the Middle East, Syria enjoys the growth and expansion of its
tourism industry. In Syria, tourism remains one of the major sectors contributing to
the prosperity of the economy of the country. This is because Syria is characterized
with the diversity of landscapes, sites and locations, which also attract international
tourists and have done for many years. Such diversity of landscapes makes the
country one of the good choices for tourists.
The tourists’ attractions also include places and sites in Damascus, Seydnaya,
Suweida, Zabadani, Maloula, Al-Ladhiqiyah and Ras Shamra. Each one of them is

10
unique in its features as a good destination for tourists. One of the tourists’
attractions in Syria is Seydnaya, which is an interesting cool spot in the worth of the
country. The monastery of Seydnaya and the Virgin Mary icon are the major places
tourists visit. A visitor to Seydnaya will visit the surrounding grottos, which were
once used as tombs. This is another one of the three towns where residents still speak
Aramaic (MOT, 2010b).
Suweida is worth a visit because at which a tourist can see its Roman ruins,
the Shahba Castle, the Suweida museum (Roman mosaics), the basilica and the
Temple to the God Dosares. North to this town are Kanawat and Shahba at which
there is 2nd
century Roman ruins: an amphitheatre, gates, paved roads, a temple and
baths and a museum of mosaics (MOT, 2010a). According to (Beattie & Pepper,
2001), the main tourists’ attraction in Suweida is undoubtedly its museum, as most of
the evidence of the town’s long history was lost during the first decade of the 20th
century.
In the fertile Barada River Valley, Zabadani is located. It overlooks orchards
and fruit trees and is connected to Damascus in the summer by a narrow-gauge train
that winds its way along the river valley. Zabadani, 45 kilometres in the northwest of
Damscus, is a good summer resorts for Syrians and foreigners to cool off (Beattie &
Pepper, 2001)
Another tourists’ attraction in Syria is Maloula, a Greek Catholic village
which is nestled in the foothills of the Anti-Lebanon Range. It is famous for the
multicoloured Cliffside homes (Darke, 2010). At Maloula, there is the 4th
century

11
Mar Taqla Monastery (Convent of St. Tekla), which has a chapel built into a cavern
in the rocks. In this place, the water dripping from the ceiling is reputed to have
healing properties. Climb along the cliff edge for some spectacular views over the
town and valley. Other attractions include Roman ruins and the nearby Convent of
St. Sarkis.
The discussion here focused on the major tourists’ attractions in Syria. The
following section deals with the major tourists’ attractions in Al-Ladhiqiyah.
1.4.2 Al-Ladhiqiyah
Al-Ladhiqiyah, sometimes written as Lattakia, is one of the major tourists’
attractions in Syria. It is a small town in the northwest of Damascus (see Figure 1.1).
It is one of the five cities that were built by Seleucus Nekator in the 2nd
century B.C.
Seleucus Nekator named it after his mother. Al-Ladhiqiyah is still a call for
Mediterranean cruise ships, stopping for excursions to nearby Qalaat Saladin (Daher,
2007). Al-Ladhiqiyah is the main port city in Syria and the largest Mediterranean
town with an active cultural, tourist and sporting life (Darke, 2010). Another
advantage of its location is that it is a manufacturing centre for surrounding
agricultural towns and villages. The availability of accessible natural resources, such
as beaches, natural areas and sunny weather in this city is one of the advantages that
make Al-Ladhiqiyah one of the preferred destinations for tourists who come to Syria.
Moreover, Al-Ladhiqiyah is considered an important stop for those travelling
along Syria’s Mediterranean coast, for those travelling by ferry to Cyprus or by bus
to Turkey. Though there's a small museum housing Ugarit pottery, most visitors

12
spend their time just a short drive north on the beach. Nearby Sahyun, a huge
Crusader-era castle, is spectacular and contains the ruined remains of Byzantine and
Arab buildings.
Due to the witnessed rising importance of tourism for Al-Ladhiqiyah, many
resorts and hotels have been opened on the coastal area of the city and in other areas.
These resorts have become a very good source for visitors and tourists seeking the
warm, sandy Mediterranean beaches (Phillips, 2010). According to MOT (2010a),
there are about 62 hotels In Al-Ladhiqiyah; of this number of hotels, there are only
four hotels are ranked five-star hotels. The following section discusses the
development of hotel industry in Syria.
1.4.3 Development of Hotel Industry in Syria
This section deals with the development of hotel industry in Syria, number of
hotels in Syria and Al-Ladhiqiayh and their locations. Hotel industry has a very fast
development in Syria. Al-Kalaa (2010) pointed out that there are some plans for
some more big number of different tourism establishments. As a result of this, the
government of Syria gives a remarkable attention to the development of tourism
because it considers the importance of tourism as a good source for advancing the
development process.
It is obvious that Syria is pushing hard to sell itself as a tourism destination
for the purposes of increasing state funding for promotional activities, while opening
up investment opportunities in the sector as it seeks to cash in on the prosperity in the
trade of tourism in the Middle East. Hotel industry plays a very significant role in

13
supporting the development of tourism industry. In Syria, according MOT, 2010b,
there are about five hundred and fifty-one hotels. In Al-Ladhiqiyah, there are about
62 hotels (MOT, 2010). All these hotels provide their services to guests who visit
these important places of attraction in Syria.
Hotels in Syria and Al-Ladhiqiyah are of different ranks and with affordable
prices. The selection of hotels in Syria is reasonable and can vary according to the
budget and the location. Moreover, there are few international chains of hotel
complementing the national luxury Cham Palace hotel chain (Mannheim, 2001). In
Damascus, the five-stars hotels, such as Le Meridian, Sheraton Hotel, Carlton Hotel
and Plaza Hotel. In Al-Ladhiqiyah, the five-star hotels include Côte D'azur De Cham
Resort, Palace Hotel and Riviera Hotel (Atlastour, 2008).
The government of Syria has taken some plans for improving tourism in the
country. As a result of these plans, there is an increase in the number of hotels in
Syria as one of the procedures for improving tourism in the country. Recently,
tourism investment in Syria witnessed a qualitative development between 2005 and
2007 (Al-Kalaa, 2008). The Ministry of Tourism in Syria is putting forth different
plans to develop the tourism in the country. These governmental plans include
signing agreements for investments in tourism and hotel industries and launching
major tourism projects. According to Al-Kalaa (2010), new hotels of international
level have started to provide their services during the last two years. These new
hotels include Damascus Four Seasons, Aleppo Sheraton, Seidnaya Sheraton,
Palmyra Semiramis and the historical Bloudan Hotel. In Syria, hotels can be found in
most of the tourists’ attractions and cities. Furthermore, there are a number of a good

14
number of hotels that reaches 551 hotels (MOT, 2010). According to Darke (2010),
there are some surprising five-star luxury-class hotels in Syria, especially in
Damascus, such as the Meridian, the Sheraton, the Semiramis and the newest
addition, the Four Season. These hotels provide their services including all the usual
five-star facilities like swimming pool, tennis courts, health club and several
restaurants to choose from (ibid)
1.5 Hotel Industry and Service Quality
This section is devoted for giving a basic background to the study through
discussing briefly the major concepts that are the focus of this study. This section
focuses on service quality and customer loyalty in hotel industry.
According to Johns (1999), the word service carries implications of
interpersonal attentions which represent a performance rendered by service provider.
The inconsistency of service depends on who delivers the service and how it is being
perceived. Therefore, service can be considered as a kind of experience that a
customer personally comes into contact with any aspect of the service provider
(Haksever, Render, Russell & Murdick, 2000). Service productivity and quality
depend on the two components of a service: delivery and performance.
Service quality focuses on satisfying the customers’ quality need. Garvin
(1988) focused on examining the quality concepts to cover both goods and service.
Service quality is the customer’s judgment about an entity’s overall excellence and
superiority (Zeithaml, 1988; Clow, Kurtz, Ozment & Ong, 1997). In other words, it
is a form of attitude related, but not equivalent to, satisfaction and results from a

15
comparison of expectations with perception of performance. Perceived service
quality is defined as the customer’s assessment of the overall excellence and
superiority at the product or service (Zeithaml, 1988).
Research proved that service quality has become an increasingly important
factor for success and survival in hotel industry. According to Zeithaml and Bitner
(2003), service quality consists of attributes, dimensions, measurements methods and
models; it is an important factor of successful business. In addition, service quality is
a way to manage business processes in order to ensure total satisfaction to the
customer on all levels.
There are two aspects of service quality: tangible and intangible. Tangible
aspects include building design, décor, layout, ambience, furniture, fixture and
equipment. All of them are considered to have a direct influence on the customer’s
perception of service quality. Bateson (1985) described tangibles as important factors
in managing the service encounter and reducing a perceived risk. Intangible aspects
of service quality include reliability, responsiveness, assurance, empathy
(Parasuraman, Berry & Zeithaml, 1991a, 1991b, 1991c).
The tangible factors including physical environment have some effects on
consumers in service organizations as well as employees. Bitner (1992) suggested
three different environmental dimensions: surrounding condition, spatial layout and
functionality and signs. While surrounding conditions can include temperature and
music, spatial layout and functionality may include furniture and the layout features.
Signs may include symbols, artefacts, signage and style of decor. All of these

16
dimensions are supposed to create an overall perceived servicescape that activates
internal cognitive, emotional and physiological responses with customers and
employees (Bitner, 1992). These are moderated by personality traits and situational
factors. The internal responses of the customers of the hotels subsequently affect
their behaviour in terms of staying longer, returning to the same site, or avoidance.
According to Wakefield and Blodgett (1999, p. 52), “the tangible physical
surroundings may more directly influence consumers’ affective responses”. So, the
environment with all its components mentioned above is a key factor which has a
great influence on people’s feelings, which is one of the reactions that encourage and
force people to remain in the place where they are in or to leave (Russell & Ward,
1982). Moreover, the cognition, emotions and behaviour of people can be greatly and
powerfully influenced by the physical environment (Russell & Ward, 1982;
Spangenberg, Crowley & Henderson, 1996). Berry and Parasuraman (1991)
suggested that consumers develop their understanding of the relationship between the
environment of a given service and the ‘quality’ of the service they may expect to
receive. In addition, it has been confirmed that consumers depend on the physical
and tangible evidence to which they have access to give evaluation of the quality of
the intangible service components (Namasivayam, 2004, p. 37). This can be applied
to establishments, such as hotels, in which customers may use their interaction with
the service provider to rate the service.
Wakefield and Blodgett (1999) tested a model that included the intangible
and tangible elements of the service quality scale (hereafter referred to as
SERVQUAL) that was established by Parasuraman, Zeithaml and Berry (1988).

17
Wakefield and Blodgett (1999) also included an affective or emotional measurement
of the customer’s level of excitement. They have reported in their study that the
tangible elements of the service environment had a positive effect on the excitement
level experienced by customers, which led to a positive effect on repeat-patronage
intentions and a greater willingness to recommend the leisure service to other people
such as friends or relatives.
Together tangible and tangible factors have their role to play in the
customers’ perceptions of service quality and loyalty. It has been confirmed that the
architecture and design of hotels (i.e. components of tangible factors) are significant
drivers for guests. In addition, customers’ perception of service quality and loyalty
are greatly affected by the room design and amenities through the evaluation of
perceived quality. Moreover, the attributes of the hotels may contribute to the
customers’ determination of purchase decision (Dube & Renaghan, 2000). The
physical environment is another factor; it is related to the image of the facility and it
includes extrinsic cues which influence the customer’s perception and satisfaction of
the service (Harrell, Hutt & Anderson, 1980). In addition, for ranking the hotels,
some customers firstly consider the physical appearance of the hotel exterior, the
public space and the guest room and secondly hotel’s location and brand name. They
ranked amenities and design above the service dimensions. Thus, customers’
satisfaction and loyalty increase significantly when the customers positively evaluate
their perceived quality about their stay at hotels.
Another important aspect of the customers’ behaviour is loyalty which occurs
in consumption situations. It is a complex construct which includes both behavioural

18
and attitudinal aspects. The concept of customer loyalty has been recently discussed
as an ultimate goal of firms to attain. Customer loyalty is particularly vital to the
hotel industry because of the intense competition among mature sectors of the
industry (Bowen & Shoemaker, 1998). Customer loyalty has been described as the
concept of repeat purchase behaviour, which can be regarded as some degree of
repetitive purchase of the same brand by the same buyer. Customer loyalty has been
viewed as one the various behavioural consequences of service quality (Zeithaml,
2000). As a behaviour intention after the performance of service, customer loyalty is
considered to be related to perceptions of quality (Rust & Zahorik, 1993).
1.6 Statement of the Problem
Although many studies discuss the relationship between customer satisfaction
and loyalty (Skogland & Siguaw, 2004) and customers’ perceptions of service
quality (Juwaheer & Ross, 2003), no study has established the relationship between
service quality dimensions as the key indicator of customer loyalty. Moreover, issues
related to both service quality and customers’ loyalty in hotel industry in Arab
countries have not been addressed adequately. According to Skogland and Siguaw
(2004), the concept of customer loyalty focuses on repeated purchasing behaviour of
customers, which describes the relationship with customer satisfaction. However,
studies on the relationship between perceived service quality of customers and
dimensions of customers’ loyalty are few.
The tangible factors including the physical environment of hotels has some
effects on the behaviour and attitudes of customers. However, little research has been
examined how the various component of physical environment and intangible factors

19
affect attitudes and behaviours of customers and little empirical research has been
done on the relationship between physical environment and key antecedents of
perceived quality (Baker, Parasuraman, Grewal &Voss 2002; Baker, Levy & Grewal,
1992; Bitner, 1992). In the case of tourism in Syria and according to the best
knowledge of the researcher, there are no published studies on the impact of physical
environment of hotels and other intangible factors on the customers’ perceptions of
service quality.
The importance of the physical environment of a hotel has been emphasized
by different researchers. Although the physical appearance of hotels’ exterior, the
appearance of public spaces, brand name and location of a hotel are the four
important attributes customers use to choose a hotel; the exterior design and the
appearances of public spaces are the most important ones. According to (Dube &
Renaghan, 2000), the physical appearances of the hotels’ exterior and public spaces
are considered two of the most attributes that are related to having a decision for
selecting a hotel to stay. Location and brand name are considered the other two
attributes cited more often in regards to the purchase decision. In fact, there is still
some debate over the fact that the physical environment was found to be more
important than service. Hotels have already started to recognize the importance of
hotel design both from an architectural and interior design perspective (Wagner,
1998; Worcester, 2000; Ransley & Ingram, 2001). To sum up, the exterior design
and public spaces of hotels continue to be important factors in the purchase decision
and in creating value during the stay.

20
However, the tangible elements were found not to have a significant effect on
perceived quality. While this appears to be contrary to their earlier study where there
was a relationship between the physical environment and perceived quality, the
measurements or scales used for the tangibles were very simplistic and basic in
comparison to the intangible measurements and scales. According to Daher (2007),
in the budgets of different Middle Eastern countries, tourism plays a significant role.
Due to the fact that some countries in the developing world suffer increasing
economic problems and mass unemployment, tourism has gradually become a very
essential sector for investment in such courtiers. This is supported by AlSayyad
(2001, p. 3) who stated that in the Third World and due to economic problems and
pressures coupled with mass unemployment, “tourism is an attractive sector to invest
in as it does not demand huge investments nor high technology”. However, studies
on tourism and hotel industry in Arab countries are still few. Moreover, Mittal and
Baker (1998) pointed out that the service encounter is the interface between the
customer, the service delivery system and where the service actually happens. Thus,
the service encounter is useful for both the customers and the service marketing
system. Bitner (1992) proposed a conceptual framework for understanding
environment and user relationships in service organizations. This section gave a brief
background to the present study.
Although Wakefield and Blodgett (1996, 1999) tested their models in some
leisure settings that included stadiums, casinos, family recreation centres and movie
theatres, they did not test them in the environment of hotels. In addition, scales for
both of the models developed by Wakefield and Blodgett (1996, 1999) were not
developed from the perspective of a hotel and more specifically, they were not

21
developed to evaluate the physical environment of hotels. Therefore, the effects of
tangible and tangible elements in hotel industry have not been studied and have not
been the focus of studies on service quality in hotel industry in Arab countries.
Another important factor in service quality is loyalty.
Wakefield and Blodgett (1999) indicated that “service quality is apt to be
perceived by customers primarily on the basis of intangible factors such as reliability,
responsiveness, assurance and empathy” (p. 52). However, issues related to the exact
intangible factors that can predict customers’ loyalty have not been investigated in
hotel industry in Arab countries.
For the improvement of tourism in Syria, hotel managers and owners need to
know how customers use and enjoy together the property and the manner in which
specific architecture and design components contribute to creating distinctive value.
Therefore, factors related to tangible aspects should be crucial for most hotel
operators (Dube & Renaghan, 2000; Hinkin & Tracey, 2003) because the physical
environment of hotels; such as hotel exterior, layout, cleanness, electric equipment
quality; are key factors to get positive perceived service quality evaluation from
customers. In other words, hotel properties’ elaborate physical surroundings require a
large capital investment to create an impressive physical presence. Operators should
consider whether those financial investments are truly worth the money.
Developing service quality programmes related to the design of hotels and
other intangible factors should be taken in account by managers and owners of
hotels. This is because customer’s evaluation and judgment of any service rely on

22
extrinsic cues. Generally, the service is produced and consumed simultaneously. A
customer uses total services within the firm’s physical facility and the customer is
naturally exposed to the place where the service is produced. Such extrinsic factors
have their influence on customer’s perceptions and evaluations of the service
experience they encounter (Shostack, 1977; Zeithaml 1988; Bitner, 1992).
Therefore, the present study attempted to investigate the influence of
tangible and intangible factors in hotels in Al-Ladhiqiyah on both the customers’
overall perceived service quality (hereafter OPSQ) and their loyalty. The present
study focused on service quality in Syria. The main purposes of the presents study
were (1) to investigate the effects of customers’ perceptions of the tangible factors
and intangible factors on perceived of service quality and (2) the effects of
customers’ perceptions of tangible and intangible factors of service quality on their
loyalty.
1.7 Research Objectives
Based on the discussion provided above, the objectives of the present study
were:
1. To examine the effect of tangible service variables on overall perceived
service quality of tangible factors.
2. To examine the effect of intangible service variables on overall perceived
service quality of intangible factors.
3. To examine the effect of tangible and intangible factors on customers’
loyalty.

23
1.8 Research Questions
The present study attempts to answer the following questions:
1. How do tangible variables of service affect customers’ overall perceived
quality of tangible factors?
2. How do intangible variables of service affect customers’ overall
perceived quality of intangible factors?
3. How do customers’ perceptions of tangible and intangible factors affect
their loyalty?
1.9 Significance of the Study
The present study has its own significance because of some reasons. First, the
present investigation contributes to research on service quality because it analyzes
the relationships among customer loyalty, perceived service quality and tangibles and
intangibles dimensions of service quality. This is because September 11, 2001,
significantly affected the business environment globally, including tourism industry
in the Arab World (Cunningham, Young & Lee, 2004; Mustafa, 2010). Furthermore,
the analysis provides statistically supportable evidence regarding these
interrelationships relative to the improvement of effective provision of service
quality.
Second, the current study is significant as it contributes to the literature of
studies and research on perceived service quality in tourism industry. This is because
studies on service quality in Arab countries have not addressed service quality and
loyalty in the hotel industry. Rather studies on service quality in Arab countries

24
examined the service quality in banks (e.g., Al-Tamimi & Al-Amiri, 2003; Jabnoun
& Al-Tamimi, 2003; Chaker & Jabnoun, 2010).
Third, the present study is significant because it tries to highlight the role that
the physical environment plays in the hotels’ customers’ perceptions of service
quality and loyalty. This is because understanding the loyalty of hotel customers can
have its contribution to the growth of the benefits of the hotels.
Fourth, this study is significance because the results of data analysis can be
useful to hotel owners and manager in tourism industry in the Arab World to have
the evaluation of service from their customers’ perspectives which turn help owners
and managers of hotels in Al-Ladhiqiyah to improve the service they offer.
Fifth, from a practical standpoint, the findings of this study are useful to plan
strategic marketing programmes in hotel industry in Syria because this study focused
on the physical environment of hotels and other intangible factors related to
employee or the hotels. Therefore, hotel owners, managers and operators would be
able to use the findings of this research to set their marketing plans for effective
physical environment that may exceed the needs of the hotels’ guests. An example of
effective physical environment planning might involve a hotel renovation.
Finally, the present study is one of the few studies that focus on hotel industry
in Arab countries that are considered to be a preferred destination to many tourists
from all over the world. In other words, studies in on tourism and hotel industries in
Arab countries in the Middle East are still few because “the promotion of tourism

25
development has represented the most feasible means” for improving services
provided to customers (Hazbun, 2004, p. 313).
1.10 Definitions of Key Terms
In the present section, the definitions of the most key terms are given below.
Intangible
Intangible factors in service refer to the services that cannot be seen or
touched. According to Kotler and Bloom (1984), intangibility is defined as “what
cannot be seen, tasted, felt, heard, or smelled”. In this sense, intangibility refers to
the total lack of the good or the attribute accessibility of service through the senses.
Tangible
According to Rowley (2006), tangibility “refers to the product’s physical
properties and the extent to which it can be seen, felt, heard, tasted or smelt” (p. 66).
Servicecapes
Servicescapes are “the built environment (i.e., the manmade, physical
surroundings as opposed to the natural or social environment)” (Bitner, 1992, p. 58).
These perceptions customers create are created through the environment (music,
colour, scent and crowding), atmosphere and physical attractiveness of the store
(Baker et al., 2002).

26
Service Quality
Service quality is defined as “the consumer's overall impression of the
relative inferiority/superiority of the organization and its services” (Bitner & Hubber,
1994, p. 77).
Perceived Service Quality (PSQ)
Perceived service quality is defined as “a global judgment, or attitude,
relating to the superiority to the service” (Parasuraman et al., 1988, p. 15).
Customer Loyalty
Customer loyalty is defined as “a deeply held commitment to re-buy or re-
patronize a preferred product or service consistently in the future, despite situational
influences and marketing efforts having the potential to cause switching behaviour”
(Oliver, 1997, p. 392).
1.11 Limitations of the Study
There are some limitations of the present study. First, the investigation of
hotel intangible and tangible services focused on major convenient facilities that can
be found in most of the hotels in the context of the study. Other studies included
some other tangible factors.
Second, the present study did not attempt to investigate the service quality of
hotels at AL-Ladhiqiyah. Rather, it investigated the effects of tangible and intangible
factors on customers’ perceptions of service quality and loyalty.

27
Third, the geographic area and setting is limited to only some random hotels
in Al-Ladhiqiyah. Thus, hotels in other cities in the country were not included
because of the constraints of time.
Fourth, this study focused only on the service quality at hotel industry.
However, service quality can be found in other leisure settings, such as health spas,
education, sport centres and health care centres. The current study did not attempt to
measure the service quality at hotels in Al-Ladhiqiyah. Rather, this study attempted
to investigate the relationship between customers’ perceptions of tangible and
intangible aspects of service quality on both customers’ overall perceptions of
service quality and customers’ loyalty. The following two sub-sections focus on the
tangible and intangible aspects of service quality.
1.12 Organization of the Thesis
The present thesis consists of five chapters. The first chapter focuses on a
background to the study. It focuses on providing a brief description of the major
tourists’ attractions in Syria and Al-Ladhiqiyah. The first chapter also discusses the
statement of the problem, the objectives of the study, the research questions and the
significance of the study. Limitations of the study and the definitions of important
terms are also provided in chapter One.
The second chapter is devoted for the literature review. The second chapter
discusses the most important key constructs, such as service quality, tangible and
intangible aspects of service quality and loyalty. Chapter Two provides the
conceptual framework of the study.

28
The third chapter deals with the methodology of the present study. It starts
with describing the research design. Next, methods of data collection are described.
After that, techniques and procedures for the analysis of data are explained. Finally,
the ethical considerations that were taken into account are detailed and explained.
The fourth chapter reports the results of data analysis. In Chapter Four,
answers to the three research questions are presented.
The last chapter is devoted for the discussion and conclusion. It starts with
providing a summary of the major findings of the study. Then, it discusses how the
results of the study are related to the results of earlier studies. Next, it provides some
practical implications for improving tourism and service quality in the hotel
industries in Syria. The findings of the current results are discussed in the light of the
findings of previous research studies. Recommendations for future studies are also
presented in chapter 5.
1.13 Chapter Summary
The current chapter served as an introductory chapter. It gave a brief
background on Syria and the major tourists’ attractions in Syria including Al-
Ladhiqiayh. The current chapter also included the statement of the problem, the
objectives of the research and the significance of the study. Definitions of the key
terms that are used in the presents study and the limitations of the presents study
were also given in this chapter. The following chapter is devoted for literature
review.

29
CHAPTER TWO
LITERATURE REVIEW
2.1 Introduction
This chapter deals with the literature review. It is very important to mention
that the theoretical literature in this study focuses on two major theories: service
quality and customer loyalty. The current chapter starts with the discussion of the
service quality in terms of conceptualization, dimension and measurement. Next, it
reviews studies that focused on tangible and intangible factors in hotel industry.
After that, it discusses the significance of customer loyalty in hotel industry and the
measurement of service quality. After that, it reviews studies that focused on service
quality and customer loyalty in hotel industry. Finally, it presents and explains the
conceptual framework of the study.
2.2 Service Quality
The purposes of this section are to provide brief descriptions on the concept
of service, to give some definitions of service quality, to discuss the dimensions of
service quality and to describe how service quality is measured.
Quality is one of those elusive concepts that are easy to visualize but difficult
to define. Prior to World War II, the notion of quality was based on the physical
characteristics of a product. The quality mandate was to measure the variation in the
product or service characteristics from standard specifications, then confront the
manufacturing or service-delivery process that contributed to any variations

30
identified (Tenner & Deloro, 1992). Quality has many definitions, ranging from
specific to general and the variation of its definitions depends on the functional area.
The evolution of the service concept can be traced to early literature
suggesting that organizations should incorporate the desired service outcome into
early strategic planning decision-making (Heskett, 1987). According to Sasser, Olson
and Wyckoff (1978) and Collier and Meyer (1998), the concept of service has been
defined as the elements of the service package or “customer benefit package” that
provide the intended benefit or value to the customer. Giving a comprehensive
definition of service, Gronroos (1990) pointed out:
A service is an activity or series of activities of more or less intangible
nature that normally, but not necessarily, take place in interactions
between the customer and service employees and/or systems of the
service provider, which are provided as solutions to customer
problems. (p. 21)
In service design, as suggested by Lovelock and Wright (1999), firms such as
those in tourism industry should consider the combination of service product,
process, place, physical evidence, people, productivity and quality, price and
promotion. However, it has been suggested that the service concept is a detailed
description of (a) those customer needs that will be satisfied and (b) what is to be
done to satisfy those needs (Clark & Fujimoto, 1991).
2.2.1 Definition of Service Quality
Service is the activities and benefits a particular organization provides to
another and it can be described as a sub-product of a product (Kotler, 1996). It can
also refer to the activities individuals or groups provide for their benefit organization
to another organization. Customers’ perception to service heavily depends on service

31
quality (Kotler, 1996). Ramaswamy (1996) considered service as “the business
transactions that take place between a donor (service provider) and receiver
(customer) in order to produce an outcome that satisfies the customer” (p. 3).
Zeithaml and Bitner (1996) defined service as “deeds, processes and performances”
(p. 5).
2.2.2 Conceptualization of Service Quality
There are different conceptualizations of service quality. For example,
Gronroos (1984) proposed a model consisting of “output” and “process” quality
seeing quality as being two-dimensional. In this model, “output” quality refers to
what is delivered to the customer. The model recognizes that customers also have
some type of image of the firm that has a quality impact in itself and functions as a
filter. Furthermore, Gronroos divided service quality into two classifications
including technical quality and functional quality. While the primary emphasis of
technical quality is on what customers usually received from the service, functional
quality focuses on the procedures of service delivery. It is the integrated evaluation
customers give to services they receive. From a customers’ standpoint, service
quality has process quality and output quality. After receiving the service, customers
assess it subjectively. Output quality is customers’ assessment on the results of
services (Oliver, 1981, 1993; Bitner, Booms & Mohr, 1994).
Parasuraman, Zeithamal and Berry (1985) defined service quality as “the
difference of customers’ pre-service expectation and post service perception”. If
service quality equals customer pre-service expectation, the service has pre-perceived
quality. Therefore, service quality is the consistent degree of customers’ satisfaction

32
or their overall assessment given to a service they receive. Service quality can meet
and exceed customers’ expectations on products and services. It is very important for
owners and managers of hotels to attract customers and maintain long-term customer
relations in order to improve efficiency and increase the profits of such hotels.
Service Quality is the subjective perception customers produce by comparing their
pre-service expectation and real experience (Parasuraman, et al., 1985).
Berry and Parasuraman (1991) pointed out that service quality is the basis for
marketing services because the core product being marketed is a performance.
Customers buy the performance which is generally regarded as the core product of a
service-based organization. Kotler (1991) conceptualized a service as “any act or
performance that one party can offer to another that is essentially intangible and does
not result in the ownership of anything. Its production may or may not be tied to a
physical product” (p. 455). Examining the relationships among service quality and
customer satisfaction in the fitness industry, Choi (2001) revealed that “service
quality occurs during service delivery in an interaction between the client and the
contact person from the service firm” (p. 9). Therefore, the attitude and performance
of a service encounter has a prominent effect on the levels of customer satisfaction
and loyalty. In another study, Szmigin (1993) pointed out that service quality can be
divided into actual service, perceptual service and result service. Actual service is the
service customers get from the business. Perceptual service is the way service
providers deliver service. Result quality is assessing whether or not the results of
services meet customers’ expectation.

33
Parasuraman, Zeithaml, Berry (1994) operationalized the service quality
construct in use of qualitative and quantitative research following generally accepted
psychometric procedures. They suggested that service quality is an abstract and
elusive construct because of three unique to services: intangibility, heterogeneity and
inseparability of production and consumption. Initially, ten determinants of service
quality were identified; these ten dimensions were accessibility, reliability,
responsiveness, competence, courtesy, communication, credibility, security,
understanding/knowing the customer and tangibles. It is the development of the
original 22-item SERVQUAL instrument that is one of the most popularly used
instrument in studies on service quality. Using SERVQUAL instrument, they
condensed the ten determinants into five dimensions (three original and two
combined dimensions) and suggested the following labels and concise definitions for
the dimensions: tangibles, reliability, responsiveness, assurance and empathy.
To sum up, the current section has shown that the conceptualization of
service quality differs from one business to another depending on the type of
business and the variation in portions of service. However, the conceptualization of
service quality as suggested by Parasuraman et al. (1994) in their model has been
widely adopted. The following section discusses the two major aspects of service
quality: tangible and intangible aspects. The following section presents the aspects of
service quality.
2.2.3 Aspects of Service Quality
This section is devoted for explaining the main aspects of service quality in
hotel industry. These aspects are the major components of service quality. Service

34
quality is the outcome of a complex interaction between several dimensions.
Although researchers have tried to identify the most important components of service
quality, Parasuraman, et al. (1988) developed their SERVQUAL model. Thus, the
discussion in the following two sections focus on the main dimensions of service
quality under two main aspects/dimensions: intangible and tangible.
2.2.3.1 Tangible Aspects of Service Quality
There are indications of the importance of tangible aspects or factors in
hotel industry and other leisure settings. Bitner (1992) used the term servicescape to
refer to the interior layout and design of a service and have been labelled as a method
for services to create a particular customer environment. These dimensions are
particularly relevant in service industries because, unlike in manufacturing, the
customer resides in the service (Chase, 1988).
One of the tangible aspects of service quality is the design of the hotel. There
is growing evidence that hotel design has both marketing and strategic implications.
Average daily room rate, occupancy and revenue per available room are all
positively related to good hotel design. Ransley and Ingram (2001) argued that good
design can lead to greater profitability and they proposed a mathematical equation
called the design efficiency factor to demonstrate this concept. Therefore, many of
the messages hotels wish to convey to their guests can be effectively communicated
through the design of the hotel. Focusing on perceptions of customers of department
stores, Dabholka,Thorpe and Rentz (1996) found that the influence of tangible
aspects of department stores on customers’ service quality perceptions is higher than
that of intangible factors.

35
Another aspect of the tangible factors in hotel industry is the ambient
conditions that can include colour, music, lighting, seating comfort and overall
cleanliness of the places inside the hotels. It has been confirmed that all of these
items have their affect on customers’ perceptions and responses to the environment
(Baker & Collier, 2005; Parasuraman et al., 1988).
Wakefield and Blodgett (1994) studied the servicescapes of two stadiums,
one of high quality and one of low quality. It was determined that greater satisfaction
was associated with the servicescape of higher quality and therefore, people were
more inclined to go to games in that stadium. In another study, Wakefield and
Blodgett (1996) incorporated facility aesthetics, such as wall colour, wall covering,
seats and overall facility attractiveness in examining the effect of ambient conditions.
The customer’s perception of seating comfort is an important component of ambient
conditions. It is especially relevant in services where customers sit for long periods
of time. For example, the padding and available seat space for a particular chair may
affect a customer’s impression of the service. Also, a customer may be
psychologically uncomfortable if seated too close to other patrons. In this research,
ambient conditions are defined as capturing the overall appearance of the facility’s
design (Wakefield & Blodgett, 1996). Therefore, the interior and exterior conditions
of the service at hotels include architectural design, decor and special design, overall
attractiveness, temperature, lighting, noise and background music
Facility layout and functionality are generally referred to as the way in which
equipment and furnishings are arranged and the ability of those items to facilitate
customers’ enjoyment. They are often perceived through (signs and symbols) décor

36
intended to communicate and enhance a certain image or mood or to direct customers
to desired destinations (Wakefield & Blodgett, 1996). Facilities are explicit
communicators used as labels and directions to communicate behavioural guidelines.
Implicit communicators, such as quality of the raw materials and equipment, office
and desk size, tidiness, the presence of certificates and photographs and personal
objects are all symbolic representations of status and professional image (Pfeffer,
1981; Wener, 1985). In a study of leisure activities, electronic equipment displays
were shown to have a significant positive impact on perception of quality in football
and casino activities (Wakefield & Blodgett, 1996). Lucas (2003) extended the work
of Bitner (1992) and Wakefield and Blodgett (1996), narrow down the scope of the
slot floor of a hotel casino.
Thorough the earlier discussion, it is obvious that empirical studies have been
conducted to confirm the effect of ambient conditions, facility aesthetics and
cleanliness on customer perceptions of service quality. Specifically, studies of hotels
found that music tempo and familiarity of décor affects how long one shops, which
ultimately reflects customer satisfaction (Locke, 2001). Other studies have shown
lighting, temperature, noise, colour and smell can all influence employee behaviour
and performance (Latham & Locke, 1979; Locke & Sirota, 1976). In a study of
leisure activities of customers at professional baseball games, football games and in
casinos, facility aesthetics and cleanliness have been shown to have a positive impact
on customers’ perceptions of quality (Wakefield & Blodgett, 1996, 1999).
Spatial layout and functionality of the physical surrounding are particularly
important to services. Spatial layout in services generally refers to the way in which

37
machinery, equipment and furnishings are arranged and the size and shape of those
items. Functionality refers to the product accessibility, flow of pathways and appeal
of service displays. An effective layout can be a good source for providing ease of
entry/exit and accessibility to other secondary services. Bitner (1992) found that
spatial layout and functionality are particularly salient in complex self-serve settings.
Layout in discount stores has been found to facilitate the fulfilment of
functional needs, while interesting and mood-altering layouts may provide hedonic
value (Wakefield & Blodgett, 1996). Empirical research regarding spatial layout and
functionality has consistently shown these to be positively associated with customer
satisfaction. For example, layout accessibility and seating comfort were both found
to have positive effects on perceived quality across leisure settings (ibid). Similarly,
spatial layout and functionality have been linked to ease and satisfaction expected
(Bitner, 1992). Some research studies (e.g., Bitner, 1992; Wener (1985) suggested
that if the customer is required to complete complex tasks with time pressures, he or
she is less likely to enjoy the service and is therefore less likely to further patronize
that firm. This suggests some level of comfort perceived by customer may shape
further service purchases. However, some authors found that customers who are very
much concerned about value give their preferences for functionality over comfort in
facility layouts (Wakefield & Blodgett, 1996).
Some studies were conducted on the development of a scale for the perceived
environment in the fields of hospitality and tourism (e.g., Wakefield & Blodgett,
1996, 1999). While the physical environment is usually perceived as holistic, there is
research to indicate that consumers are aware of the individual dimensions or

38
separate elements that exist in a physical environment and can discriminate between
parts of the physical environment they like and dislike. After reviewing the literature
on hotel industry, it was decided that the present study had to include the exterior
design, the equipment and the ambient conditions. These studies did not focus on the
service quality in hotel industry.
The discussion in this section dealt with studies on the effects and the
important roles of tangible factors. The following section focuses on the intangible
aspects of service quality.
2.2.3.2 Intangible Aspects of Service Quality
The intangible aspects of service quality are those aspects that are not
touched. They include reliability, responsiveness, empathy and assurance. They
constitute an important role of service. These intangible factors are four of five
dimensions in SERVQUAL model of Parasurman et al. (1988). Intangibility is the
essence of service (Zeithaml et al., 1990) because it is perceived by customers in
subjective and highly abstract ways (Gronroos, 2000).
The dimensions of intangibles in service quality are reliability,
responsiveness, assurance and empathy. The dimension of reliability is defined as
“delivering the promised performance dependably and accurately” (Schneider & White,
2004, p. 32). While the dimension of responsiveness is defined as “willingness of the
organization to provide prompt service and help customers”, the dimension of assurance
is defined as “ability of the organization’s employees to inspire trust and confidence in
the organization through their knowledge and courtesy” and the dimension of empathy is
defined as “personalized attention given to a customer” (ibid).

39
Parasuraman et al. (1988) argued that reliability reflects the service provider’s
“ability to perform service dependability and accurately” (p. 23). Furthermore, reliability
includes doing it right the first time and it is one of the most important service
components of customers (Parasuraman et al., 1991a). Kandampully, Mok and Sparks
(2001) mentioned that reliability extends to providing services as and when
promised. Responsiveness represents the “willingness to help customers and provide
prompt service” (Parasuraman et al., 1988, p. 23). As result of this, the ability of
service providers “to provide services in a timely manner is a critical component of
service quality for many guests” (Kandampully, Mok & Sparks, 2001, p. 54). The
third dimension is assurance that reflects the “knowledge and courtesy of employees
and their ability to inspire trust and confidence” (Parasuraman, et al., 1988, p. 23).
Focusing on assurance, Kandampully, Mok and Sparks (2001, p. 54) asserted that
guests expect to feel safe in their transactions with employee. Empathy involves the
“caring, individualized attention the firm provides its customers” (Parasuraman et al.,
1988, p. 23). The importance of empathy may be the root of considering the
customer as an individual. The following section focuses on the development of
service quality.
2.2.4 Measurement of Service Quality
The measurement of service quality has been conducted from the
perspectives of the customers. However, some models have been developed to
measure service quality. There are different factors that are used to assess customers’
perceptions of a product or service. However, it has been acknowledged that the most
commonly used measure of determining guests’ attitudes is satisfaction with the
features of the hotel (Callan & Bowman, 2000; Choi & Chu, 2000). Through focus
group interviews, Parasuraman et al. (1985) developed a conceptual model that

40
defined service quality from the perspective of customers’ viewpoints. The authors
identified ten factors: tangibles, reliability, responsiveness, competence, courtesy,
credibility, security, accessibility, communication and understanding the customer.
Parasuraman et al. (1988) modified the ten dimensions of service quality into five
dimensions, including 22 items that measure customer perceptions of service quality
through empirical testing. These five dimensions are tangibles (the appearance of
physical facilities, equipment, personnel and communication materials), reliability
(the ability to perform the promised service accurately and dependably),
responsiveness (the willingness to help customers and to provide prompt service),
assurance (the knowledge and courtesy of employees and their ability to convey trust
and confidence) and empathy (the caring, individualized attention provided to the
customer). Zeithaml, Parasuraman and Berry (1985) linked the concept of perceived
service quality to the concepts of perception and expectations.
In services marketing literature, perception is considered as consumers’
beliefs concerning the service received (Parasuraman et al., 1985). Expectations are
defined as “desires or wants of consumers i.e., what they feel a service provider
should offer rather than would offer” (ibid, p. 47). It is significant to mention that
Parasurman et al. (1985) argued that expectations and satisfaction should not be used
to refer to the same meanings. This is because service expectations do not represent
predictions about what service providers would offer, but rather what they should
offer. In this model, service quality is conceptualized as a gap between consumer's
expectations (E) and the perception of the employees' performance (P). In order to
measure service quality, Parasuraman et al. (1988) suggested that customer's
expectation scores should be deducted from their perception scores (Q = P - E). The

41
better the positive score indicates superior service quality or vice versa. The gap that
is likely to occur between the people's expectation and perception of service is not
only a measure of service quality but also indicator of customer satisfaction and
discontent. Service quality from the customer's perceptions is dependent upon the
direction and degree of discrepancy between service expectation and service
perception. Therefore, the comparison of customer expectation and perceived service
quality in one particular organization can determine whether a service standard is
suitable.
In order to improve the SERVQUAL scale and to verify its applicability,
Parasuraman et al. (1991a) argued that understanding and responding to customer
expectations are more important than providing superior service. They conducted
sixteen focus group interviews with customers in six service sectors: automobile
insurance, commercial property and casualty insurance, business equipment repair,
truck and tractor rental and leasing, automobile repair and hotels. They employed
qualitative methods of data collection to explore questions as well as quantitative
research to test the relationships that existed within the model. In measuring
perceived service quality, the level of comparison is what a customer should expect;
whereas in measures of satisfaction, the appropriate comparison is what a consumer
would expect (Cronin & Taylor, 1992). As a result of their investigation,
Parasuraman et al. (1991a) eliminated the negatively expressed items, replaced two
confusing items with non-redundant alternatives and added importance weights to
the measurement process.

42
The SERVQUAL instrument has been extensively used in many studies (e.g.,
Saleh & Ryan, 1991; Gupta & Chen, 1995) focusing on measuring service quality in
the hospitality industry. Such studies applied and modified the SERVQUAL model
that was originally developed by Parasuraman et al. (1988, 1991a) for measuring
service quality in the hospitality industry. The modifications of the constructs of this
model have been done to fit particular hospitality situations (Juwaheer & Ross,
2003). However, this model cannot measure the actual performance and be assessed
from within the organization. This model has some weaknesses as it does; the
instrument has high external reliability that can be appropriately used in the hotel
setting.
Numerous researchers have adapted the SERVQUAL battery to specific
industries, products and target markets. Saleh and Ryan (1991) were among the first
to analyze service quality in the hospitality industry. Baker and Fesenmaier (1997)
used SERVQUAL in an effective way focusing on the expectation differences among
three groups (visitors, employees and managers) involved in a tourism service
encounter. Gupta and Chen (1995) conducted a study which identified the
relationship between five of the dimensions of SERVQUAL (tangibles, reliability,
responsiveness, assurance and empathy) and customer perceived service quality
using a linear regression model. Gupta and Chen found that the dimension of
tangibles was perceived as most relevant in the surveyed industries. According to
Choi and Chu (2000), customers generally focus on these factors when they perceive
hotel quality: cleanliness, location, room rate, security, service quality and the
reputation of the hotel or chain.

43
There are some alternative models for measuring service quality. Based on
the disconfirmation paradigm, Bolton and Drew (1991) developed a multistage
model of customers’ assessments of service quality and value. Applying the model
they developed, they found that the customers’ perceptions of service quality were
directly affected by disconfirmation and indirectly affected by expectation and actual
performance. Gronroos (1994) developed the initial model of perceived quality based
on the disconfirmation paradigm. McDougall and Levesque (1994) proposed a
conceptual model by adding the physical environment as one of the factors. Thus, the
three-factor model of service quality includes three factors: (1) service outcomes
(Gronroos, 1994), (2) service process (ibid) and (3) physical environment (Bitner,
1992). McDougall and Levesque used confirmatory factor analysis to test the model
by using the dimensions of SERVQUAL. The three-factor model of service quality
was supported by the result of McDougall and Levesque (1994) who concluded that
the three factors could be important determinants of the customers’ assessment of
service quality.
Cronin and Taylor (1992) examined Parasuraman et al.’s model of (1991a)
measuring service quality and argued that the disconfirmation paradigm was
intended to measure satisfaction not service quality and tested the performance only
scale (SERVPERF). They concluded that the performance-only SERVPERF measure
of service quality outperformed the disconfirmation-based SERVQUAL measure.
Parasuraman, Zeithaml and Berry (1994) argued that customer service quality
perceptions consist of the perceived service performance (SERVPERF) and the
perception of solving problems which may occur during the service encounter. They
suggested that the gap between performance and expectations moderates the

44
relationship between performance and behavioural outcomes. As the results, a
positive relationship existed between the perceptions of service quality and
behavioural outcomes as customer loyalty, reluctance to switch, willingness to pay,
willingness to pay a premium and increased probability of purchase.
2.3 Studies on Service Quality in Hotel Industry
One of the early studies on service quality in hotel industry is Saleh and Ryan
(1991) that was partially based on the SERVQUAL model created by Parasurarnan et
al. (1988). Saleh and Ryan (1991) modified the instruments and came up with a 30-
item, five-point Likert Scale instrument. The survey was categorized into three
sections. The first section was associated to the service quality expectation. The
second section contained the quality gained or offered and the last section was
intended to obtain demographic data from the participants. The data were collected
from 200 customers who were staying in 300-bedroom-hotel in Canada. On the other
hand, the hotel management and service providers were also asked to respond to the
questionnaire and an interview (Saleh & Ryan, 1991). This study explored the
existing gaps between customers' and management's perceptions of hotel qualities
and between customer anticipation and perception of service delivery (ibid).
By employing the analytical hierarchy process and competitive gap analysis,
Min and Min (1997) found that both the cleanliness of a guest room and courtesy of
hotel staff were among the attributes that were considered most important,
particularly in forming impressions of service quality. In their study, Min and Min
reported that two major service criteria (i.e., overall room values and front-office
services) and 14 attributes were relevant to Korean luxury hotels. In another one of

45
the early studies that was conducted in Australia’s three to five-stars hotels, Wong,
Dean and White (1999) extended version of SERVQUAL scale and found that
service quality in the hospitality industry was represented by three dimensions:
employees’ dimensions (behaviour and appearance), tangibles and reliability.
According to Wong, Dean and White, the best predictor of overall service quality
was the employees’ dimension and the most important attributes in this dimension
was individual attention given by the employees to the customers.
Recently, there have been some studies on service quality in hotel industry.
Using modified SERVQUAL model, Juwaheer and Ross (2003) found that an overall
evaluation of service quality in Mauritian hotels was determined largely by two
dimensions of SERVQUAL: assurance and reliability. While assurance factors in this
study included security and safety of guests and effective handling of complaints and
problems by hotel staff; reliability factors included hotels perform tasks that have
been promised to guests and resolving problems encountered by guests. They
emphasized that a focus on improving these factors in hotels can help in achieving
high levels of service quality and satisfaction.
For analyzing the image of Singapore from the perspective of tourists from
Indonesia, Pawitra and Tan (2003) used SERVQUAL. They found that the use of
SERVQUAL in measuring a destination image required some modifications in order
to ensure that the data reflect the unique attributes provided by the destination. They
also indicated that the destination image can be determined by analyzing tourist
perceptions. Emphasising the role of culture, Atilgan, Akinci and Aksoy (2003)
suggested that cultural characteristics have an effect on perceptions of service quality

46
in tourism. They also found that different cultural groups can have different levels of
expectations and perceptions in terms of service-quality dimensions. Therefore,
many of the items in the SERVQUAL instrument can be salient to different
customers for different reasons.
In a very recent study, Shahin and Dabestani (2010) conducted a study in
which they assessed the service quality gaps based on expectations and perceptions
of customers in a four-star hotel in Isfahan as the major tourism focal point in Iran.
The questionnaire they used includes four questions related to reliability, three
questions to responsiveness, three questions to security and confidentiality, two
questions to access and approachability, two questions to communication, two
questions to understanding the customer, three questions to credibility, three
questions to tangibles, two questions to courtesy, two questions to price, two
questions to competence and two questions to flexibility. They found that the
delivered service performance is lower than customers’ expectations and the “price”
gap has the highest positive value amongst the service quality dimensions. The
lowest positive value is also related to creditability. It is important to mention that
their study used only correlational analysis without conducting a factor analysis.
To sum up, most of the studies on service quality in hotel industry have been
conducted in five-star hotels in non-Arab countries. In other words, studies on
service quality in hotel industry in Arab countries are very few. For example,
Almossawi (2008) employed the SERVQUAL model to assess the quality of
services provided at one of the popular five-star hotels in Bahrain, named the Gulf
Hotel. He found that customers are dissatisfied

47
With the service quality (i.e. their expectations exceed their perceptions) provided at
the hotel in 55% of the SERVQUAL service attributes belonging to three
dimensions: tangibles, reliability and assurance.
2.4 Customer Loyalty
This main section deals with the definition of customer loyalty,
conceptualization of customer loyalty and the measurement of customer loyalty.
2.4.1 Definition of Customer Loyalty
Customer loyalty is defined as a hybrid between behavioural and attitudinal
loyalty with a higher emphasis on the behavioural aspect of customer loyalty (Dick
& Basu, 1994). One of the benefits of maintaining customers’ loyalty is that it
increases income and decreases costs when a company invests in improving
customer loyalty because loyal customer recommends the business to other people.
Word of mouth that is free advertisement helps businesses establish a good
reputation and generate income. Pullman and Gross (2004) acknowledge that loyal
customers are the key to success for many services, particularly those in the
hospitality setting. Bowen and Shoemaker (1998) also maintained that a small
increase in loyal customers can result in a substantial increase in profitability.
Further, Kandampully and Suhartano (2000) claimed that the significance of
customer loyalty is likely to become a necessary prerequisite for the future survival
of hotel organizations. Thus, in the current marketing environment, the keys to
success are attracting new customers and maintaining good relations with those
customers. The focus of this section and the following section is to show the
evolution of the loyalty construct over time, mapping out the construct's domain and

48
its specific components to provide a clear definition of the service quality construct
used in this study.
2.4.2 Conceptualization of Customer Loyalty
The concept of loyalty is rich with many possible definitions. A common
approach is to distinguish between a consumer’s attitudinal loyalty and behavioural
loyalty (Zeithaml, 2000). Behavioural loyalty is repeated transactions (or percentage
of total transactions in the category, or total expenditures in the category) and can
sometimes be measured quite simply with observational techniques. Attitudinal
loyalty is often defined as both positive affect toward the relationship’s continuance
and the desire to continue to remain in the relationship and is sometimes defined
equivalently with relationship commitment (Morgan & Hunt, 1994). Attitudinal
loyalty is measured by questionnaire methods. In order to examine customers’ word-
of-mouth intentions, re-patronage intentions and their relationship to customers’
loyalty, it is recommended to use of more than one approach (Soderlund, 2006). It is
significant to mention that these common aspects of loyalty are most common
determinant of loyalty in existing research (ibid).
The conceptualization of loyalty evolved over years. In the early days the
focus of loyalty was on brand loyalty with respect to tangible goods (Day, 1969;
Tucker, 1964; Kostecki, 1994). Cunningham (1956) defined brand loyalty simply as
the proportion of purchases that is given to a particular brand a customer purchases
most often. This definition broadened the spectrum of analysis by focusing on store
as opposed to brand loyalty using the same measures he had used earlier for brands.
However, few studies have looked at customer loyalty of services (Oliver, 1999).

49
Loyalty can be of substantial value to both customers and the firm. Customers
are willing to invest their loyalty in business that can deliver superior value relative
to the offerings of competitors (Reichheld et al., 2000). When customers are loyal to
a hotel or a firm, they may minimize time spent in searching and locating and
evaluating purchase alternatives. Also, customers can avoid the learning process that
may consume the time and effort needed to become accustomed to a new vendor.
Selnes (1993) stated that customer loyalty includes the possibility of
repurchase, possibility of switching and willingness of recommending services to
others. Higher customer loyalty leads to higher switching barriers. Customer loyalty
is the relationship between customer’s personal attitude (cause) and customers’
repurchase (result) (Dick & Basu, 1994). Jones and Sasser (1993) mentioned two
kinds of customer loyalty: long-term loyalty and short-term loyalty. Customers with
short term loyalty switch easily when they have better choices. Prus and Brandt
(1995) mentioned that customer satisfaction leads to customer loyalty.
Customer loyalty is the long-term relationship and customers have with a
certain brand or company. A loyal customer will keep purchasing the same product
or service even when there are other alternatives (Oliver, 1997; Bowen &
Shoemaker; 1998). Hepworth and Mateus (1994) declared that customer loyalty is
the customers’ intention of repurchasing the same products/service or other
products/services from the same company. Neal (1999) stated that “customer loyalty
is the frequency customers buy the same product and service when they need this
kind of products or services. Customer loyalty is behaviour and customer satisfaction
is an attitude”.
50
There are different characteristics for loyal customers. According to
Parasuraman et al. (1996), post-purchase behaviour is loyalty, brand switching,
payment, external response and internal response. Loyalty includes word of mouth
and intention of repurchase. According to Jones and Sasser (1995), there are three
characteristics of customer loyalty: (1) intention to repurchase (2) primary
behaviour-frequency of purchase, consistency of purchasing and length of being a
customer; (3) secondary behaviour-providing information and recommending to
others. Prus and Brandt (1995) pointed out that customer loyalty includes intention of
repurchasing, purchasing other products and services of the same company and the
intention of recommending to others. Moreover, Griffin (2002) mentioned that loyal
customer has the following characteristics: repeat purchase, intention to purchase
other products and services of the company, intention of recommending to others and
the ability of not being influenced by competitive brands.
In general, customer loyalty is thought to reflect how much customers wish to
maintain their relation with a specific supplier and it usually comes as a result of the
extent to which customers believe that what they get from this supplier is worth more
than what they get from others. An exact definition of customer loyalty, however,
may include a variety of attitudes and behaviours and may well be situation specific
(Kroenert et al., 2005). Customer loyalty has been connected to profits through
increased customer retention (Reichheld & Sasser, 1990; Anderson & Sullivan,
1993). In this respect, it has been found that the average annual profit per customer
grows constantly over the years that the customer remains with a company
(Gronroos, 2000). Thus, the effect of loyalty on profits is attributed to five distinct

51
factors: acquisition costs, revenue growth, cost savings, price premiums and referrals
(Reichheld, 1996).
In hospitality industry, loyalty programmes are common because it is
confirmed that loyal customers make more purchase. Furthermore, loyal customers
are less likely to switch to another hotel just because of price and other special
promotions (Shoemaker & Lewis, 1999). The most essential theory of loyalty
marketing is that a small increase in loyal customers can bring a significant increase
in profitability to a business. Reichheld and Sasser (1990) found that a 5% increase
in customer retention resulted up to a 125% increase in profits in nine service
industry groups they studied. Therefore, hotels or companies can double their profits
by retaining just 5% of their customers.
Thus, customer loyalty to services at a hotel is affected by the behaviour of
customers towards such service because loyalty reflects the extent to which
customers have the interest to maintain their relation with a particular hotel. In other
words, loyalty comes as a result of how much customers believe that what they get
from a specific hotel is worth more than what they get from others. Loyalty includes
a variety of attitudes or behaviours or may well be situation specific (Kroenert et al.,
2005). It is affected by a number of variables that are significant to be studied for
finding out the correlation between customers’ loyalty and tangible and intangible
aspects of services at hotels. The discussion in the current section focused on the
conceptualization of customer loyalty. The following section deals with major
studies that were conducted on measuring customer loyalty.

52
2.4.3 Measurement of Customer Loyalty
Customers’ loyalty can be measured through their intent to repurchase,
satisfaction and tolerance to price fluctuation. Customer loyalty includes customers’
repurchasing behaviour and their preference toward a certain product or service
(Fornell, 1992; Griffin, 2002). Backman and Crompton (1991) pointed out that
customer loyalty includes behaviour loyalty and attitude loyalty. While behaviour
loyalty is the frequency that customers purchase, attitude loyalty is customer
preference. However, Skogland and Siguaw (2004) argued that customer loyalty
means that customers have the interest to repurchase and recommend the business to
other people, such as friends and relatives. It includes praising the company to
others, recommending the company to inquirers, encouraging others to purchase,
keeping the company as their first purchase choice and repurchasing. Customer
loyalty can be measured by environmental attribute, managerial attribute and social
attributes (ibid).
With reference to measuring customer loyalty, studies can be divided
according to the dimension of loyalty. Earlier studies considered loyalty as one
dimension and emphasised that customer loyalty should be treated as one dimension
while focusing on measuring it. After that, studies measured loyalty as two-
dimensional item. Recent studies focused on loyalty as multiple attitudinal or
psychological facets of consumer loyalty. These recent studies led to a more
profound and integrated understanding of loyalty.
Studies that considered loyalty as one dimension are either studies that
focused on attitude loyalty or behaviour loyalty. Attitude loyalty is established when

53
customers like a certain product or service. Behaviour loyalty is customers’ habit of
re-purchase. Businesses should focus on customers’ needs and wants in order to
produce good products and services. Service quality directly influences customers’
loyalty. Thus, hotels and other leisure settings should follow customers’ changing
tastes to improve their products and services. Most of earlier studies that focused on
brand loyalty looked only at the behavioural dimension. According to these studies,
loyalty to a product or service was simply considered as “the consistent purchase of
one brand over time” (Backman & Crompton, 1991).
Due to the fact that behavioural approaches looked at observable variables
such as over behaviours of consumers, they were easy to operationalize. However,
they have many fatal weaknesses as the theoretical framework for studying consumer
loyalty. Howard, Edginton and Selen (1988), criticizing measuring behavioural
loyalty using one-dimensional approaches, used a two-dimensional model to measure
both repeat patronage and the degree of commitment expressed by consumers. They
suggested that the model they employed can be useful in measuring the degree to
which individuals are loyal to a park and recreation department.
Studies focusing on attitudinal loyalty only, just like behaviour-only
approaches, had their limitations. According to Prichard, Howard and Ravitz (1992),
many loyalty theorists found that the early studies of attitudinal components of
consumer loyalty lacked theoretical conceptualization because the multitude of
measures confused different researchers. As a result of this, it has been noted that
examination of the theoretical and empirical rigor underlying the development of

54
various attitudinal measures led to some questions on the construct validity of such
measures (Prichard, Howard & Ravitz, 1992).
The two-dimensional approach combines both the behavioural and
psychological facets of consumer loyalty. Thus it contributed to the understanding of
loyalty by overcoming the weaknesses of one-dimensional approaches. For example,
the two-dimensional approach can identify spurious loyalty of consumers while
behavioural loyalty could not. However, most two-dimensional studies of consumer
loyalty were deficient in that the measurement of psychological attachment of
consumers was very difficult.
Experience indicates that defining and measuring brand loyalty is extremely
difficult. The further exploration of the attitudinal dimension in recent years has led
to the conceptualization of loyalty as a dynamic process. The developments of
costumers’ loyalty, especially research concerning attitudinal loyalty, lead to some
more complicated and comprehensive models of the construct, such as multi-
dimensional models. In recent years, many researchers focused on consumer
loyalty’s multi-facetedness because of the concepts complexity, especially the
attitudinal dimension. For example, Prichard, Howard and Ravitz (1992) noted that
the addition of commitment as a component of attitudinal loyalty attracted great
attention from researchers of loyalty in the past decades.
Recently, Skogland and Siguaw (2004) stated that “research on customer
loyalty has primarily focused on customer satisfaction and involvement” (p. 221).
However, the researchers said that results on the relationship between repeat-
55
purchase behaviour and satisfaction were unclear. Numerous studies have indicated
significant relationships, whereas others have argued that satisfaction explains little
in regards to repeat purchases. Skogland and Siguaw (2004) suggested antecedent of
involvement on loyalty received inadequate consideration. Their research examined
the degree to which satisfaction impacts loyalty and they explored how satisfaction
may affect involvement to better understand how involvement may directly influence
loyalty. Taken this into consideration, the present study focused on the effects of
dimensions of service quality on customers’ loyalty. Findings indicated that neither
overall satisfaction nor satisfaction with the people factor were key indicators of
“repeat-purchase” behaviour, attitudinal loyalty, or “word-of-mouth” loyalty. Results
showed that less than half of even the most contented customers regularly selected to
stay again at the hotel they had just patronized. Skogland and Siguaw (2004) stated
that “although marketers have long advanced the presence of guest satisfaction as
instrumental in ensuring repeat business, guest satisfaction does not appear to have
the substantive and sweeping effect on guest loyalty that has previously been
assumed” (p. 227).
To sum up, in the last few decades’ exploration of consumer loyalty could be
divided into three stages. The early approaches focused on only one dimension of
consumer loyalty, either behavioural or attitudinal. The second stage was a
composite loyalty approach: it combined both behavioural and attitudinal
approaches. Although it was a synthesis of the approaches of the first stage, its
investigation of different aspects of the attitudinal loyalty were still superficial. The
third approach was the multidimensional model of loyalty studies including the
relational analyses of dimensions and the “path analytic model” (Iwasaki & Havitz,

56
1998). Compared with approaches in the first two stages the last approach provides a
more comprehensive understanding of consumer loyalty. The dynamic psychological
process model especially represents the direction of future research of consumer
loyalty because it reveals the complexity of this concept (ibid). In the present study,
loyalty is considered as a complex issue that is multi-dimensional.
2.4.4 Customer Satisfaction and Loyalty
In the recent changing global environment, all business firms, such as hotels,
are looking for innovative ways and strategies to increase customer loyalty because
customer loyalty has a very powerful impact on firms’ performance and it is
considered as a major source of competitive advantages (Lam, Shanker, Erramilli &
Murthy, 2004; Zeithmal, 2000). Enhanced customer loyalty of firms, such as hotels,
increases revenue, reduces customer acquisition costs, lower costs of serving repeat
purchasers and ultimately leads to greater profitability (Reichheld & Sasser, 1990;
Lam et al., 2004).
In some studies, it has been argued that satisfaction is an important factor in
measuring the service quality. However, customer loyalty is more important than
satisfaction. Even though customer satisfaction is vital to the hotel industry, customer
loyalty is more precious than customer satisfaction because loyal customers will
return and recommend the hotel to their friends and relatives and this, in turn, helps
increase hotel profitability (Bowen & Shoemaker, 1992). Pullman and Gross (2004)
argued that customer loyalty is an indicator to the success for the service industry,
especially the hospitality. Therefore, customer satisfaction is not necessarily an
indicator of customer loyalty (ibid). Accordingly, loyal customers do not switch to

57
other service providers with small differences, such as price or service. The proposed
definition of customer loyalty describes guests who hold favourable attitudes toward
the hotel, commit to repurchase the product/service and recommend the hotel to
others (Kandampully & Suhartanto, 2000).
Satisfied customers are not necessarily loyal customers because customer
satisfaction and loyalty are directly related but are not always positive. Bowen and
Chen (2001) pointed out that customer satisfaction and customer loyalty are two
parts of a concept. They are not directly related. Though good quality can result in
high satisfaction, high satisfaction does not directly create loyalty (Fay, 1994).
Numerous efforts of raising customer loyalty by improving customer satisfaction
have failed in the past because customer satisfaction does not have a significant
influence on customer loyalty (Neal, 1999). Moreover, meeting customers’
expectations only helps business to improve service quality. However, it does not
directly result in customer loyalty. It has been suggested that business should focus
on both customer satisfaction and loyalty (Stum & Thiry, 1991) because agreed that
customer satisfaction does not increase income but customer loyalty does (Fredericks
& Salter, 1995).
2.4.5 Service Quality and Customer Loyalty
The relationship between service quality and customer loyalty has been the
focus of a good number of studies. In this section, earlier and recent studies on
service quality and customers’ loyalty are reviewed.

58
Customer loyalty can be of great value to an organization because loyal
customers are believed to be much cheaper to serve and their support easier to
maintain. The last few decades’ exploration of consumer loyalty can be divided into
three stages. Insufficient, the early approaches focused on only one dimension of
consumer loyalty (either behavioural or attitudinal dimension) insufficient. The
second stage was the composite loyalty approach: it combined both behavioural and
attitudinal approaches. This approach was also deemed insufficient and superficial.
The third approach was the multidimensional model of loyalty studies including the
relational analyses of dimensions and the analytic model”. Compared with the first
two approaches, the last approach provides a more comprehensive understanding of
consumer loyalty. The dynamic psychological process model is believed to
especially represent the direction of future research of consumer loyalty because it
reveals the complexity of this concept.
Dick and Basu (1994) argued that market communications that enhance
consumers' beliefs regarding the service quality of a given company are likely to
strengthen repeat patronage. “Confidence with a service supplier is often a key to
loyalty and reminding consumers of past purchases ... may be critical in building or
maintaining loyalty”. Offering personalized services and enacting company policies
to build consumer confidence are ways that companies can try to induce attitudinal
loyalty in customers. Another aspect of service quality that is often used by
companies to enhance loyalty of customers is the attempt to obtain sites that provide
advantages to consumers in terms of time and effort (Dick & Basu, 1994). In another
study, Pritchard, Howard and Havitz (1992) indicated that recreation participants’

59
perceptions and evaluations of service quality may be related to their loyalty to a
recreation service.
Backman and Veldkamp (1995) indicated that consumer loyalty is important
and it must be nurtured since it may decrease with changing expectations or service
conditions. When the level of a particular service does not meet the customers’
expectations, they are likely to switch to another supplier of that service (Backman &
Veldkamp, 1995, p. 33). Furthermore, they indicated that there is a relationship
between consumers’ perceptions of service quality gaps and their degree of loyalty.
When the service quality of a company is below customers’ expectations, it can be
frustrating for consumers, which is likely to contribute to the loss of consumer
loyalty. Accordingly, it is suggested that in order to be more effective in developing
loyalty, agencies of hotels or any other leisure setting should be dedicated to
delivering excellent service quality and thus, managers should be very concerned
with the perceived quality of recreation services.
Pritchard and Howard (1997) suggested that loyal customers are “involved
decision makers who perceive significant service quality differences” (p. 5) and are
satisfied with their service experience. Mel, Dean and White (1999) indicated that
their review of literature revealed that customers' perceptions of service quality
impacted on customer loyalty. Focusing on hotel client, they found that the
component tangibles, particularly in relation to visual appeals of a facility, had a
greater impact on loyalty than any of the other performance components. They found
that consumer satisfaction acted as a mediator between service quality and customer
loyalty. In other words, service quality has an indirect impact on customer loyalty

60
through consumer satisfaction. Similarly, Backman and Veldkamp (1995) found that
in internet commerce and perceived service value had a considerable impact on
customer satisfaction and customer loyalty.
McCarville (2000) stated that expectations brought to a service encounter
create a reference point around which judgments are made. Even if a service option
was satisfying at one point, if it no longer meets expectations, it may become
unacceptable to some, leading to a decrease in customer loyalty. In order to combat
this, service providers strive to improve service offerings by developing relationships
with clients and by taking an active part in establishing expectation levels by
providing information those “under promises” services. Hallowell (1996) stated that
“loyalty behaviours including relationship continuance, increased scale or scope of
relationship and recommendation (word of mouth advertising) result from customers’
beliefs that the quantity of value received from one supplier is greater than that
available from other suppliers” (p. 28). In summary, several studies have shown a
positive relationship between consumer loyalty and consumers' perceptions of
service quality. These authors have offered suggestions for companies to increase
their quality of service in order to promote increased participant loyalty.
Therefore, the importance of the relationship between service quality and
loyalty cannot be denied and this relationship has been emphasized in previous
studies. However, the present study considered another issue which was investigating
the effect of the customers’ perceptions of tangible and intangible factors on both
customers’ overall perception of service quality and loyalty.

61
2.5 Studies on Service Quality in Arab Countries
In Arab countries, there have been studies on service quality, satisfaction and
loyalty. However, none of these studies have been conducted on the service quality at
hotels in Arab countries. Rather, these studies focused on service quality at banks
and higher education. Some of such recent studies on service quality in Arab
countries are Chaker and Jabnoun (2010), Kassim and Ismail (2009), Hossain and
Leo (2009), and Abdullah and Kassim (2009).
Chaker and Jabnoun (2010) developed a questionnaire based on the
constructs influencing service quality gaps found by Parasuraman to examine some
of major barriers to service quality in Islamic banks in Qatar and the impact of
demographic variables on the perceptions of these barriers. The questionnaire was
distributed to employees of Islamic banks in Qatar. Chaker and Jabnoun found that
lack of empowerment, centralization and lack of transformational leadership, were
found to be significant barriers to service quality in Islamic banks in Qatar. On the
other hand, culture was not found to be significant.
In a survey that was conducted in Qatar, Kassim and Ismail (2009)
investigated how perceived service quality, satisfaction and trust determined loyalty
in e-commerce settings at the level of construct dimensions. They found that only
assurance does appear to play an imperative role in building trust as suggested by
many authors. Of particular interest is the finding that word-of-mouth is an
antecedent of trust and intention. It becomes clear that word-of-mouth is a relatively
important driver of trust and intention in e-commerce settings. In another study,
Hossain and Leo (2009) focused on evaluating the service quality in retail banking in

62
the Middle East in general and Qatar in particular. They administered the
questionnaire to a sample size of 120 who were chosen on a convenient basis from
four banks. They found the highest customers’ perceptions are demonstrated in the
tangibles area such as infrastructure facilities of the bank, followed by the empathy
area such as timing of the bank and returns on deposit. On the other hand, they found
that the lowest perceptions are in the competence area, such as the method of
imposing service charges followed by reliability, such as customers’ guidance.
2.6 The Conceptual Framework
Based on the discussion above on theories and studies related to service
quality, dimensions of service quality and customers’ loyalty, the conceptual
framework of the present study is presented in Figure 2.1. The majority of service
quality studies adapted the SERVQUAL scale to measure service. It has been
reported in such studies that SERVQUAL is useful and effective in measuring
service quality.
2.7 Chapter Summary
The current chapter discussed the studies related to the objectives of the
presented study. It discussed service quality and its measurement. It also highlighted
the importance of tangible and intangible factors in hotel industry. In addition, the
current chapter described the significance of customers’ loyalty and how it is
theorized that it is related to OPSQ of tangible and intangible factors. The following
chapter focuses on the research design of the current study.

63
Figure 2.1: Conceptual Framework of Investigating the Effects of Tangible and
Intangible Factors on Customers’ Perceived Service Quality and Loyalty
in Hotel Industry
Intangible Factors
1. Reliability
2. Responsiveness
3. Assurance
4. Empathy
Tangible Factors
1. Design
2. Equipment
3. Ambient Conditions
Overall Perceived
Service Quality of
Tangible Factors
Overall Perceived
Service Quality of
Intangible Factors
Customers’ Loyalty

64
CHAPTER THREE
METHODOLOGY
3.1 Introduction
This chapter discusses the research design and the hypotheses of the study. It
presents the instrument that was used for data collection and the procedures for data
collection. This chapter presents also the research procedures concerning: (a) the
selection of subjects; (b) the survey instrument adoption and formation; (c) the
research procedures; and (d) plans for data analysis. In addition, the current chapter
also discusses how data were analyzed using SPSS.
3.2 The Design of the Study
The design of the present study is a survey study employing quantitative
approach. Most of the previous studies on service quality and loyalty in hotel
industry adopted quantitative approach with a survey design. These studies include
Saleh and Ryan (1991), Wakefield and Blodgett (1999), Kassim and Abdullah (2010)
and Shahin and Dabestani (2010), just to quote few. Miller (2004) stated that the
major advantages of survey research are (a) the ability to collect a wide scope of
information from a large population (b) dealing with a real situation in the sense that
a researcher collects data in the actual situation and (c) providing a first step in
developing hypotheses or in identifying more specific problems for research.
Previous studies of the components and characteristics of intangible service
(Parasuraman et al., 1988, 1991a, 1991b, 1991c) and tangible service (Wakefield &
Blodgett, 1996; Bitner, 1992) form the theoretical basis for this study. Thus, the

65
questionnaire that was sued as an instrument for data collection was based on these
theories.
3.3 Hypotheses of the Study
The present research attempted to answer three research questions. The three
research questions and the hypotheses of this study are listed below:
Hypothesis 1: The tangible variables have effect on overall perceived service
intangible quality
1.1 The design of the hotel has effect on customers’ overall perceived service
tangible quality.
1. 2 The equipment of the hotel has effects on customers’ overall perceived
service tangible quality.
1. 3 The ambient conditions in the hotel have effect on customers’ overall
perceived service tangible quality.
Hypothesis 2: The intangible variables have effect on overall perceived service
intangible quality.
2.1 Reliability has an effect on customers’ overall perceived service
intangible quality.
2.2 Responsiveness has an effect on customers’ overall perceived service
intangible quality.
2. 3 Assurance has an effect on customers’ overall perceived service
intangible quality.
2. 4 Empathy has an effect on customers’ overall perceived service intangible
quality.

66
Hypothesis 3: Tangible and intangible variables of the hotel have effect on
customers’ loyalty.
3.1 The design of the hotel has effect on customer loyalty
3. 2 The equipment of the hotel has effects on customer loyalty.
3. 3 The ambient conditions in the hotel have effect on customer loyalty.
3.4 Reliability has an effect on customer loyalty.
3.5 Responsiveness has an effect on customer loyalty.
3. 6 Assurance has an effect on customer loyalty.
3. 7 Empathy has an effect on customer loyalty.
3.4 Respondents and Sampling Design
In this study, customers who stayed overnight at hotels located in Al-
Ladhiqiyah, a coastal city in Syria were the target population. The respondents in this
study were selected randomly from the target population. The sampling design in the
present study was convenience sampling, a type of non-probability sampling, in
which the hotels’ customers were selected, in part or in whole, at the convenience of
the researcher. The researcher made no attempt, or only a limited attempt, to insure
that this sample is an accurate representation of some larger group or population.
According to Sekaran (2009) and Anderson, Sweeney and Williams (2009),
convenience sampling is a non-probability sampling technique where subjects are
selected because of their convenient accessibility and proximity to the researcher; the
respondents are selected without pre-specified or known probabilities. This sampling
has been used in measuring customers’ perceived service quality and customer

67
loyalty in several researches, such as Kim, Jin and Swinney (2009), Master and
Prideaux (2000) and Tsang and Qu (2000).
Moreover, the researcher tried to distribute the survey questionnaire to guests
when they checked in. With the help of managers at hotels, the questionnaires were
distributed to the respondents who were requested to return the questionnaires after
completion of responding to items of the questionnaire to the researcher when they
check out. Regarding the sampling of the hotels, they were selected randomly
because Al-Ladhiqiyah is a small town, in which there were no many hotels.
Figure 3.1 presents the procedures of the current research. As provided in
Figure 3.1, the first step was formulating the research objectives. Next, earlier studies
related to service quality and customer loyalty were reviewed. Next, theories related
to service quality, tangible and intangible factors in hotel industry were discussed in
detail. After that, theories related to the present study were reported. Next, the
conceptual framework for this study was constructed on the basis of earlier studies
focused on the effects of tangible and/or intangible variables on service on customer
loyalty. After that, the questionnaire was design based on earlier studies on service
quality. After that, data were collected at Al-Ladhiqiyah, a city in Syria. This was
followed by data analysis and results reporting. Finally, recommendations and
suggestions for improvement of service quality in hotels were presented in detail at
the end of the research.

68
Figure 3.1: Research Procedures of the Study
Identification of research objectives
Literature review and
theories review
Construction of conceptual
framework
Questionnaire design
Data collection
(Quantitative)
Guests of hotels in
some hotels in
Al-Ladhiqiyah
Data Analysis
(Descriptive Statistics, factor analysis
and regressions analysis)
Reporting the results
Conclusions and
recommendations
Pilot
study

69
3.5 Data Collection Instrument
The instrument that was employed for data collection in the present study was
a questionnaire that was based on Parasuraman et al. (1988, 1991a, 1991b, 1991c),
Wakefield & Blodgett (1996, 1999), Bitner (1992) and Skogland and Siguaw (2004).
The questionnaire in the present study was piloted for testing its validity and
reliability. Moreover, it was shown to experts to obtain their views on the items of all
dimensions. These experts have been teaching and researching in business,
marketing and management for a number of years.
As provided in Table 3.1, the questionnaire, which was administered by the
researcher himself, consisted of four sections. The first section of the questionnaire
was designed to obtain personal information concerning the demographic
characteristics of respondents including gender, age, annual income, number of visits
to hotels in the past year and the purpose of visits per a year. This section helped the
researcher to provide a profile of all respondents in the present study. However, the
respondents’ answers were not one of the variables.
Table 3.1: Number of Items for the Dimensions in the Questionnaire
Dimensions Number of items
1. Personal information 5
2. Design of the hotel 8
3. Equipment 3
4. Ambient conditions 4
5. Reliability 5
6. Responsiveness 4
7. Assurance 4
8. Empathy 5
9. OPSQ 2
10. Loyalty 7
Total of items 47 items OPSQ = Overall Perceived Service Quality

70
The second section of the questionnaire focused on indentifying the
customers’ perceptions of tangible aspects, including the design of the building,
equipment in the hotel and the ambient conditions. The total of items in this section
is sixteen items: eight items for design, three items for equipment and four items for
ambient conditions. This section was adopted with some modification from
Wakefield & Blodgett (1999). Some items were added to better fit within the context
of the study and the hotel industry. Respondents were asked to express their opinion
on the 16 items of tangible service quality attributes on a seven-point Likert scale,
ranging from ‘strongly disagree’ to ‘strongly agree’ with value 1 and 7 respectively.
To create a list of tangible service quality attributes for the questionnaire, previous
studies were reviewed. Frequently used attributes in tangible service quality studies
(Parasuraman et al., 1988, 1991a, 1991b, 1991c; Bitner, 1992; Wakefield &
Blodgett, 1996, 1999) were referred to.
The items in the third section of the questionnaire identified the customers’
perceptions of intangible aspects of service quality. The total number of items in this
section was eighteen items which were all directly based on Parasuraman et al.
(1988). Five items were given for the dimension of reliability, four items for the
dimension of responsiveness, four items for the dimension of assurance and five
items for the dimension empathy. Again, respondents were requested to express their
perceptions of the intangible service quality attributes on a seven-point Likert scale
ranging from ‘strongly disagree’ to ‘strongly agree’ with values 1 and 7 respectively.
The fourth section of the questionnaire was designed to identify customers’
loyalty. Respondents in this study were asked to express their opinions on their

71
loyalty to the hotel they were staying in. The total number of items in this section
was seven items. This section was adopted from Skogland and Siguaw (2004).
Moreover, using the dimensions with the seven items mentioned above was
suggested by different researcher (Hayes, 2008). The respondents were requested to
express their opinions on a seven-point Likert scale ranging from ‘strongly disagree’
to ‘strongly agree’ with values 1 and 7 respectively.
The English questionnaire was translated into Arabic language by an expert
in translating from Arabic to English. The Arabic version of the questionnaire was
then translated back to English to ensure consistency by a professor who is expert in
translating from Arabic to English. The English version of the questionnaire is
presented in appendix A and the Arabic version is presented in appendix B. The
following section deals with how the data were analysed.
3.6 Data Analysis
After the researcher collected all the completed surveys, invalid surveys were
discarded. The questionnaires were administered to 221 customers. The response rate
was 94.6% because the valid questionnaires were 209. The data obtained through the
questionnaire were analyzed using SPSS (Statistical Package for Social Sciences).
The data were tabulated and entered in SPSS for descriptive statistics, factor analysis
and regression analysis. To achieve the stated objectives and to test the hypotheses,
descriptive statistics and regression analysis were used.
Descriptive statistics for all questionnaire items and research variables were
computed in order to check for missing data and errors in data entry. Data entries

72
were then listed and checked against the original questionnaires. Once the data were
entered and coded, the researcher checked the assumptions and performed multiple
linear regression analysis to test the hypotheses at a 0.05 alpha level. Regression
analysis explains if there is a relationship between two or more variables and it also
clarifies whether the relationship is linear as in positive or negative.
Descriptive statistics was used to describe the basic features of the data.
Descriptive statistics was applied to determine mean and standard deviation scores
on all attributes. A frequency analysis was conducted for all the questions to examine
the distribution of the responses. In addition, hotel guests’ demographic information
was analyzed. Descriptive statistics was also used to consolidate the data to
determine mean and standard deviation of the attributes of intangible service,
tangible service, perceived service quality and customers’ loyalty. A frequency
analysis is conducted to examine the distribution of respondents’ demographic
profiles.
Multiple regression analysis was employed to determine the relative impact
of intangible service dimensions and tangible service dimensions on customers’
perceptions of service quality and loyalty. Regression analysis is a statistical
technique to analyze the relationship between a dependent variable and a set of
independent variables. Unlike correlation analysis, regression analysis describes the
nature of the relationship. Regression analysis used in the current study provided
measurements of the accuracy of the predictors, based on the explained variance and
measures the importance of the predictor variables that is, independent variables in
explaining the variance in the criterion variable that is, dependent variable.

73
Assumptions in multiple regression analysis include linear relationship,
constant variance of the error terms (homoscedasticity), independence of the error
terms (uncorrelated) and normality of the error term distribution. These assumptions
are detected by residual plots, Levene’s test and Kolmogorov Smirnov test. As
suggested by Hair Anderson, Tatham & Black (1998), multiple R and R Squared
were used to assess overall model fit. Multiple R is the correlation coefficient for the
simple regression of X and the dependent variable Y. R-square is the correlation
coefficient squared, also referred to as the coefficient of determination. This value
indicates the percentage of total variation of Y which explained by X (Pallant, 2007).
Another measure of the accuracy of predictions is the standard error of the estimate
which is the square root of the sum of the squared errors divided by the degrees of
freedom. It represents an estimate of the standard deviation of the actual dependent
values around the regression line.
As recommended by Hair et al. (1998), several measures need to be defined
for each variable in the equation. Those are the regression coefficient, the standard
error of the coefficient and the t value of variables in the equation. The beta value is
the value calculated from standardized data. The beta value allows us to compare the
effect of one independent variable on Y to the effect on Y of other independent
variables at each stage. The standard error of the coefficient is the standard error of
the estimate of b value. It is an estimate of how much the regression coefficient
varies between samples of the same size taken from the same population. The t-value
of variables in the equation, measures the significance of the correlation of the
variable reflected in the regression coefficient. Correlation and t values are available
74
to assess their potential contribution as for variables which are not in the equation
(Hair et al., 1998).
Regression analysis that was used to analyze the relationship between a
dependent variable and one or more independent variables could show the proportion
of variance between variables due to the independent variables. The level of
significance was set at 0.05 because it is the most standard in social sciences (Burns
& Burns, 2008). The parameters were estimated so as to give a best fit of the data. It
is significant to mention that regression can be used for prediction, inference and
hypotheses testing and modelling of causal relationships. These uses of regression
depended mostly on the underlying assumptions being satisfied. Although regression
analysis was criticized as being misused for these purposes in many cases where the
appropriate assumptions cannot be verified to hold (Berk, 2004; Freedman, 2005), it
has been employed in different studies measuring the relationships between service
quality and customer’ loyalty. In this study, regression in SPSS was used to analyze
the percentage of relationship changes between dependent variables as a result of the
independent variables. Studies on service quality and customer loyalty that used
regression analysis include Gupta and Chen (1995), Tsang and Qu (2000), Fu and
Parks (2001) and Akbaba (2006).
3.7 Pilot Study
A pilot study was conducted to test the internal consistency of the items of
the questionnaire. The respondents were USM students who had the chance to stay at
hotels in any Syrian city. The respondents to the questionnaire in the pilot study were
thirty-three respondents. The pilot study that was carried out with 33 respondents to

75
identify unanticipated problems or issues provided valuable information about
instrument administration, scoring routine and analysis techniques. Most importantly,
from the results of the pilot study, some items in the questionnaire were deleted to
acquire more reliable information from the scales prior to collecting the final data for
the study. Moreover, some items were rephrased for better face validity. Such items
focused on equipment in hotels.
3.8 Reliability and Validity
For establishing content-based validity evidence, the questionnaire was
submitted to a panel of three experts who possess a substantial amount of knowledge
and research experience in the field of business marketing and management to ensure
the validity of each of the constructs. First, the panel of experts was provided with
detailed information about the fundamental purpose and overall design of the study
to assist them in making improvement decisions. After that, the panel of experts was
asked to carefully review each of the questionnaires to determine whether the
individual items adequately represent the domains of the underlying constructs in
terms of wording, clarity, format and adequacy. In other words, the panel of experts
was asked to conduct a structured review of each of the questionnaires to ensure their
content relevance and content representativeness.
According to Churchill and Brown (2004, p. 333), “content validity is the
adequacy with which the important aspects of the characteristics are captured by the
measure”. Simply, the content validity ensured the instrument fully included the
important features of the construct that was being measured. To achieve the content
validity, a review of literature was conducted to find the important variables related

76
to the constructs of both service quality and hotel rating systems. Additionally, the
measure of service quality used in this study was adopted from the well-established
measurement of the SERVQUAL and the adaptation of internationally accepted hotel
rating model.
Churchill and Brown (2004) defined reliability as an “ability of a measure to
obtain similar scores for the same object, trait, or construct across time, across
different evaluation, or across the items forming the measure” (p. 335). They also
explained the two types of reliability which were an inter-judge reliability and an
internal consistency. The inter-judge reliability of a measure was operated when
different subjects evaluated a single object. An internal consistency was another
reliability used to determine the correlation of items in the measure. This study
observed only the internal consistency because the study asked for a score from each
respondent toward a statement. The internal consistency allowed the researcher to
check if each respondent’s scores of different parts in the measurement appeared in a
similar pattern. The coefficient alpha, generally known as Cronbach’s alpha,
indicated that the internal consistency existed. Nunnally (1978, p. 245) as cited in
Pedhazur and Schmelkin (1991) suggested “reliabilities of 0.7 or higher will suffice”.
Thus, the greater the coefficient alpha is, the more reliable the measurement is. The
reliability analysis of the collected data revealed that the scales had an internal
consistency supported by highly satisfied alpha value
3.9 Chapter Summary
This chapter focused on describing the research design of the study the main
instrument (a questionnaire) that was used for data collection. Next, procedures for

77
data collection and the sampling technique were also explained. In addition, this
chapter showed how data were analysed using descriptive statistics, factor analysis
and regression analysis. This chapter also provided explanation on how the pilot
study was conducted and how it was useful for the main study.

78
CHAPTER FOUR
RESULTS
4.1 Introduction
The main purpose of the present study was to investigate the effects of
tangible and intangible factors on overall perceived service quality and customers’
loyalty. Data for the present study were collected from 209 guests who were staying
in some hotels in Al-Ladhiqiyah during data collection in December 2009 and
January 2010. The instrument that was used for data collection was a questionnaire
consisting of 47 items. The current chapter discusses the results of data analysis. In
reporting the results of data analysis, the current chapter starts with reporting the
results of demographic data of the respondents. Next, it provides a description of the
reliability analysis. The results of regression analysis are reported in detail.
4.2 Demographic Characteristics of Respondents
This section is devoted for reporting the results of the demographic data of
the respondents. Table 4.1 presents a summary of the major characteristics of the
respondents. As it is shown in Table 4.1 below, the total of the respondents was 209.
The female respondents were 102 and constituted 51.2% out of the total respondents.
On the other hand, there were 107 male respondents constituting 48.8% of the total
respondents. The majority of the respondents were either between 28-37 years old
(27.3%) or between 38-47 years old (24.9%). Concerning the annual income, 37.3%
of the respondents were in category of less than $20000 followed by 25.4% in the
range between $20001 and $35000. Most of the respondents (38.3%) visited Al-
Ladhiqiyah between one to two times per a year. In addition, 21.5% of the

79
respondents visited that city 3-4 times per a year. Concerning the purpose of visit,
while 34 % of the respondents came for leisure, 24.9 % came for visiting their
relatives in Al-Ladhiqiyah. Moreover, 22.5% visited that city for both business and
leisure.
Figure 4.1 shows the distribution of the factor of age among the respondents.
As shown in Figure 4.1, most of the respondents who were guests in some hotels of
Al-Ladhiqiyah were between 28 and 37 years old (27.3%), followed by the category
of 38 to 47 years old (24.9%). On the other hand, the distribution of the respondents
according to the categories of their gender is presented in Figure 4.2. The gender
results indicated in Figure 4.2 show an almost an equal distribution with 51.2% being
male and 48.8% female.
Table 4.1: Demographic Characteristics of Respondents
Characteristics Categories Frequencies %
1. Gender Male 107 48.8 %
Female 102 51.2 %
2. Age
18-27 45 21.5 %
28-37 57 27.3 %
38-47 52 24.9 %
47-57 39 18.7%
Above 57 16 7.7%
3. Annual income
Less than $20000 78 37.3%
Between $20001- $35000 53 25.4%
Between $35001- $50000 34 16.3%
Between $50001- $75000 29 13.9%
Above $75000 15 7.2%
4. Visits per year
1-2 times 80 38.3%
3-4 times 45 21.5%
5-6 times 35 16.7%
7-8 times 36 17.2%
More than 8 times 13 6.2%
5. Purpose of visit
Business 23 11.0%
Leisure 71 34.0%
Leisure and business 47 22.5%
Meeting or conference 16 7.7%
Visiting relatives 52 24.9%

80
Figure 4.1: Distribution of Age among the Respondents
Figure 4.2: Distribution of Gender among the Respondents
While Figure 4.3 presents the distribution of the annual income of the
respondents, Figure 4.4 provides the distribution of the number of visits of the
respondents per a year. The final feature of the characteristics of the respondents is
the purpose of their visits. Figure 4.5 shows that the majority of the guests who were
at some hotels in Al-Ladhiqiyah came for the purpose of leisure (34%), followed by
the purpose of visiting relatives (24.9%).

81
Figure 4.3: Distribution of the Annual Income among the Respondents
Figure 4.4: Distribution of Number of Visits per a Year among the Respondents

82
Figure 4.5: Distribution of the Purposes of Visits among the Respondents
4.3 Results of Factor Analysis
Factor analysis and reliability tests were initially used. Exploratory factor
analysis was used to determine how many factors were appropriate and which items
belonged together. As suggested by Krishnaswamy, Sivakumar and Mathirajan
(2009), the steps that were followed for doing factor analysis were four: (1) data
collection and generation of the correlation matrix, (2) extraction of initial factor
solution, (3) rotation and interpretation and (4) construction of scales or factor scores
to use in further analyses.
The results of the factor analysis produced a clean factor structure with high
reliability loading on the factors. Most variables loaded heavily on one factor and
this confirmed that there was minimal overlap among factors and that all factors
independently structured. As shown in Table 4.2, for factor analysis of the
items/questions for tangible factors, each item score of tangible dimensions was
greater or equal 0.4. Results of factor analysis for the intangible dimensions are

83
provided in Table 4.3, results of factor analysis of OPSQ dimension is provided in
Table 4.4 and results of factor analysis of the customer loyalty dimension is provided
in Table 4.5. As shown in Tables 4.2, 4.3, 4.4 and 4.5, the score for each
item/question is greater than 0.4, based on Nunnally’s (1978) suggestion. Therefore,
all these items were not removed and were used for the multiple regression analysis.
Table 4.2: Factor Analysis of the Items on the Dimensions of Tangibles
Dimensions Items/questions Factor
Loading
Tangibles
Des
ign
1. The overall outside appearance of the hotel is
attractive.
0.643
2. The interior design of the hotel is attractive. 0.772
3. Layout of the hotel makes it easy to get
around.
0.638
4. Seats in the hotel are comfortable. 0.586
5. Lights in the environment of the hotel are
appropriate.
0.453
6. The furniture in the hotel is comfortable. 0.539
7. The decoration in the hotel is attractive. 0.587
8. The signs in the hotel provide adequate
direction.
0.601
Equip
men
t 1. The electronic equipment in the hotel is of
high quality.
0.486
2. Equipment in the hotel is modern-looking. 0.538
3. The audio/video machines in the hotel are
interesting.
0.547
Am
bie
nt
Condit
ions
1. The hotel is kept clean all time. 0.550
2. The temperature in the hotel is comfortable 0.583
3. The appearance of the employees in the hotel
is neat.
0.564
4. Walkways and exits in the hotel are kept
clean.
0.560
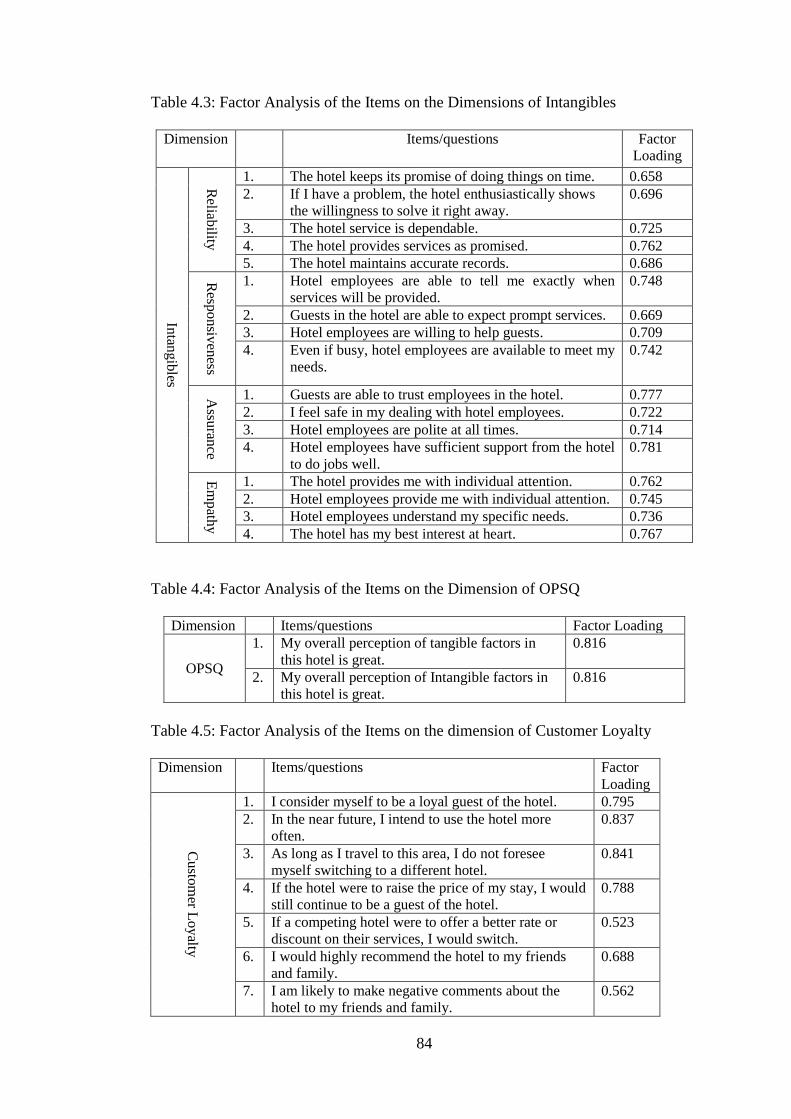
84
Table 4.3: Factor Analysis of the Items on the Dimensions of Intangibles
Dimension Items/questions Factor
Loading
Intan
gib
les
Reliab
ility
1. The hotel keeps its promise of doing things on time. 0.658
2. If I have a problem, the hotel enthusiastically shows
the willingness to solve it right away.
0.696
3. The hotel service is dependable. 0.725
4. The hotel provides services as promised. 0.762
5. The hotel maintains accurate records. 0.686
Resp
on
siven
ess
1. Hotel employees are able to tell me exactly when
services will be provided.
0.748
2. Guests in the hotel are able to expect prompt services. 0.669
3. Hotel employees are willing to help guests. 0.709
4. Even if busy, hotel employees are available to meet my
needs.
0.742
Assu
rance
1. Guests are able to trust employees in the hotel. 0.777
2. I feel safe in my dealing with hotel employees. 0.722
3. Hotel employees are polite at all times. 0.714
4. Hotel employees have sufficient support from the hotel
to do jobs well.
0.781
Em
path
y
1. The hotel provides me with individual attention. 0.762
2. Hotel employees provide me with individual attention. 0.745
3. Hotel employees understand my specific needs. 0.736
4. The hotel has my best interest at heart. 0.767
Table 4.4: Factor Analysis of the Items on the Dimension of OPSQ
Dimension Items/questions Factor Loading
OPSQ
1. My overall perception of tangible factors in
this hotel is great.
0.816
2. My overall perception of Intangible factors in
this hotel is great.
0.816
Table 4.5: Factor Analysis of the Items on the dimension of Customer Loyalty
Dimension Items/questions Factor
Loading
Cu
stom
er Lo
yalty
1. I consider myself to be a loyal guest of the hotel. 0.795
2. In the near future, I intend to use the hotel more
often.
0.837
3. As long as I travel to this area, I do not foresee
myself switching to a different hotel.
0.841
4. If the hotel were to raise the price of my stay, I would
still continue to be a guest of the hotel.
0.788
5. If a competing hotel were to offer a better rate or
discount on their services, I would switch.
0.523
6. I would highly recommend the hotel to my friends
and family.
0.688
7. I am likely to make negative comments about the
hotel to my friends and family.
0.562

85
4.4 Results of Reliability Tests
Reliability is defined as “the degree to which a measuring instrument is free
from random error so as to supply consistent results” (Cooper & Schindler, 2006, p.
323). Reliability also refers to the degree of consistency between multiple
measurements of a variable (Hair et al., 2006, p. 137). Cronbach’s alpha is a
statistical measurement that is widely used to assess the internal consistency
reliability of multi-item scales at an interval level of measurement.
In the present study, Cronbach’s alpha was used as an indicator of internal
consistency reliability because it refers to the degree to which the set of items of a
scale are internally consistent in their measurements and to their measuring of the
same underlying construct (i.e., the extent to which the items were coherent and had
a constant difference in phase) (Hair et al., 2006, p. 710). This is because a scale’s
internal consistency is one of the important aspects of reliability (Pallant, 2005, p.
90). The minimum level that is generally agreed upon for the Cronbach’s alpha
coefficient of a scale is 0.70 (Hair et al., 2006, p. 137; Pallant, 2005, p. 90). The
Cronbach’s alpha reliability coefficients of the nine constructs measured in this study
are provided in Table 4.6 in this section. As shown in Table 4.6, the Cronbach’s
alpha reliability coefficient values for all dimensions are higher than 0.70, the
accepted minimum value of 0.70. In the following section, the answers for the
research questions are provided.

86
Table 4.6: Results of Reliability Analysis
Dimensions (Variables) Alpha Value
Tangible
Factors
Design 0.86
Equipment of the hotel 0.80
Ambient conditions 0.85
Intangible
Factors
Reliability 0.93
Responsiveness 0.91
Assurance 0.93
Empathy 0.95
OPSQ 0.77
Customer Loyalty 0.93
4.5 Results of Regression Analysis
The present research attempted to answer three research questions. The three
research questions and the hypotheses are listed below:
Hypothesis 1: The tangible variables have effect on OPSQ of tangibles.
Hypothesis 2: The intangible variables have effect on OPSQ of intangibles.
Hypothesis 3: Tangible and intangible factors of the hotel have effect on customers’
loyalty.
Table 4.7: Regressions Models and Variables
Regression model Dependent variables Independent variables
First OPSQ of Tangible Factors
Design
Equipment
Ambient Conditions
Second OPSQ of Intangible Factors
Reliability
Responsiveness
Assurance
Empathy
Third Customers’ Loyalty
Design
Equipment
Ambient Conditions
Reliability
Responsiveness
Assurance
Empathy
The regression models investigated in this study were four. These four regression
models were as follows:

87
1. OPSQ of Tangible Factors = β0 + β1 (Design) + β2 (Equipment) + β3
(Ambient Conditions)
2. OPSQ of Intangible Factors = β0 + β1 (Reliability) + β2 (Responsiveness) + β3
(Assurance) + β4 (Empathy)
3. Customers’ Loyalty = β0 + β1 (Design) + β2 (Equipment) + β3 (Ambient
Conditions) + β4 (Reliability) + β5 (Responsiveness) + β6 (Assurance) + β7
(Empathy)
In the first regression model, the dependent variable is OPSQ of tangible
factors and the three independent variables are design, equipment and ambient
conditions (see Table 4.7). In the second regression model, the OPSQ of intangible
factors were formulated to be predicted by four independent variables: reliability,
responsiveness, assurance and empathy. In the third regression model, the customers’
loyalty is the dependent variable and the independent variables are design,
equipment, ambient conditions, reliability, responsiveness, assurance and empathy.
Before conducting regression analysis, all tests of regression assumptions, as
suggested by Pallant (2007), were conducted and there was no significant violation
of the assumptions and outliers found in the model. The degree of variable
collinearity is considered acceptable with the variance inflation (VIF) less than 10
and the condition indices less than 30 (Belsley, 1984). Indications show that there
was no variable collinearity in the model. Furthermore, there was no major deviation
from normality. In the following three main sections, the answers of the three
research questions are reported.

88
4.5.1 Research Question One
Research question one proposed that the design of the hotel, the equipment at
the hotel and the ambient conditions of the hotel had an effect on customers’ overall
perceived service quality of tangible factors. To answer this research question, three
hypotheses were developed. The three hypotheses were:
1.1 The design of the hotel has effect on customers’ OPSQ of tangibles.
1.2 The equipment of the hotel has effects on customers’ OPSQ of tangibles.
1.3 The ambient conditions in the hotel have effect on customers’ OPSQ of tangibles.
To test the three hypotheses in the first research question, regression analysis
was used to determine the impact of tangible service factors on customers’ overall
perception of tangible service quality. Based on Wakefield and Blodgett (1999) and
Bitner (1992), the present study proposed three tangible factors: design of the hotel,
equipment in the hotel and ambient conditions. It was proposed that these three
tangible factors had effect on overall perceived tangible quality. The independent
variables were the design of the hotel, the equipment at the hotel and the ambient
conditions at the hotel. The dependent variable was overall perceived service quality
of tangible factors.
Regression analysis was run on SPSS version 15. The ENTER variable
selection method involving all three tangible factors of service quality was utilized
for the total of 209 respondents. Table 4.8 presents a summary of the results of the
first regression model. As shown in Table 4.8, the results of the first regression
model indicates that the regression model was statistically significant (F = 83.173, p
= 0.000; P≤ 0.01) and 54% of the OPSQ of tangible factors was explained by the

89
three tangible factors of service quality. Moreover, the F-ratio value of 83.173 was
significant (p=.000; P≤ 0.01), indicating that the results of the equation hardly could
have occurred by chance. In addition, the results of the regression coefficient from
the first multiple regression showed the influence of the three independent variables
on the OPSQ of tangible factors. The coefficients indicated that all variables (i.e.
design, equipment and ambient conditions) had high contribution to explaining the
dependent variable. However, the variable of design exerted the strongest influence
on the overall perception of tangibles factors, followed by other independent
variables.
As provided in Table 4.9, the results of the regression coefficient obtained
from multiple regression analysis showed the influence of the three intangible
variables on the OPSQ. The coefficients indicated that the factors of design and
ambient conditions exerted the strongest influence on the customers’ OPSQ,
followed by the factor of equipment which exerted the weakest influence.
Table 4.8: Summary of Regression Model 1 (N=209)
Dependent
Variables
Independent
Variables R
2
Adjusted
R2
F Sig.
OPSQ of Tangible
factors
Design
0.549 0.542 83.173 .000* Equipment
Ambient
conditions
*P≤ 0.01

90
Table 4.9: The Influence of the Three Intangible Variables on OPSQ in Regression
Model 1
Independent
Variables B Beta t Sig.
Regression
Model 1
Design .385 .296 3.863 .000*
Equipment .278 .260 3.782 .000*
Ambient
conditions .308 .270 3.635 .000*
Dependent variable: OPSQ of Tangible factors
*P≤ 0.01
4.5.1.1 Hypotheses 1-1, 1-2 and 1-3 Testing
Hypothesis 1-1 was that the design of the hotel had effect on customers’
overall perceived service tangible quality. The null hypothesis and the alternative one
were:
1. The design of the hotel had effect on customers’ overall perceived service tangible
quality,
2. The design of the hotel had no effect on customers’ overall perceived service
tangible quality.
Hypothesis 1-2 was that the equipment at the hotels had effect on customers’
overall perceived service tangible quality. The null hypothesis and the alternative one
were:
1. The equipment at the hotels had effect on customers’ overall perceived service
tangible quality,
2. The equipment at hotel had no effect on customers’ overall perceived service
tangible quality.
Hypothesis 1-3 was that the ambient conditions of the hotel had effect on
customers’ overall perceived service tangible quality. The null hypothesis and the
alternative one were:

91
1. The ambient conditions at the hotels had effect on customers’ overall perceived
service tangible quality,
2. The ambient conditions at the hotels had no effect on customers’ overall
perceived service tangible quality.
As shown in Tables 4.8 and 4.9, hypotheses 1-1, 1-2 and 1-3 are supported by
the results of regression analysis at P≤ 0.01. Therefore, the factors of design,
equipment and ambient conditions were good predictors of OPSQ of tangible factors.
Accordingly, there was a relationship between these factors and the dependent
variable (i.e. OPSQ of tangible factors).
4.5.2 Research Question Two
Research question two proposed that intangible service factors had an effect
on OPSQ of intangible factors. To answer this research question, four hypotheses
were developed based on previous research. The four hypotheses were:
1.1 The reliability has effect on customers’ OPSQ of intangible factors.
1.2 The responsiveness has effects on customers’ OPSQ of intangible factors.
1.3 The assurance has effect on customers’ OPSQ of intangible factors.
1.4 The empathy has effect on customers’ OPSQ of intangible factors.
To test these four hypotheses, linear regression analysis was used to
determine the impact of intangible service factors on OPSQ of intangible factors.
Based on Parasurman et al. (1988), the present study proposed four tangible factors:
reliability, responsiveness, assurance and empathy. It was proposed that these four

92
intangible factors had effect on customers’ OPSQ of intangible factors. The
dependent variable was overall perceived service quality of tangible factors.
The linear regression analysis was run on SPSS version 15. The results of
regression analysis are presented in Tables 4.10 and 4.11. As provided in Table 4.10,
the results of the second regression model indicates that the regression model was
statistically significant (F = 176.624, p = 0.000; P≤ 0.01) and 77% of the OPSQ of
intangible factors was explained by the four intangible factors of service quality.
Moreover, the F-ratio value of 176.624 was significant (p=0.000; P≤ 0.01),
indicating that the results of the equation hardly could have occurred by chance.
As it is provided in Table 4.11, the results of the regression coefficient from
the multiple regression showed the influence of the four independent variables on the
overall perceived service quality. As presented in Table 4.11, the coefficients
indicated that the variables of empathy had its major contribution to explaining the
dependent variable (P≤ 0.01). On the other hand, it was found that also assurance and
reliability had their contribution to explaining the dependent variable (P≤ 0.01).
However, the results of the regression analysis of the effect of the variables of
empathy and assurance were highly significant at p≤ 0.01. On the other hand, the
results of the regression analysis of the In other words, the variable of empathy and
assurance exerted the strongest influence on the overall perception of intangibles
factors.

93
Table 4.10: Summary of Regression Model 2 (N=209)
Dependent
Variables
Independent
Variables R
2
Adjusted
R2
F Sig.
OPSQ of
Intangible factors
Reliability
0.776 0.772 176.624 .000* Responsiveness
Assurance
Empathy
*P≤ 0.01
Table 4.11: The Influence of the Independent Variables in Regression Model 2
Independent Variables B Beta t Sig.
Regression
Model 2
Reliability .194 .162 2.233 .027*
Responsiveness .161 .128 1.639 .103
Assurance .252 .211 2.713 .007*
Empathy .508 .433 6.234 .000**
Dependent variable: OPSQ of intangible factors
* P≤.0.05 **P≤ 0.01
4.5.2.1 Hypothesis 2-1, 2-2, 2-3 and 2-4 Testing
Hypothesis 2-1 was that the reliability had effect on customers’ overall
perceived service intangible quality. The null hypothesis and the alternative one
were:
1. The reliability had effect on customers’ overall perceived service tangible quality,
2. The reliability had no effect on customers’ overall perceived service intangible
quality.
Hypothesis 2-2 was that the responsiveness had effect on customers’ overall
perceived service intangible quality. The null hypothesis and the alternative one
were:
1. The responsiveness had effect on customers’ overall perceived service intangible
quality,
2. The responsiveness had no effect on customers’ overall perceived service
intangible quality.

94
Hypothesis 2-3 was that assurance had effect on customers’ overall perceived
service intangible quality. The null hypothesis and the alternative one were:
2-3: The assurance had effect on customers’ overall perceived service tangible
quality,
2-3: The assurance had no effect on customers’ overall perceived service tangible
quality.
Hypothesis 2-4 was that empathy had effect on customers’ overall perceived
service intangible quality. The null hypothesis and the alternative one were:
1. The empathy had effect on customers’ overall perceived service tangible quality,
2. The empathy had no effect on customers’ overall perceived service tangible
quality.
As shown in Tables 4.10 and 4.11, hypotheses 2-1, 2-2, 2-3 and 2-4 were
supported by the results of regression analysis.
4.5.3 Research Question Three
Research question three proposed that tangible service factors (design,
equipment and ambient conditions) and intangible factors (reliability,
responsiveness, assurance and empathy) had their effect on customers’ loyalty. To
answer this research question, seven hypotheses were developed. The seven
hypotheses were:
3.1 The design of the hotel has effect on customers’ loyalty.
3. 2 The equipment of the hotel has effects on customers’ loyalty.
3. 3 The ambient conditions in the hotel have effect on customers’ loyalty.
3.4 The reliability has effect on customers’ loyalty.
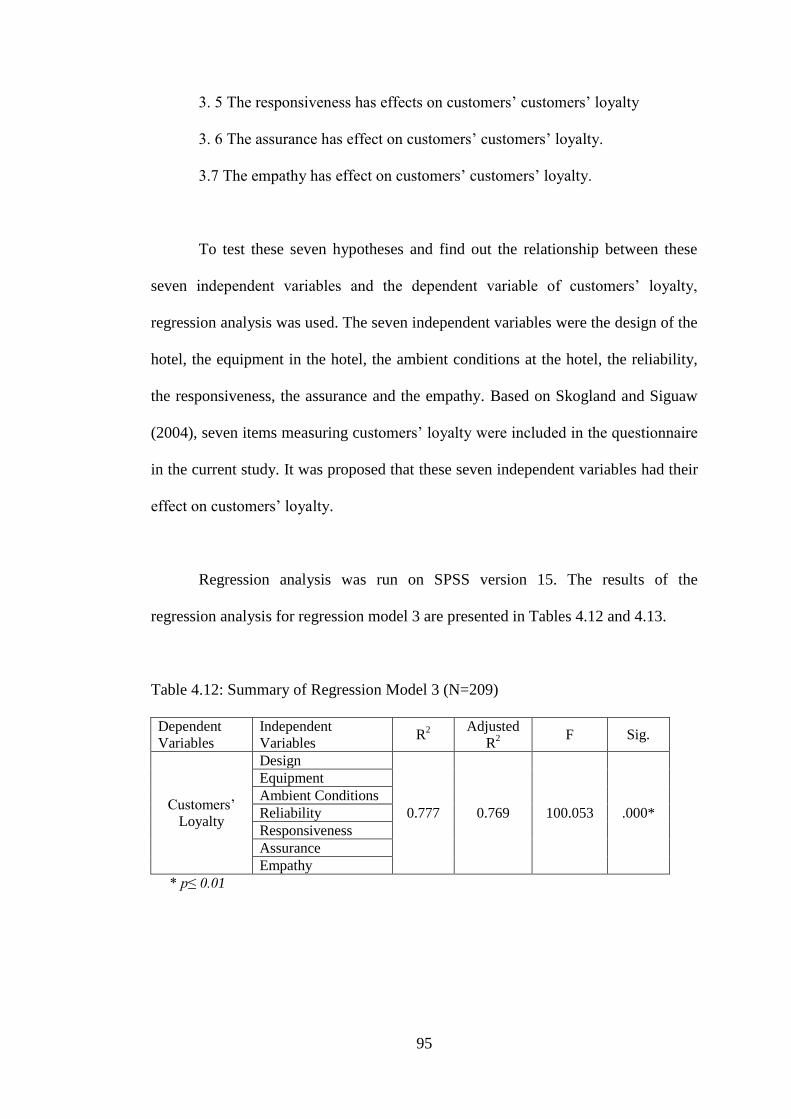
95
3. 5 The responsiveness has effects on customers’ customers’ loyalty
3. 6 The assurance has effect on customers’ customers’ loyalty.
3.7 The empathy has effect on customers’ customers’ loyalty.
To test these seven hypotheses and find out the relationship between these
seven independent variables and the dependent variable of customers’ loyalty,
regression analysis was used. The seven independent variables were the design of the
hotel, the equipment in the hotel, the ambient conditions at the hotel, the reliability,
the responsiveness, the assurance and the empathy. Based on Skogland and Siguaw
(2004), seven items measuring customers’ loyalty were included in the questionnaire
in the current study. It was proposed that these seven independent variables had their
effect on customers’ loyalty.
Regression analysis was run on SPSS version 15. The results of the
regression analysis for regression model 3 are presented in Tables 4.12 and 4.13.
Table 4.12: Summary of Regression Model 3 (N=209)
Dependent
Variables
Independent
Variables R
2
Adjusted
R2
F Sig.
Customers’
Loyalty
Design
0.777 0.769 100.053 .000*
Equipment
Ambient Conditions
Reliability
Responsiveness
Assurance
Empathy
* p≤ 0.01

96
Table 4.13: The Influence of the Independent Variables in Regression Model 3
(N=209)
Independent Variables B Beta t Sig.
Regression
Model 3
Design .071 .061 1.033 .303
Equipment .041 .044 .860 .391
Ambient Conditions -.088 -.087 -1.550 .123
Reliability .309 .314 3.960 .000*
Responsiveness -.024 -.023 -.283 .778
Assurance .285 .289 3.691 .000*
Empathy .327 .338 4.818 .000*
Dependent variable: customers’ loyalty
* p≤ 0.01
As provided in Table 4.12, the results of the regression coefficient showed that
there was a great influence of the seven independent variables on the customers’
loyalty. As presented in Table 4.13, the coefficients indicated that all reliability,
assurance and empathy had high contribution to explaining the dependent variable
(i.e. customer loyalty) at p≤ 0.01.
4.5.3.1 Hypothesis 3-1, 3-2, 3-3, 3-4, 3-5, 3-6 and 3-7 Testing
Hypothesis 3-1 was that the design of the hotel had effect on customers’
loyalty. The null hypothesis and the alternative one were:
1. The design of the hotel had effect on customers’ loyalty.
2. The design of the hotel had no effect on customers’ loyalty.
Hypothesis 3-2 was that the equipment at the hotels had effect on customers’
loyalty. The null hypothesis and the alternative one were:
1. Equipment at the hotels had effect on customers’ loyalty,
2. Equipment at the hotels had no effect on customers’ loyalty.

97
Hypothesis 3-3 was that ambient conditions had effect on customers’
customers’ loyalty. The null hypothesis and the alternative one were:
1. The ambient conditions had effect on customers’ loyalty,
2. The ambient conditions had no effect on customers’ loyalty.
Hypothesis 3-4 was that the reliability had effect on customers’ loyalty. The
null hypothesis and the alternative one were:
1. The reliability had effect on customers’ loyalty,
2. The reliability had no effect on customers’ loyalty.
Hypothesis 3-5 was that the responsiveness had effect on customers’ loyalty.
The null hypothesis and the alternative one were:
3-5: The responsiveness had effect on customers’ loyalty,
3-5: The responsiveness had no effect on customers’ loyalty.
Hypothesis 3-6 was that assurance had effect on customers’ loyalty. The null
hypothesis and the alternative one were:
1. The assurance had effect on customers’ loyalty,
2. The assurance had no effect on customers’ loyalty.
Hypothesis 3-7 was that empathy had effect on customers’ loyalty. The null
hypothesis and the alternative one were:
1. The empathy had effect on customers’ loyalty.
2. The empathy had no effect on customers’ loyalty.

98
As shown in Tables 4.12 and 4.13, hypothesis, 3-4, 3-6 and 3-7 were
supported by the results of the regression analysis at P≤ 0.01. On the other hand,
hypotheses 3-1, 3-2, 3-3 and 3-5 were not supported by the results of regression
analysis.
4.6 Summary of the Results
The hypotheses of the present study were 14. Table 4.14 presents a summary
of the results of regression analysis that was used for testing the hypotheses. As it is
provided in Table 4.14, nine hypotheses were supported by the results of regression
analysis. Theses hypotheses are 1-1, 1.2, 1-3, 2-1, 2-3, 2-4, 3-4, 3-6 and 3-7. On the
other hand, hypotheses 2-2, 3-1, 3-2, 3-3 and 3-5 were rejected by the results of the
regression analysis. In addition, Figure 4.6 shows the final results regarding the
relationship between independent variables and dependent variables.
As shown in Figure 4.6, the circular shapes are given for dependent variables;
in the middle of the figure, the rectangular shapes are provided to show the
independent variables. The strong relationship between an independent variable and
a dependent is indicated by a solid line. On the other hand, the weak relationship
between an independent variable and a dependent is indicated by a dash line. In other
words, rejected hypotheses were indicated by dash lines.
4.7 Chapter Summary
The current chapter reported the results of data analysis. It also reported the
results of the factor analysis and regression analysis. The following chapter focuses

99
on the discussion and conclusion. The following chapter also presents some
recommendations for future research.
Table 4.14: Summary of the Results of all Hypotheses
Hypotheses Test Sig. Results
Research question 1
1.1 The design of the hotel has effect on
customers’ overall perceived service
tangible quality.
Regression
analysis
.000* Supported
1. 2 The equipment of the hotel has
effects on customers’ overall
perceived service tangible quality.
Regression
analysis
.000* Supported
1. 3 The ambient conditions in the hotel
have effect on customers’ overall
perceived service tangible quality.
Regression
analysis
.000* Supported
Research question 2
2.1 Reliability has an effect on
customers’ overall perceived service
intangible quality.
Regression
analysis
.027* Supported
2.2 Responsiveness has an effect on
customers’ overall perceived service
intangible quality.
Regression
analysis
.103 Rejected
2.3 Assurance has an effect on
customers’ overall perceived service
intangible quality.
Regression
analysis
.007* Supported
2.4 Empathy has an effect on
customers’ overall perceived service
intangible quality.
Regression
analysis
.000** Supported
Research question 3
3.1 The design of the hotel has effect on
customer loyalty
Regression
analysis .303
Rejected
3. 2 The equipment of the hotel has
effects on customer loyalty.
Regression
analysis .391
Rejected
3. 3 The ambient conditions in the hotel
have effect on customer loyalty.
Regression
analysis .123
Rejected
3.4 Reliability has an effect on
customer loyalty.
Regression
analysis .000**
Supported
3.5 Responsiveness has an effect on
customer loyalty.
Regression
analysis .778
Rejected
3.6 Assurance has an effect on customer
loyalty.
Regression
analysis .000**
Supported
3.7 Empathy has an effect on customer
loyalty.
Regression
analysis .000**
Supported
*p≤ 0.05 **p≤ 0.01

100
____________________ strongest influence
------------------------------ no influence
Figure 4.6: Modeling the Relationship between Dependent and Independent
Variables
Independent Variables
Model 1
Model 3
Independent Variables
Design
Equipment
Ambient conditions
Empathy
Assurance
Responsiveness
Reliability
Model 2
Overall
perceived
service
quality of
tangibles
Overall
perceived
service
quality of
intangibles
Customer
loyalty

101
CHAPTER FIVE
DISCUSSION AND CONCLUSIONS
5.1 Introduction
The present study focused on investigating the effects of tangible and
intangible factors at hotels on the customers’ overall perceived service quality and
loyalty. The specific objectives of the current research were:
1. To examine the effect of tangible service variables on customers’ overall
perceived service quality of tangible factors.
2. To examine the effect of intangible service variables on customers’ overall
perceived service quality of intangible factors.
3. To examine the effect of tangible and intangible factors on customers’
loyalty.
Data were collected from 209 respondents using a questionnaire adapted to
measure the effects of tangible and intangible factors on OPSQ and customers’
loyalty. The sampling technique that was used for selecting the respondents was
convenience sampling. Data were collected from guests at some randomly selected
hotels at Al-Ladhiqiyah, Syria. Data were analyzed using descriptive statistics, factor
analysis and regression analysis. Three models of regression were formulated to test
the 14 hypotheses of this study. In the regression analysis of the three regression
models, the outputs of the regression analysis were compared with the standardized
coefficients (Beta weight, β) of each relation to find the variations in the effect of
tangible and intangible factors on OPSQ and loyalty. Moreover, the results of the

102
significance were compared to the p-value of significance that was set to 0.05 and
0.01.
The current chapter offers a summary of the current study and conclusions
related to the four research questions, practical recommendations derived from study
results are discussed in the first part. The current chapter concludes with a discussion
of the implications for managers and owners of hotels and suggestions for future
research in hotel industry.
5.2 Descriptive Results from Respondents
The respondents in the current study were 209. The male respondents were
107 (48.8%) and the female respondents were 102 (51.2%). Rankings in age groups
were as follows: about 27.3% of the respondents were 28-37, followed by 24.9% at
38-47, 21.5% at 18-27 and 18.7% at 47-57. For annual income, 37.3 % of
respondents were in the range of less than $20000, followed by 25.4% in the range of
$20001 to $35000, 16.3% between $35001 to $50000 and 13.9% in the range of
50001 to $75000 and 7.2% above 75000 $. In terms of number of visits per a year,
38.3% of the respondents visited Al-Ladhiqiyah between one to two times per a year,
followed by 21.5% of the respondents visited that city between three to four times
per a year. Regarding the purpose of visit, 345 of the respondents visited that city for
leisure, followed by 24.9% of the respondents visited that city for the purpose of
coming to see relatives and 22.5% of the respondents came for both leisure and
business.

103
The following sections focus on discussing the major findings and
conclusions of the three research questions of this study. After that, implications for
hotel industry and tourism industry are provided. Finally, recommendations for
future research in the fields of hotel industry are provided.
5.3 Discussion of the Findings of the Study
In this section, the major findings of the present study are discussed
according to the research questions. In addition, the results of the presents are
discussed in relation to the results of previous studies reviewed in the second chapter.
In other words, this section is devoted to discussing the connection of the results of
this study to the results and findings of previous studies. The reliability coefficients
of four dimensions of modified SERVQUAL were consistent with the original
version developed by Parasurarnan et al. (1988). Cronbach’s coefficient of the total
scale of the original SERVQUAL had very high internal consistency (a=.92)
according to Nunnally's (1978) analysis, the Cronbach's coefficient of the total scale
for the modified SERVQUAL used in this study was considered as having high
internal consistency (a=.90) as well. For the validity, the modified SERVQUAL
showed highly acceptable score (a=.70-.80), which was consistent with the original
version. This also was consistent with the findings of Lau, Akbar and Fie (2005) that
the internal consistency of modified SERVQUAL instrument had the overall alphas
higher than 0.80. This confirms Parasuraman et al.’s (1988) findings that the
SERVQUAL instrument could be employed in numerous services without revision
as the SERVQUAL has high reliability and validity.

104
Most service quality studies in the hospitality industry adapted the
SERVQUAL scale to measure service quality. Such studies showed that the
instrument SERVQUAL is useful and effective in measuring service quality in the
hospitality industry. Similarly, the current study revealed that SERVQUAL is an
effective and valid instrument to be sued in research related to service quality and its
dimensions and factors.
5.3.1 Research Question One
Research question one focused on examining the effect of tangible service
variables on OPSQ of tangible factors. In this research question, the dependent
variable is OPSQ of tangible factors and the three independent variables are design,
equipment and ambient conditions. The present study shows that the design of, the
equipment and the ambient conditions at hotels have their great influence on
customers’ OPSQ of tangible factors. Moreover, the factors of design and ambient
conditions have the strongest influence on customers’ OPSQ of tangible factors,
followed by the factor of equipment in hotels.
The present study shows that tangible factors in hotels industry have their
effects on both customers’ perceptions of service quality and loyalty. The results
revealed in this study related to the effects of the design of the hotels on customers’
loyalty are not in agreement with the results of Dubé and Renaghan (2000) because
they confirmed the importance of architecture and design as key value drivers for
guests. Moreover, the respondents in Dubé and Renaghan (2000) ranked the physical
appearance of the hotel exterior, the public space and the guest room only slightly
lower than the hotel’s location and brand name. Similarly, the present study shows

105
that the exterior design of this study had the greatest effects on both perceptions of
service quality and loyalty.
Similar to some of the research objectives of Bitner (1992) and Wakefield,
Blodgett (1996), the present study focused on the fixed elements in hotels including
the design and the ambient conditions. Bitner (1992) stated that ambient factors are
major components of servicescape and are important to understanding customers’
behaviour. Wakefield, Blodgett tested the model in three leisure service settings:
college football, minor league baseball and casinos and found that servicescape
significantly affects perceived quality of the leisure service setting. The results of the
present study are in agreement with the findings of Wakefield, Blodgett (1996) and
Bitner (1992).
5.3.2 Research Question Two
Research question two focused on examining the effect of intangible service
variables on OPSQ of intangible factors. In this research question the dependent
variable is OPSQ of intangible factors; the four independent variables are reliability,
responsiveness, assurance and empathy. The present study shows that these
independent variables have their effects on customers’ OPSQ of intangible factors.
Furthermore, the results of the regression analysis that the variables of empathy and
assurance have the strongest influence on customers’ OPSQ, followed by the factor
of reliability. On the other hand, the results show that responsiveness have no effect
on customers’ perception of the quality of tangibles.

106
With regard to the importance of service quality factors, studies such as Berry
and Parasuraman (1991), Parasuraman et al. (1988) and Rust and Oliver (1994)
conducted on service quality emphasized that the factor of reliability is the foremost
factor that customers consider in evaluating a company's quality of service among
the four service quality factors suggested by Parasuraman et al. (1988).
The findings of Parasuraman et al. (1988) indicated that reliability was the
highest rated dimension as viewed by customers in four industries (a bank, a credit
card company, a repair and maintenance company and long-distance telephone
company). However, in this present study, the variables of empathy and assurance
were the highest rate dimensions, whereas reliability and responsiveness were the
lowest rated dimensions. Therefore, this finding was inconsistent with the findings of
Parasuraman et al. (1988).
5.3.3 Research Question Three
Research question three focused on examining the effect of tangible and
intangible factors on customers’ loyalty. In this research question, the dependent
variable is customers’ loyalty; the seven independent variables are design,
equipment, ambient conditions, reliability, responsiveness, assurance and empathy.
The results of this research question revealed that the seven independent variables
have great effects on customers’ loyalty. The results also showed that the tangible
factors at hotels have no influence on customers’ loyalty.
The results of a regression analysis in the present study showed different
results in relation to the relative importance of the four variables of intangible factors

107
of service quality. That is, the results revealed that the factors of assurance, empathy
and reliability variables have great influence on customer loyalty. In this respect, it
seems necessary to critically consider those factors. In more detail, the factor of
tangibles indicates the physical evidence of the service, such as physical facilities,
appearance of personnel, other customers in the service facility and tools or
equipment utilized to provide the services (Parasuraman et al., 1985).
These results are similar to Zeithaml and Bitner (1996) and Boulding, Kalra,
Staelin and Zeithaml (1993). Zeithaml and Bitner (1996) found that overall
perception of service quality directly influence customers’ behavioural intentions,
including their tendency to say positive things, to recommend the company and to
remain loyal to the company. Similar to these findings, Boulding, Kalra, Staelin and
Zeithaml (1993) found that there is a connection between service quality and
repurchase intention and willingness to recommend the place to others.
As given in Skogland and Siguaw (2004), the present study adopted the seven
items on customers’ loyalty for obtaining respondents’ perceptions of their loyalty.
However, this present study did not confirm the findings of Skogland and Siguaw
(2004) which revealed that the main factors influencing customer loyalty were hotel
design and facilities. This is because this study showed that tangibles dimensions of
service quality were significant explanatory variables of customer loyalty.
This study did not strongly confirm Ganesh, Arnold and Reynolds's statement
(2000) that “people factor” (i.e., service quality), in terms of tangibility, reliability,
responsiveness, assurance and empathy may be the most significant in determining
108
overall contentment and repeated purchasing in service industries. This is because
the present study showed that only two dimensions of SERVQUAL (reliability and
empathy) were significant explanatory variables of customers’ loyalty. Furthermore,
the present study strongly confirmed King’s (1995) proposition that a hotel needs to
understand what customer's needs and desires and fulfil them (empathy) to help
increase customer loyalty and create repeat-patronage of customers. Similar to the
findings of the current study, King (1995) found that empathy and assurance were
significant explanatory variables of repeat-patronage dimension of customer loyalty.
Some of the findings of the current study confirmed Lau et al.’s (2005)
findings that empathy and assurance were highly significant predictors of customers’
loyalty. On the other hand, some other findings of the present study were in
agreement with the findings of Lau et al. (2005) which revealed that responsiveness
and reliability were not significant in contributing toward customers’ loyalty.
5.4 Practical Implications
There are some practical implications of this study. The present study shows
that the exterior design of a hotel including the decor and the furniture in the public
spaces and rooms have their effect on the customers’ perceptions of service quality
and loyalty. Moreover, the equipment found at hotels and the conditions of the rooms
and the public spaces in hotels influence customers’ evaluation of the service quality.
Therefore, the owners and managers of hotels should pay attention for this issue as it
may maintain loyal customers that will be a good source for the profitability of the
hotels.

109
This study emphasizes that the physical environment of hotels is one of the
best drives for customers’ selection and recommendations of hotels to their friends
and relatives. The study results showed that physical environment influences the
perceived service quality that relate to customer loyalty. This conclusion is in
agreement with the findings of other studies that emphasized the role the physical
environment does play in customers’ loyalty and satisfaction process (Bitner, 1992;
Lucas, 2003). Therefore, managers and owners of hotels should take into
consideration of such factors taking care of the cleanness of the furniture, rooms and
public places at hotels.
The current study showed that all intangible aspects of service quality are of
great importance for customers when evaluating the quality of service they receive at
hotels. Therefore, paying attention to (1) employees’ to provide prompt service, (2)
delivering he promised service, (3) employees’ ability to inspire trust and confidence
and (4) the personal attention given to customers can increase income of hotels and
can also create loyal customers.
The present study revealed that assurance and empathy dimensions of service
quality in hotel industry are significant explanatory variables of dimensions of
customers’ loyalty of hotel guests in Al-Ladhiqiyah measured by customer loyalty.
These dimensions should be major areas of focus for hotel managers to increase
customer loyalty in terms of repeat patronage.

110
5.5 Recommendations for Future Research
Studies on tourism and hospitality in Arab courtiers are still very few. For
future research in the field of tourism and hospitality in Arab countries, the present
study has some recommendations for future research. First, it is recommended that
future research can focus only on the physical environment of the hotels to
investigate its effect on the customers’ perceptions of service quality.
Second, the present study suggests that future research can combine both
qualitative and quantitative research for investigating the effects of tangible and
intangible factors on customers’ OPSQ and loyalty. This is because data in the
present study were collected through employing a questionnaire that was distributed
to 209 customers. Using a mixed research design is recommended because it can
help researcher to triangulate data sources and methods of data collection. In such
mixed research design, a researcher can interview customers to gain deep
information about their perceptions of service quality at hotel industry and more
reliable information on their suggestions for improving service quality.
Third, the researcher recommends that other studies can investigate other
tangible factors because this study focused only three tangible factors: design,
equipment and ambient conditions. Other factors that can include in future studies
can include layout accessibility, seating comfort and music perceptions, etc.
Fourth, studies on customers’ perceptions of tangible and intangible factors in
hotel industry and their effects on customers’ loyalty are also recommended in hotel
industry in Arab countries.

111
Fifth, future studies can be conducted across some cultures in order to
compare the differences of customers’ perceptions of service quality.
Sixth, future studies should focus on the relationship between customers’
loyalty and other factors that can cause customers to use services with a hotel, such
as the hotel's reputation, special services, promotion and location.
Finally, future studies can focus on conducting a replication study using a
larger sample size and encompassing different cities in Syria to strengthen
generalizability of findings about the relationships between service quality and
customer loyalty.
5.6 Chapter Summary
The current chapter discussed the conclusions of the present research that
focused on investigating the effects of tangible and intangible factors hotels at Al-
Ladhiqiyah on the customers’ OPSQ and customers’ loyalty. This study shows that
both tangible and intangible factors have their effects on customers’ OPSQ and
loyalty. However, this study shows that the tangible factors at hotels have a greater
effect on customers’ perceptions of service quality and loyalty.

112
REFERENCES
Abdullah, A., & Kassim, N. (2009). Measuring perceived service quality in Qatari
Islamic banks. Journal for International Business and Entrepreneurship
Development, 4(1), 90-106.
Al Sayyad, N. (Ed.). (2001). Consuming tradition, manufacturing heritage. London:
Routledge.
Al-Hamarneh, A. (2005). New tourism trends in the Arab world. Islamic Tourism,
16(March-April), 50-54.
Al-Hamarneh, A., & Steiner, C. (2004). Islamic tourism: rethinking the strategies of
tourism development in the Arab world after September 11, 2001.
Comparative Studies of South Asia, Africa and the Middle East, 24(1), 175-
186.
Almossawi, M. (2008). Analyzing service quality in the hospitality industry: the case
of Bahrain. Indian Journal of Economics and Business, 7(2), 215-234.
Al-Tamimi, H., & Al-Amiri, A. (2003). Analysing service quality in the UAE
Islamic banks. Journal of Financial Services Marketing, 8(2), 119-132.
Anderson, E. W., & Sullivan, M. W. (1990). The antecedents and consequences of
customer satisfaction for firms. Marketing Science, 12(2), 25-43.
Antoun, R., & Quataert, D. (1991). Syria: society, culture, and polity. New York:
State University of New York.
Atilgan, E., Akinci, S., & Aksoy, S. (2003). Mapping service quality in the tourism
industry. Managing Service Quality, 13(5), 412-422.
Atlastour (2008). Hotels in Syria, from http://www.atlastours.net/syria/hotels.html
Aziz, H. (1995). Understanding attacks on tourists in Egypt. Tourism Management,
16(2), 91-95.
Aziz, H. (2001). The Journey: an overview of tourism and travel in the Arab/Islamic
context. In D. Harrison (Ed.), Tourism and the less developed countries:
issues and case studies (pp. 151-160). Wallingford: CABI Publishing.
Backman, S., & Veldkamp, C. (1995). Examination of the relationship between
service quality and user loyalty. Journal of Park and Recreation
Administration, 13(2), 29-41.
Backman, S. J., & Crompton, J. L. (1991). The usefulness of selected variables for
predicting activity loyalty. Leisure Sciences, 13(3), 205-220.

113
Baker, D., & Fesenmaier, D. (1997). Effects of service climate on managers' and
employees' rating of visitors' service quality expectations. Journal of Travel
Research, 36(1), 15-22.
Baker, J., Levy, M., & Grewal, D. (1992). An experimental approach to making
retail store environmental decisions. Journal of Retailing, 68(4), 445-460.
Baker, J., Parasuraman, A., Grewal, D., & Voss, G. (2002). The influence of multiple
store environment cues on perceived merchandise value and patronage
intentions. Journal of Marketing, 66(2), 120-141.
Baker, T., & Collier, D. A. (2005). The economic payout model for service
guarantees. Decision Sciences, 36(2), 197-220.
Barsky, J., & Nash, L. (2003). Evoking emotion: affective keys to hotel loyalty.
Cornell Hotel and Restaurant Administration Quarterly, 43(1), 39-46.
Bateson, J. (1985). Perceived control and the service encounters In J. A. Czepiel, M.
R. Solomon & C. F. Surprenant (Eds.), The service encounter (pp. 123-132).
Lexington, MA: Lexington Books.
Beattie, A., & Pepper, T. (2001). The rough guide to Syria. London: Rough Guides
Limited.
Belsley, D. A. (1984). Demeaning conditioning diagnostics through centering. The
American Statistician, 38(2), 73-82.
Berry, L., & Parasuraman, A. (1991). Marketing services: competing through
quality. New York: Free Press.
Bianchi, R. (2006). Tourism and the globalization of fear: analyzing the politics of
risk and (in) security in global travel. Tourism and Hospitality Research,
7(1), 64-74.
Bitner, M. J. (1992). Servicescapes: the impact of physical surroundings on
customers and employees. Journal of Marketing, 56(2), 57-71.
Bitner, M. J., Booms, B. H., & Mohr, L. A. (1994). Critical service encounter: the
employee's viewpoint. Journal of Marketing, 58(4), 95-106.
Bitner, M. J., & Hubbert, A. R. (1994). Encounter satisfaction versus overall
satisfaction versus quality. In R. T. Rust & R. L. Oliver (Eds.), Service
quality: new directions in theory and practice. (pp. 72-94). London: Sage.
Blanke, J., & Mia, I. (2005). Assessing travel & tourism competitiveness in the Arab
world. World Economic Forum Geneva.
Bolton, R. N., & Drew, J. H. (1991). A multistage model of customers’ assessments
of service quality and value. Journal of Consumer Research, 17(4), 375-387.

114
Boulding, W. A., Kalra, R. S., & Zeithaml, V. A. (1993). A dynamic process model
of service quality: from expectations to behavioral intentions. Journal of
Marketing Research, 30(1), 7-27.
Bowen, J. T., & Chen, S. L. (2001). The relationship between customer loyalty and
customer satisfaction. International Journal of Contemporary Hospital
Management, 13(4/5), 213-217.
Bowen, J. T., & Shoemaker, S. (1998). Loyalty: a strategic commitment. Cornell
Hotel and Restaurant Administration Quarterly, 39(1), 12-25.
Burns, R. B., & Burns, R. A. (2008). Business research methods and statistics using
SPSS: Sage Publications Ltd.
Callan, R. J., & Bowman, L. (2000). Selecting a hotel and determining salient quality
attributes: a preliminary study of mature British travellers. The International
Journal of Tourism Research, 2(2), 97-118.
Chaker, M. N., & Jabnoun, N. (2010). Barriers to service quality in Islamic banks in
Qatar. International Journal of Commerce and Management, 20(4), 296-307.
Chand, M. (2002). Travel agency management: an introductory text. New Delhi:
Anmol Publications PVT.
Chase, R. B. (1988). The service factory. Academy of management executive, 2(3),
191-196.
Choi, T., & Chu, R. (2000). Levels of satisfaction among Asian and Western
travellers. The International Journal of Quality & Reliability Management,
17(2), 116-131.
Churchill, G. A., & Brown, T. J. (2004). Basic marketing research (5th ed.). USA:
South-Western.
Clark, K., & Fujimoto, M. (1991). Product development performance: strategy,
organization and management in the world auto industries. Cambridge, MA:
Harvard University Press.
Clow, K. E., Kurtz D, L., Ozment, J., & Ong, B. S. (1997). The antecedents of
customer expectations of services: an empirical study across four industries.
The Journal of Services Marketing, 11(4), 230-248.
Cook, R. D., & Weisberg, S. (1982). Criticism and influence analysis in regression.
Sociological Methodology, 13, 313-361.
Cooper, D. R., & Schindler, P. S. (2006). Business research methods (9th ed.). New
York: McGraw-Hill.
Cronin, J. J., & Taylor, S. A. (1992). Measuring service quality: a re-examination
and extension. Journal of Marketing, 56(3), 55-68.

115
Cunningham, L. F., Young, C. E., & Lee, M. (2004). Perceptions of airline service
quality: pre and post 9/11. Public Works Management Policy, 10(16), 3-23.
Cunningham, R. (1956). Brand loyalty- what, where how much? Harvard Business
Review, 34(1), 116-128.
Czepiel, J. A., & Gilmore, R. (1987). Exploring the concept of loyalty in services. In
J. A. Czepiel, C. A. Congram & J. Shanahan (Eds.), The service challenge:
integrating for competitive advantage (pp. 91-94). Chicago: American
Marketing Association.
Daher, R. (Ed.). (2007). Tourism in the Middle East: continuity, change, and
transformation. Bristol Channel View Publications.
Darke, D. (2010). Syria. Guilford, USA: Globle Prequot Press.
Day, G. S. (1969). A two-dimensional concept of brand loyalty. Journal of
Advertising Research, 9(3), 29-35.
Dick, A. S., & Basu, K. (1994). Customer loyalty: toward an integrated conceptual
framework. Academy of Marketing Science, 22(2), 99-113.
Dube, L., & Renaghan, L. (2000). Creating visible customer value: how customers
view best-practice champions. Cornell Hotel and Restaurant Administration
Quarterly, 41(1), 62-72.
Dube, L., & Renaghan, L. M. (1999). Building customer loyalty. Cornell Hotel and
Restaurant Administration Quarterly, 40(5), 78-88.
Englar, M. (2006). Syria: a question and answer book. Minnesota: Fact Finders.
Fay, C. J. (1994). Royalties from loyalties. Journal of Business Strategy, 15(2), 47-
51.
Fornell, C. (1992). A national customer satisfaction barometer: the Swedish
experience. Journal of Marketing, 56(1), 6-21.
Frangialli, F. (2004). International tourism: the great turning point: texts and
documents 2001-2003 (Vol. 3). Madrid: World Tourism Organization
Publications.
Frank, R. E. (1962). Brand choice as a probability process. The Journal of Business,
35(1), 43-56.
Fredericks, J. O., & Salter, J. M. (1995). Beyond customer satisfaction. Management
Review, 84(5), 29-32.
Freedman, D. A. (2005). Statistical models: theory and practice. Cambridge:
Cambridge University Press.

116
Fu, Y., & Parks, S. C. (2001). The relationship between restaurant service quality
and consumer loyalty among the elderly. Journal of Hospitality & Tourism
Research, 25(3), 320-326.
Gahwiler, P., & Havitz, M. (1995). Toward a relational understanding of leisure
social worlds. involvement. psychological commitment. and behavioral
loyalty. Journal of Park and Recreation Administration, 13(2), 1-23.
Ganesh, J., Arnold, M., & Reynolds, K. (2000). Understanding the customer base of
service providers: an examination of the difference between switchers and
stayers. Journal of Marketing, 64(3), 65-83.
Garvin, D. A. (1983). Quality on the line. Harvard Business Review, 61(5), 65-79.
Garvin, D. A. (1988). Managing quality: the strategic and competitive edge. New
York: The Free Press.
Ghobadian, A., Speller, S., & Jones, M. (1994). Service quality: concepts and
models. International Journal of Quality & Reliability Management, 11(9),
43-66.
Griffin, J. (2002). Customer loyalty: how to earn it, how to keep it. San Francisco:
Jossey-Bass.
Gronroos, C. (1984). A service quality model and its marketing implications.
European Journal of Marketing, 18(4), 36-44.
Gronroos, C. (1990). Service management and marketing: managing the moment of
truth in service competition. Lexington: Lexington Books.
Gronroos, C. (1994). From marketing mix to relationship marketing: towards a
paradigm shift in marketing. Asia-Australia Marketing Journal, 2(1), 9-29.
Gronroos, C. (2000). Service management and marketing: a customer relationship
management approach (2nd ed.). New York: John Wiley & Sons.
Gupta, A., & Chen, I. (1995). Service quality: implications for management
development. International Journal of Quality and Reliability Management,
12(7), 28-35.
Hair, J. F., Anderson, R. E., Tatham, R. L., & Black, W. C. (1998). Multivariate data
analysis (5th ed.). UK: Prentice Hall International.
Haksever, C., Render, B., Russell, R., & Murdick, R. (2000). Service management
operations (2nd ed.). Prentice-Hall: New Jersey.
Hall, C. M., & Boyd, S. (Eds.). (2005). Nature-based tourism in peripheral areas.
Clevedon: Channel View Publications.
Hallowell, R. (1996). The relationship of customer satisfaction, customer loyalty and
profitability: an empirical study. International Journal of Service Industries,
Management, 7(4), 27-42.

117
Harrell, G. D., Hutt, M. D., & Anderson, J. C. (1980). Path analysis of buyer
behaviour under conditions of crowding. Journal of Marketing Research,
17(1), 45-61.
Hayes, B. E. (2008). Measuring customer satisfaction and loyalty: survey design,
use, and statistical analysis methods (3rd ed.). Milwaukee, WI: ASQ Quality
Press Publications.
Hazbun, W. (2004). Globalisation, reterritorialisation and the political economy of
tourism development in the Middle East. Geopolitics, 9(2), 310-341.
Hazbun, W. (2008). Beaches, ruins, resorts: the politics of tourism in the Arab
World. Minneapolis: University of Minnesota Press.
Hazbun, W. (November 1, 1997). The development of tourism industries in the Arab
world: trapped between the forces of economic globalization and cultural
Commodification. Paper presented at the Washington, DC. from
http://hazbun.mwoodward.com/Globalization.html#_ftn1.
Hepworth, M., & Mateus, P. (1994). Connecting customer loyalty to the bottom line.
Canadian Business Review, 21(4), 40-43.
Heskett, J. L. (1987). Lessons in the service sector. Harvard Business Review, 65(2),
118-129.
Hinkin, T. R., & Tracey, J. B. (2003). The service imperative: factors driving
meeting effectiveness. Cornell Hotel and Restaurant Administration
Quarterly, 44(5/6), 17-26.
Holden, A. (2000). Environment and tourism (1st ed.). London: Routledge.
Hossain, M., & Leo, S. (2009). Customer perception on service quality in retail
banking in Middle East: the case of Qatar. International Journal of Islamic
and Middle Eastern Finance and Management, 2(4), 338-350.
Howard, D. R., Edginton, C. R., & Selin, S. W. (1988). Determinants of program
loyalty. Journal of Park and Recreation Administration, 6(4), 41-51.
Hudman, L., & Jackson, R. (2003). Geography of travel and tourism: Cengage
Learning.
Iwasaki, Y., & Havitz, M. E. (1998). A path analytic model of the relationship
between involvement, psychological commitment, and loyalty. Journal of
Leisure Research, 30(2), 256-280.
Jabnoun, N., & Al-Tamimi, H. (2003). Measuring perceived service quality at UAE
commercial banks. International Journal of Quality & Reliability
Management, 20(4), 458-472.
Johns, N. (1999). What is this thing called service? European Journal of Marketing,
33(9/10), 958-973.

118
Jones, T., & Sasser, E. (1993). Why satisfied customers defect. Harvard Business
Review, 73(6), 88-99.
Juwaheer, T. D., & Ross, D. L. (2003). A study of hotel guest perceptions in
Mauritius. International Journal of Contemporary Hospitality Management,
15(2), 105-115.
Kandampully, J. (1998). Service quality to service loyalty: a relationship which goes
beyond customer service. Total Quality Management, 9(6), 431-443.
Kandampully, J., Mok, C., & Sparks, B. (2001). Service quality management in
hospitality, tourism, and leisure. London: Routledge.
Kandampully, J., & Suhartanto, D. (2000). Customer loyalty in the hotel industry:
the role of customer satisfaction and image. International Journal of
Contemporary Hospitality Management, 12(6), 346 - 351.
Kassim, N., & Abdullah, N. A. (2010). The effect of perceived service quality
dimensions on customer satisfaction, trust, and loyalty in e-commerce
settings: a cross cultural analysis. Asia Pacific Journal of Marketing and
Logistics, 22(3), 351-371.
Kassim, N., & Ismail, S. (2009). Investigating the complex drivers of loyalty in e-
commerce settings. Measuring Business Excellence, 13(1), 56-71.
Kim, J., Jin, B., & Swinney, J. (2009). The role of retail quality, e-satisfaction and e-
trust in online loyalty development process. Journal of Retailing and
Consumer Services, 16(4), 239-247.
King, C. A. (1995). Viewpoint: what is hospitality? International Journal of
Hospitality Management, 14(3/4), 219-234.
Kostecki, M. M. (1994). Marketing strategies for services; globalization, client
orientation, deregulation. Oxford: Pergamon Press.
Kotler, P. (1996). Marketing management: analysis, planning, implementation and
control. Englewood Cliffs New Jersey: Prentice-Hall Inc.
Kotler, P., & Bloom, P. (1984). Marketing professional services. . Englewood Cliffs,
NJ: Prentice Hall.
Kotler, P., Bowen, J., & Makens, J. (1996). Marketing for hospitality and tourism.
Englewood Cliffs, NJ: Prentice Hall.
Krishnaswamy, K. N., Sivakumar, A. I., & Mathirajan, M. (2009). Management
research methodology: integration of methods and techniques. London:
Prentice Hall.
Kroenert, B., Spalding, L., Cooper, B., & Lee, L. (2005). Making the link. Marketing
Research, 17(1), 21-25.

119
Lam, S. Y., Shanker, V., Erramilli, M., & Murthy, B. (2004). Customer value,
satisfaction, loyalty, and switching costs: an illustration from a business-to
business service context. Journal of the Academy of Marketing Science,
32(3), 293-311.
Laroche, M., Yang, Z., McDougall, G., & Bergeron, J. (2005). Internet versus bricks-
and-mortar retailers: An investigation into intangibility and its consequences.
Journal of Retailing, 81(4), 251-267.
Latham, G. P., & Locke, E. A. (1979). Goal setting: a motivational technique that
works. Organizational Dynamics, 8(2), 68-80.
Lau, P. M., Akbar, A. K., & Fie, D. Y. (2005). Service quality: a study of the luxury
hotels in Malaysia. Journal of American Academy of Business, 7(2), 46-56.
Locke, E. (2001). Motivation by goal setting. In R. T. Golembiewski (Ed.),
Handbook of organizational behaviour (2nd ed., pp. 43-56). New York:
Marcel Dekker, Inc.
Locke, E., & Sirota, D. (1976). An experimental case study of the successes and
failures of job enrichment in a government agency. Journal of Applied
Psychology, 61(6), 701-711.
Lovelock, C. H., & Wright, L. (1999). Principles of service management and
marketing. Englewood Cliffs, NJ: Prentice-Hall.
Lucas, A. F. (2003). The determinants and effects of slot servicescape satisfaction in
a Las Vegas hotel casino. UNLV Gaming Research & Review Journal, 7(1),
1-17.
Mahony, D. F., Madrigal, R., & Howard, D. (2000). Use the psychological
commitment to team (PCT) scale to segment sport consumers based on
loyalty. Sport Marketing Quarterly, 9(1), 15-25.
Mannheim, I. (2001). Syria & Lebanon handbook: the travel guide. Bristol: Footprint
Handbooks.
Master, H., & Prideaux, B. (2000). Culture and vacation satisfaction: a study of
Taiwanese tourists in South East Queensland. Tourism Management, 21(5),
445-449.
McCarville, R. (2000). Satisfaction-the basis of client loyalty. Parks and Recreation,
35(11), 24-33.
McDougall, G. H., & Levesque, T. I. (1994). A revised view of service quality
dimensions: an empirical investigation. Journal of Professional Service
Marketing, 11(1), 189-209.
Miller, L. E. (2004). Research Methods. Ohio: The Ohio State University.
Ministry of Tourism (2009). Syria, from http://www.syriatourism.org/

120
Ministry of Tourism (2010a). Suweda, from
http://www.syriatourism.org/index.php?module=subjects&func=viewpage&p
ageid=1808
Ministry of Tourism (2010b). Syria Today, from
http://www.syriatourism.org/index.php?module=subjects&func=viewpage&p
ageid=2420
Mittal, B., & Baker, J. (1998). The services marketing system and customer
psychology. Psychology and Marketing, 15(8), 727-733.
Morgan, R. M., & Hunt, S. D. (1994). The commitment-trust theory of relationship
marketing. Journal of Marketing, 58(3), 20-38.
Mustafa, M. H. (2010). Tourism and globalization in the Arab World. International
Journal of Business and Social Science, 1(1), 37-48.
Nadiri, H., & Hussain, K. (2005). Perceptions of service quality in North Cyprus
hotels. International Journal of Contemporary Hospitality Management,
17(6), 469-480.
Namasivayam, K. (2004). The impact of intangibles on consumers' quality ratings
using the star/diamond terminology. Foodservice Research International,
15(1), 34-40.
Neal, W. D. (1999). Satisfaction is nice, but value drives loyalty. Journal of
Marketing Research, 11(1), 85-93.
Nicholls, J. A., Gilbert, G. R., & Roslow, S. (1998). Parsimonious measurement of
customer satisfaction with personal service and the service setting. The
Journal of Consumer Marketing, 15(3), 239-246.
Nunnally, J. C. (1978). Psychometric theory (2nd ed.). New York: McGraw Hill
Book Company.
Oliver, R., Rust, R., & Varki, S. (1997). Customer delight: foundations, findings, and
managerial insight. Journal of Retailing, 73(3), 331-336.
Oliver, R. L. (1981). Measurement and evaluation of satisfaction process in retail
settings. Journal of Retailing, 57(3), 25-46.
Oliver, R. L. (1993). A conceptual model of service quality and service satisfaction:
compatible goals, different concepts. In T. A. Swartz & S. W. Brown (Eds.),
Advances in services marketing and management (2nd ed., pp. 65-85).
Greenwich, CT: JAI Press.
Oliver, R. L. (1999). Whence consumer loyalty? Journal of Marketing, 63(4), 33-44.
Olson, J. C., & Jacoby, J. (1971). A construct validation study of brand loyalty. Paper
presented at the Proceedings of the American Psychological Association.

121
Oxford, B. G. (2009). The report: Syria 2009. Oxford: Oxford Business Group
Page, S., & Ateljevic, J. (2009). Tourism and entrepreneurship: international
perspectives. Oxford: Butterworth-Heinemann.
Pallant, J. (2007). SPSS survival manual: a step by step guide to data analysis using
SPSS version 15 (3rd ed.). Maidenhead: Open University Press.
Parasuraman, A., Berry, L. L., & Zeithamal, V. A. (1988). SERVQUAL: a multi-
item scale for measuring consumer perceptions of service quality. Journal of
Retailing, 64(1), 12-40.
Parasuraman, A., Berry, L. L., & Zeithaml, V. A. (1991a). Perceived service quality
as a customer-based performance measure: An empirical examination of
organizational barriers using an extended service quality model. Human
Resource Management, 30(3), 335-343.
Parasuraman, A., Berry, L. L., & Zeithaml, V. A. (1991b). Refinement and
reassessment of the SERVQUAL scale. Journal of Retailing, 67(4), 420-450.
Parasuraman, A., Berry, L. L., & Zeithaml, V. A. (1991c). Understanding customer
expectations of service. Sloan Management Review, 32(3), 39-49.
Parasuraman, A., Zeithaml, V. A., & Berry, L. L. (1985). A Conceptual model of
service quality and its implication for future research. Journal of Marketing,
49(4), 41-50.
Parasuraman, A., Zeithaml, V. A., & Berry, L. L. (1994). Alternative scales for
measuring service quality: a comparative assessment based on psychometric
and diagnostic criteria. Journal of Retailing, 70(3), 193-194.
Park, S. H. (1996). Relationships between involvement and attitudinal loyalty
constructs in adult fitness programs. Journal of Leisure Research, 28(4), 233-
250.
Park, S. H., & Kim, Y. M. (2000). Conceptualizing and measuring the attitudinal
loyalty construct in recreational sport contexts. Journal of Sport
Management, 14(3), 197-207.
Pawitra, T. A., & Tan, K. C. (2003). Tourist satisfaction in Singapore: a perspective
from Indonesian tourists. Managing Service Quality, 13(5), 399-411.
Pedhazur, E. J., & Schmelkin, L. P. (1991). Measurement, design, and analysis: an
integrated approach. Hillsdale, New Jersey: Lawrence Erlbaum Associates.
Pfeffer, J. (1981). Power in organizations. Marshfield, Mass: Pitman Publications.
Phillips, D. A. (2010). Syria. Philadelphia, PA: Chelsea House Pub.
Pricharad, M. P., & Howard, D. R. (1997). The loyal traveller: examining a typology
of service patronage. Journal of Travel Research 35(4), 2-10.

122
Prichard, M. P., Howard, D. R., & Havitz, M. E. (1992). Loyalty measurement: a
critical examination and theoretical extension. Leisure Sciences, 14(2), 155-
164.
Prus, A., & Brandt, D. (1995). Understanding your customers. Marketing Tools, 2(5),
10-14.
Pullman, M. E., & Gross, M. A. (2004). Ability of experience design elements to
elicit emotions and loyalty behaviours. Decision Sciences, 35(3), 551-578.
Ramaswamy, R. (1996). Design and management of service processes: keeping
customers for life. Readin & MA: Addison-Wesley Publishing Co.
Ransley, J., & Ingram, H. (2001). What is "good" hotel design? Facilities, 19 (1/2),
79-86.
Reichheld, F. F. (1996). The loyalty effect: the hidden force behind growth, profits
and lasting value. Boston: Harvard Business School Press
Reichheld, F. F., Markey, R. G., & Hopton, C. (2000). E-customer loyalty: applying
the traditional rules of business for online success. European Journal
Business, 12(4), 173-179.
Reichheld, F. F., & Sasser, E. W. (1990). Zero defections: quality comes to services.
Harvard Business Review, 68(5), 105-116.
Reisinger, Y. (2001). Concept of tourism, hospitality, and leisure services. In J.
Kandampully, C. Mok & B. Sparks (Eds.), Service quality management in
hospitality, tourism, and leisure (pp. 1-21). Binghamton, NY: The Haworth
Press, Inc.
Rowley, J. (2006). Information marketing. Burlington, USA: Ashgate Pub Co.
Russell, J., & Ward, L. (1982). Environmental psychology. Annual Review of
Psychology, 33(1), 651-688.
Rust, R. T., & Oliver, R. W. (1994). Video dial tone. The Journal of Services
Marketing, 8(3), 5-16.
Rust, R. T., & Zahorik, A. J. (1993). Customer satisfaction, customer retention, and
market share. Journal of Retailing, 69(2), 193-208.
Saleh, F., & Ryan, C. (1991). Analyzing service quality in the hospitality industry
using the SERVQUAL model. The Service Industries Journal, 11(3), 324-
343.
Saudi, G. S. (2009, July 22). Tourism in Arab countries steady. Saudi Gazette, from
http://www.saudigazette.com.sa/index.cfm?method=home.con&contentid=20
09072244353
Schall, M. (2003). Best practices in the assessment of hotel-guest attitudes. Cornell
Hotel and Restaurant Administration Quarterly, 44(2), 51-65.

123
Schneider, B., & White, S. (2004). Service quality: research perspective. Thousand
Oaks, California: Sage Publications.
Selnes, F. (1993). An examination of the effect of product performance on brand
reputation, satisfaction and loyalty. European Journal of Marketing, 27(9),
19-35.
Sekaran, U. (2009). Research methods for business: a skill building approach:
Wiley-India.
Shahin, A., & Dabestani, R. (2010). Correlation analysis of service quality gaps in a
four-star hotel in Iran. International Business Research, 3(3), 40-46.
Shoemaker, S., & Lewis, R. (1999). Customer loyalty: the future of hospitality
marketing. Hospitality Management, 18(4), 345-370.
Skogland, I., & Siguaw, J. (2004). Are your satisfied customers loyal? Cornell Hotel
and Restaurant Administration Quarterly, 45(3), 221-234.
Soderlund, M. (2006). Measuring customer loyalty with multi-item scales: a case for
caution. International Journal of Services Industry management, 17(1), 76-
98.
Spangenberg, E. R., Crowley, A. E., & Henderson, P. W. (1996). Improving the store
environment: do olfactory cues affect evaluations and behaviours? Journal of
Marketing, 60(2), 67-80.
Stum, D., & Thiry, A. (1991). Building customer loyalty. Training Development
Journal, 45(4), 34-36.
Szmigin, I. (1993). Managing quality in business-to-business services. European
Journal of Marketing, 27(1), 5-21.
Telfer, D. J., & Sharpley, R. (2008). Tourism and development in the developing
world. London: Routeledge.
Tenner, A. R., & Detoro, J. (1992). Total Quality management: three steps to
continuous improvement. Reading, MA: Addison-Wesley.
Tsang, N., & Qu, H. (2000). Service quality in China’s hotel industry: a perspective
from tourists and hotel managers. International Journal of Contemporary
Hospitality Management, 12(5), 316-326.
Tucker, W. T. (1964). The development of brand loyalty. Journal of Marketing
Research, 1(3), 32-35.
Turley, L. W., & Bolton, D. L. (1999). Measuring the affective evaluations of retail
service environments. Journal of Professional Services Marketing, 19(1), 31-
44.
United Nations World Tourism Organization (UNWTO) (2001). Tourism 2020
Vision. Global Forecasts and Profiles of Market Segments, v.

124
United Nations World Tourism Organization (2008a). Developing countries lead
dynamic world tourism growth, from
http://www.unwto.org/media/news/en/press_det.php?id=1801&idioma=E.
United Nations World Tourism Organization (2008b). Tourism: an economic and
social phenomenon, from
http://www.unwto.org/aboutwto/why/en/why.php?op=1.
Wakefield, K. L., & Barnes, J. H. (1996). Retailing hedonic consumption: a model of
sales promotion of a leisure service. Journal of Retailing, 77(4), 409-427.
Wakefield, K. L., & Blodgett, J. G. (1994). The importance of servicescapes in
leisure service settings. Journal of Services Marketing, 8(3), 66-76.
Wakefield, K. L., & Blodgett, J. G. (1996). The effects of the servicescape on
customers' behavioral intentions in leisure service settings. Journal of
Services Marketing, 10(6), 45-61.
Wakefield, K. L., & Blodgett, J. G. (1999). Customer response to intangible and
tangible service factors. Psychology & Marketing, 16(1), 51-65.
Walker, J. R. (2003). Introduction to hospitality management. (1st ed.). New York,
NY: Prentice Hall.
Wener, R. E. (Ed.). (1985). The environmental psychology of serve encounters.
Lexington MA.
Worcester, B. A. (2000). Illusions of grandeur. Hotel & Motel Management, 215(18),
54-55.
World, T. O. (2010). International tourism: recovery confirmed, but growth remains
uneven. Barometer, 8(2). Retrieved from http://www.unwto.org.
Zeithaml, V. A. (1988). Consumer perceptions of price, quality and value: a means-
end model and synthesis of evidence. Journal of Marketing, 52(3), 2-22.
Zeithaml, V. A. (2000). Service quality, profitability, and the economic worth of
customers: what we know and what we need to learn? Academy of Marketing
Science Journal, 28(1), 67-85.
Zeithaml, V. A., & Binter, M. J. (1996). Service marketing. New York: The
McGraw-HilI Companies, Inc.
Zeithaml, V. A., & Bitner, M. J. (2003). Service marketing integrating customer
focus across the firm (3 ed.). New York: McGraw-Hill.
Zeithaml, V. A., Parasuraman, A., & Berry, L. L. (1985). Problems and strategies in
services marketing. Journal of Marketing, 49 (2), 33-47.

125
Appendices

126
APPENDIX A
Questionnaire (English Version)
Tourism in Syria: Investigating the Effects of Tangible and Intangible Factors
on Customers’ Perceived Service Quality and Loyalty in Hotel Industry in
Al-Ladhiqiyah
Introduction:
This survey is about your perceptions of tangible and intangible factors in the hotel
you are currently staying in. This questionnaire consists of four sections. Please
answer them all.
Section 1: Demographic Data
The following questions are related to demographic information. For each question,
please choose one answer that is the most appropriate for you. 1. What is your gender? Male Female
2. What is your age?
18 – 27 28 – 37 38 – 47 48 – 57 Over 57
3. What is your annual income in US Dollars?
Less than $20000 Between $20000 – $35000
Between $35001 - $50000 Between $50001- 75000
More than $75001
4. How many times per year do you visit this hotel?
1– 2 3 – 4 5 – 6 7 – 8 Over 8
5. What is your purpose of this travel?
For business For leisure For leisure and business
To join a convention Visit relatives
Section 2: Tangible Factors of Service Quality
Tangible factors are factors that can be seen and touched. These factors are related to
the design of the hotel, the equipment in the hotel and the surrounding conditions.
Please indicate how you strongly agree or disagree to each statement given below by
circling the most appropriate option to you. The options are as follows:
1 Strongly disagree 2 Disagree 3 Moderately disagree 4
Neutral
5 Moderately agree 6 Agree 7 Strongly agree
1. The overall outside appearance of the hotel is
attractive.
1 2 3 4 5 6 7
2. The interior design of the hotel is attractive. 1 2 3 4 5 6 7 3. Layout of the hotel makes it easy to get around. 1 2 3 4 5 6 7 4. Seats in the hotel are comfortable. 1 2 3 4 5 6 7 5. Lights in the environment of the hotel are
appropriate.
1 2 3 4 5 6 7
6. The furniture in the hotel is comfortable. 1 2 3 4 5 6 7 7. The decoration in the hotel is attractive. 1 2 3 4 5 6 7

127
8. The signs in the hotel provide adequate direction. 1 2 3 4 5 6 7
9. The electronic equipment in the hotel is of high
quality.
1 2 3 4 5 6 7
10. Equipment in the hotel is modern-looking. 1 2 3 4 5 6 7 11. The audio/video machines in the hotel are
interesting.
1 2 3 4 5 6 7
12. The hotel is kept clean all time. 1 2 3 4 5 6 7 13. The temperature in the hotel is comfortable 1 2 3 4 5 6 7 14. The appearance of the employees in the hotel is
neat.
1 2 3 4 5 6 7
15. Walkways and exits in the hotel are kept clean. 1 2 3 4 5 6 7 16. My overall perception of tangible factors in this
hotel is great.
1 2 4 5 6 6 7
Section 3: Intangible Factors of Service Quality
Intangible factors of service quality are factors that cannot be seen but can be
comprehended. These factors include the customer’s dependence on hotel’s service,
hotels’ employees’ quick response to their customers’ requests, employees’
understanding of customers’ feelings and customers’ confidence in employees’
abilities. Please indicate how you strongly agree or disagree to each statement given
below by circling the most appropriate option to you. The options are as follows:
1 Strongly disagree 2 Disagree 3 Moderately disagree 4 Neutral
5 Moderately agree 6 Agree 7 Strongly agree
1. The hotel keeps its promise of doing things on
time.
1 2 3 4 5 6 7
2. If I have a problem, the hotel enthusiastically
shows the willingness to solve it right away.
1 2 3 4 5 6 7
3. The hotel service is dependable. 1 2 3 4 5 6 7 4. The hotel provides services as promised. 1 2 3 4 5 6 7 5. The hotel maintains accurate records. 1 2 3 4 5 6 7 6. Hotel employees are able to tell me exactly when
services will be provided.
1 2 3 4 5 6 7
7. Guests in the hotel are able to expect prompt
services.
1 2 3 4 5 6 7
8. Hotel employees are willing to help guests. 1 2 3 4 5 6 7 9. Even if busy, hotel employees are available to
meet my needs.
1 2 3 4 5 6 7
10. Guests are able to trust employees in the hotel. 1 2 3 4 5 6 7 11. I feel safe in my dealing with hotel employees. 1 2 3 4 5 6 7 12. Hotel employees are polite at all times. 1 2 3 4 5 6 7 13. Hotel employees have sufficient support from the
hotel to do jobs well.
1 2 3 4 5 6 7
14. The hotel provides me with individual attention. 1 2 3 4 5 6 7 15. Hotel employees provide me with individual
attention.
1 2 3 4 5 6 7
16. Hotel employees understand my specific needs. 1 2 3 4 5 6 7 17. The hotel has my best interest at heart. 1 2 3 4 5 6 7

128
18. My overall perception of Intangible factors in this
hotel is great.
1 2 3 4 5 6 7
Section 4: Customer’s Loyalty
Customer’s loyalty is a concept that is used to refer to the customers’ repeat of
purchase and his/her recommendation of the hotel he visited to friends and others.
Please indicate how you strongly agree or disagree to the statement given by circling
the most appropriate options to you. The options are as follows:
1 Strongly disagree 2 Disagree 3 Moderately disagree 4 Neutral
5 Moderately agree 6 Agree 7 Strongly agree
1. I consider myself to be a loyal guest of the hotel. 1 2 3 4 5 6 7
2. In the near future, I intend to use the hotel more
often.
1 2 3 4 5 6 7
3. As long as I travel to this area, I do not foresee
myself switching to a different hotel.
1 2 3 4 5 6 7
4. If the hotel were to raise the price of my stay, I
would still continue to be a guest of the hotel.
1 2 3 4 5 6 7
5. If a competing hotel were to offer a better rate or
discount on their services, I would switch.
1 2 3 4 5 6 7
6. I would highly recommend the hotel to my friends
and family.
1 2 3 4 5 6 7
7. I am likely to make negative comments about the
hotel to my friends and family.
1 2 3 4 5 6 7
Thanking You
The Researcher
Omar Z. Enizan Alsaqre

129
APPENDIX B
Questionnaire (Arabic Version)
م لجودة الخدمة وعلى الوالء لدى لمادية وغير المادية على االدراك العاالسياحة في سوريا: بحث اثر العوامل ا
الزبائن في بعض فنادق الالذقية
المقدمة:
الغرض من هذا االستبيان هو معرفة تقيمك للعوامل المادية والغيرمادية في الفندق الذي انت نزيل به األن. هذا
االستبيان يتكون من اربعة اقسام. ارجو منك مشكورا األجابة على جميع األسئلة.
ألول: معلومات شخصيةالقسم ا
.األسئلة التالية تتعلق بمعلومات شخصية عنك. لكل سؤال اختر اإلجابة المناسبة لك
ماهو جنسك؟ .1 ذكر
انثى
. كم عمرك؟2
11-22
. كم دخلك السنوي 3
)بالدوالر(؟
22222اقل من
30222 - 22222بين 21-32
02222 - 30221بين 31-72
20222 - 02221يبن 71-02
20222اكثر من 02اكبر من
. كم مرة تزور هذا الفندق 4
في العام؟
1-2
. ماهو سبب الزيارة؟5
العمال تجارية
للراحة 3-7
للراحة واألعمال التجارية 0-6
لاللتحاق باجتماع 2-1
لزيارة األقارب 1اكثر من
لعوامل المادية لجودة الخدمةالقسم الثاني: ا
العوامل المادية لجودة الخدمة هي العوامل الملموسة وتشمل تصميم الفندق، واالجهزة الموجودة في الفندق
وظروف بيئة الفندق. من فضلك اخبرنا عن درجة موافقتك على الجمل االتية عن طريق وضع دائرة على
افضل اختيار لك. درجات اإلختيار هي
. محايد7. ال اوافق باعتدال 3. ال اوافق 2افق بشدة . الاو1
. اوافق بشدة2. اوافق 6. اوافق باعتدال 0
2 6 0 7 3 2 1 المظهر الخارجي الشامل للفندق جذاب. .1
2 6 0 7 3 2 1 التصميم الداخلي للفندق جذاب. .2
2 6 0 7 3 2 1 التنسيق داخل الفندق يجعل التمشي فيه سهال. .3
2 6 0 7 3 2 1 كراسي الجلوس في هذا الفندق مريحة. .7
2 6 0 7 3 2 1 مستوى األضاءة في بيئة الفندق مناسب. .0
2 6 0 7 3 2 1 االثاث في هذا الفندق مريح. .6
2 6 0 7 3 2 1 الديكورات في هذا الفندق جذابة. .2
2 6 0 7 3 2 1 الالفتات داخل الفندق تعطي ارشادات كافية. .1
2 6 0 7 3 2 1 األجهزة في هذا الفندق ذو جودة عالية. .9

130
2 6 0 7 3 2 1 األجهزة في هذا الفندق حديثة. .12
2 6 0 7 3 2 1 األجهزة المرئية والمسموعة في هذا الفندق ممتعة. .11
2 6 0 7 3 2 1 الفندق نظيف طوال األوقات. .12
2 6 0 7 3 2 1 درجة الحرارة في هذا الفندق مناسبة. .13
2 6 0 7 3 2 1 يظهر العاملون في هذا الفندق بمظهر انيق. .17
2 6 0 7 3 2 1 الممرات والمداخل والمخارج في هذا الفندق نظيفة دائما. .10
2 6 0 7 3 2 1 تقييمي العام للعوامل المادية في هذا الفندق عظيم. .16
سم الثالث: العوامل الغير المادية لجودة الخدمةالق
العوامل الغير مادية يقصد بها العوامل الغير ملموسة وتشمل سرعة اإلستجابة لطلبات الزبون، تامين الخدمة
للزبون، التعاطف مع الزبون وامكانية اإلعتماد على خدمة العاملين. من فضلك اخبرنا عن درجة موافقتك على
عن طريق وضع دائرة على افضل اختيار لك. درجات اإلختيار هيالجمل االتية
. محايد7. ال اوافق باعتدال 3. ال اوافق 2. الاوافق بشدة 1
. اوافق بشدة2. اوافق 6. اوافق باعتدال 0
2 6 0 7 3 2 1 بالوعد في وقته. الفندق يحافظ على الوفاء .1
اذا كان لدي مشكلة، الفندق بتحمس يظهر اإلستعداد ليجد .2
لها حال فوريا.
1 2 3 7 0 6 2
2 6 0 7 3 2 1 الخدمة في الفندق يمكن اإلعتماد عليها. .3
2 6 0 7 3 2 1 الفندق يقدم الخدمات كما يعد بها. .7
2 6 0 7 3 2 1 الفندق يحتفظ بسجالت دقيقة. .0
العاملون في الفندق قادرون على ان يخبروني متى ستقدم .6
الّي خدمة ما.
1 2 3 7 0 6 2
2 6 0 7 3 2 1 النزالء في الفندق قادرون على توقع خدمات فورية. .2
2 6 0 7 3 2 1 العاملون في الفندق مستعدون لمساعدة الزبائن. .1
عدون حتى ولو كانوا مشغولين، العاملون في الفندق مست .9
لتلبية احتياجاتي.
1 2 3 7 0 6 2
النزالء في الفندق قادرون على الثقة في العاملين في هذا .12
الفندق.
1 2 3 7 0 6 2
2 6 0 7 3 2 1 اشعر باألمان في تعاملي مع العاملين في الفندق. .11
2 6 0 7 3 2 1 العاملون في الفندق مهذبون في تعاملهم طول الوقت. .12
الفندق لديهم الدعم الكافي من الفندق ليقوموا العاملون في .13
بعملهم على شكل جيد.
1 2 3 7 0 6 2
2 6 0 7 3 2 1 الفندق يزودني باإلهتمام الفردي. .17
2 6 0 7 3 2 1 العاملون في الفندق يزودوني باالهتمام الفردي. .10
2 6 0 7 3 2 1 العاملون في الفندق يفهمون احتياجاتي الخاصة. .16
2 6 0 7 3 2 1 يستجيب لرغباتي بحب. الفندق .12
2 6 0 7 3 2 1 تقييمي العام للعوامل الغير المادية في هذا الفندق عظيم. .11
القسم الرابع: الوالء و جودة الخدمة
والء الزبون لفندق ما يتمثل في ان يكون الزبون يتردد على النزول في الفندق ويشمل الوالء اعطاء االصدقاء
كية ليكونوا زبائن في نفس الفندق. من فضلك اخبرنا عن درجة موافقتك على الجمل االتية عن واألخرين تز
درجات اإلختيار هي طريق وضع دائرة على افضل اختيار لك.
. محايد7. ال اوافق باعتدال 3. ال اوافق 2. الاوافق بشدة 1
. اوافق بشدة2. اوافق 6ل . اوافق باعتدا0

131
2 6 0 7 3 2 1 نفسي زبونا وفياً لهذا الفندق. أعتبر .1
2 6 0 7 3 2 1 في المستقبل القريب انوي ان استمر زبونا لهذا الفندق. .2
طالما اسافر الى هذه المدينة، ال اتوقع التغيير الى فندق .3
آخر.
1 2 3 7 0 6 2
2 6 0 7 3 2 1 حتى ولو رفع الفندق اسعاره، ساستمر زبونا لهذا الفندق. .7
لو هناك فندق منافس قّدم اسعارا اقل او تخفيضات، .0
ساّغـير اليه.
1 2 3 7 0 6 2
2 6 0 7 3 2 1 اشجع األصدقاء واألقارب ان يكونوا زبائنا لهذا الفندق. .6
ا الفندق على األرجح ساقول مالحظات سلبية عن هذ .2
لألصدقاء واألقارب.
1 2 3 7 0 6 2
شكرا على تعاونك
الباحث: عمر الصكري

132
LIST OF PUBLICATIONS
Alsaqre, O., Mohammed, B. & Jaafar, M. (2010). Investigating the effects of tangible
and intangible factors on customers' perceived service quality and loyalty in
hotel industry. Paper presented at the International Graduate Tourism
Research Conference, Kuala Lumpur, Berjaya University College of
Hospitality, Malaysia.
Alsaqre, O., Mohammed, B. & Jaafar, M. (2010). A study of the effects of factors in
the physical environment of hotels on customers’ perceptions of service
quality and loyalty. Paper presented at the Regional Conference on Tourism
Research (RCTR 2010), Penang, Universiti Sains Malaysia.