Investigating Sustainable Practices in Hotel Industry-From ...
30
sustainability Article Investigating Sustainable Practices in Hotel Industry-From Employees’ Perspective: Evidence from a Mediterranean Island Habib Alipour *, Farzad Safaeimanesh and Arezoo Soosan Faculty of Tourism, Eastern Mediterranean University, 99450 Famagusta, Turkey; [email protected] (F.S.); [email protected] (A.S.) * Correspondence: [email protected] Received: 26 September 2019; Accepted: 13 November 2019; Published: 20 November 2019 Abstract: Although several studies have researched the hotel employees’ environmental behavior, none has addressed the hotel employees’ perception of their respective hotels’ sustainability practices. This study aims to investigate the sustainable practices in four and five star hotels in a Mediterranean island by employing Global Sustainable Tourism Council (GSTC) hotel criteria indicators, indicators of sustainable development for tourism destinations (WTO), and the European Union’s (EU) sustainability framework for the Mediterranean hotels—“Nearly Zero-Energy Hotels” (NEZEH), and global sustainable development goals (SDG) in the context of three dimensions: social, economic and environment. The sampled hotels claim that their operation system is conformed to sustainability principles with the aim of furthering their green agenda. In this study, we aim to investigate the validity and extent of this claim. About 290 (N = 290) employees in the specified hotels were surveyed. The measurement instruments were compiled based on sustainability indicators that encompassed addressing social, economic, and environmental dimensions. The research questions contextualized around four main themes: effective sustainability planning, maximizing social and economic benefits for the local community, enhancing cultural heritage, and reducing negative environmental impacts. For the statistical and data analysis, SEM (structural equation modeling) is used. Study revealed that employees are a legitimate and credible source of information about sustainability practices. It is also revealed that as going green is becoming a means toward branding, hotels are making efforts to implement a genuine sustainability practice. Study also indicated that the majority of employees validated the sustainability practices as genuine. Keywords: tourism; tourism accommodations; sustainable development; sustainable practice; employee perception; north Cyprus 1. Introduction Tourism is among the growing industries with tremendous environmental impact [1]. This subsequently shifts the concern toward tourism and its impact on an international scale. As the movement of sustainable development and environmental issues becoming textbook reality, destinations gearing toward formulating new policies to harmonize tourism and environment through sustainable practices, which has also become a global mantra [2]. Nowadays, most industries and businesses tend to consider sustainability and green practices in their operations; the tourism sector is not an exception. Multiple organizations of tourism have also embarked upon various environmental policies to upgrade and harmonize their equipment and facilities to certain target markets who are demanding green practices and products [3]. In this context, corporate social responsibility (CSR) is an example of and commitment to environmentalism and social responsibilities around the world [4]. The tourism Sustainability 2019, 11, 6556; doi:10.3390/su11236556 www.mdpi.com/journal/sustainability
Transcript of Investigating Sustainable Practices in Hotel Industry-From ...

sustainability
Article
Investigating Sustainable Practices in HotelIndustry-From Employees’ Perspective: Evidencefrom a Mediterranean Island
Habib Alipour *, Farzad Safaeimanesh and Arezoo Soosan
Faculty of Tourism, Eastern Mediterranean University, 99450 Famagusta, Turkey;[email protected] (F.S.); [email protected] (A.S.)* Correspondence: [email protected]
Received: 26 September 2019; Accepted: 13 November 2019; Published: 20 November 2019 �����������������
Abstract: Although several studies have researched the hotel employees’ environmental behavior,none has addressed the hotel employees’ perception of their respective hotels’ sustainability practices.This study aims to investigate the sustainable practices in four and five star hotels in a Mediterraneanisland by employing Global Sustainable Tourism Council (GSTC) hotel criteria indicators, indicatorsof sustainable development for tourism destinations (WTO), and the European Union’s (EU)sustainability framework for the Mediterranean hotels—“Nearly Zero-Energy Hotels” (NEZEH),and global sustainable development goals (SDG) in the context of three dimensions: social, economicand environment. The sampled hotels claim that their operation system is conformed to sustainabilityprinciples with the aim of furthering their green agenda. In this study, we aim to investigate thevalidity and extent of this claim. About 290 (N = 290) employees in the specified hotels were surveyed.The measurement instruments were compiled based on sustainability indicators that encompassedaddressing social, economic, and environmental dimensions. The research questions contextualizedaround four main themes: effective sustainability planning, maximizing social and economic benefitsfor the local community, enhancing cultural heritage, and reducing negative environmental impacts.For the statistical and data analysis, SEM (structural equation modeling) is used. Study revealed thatemployees are a legitimate and credible source of information about sustainability practices. It isalso revealed that as going green is becoming a means toward branding, hotels are making efforts toimplement a genuine sustainability practice. Study also indicated that the majority of employeesvalidated the sustainability practices as genuine.
Keywords: tourism; tourism accommodations; sustainable development; sustainable practice;employee perception; north Cyprus
1. Introduction
Tourism is among the growing industries with tremendous environmental impact [1]. This subsequentlyshifts the concern toward tourism and its impact on an international scale. As the movement ofsustainable development and environmental issues becoming textbook reality, destinations gearingtoward formulating new policies to harmonize tourism and environment through sustainable practices,which has also become a global mantra [2]. Nowadays, most industries and businesses tend to considersustainability and green practices in their operations; the tourism sector is not an exception.
Multiple organizations of tourism have also embarked upon various environmental policies toupgrade and harmonize their equipment and facilities to certain target markets who are demandinggreen practices and products [3]. In this context, corporate social responsibility (CSR) is an example ofand commitment to environmentalism and social responsibilities around the world [4]. The tourism
Sustainability 2019, 11, 6556; doi:10.3390/su11236556 www.mdpi.com/journal/sustainability

Sustainability 2019, 11, 6556 2 of 30
sector, as a global phenomenon, has also realized its role regarding sustainability as it makes use of theresources and generates measurable environmental impacts [1]. The tourism’s impact on environmentand its contribution to global carbon footprint is a foregone conclusion [5,6].
Kyrenia (Girne in Turkish), is a major city in north Cyprus that captures the highest share ofnumber of tourists and bed nights (71%), as well as, highest share of number of hotels (64%) [7]. In themeantime, north Cyprus’s economy is highly dependent on tourism [8] and at the consolidated stage oftourism area life cycle [9]. According to Butler [10]’s tourism area life cycle model (TALC), destinations,especially coastal resorts (e.g., Kyrenia), evolve through several stages. The stage of “consolidation,”which Kyrenia is experiencing [11], characterized as a stage whereby tourism is a major economicsector; heavy advertising; some opposition to tourism because of over-crowded and high-density oftourism destination; product deterioration and abandonment of facilities [10]. However, to reconcilethe sustainability and growth, a new reality needs to be recognized, which is changing nature andbehavior of tourists who are keen to consume green product and expect environmentally principledprocesses of production and consumption, and/or, they have pro-social attitude and green consumptionvalues [12].
While consumers are demanding green services and green products, tourism accommodationsector has been a vanguard in responding to green consumers’ demand. Green hotel concept in thecontext of sustainable tourism has gained recognition as a business strategy, as well as, gaining acompetitive edge in the global tourism market [13]. Studies revealed that “one of the most importantreasons for going green is the customer, often touted as the central stakeholder in driving hotels to beenvironmentally friendly; indeed, a growing consumer base exists who are attracted by the ecologicalappeal of lodging facilities” [14]. Nevertheless, consumers’ demand has played a significant role inmediating hotels’ green practices. Fatma et al. [15] (p. 40) noted that “increased awareness amongconsumers toward social and environmental issues led to a demand that tourism companies protectthe cultural heritage and places visited by tourists.” Furthermore, green hotels/ sustainable hotels areaffected by green consumers’ demand for practices that are in line with sustainability [16–18].
Tourism destinations that are highly dependent on tourism have to face extra challenges in anuncertain environmental prospect such as climate change [19]. The case of north Cyprus is amongmany Mediterranean destinations whose recent economic growth is structured upon tourism sector.It is also a known reality that they are experiencing environmental degradation and uncertainty aboutsustainable future, especially in the coastal areas—location of many up-market/luxury hotels [20].
The main objective of this study is to investigate the sustainability practices of the accommodationsector on the environmental, social, and economic dimensions as an indication toward sustainability.It is assumed that environmental practices in hotels—as a sub-sector of tourism system—can be aformula to achieve the principles of sustainable development. The assumption is that when hotels’operating system is embarking upon implementation of sustainability principles, it gains the recognitionas “green hotels” with marketing as well as competitiveness implications in the long-run [21].
Managers of tourism industry, especially in accommodation sector are facing a rapidly growingenvironmental concern nationally and internationally. Accommodation sector in particular needsto adapt themselves and adopt new strategies as well as utilizing new methods and trends. It wasestimated that the amount of total waste generated by hotels during the lean season amounted to2010.5 kg/day in north Cyprus, in which the share of large hotels was (66.7%), followed by mediumsize hotels (19.4%), and guesthouses (2.6%) [22]. Therefore, this study adheres to tackling the issue ofsustainability which resonates with statement that: “The United Nations Sustainable DevelopmentGoals of the 2030 Agenda for Sustainable Development indicate the need to rethink the currenteconomic growth ideology in the context of social and environmental needs in development” [2] (p. 3).The question is to what extent the accommodation sector is in line with such agenda.
Even though “sustainability is widely accepted as a ’good business’ mega-trend in contemporarytourism and hospitality industry” [23] (p. 15), the acceptability of this attitude do not necessarilytranslate into sustainable practice. There are ample evidences of “greenwashing” as a sector-wide

Sustainability 2019, 11, 6556 3 of 30
exercise [24–26]. Nevertheless, as Weaver, Davidson, Lawton, Patiar, Reid, and Johnston [23] stated“growing recognition and adoption of sustainability practices and corporate social responsibilitycharters amongst hotels internationally is nudging the sustainability paradigm” (p. 15). In themeantime, “despite the almost universal support for sustainability and participation in at least somerelated initiatives, empirical data that comprehensively describes and organizes these practices arelacking in the tourism and hospitality literature” [23]. This still resonates with the United Nations’ 2030Sustainable Development Goals (SDGs) [27], which is an outcry for sustainable practice. Such practiceis “commonly regarded as the care of the environment, society, and the production of economicbenefits” [27] (p. 787). At the end, this study is a logical effort to push the SDG’s agendas forward,especially in less developed economies; whereas, “the literature is dominated by examples of hotels’responsible and sustainable practices in the developed world” [27] (p. 787).
Furthermore, this study will add an insight into the literature, as well as, a contribution toenriching an awareness for managers. The study is also aiming to contribute to the literature whichis limited in terms of receiving attention on this topic because of contradictory findings in regard toconsumers’ green decision and hotels’ green practice [28,29].
2. Conceptualization
The following questions construct the conceptual logic that guides this research:
1. What is the extent of hotel managers’ commitment to sustainable practices?2. What are the indications of hotels’ initiatives toward sustainable practices?3. What is the nature of hotels’ sustainable strategy; and how these strategies are realized?4. What are the methodologies that hotels apply to measure their progress toward achieving
sustainable practice?
The main argument revolves around the concept of sustainability and its social, economic, andenvironmental agendas elaborated by WCED [30]; Weaver, Davidson, Lawton, Patiar, Reid, andJohnston [23]; and Harris and Goodwin [31].
The concept of sustainable practice includes social responsibility of the hotels toward the localcommunity that they are embedded, economic fairness toward employees and contribution to theeconomic welfare of the local people, and measurable practices toward environmental protection andquality (i.e., triple bottom line) [32]. In the meantime, it is believed that the sustainable practices ofhotels should be embedded in the overall supply side of tourism system where visitor’s expectationis fulfilled when they experience a mosaic of attractions with social, economic, and environmentalconnotations that affects their cognitive and affective perceptions [33,34]. Nevertheless, hotels thatembark upon green marketing are aware of the changing market and changing tourist’s profile andvalues [35]. Theory of basic human value [36] contends that a measurable segment of the consumerspossesses biospheric value and they are concerned with the benefits of nature and biosphere withwillingness to contribute to the welfare of natural world [37].
Based on the Global Sustainable Tourism Criteria [38], and sustainable development perspective [30],a framework has been structured to guide the study (see Figure 1). The accommodation sector isa business entity with constant marketing challenges in the global tourism market. However, theirgreen practices cannot be isolated from their marketing strategies [39,40]. Thus, the philosophicalethos of their sustainable practice should revolve around the triple bottom line (TBL) goals. In thisregard Jamrozy [41] (p. 124) noted: “while many product development implications have already beendiscussed in sustainable tourism management, unique marketing missions such as the facilitation ofsynergies between a network of agents and the communication of triple bottom benefits of sustainabletourism experiences need to be addressed” (see also Figure 2). In the meantime, this is the firstcomprehensive research on hotel’s sustainability practices based on employees’ perspectives in themajor destination in north Cyprus.

Sustainability 2019, 11, 6556 4 of 30Sustainability 2018, 10, x FOR PEER REVIEW 4 of 31
Figure 1. Theoretical model of the study.
This study has also adhered to the European Union’s (EU) sustainability framework for the Mediterranean hotels which is manifested in its project called “Nearly Zero-Energy Hotels” (NEZEH); whereby “the aim is to reinforce businesses operating in the hospitality sector to meet the challenges of competitiveness, reduction of energy consumption, and adoption of green energy technologies, providing technical support and advice to selected hotels in order to develop sustainable and feasible large scale renovations toward Near Zero Energy consumption levels” [42] (p. 230). Such undertaking is rationalized as the hospitality industry is responsible for 2% of the world’s CO2 emissions can play a crucial role contributing to the 2020 and even more ambitious for 2050 energy targets in the Member States. This study is tantamount to EU’s NEZEH agenda.
Applying The Global
Sustainable Tourism
Council (GSTC) hotel
criteria.
Det
erm
inan
ts o
f res
earc
h O
utco
me.
Thematic research concerns:
•Demonstrate effective management
System
•Maximize social and economic
benefits to the local community and
minimize negative impacts,
•Maximize benefits to cultural
heritage and minimize negative
impacts,
•Maximize benefits to the
environment and minimize negative
impacts,
•Conserving biodiversity, ecosystems
and landscapes,
•Conserving resources,
•Reducing pollution,
•Employees environmental
awareness,
•Employees environmental training,
•Collaboration with NGOs,
•Environmental communication
through hotelier’s association.
Some of the uses of the criteria include the following: • Serve as the basis for certification for sustainability
• Serve as basic guidelines for businesses of all sizes to become more sustainable,
and help businesses choose sustainable tourism programs that fulfill these global
criteria
• Provide greater market access in the growing market for sustainable products,
Sustainability
dimensions:
• SOCIAL
• ENVIRONMENT.
Figure 1. Theoretical model of the study.
This study has also adhered to the European Union’s (EU) sustainability framework for theMediterranean hotels which is manifested in its project called “Nearly Zero-Energy Hotels” (NEZEH);whereby “the aim is to reinforce businesses operating in the hospitality sector to meet the challengesof competitiveness, reduction of energy consumption, and adoption of green energy technologies,providing technical support and advice to selected hotels in order to develop sustainable and feasiblelarge scale renovations toward Near Zero Energy consumption levels” [42] (p. 230). Such undertakingis rationalized as the hospitality industry is responsible for 2% of the world’s CO2 emissions can play acrucial role contributing to the 2020 and even more ambitious for 2050 energy targets in the MemberStates. This study is tantamount to EU’s NEZEH agenda.

Sustainability 2019, 11, 6556 5 of 30Sustainability 2018, 10, x FOR PEER REVIEW 5 of 31
Figure 2. Sustainable practice philosophy for hotel business strategy. Source: Adopted from Jamrozy [41]. Permission obtained.
3. Literature Review
The number of environmentally conscious tourists is rapidly growing, they demand green products during their travel, and they are willing to pay for it [43–46]. The belief and tendency among green consumers including tourists is that the companies and other related firms should have a sustainable approach and maintain a high level of environmentally friendly activities. This tendency toward sustainable and green practices have led travelers to prefer hotels whose sustainable practices are visible and genuine [47–49]. “Studies conducted by the International Hotels Environment Initiative (IHEI) reveal that 90% of the hotel guests prefer to stay in a hotel that cares for the environment” [43] (p. 214).
Nevertheless, the environmental behavior of the consumers in the one hand and marketing forces in the other hand has forced the tourism industry, with accommodation sector as a vanguard, to reconcile the conventionally conflictive relationships between economic interests and environmental quality. In macroeconomic context, Harris and Goodwin [31] stated that “the picture of environmental limits that we have sketched implies a much more critical view of increasing consumption; growth in consumption is not necessarily undesirable, but needs to be weighed against its negative effects on resources and environmental services” (p. 15).
SOCIETY:
Philosophy: Social Justice
Societal Mkt. Orientation
“Cause”, “Good” Products for Society
Goal: Benefit of Society, Equity
ECONOMY:
Philosophy:
Anthropocentric
Consumer/Green Mkt.
Orientation
Specialized (Green)
Products for Target
Markets
ENVIRONMENT
Philosophy:
Biocentric/ Ecocentric
Environmental Mkt.
Orientation
(Eco/Green) Products
in a Healthier
Environment
Goal: Healthy
Sustainable practice philosophy.
Figure 2. Sustainable practice philosophy for hotel business strategy. Source: Adopted fromJamrozy [41]. Permission obtained.
3. Literature Review
The number of environmentally conscious tourists is rapidly growing, they demand green productsduring their travel, and they are willing to pay for it [43–46]. The belief and tendency among greenconsumers including tourists is that the companies and other related firms should have a sustainableapproach and maintain a high level of environmentally friendly activities. This tendency towardsustainable and green practices have led travelers to prefer hotels whose sustainable practices are visibleand genuine [47–49]. “Studies conducted by the International Hotels Environment Initiative (IHEI)reveal that 90% of the hotel guests prefer to stay in a hotel that cares for the environment” [43] (p. 214).
Nevertheless, the environmental behavior of the consumers in the one hand and marketing forcesin the other hand has forced the tourism industry, with accommodation sector as a vanguard, toreconcile the conventionally conflictive relationships between economic interests and environmentalquality. In macroeconomic context, Harris and Goodwin [31] stated that “the picture of environmentallimits that we have sketched implies a much more critical view of increasing consumption; growth inconsumption is not necessarily undesirable, but needs to be weighed against its negative effects onresources and environmental services” (p. 15).
However, the idea of sustainable practice in general and particularly in tourism emanates froma worldwide challenge that addresses social, economic, and environmental justice. In the context ofsustainable practices in any organization and processes of production and consumption, Schlosberg [50](p. 38), believes the new trends “extend a conception of environmental justice into a new realm—whereenvironment and nature are understood to create the conditions for social justice.”

Sustainability 2019, 11, 6556 6 of 30
The tourism sector at the global level has become one of the major contributors to globalenvironmental challenge with socio-economic ramifications. The recognition of sustainable tourismas a sub-discipline of sustainable development is an acknowledgment of problems associated withmass tourism [1,9,51]. Finally, the misperception about tourism as “smokeless industry” shifted thetrajectory of tourism development. As elaborated by Tang, et al. [52] (p. 390), “the tourism industryis no longer regarded as a ‘smokeless’ industry accompanying the improvement of environmentalconsciousness. Tourism often involves travel and accommodations, which rely on fossil fuels for thetransportation of tourists to and from as well as within destinations and for hosting tourists.”
To ensure the long-term existence and sustainability in the hospitality industry, there are severalchallenges that hotels—as a formidable sub-sector—need to overcome. First, they need to balancebetween economic interest and sustainability. Second, they have to overcome the challenge of climatechange as they are highly vulnerable to this challenge [53]. In this context, the implementation ofenvironmental, social, and economic practices within the sustainability framework “has become crucialinto tourism facilities operations management” [54] (p. 471). Such a practice is known as “greenpractice,” which is defined as “a value-added business strategy that benefits hospitality operations thatengages in environmental protection initiatives” [55] (p. 226).
Nevertheless, sustainable practice in tourism in general and particularly in accommodation/hotelsector has become a major part of policy spectrum worldwide. Such an indispensable policy resonateswith two narratives. First, “many hotels acknowledge that adopting eco-friendly practices is notonly an ethical practice but also beneficial in reducing costs, image enhancement, creating marketdifferentiation, and corporate social responsibility” [43] (p. 212). Second, the ubiquitous acceptanceof principled sustainability, especially in tourism, which “accounts for resource-based (e.g., impactson natural and cultural capital), activity-based (e.g., growth and development of industry), andcommunity-based (e.g., involvement of social capital in a local context) traditions” [56] (p. 919).Nevertheless, sustainable practice in hotels transcends the normative and cosmetic environmentalgestures (i.e., labeled as “greenwash”) [57], because most of the five star hotels, especially in theMediterranean destinations, are located in the coastal areas with socio-ecological implications not justlocally, but also regionally and globally [58].
3.1. Green Consumers/Tourists
Green consumerism has its roots in demand for organic food that goes back to post world war II.During this time, as reported by Sparks and Shepherd [59] (p. 391):
“The use of synthetic nitrogen has increased six-fold and the production of pesticides hasincreased approximately twenty times. This development has been accompanied not only by increasedagricultural production but also by a growing concern about associated health and environmentalproblems (e.g., nitrate in the water supply, pesticide toxicity, and pesticide resistance).”
“Green consumers are conventionally defined as consumers who engage in consumer practicesthat are viewed as environmentally friendly” [60] (p. 127). To reduce environmental impact, consumersinvolve in various forms of practices including: “reducing consumption; using public transportation;recycling; buying products with less packaging; buying second-hand goods; eating less meat; buyinglocally grown food; organic food; fair-trade items and other products that have a reduced environmentalimpact” [60].
Such attitude toward healthy food and environmentalism have been explained in the context oftheory of planned behavior (TPB) [61], and theory of reasoned action (TRA) [62]. It was suggestedthat such behavior, which translated to a trend, had broader aim of concern for environment bythe consumers and explained by differences between certain consumers’ political and technologicalattitudes. These theories have been highly useful in explaining and understanding the psychologicaland cognitive behaviors of consumer decision-making and their willingness to purchase green productsand support green practices [12,28].

Sustainability 2019, 11, 6556 7 of 30
Nevertheless, there has been a growing concern for sustainability and green products among theconsumers worldwide and the concern has also been growing among the tourists to demand greenservices and practices in the hospitality industry [36,63–65]. Travelers have also played an importantrole in the flourishment of alternative tourism that has sprung up in the global tourism arena in theforms of eco-village, eco-lodge, farm tourism, agri-tourism, and nature-based tourism, just to namea few [66,67]. In a global survey by Booking.com and TripAdvisor.com, which carried out in 2016,indicated an encouraging data for sustainable tourism. Accordingly, 68 percent of tourists prefer tobook an eco-friendly accommodation, transportation, and meals.
It is important to point out that “customer satisfaction is critical for hotels’ business survival” andseveral theories have dealt with the construct of “satisfaction,” for instance, expectancy disconfirmationtheory, equity theory, attribution theory, and motivation-hygiene theory [68]. In the meantime,constructs of tourists’ eco-friendly intentions, green marketing strategies, green image’s impact, etc.,have captured the attention of the researchers and contextualized within the green hotel trends.The impact of green practices on customer demand for green product and their satisfaction have alsoattracted the curiosity of the marketers and scholars [68–70]. “In addition, in the hospitality industry,researchers found that customers that have a great awareness of problems regarding the environmentprefer to make eco-friendly purchases” (as cited in [71] (p. 3404)).
Hotels are keen to uphold the intention of the tourists to revisit their facilities. This is due to aparadigm shift toward sustainability in marketing tourism [41], due to pro-environmental behavior ofthe so-called green tourists, who are responsible travelers that conserve natural environment [72], andthey have become a segment in the tourism market [46]. Nonetheless, green tourists are capturinga measurable segment of the market that hotels cannot ignore. By definition they “behave in anenvironmentally friendly manner when on vacation in a wide range of tourism contexts” [46] (p. 320).
Nevertheless, those consumers, “exemplifying a greener lifestyle, are crucial to companiesand to other consumers as they serve as examples (buying fair trade, recycling, saving energy,etcetera) contributing to the sustainability of the planet” [12] (p. 1001). In the meantime, the greenlifestyle is a reaction to and sympathy with the environmental challenges (pollution, global warming,overpopulation, natural resource depletion, waste disposal, climate change, loss of biodiversity, andocean acidification) that humanity faces.
Our assertion is that employees are not in a position to force hotels to go green; however, theconsumers/tourists/guests (i.e., these terms have been used interchangeably in tourism literature asthey consume tourism product) [73–77] (just to name a few), can force the hotels to go green, otherwisethey will not patronize those hotels that are not practicing sustainability [45,55,78].
3.2. Green Hotels and Sustainable Practice
The tourism accommodation sector in general, hotels in particular, are challenged by changingmarket internationally and domestically. The supply and demand dimensions of tourism is highlydynamic as the host community and travelers have divergent and sometimes converging concernsabout the nature of processes of production and consumption [79]. This is highly relevant to thehotels’ environmentally friendly services, green supply chain, and overall sustainable practices.Robin et al. [80] (p. 1415) stated that “these practices not only serve to lure certain types of clientswho seek an explicit commitment to the natural environment but also provide hotels with a source ofcompetitive advantage that allows for cost reductions and improves their image.”
The Global Sustainable Tourism Council (GSTC) in alliance with International Social andEnvironmental Accreditation and Labeling Alliance (ISEAL) are organized around four themesfor hotels’ sustainable practices: “effective sustainability planning, maximizing social and economicbenefits for the local community, enhancing cultural heritage, and reducing negative impacts to theenvironment” [38] (p. 1). Similar to manufacturing firms, green adoption in hotels that provide servicesis increasingly accepted as indispensable to generating long-term profitable services that positivelyreflect on the firms’ environmental and social responsibilities [81]. Furthermore, Saura et al. [82]

Sustainability 2019, 11, 6556 8 of 30
explored that hotels’ environmental practices should expand beyond the physical location of the hotel,rather they should extend to the surrounding environment “including the pure air in the facilities andsurroundings, the absence of noise, and the abundance of nature and plants, in the hotel ecosystem”(p. 14). They asserted that travelers’ positive sentiments regarding these indicators should translate tothe hotel managers’ commitment to respect the sustainability of natural areas, as well as the use oflocal products and experiences.
In the meantime, the hotel industry has been identified as the most polluting sector within thehospitality industry. According to the American Hotel and Lodging Association, “in 2012, the USAhotels spent $8.2 billion on energy, created 7 million tons of waste, consumed 64 trillion gallons ofwater, and generated 23 million tons of CO2” [68] (p. 1341).
According to some studies [70,83], it is believed that because of the nature of hotels’ functions,they consume great amount of energy and water along with production of substantial quantity ofwaste material. It is estimated that “the hotel industry generates about 45.0% of all municipal solidwastes among municipal commercial sector facilities” [84] (p. 59). Researchers agree that the properwaste reduction management in hotel leads to not only environmental protection but also economicbenefits. The environmental impact of hotels is more visible in the coastal areas where the “Sun, Seaand Sand” (3S) model tourism is dominant (e.g., Mediterranean region) [20,85].
At the same time, economic benefits of the hotels are interlinked to the green consumer’s demandfor environmentally friendly services. To satisfy the consumers, hotels are obliged to focus on buildingtheir image as “green hotel” in line with sustainable practice. In a “survey conducted by TripAdvisor, itwas revealed that about 62.0% of travelers are concerned about the environmental issue when decidingto stay at a hotel [81]; nearly 87.0% of guests are aware of the importance of eco-friendly hotel, about80.0% of guests consider themselves as eco-conscious customers, and about 30.0% of them are willingto pay more for environmentally responsible hotels” [84] (p. 58).
Nonetheless, tourism industry in general and hotel sector in particular have realized the benefitsof going green. This so-called “green revolution” [86] has come about because of the forces of supplyand demand within the global tourism system. Kang, Stein, Heo, and Lee [86] (p. 565) stated that:
“People throughout the world seek to alter the current path of rapid environmental degradation.The hotel industry is not exempt from and has certainly participated in the growing trend. Over the pastseveral years, the world’s leading hotel brands have increased their efforts to respond to environmentalissues and invested significantly in going green.”
In an international survey conducted by TripAdvisor (2013), results revealed “more than30,000 travelers indicate that 79 per cent of the travelers place importance on properties implementinggreen practices” [68] (p. 1341). Furthermore, as tourism has become a global phenomenon, hotelshave also become aware of global response to environmental challenges. Thus, “in response toserious environmental concerns, the hotel industry is emphasizing energy conservation, environmentalprotection, and sustainable development by reducing waste, recycling materials, and reusing resources.As hotels are highly vulnerable to external factors and pressures in a global operating environment,many hotels are trying to adopt low-carbon energy technologies or green management to addressenvironmental demand” [87] (p. 1).
4. Study Site
For the purpose of this study, the historical/coastal city of Kyrenia (also called Girne) wasconsidered as a case study site. Kyrenia is also the major tourist city in north Cyprus. This case studywas considered appropriate because it involves comprehensive and context analyses with a view toidentify issues and generate insights. The city is home to the highest number of four and five starhotels, casinos, restaurants, and residential tourism [34,88] (See also Figure 3). It is also home to severaluniversities with large number of international students (Edu-tourists). Kyrenia is also a coastal citywith sun, sea, and sand tourism attractions. “According to the land-use survey, the vast majorities ofthe buildings (45%) are for touristic use, and mixed used buildings and hotels (47%) [89] (p. 1495,1498).

Sustainability 2019, 11, 6556 9 of 30
Sustainability 2018, 10, x FOR PEER REVIEW 9 of 31
Around 64 percent of the tourist accommodations in north Cyprus is located in Kyrenia that accounts for over 59 percent bed nights [90]. Kyrenia also received 42 percent of tourist arrivals in north Cyprus in the year t [90]. Compare to other regions in north Cyprus, Kyrenia is experiencing “over-tourism.” Over- tourism has been associated with “anti-tourism movements, tourismphobia, and pollution” [91]. Kyrenia’s hotels attracted our attention because “as a large sector of the tourism industry, the hotel industry is resource-intensive and thus has a great impact on the natural environment. “The hotel industry has been suggested to be the most harmful to the environment among all hospitality sectors” [68]. Therefore, hotels have decisive role in upholding the principles of sustainability and its implementation. With the highest number of four- and five-star hotels and their associated casinos, Kyrenia has suffered from pollution, loss of green space, loss of open space, seawater pollution, and absence of an adequate sewage infrastructure. “The underground water resources are under extra pressure from the sewage produced by large hotels as their sewage treatment plants do not operate efficiently” [89] ( p. 1496). On this ground, this study intends to put to test the hotel’s sustainable practices.
Figure 3. Map of Cyprus. Source: https://www.drivingdirectionsandmaps.com/cyprus-google-map/
5. Methodology
5.1. Data Collection
As the main objective of this research is to investigate the sustainable practices in four- and five-star hotels in a Mediterranean island, a descriptive research design was deemed the most proper quantitative method to answer the research questions. The survey questionnaire designed for this
Figure 3. Map of Cyprus. Source: https://www.drivingdirectionsandmaps.com/cyprus-google-map/.
Around 64 percent of the tourist accommodations in north Cyprus is located in Kyrenia thataccounts for over 59 percent bed nights [90]. Kyrenia also received 42 percent of tourist arrivals innorth Cyprus in the year t [90]. Compare to other regions in north Cyprus, Kyrenia is experiencing“over-tourism.” Over- tourism has been associated with “anti-tourism movements, tourismphobia,and pollution” [91]. Kyrenia’s hotels attracted our attention because “as a large sector of the tourismindustry, the hotel industry is resource-intensive and thus has a great impact on the natural environment.“The hotel industry has been suggested to be the most harmful to the environment among all hospitalitysectors” [68]. Therefore, hotels have decisive role in upholding the principles of sustainability and itsimplementation. With the highest number of four- and five-star hotels and their associated casinos,Kyrenia has suffered from pollution, loss of green space, loss of open space, seawater pollution,and absence of an adequate sewage infrastructure. “The underground water resources are underextra pressure from the sewage produced by large hotels as their sewage treatment plants do notoperate efficiently” [89] (p. 1496). On this ground, this study intends to put to test the hotel’ssustainable practices.
5. Methodology
5.1. Data Collection
As the main objective of this research is to investigate the sustainable practices in four- andfive-star hotels in a Mediterranean island, a descriptive research design was deemed the most properquantitative method to answer the research questions. The survey questionnaire designed for thisstudy consists of a set of demographic questions (i.e., age, gender, duration of stay, and educational

Sustainability 2019, 11, 6556 10 of 30
level). A 5-item Likert scale is designed to measure each indicator (1—strongly agree, 2—agree,3—neutral, 4—disagree, 5—strongly disagree). This enables the researcher to transform each indicatoron a reflective form to represent the variables/measures of the study. Data collection spanned almosttwo months (June–July 2018). Out of 290 survey questionnaires, three items were incomplete; therefore,around 287 items were useable for analysis. Out of twelve four- and five-star hotels, eight hotels wereaccessible. In total, four “4 star” and four “5 star” hotels were accessed. These hotels facilitated thesurvey on condition not to reveal their names. Therefore, they are given anonymous names (e.g., A, B,C . . . etc.). The survey instrument was originally prepared in English and then translated into Turkishbased on the back-translation method [92]. The resulting instrument was tested with a pilot sample of20 employees regarding the understandability of the scale items. Thus, no changes were made in thesurvey instrument, as there was not any difficulty in understanding the items.
The design of survey questionnaire (S/Q) started with linking the research aim (hotels’ sustainablepractice on social, economic, and environmental dimensions—three pillars of sustainability), and eachquestion in the context of relevancy to the issues that surrounded the research. To develop such link, atable of specifications with a two-dimensional matrix was developed. One dimension contained thedomain of the research goal (i.e., sustainability practice on social, economic or environment), and thesecond dimension exhibited the respondents’ attitude/belief representative of those domains. Througha pilot study [93], we made sure that each S/Q was clearly understood by the respondents. Finally,the S/Q were structured into groups (i.e., three parts) whereby items relevant to each group wereorganized accordingly. The source of the S/Q was achieved by exploring the extant literature [54,94–96],just to name a few. Furthermore, the R/Q were enriched by the criteria established by globalsustainable tourism council (GSTC) [97] (i.e., hotels’ sustainable performance indicators), indicatorsof sustainable development for tourism destinations [98], the European Union’s (EU) sustainabilityframework for the Mediterranean hotels—”Nearly Zero-Energy Hotels” (NEZEH) [42], and globalSustainable Development Goals (SDG) [99]. These sources are highly relevant to the aim of the study.Target population is justified as the “employees” are the legitimate reservoir of information about theorganizational practices/behaviors [100–102]. Finally, each R/Q was examined to make sure that itgenerates a response that reveals the sustainability practice on each dimension. For instance, if the issuein question is social (i.e., hotels’ sustainability practice in terms of “social” aspect); the design of thequestion should solicit the level of hotel’s involvement in contribution to community’s cultural heritage.
In light of the information received from the hotels’ managers, the total number of employeesworking in these hotels was 1635. In order to collect data from employees, the researchers were able toreceive permission from the hotels’ managers. At the outset of the research, hotels’ employees weregiven an assurance of anonymity and confidentiality [103], and it was explained that there were noright or wrong answers to the questionnaire items. Respondents were requested to self-administerthe questionnaires. The number of respondents from each hotel was specified as proportional to thenumber of staffs in these hotels.
5.2. Sampling Method and Measurement
As the aim of this study was to examine hotel employees’ perception of sustainable practices oftheir respective working organization, the study population comprised of employees from variousdepartments of the hotels. Consequently, 300 questionnaires were distributed to the employees;however, a total of 290 items were returned, in which 287 were valid responses. Therefore, the returnrate was 95.67%.
The drop-off/pick-up method for employees’ survey research was applied that consisted ofdelivering questionnaires to the managers for distribution among the employees within the studyhotels. For the purpose of this study convenience sampling method was undertaken which “is a typeof nonprobability/ nonrandom sampling where members of the target population that meet certainpractical criteria, such as easy accessibility, geographical proximity, availability at a given time, or

Sustainability 2019, 11, 6556 11 of 30
the willingness to participate are included for the purpose of the study” [104] (p. 2). This is alsocommensurate with similar studies (e.g., [105,106]).
The measurement instruments compiled based on sustainability indicators including: GlobalSustainable Tourism Council (GSTC) [97], hotel criteria indicators, indicators of sustainable developmentfor tourism destinations [98], and the European Union’s (EU) sustainability framework for theMediterranean hotels—“Nearly Zero-Energy Hotels” (NEZEH) [42], as well as extant literature(e.g., [18,101,107]). These studies have addressed sustainability practices on social, economic, andenvironmental dimensions. The social dimension (SUS_SOC) was measured using six (6) items; theenvironment dimension (SUS_ENV) was measured using eight (8) items; and the economic dimension(SUS_ECON) was measured using eight (6) items. Responses to the items were elicited on a five-pointscale ranging from 1 (Strongly Agree) to 5 (Strongly Disagree). For the list of items’ description, seeTable 2. Balcı [108] has developed an attitude scale based on the average of the Likert scale questionnaireas follows: 1–1.79 strongly agree; 1.80–2.59 agree; 2.60–3.39 undecided; 3.40–4.19 disagree; and 4.20–5strongly disagree. By referring to Balcı [108], we demonstrate the extent of sustainability practicesbased on employees’ perception.
Several studies have addressed the relationship between sample size and the model fit indicesand elaborated that for a maximum likelihood estimation (MLE), which is used in this study as anestimation procedure, a sample size of 200 to 400 is adequate [83,109–111]. The sample size is not onlyimportant for the statistical analysis, but also is the critical determinant for evaluating the reliability ofthe existing model. Although there is no standard rule for sample size, it is suggested that in SEM aminimum of five respondents per estimated parameter can be acceptable [112], however, a ratio of 10is more appropriate [113].
5.3. Data Analysis
Data analysis method of this study employed structural equation modeling (SEM) to test theconceptual model. The structural equation modeling (SEM) as a statistical methodology is appliedto explain and measure the unobserved (latent) variables in order to assess the conceptual model’sconsistency with observed variables and collected data [114,115]. In the meantime, for the purpose ofstatistical and data analysis via SEM the AMOS software package version 24.0 was utilized. In addition,the data preparation and screening was conducted prior to SEM [116]. One should bear in mindthat the missing data as a part of data preparation and screening is a critical issue when SEM isutilized [117]. Otherwise, missing data can result in bias as well as distortion of statistical test, whichis necessary for estimation of parameters [113,118,119]. As the aim of this study is to confirm thatthe constructs of the proposed model (sustainability) load into the underlying sub-constructs (social,economic, and environment), the second-order confirmatory factor analysis (CFA) is employed in thisstudy [113,120–122]. The validity of the instrument is also measured by testing the content validityand convergent validity [123]. The content validity is referred to the adequacy and comprehensibilityof the instrument that is supposed to measure. The construct validity is the extent to which a scaleadequately measures a certain variable, which is sub-categorized into convergent and discriminantvalidity. In the meantime, the content validity in this research was measured through the expertjudgment and literature review [124,125]. The convergent validity, which is applied in this study,determines to what extent the scale items of the construct can be loaded in the model, which can bealso appraised through the item-to-total correlation (ITC) [126].
The reliability of the constructs has been measured through the Cronbach’s alpha coefficient,composite reliability, and average variance extracted (AVE). Moreover, the R square (R2) values inAMOS, which is labelled as squared multiple correlations, are also used for further verification of thereliability [109]. This approach evaluates the representativeness level of the measurement model fromthe observed indicators [116,121]. In order to measure the overall model fit of the model, three typesof indices were utilized consisting of parsimonious fit measure (PFM), absolute fit measure (AFM),and incremental fit measure (IFM) measures [111,113,122,127]. This is because in SEM the model fit

Sustainability 2019, 11, 6556 12 of 30
refers to the extent to which the proposed model adequately fits the observed data [128]. As differentestimation methods are different in terms of their functions for minimizing the discrepancy basedon their distributional assumptions, obtaining the permissible values of the parameters is a commonacceptable approach [129]. Therefore, since there are no exact guidelines and consensus about a “goodfit,” estimating the different fit indices at the same time is the suitable procedure [130].
6. Results
6.1. Respondents’ Profile
The demographic profile of this study consists of age, gender, level of education, duration ofemployment. The result of descriptive analysis for the demographic variables shows that the majorityof the respondents were mature adults aged 31–40 (48.1%). Education level of the employees comprisedof a 4-year university degree (50.2%), 2-year College degree (28.9%), post-graduate degrees (11.8%),and the rest were holder of high school diploma (9.1%). The majority of the employees’ duration ofwork were 3–5 years (43. 2%). Overall, the employees’ gender profile was equal which comprised offemales (48.4%) and males (51.6%). See also Table 1.
Table 1. Respondents’ profile.
Profile Category Frequency (N = 287) Percentage (%)
Gender Female 139 48.4Male 148 51.6
Age Under 20 29 10.121–30 66 23.031–40 138 48.1
Above 40 54 18.8
Educational Level High school 26 9.1College 83 28.9
4-year university 144 50.2M.Sc. Or PhD 34 11.8
Duration of employment Less than a year 18 6.31–3 years 66 23.03–5 years 124 43.2
More than 5 years 79 27.5
6.2. Descriptive Statistics of the Questions
Table 2 sets out the general perception of the respondents regarding the sustainability practicesof the hotels where they are employed. The frequency and percentage of respondents’ perceptionregarding each item of the questionnaire is shown in Table 3. The result based on the mean scoresshows that the majority of respondents either agree or are neutral. Based on the result of Table 3, 53.2%of the respondents agree or strongly agree, however, only 15% of the respondents were disagree orstrongly disagree.
As exhibited in Table 3, employees’ responses on sustainability practices in relation to social,environmental, and economic dimensions in average for social is 2.54, for environmental is 2.50, andfor economic is 2.58, which implies that employees “agreement” and validation of hotels sustainabilitypractice. According to Balcı [108], it is shown that the attitude scale of the variables was “agree” thatindicates the proposed sustainability practices are implemented in these hotels as it is perceived bytheir employees. For instance, on the social dimension (i.e., Staff are informed and trained about the naturaland cultural heritage of the local area), response value of agreement registered is 2.45 (mean). In regard toenvironmental dimension (i.e., Native and endemic plants obtained from sustainable sources have been usedin landscaping and decoration, avoiding exotic and invasive species), response value of agreement registeredis 2.34 (mean). On economic dimension (i.e., Water saving equipment are regularly maintained and areefficient), the response value of agreement registered is 2.47 (mean).

Sustainability 2019, 11, 6556 13 of 30
Table 2. Descriptive statistics of questionnaire variables.
Variable Label Variables Mean Median Mode Std. Dev. Min. Max.
• The sustainability management system (SMS) isclearly documented and understood. SUS1_SOC 2.41 2 2 0.91 1 5
• Staff are informed and trained about the natural andcultural heritage of the local area SUS2_SOC 2.45 2 2 0.89 1 5
• Organization participates in partnerships betweenlocal communities, NGOs and other local bodies where
these existSUS3_SOC 2.64 3 3 0.95 1 5
• Organization has identified groups at risk ofdiscrimination, including women and local minorities SUS4_SOC 2.61 3 3 0.94 1 5
• Hotels seek to bring innovative green products andservices to market SUS5_SOC 2.59 2 2 1.04 1 5
• Hotel companies often use eco-labels on packaging,and show them on their corporate websites SUS6_SOC 2.54 2 2 0.99 1 5
• Records of these programs are listed and managed SUS1_ENV 2.47 2 2 0.84 1 5
• There is an environmental awareness rising plan. SUS2_ENV 2.49 2 2 0.85 1 5
• Native and endemic plants obtained from sustainablesources have been used in landscaping and decoration,
avoiding exotic and invasive speciesSUS3_ENV 2.34 2 2 0.80 1 5
• Organization uses green procurement criteria SUS4_ENV 2.62 2 2 0.97 1 5
• Hotel holds environmental protection awarenessprograms for community. SUS5_ENV 2.37 2 2 0.85 1 5
• Total direct and indirect greenhouse gas emissions aremonitored and managed SUS6_ENV 2.60 2 2 1.00 1 5
• Chemicals especially those in bulk amounts, arestored and handled in accordance with
appropriate standardsSUS7_ENV 2.57 2 2 1.00 1 5
• Organization is aware of, and complies with, relevantlaws and regulations concerning animal welfare SUS8_ENV 2.56 2 2 0.91 1 5
• SMS includes a process for monitoring continuousimprovement in sustainability performance SUS1_ECON 2.55 2 2 0.88 1 5
• Energy used per tourist/night for each type of energyis monitored and managed SUS2_ECON 2.70 3 2 1.03 1 5
•Water saving equipment are regularly maintainedand are efficient SUS3_ECON 2.47 2 2 0.93 1 5
• Equipment and facilities for air quality are monitoredand maintained SUS4_ECON 2.72 3 2 0.94 1 5
• A solid waste management plan is in place SUS5_ECON 2.75 3 2 1.09 1 5
• Organization uses and promotes the usage ofrecyclable water or grey water in other operations
(e.g., watering trees).SUS6_ECON 2.52 2 2 0.93 1 5
While the overall analysis of employees’ perceptions about their hotel’s sustainability behaviorindicated an agreement with the hotels’ sustainability practices; one-way ANOVA test and the posthoc test of Tukey HSD became necessary in order to explore the differences in variables between theirsubgroups as well as other demographic variables.
The result of one-way ANOVA test in Appendix A, Table A1 shows there is significant differencebetween the duration of employment of respondents as indicated by means of variables (i.e., SUS5_SOC,SUS6_SOC, and SUS6_ENV). In addition, Appendix A, Table A2 demonstrates the difference betweengroups of variables with significant and different means. The result of post hoc test of Tukey HSD(Appendix A, Table A2) shows that there is a significant difference for SUS5_SOC variable whencomparing employment for a duration of 1–3 years, and for duration of more than 5 years. So that, themean of employees with duration of more than 5 years is significantly lower than those with 1–3 yearsof employment. For instance, employees with more than 5 years of employment responded, “agree” tothe item: “hotels seek to bring innovative green products and services to their establishments;” whereas, thiswas not the case for employees with less than 5 years of working duration.

Sustainability 2019, 11, 6556 14 of 30
Table 3. Descriptive statistics of Likert scale questions.
Strongly Agree Agree Neutral Disagree Strongly Disagree
Variables Frequency Percent Frequency Percent Frequency Percent Frequency Percent Frequency Percent
SUS1_SOC 31 10.8 150 52.3 71 24.7 26 9.1 9 3.1SUS2_SOC 32 11.1 132 46.0 90 31.4 27 9.4 6 2.1SUS3_SOC 29 10.1 102 35.5 108 37.6 39 13.6 9 3.1SUS4_SOC 31 10.8 103 35.9 108 37.6 37 12.9 8 2.8SUS5_SOC 38 13.2 109 38.0 87 30.3 39 13.6 14 4.9SUS6_SOC 36 12.5 119 41.5 85 29.6 36 12.5 11 3.8
Average SOC 32.8 11.4 119.2 41.5 91.5 31.9 34.0 11.9 9.5 3.3
SUS1_ENV 27 9.4 131 45.6 99 34.5 26 9.1 4 1.4SUS2_ENV 24 8.4 136 47.4 94 32.8 28 9.8 5 1.7SUS3_ENV 34 11.8 146 50.9 85 29.6 20 7.0 2 0.7SUS4_ENV 28 9.8 116 40.4 93 32.4 38 13.2 12 4.2SUS5_ENV 36 12.5 139 48.4 89 31.0 17 5.9 6 2.1SUS6_ENV 28 9.8 127 44.3 79 27.5 39 13.6 14 4.9SUS7_ENV 32 11.1 122 42.5 85 29.6 34 11.8 14 4.9SUS8_ENV 24 8.4 130 45.3 90 31.4 35 12.2 8 2.8
Average ENV 29.1 10.2 130.9 45.6 89.3 31.1 29.6 10.3 8.1 2.8
SUS1_ECON 24 8.4 125 43.6 102 35.5 28 9.8 8 2.8SUS2_ECON 29 10.1 104 36.2 95 33.1 42 14.6 17 5.9SUS3_ECON 35 12.2 127 44.3 86 30.0 32 11.1 7 2.4SUS4_ECON 18 6.3 111 38.7 103 35.9 43 15.0 12 4.2SUS5_ECON 31 10.8 103 35.9 79 27.5 55 19.2 19 6.6SUS6_ECON 33 11.5 117 40.8 101 35.2 26 9.1 10 3.5
Average ECON 28.3 9.9 114.5 39.9 94.3 32.9 37.7 13.1 12.2 4.2
Average 30.0 10.5 122.5 42.7 91.5 31.9 33.4 11.6 9.8 3.4
Note: Range = 1 (Strongly Agree) to 5 (Strongly Disagree).
The result for SUS6_SOC and SUS6_ENV variables is also significantly different for employmentwith duration of 1–3 years and 3–5 years. So that, the mean of duration of employment with 3–5 yearsis significantly lower than those with 1–3 years of employment. For instance, employees with 3–5 yearsemployment duration responded “agree” to the items: “Hotel companies often use eco-labels on packaging,and show them on their corporate websites;” and “total direct and indirect greenhouse gas emissions aremonitored and managed” in compare to the employees with the employment duration of 1–3 years.
This indicates that employees with higher duration of employment tend to express a positiveview about the sustainability practices of their respective hotel. However, employees’ views towardthe reset of the variables does not show significant difference in relation to their employment duration.
The result of one-way ANOVA test in Appendix A, Table A3 shows there is significant differencein employees’ views in relation to their level of education. This can be observed in Appendix A,Table A3 for the following variables (SUS1_ENV, SUS4_ENV, SUS5_ENV, and SUS6_ENV). Appendix A,Table A4 demonstrates the difference between groups of variables with significant and different means.The result of post hoc test of Tukey HSD (Appendix A, Table A4) shows that there is a significantdifference for SUS4_ENV variable when comparing employees’ level of education. So that, the meanfor employees with a “4-year” university education is significantly lower than those without a “4-year”university education. This indicates that employees with at least “4 years” of higher education havemore knowledge and awareness of their organization’s green behavior.
The results for SUS5_ENV and SUS6_ENV variables are also significantly different for employeeswith different level of education. However, for SUS1_ENV variable there is no significant differencebetween groups in relation to the level of education. For instance, employees with university education(i.e., 4-year), expressed their disagreement with the following items: “Hotels seek to bring innovativegreen products and services to market;” and “hotel companies often use eco-labels on packaging, and show themon their corporate websites” compared to the employees with high-school level of education.
Therefore, results indicate that level of education of employees provides them with deeperunderstanding and observation of their organizations green practices, have different believes about thesustainability practices of the hotel which they work for regardless of the subject toward which they
Sustainability 2019, 11, 6556 15 of 30
agree or remain neutral. However, this factor did not show significant difference toward the reset ofvariables in relation to the level of education.
The result of one-way ANOVA test in Appendix A, Table A5 shows there is significant differencein relation to the age of respondents as indicated by means of the following variables (i.e., SUS2_SOC,SUS3_SOC, SUS5_SOC, SUS6_SOC; SUS2_ECON, and SUS4_ECON).
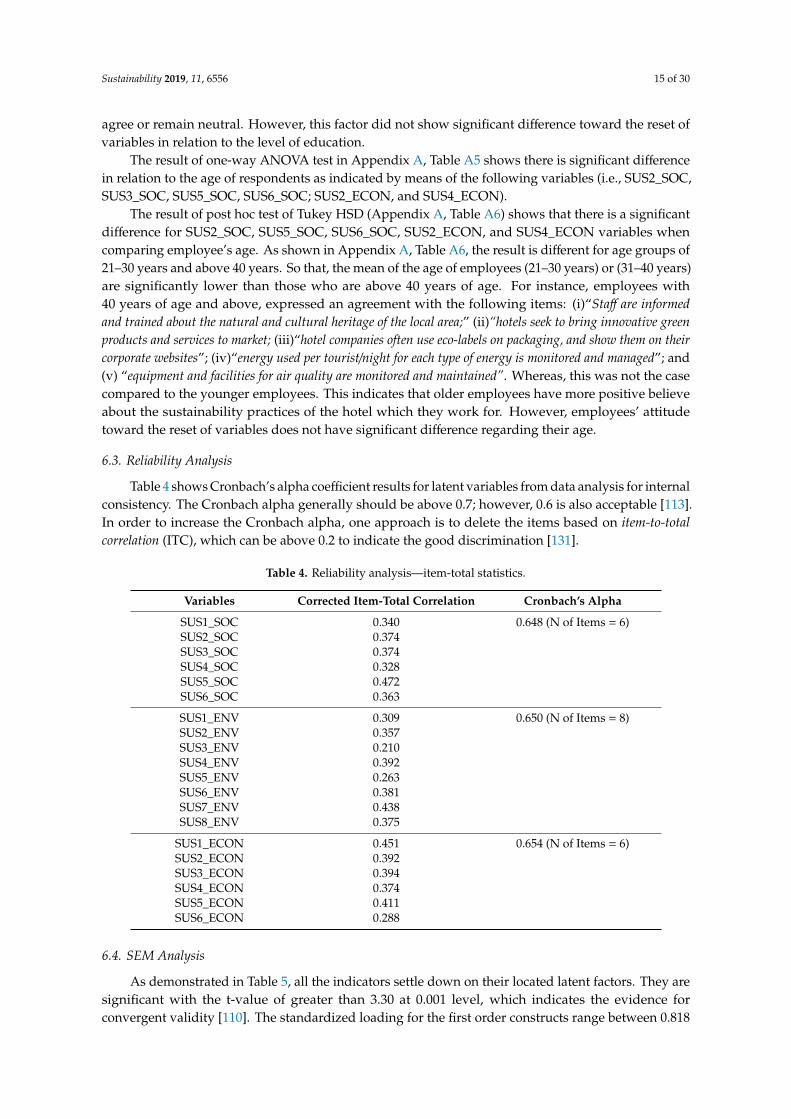
The result of post hoc test of Tukey HSD (Appendix A, Table A6) shows that there is a significantdifference for SUS2_SOC, SUS5_SOC, SUS6_SOC, SUS2_ECON, and SUS4_ECON variables whencomparing employee’s age. As shown in Appendix A, Table A6, the result is different for age groups of21–30 years and above 40 years. So that, the mean of the age of employees (21–30 years) or (31–40 years)are significantly lower than those who are above 40 years of age. For instance, employees with40 years of age and above, expressed an agreement with the following items: (i)“Staff are informedand trained about the natural and cultural heritage of the local area;” (ii)“hotels seek to bring innovative greenproducts and services to market; (iii)“hotel companies often use eco-labels on packaging, and show them on theircorporate websites”; (iv)“energy used per tourist/night for each type of energy is monitored and managed”; and(v) “equipment and facilities for air quality are monitored and maintained”. Whereas, this was not the casecompared to the younger employees. This indicates that older employees have more positive believeabout the sustainability practices of the hotel which they work for. However, employees’ attitudetoward the reset of variables does not have significant difference regarding their age.
6.3. Reliability Analysis
Table 4 shows Cronbach’s alpha coefficient results for latent variables from data analysis for internalconsistency. The Cronbach alpha generally should be above 0.7; however, 0.6 is also acceptable [113].In order to increase the Cronbach alpha, one approach is to delete the items based on item-to-totalcorrelation (ITC), which can be above 0.2 to indicate the good discrimination [131].
Table 4. Reliability analysis—item-total statistics.
Variables Corrected Item-Total Correlation Cronbach’s Alpha
SUS1_SOC 0.340 0.648 (N of Items = 6)SUS2_SOC 0.374SUS3_SOC 0.374SUS4_SOC 0.328SUS5_SOC 0.472SUS6_SOC 0.363
SUS1_ENV 0.309 0.650 (N of Items = 8)SUS2_ENV 0.357SUS3_ENV 0.210SUS4_ENV 0.392SUS5_ENV 0.263SUS6_ENV 0.381SUS7_ENV 0.438SUS8_ENV 0.375
SUS1_ECON 0.451 0.654 (N of Items = 6)SUS2_ECON 0.392SUS3_ECON 0.394SUS4_ECON 0.374SUS5_ECON 0.411SUS6_ECON 0.288
6.4. SEM Analysis
As demonstrated in Table 5, all the indicators settle down on their located latent factors. They aresignificant with the t-value of greater than 3.30 at 0.001 level, which indicates the evidence forconvergent validity [110]. The standardized loading for the first order constructs range between 0.818

Sustainability 2019, 11, 6556 16 of 30
and 0.974, and the R square (R2) values range from 0.670 to 0.949 and above 0.50, which demonstratethat reliability of the model is highly acceptable [109,132].
Table 5. Second-order confirmatory factor analysis (CFA) analysis for overall model.
First- & Second-Order Constructs/Items Unstandardized Loading (B) t-Values
SUS (AVE = 0.803; CR = 0.924; MaxR(H) = 0.960)
SOC (R2 = 0.789; Standardized loading (β) = 0.974)
SUS1_SOC 1.925 5.951 ***SUS2_SOC * 1.000 n/aSUS3_SOC 1.892 5.869 ***SUS4_SOC 1.135 4.815 ***SUS5_SOC 2.369 6.35 ***SUS6_SOC 2.173 6.137 ***
ENV (R2 = 0.949; Standardized loading (β) = 0.888)
SUS1_ENV 1.201 4.482 ***SUS2_ENV 1.438 5.055 ***
SUS3_ENV * 1.000 n/aSUS4_ENV 1.516 4.751 ***
SUS5_ENV † - n/aSUS6_ENV 1.978 5.589 ***SUS7_ENV 2.004 5.471 ***SUS8_ENV 1.579 5.153 ***
ECO (R2 = 0.670; Standardized loading (β) = 0.818)
SUS1_ECON 1.402 5.797 ***SUS2_ECON 1.381 5.216 ***SUS3_ECON 1.602 5.539 ***
SUS4_ECON * 1.000 n/aSUS5_ECON 2.470 6.37 ***SUS6_ECON 1.239 4.435 ***
Note: * fixed parameter; † removed during the CFA; *** p < 0.001.
Furthermore, the results revealed that the composite reliability (CR) and average variance extracted(AVE) values of the second-order construct (overall model) are 0.924 and 0.803, respectively. These valuesexceeded the recommendation values of 0.70 for CR [133], and 0.5 for AVE [134], respectively. The CRand AVE were apprised to evaluate when three determined first-order constructs could demonstratethe second-order construct adequately. Accordingly, the first-order constructs consist of social,environment, and economics are significantly related to the second-order construct- sustainability.
6.5. Goodness-of-Fit Statistics for Overall Model
The results of goodness-of-fit statistics (Table 6) suggested that the overall model obtained a goodfit with three first-order constructs to the observed data. The estimated value of standardized rootmean square residual (SRMR) is 0.07 and less than 0.08, which shows a good fit [135]. One shouldbear in mind that if the value of root mean square error of approximation (RMSEA) is less than 0.05,it demonstrates a good fit; but if it is between 0.05 and 0.08, it can be considered as an adequate(acceptable) fit. Whereas, the value between 0.08 and 0.10, represents a mediocre fit. However, if it isgreater than 0.10 the model is not considered fit [136]. The estimated RMSEA value is 0.076, which canbe considered as an acceptable fit.

Sustainability 2019, 11, 6556 17 of 30
Table 6. Goodness-of-fit statistics for overall model.
Measure Estimate Threshold Interpretation
Chi-square (χ2) of estimate model 341.98 – –Degree of freedom (DF) 136 – –
CMIN/DF 2.515 Between 1 and 3 ExcellentStandardized root mean square residual (SRMR) 0.067 <0.08 Excellent
Root mean square error of approximation (RMSEA) 0.073 <0.06 AcceptableTucker Lewis Index (TLI) 0.749 >0.95 Acceptable
Comparative Fit Index (CFI) 0.801 >0.95 Acceptable *Adjusted goodness-of-fit Index (AGFI) 0.853 >0.80 Excellent
Note: * According to Hu and Bentler [135], when the combination of estimation of CFI or TLI for less than 0.96 andSRMR for greater than 0.06 is obtained for the sample size of more than 250 and less than 500; therefore, it can beconcluded that model is fit. Accordingly, the combination of the estimated values for TLI, CFI, and SRMR show agood fit for the overall model.
The adjusted goodness-of-fit index (AGFI) value of greater than 0.90 is considered to be agood fit [137–139], however, the value of greater than 0.80 is also can be acceptable [111,135,140].The estimated AGFI value is 0.840, which demonstrates a good fit. The common rules for the value ofTucker Lewis index (TLI) [141] and comparative fit index (CFI) [142] is to be greater than 0.90 in orderto show a good fit. However, according to Hu and Bentler [135], when the combination of estimationof CFI or TLI is less than 0.96 and for SRMR greater than 0.6 and the sample size is more than 250 andless than 500, then it can be concluded that the model is a good fit. Accordingly, the combination ofthe estimated values for TLI, CFI, and SRMR show a good fit for the overall model. The chi-squaremeasure regarded as an absolute fit and its estimated ratio (CMIN/DF) of 2.642 indicates that the modelis a good fit [113,143]. Since other indices like goodness of fit index (GFI) [100,144], Hoelter index [111],and normed fit index (NFI) [144,145] are not recommended to use, they are not reported in the table.To sum up, the goodness-of-fit indices and other estimated parameters revealed that the overall modelincluding first- and second-order as well as observed indicators fit the data fairly well.
7. Discussion and Conclusions
This research contributes to the literature by presenting the employee perspective as an assessmentand measurement of the sustainability practices framework in the context of social, environmental, andeconomic dimensions. The rationale for understating the employees’ perception of sustainability practicesin accommodation sector is based on their organic embeddedness in their respective organization. [146],claimed that employees should be “treated as the main asset of the organization” (p. 709). Second,“evidence suggests that employees are centrally important in deploying CSR strategies, but it is equallytrue that the success of strategy implementation is a function of employee perception” [100].
Nowadays, various national and international institutions are pressing organizations to embarkupon and involve in sustainable practices, which has become the most hot and frequently debatedsubject [147]. The outcome of sustainability discourse is abounded; however, sustainability managementas a framework has gained significance because it melds social, economic, and environmentalimperatives. Based on sustainability management framework, hotels (in our case), expected toformulate, implement, and evaluate environmental and socioeconomic sustainability-related decisionsand actions [148]. The role of employees and their perceptions in achieving sustainability goals isexplained by stakeholder theory, which considers employees as “the inner stakeholders.” Employees asstakeholders are also legitimate sources of information regarding the CSR activity in the organizations.As Sharma and Tewari [100] (p. 114) noted, there is a “framework explaining the manner in which theperformance of an organization, society, and environment is affected as a result of the attitude andbehavior stimulated in the employees due to change in their perception toward CSR.”
The main objective of this study was to investigate the sustainability practices of the accommodationsector based on employees’ perspective in order to explore the extent and validity of those practicesthat is usually claimed by this sector. In another words, we assume that employees’ perspective of

Sustainability 2019, 11, 6556 18 of 30
sustainability practices can open a new window to understand whether the sustainability behaviors ofthe hotels are substantive or symbolic (i.e., genuine vs. greenwashing).
Nowadays, “the number of organizations putting the issue of sustainability on strategic agendahas been growing in the past few years. Although sustainable development gains more importance,discussion on measures of sustainability is continuing” [146] (p. 708). The study has been anattempt to investigate and contextualize the sustainability practices in three social, economic, andenvironmental dimensions. To achieve this, indicators from Global Sustainable Tourism Council(GSTC) [38], UN Sustainable Development Goal (SDG) [99], WTO [98], the European Union’s (EU)sustainability framework for the Mediterranean hotels—"Nearly Zero-Energy Hotels” (NEZEH) [42],provided integrated sustainability measurement frameworks.
Most of the studies have researched employees’ perspectives in one-dimensional context; studiesto engage in observing this in three dimensions of sustainability is rarely done. This study willtry to bridge this gap. As emerged from this study, there is no difference in perception regardingthe sustainability practices based on gender. While the respondents were almost equally male andfemale, there was no statistically significant difference between genders in relation to sustainabilitydimensions. Findings revealed that majority of employees agreed that hotels are practicing sustainably,especially, in the areas of economics and environment. However, around one-third of employeeswere neutral in their responses to sustainability practices in their hotels. Interestingly, when the ageis factored in, older employees with longer duration of employment in the same hotel expressed anagreement with sustainability practices of their hotels. In the meantime, the “star” of hotels did notmake any difference and did not play a role in the responses and results. Nevertheless, the results ofthis study are in line with the findings of M. Wiernik et al. [149], and Sharma and Tewari [100], whosestudies are a validation of employees as stakeholders and the source of awareness/knowledge aboutorganizations’ sustainability practices. Result also showed that employees with higher education havebetter understandings of sustainability practices. In our study, we can conclude that managers arestrongly committed to sustainability practices. This is also in line with the trend that green practicesare beneficial for hotels as they want to develop a brand, as well as tap on the green customersmarket [74,80,150].
As the aim of this study is to confirm that the constructs of the proposed model (sustainability) loadinto the underlying sub-constructs (social, economic, and environment), the second-order confirmatoryfactor analysis (CFA) results show that the overall model including first- and second-order as wellas observed indicators fit the data fairly well. This confirmed the hotels’ claim that their operationis involved in sustainability practices and are determined to follow the green agenda. Therefore,understanding employees’ perception is a relevant and legitimate source to investigate organizations’sustainable practices knowing the fact that employees are an organic part of the organizational structure,as well as its main asset.
Findings of this study is echoing previous studies that going green and practicing sustainabilityby hotel sector has come about because of green-conscious customers who are willing to pay higherprices for green products/services [76]. In the case of north Cyprus, the situation is strongly influencedby international demand, especially European clients who are frequent visitors. “In this respect, oneway to increase the quality of tourist product is to include sustainability measures to attract newmarkets” [80] (p. 1416). This study is also in consonant with findings of studies by Robin, Pedroche,and Astorga [80], and Wu, Thongma, Leelapattana, and Huang [95], who revealed that sustainabilitypractices in hotels has become a management tool to achieve quality performance and efficiency.
The analysis revealed that the sampled hotel’s sustainability practices transpired on threedimensions—social, environmental, and economic. Such findings emanated based on employee’sperception of hotel’s green behavior, “given that employees carry the main burden of responsibility forimplementing ethical corporate behavior and are often the face of the organization’s CSR program [151](p. 268), knowing that “CSR programs rooted in sustainable development” [152] (p. 85).

Sustainability 2019, 11, 6556 19 of 30
Nowadays going green and practicing sustainability has become a significant part of hotels’strategy in terms of marketing, brand development, competitiveness, and cost cutting associatedwith waste disposal and material usage [153]. This aspect of hotel’s sustainability practice is abusiness-oriented approach. Coupled with the business behavior of going green is the CSR aspect,which is rooted in sustainability and incorporated in the hotels’ strategy. The CSR aspect is engenderedby global environmental movement that has become “the driving factors for hotel operators to becomecompetitive in minimizing and eliminating their operation [externalities] on the environment” (ascited in [153], p. 226). Furthermore, “environmentally friendly hotel,” an “eco-friendly hotel,” ora “sustainable hotel” has become a buzzword within the global tourism system. For instance, “theRitz-Carlton, Kuala Lumpur, joined the annual global environmental awareness event created by theWorld Wildlife Fund to highlight the threat of climate change” [150] (p. 3). Our study revealed thathotels in north Cyprus are not in isolation from the global movements and demands.
Regarding the first research question, managers’ commitment to sustainability is rationalized andunderstandable from business point of view and in the context of CSR as discussed earlier. The secondresearch question verified through employee’s positive validation of sustainability practices on social,environmental, and economic dimensions. Study revealed that hotels have strategized sustainability;however, a precise measurement of realization of each aspect of the strategy can be quantified as atopic for future research. In terms of methodologies that hotels apply to measure their progress towardachieving sustainable practice; again, this item can be observed through for example the applicationof solar system or landscape area; however, the precise weight and volume requires a mathematicalanalysis as a pathway for future research.
8. Research Contributions and Future Studies
Overall, the research contributes to new insights for understanding the concept of sustainabilityand how it is practiced, as well as the extent of those practices in accommodation sector. First, theresearch deepens understanding of the sustainability practices from the perspective of the employees.Second, this study transcends the role of employees in sustainability practices or their awareness ofsustainability. This study assumed that employees are the legitimate assets of the accommodationsector and have legitimacy to judge on how their organizations are behaving regarding sustainabilityprinciples. Employees have the knowledge to issue a verdict on hotels sustainability practice whetheris genuine or greenwash. Furthermore, the research provides hotels with a legitimate referenceto rethink their sustainability practices, and be aware that greenwashing cannot camouflage theirbehavior for long. This study might be a benchmark for sustainability practice assessment by thehotels to reevaluate their behavior and overcome their lacking in the tourism market. Even thoughthis study explored certain findings in this case, future research can investigate why employees are alegitimate source of and organic reservoir in the accommodation sector when it comes to revealing thesustainability practices.
9. Limitations
There are certain limitations that need consideration. Data was collected from 4- and 5-star hotels;other accommodation sectors should be investigated and compared. Although the findings of thisstudy provide some insights into the accommodation sector in one city, it can be expanded to otherlocations as well. Future studies can also increase the sample size, especially in cases where tourism isa dominant activity.
Author Contributions: Conceptualization and literature review, H.A. and A.S.; survey execution, A.S.;methodology and analysis, F.S. and H.A.; review and editing, H.A.
Funding: This research received no external funding.
Conflicts of Interest: The authors declare no conflict of interest.

Sustainability 2019, 11, 6556 20 of 30
Appendix A
Table A1. Comparing means of all the variables and duration of employment.
Sum of Squares df Mean Square F Sig.
SUS1_SOCBetween Groups 0.168 3 0.056 0.067 0.977Within Groups 237.490 283 0.839
SUS2_SOCBetween Groups 2.264 3 0.755 0.958 0.413Within Groups 222.851 283 0.787
SUS3_SOCBetween Groups 2.527 3 0.842 0.940 0.422Within Groups 253.508 283 0.896
SUS4_SOCBetween Groups 4.046 3 1.349 1.537 0.205Within Groups 248.247 283 0.877
SUS5_SOCBetween Groups 10.526 3 3.509 3.344 0.020 *Within Groups 296.958 283 1.049
SUS6_SOCBetween Groups 8.596 3 2.865 2.973 0.032 *Within Groups 272.770 283 0.964
SUS1_ENVBetween Groups 0.765 3 0.255 0.359 0.783Within Groups 200.789 283 0.710
SUS2_ENVBetween Groups 0.438 3 0.146 0.201 0.896Within Groups 205.290 283 0.725
SUS3_ENVBetween Groups 1.222 3 0.407 0.630 0.596Within Groups 182.994 283 0.647
SUS4_ENVBetween Groups 0.643 3 0.214 0.224 0.880Within Groups 271.197 283 0.958
SUS5_ENVBetween Groups 1.637 3 0.546 0.746 0.525Within Groups 206.948 283 0.731
SUS6_ENVBetween Groups 8.566 3 2.855 2.901 0.035 *Within Groups 278.549 283 0.984
SUS7_ENVBetween Groups 0.935 3 0.312 0.309 0.819Within Groups 285.490 283 1.009
SUS8_ENVBetween Groups 1.263 3 0.421 0.506 0.679Within Groups 235.538 283 0.832
SUS1_ECONBetween Groups 2.520 3 0.840 1.078 0.359Within Groups 220.497 283 0.779
SUS2_ECONBetween Groups 1.759 3 0.586 0.549 0.650Within Groups 302.471 283 1.069
SUS3_ECONBetween Groups 2.345 3 0.782 0.902 0.440Within Groups 245.209 283 0.866
SUS4_ECONBetween Groups 0.795 3 0.265 0.299 0.826Within Groups 250.905 283 0.887
SUS5_ECONBetween Groups 0.301 3 0.100 0.084 0.969Within Groups 339.636 283 1.200
SUS6_ECONBetween Groups 0.981 3 0.327 0.372 0.773Within Groups 248.622 283 0.879
*. The mean difference is significant at the p ≤ 0.05 level.; Note: df (Degree of freedom); F (F test); Sig. (Significance).

Sustainability 2019, 11, 6556 21 of 30
Table A2. Tukey HSD post hoc test for duration of employment and other significant variables.
Dependent Variable MeanDifference Std. Error Sig.
90% Confidence Interval
Lower Bound Upper Bound
SUS5_SOC
less than ayear
1–3 years −0.283 0.272 0.727 −0.91 0.343–5 years 0.039 0.258 0.999 −0.56 0.63
more than 5 years 0.257 0.268 0.773 −0.36 0.87
1–3 yearsless than a year 0.283 0.272 0.727 −0.34 0.91
3–5 years 0.321 0.156 0.169 −0.04 0.68more than 5 years 0.540 0.171 0.009 *** 0.15 0.93
3–5 yearsless than a year −0.039 0.258 0.999 −0.63 0.56
1–3 years −0.321 0.156 0.169 −0.68 0.04more than 5 years 0.218 0.147 0.451 −0.12 0.56
more than5 years
less than a year −0.257 0.268 0.773 −0.87 0.361–3 years −0.540 0.171 0.009 *** −0.93 −0.153–5 years −0.218 0.147 0.451 −0.56 0.12
SUS6_SOC
less than ayear
1–3 years −0.293 0.261 0.676 −0.89 0.313–5 years 0.128 0.248 0.955 −0.44 0.70
more than 5 years 0.113 0.256 0.972 −0.48 0.70
1–3 yearsless than a year 0.293 0.261 0.676 −0.31 0.89
3–5 years 0.421 0.150 0.027 ** 0.08 0.77more than 5 years 0.405 0.164 0.066 0.03 0.78
3–5 yearsless than a year −0.128 0.248 0.955 −0.70 0.44
1–3 years −0.421 0.150 0.027 ** −0.77 −0.08more than 5 years −0.016 0.141 1.000 −0.34 0.31
more than5 years
less than a year −0.113 0.256 0.972 −0.70 0.481–3 years −0.405 0.164 0.066 −0.78 -0.033–5 years 0.016 0.141 1.000 −0.31 0.34
SUS6_ENV
less than ayear
1–3 years −0.061 0.264 0.996 −0.67 0.553–5 years −0.449 0.250 0.278 −1.02 0.13
more than 5 years −0.198 0.259 0.870 −0.79 0.40
1–3 yearsless than a year 0.061 0.264 0.996 −0.55 0.67
3–5 years −0.388 0.151 0.052 * −0.74 −0.04more than 5 years −0.138 0.165 0.839 −0.52 0.24
3–5 yearsless than a year 0.449 0.250 0.278 −0.13 1.02
1–3 years 0.388 0.151 0.052 * 0.04 0.74more than 5 years 0.251 0.143 0.298 −0.08 0.58
more than5 years
less than a year 0.198 0.259 0.870 −0.40 0.791–3 years 0.138 0.165 0.839 −0.24 0.523–5 years −0.251 0.143 0.298 −0.58 0.08
*. The mean difference is significant at the p ≤ 0.1 level; **. The mean difference is significant at the p ≤ 0.05 level;***. The mean difference is significant at the p ≤ 0.01 level. Note: Std.Error (Standard error); Sig. (Significance).
Table A3. Comparing means of all the variables and level of education.
Sum of Squares df Mean Square F Sig.
SUS1_SOCBetween Groups 4.091 3 1.364 1.652 0.178Within Groups 233.568 283 0.825
SUS2_SOCBetween Groups 1.376 3 0.459 0.580 0.629Within Groups 223.739 283 0.791
SUS3_SOCBetween Groups 4.064 3 1.355 1.521 0.209Within Groups 251.971 283 0.890
SUS4_SOCBetween Groups 1.528 3 0.509 0.575 0.632Within Groups 250.765 283 0.886
SUS5_SOCBetween Groups 2.708 3 0.903 0.838 0.474Within Groups 304.776 283 1.077
SUS6_SOCBetween Groups 4.403 3 1.468 1.500 0.215Within Groups 276.963 283 0.979
SUS1_ENVBetween Groups 4.456 3 1.485 2.133 0.096 *Within Groups 197.098 283 0.696
SUS2_ENVBetween Groups 0.935 3 0.312 0.430 0.731Within Groups 204.794 283 0.724
SUS3_ENVBetween Groups 1.639 3 0.546 0.847 0.469Within Groups 182.577 283 0.645
SUS4_ENVBetween Groups 8.398 3 2.799 3.007 0.031 **Within Groups 263.442 283 0.931
SUS5_ENVBetween Groups 5.718 3 1.906 2.659 0.049 **Within Groups 202.867 283 0.717

Sustainability 2019, 11, 6556 22 of 30
Table A3. Cont.
Sum of Squares df Mean Square F Sig.
SUS6_ENVBetween Groups 7.150 3 2.383 2.409 0.067 *Within Groups 279.965 283 0.989
SUS7_ENVBetween Groups 4.906 3 1.635 1.644 0.179Within Groups 281.519 283 0.995
SUS8_ENVBetween Groups 0.380 3 0.127 0.152 0.929Within Groups 236.421 283 0.835
SUS1_ECONBetween Groups 2.209 3 0.736 0.944 0.420Within Groups 220.808 283 0.780
SUS2_ECONBetween Groups 3.303 3 1.101 1.035 0.377Within Groups 300.927 283 1.063
SUS3_ECONBetween Groups 4.296 3 1.432 1.666 0.175Within Groups 243.258 283 0.860
SUS4_ECONBetween Groups 1.839 3 0.613 0.694 0.556Within Groups 249.861 283 0.883
SUS5_ECONBetween Groups 5.118 3 1.706 1.442 0.231Within Groups 334.820 283 1.183
SUS6_ECONBetween Groups 0.091 3 0.030 0.034 0.991Within Groups 249.512 283 0.882
*. The mean difference is significant at the p ≤ 0.1 level; **. The mean difference is significant at the p ≤ 0.05 level.Note: df (Degree of freedom); F (F test); Sig. (Significance).
Table A4. Tukey HSD post hoc test for education level of employee and other significant variables.
Dependent Variable MeanDifference Std. Error Sig.
90% Confidence Interval
Lower Bound Upper Bound
SUS4_ENV
highschool
college −0.264 0.217 0.616 −0.76 0.244-year university 0.122 0.206 0.934 −0.35 0.60
M.Sc. or PhD 0.115 0.251 0.968 −0.46 0.69
collegehigh school 0.264 0.217 0.616 −0.24 0.76
4-year university 0.386 0.133 0.020 ** 0.08 0.69M.Sc. or PhD 0.380 0.196 0.217 −0.07 0.83
4-yearuniversity
high school −0.122 0.206 0.934 −0.60 0.35college −0.386 0.133 0.020 ** −0.69 -0.08
M.Sc. or PhD −0.007 0.184 1.000 −0.43 0.42
M.Sc. orPhD
high school −0.115 0.251 0.968 −0.69 0.46college −0.380 0.196 0.217 −0.83 0.07
4-year university 0.007 0.184 1.000 −0.42 0.43
SUS5_ENV
highschool
college −0.227 0.190 0.633 −0.66 0.214-year university −0.448 0.180 0.065 * −0.86 -0.03
M.Sc. or PhD −0.314 0.221 0.484 −0.82 0.19
collegehigh school 0.227 0.190 0.633 −0.21 0.66
4-year university −0.221 0.117 0.233 −0.49 0.05M.Sc. or PhD −0.088 0.172 0.957 −0.48 0.31
4-yearuniversity
high school 0.448 0.180 0.065 * 0.03 0.86college 0.221 0.117 0.233 −0.05 0.49
M.Sc. or PhD 0.133 0.161 0.843 −0.24 0.50
M.Sc. orPhD
high school 0.314 0.221 0.484 −0.19 0.82college 0.088 0.172 0.957 −0.31 0.48
4-year university −0.133 0.161 0.843 −0.50 0.24
SUS6_ENV
highschool
college −0.463 0.224 0.165 −0.98 0.054-year university −0.565 0.212 0.040 ** −1.05 -0.08
M.Sc. or PhD −0.532 0.259 0.172 −1.13 0.06
collegehigh school 0.463 0.224 0.165 −0.05 0.98
4-year university −0.102 0.137 0.878 −0.42 0.21M.Sc. or PhD −0.069 0.203 0.987 −0.53 0.40
4-yearuniversity
high school 0.565 0.212 0.040 ** 0.08 1.05college 0.102 0.137 0.878 −0.21 0.42
M.Sc. or PhD 0.033 0.190 0.998 −0.40 0.47
M.Sc. orPhD
high school 0.532 0.259 0.172 −0.06 1.13college 0.069 0.203 0.987 −0.40 0.53
4-year university −0.033 0.190 0.998 −0.47 0.40
*. The mean difference is significant at the p ≤ 0.1 level; **. The mean difference is significant at the p ≤ 0.05 level.Note: Std.Error (Standard error); Sig. (Significance).

Sustainability 2019, 11, 6556 23 of 30
Table A5. Comparing means of all the variables and age of employee.
Sum of Squares df Mean Square F Sig.
SUS1_SOCBetween Groups 3.825 3 1.275 1.543 0.204Within Groups 233.833 283 0.826
SUS2_SOCBetween Groups 6.514 3 2.171 2.811 0.040 **Within Groups 218.601 283 0.772
SUS3_SOCBetween Groups 9.967 3 3.322 3.821 0.010 **Within Groups 246.067 283 0.869
SUS4_SOCBetween Groups 0.715 3 0.238 0.268 0.848Within Groups 251.577 283 0.889
SUS5_SOCBetween Groups 12.824 3 4.275 4.106 0.007 ***Within Groups 294.660 283 1.041
SUS6_SOCBetween Groups 12.904 3 4.301 4.534 0.004 ***Within Groups 268.462 283 0.949
SUS1_ENVBetween Groups 2.408 3 0.803 1.140 0.333Within Groups 199.146 283 0.704
SUS2_ENVBetween Groups 0.494 3 0.165 0.227 0.878Within Groups 205.234 283 0.725
SUS3_ENVBetween Groups 2.394 3 0.798 1.242 0.295Within Groups 181.822 283 0.642
SUS4_ENVBetween Groups 2.465 3 0.822 0.863 0.461Within Groups 269.375 283 0.952
SUS5_ENVBetween Groups 1.835 3 0.612 0.837 0.474Within Groups 206.750 283 0.731
SUS6_ENVBetween Groups 4.865 3 1.622 1.626 0.184Within Groups 282.250 283 0.997
SUS7_ENVBetween Groups 3.868 3 1.289 1.291 0.278Within Groups 282.557 283 0.998
SUS8_ENVBetween Groups 3.963 3 1.321 1.606 0.188Within Groups 232.838 283 0.823
SUS1_ECONBetween Groups 1.617 3 0.539 0.689 0.560Within Groups 221.401 283 0.782
SUS2_ECONBetween Groups 9.588 3 3.196 3.070 0.028 **Within Groups 294.642 283 1.041
SUS3_ECONBetween Groups 0.138 3 0.046 0.053 0.984Within Groups 247.416 283 0.874
SUS4_ECONBetween Groups 9.343 3 3.114 3.637 0.013 **Within Groups 242.357 283 0.856
SUS5_ECONBetween Groups 3.955 3 1.318 1.110 0.345Within Groups 335.982 283 1.187
SUS6_ECONBetween Groups 0.962 3 0.321 0.365 0.778Within Groups 248.641 283 0.879
*. The mean difference is significant at the p ≤ 0.1 level; **. The mean difference is significant at the p ≤ 0.05 level;***. The mean difference is significant at the P ≤ 0.01 level. Note: df (Degree of freedom); F (F test); Sig. (Significance).
Table A6. Tukey HSD post hoc test for age of employee and other significant variables.
Dependent Variable MeanDifference Std. Error Sig.
90% Confidence Interval
Lower Bound Upper Bound
SUS2_SOC
under 2021–30 0.030 0.196 0.999 −0.42 0.4831–40 0.157 0.180 0.818 −0.26 0.57
above 40 0.454 0.202 0.114 −0.01 0.92
21–30under 20 −0.030 0.196 0.999 −0.48 0.42
31–40 0.127 0.132 0.769 −0.18 0.43above 40 0.424 0.161 0.044 ** 0.05 0.80
31–40under 20 −0.157 0.180 0.818 −0.57 0.26
21–30 −0.127 0.132 0.769 −0.43 0.18above 40 0.297 0.141 0.154 −0.03 0.62
above 40under 20 −0.454 0.202 0.114 −0.92 0.01
21–30 −0.424 0.161 0.044 ** −0.80 −0.0531–40 −0.297 0.141 0.154 −0.62 0.03
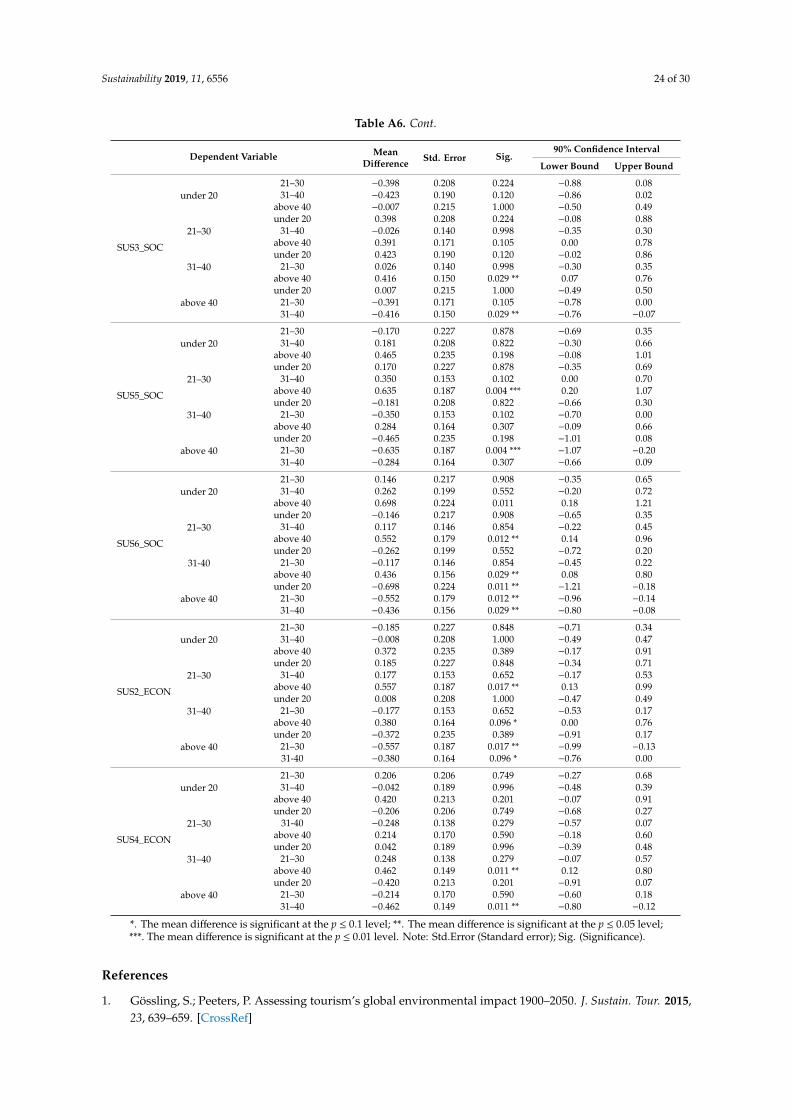
Sustainability 2019, 11, 6556 24 of 30
Table A6. Cont.
Dependent Variable MeanDifference Std. Error Sig.
90% Confidence Interval
Lower Bound Upper Bound
SUS3_SOC
under 2021–30 −0.398 0.208 0.224 −0.88 0.0831–40 −0.423 0.190 0.120 −0.86 0.02
above 40 −0.007 0.215 1.000 −0.50 0.49
21–30under 20 0.398 0.208 0.224 −0.08 0.88
31–40 −0.026 0.140 0.998 −0.35 0.30above 40 0.391 0.171 0.105 0.00 0.78
31–40under 20 0.423 0.190 0.120 −0.02 0.86
21–30 0.026 0.140 0.998 −0.30 0.35above 40 0.416 0.150 0.029 ** 0.07 0.76
above 40under 20 0.007 0.215 1.000 −0.49 0.50
21–30 −0.391 0.171 0.105 −0.78 0.0031–40 −0.416 0.150 0.029 ** −0.76 −0.07
SUS5_SOC
under 2021–30 −0.170 0.227 0.878 −0.69 0.3531–40 0.181 0.208 0.822 −0.30 0.66
above 40 0.465 0.235 0.198 −0.08 1.01
21–30under 20 0.170 0.227 0.878 −0.35 0.69
31–40 0.350 0.153 0.102 0.00 0.70above 40 0.635 0.187 0.004 *** 0.20 1.07
31–40under 20 −0.181 0.208 0.822 −0.66 0.30
21–30 −0.350 0.153 0.102 −0.70 0.00above 40 0.284 0.164 0.307 −0.09 0.66
above 40under 20 −0.465 0.235 0.198 −1.01 0.08
21–30 −0.635 0.187 0.004 *** −1.07 −0.2031–40 −0.284 0.164 0.307 −0.66 0.09
SUS6_SOC
under 2021–30 0.146 0.217 0.908 −0.35 0.6531–40 0.262 0.199 0.552 −0.20 0.72
above 40 0.698 0.224 0.011 0.18 1.21
21–30under 20 −0.146 0.217 0.908 −0.65 0.35
31–40 0.117 0.146 0.854 −0.22 0.45above 40 0.552 0.179 0.012 ** 0.14 0.96
31-40under 20 −0.262 0.199 0.552 −0.72 0.20
21–30 −0.117 0.146 0.854 −0.45 0.22above 40 0.436 0.156 0.029 ** 0.08 0.80
above 40under 20 −0.698 0.224 0.011 ** −1.21 −0.18
21–30 −0.552 0.179 0.012 ** −0.96 −0.1431–40 −0.436 0.156 0.029 ** −0.80 −0.08
SUS2_ECON
under 2021–30 −0.185 0.227 0.848 −0.71 0.3431–40 −0.008 0.208 1.000 −0.49 0.47
above 40 0.372 0.235 0.389 −0.17 0.91
21–30under 20 0.185 0.227 0.848 −0.34 0.71
31–40 0.177 0.153 0.652 −0.17 0.53above 40 0.557 0.187 0.017 ** 0.13 0.99
31–40under 20 0.008 0.208 1.000 −0.47 0.49
21–30 −0.177 0.153 0.652 −0.53 0.17above 40 0.380 0.164 0.096 * 0.00 0.76
above 40under 20 −0.372 0.235 0.389 −0.91 0.17
21–30 −0.557 0.187 0.017 ** −0.99 −0.1331-40 −0.380 0.164 0.096 * −0.76 0.00
SUS4_ECON
under 2021–30 0.206 0.206 0.749 −0.27 0.6831–40 −0.042 0.189 0.996 −0.48 0.39
above 40 0.420 0.213 0.201 −0.07 0.91
21–30under 20 −0.206 0.206 0.749 −0.68 0.27
31-40 −0.248 0.138 0.279 −0.57 0.07above 40 0.214 0.170 0.590 −0.18 0.60
31–40under 20 0.042 0.189 0.996 −0.39 0.48
21–30 0.248 0.138 0.279 −0.07 0.57above 40 0.462 0.149 0.011 ** 0.12 0.80
above 40under 20 −0.420 0.213 0.201 −0.91 0.07
21–30 −0.214 0.170 0.590 −0.60 0.1831–40 −0.462 0.149 0.011 ** −0.80 −0.12
*. The mean difference is significant at the p ≤ 0.1 level; **. The mean difference is significant at the p ≤ 0.05 level;***. The mean difference is significant at the p ≤ 0.01 level. Note: Std.Error (Standard error); Sig. (Significance).
References
1. Gössling, S.; Peeters, P. Assessing tourism’s global environmental impact 1900–2050. J. Sustain. Tour. 2015,23, 639–659. [CrossRef]

Sustainability 2019, 11, 6556 25 of 30
2. Saarinen, J.; Gill, A.M. Resilient Destinations and Tourism: Governance Strategies in the Transition TowardsSustainability in Tourism; Routledge: Abingdon, UK, 2018.
3. Morrison-Saunders, A.; Hughes, M.; Pope, J.; Douglas, A.; Wessels, J.-A. Understanding visitor expectationsfor responsible tourism in an iconic national park: Differences between local and international visitors.J. Ecotourism 2019, 18, 1–11. [CrossRef]
4. Cavaco, S.; Crifo, P. CSR and financial performance: Complementarity between environmental, social andbusiness behaviours. Appl. Econ. 2014, 46, 3323–3338. [CrossRef]
5. Abounit, S.; Bousset, L.; Loria, F.; Zhu, S.; de Chaumont, F.; Pieri, L.; Olivo-Marin, J.C.; Melki, R.; Zurzolo, C.Tunneling nanotubes spread fibrillar α-synuclein by intercellular trafficking of lysosomes. EMBO J. 2016, 35,2120–2138. [CrossRef] [PubMed]
6. De Grosbois, D.; Fennell, D. Carbon footprint of the global hotel companies: Comparison of methodologiesand results. Tour. Recreat. Res. 2011, 36, 231–245. [CrossRef]
7. (MET) Ministry of Tourism and Environment. Statistical Year Book (2016); MET: Nicosia, Cyprus, 2017.8. Cavusoglu, B. Knowledge economy and North Cyprus. Procedia Econ. Financ. 2016, 39, 720–724. [CrossRef]9. Butler, R.W. Sustainable tourism: A state-of-the-art review. Tour. Geogr. 1999, 1, 7–25. [CrossRef]10. Butler, R.W. The concept of a tourist area cycle of evolution: Implications for management of resources.
Can. Geogr./Le Géographe Can. 1980, 24, 5–12. [CrossRef]11. Kara, C. Sustinable Tourism Development in Small Island Developing States. Turkish Republic of Northern
Cyprus (TRNC) As A Case Study. Master’s Thesis, Izmir Insitute of Technology, Urla/Izmir, Turkey, 2003.12. do Paço, A.; Shiel, C.; Alves, H. A new model for testing green consumer behaviour. J. Clean. Prod. 2019, 207,
998–1006. [CrossRef]13. Yeh, S.-S.; Ma, T.; Huan, T.-C. Building social entrepreneurship for the hotel industry by promoting
environmental education. Int. J. Contemp. Hosp. Manag. 2016, 28, 1204–1224. [CrossRef]14. Rahman, I.; Reynolds, D. Predicting green hotel behavioral intentions using a theory of environmental
commitment and sacrifice for the environment. Int. J. Hosp. Manag. 2016, 52, 107–116. [CrossRef]15. Fatma, M.; Rahman, Z.; Khan, I. Measuring consumer perception of CSR in tourism industry: Scale
development and validation. J. Hosp. Tour. Manag. 2016, 27, 39–48. [CrossRef]16. Rahman, I.; Reynolds, D. The influence of values and attitudes on green consumer behavior: A conceptual
model of green hotel patronage. Int. J. Hosp. Tour. Adm. 2019, 20, 47–74. [CrossRef]17. Njite, D.; Schaffer, J. Revisiting attributes: How important is green in the consumer selection of hotel rooms?
Int. J. Hosp. Tour. Adm. 2017, 18, 219–244. [CrossRef]18. Chan, E.S.-W. Green marketing: Hotel customers’ perspective. J. Travel Tour. Mark. 2014, 31, 915–936. [CrossRef]19. Weir, B. Climate change and tourism–Are we forgetting lessons from the past? J. Hosp. Tour. Manag. 2017, 32,
108–114. [CrossRef]20. Drius, M.; Bongiorni, L.; Depellegrin, D.; Menegon, S.; Pugnetti, A.; Stifter, S. Tackling challenges for
Mediterranean sustainable coastal tourism: An ecosystem service perspective. Sci. Total Environ. 2019, 652,1302–1317. [CrossRef]
21. Iraldo, F.; Testa, F.; Lanzini, P.; Battaglia, M. Greening competitiveness for hotels and restaurants. J. Small Bus.Enterp. Dev. 2017, 24, 607–628. [CrossRef]
22. Azarmi, S.; Oladipo, A.; Vaziri, R.; Alipour, H. Comparative Modelling and Artificial Neural Network InspiredPrediction of Waste Generation Rates of Hospitality Industry: The Case of North Cyprus. Sustainability 2018,10, 2965. [CrossRef]
23. Weaver, D.; Davidson, M.C.; Lawton, L.; Patiar, A.; Reid, S.; Johnston, N. Awarding sustainable Asia-Pacifichotel practices: Rewarding innovative practices or open rhetoric? Tour. Recreat. Res. 2013, 38, 15–28. [CrossRef]
24. Chen, H.; Bernard, S.; Rahman, I. Greenwashing in hotels: A structural model of trust and behavioralintentions. J. Clean. Prod. 2019, 206, 326–335. [CrossRef]
25. Pizam, A. Green hotels: A fad, ploy or fact of life? Int. J. Hosp. Manag. 2009, 1, 1. [CrossRef]26. Higgins-Desbiolles, F. Justice tourism and alternative globalisation. J. Sustain. Tour. 2008, 16, 345–364. [CrossRef]27. Musavengane, R. Small hotels and Responsible Tourism Practice: Hoteliers’ perspectives. J. Clean. Prod.
2019, 220, 786–799. [CrossRef]28. Yadav, R.; Balaji, M.; Jebarajakirthy, C. How psychological and contextual factors contribute to travelers’
propensity to choose green hotels? Int. J. Hosp. Manag. 2019, 77, 385–395. [CrossRef]
Sustainability 2019, 11, 6556 26 of 30
29. Choi, H.; Jang, J.; Kandampully, J. Application of the extended VBN theory to understand consumers’decisions about green hotels. Int. J. Hosp. Manag. 2015, 51, 87–95. [CrossRef]
30. WCED, S.W.S. World commission on environment and development. Our Common Future 1987, 17, 1–91.31. Harris, J.M.; Goodwin, N.R. Reconciling Growth and the Environment; Tufts University: Medford, MA,
USA, 2003.32. Slaper, T.F.; Hall, T.J. The triple bottom line: What is it and how does it work. Indiana Bus. Rev. 2011, 86, 4–8.33. Toelkes, C. Sustainability communication in tourism–A literature review. Tour. Manag. Perspect. 2018, 27,
10–21. [CrossRef]34. Gunce, E. Tourism and local attitudes in Girne, Northern Cyprus. Cities 2003, 20, 181–195. [CrossRef]35. Papadas, K.-K.; Avlonitis, G.J.; Carrigan, M. Green marketing orientation: Conceptualization, scale
development and validation. J. Bus. Res. 2017, 80, 236–246. [CrossRef]36. Zielinski, S.; Botero, C. Are eco-labels sustainable? Beach certification schemes in Latin America and the
Caribbean. J. Sustain. Tour. 2015, 23, 1550–1572. [CrossRef]37. Nguyen, T.N.; Lobo, A.; Greenland, S. Pro-environmental purchase behaviour: The role of consumers’
biospheric values. J. Retail. Consum. Serv. 2016, 33, 98–108. [CrossRef]38. GSTC (Global Sustainable Tourism Council). Global Sustainable Tourism Criteria for Hotels and Tour Operators;
Global Sustainable Tourism Council: Washington, DC, USA, 2013.39. Dangelico, R.M.; Vocalelli, D. “Green Marketing”: An analysis of definitions, strategy steps, and tools
through a systematic review of the literature. J. Clean. Prod. 2017, 165, 1263–1279. [CrossRef]40. Papadas, K.-K.; Avlonitis, G.J.; Carrigan, M.; Piha, L. The interplay of strategic and internal green marketing
orientation on competitive advantage. J. Bus. Res. 2019, 104, 632–643. [CrossRef]41. Jamrozy, U. Marketing of tourism: A paradigm shift toward sustainability. Int. J. Cult. Tour. Hosp. Res. 2007,
1, 117–130. [CrossRef]42. Tsoutsos, T.; Tournaki, S.; de Santos, C.A.; Vercellotti, R. Nearly zero energy buildings application in
Mediterranean hotels. Energy Procedia 2013, 42, 230–238. [CrossRef]43. Kularatne, T.; Wilson, C.; Månsson, J.; Hoang, V.; Lee, B. Do environmentally sustainable practices make
hotels more efficient? A study of major hotels in Sri Lanka. Tour. Manag. 2019, 71, 213–225. [CrossRef]44. Kostakis, I.; Sardianou, E. Which factors affect the willingness of tourists to pay for renewable energy?
Renew. Energy 2012, 38, 169–172. [CrossRef]45. Bergin-Seers, S.; Mair, J. Emerging green tourists in Australia: Their behaviours and attitudes. Tour. Hosp. Res.
2009, 9, 109–119. [CrossRef]46. Dolnicar, S.; Matus, K. Are green tourists a managerially useful target segment? J. Hosp. Leis. Mark. 2008, 17,
314–334. [CrossRef]47. Verma, V.K.; Chandra, B.; Kumar, S. Values and ascribed responsibility to predict consumers’ attitude and
concern towards green hotel visit intention. J. Bus. Res. 2019, 96, 206–216. [CrossRef]48. Berezan, O.; Raab, C.; Yoo, M.; Love, C. Sustainable hotel practices and nationality: The impact on guest
satisfaction and guest intention to return. Int. J. Hosp. Manag. 2013, 34, 227–233. [CrossRef]49. Tzschentke, N.A.; Kirk, D.; Lynch, P.A. Going green: Decisional factors in small hospitality operations. Int. J.
Hosp. Manag. 2008, 27, 126–133. [CrossRef]50. Schlosberg, D. Theorising environmental justice: The expanding sphere of a discourse. Environ. Politics 2013,
22, 37–55. [CrossRef]51. Clarke, J. A framework of approaches to sustainable tourism. J. Sustain. Tour. 1997, 5, 224–233. [CrossRef]52. Tang, Z.; Shang, J.; Shi, C.; Liu, Z.; Bi, K. Decoupling indicators of CO2 emissions from the tourism industry
in China: 1990–2012. Ecol. Indic. 2014, 46, 390–397. [CrossRef]53. Scott, D.; Hall, C.M.; Gössling, S. Global tourism vulnerability to climate change. Ann. Tour. Res. 2019, 77,
49–61. [CrossRef]54. Merli, R.; Preziosi, M.; Acampora, A.; Lucchetti, M.; Ali, F. The impact of green practices in coastal tourism:
An empirical investigation on an eco-labelled beach club. Int. J. Hosp. Manag. 2019, 77, 471–482. [CrossRef]55. Kim, S.-H.; Lee, K.; Fairhurst, A. The review of “green” research in hospitality, 2000-2014: Current trends
and future research directions. Int. J. Contemp. Hosp. Manag. 2017, 29, 226–247. [CrossRef]56. Larson, L.R.; Poudyal, N.C. Developing sustainable tourism through adaptive resource management: A case
study of Machu Picchu, Peru. J. Sustain. Tour. 2012, 20, 917–938. [CrossRef]

Sustainability 2019, 11, 6556 27 of 30
57. Higgins-Desbiolles, F. The elusiveness of sustainability in tourism: The culture-ideology of consumerismand its implications. Tour. Hosp. Res. 2010, 10, 116–129. [CrossRef]
58. Opdam, P. Exploring the role of science in sustainable landscape management. In An Introduction to theSpecial Issue; Multidisciplinary Digital Publishing Institute: Basel, Switzerland, 2018.
59. Sparks, P.; Shepherd, R. Self-identity and the theory of planned behavior: Assesing the role of identificationwith “ green consumerism”. Soc. Psychol. Q. 1992, 55, 388–399. [CrossRef]
60. McCarthy, B.; Liu, H.B. Food waste and the ‘green’consumer. Australas. Mark. J. (AMJ) 2017, 25, 126–132.[CrossRef]
61. Ajzen, I. From intentions to actions: A theory of planned behavior. In Action Control; Springer:Berlin/Heidelberg, Germany, 1985; pp. 11–39.
62. Ajzen, I.; Fishbein, M. Theory of reasoned action-Theory of planned behavior. Univ. South Fla. 1988, 2007,67–98.
63. Pulido-Fernández, J.I.; Cárdenas-García, P.J.; Espinosa-Pulido, J.A. Does environmental sustainabilitycontribute to tourism growth? An analysis at the country level. J. Clean. Prod. 2019, 213, 309–319. [CrossRef]
64. Dodds, R.; Holmes, M. Is there a Benefit from being Green. Assessing Benefits from Marketing Sustainabilityby North American Hotels. J. Hotel Bus. Manag. 2016, 5, 145. [CrossRef]
65. Cronin, J.J.; Smith, J.S.; Gleim, M.R.; Ramirez, E.; Martinez, J.D. Green marketing strategies: An examinationof stakeholders and the opportunities they present. J. Acad. Mark. Sci. 2011, 39, 158–174. [CrossRef]
66. Prince, S.; Ioannides, D. Contextualizing the complexities of managing alternative tourism at thecommunity-level: A case study of a nordic eco-village. Tour. Manag. 2017, 60, 348–356. [CrossRef]
67. Meleddu, M.; Pulina, M. Evaluation of individuals’ intention to pay a premium price for ecotourism:An exploratory study. J. Behav. Exp. Econ. 2016, 65, 67–78. [CrossRef]
68. Yu, Y.; Li, X.; Jai, T.-M. The impact of green experience on customer satisfaction: Evidence from TripAdvisor.Int. J. Contemp. Hosp. Manag. 2017, 29, 1340–1361. [CrossRef]
69. Zou, L.W.; Chan, R.Y. Why and when do consumers perform green behaviors? An examination of regulatoryfocus and ethical ideology. J. Bus. Res. 2019, 94, 113–127. [CrossRef]
70. Hao, Y.; Liu, H.; Chen, H.; Sha, Y.; Ji, H.; Fan, J. What affect consumers’ willingness to pay for greenpackaging? Evidence from China. Resour. Conserv. Recycl. 2019, 141, 21–29. [CrossRef]
71. Cozzio, C.; Bullini Orlandi, L.; Zardini, A. Food sustainability as a strategic value driver in the hotel industry.Sustainability 2018, 10, 3404. [CrossRef]
72. Dolnicar, S.; Crouch, G.I.; Long, P. Environment-friendly tourists: What do we really know about them?J. Sustain. Tour. 2008, 16, 197–210. [CrossRef]
73. Kim, W.G.; Li, J.; Han, J.S.; Kim, Y. The influence of recent hotel amenities and green practices on guests’price premium and revisit intention. Tour. Econ. 2017, 23, 577–593. [CrossRef]
74. Merli, R.; Preziosi, M.; Acampora, A.; Ali, F. Why should hotels go green? Insights from guests experience ingreen hotels. Int. J. Hosp. Manag. 2019, 81, 169–179. [CrossRef]
75. Janta, H.; Christou, A. Hosting as social practice: Gendered insights into contemporary tourism mobilities.Ann. Tour. Res. 2019, 74, 167–176. [CrossRef]
76. Chan, E.S. Managing green marketing: Hong Kong hotel managers’ perspective. Int. J. Hosp. Manag. 2013,34, 442–461. [CrossRef]
77. Buhalis, D. The tourism phenomenon: The new tourist and consumer. In Tourism in the Age of Globalisation;Routledge: London, UK, 2005; pp. 83–110.
78. Lee, J.-S.; Hsu, L.-T.; Han, H.; Kim, Y. Understanding how consumers view green hotels: How a hotel’s greenimage can influence behavioural intentions. J. Sustain. Tour. 2010, 18, 901–914. [CrossRef]
79. Arbieu, U.; Grünewald, C.; Martín-López, B.; Schleuning, M.; Böhning-Gaese, K. Mismatches between supplyand demand in wildlife tourism: Insights for assessing cultural ecosystem services. Ecol. Indic. 2017, 78,282–291. [CrossRef]
80. Robin, C.F.; Pedroche, M.S.C.; Astorga, P.S. Revisiting green practices in the hotel industry: A comparisonbetween mature and emerging destinations. J. Clean. Prod. 2017, 140, 1415–1428.
81. Hussain, M.; Al-Aomar, R.; Melhem, H. Assessment of lean-green practices on the sustainable performanceof hotel supply chains. Int. J. Contemp. Hosp. Manag. 2019. [CrossRef]

Sustainability 2019, 11, 6556 28 of 30
82. Saura, J.; Reyes-Menendez, A.; Alvarez-Alonso, C. Do online comments affect environmental management?Identifying factors related to environmental management and sustainability of hotels. Sustainability 2018, 10,3016. [CrossRef]
83. Jackson, D.L. Revisiting sample size and number of parameter estimates: Some support for the N: Qhypothesis. Struct. Equ. Model. 2003, 10, 128–141. [CrossRef]
84. Han, H.; Lee, J.-S.; Trang, H.L.T.; Kim, W. Water conservation and waste reduction management for increasingguest loyalty and green hotel practices. Int. J. Hosp. Manag. 2018, 75, 58–66. [CrossRef]
85. Tovar-Sánchez, A.; Sánchez-Quiles, D.; Rodríguez-Romero, A. Massive coastal tourism influx to theMediterranean Sea: The environmental risk of sunscreens. Sci. Total Environ. 2019, 656, 316–321. [CrossRef][PubMed]
86. Kang, K.H.; Stein, L.; Heo, C.Y.; Lee, S. Consumers’ willingness to pay for green initiatives of the hotelindustry. Int. J. Hosp. Manag. 2012, 31, 564–572. [CrossRef]
87. Ge, H.; Chen, S.; Chen, Y. International alliance of green hotels to reach sustainable competitive advantages.Sustainability 2018, 10, 573. [CrossRef]
88. Scott, J.E. Coffee shop meets casino: Cultural responses to casino tourism in Northern Cyprus. J. Sustain.Tour. 2003, 11, 266–279. [CrossRef]
89. Vehbi, B.O.; Doratli, N. Assessing the impact of tourism on the physical environment of a small coastal town:Girne, northern cyprus. Eur. Plan. Stud. 2010, 18, 1485–1505. [CrossRef]
90. (MET) Ministry of Tourism and Environment. Statistical Year Book, 2017; MET: Nicosia, Cyprus, 2018.91. Seraphin, H.; Sheeran, P.; Pilato, M. Over-tourism and the fall of Venice as a destination. J. Destin. Mark.
Manag. 2018, 9, 374–376. [CrossRef]92. Parameswaran, R.; Yaprak, A. A cross-national comparison of consumer research measures. J. Int. Bus. Stud.
1987, 18, 35–49. [CrossRef]93. Kim, Y. The pilot study in qualitative inquiry: Identifying issues and learning lessons for culturally competent
research. Qual. Soc. Work 2011, 10, 190–206. [CrossRef]94. Burgess, T.F. A General Introduction to the Design of Questionnaires for Survey Research, 1st ed.; University of
Leeds: Leeds, UK, 2001.95. Wu, M.-H.; Thongma, W.; Leelapattana, W.; Huang, M.-L. Impact of hotel employee’s green awareness,
knowledge, and skill on hotel’s overall performance. In Advances in Hospitality and Leisure; Emerald GroupPublishing Limited: Bingley, UK, 2016; pp. 65–81.
96. Chan, E.S.; Hawkins, R. Application of EMSs in a hotel context: A case study. Int. J. Hosp. Manag. 2012, 31,405–418. [CrossRef]
97. GSTC (Global Sustainable Tourism Council). Global Sustainable Tourism Criteria Hotel Criteria with SuggestedPerformance Indicators Preamble, 3rd ed.; Global Sustainable Tourism Council: Washington, DC, USA, 2016.
98. WTO (World Tourism Organization). Indicators of Sustainable Development for Tourism Destinations: A Guidebook;World Tourism Organization: Madrid, Spain, 2004.
99. SDG (Sustainable Development Goals). Improving Human and Planetary Wellbeing. 2013, Volume 495.Available online: https://sustainabledevelopment.un.org/content/documents/1696griggs2.pdf (accessed on14 November 2019).
100. Sharma, E.; Tewari, R. Engaging employee perception for effective corporate social responsibility: Role ofhuman resource professionals. Glob. Bus. Rev. 2018, 19, 111–130. [CrossRef]
101. Chan, E.S.; Hon, A.H.; Okumus, F.; Chan, W. An empirical study of environmental practices and employeeecological behavior in the hotel industry. J. Hosp. Tour. Res. 2017, 41, 585–608. [CrossRef]
102. Droussiotis, A.; Austin, J. Company practices of Cypriot firms: Perceptual differences between employersand employees. Eur. Bus. Rev. 2008, 20, 208–221. [CrossRef]
103. Goree, C.T.; Marszalek, J.F. Electronic surveys: Ethical issues for researchers. Coll. Stud. Aff. J. 1995, 15,75–79.
104. Etikan, I.; Musa, S.A.; Alkassim, R.S. Comparison of convenience sampling and purposive sampling. Am. J.Theor. Appl. Stat. 2016, 5, 1–4. [CrossRef]
105. Asmelash, A.G.; Kumar, S. Assessing progress of tourism sustainability: Developing and validatingsustainability indicators. Tour. Manag. 2019, 71, 67–83. [CrossRef]
106. López, M.F.B.; Virto, N.R.; Manzano, J.A.; Miranda, J.G.-M. Residents’ attitude as determinant of tourismsustainability: The case of Trujillo. J. Hosp. Tour. Manag. 2018, 35, 36–45. [CrossRef]
Sustainability 2019, 11, 6556 29 of 30
107. Park, J.; Jeong Kim, H.; McCleary, K.W. The impact of top management’s environmental attitudes on hotelcompanies’ environmental management. J. Hosp. Tour. Res. 2014, 38, 95–115. [CrossRef]
108. Balcı, A. Sosyal Bilimlerde Arastırma: Yöntem Teknik Ve Ilkeler [Research in Social Sciences: Administration,Technique and Principles]; Pegem Akademi Yayıncılık: Ankara, Türkiye, 2004.
109. Bollen, K.A. A new incremental fit index for general structural equation models. Sociol. Methods Res. 1989,17, 303–316. [CrossRef]
110. Anderson, J.C.; Gerbing, D.W. The effect of sampling error on convergence, improper solutions, andgoodness-of-fit indices for maximum likelihood confirmatory factor analysis. Psychometrika 1984, 49, 155–173.[CrossRef]
111. Hu, L.-T.; Bentler, P.M. Evaluating model fit. In Structural Equation Modeling: Concepts, Issues, and Applications;Hoyle, R.H., Ed.; Sage: New York, NY, USA, 1995; pp. 76–99.
112. Hatcher, L.; O’Rourke, N. A Step-by-Step Approach to Using SAS for Factor Analysis and Structural EquationModeling; Sas Institute: Cary, NC, USA, 2013.
113. Hair, J.F.; Black, W.C.; Babin, B.J.; Anderson, R.E.; Tatham, R.L. Multivariate Data Analysis, 6th ed.; PearsonPrentice Hall: New Jersey, NJ, USA, 2006; Volume 87, pp. 49–74.
114. Bollen, K.A.; Long, J.S. Testing Structural Equation Models; Sage: Thousand Oaks, CA, USA, 1993; Volume 154.115. Hoyle, R.H. The Structural Equation Modeling Approach: BASIC Concepts and Fundamental Issues; American
Psychological Association: Washington, DC, USA, 1995.116. Kline, R.B. Structural Equation Modeling; Guilford Press: New York, NY, USA, 1998.117. Schafer, J.L.; Graham, J.W. Missing data: Our view of the state of the art. Psychol. Methods 2002, 7, 147.
[CrossRef]118. De Vaus, D. Research Design in Social Research; Sage: Thousand Oaks, CA, USA, 2001.119. Roth, P.L. Missing data: A conceptual review for applied psychologists. Pers. Psychol. 1994, 47, 537–560.
[CrossRef]120. Byrne, B.M. Structural Equation Modeling with LISREL, PRELIS, and SIMPLIS: Basic Concepts, Applications, and
Programming; Psychology Press: East Sussex, UK, 2013.121. Byrne, B.M.; Stewart, S.M. Teacher’s corner: The MACS approach to testing for multigroup invariance of a
second-order structure: A walk through the process. Struct. Equ. Model. 2006, 13, 287–321. [CrossRef]122. Byrne, B.M. Structural Equation Modeling with Mplus: Basic Concepts, Applications, and Programming; Routledge:
London, UK, 2013.123. Straub, D.W. Validating instruments in MIS research. MIS Q. 1989, 13, 147–169. [CrossRef]124. Cronbach, L.J. Coefficient alpha and the internal structure of tests. Psychometrika 1951, 16, 297–334. [CrossRef]125. Cook, T.D.; Campbell, D.T. The design and conduct of true experiments and quasi-experiments in field
settings. In Reproduced in Part in Research in Organizations: Issues and Controversies; Goodyear PublishingCompany: Santa Monica, CA, USA, 1979.
126. Garver, M.S.; Mentzer, J.T. Logistics research methods: Employing structural equation modeling to test forconstruct validity. J. Bus. Logist. 1999, 20, 33.
127. Maruyama, G. Basics of Structural Equation Modeling; Sage: Thousand Oaks, CA, USA, 1997.128. Schermelleh-Engel, K.; Moosbrugger, H.; Müller, H. Evaluating the fit of structural equation models: Tests of
significance and descriptive goodness-of-fit measures. Methods Psychol. Res. Online 2003, 8, 23–74.129. Marsh, H.W.; Grayson, D. Latent Variable Models of Multitrait-Multimethod Data; American Psychological
Association: Washington, DC, USA, 1995.130. Tanaka, J.S. Multifaceted conceptions of fit in structural equation models. Sage Focus Ed. 1993, 154, 10.131. Shrock, S.A.; Coscarelli, W.C. Criterion-Referenced Test Development: Technical and Legal Guidelines for Corporate
Training; John Wiley & Sons: Hoboken, NJ, USA, 2008.132. Steenkamp, J.-B.E.; Van Trijp, H.C. The use of LISREL in validating marketing constructs. Int. J. Res. Mark.
1991, 8, 283–299. [CrossRef]133. Barclay, D.; Higgins, C.; Thompson, R. The Partial Least Squares (PLS) Approach to Casual Modeling:
Personal Computer Adoption ans Use as an Illustration. Technol. Stud. 1995, 2, 285–309.134. Fornell, C.; Larcker, D.F. Evaluating structural equation models with unobservable variables and measurement
error. J. Mark. Res. 1981, 18, 39–50. [CrossRef]135. Hu, L.T.; Bentler, P.M. Cutoff criteria for fit indexes in covariance structure analysis: Conventional criteria
versus new alternatives. Struct. Equ. Model. Multidiscip. J. 1999, 6, 1–55. [CrossRef]

Sustainability 2019, 11, 6556 30 of 30
136. Browne, M.W.; Cudeck, R. Alternative ways of assessing model fit. Sage Focus Ed. 1993, 154, 136. [CrossRef]137. Cole, D.A. Utility of confirmatory factor analysis in test validation research. J. Consult. Clin. Psychol. 1987,
55, 584. [CrossRef]138. Jöreskog, K.G.; Sörbom, D. Recent developments in structural equation modeling. J. Mark. Res. 1982, 19,
404–416. [CrossRef]139. Jöreskog, K.G.; Sörbom, D. LISREL 8: User’s Reference Guide; Scientific Software International: Chicago, IL,
USA, 1996.140. Hu, L.-T.; Bentler, P.M. Fit indices in covariance structure modeling: Sensitivity to underparameterized
model misspecification. Psychol. Methods 1998, 3, 424. [CrossRef]141. Bentler, P.M.; Bonett, D.G. Significance tests and goodness of fit in the analysis of covariance structures.
Psychol. Bull. 1980, 88, 588. [CrossRef]142. Bentler, P.M. Comparative fit indexes in structural models. Psychol. Bull. 1990, 107, 238. [CrossRef] [PubMed]143. Tabachnick, B.G.; Fidell, L.S. Using Multivariate Statistics Boston; Allyn Bacon: Needham Heights, MA,
USA, 2007.144. Marsh, H.W.; Balla, J. Goodness of fit in confirmatory factor analysis: The effects of sample size and model
parsimony. Qual. Quant. 1994, 28, 185–217. [CrossRef]145. Bearden, W.O.; Sharma, S.; Teel, J.E. Sample size effects on chi square and other statistics used in evaluating
causal models. J. Mark. Res. 1982, 19, 425–430. [CrossRef]146. Staniškiene, E.; Stankeviciute, Ž. Social sustainability measurement framework: The case of employee
perspective in a CSR-committed organisation. J. Clean. Prod. 2018, 188, 708–719. [CrossRef]147. Hanna, K.S. Planning for sustainability: Experiences in two contrasting communities. J. Am. Plan. Assoc.
2005, 71, 27–40. [CrossRef]148. Hörisch, J.; Freeman, R.E.; Schaltegger, S. Applying stakeholder theory in sustainability management: Links,
similarities, dissimilarities, and a conceptual framework. Organ. Environ. 2014, 27, 328–346. [CrossRef]149. Wiernik, B.M.; Ones, D.S.; Dilchert, S. Age and environmental sustainability: A meta-analysis. J. Manag.
Psychol. 2013, 28, 826–856. [CrossRef]150. Ahn, J.; Kwon, J. Green hotel brands in Malaysia: Perceived value, cost, anticipated emotion, and revisit
intention. Curr. Issues Tour. 2019, 1–16. [CrossRef]151. Jenkin, T.A.; McShane, L.; Webster, J. Green information technologies and systems: Employees’ perceptions
of organizational practices. Bus. Soc. 2011, 50, 266–314. [CrossRef]152. Luke, T.W. Corporate social responsibility: An uneasy merger of sustainability and development. Sustain. Dev.
2013, 21, 83–91. [CrossRef]153. Chandran, C.; Bhattacharya, P. Hotel’s best practices as strategic drivers for environmental sustainability
and green marketing. J. Glob. Sch. Mark. Sci. 2019, 29, 218–233. [CrossRef]
© 2019 by the authors. Licensee MDPI, Basel, Switzerland. This article is an open accessarticle distributed under the terms and conditions of the Creative Commons Attribution(CC BY) license (http://creativecommons.org/licenses/by/4.0/).