Investigating Population Pyramids and what they tell us. AP Human Geography.
16
Investigating Population Pyramids and what they tell us. AP Human Geography
-
Upload
elfreda-glenn -
Category
Documents
-
view
218 -
download
0
Transcript of Investigating Population Pyramids and what they tell us. AP Human Geography.

Investigating Population Pyramids and what they tell us.
AP Human Geography

Source US Census Bureau International Data Base
A Population Structure is the composition of a population, the most important elements of which are age and sex
Population Pyramids are bar charts, arranged vertically that shows the distribution of a population by age and gender.

Take a couple minutes to study this pyramid. Jot down things you can tell about this country’s population.

Retired Dependents
Retired Dependents
Workforce Workforce
Child Dependents
Child Dependents
Divide the Pyramid into 3 sections: The young dependent population The economically active population The elderly dependent population

The Pyramid contains information about:• Genders•Population of Specific Ages•Life Expectancy•Death Rate•Birth Rate•Infant Mortality•Population of the workforce•Population of dependents•How the Population changes
Why are population Pyramids Useful?

• Migration Patterns• Identify Areas where
there are ageing populations or young population profiles
• Illustrate Development Indicators like Birth Rate.-
• Predictive tools for future services likes schools, nursing homes, pension programs, health services
• Calculate Dependency Ratios
• Government Policy –pronatalist or antinatalist
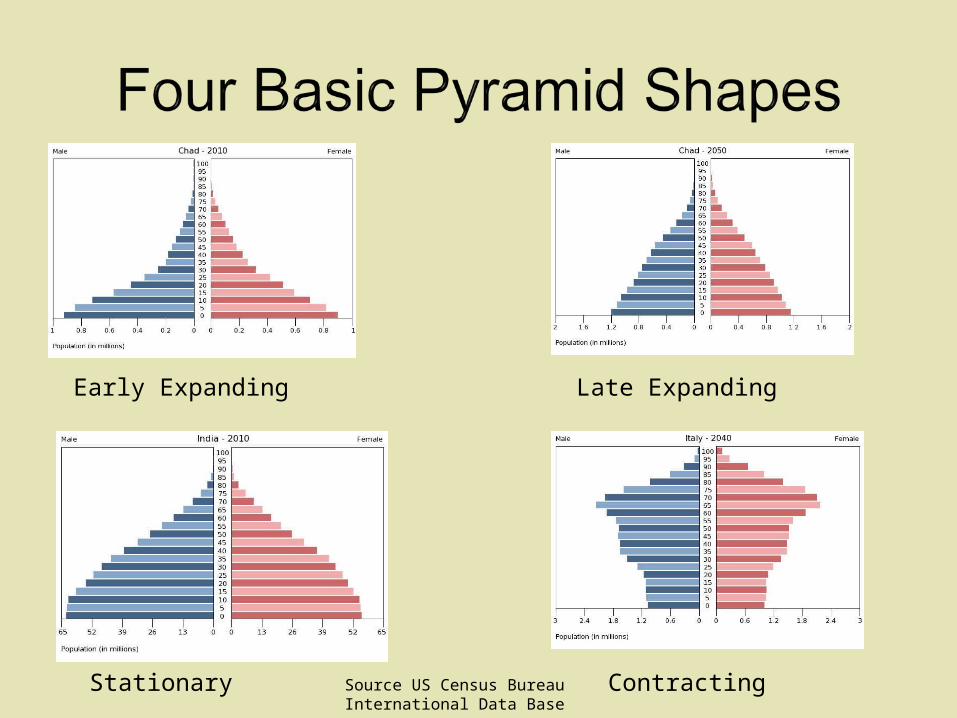
Early Expanding Late Expanding
Stationary ContractingSource US Census Bureau International Data Base

• Wide Base (High Birth Rate)
• Rapidly Tapers (High Death Rate)
• Short bars in Higher age groups (Low Life Expectancy)
Source US Census Bureau International Data Base

• Beehive in Shape• Less Tapering (Falling
Death Rate)• Base less wide (Falling
Birth Rates• Improving Life
Expectancy
Source US Census Bureau International Data Base

• Bars change little from generation to generation (low Death Rate)
• Improving Life Expectancy
• Births around replacement level
Source US Census Bureau International Data Base

• ‘Coffin’ Shape• Short Base Bars as Birth
Rate is well below replacement
• Long bars in older generations (Ageing Population)
• Long Life Expectancy
Source US Census Bureau International Data Base

How do pyramids connect to Demographic Transition Model?

1 2 3 4 5

Population Structures: Differences among Countries
• Differences in population structures can be based on one or more of the following: – Migration (in and out, urban/rural) – Sex Ratio – Access to health services (both young and old)

Sex Ratio
• Sex Ratio is the number of males per 100 females in a population.
• Male births consistently exceed female births due to a combination of biological and social reasons (infanticide- a phenomenon we will discuss in the next unit)

Population Projections
• Populations projections are the prediction of future populations based on the present age-gender structure, and with present rates of fertility, mortality and migration.
• Population projections are always hypothetical in nature.