Investigating Notch and Related Pathways for New ... · Investigating Notch and Related Pathways...
212
Investigating Notch and Related Pathways for New Biomarkers in Pancreatic Cancer Submitted for the degree of Doctor of Medicine at the University of Leicester By Mr Muhammad Mehdi Masood M.B.Ch.B. M.R.C.S. P.G.C.E. Department of Cancer Studies and Molecular Medicine University of Leicester February 2017
Transcript of Investigating Notch and Related Pathways for New ... · Investigating Notch and Related Pathways...

Investigating Notch and Related Pathways
for New Biomarkers in Pancreatic Cancer
Submitted for the degree of Doctor of Medicine
at the University of Leicester
By
Mr Muhammad Mehdi Masood
M.B.Ch.B. M.R.C.S. P.G.C.E.
Department of Cancer Studies and Molecular Medicine
University of Leicester
February 2017

ii
This thesis is dedicated to my parents
Professor Abul Fazal Muhammad Masood (1935 – 2014), known as the
“Father of Paediatric Surgery in Bangladesh”
And my mother
Dr Meherun Nessa Masood
“Whatever good I have done in my life so far is to make these two
wonderful human beings proud of me”
Glory be to Almighty God. Without His blessings, it would not have been
possible for me to complete this thesis

iii
ABSTRACT
Investigating Notch and related pathways for new biomarkers in pancreatic
cancer
Muhammad Mehdi Masood
Pancreatic ductal adenocarcinoma (PDAC) is the 5th commonest cause of cancer related
death in the UK with a 5-year survival rate of only 4%. This is due to vague symptoms,
late presentation and lack of availability of decent biomarkers, making most PDAC
unsuitable for curative resections at the time of diagnosis. Therefore, there is an urgent
need for new biomarkers.
Previous work in our lab has shown that Notch 1, Notch 3 and Notch 4 signalling
pathway are upregulated in PDAC compared to normal pancreas. The aim of this this
study was to examine the Notch signalling pathway and related miRNAs as potential
biomarkers for PDAC.
In this thesis, we describe the method development of a process of detecting Notch Nβ-
fragments in the plasma of human at concentrations of 121.67 fmol/µL. Notch Nβ-
fragments are released between the two cleavage sites S3 and S4 as part of γ-secretase
mediated cleavages following ligand activation. We could detect Notch 3 Nβ-fragments
in plasma of PDAC and healthy volunteers but were unable to find any statistically
significant differences between them. We were unable to detect Notch 1 Nβ-fragments.
We investigated Notch 2 expression in human tissue samples using
immunohistochemistry and found Notch 2 to be upregulated in resectable PDAC and
further upregulated in non-resectable locally advanced cancer, but down regulated in
metastatic PDAC tissue in comparison to non-resectable locally advanced tissue. This
suggests the role of Notch 2 proteins as diagnostic and prognostic biomarkers.
Using RT-PCR we identified miR-200c, miR–155a and miR–375 which could help
differentiate between the plasma of healthy volunteers, PDAC and chronic pancreatitis
(CP). Adding age to a binary logistic regression model we could differentiate between
PDAC and CP achieving ROC curve values of above 0.95. This suggests the role of
these miRNAs as diagnostic biomarkers.

iv
ACKNOWLEDGEMENTS
I would like to thank my initial supervisors Professor Maggie Manson and Mr David
Berry for giving me this opportunity. I would also like to thank Professor Ashley
Dennison for supporting me during a difficult time and allowing me access to his clinics
for patient samples. I cannot express enough gratitude to Dr Don Jones Jr for taking me
on as a student and spending so much of his valuable time making corrections to my
thesis. Finally, I must thank Mr Chris Neal for not just being my supervisor, but being a
friend who has been providing support from the beginning.
There are some special people involved in this project who deserves a mention. I must
thank Dr Chris Mann, whose work provided the foundation for my project. Dr Frieda
Teichert and Dr Elena Karpova were instrumental in my research and I am extremely
grateful to them for their support and guidance in mass spectrometry and micro RNA
respectively. Dr Rajinder Singh has helped me with mass spectrometry, given me
advice, constant encouragement and has been a friend. I would also like to thank Dr
Kevin West for scoring the immunohistochemistry slides with me. Thank you also to Dr
Howard Pringle for his guidance on the statistical analysis for the micro RNA chapter.
This thesis would not have been possible without the support of my family. The
constant push from my parents have been a driving force. Unfortunately, my father is
not here anymore to see the end-product. He would have been very happy and proud.
My wife and daughter have been very understanding and supportive throughout this
time. Special thanks to my sister for her support. Finally, I have to thank my in-laws,
especially my mother-in-law for the countless times she has dropped everything at short
notice to babysit my daughter so I can work on my thesis.

v
Contents
INTRODUCTION ............................................................................... 1
1.1 Pancreatic Cancer ................................................................................................... 2
1.2 Cell Signalling in Carcinogenesis ........................................................................... 4
1.3 The Notch Signalling Pathway ............................................................................... 6
1.3.1. Notch receptors ............................................................................................... 6
1.3.2 Notch Receptor Activation .............................................................................. 8
1.3.3 Notch Ligands ................................................................................................ 10
1.3.4 DSL ligands as inhibitors of Notch Signalling .............................................. 12
1.3.5 Target Gene Transcription ............................................................................. 13
1.3.6 Degradation of Notch ..................................................................................... 14
1.3.7 CSL-independent Notch signalling ................................................................ 16
1.3.8 Notch in normal tissue development ............................................................. 17
1.3.9 The role of Notch signalling in malignancies ................................................ 21
1.3.10 Notch in Pancreatic Cancer .......................................................................... 26
1.3.11 Notch Signalling as a potential Biomarker for Pancreatic Cancer .............. 30
1.4. MicroRNAs .......................................................................................................... 34
1.4.1 MicroRNAs in cancer .................................................................................... 36
1.4.2. MicroRNAs as potential biomarkers of pancreatic cancer ........................... 37
1.4.3 MicroRNAs and Notch .................................................................................. 39
1.5 Hypothesis, Aim and Objectives .......................................................................... 41

vi
1.5.1 Aim ................................................................................................................ 41
1.5.2 Objectives ...................................................................................................... 41
MATERIALS AND METHOD ........................................................ 42
2.1 Clinical Materials .................................................................................................. 43
2.1.1 Patient recruitment for collection of blood .................................................... 43
................................................................................................................................ 44
2.1.2 Patient Recruitment for immunohistochemistry ............................................ 44
2.1.3 Tissue selection and assessment .................................................................... 46
2.2 Laboratory Materials ............................................................................................. 46
2.2.1 Materials for immunohistochemistry (chapter 4) .......................................... 46
2.2.2 Antibodies ...................................................................................................... 47
2.2.3 Materials for plasma preparation, solid phase extraction and mass
spectrometry (chapter 3) ......................................................................................... 47
2.2.4 Materials for microRNA extraction and PCR (chapter 5) ............................. 48
2.3 Solutions and Buffers ............................................................................................ 49
2.3.1 Solutions and buffers for immunohistochemistry .......................................... 49
2.3.2 Buffers for Solid Phase Extraction ................................................................ 51
2.4 Methods – Immunohistochemistry ....................................................................... 53
2.4.1 The EnVision+ immunohistochemistry technique ......................................... 53
2.4.2 Preparation of tissue slides ............................................................................ 54
2.4.3 Envision+ Immunohistochemistry protocol ................................................... 55
2.4.4 Optimisation of immunohistochemistry ........................................................ 57

vii
2.4.5 Scoring of immunohistochemical staining .................................................... 58
2.5 Methods – Patient Plasma Preparation ................................................................. 59
2.6 Methods – MicroRNA .......................................................................................... 59
2.6.1 Extraction of miRNA from plasma (miRNeasy Kit) ..................................... 59
2.6.2 miScript Reverse Transcription and SYBR® Green R -T qPCR ................... 61
2.7 Methods – Mass Spectrometry ............................................................................. 64
2.7.1 Steps used for sample preparation. ................................................................ 64
INVESTIGATING NOTCH 1 AND NOTCH 3 AS POTENTIAL
BIOMARKERS FOR PANCREATIC DUCTAL ADENOCARCINOMA USING
MASS SPECTOMETRY ................................................................................................ 71
3.1 Introduction ........................................................................................................... 72
3.2 Background information on Mass Spectrometry .................................................. 74
3.2.1 Electrospray Ionisation-Mass Spectrometry (ESI-MS) ................................. 75
3.2.2 Matrix–Assisted Laser Desorption Ionisation (MALDI) ............................... 75
3.2.3 Comparison of MALDI and ESI .................................................................... 76
3.3 Purification of Samples – The Principle ............................................................... 77
3.3.1 Solid Phase Extraction -The principle ........................................................... 78
3.3.2 Size-exclusion filtration – The Principle ....................................................... 79
3.3.3 Immunoprecipitation using Magnetic Dynabeads – The principle ................ 80
3.4 Methods ................................................................................................................ 81
3.4.1 Synthetic Notch Nβ peptide ........................................................................... 81
3.4.2 ........................................................................................................................ 83

viii
Sample preparation ................................................................................................. 83
3.5 Method Development ........................................................................................... 83
3.5.1 Solid Phase Extraction ................................................................................... 84
3.5.2 Validation of antibody ................................................................................... 92
3.5.3 Immunoprecipitation using magnetic Dynabeads. ......................................... 92
3.5.4 Development of the size exclusion filtration method .................................. 102
3.6 Results ................................................................................................................. 109
3.6.1 Analysis of Notch 1 peptide in patient samples ........................................... 109
3.6.2 Analysis of Notch 3 peptide in patient samples ........................................... 109
3.7 Discussion ........................................................................................................... 113
NOTCH 2 EXPRESSION IN PANCREATRIC
ADENOCARCINOMA IN VIVO ................................................................................ 116
4.1 Introduction ......................................................................................................... 117
4.2 Patient Demographics ......................................................................................... 118
4.3 Results ................................................................................................................. 121
4.3.1 Notch 2 expression ....................................................................................... 121
4.3.2 Survival Analyses ........................................................................................ 127
4.4 DISCUSSION ..................................................................................................... 134
INVESTIGATING miRNA EXPRESSION IN PLASMA OF
PATIENTS WITH PANCREATIC DUCTAL ADENOCARCINOMA AND
CHRONIC PANCREATITIS AS POTENTIAL BIOMARKERS ............................... 141
5.1 Introduction ......................................................................................................... 142

ix
5.2 Results ................................................................................................................. 144
5.2.1 Micro RNAs investigated ............................................................................ 144
5.2.2 Micro RNA statistical analysis .................................................................... 145
5.2.1 Patient Demographics .................................................................................. 147
5.2.3 Micro RNA Results ..................................................................................... 148
5.3 Discussion ........................................................................................................... 161
DISCUSSION .................................................................................. 169
REFERENCES ............................................................................................................. 177
APPENDIX ................................................................................................................... 195
Ethics approval for this project ................................................................................. 195
LIST OF FIGURES
Figure 1.1 Schematic diagram displaying the structure of Notch. .................................... 7
Figure 1.2 Notch signalling Pathway. ............................................................................. 10
Figure 1.3 Structure of the Notch ligands. ...................................................................... 12
Figure 1.4 Notch signalling is tightly regulated through an efficient process of NICD
degradation. ..................................................................................................................... 16
Figure 1.5 Pancreatic intraepithelial neoplasia. Pancreatic intraepithelial neoplasia:
PanIN-1A (flat), PanIN-1B (papillary), PanIN-2 (papillary with nuclear changes), and
PanIN-3 (severely atypical with mitoses, budding, and luminal necrosis). Figure taken
from Winter, Maitra and Yeo, 2006. .............................................................................. 28

x
Figure 1.6 Extracellular release of the Notch 1 peptides and its detection. .................... 34
Figure 1.7 Biogenesis of miRNA. .................................................................................. 35
Figure 2.1 Schematic diagram depicting the Envision immunohistochemistry system. 53
Figure 2.2 Schematic diagram of the steps involved in sample purification and
enrichment. ..................................................................................................................... 70
Figure 3.1 Schematic diagram of Notch 1 signalling. .................................................... 73
Figure 3.2 Detection and sequencing of Notch 1 Nβ peptide. ........................................ 74
Figure 3.3 MALDI-MS signals for Notch 1 Human and Mouse peptide. ...................... 83
Figure 3.4 MALDI-MS spectrum reading of 50 µL of ASPC cell culture medium. ...... 85
Figure 3.5 MALDI-MS spectrum of 500 µL ASPC cell culture medium. ..................... 85
Figure 3.6 MALDI-MS spectra of 50 µL ASPC cell culture medium after different
washes. ............................................................................................................................ 86
Figure 3.7 MALDI-MS spectrum of ASPC cell culture medium spiked with mouse
Notch 1 peptide. .............................................................................................................. 87
Figure 3.8 MALDI-MS spectra of 50 µL ASPC culture medium spiked with 50 pmol of
mouse Notch 1 peptide. .................................................................................................. 90
Figure 3.9 MALDI-MS spectrum of 50 µL of ASPC cell culture medium spiked with 50
pmol of Mouse Notch 1 peptide. .................................................................................... 91
Figure 3.10 MALDI-MS spectra of ASPC cell culture medium spiked with 50p mol of
human Notch 1 peptide before and after SPE. ................................................................ 92
Figure 3.11 MALDI-MS spectra of human Notch 1 peptide dissolved in ammonium
bicarbonate and immunoprecipitated using dynabeads. ................................................. 94
Figure 3.12 MALDI-MS spectrum of 25 pmol of human Notch 1 peptide eluted with
differing acids during immunoprecipitation using magnetic dynabeads. ....................... 94

xi
Figure 3.13 MALDI-MS spectra of 100 pmol of human Notch 1 peptide eluted with
differing pH of 0.1 M citric acid during immunoprecipitation using magnetic
dynabeads. ....................................................................................................................... 95
Figure 3.14 MALDI-MS spectra of healthy human plasma and plasma spiked with
Notch 1 peptide. .............................................................................................................. 96
Figure 3.15 MALDI-MS spectrum of healthy human plasma spiked with 100 pmol
Notch 1 peptide. .............................................................................................................. 98
Figure 3.16 MALDI-MS spectra of healthy human samples spiked with 25 pmol of
Notch 1 peptide, incubated with antibody for 2 h and 12 h. ........................................... 99
Figure 3.17 MALDI-MS spectra of healthy human plasma spiked with 10 pmol of
Notch 1 peptide. ............................................................................................................ 100
Figure 3.18 MALDI-MS spectra of the first wash with ammonium bicarbonate prior to
elution with 0.1 M citric acid pH 1.5. ........................................................................... 101
Figure 3.19 MALDI-MS spectra of healthy human plasma spiked with Notch 1 peptide.
...................................................................................................................................... 102
Figure 3.20 MALDI-MS spectra of 50 µL of healthy human plasma spiked with 50
pmol of Notch 1 peptide. .............................................................................................. 104
Figure 3.21 MALDI-MS spectrum showing development of the size exclusion filtration
method. ......................................................................................................................... 106
Figure 3.22 MALDI-MS spectra following passivation of the Amicon filters. ........... 107
Figure 3.23 MALDI-MS spectra following Tween-20 passivation of Amicon filters. 108
Figure 3.24 MALDI-MS spectra analysis of PDAC patient and healthy volunteer
plasma. .......................................................................................................................... 110
Figure 3.25 MALDI-MS spectrum of Notch 3 peptide in healthy plasma and PDAC
patient's plasma. ............................................................................................................ 112

xii
Figure 4.1 Immunohistochemical expression of Notch 2 in normal pancreas and
pancreatic adenocarcinoma. .......................................................................................... 124
Figure 4.2 Kaplan Meier curve demonstrating the impact of Notch 2 expression on
overall survival in patients who had potentially curative resection (n = 42) ................ 131
Figure 4.3 Kaplan Meier curve demonstrating the impact of Notch 2 expression on
disease-free survival in patients who had potentially curative resection (n = 42) ........ 132
Figure 5.1 Box plot of ∆ Ct of miR-10b, miR–34a, and miR–200c. ............................ 151
Figure 5.2 Box plot of ∆ Ct of miR-375, miR–155a. ................................................... 152
Figure 5.3 Box plot of ∆ Ct of miR-196a, miR–503. ................................................... 153
Figure 5.4 A ROC curve using the probabilities of the model where miR-200c was the
only statistically significant variable and the binary outcome was PDAC vs non-cancer.
...................................................................................................................................... 155
Figure 5.5 A ROC curve using the predicted probabilities of the model where age (in
years) and miR-200c were the covariables and the binary outcome was PDAC vs non-
cancer. ........................................................................................................................... 155
Figure 5.6 A ROC curve using the predicted probabilities of the model where miR-200c
and miR–375 made statistically significant contributions and the binary outcome was
HV vs PDAC. ............................................................................................................... 157
Figure 5.7 A ROC curve using the predicted probabilities of the model where miR–375
made statistically significant contributions to the binary outcome of HV vs PDAC. .. 158
Figure 5.8 A ROC curve using the predicted probabilities of the model where miR-503
and miR–155a made statistically significant contributions and the binary outcome was
PDAC vs chronic pancreatitis. ...................................................................................... 159

xiii
Figure 5.9 A ROC curve using the predicted probabilities of the model where age (in
years) and miR – 155a made statistically significant contributions to the binary outcome
of PDAC vs chronic pancreatitis. ................................................................................. 160
Figure 5.10 A ROC curve using the predicted probabilities of the model where miR–
155a made statistically significant contributions to the binary outcome of healthy
volunteers’ vs chronic pancreatitis. .............................................................................. 161
LIST OF TABLES
Table 2.1 Materials for immunohistochemistry .............................................................. 46
Table 2.2 Primary antibodies .......................................................................................... 47
Table 2.3 Materials used for plasma preparation, solid phase extraction and mass
spectrometry .................................................................................................................... 47
Table 2.4 Materials used for microRNA extraction and PCR ........................................ 48
Table 2.5 miRNA Primers for use with MiScript SYBR® Green PCR Kit ................... 49
Table 2.6 Optimal conditions for Notch 2 antibody ....................................................... 58
Table 2.7 Reverse-transcription reaction components .................................................... 62
Table 2.8 Reaction setup for real-time PCR ................................................................... 63
Table 2.9 Cycling conditions for real-time PCR ............................................................ 64
Table 3.1 Amino acid sequence of 1) Notch 1 Nβ21 in mouse and human 2) Notch 3
Nβ21 in human................................................................................................................ 81

xiv
Table 4.1 Clinicopathological data of patients undergoing potentially curative resection
for pancreatic ductal adenocarcinoma. ......................................................................... 120
Table 4.2 Expression of Notch 2 in normal pancreas, early and advanced pancreatic
adenocarcinoma. ........................................................................................................... 122
Table 4.3 Correlations between Notch 2 protein expression and other Notch proteins
and pathway constituents. ............................................................................................. 125
Table 4.4 Associations of nuclear and cytoplasmic Notch 2 expression in resectable
PDAC tissue with clinicopathological variables. ......................................................... 126
Table 4.5 Univariate Cox Regression survival analyses for Notch 2 pathway biomarkers
for all patients undergoing potentially-curative resection for pancreatic adenocarcinoma
(n=42)............................................................................................................................ 130
Table 4.6 Univariate Cox Regression survival analyses for Notch 2 pathway biomarkers
for patients who had a clear R0 resection margin following surgery for pancreatic
adenocarcinoma (n=27) ................................................................................................ 130
Table 4.7 Univariate Cox regression survival using clinicopathologic factors for
patients undergoing potentially-curative resection for pancreatic adenocarcinoma (n =
42). Variables with P values < 0.1 are highlighted in bold. .......................................... 133
Table 5.1 Summary of expression profiles in literature of the 11 miRNAs which were
chosen for our study to differentiate between PDAC patients, chronic pancreatitis and
healthy volunteers. ........................................................................................................ 146
Table 5.2 Age and Gender of patients included in this study. ...................................... 148
Table 5.3 The mean/median of the ∆ Ct values of the miRNAs and p value of the
ANOVA/Kruskal Wallis test for ∆ Ct values within groups. ....................................... 149

xv
ABBREVIATIONS
ABC Avidin-Biotin complex
ADAM/TACE A desintegrin and metallopeptidase/tumour necrosis factor α
converting enzyme
AGO Argonaute
APP Amyloid precursor protein
CADASIL cerebral autosomal dominant arteriopathy
cDNA Complementary DNA
CHCA α- cyano-hydroxy cinnamic acid matrix
CLL Chronic lymphocytic leukaemia
CP Chronic pancreatitis
CSL CBF1, Suppressor of Hairless, Lag1
DMP Dimethyl Pimelimidate Dihydrochloride
DNA Deoxy ribonucleic acid
DSL Delta/Serrate/LAG -2
EGF Epidermal growth factor
ELISA Enzyme-linked immunosorbent assay
ERCP Endoscopic retrograde cholangiopancreatography
ESI Electrospray ionisation
ESI-MS Electrospray ionisation mass spectrometry
EUS Endoscopic ultrasound
FDP Freeze dried pellets
FNA Fine needle aspiration
GSI Gamma secretase inhibitor
HIAR Heat-induced antigen retrieval

xvi
HV Healthy volunteer
HRP Horseradish peroxidase
IA-MS Immunoprecipitation using antibody bound dynabeads followed
by MS analysis
IHC Immunohistochemistry
IMS Industrial Methylated spirit
LSAB Labelled Streptavidin Biotin
mRNA messenger RNA
miRNA micro RNA
MS Mass spectrometry
MALDI Matrix-assisted laser desorption ionisation
MALDI-TOF Matrix-assisted laser desorption ionisation time of flight
NEXT Notch extracellular truncation
NF-κB Nuclear factor kappa-light-chain-enhancer of activated B cells
NICD Notch intracellular domain
NRARP Notch regulated Ankyrin repeat protein
PanIN Pancreatic intraepithelial neoplasia
PDAC Pancreatic ductal adenocarcinoma
PCR Polymerase chain reaction
RAM RBP-jk associate molecule
RISC RNA-induced silencing complex
RNA Ribonucleic acid
RT-PCR Real time polymerase chain reaction
SKIP Ski-interacting protein
SPE Solid Phase Extraction
TAD Transcriptional activator domain/transactivation domain

xvii
T-ALL T cell acute lymphoblastic leukaemia/lymphoma
TBS Tris Buffered Saline
TFA Trifluroacetic acid
TGF–β Transforming growth factor beta
VSMC Vascular smooth muscle cells

INTRODUCTION

2
1.1 Pancreatic Cancer
Pancreatic cancer (PANC) is the 5th most common cause of cancer related deaths in the
UK (Cancer Research UK, 2016). This is despite it being the 10th most common cancer
and making up only 3% of all cancer cases in the UK. 4716 men (50%) and 4692
women (50%) were diagnosed with the disease in 2013. (Cancer Research UK, 2016)
Despite advances in chemotherapy and radiotherapy, the only definitive curative option
is surgical resection. However due to factors such as late presentation, aggressive local
spread and early metastasis, only 10% of tumours are amenable for surgical resection at
the time of diagnosis. (Stocken et al, 2005) 79% of patients with known staging of
pancreatic cancer at diagnosis, present with advanced disease (stage 3 & 4) unsuitable
for curative resection. PANC is also a cancer associated with aging, and on average
each year almost half of the patients (47%) diagnosed with this cancer in the UK are
above 75 years old (Cancer Research UK, 2016).
Complete resection of the cancer involves a Whipples procedure (also known as a
pancreaticoduodenectomy), which also carries an operative mortality rate of
approximately 1 to 16% (National Cancer Institute, 2016). Thus, pancreatic
adenocarcinoma has one of the worst prognoses of all gastrointestinal tumours, with a
5-year survival rate of between 0.4- 4%. The European Study Group for Pancreatic
Cancer (ESPAC) 1 trial showed that median survival for patients with curative surgery
and adjuvant chemotherapy was 20.1 months and the 5-year survival rate of these
patients are 29% (Ghaneh et al, 2008; Stocken et al, 2005).
The majority (95%) of pancreatic cancers develop as Pancreatic Ductal
Adenocarcinoma (PDAC), from the ductal cells of the exocrine pancreas. Other variants

3
of the adenocarcinoma include adenosquamous carcinoma, colloid carcinoma, hepatoid
carcinoma, medullary carcinoma, signet ring cell carcinoma and undifferentiated
carcinoma. (Weledji et al, 2016; Ralph and Fukushima, 2007). Tumours of endocrine
origin or neuroendocrine tumours as they are commonly known, such as insuloma and
glucagonoma, account for a maximum of 5 % of all pancreatic tumours and are usually
associated with much more favourable outcomes that the ductal carcinoma of the
exocrine origin (National Cancer Institute, 2015). This thesis focuses on pancreatic
ductal adenocarcinoma.
Despite advances in radiological imaging techniques, diagnosis remains difficult. In
particular, there is the need to differentiate between pancreatic carcinoma and chronic
pancreatitis when presented with a pancreatic mass. In the absence of accessible
metastatic disease, obtaining tissue for histological diagnosis is often challenging,
despite the use of modalities such as endoscopic ultrasound and diagnostic laparotomy.
(Kloppel and Adsay, 2009) Patients often proceed to laparotomy and pancreatic
resection and the associated morbidity without formal histology. There is therefore a
need to develop biomarkers for early detection/differentiation of chronic pancreatitis
and pancreatic ductal adenocarcinoma and to aid treatment of pancreatic ductal
adenocarcinoma at an early and potentially curable stage.
An understanding of the pathways involved in pancreatic adenocarcinoma progression
will allow us to identify new biomarkers as well as identify potential novel therapeutic
targets.

4
1.2 Cell Signalling in Carcinogenesis
We are learning more about the process of carcinogenesis day by day. Carcinogenesis
or tumourigenesis, is the process of cancer development from a normal cell. The life
history of cancer can be divided into stages. It was initially thought it could simply be
divided into initiation (single cell mutation), promotion (mutant cell proliferation)
stages. Progression can be described as the additional changes which occur after cancer
has formed. (King, 2000; Weinberg, 1989). However, despite the simplicity of the
above statement, tumourigenesis has long been thought to be a complex multistep
process. Weinburg (1989) described tumourigenesis as a succession of five to six
independent rate-limiting steps, each step representing a physiological barrier that must
be breached for the cell to progress further towards the end-point of malignancy. Such
multiple barriers are necessary to ensure that the successful completion to a
tumourigenic event is a rare process (Weinberg, 1989). Fearon et al described the first
step in tumourigenesis as initial mutational activation of oncogenes coupled with
mutational in-activation of tumour suppressor genes. Secondly at least 4 to 5 gene
mutations are required for the formation of a malignant tumour. Third, the cumulative
effects of the genetic alterations are responsible for determining the tumour’s biological
properties. They also said that in some cases, tumour suppressor genes tend to exert an
effect at the cellular level even in the presence of cancer (Fearon and Vogelstein, 1990).
It was originally suggested by Hanahan and Weinburg in 2000, that cancer progression
is the culmination of six essential alterations in cell physiology which collectively
dictate malignant growth (Hanahan and Weinberg, 2000). They were:
• Self-sufficiency in growth signals

5
• Insensitivity to growth-inhibitory (antigrowth) signals
• Evasion of programmed cell death (apoptosis)
• Limitless replicative potential
• Sustained angiogenesis
• Tissue invasion and metastasis
Since then, Hanahan and Weinberg has released the next generation “Hallmarks of
Cancer” (Hanahan and Weinberg, 2011) in which they have added two enabling
characteristics and two more emerging hallmarks as essential for tumour progression.
The enabling characteristics are genome instability and mutation; and tumour-
promoting inflammation. The two more hallmarks are:
• Reprogramming energy metabolism
• Evading immune destruction
It is now well established that cells are continuously under the influence of intracellular
signalling pathways. It is these pathways which normally targets their effector proteins
to carry out the normal activities of the cell. In cancer, certain pathways target proteins
which ultimately decide whether a cell proliferates, becomes senescent or dies. In
healthy cells these signals are finely regulated to maintain equilibrium. However, if the
regulation fails it can lead to abnormal signalling (O'Connor and Adams, 2010). Any
signalling changes which lead to uncontrolled proliferation may predispose to
cancerous changes by further incorporation of mutations compared to normally
proliferating cells. A cascade of changes in several signalling pathways is necessary for
a cancer to develop. It is important to understand the sequence of events in intracellular
pathways which result in these changes. Understanding the malfunction in different

6
pathways may enable the identification of targets for novel treatment as well as new
biomarkers which could identify the disease whilst still in a potentially curable stage
(Hanahan and Weinberg, 2000; Hanahan and Weinberg, 2011).
Several pathways including KRAS, CDKN2A, TGF-β, TP53, HEDGEHOG, NOTCH,
WNT, EGFR FAMILY, NF-κB and MYC have been identified as having roles in
pancreatic adenocarcinoma (Muller et al, 2007; McCleary-Wheeler, McWilliams and
Fernandez-Zapico, 2012). This thesis will examine the Notch Signalling Pathway.
1.3 The Notch Signalling Pathway
The Notch signalling pathway was first discovered in 1917 when strains of Drosophila
were seen with notches in their wing blades. This was attributed to a gene insufficiency
which was later identified as a transmembrane receptor, named Notch. Since the
discovery of the involvement of a Notch 1 translocation in human T cell acute
lymphoblastic leukaemia, there has been considerable interest in the role of Notch
signalling in carcinogenesis (Jun, Stevens and Kaplan-Lefko, 2008).
1.3.1. Notch receptors
The Notch genes encodes members of a family of receptors that mediate short range
signalling events. In mammals, there are four Notch genes designated Notch 1, 2, 3 and
4 (Borggrefe and Oswald, 2009). A typical Notch gene encodes a single transmembrane
receptor. The extracellular region of the receptor is made of an array of up to 36
epidermal growth factors (EGF)-like repeats, which is involved in ligand interaction.
(Borggrefe and Oswald, 2009) There are three juxtamembrane repeats known as Lin-

7
12-Notch (LN) repeats which modulate interactions between the extracellular and the
membrane-tethered intracellular domains (Bolos, Grego-Bessa and De La Pompa, 2007;
Bianchi, Dotti and Federico, 2006; Fiuza and Arias, 2007). One of the most important
features of Notch is that it acts as a transcription factor as well as a transmembrane
receptor. At the cell surface, Notch is present as a heterodimer consisting of
extracellular EGF repeats and juxtamembranous LN repeats linked non-covalently by a
heterodimerization region to the rest of the molecule (Fiuza and Arias, 2007).
Figure 1.1 Schematic diagram displaying the structure of Notch.
The extracellular Notch is composed of up to 36 EGF-like repeats with 3 juxtamembrane Lin-12
repeats, which is in close proximity with the heterodimerization domain. The heterodimerization
domain binds non-covalently, the extracellular Notch with the membrane tethered intracellular Notch.
The intracellular Notch has regions called RAM, Ankyrin repeats, a transactivation domain (TAD) and
a PEST domain. Adapted from Fiuza and Arias, 2007.
Notch proteins are synthesized as a 360 kDa precursor protein. The C- terminal
heterodimerization domain of the extracellular Notch forms a stable complex with the
extracellular region of the juxtamembranous Notch. It is this site, the S1 site, which is

8
the cleavage site of this structure. During maturation, the unprocessed Notch is cleaved
at the S1 site by furin-like proteases in the trans-Golgi, yielding a 180 kDa extracellular
domain and a 120 kDa fragment consisting of the membrane tethered intracellular
domain with a short extracellular sequence (Logeat et al, 1998; Baron, 2003).
The intracellular region of Notch has four distinct regions. They include the RAM
(RBPjk Associate Molecule) domain, the seven ankyrin repeats, a transcriptional
activator domain/transactivation domain (TAD) and the PEST (proline, glutamine,
serine, threonine-rich) sequence. The ankyrin repeats are flanked by two nuclear
localisation sequences, prior to and following the Ankyrin repeats (Baron, 2003).
1.3.2 Notch Receptor Activation
Notch receptors are normally inactive in the absence of ligands. As previously
mentioned, Notch is a single transmembrane protein and the extracellular region is
present on the cell surface. The ligands for Notch are also transmembrane proteins
thereby making it essential for cell-cell contact to trigger the signalling event (Fiuza and
Arias, 2007).
The extracellular portion of the cleaved Notch (S1 site) during the secretory phase
undergoes extensive glycosylation. This glycosylation is critical for proper folding of
the receptor and its subsequent interactions with the ligands, which are also
glycoproteins (D'Souza, Miyamoto and Weinmaster, 2008).

9
It is well established that Notch receptor activation is mediated by a sequence of
proteolytic events (Kopan and Ilagan, 2009). The ligands mediate the interaction with
Notch EGF like repeats 11 and 12. This interaction leads to a conformational change
within the extracellular Notch that exposes an extracellular metalloprotease site (S2
site). This S2 site is susceptible to cleavage by transmembrane proteases of the
ADAM/TACE (a desintegrin and metallopeptidase/tumour necrosis factor α converting
enzyme) family. (Fiuza and Arias, 2007) Cleavage at the S2 site results in shedding of
the Notch extracellular domain and creates a membrane tethered intermediate called
Notch extracellular truncation (NEXT). NEXT is a substrate for γ Secretase, which is a
member of a family of intramembrane cleaving proteases. Gamma Secretase activity of
a membrane protein complex containing presenilin as the catalytic component then
cleaves the transmembrane part of NEXT at two intramembranous sites (S3 & S4). This
releases the Notch Intracellular domain which translocates into the nucleus and
subsequently regulates Notch gene expression (Roy, Pear and Aster, 2007; Kopan and
Ilagan, 2009).
In mammals, presenilin have also been found in large protein complexes with gamma-
secretase activity, which cleaves the amyloid precursor protein (APP) in its
transmembrane domain. This suggests that the mechanism leading to cleavage of APP
and Notch might be related. Abnormal processing of APP has been implicated in
Alzheimer’s disease (Haass and De Strooper, 1999).

10
Figure 1.2 Notch signalling Pathway.
S1 cleavage happens at the trans-Golgi apparatus. Ligand binding activates Notch and elicits
several steps of cleavage. The first step is the cleavage at the extracellular S2 by proteases
ADAM10 or by TACE. Two further intramembranous cleavages, S3 and S4 by γ secretase
activity, results in the release of Notch Intracellular Domain (NICD). NICD translocates into the
nucleus and recruits transcription factors activating target gene expression. Figure taken from
Fiuza and Arias, 2007.
1.3.3 Notch Ligands
As mentioned in the previous section, Notch ligands are also transmembrane
glycoproteins and so cell-cell contact is necessary for activation of Notch (Fiuza and
Arias, 2007; D'Souza et al, 2008). There are two types of Notch ligands in mammals,
Delta and Jagged/Serrate, and they both belong to the DSL family of proteins (Fiuza

11
and Arias, 2007). The largest types of Notch ligands are characterized by three
structural blocks: a N-terminal DSL (Delta/Serrate/LAG-2) motif, specialized tandem
EGF repeats called the DOS (Delta and OSM-11-like proteins) domain, and EGF like
repeats (Kopan and Ilagan, 2009). DSL is an extracellular cysteine rich region and is
present in both Delta and Jagged ligands. DSL interacts with EGF-like repeats 11 and
12 of the Notch receptor protein and subsequently triggers cleavage at the S2 site which
results in activation of the Notch signalling pathway (D'Souza et al, 2008; Fiuza and
Arias, 2007).
DSL ligands are classified according to the presence or absence of a cysteine-rich
domain and the presence or absence of a DOS domain. (Kopan and Ilagan, 2009). There
are three Delta like proteins (Delta 1,3 and 4) and two Serrate proteins (Jagged 1 and 2).
The main structural differences between the Delta and Jagged families are as follow:
• The Jagged ligands contain a greater number of EGF repeats in the
extracellular region. They also have insertions within the EGF repeats.
• The Jagged/Serrate ligands also contain a cysteine-rich region, closer to the
membrane, that is completely absent from the Delta ligands (Fiuza and Arias,
2007).

12
Figure 1.3 Structure of the Notch ligands.
Delta and Jagged/Serrate ligands are composed of an N terminal DSL region responsible for
interacting with EGF like repeats 11 and 12 of the Notch receptor. Jagged/Serrate ligands
have longer EGF like repeats compared to the Delta ligand and also contains an extracellular
cysteine-rich region. Figure taken from Fiuza and Arias, 2007.
1.3.4 DSL ligands as inhibitors of Notch Signalling
DSL ligands can also interact with Notch proteins in the same cell. However, in these
circumstances, instead of inducing Notch signalling, they have an inhibitory effect. The
molecular basis of this interaction and its effects are not well understood, but it is
thought to be important in a subset of Notch dependent developmental events (Klein,
Brennan and Martinez Arias, 1997; Fiuza and Arias, 2007). This inhibitory action has

13
been shown to promote retinal neurogenesis and neurite outgrowth, as well as inhibiting
keratinocyte differentiation within epidermal stem cells (Lowell and Watt, 2001;
Dorsky et al, 1997).
1.3.5 Target Gene Transcription
The interaction of Notch with its ligands and subsequent proteolysis of the intact,
membrane-bound Notch receptor results in the release of a soluble fragment consisting
of the entire intracellular domain, termed the Notch intracellular domain (NICD). NICD
enters the nucleus and participates directly in the transcriptional regulation of target
genes (Fiuza and Arias, 2007).
This direct translocation of an active Notch signalling fragment to the nucleus is a
unique characteristic about Notch as it does not rely upon multiprotein phosphorylation
cascades, second messengers and other signal-relaying mechanisms (Fortini, 2009).
Since Notch does not use second messengers, the level of signalling activity is solely
dependent on the nuclear concentration of NICD and this is very tightly controlled
(Fortini, 2009). The nuclear responses to the NICD translocation are sensitively
modulated by several transcriptional mechanisms. The primary effectors of the NICD in
the nucleus are transcription factors of the conserved mammalian CBF1/Drosophila
Su(H)/C, elegans LAG-1 (CSL) family. CSL is also known as CBF-1 and RBP-Jκ.
Suppressor of Hairless (Su(H)) is a DNA-binding protein component of the Notch
signalling pathway that is thought to be required for target gene activation. (Fortini,
2009; Oswald et al, 2002; Fiuza and Arias, 2007).

14
In the absence of NICD, CSL proteins bind to specific sequences of the regulator
elements of several Notch target genes and act as transcriptional repressors, recruiting
histone deacetylase and other corepressors (NCoR/SMRT, MINT/SHARP/SPEN, CIR,
Hairless, CtBP, and Groucho/TLE) to form a transcription repressor complex (Fortini,
2009; Bianchi et al, 2006; Fiuza and Arias, 2007). Upon ligand induced activation,
NICD enters the nucleus and binds to CSL, removes the histone deacetylase/corepressor
complex and, together with coactivator Mastermind, forms a transcriptionally active
ternary complex (Borggrefe and Oswald, 2009; Fiuza and Arias, 2007; Fortini, 2009).
This active complex recruits general transcription factors, promoting increased
expression of Notch target genes (Fryer, White and Jones, 2004).
Several Notch target genes have been identified, but the most recognised targets in
mammals belong to a family of basic helix-loop-helix (HLH) transcription factors. They
are the HES (Hairy-Enhancer of Split) and the Hes-related factor families (HRT, also
known as HESR, HERP or CHF; HRP; HEY). These target genes function as
transcriptional repressors (Bolos et al, 2007; Bianchi et al, 2006; Borggrefe and
Oswald, 2009). Two other Notch target genes, NRARP (Notch regulated ankyrin repeat
protein) and Deltex-1 were shown to be potent negative regulators of Notch signalling.
Although NRARP’s transcription is activated by Notch signalling, it forms an inhibitor
complex with NICD-CSL, thereby functioning as a negative feedback regulator
(Yamamoto et al, 2001; Yun and Bevan, 2003; Krebs et al, 2001).
1.3.6 Degradation of Notch
Once the NICD is generated by irreversible proteolysis of the Notch receptor, the potent
NICD signalling fragment can no longer be controlled by ligand binding or cell-surface

15
events. It is therefore essential that the NICD turnover is tightly controlled to prevent
sustained signalling for an inappropriately long time or at very high levels (Kopan and
Ilagan, 2009; Fiuza and Arias, 2007). Sustained levels of NICD can be detrimental in
mammals with Weng et al showed that stabilising the NICD can cause T cell acute
lymphoblastic leukaemia (Weng et al, 2004).
Thus, in addition to the different regulatory mechanisms on the DSL ligands which
primarily control NICD production, optimal levels of NICD are regulated in cells by
ensuring that NICD has a very short half-life, lasting in most cases a fraction of the cell
cycle (Kopan and Ilagan, 2009). Therefore Notch mediated transcriptional activation is
stopped by the degradation of NICD. Protein degradation is a very effective method of
signalling regulation and one that is clearly used to keep the levels of NICD just above
the functional threshold. (Fiuza and Arias, 2007).
The active CSL-NICD-Mastermind ternary complex, in the nucleus, associates with a
protein called Ski-interacting protein (SKIP). SKIP is unique in that it can associate
with both the CSL co-repressors and with the CSL- NICD- Mastermind ternary
complex (Zhou et al, 2000; Kovall, 2007). SKIP and Mastermind recruit kinases that
specifically phosphorylate NICD in the TAD and PEST domains (O'Neil et al, 2007;
Fryer et al, 2004; Fiuza and Arias, 2007). Ubiquitination of the phosphorylated sites by
Fbw7/Sel 10 ubiquitin ligase leads to NICD degradation. This stops the signalling
process until the arrival of new NICD in the nucleus. Addition of ubiquitin by E3
ligases to DSL ligands, is termed ubiquitination, and this modification regulates ligand
signalling activity and cell-surface expression (Fryer et al, 2004).

16
Figure 1.4 Notch signalling is tightly regulated through an efficient process of NICD degradation.
A) Upon ligand induced activation, NICD enters the nucleus and binds to CSL, removes the
histone deacetylase/corepressor complex and, together with coactivator Mastermind, forms a
transcriptionally active ternary complex. B) The active CSL-NICD-Mastermind ternary
complex, in the nucleus, associates with a protein called Ski-interacting protein (SKIP). C)
SKIP and Mastermind recruit kinases that specifically phosphorylate NICD in the TAD and
PEST domains. Ubiquitination of the phosphorylated sites by Fbw/Sel 10 ubiquitin leads to
NICD degradation. D) In the absence of NICD, CSL proteins bind to the specific sequences of
the regulator elements of Notch target genes and act as transcriptional repressors, recruiting
histone deacetylase and other corepressors to form a transcription repressor complex. Adapted
from Fiuza and Arias, 2007.
1.3.7 CSL-independent Notch signalling
There is increasing evidence of a CSL-independent Notch signalling pathway. Shawber
et al. looked at the differentiation of mouse myoblasts into myotubes and found
expression of truncated forms of Notch lacking the ability to interact with CSL but still
inhibiting myoblast differentiation (Shawber et al, 1996). More work on Drosophila,
showed that mutant forms of Notch still exhibit gain of function phenotypes during
neurogenesis that are independent of Su(H), but dependent on shaggy, which plays a
central role in Wnt signalling. This study suggested a functional connection between
Notch and Wnt signalling, which other studies have confirmed (Lawrence et al, 2000;

17
Hayward et al, 2005; Brennan et al, 1999; Brennan et al, 1997). Nakhai et al found that
RBP-Jκ (another name for CSL) has a Notch independent role in pancreatic
organogenesis. They demonstrated an essential role for Rbpj, not Notch 1 and Notch 2
in pancreatic organogenesis (Nakhai et al, 2008).
Wnt signalling is mediated by β-catenin and it is thought that Notch modulates Wnt
signalling by setting up a threshold for the function of β-catenin. For example, Notch
has been able to suppress the development of osteoblasts in favour of chrondoblasts by
the suppression of β-catenin activity (Deregowski et al, 2006; Hayward et al, 2005).
1.3.8 Notch in normal tissue development
Notch signalling is used in many developmental events. It has been shown to regulate a
broad range of events in both embryonic and post-natal development. These include
proliferation, apoptosis, border formation, and cell fate decisions (Kloppel and Adsay,
2009). There are three basic functions of Notch which enable it to exhibit all the
phenotypic effects described later in this section (Fiuza and Arias, 2007).
The functions of Notch are:
1. Lateral inhibition: This is a notion that during cell development, only some
cells adopt their potential out of a group of cells with a common development
potential. Cells which adopt the potential suppress the same fate in the others.
This is known as lateral inhibition (Gibert and Simpson, 2003). For example,
during development, groups of ectodermal cells with a neural and epidermal
potential are inhibited by Notch and thereby do not achieve their neural fate

18
(Chiba, 2006). Similarly, in mammals, lateral inhibition plays an important part
in hair and cell development in the inner ear (Kiernan et al, 2005; Radosevic,
Fargas and Alsina, 2014).
2. Asymmetric cell fate assignation: Notch is mainly involved in binary cell fate
decisions. One way of involvement is by lateral inhibition and the other is by
asymmetric cell division which relies on cell polarisation, with Notch signalling
being localised to one part of the cell (Fiuza and Arias, 2007). Asymmetric
distribution of Notch signalling activity determines whether the daughter cells
will be a signal sending or a signal- receiving cell. Once this is determined, the
cells differentiate according to binary cell fate decisions mediated by Notch
(Hutterer and Knoblich, 2005; Le Borgne and Schweisguth, 2003).
An important example of Notch’s involvement in binary cell fate decision is its
role in the maintenance of stem cell population. Notch mediates many decisions
on whether a cell remains undifferentiated or differentiates in both embryonic
and post-embryonic cell stem systems (Chiba, 2006).
3. Boundary formation: Notch is involved in establishing boundaries between
different cell types during development. An example is the formation of
boundaries between the prospective somites during somitogenesis (Giudicelli
and Lewis, 2004). Although the full mechanisms are not fully understood, this is
thought to be achieved by a complex process of multiple Notch regulatory
mechanisms and also involving the Wnt pathway.

19
The role of Notch in the development of the central nervous system (CNS) in
vertebrates is very well documented (Bolos et al, 2007). Notch maintains neuronal
progenitors (neuronal stem cells) in a progenitor state and inhibits differentiation.
Several studies have shown that Notch influences multiple choice points in the neural
progenitor lineage. It has been shown that Hes1 (Notch target gene) mutation produces
severe defects in neural development, including lack of cranial neural tube closure and
anencephaly (Bolos et al, 2007). In contrast to neuronal differentiation, Notch has a
more instructive role in gliogenesis directly promoting the differentiation of many glial
subtypes. Notch signalling favours the generation of Müller glia cells at the expense of
neurons (Bolos et al, 2007). There are suggestions that Notch signalling has a role in
neuronal function in the adult brain (Bolos et al, 2007; Saura et al, 2004; Ables et al,
2011). High levels of Notch signalling are present in the adult brain and in particular
Notch is also thought to maintain neuronal stem cells in quiescence (Urbán and
Guillemot, 2014).
As mentioned previously the role of Notch in boundary formation is extremely
important in the patterning process leading to somite boundary formation and the
establishment of the anterior and posterior compartments of somites. Following Notch 1
mutation, irregular somites have been generated with abnormal segmental boundaries
(Bolos et al, 2007).
Notch is an essential regulator of the cardiovascular system and alterations in Notch
signalling lead to abnormal vascular development at multiple stages and to varying
degrees (Bolos et al, 2007; T. Wang, Baron and Trump, 2008; Zhang et al, 2014).
Mutation in Notch 3 is associated with CADASIL (cerebral autosomal dominant

20
arteriopathy with subcortical infarction and leukoencephalopathy), characterised by
strokes and vascular dementias (T. Wang et al, 2008). An insufficiency of Jagged 1
ligand causes Alagille syndrome, which is characterised by vascular anomalies amongst
other features (Bolos et al, 2007). Notch 1 and 4 have been found to be predominant in
the endothelium and Notch 1 and 3 are present in smooth muscle cells. Notch also plays
an important role in arterial/venous specification and patterning during development
and a mutation results in a loss of arterial identity and arteriovascular malformations
(Bolos et al, 2007; Zhang et al, 2014).
Notch is also involved in the development of some classical endocrine systems. For
example, Notch target genes Hes 1 and Hes 5 have been shown to control the progenitor
cell pool in pituitary gland development and their absence leads to severe hypoplasia
exhibited in mice lacking the genes (Kita et al, 2007). Notch has a similar effect on the
development of the pancreas as Hes 1 null mice pancreas precursor cells have shown
premature differentiation leading to severe hypoplasia (Avila and Kissil, 2013; Jensen
et al, 2000). Notch also has an additional role in the cell fate decision between
progenitor/exocrine and endocrine pancreas (Avila and Kissil, 2013).
Similarly, Notch signalling plays a role in regulating stem cell differentiation towards a
secretory or absorptive cell fate, through lateral inhibition, in the largest endocrine
gland, the gut (C. S. Lee and Kaestner, 2004). It has also been suggested that Notch
downregulates osteoclastogenesis and commits mesenchymal cells to the osteoblastic
cell lineage (Yamada et al, 2003).

21
Since the Notch pathway can lead to so many different and sometimes opposing
outcomes, it is thought that Notch function is context dependent, depending on dosage
and cell lineages (Bolos et al, 2007). Tight control of Notch is essential for the
development of most tissues and once development is complete, Notch is normally
down regulated in mature tissues.
1.3.9 The role of Notch signalling in malignancies
Tumour formation involves re-activation of down regulated pathways which were used
during embryonic development (Bolos et al, 2007) . In the same context, aberrant Notch
signalling, can lead to tumour formation (Bolos et al, 2007). Notch is interesting as it
can act as both an oncogene or as a tumour suppressor. It has been suggested that Notch
signalling plays a key role in haematological and solid malignancies. The outcome of
Notch action depends on signal strength, timing, cell type and context. The
consequence of abnormal Notch functioning depends on its normal function in the
given tissue (Radtke and Raj, 2003; Maillard and Pear, 2003). If the normal function of
Notch is as a gatekeeper or as a regulator of stem cells or as a regulator of precursor cell
fate, then abnormal functioning leads it to act as an oncogene; whereas it acts as a
tumour suppressor in tissues where it normally initiates terminal differentiation events
(Radtke and Raj, 2003; Bolos et al, 2007).
The Notch signalling pathway has oncogenic as well as tumour suppressive effects in
cancer, depending on cellular context. It has been identified as an oncogene in multiple
cancers, including leukaemia, colorectal, lung, cervical, breast and oral squamous
carcinoma (Avila and Kissil, 2013). Notch 1 function as a tumour suppressor in mice
non-melanoma skin cancer and may also function as a tumour suppressor in human

22
non-melanoma skin cancer. Notch has also been implicated as a tumour suppressor in
prostate cancer, hepatocelullar carcinoma and small cell lung cancer (Avila and Kissil,
2013).
Notch alone might not be a very efficient oncogene and must collaborate with other
oncoproteins to become a very efficient oncogene. In in-vitro experiments, in various
cell types, expressing NICD with certain oncoproteins, have induced transformation to
tumour cells (Bolos et al, 2007). Evidence suggests that in tumours where Notch acts as
an oncogene, Notch signalling inhibition can be used as a viable strategy for treatment
of certain solid and haemopoietic tumours (Nickoloff, Osborne and Miele, 2003; Aster,
2005). There is also evidence to suggest that in addition to its role as an oncogene
Notch also plays a big role in tumour angiogenesis (Zeng et al, 2005).
1.3.9.1 Haematological malignancies
Notch plays a key role in haematopoiesis. In fact, Notch 1 receptor was first detected in
human haematopoietic cells through its involvement in a chromosomal translocation in
leukaemic T cells (Ellisen et al, 1991). It was soon found to be also expressed by
multiple cells within the haematopoietic hierarchy, including bone marrow
haematopoietic progenitors (Milner et al, 1994). Notch 1 signalling is essential for
normal T cell progenitor development and specification in the thymus, as well as for
splenic marginal zone B cell development (Maillard, He and Pear, 2003). It also plays a
positive role in megakaryocyte development (Mercher et al, 2008). In addition to
mediating haemopoietic cell fate determination in the embryo and in the adult, Notch
signalling is also a critical factor in the maintenance of a pool of self-renewing
haematopoietic stem cells (HSC) (Milner and Bigas, 1999). Any dysregulation of the

23
Notch signalling pathway could therefore lead to the development of haematological
malignancies. The most obvious haematological cancer associated with Notch
dysregulation is human acute T cell acute lymphoblastic leukaemia/lymphoma (T-
ALL). This constitutes approximately 15-20% of ALL in both children and adults
(Bolos et al, 2007).
As mentioned earlier, Notch 1 was first discovered due to its involvement in
chromosome translocation (t) in human T-ALL. Chromosome translocation is seen in
less than 1% of all T-ALL. However, aberrant Notch gain-of-function activity has been
seen in the majority of human T-ALL. This places the Notch pathway at the centre of
T-ALL pathogenesis (Weng et al, 2004).
The theory that Notch functions as an efficient oncogene only when it is in association
with other dysregulated proteins is supported by the detection of mutations in multiple
molecular subtypes of T-ALL (Aster, 2005). c-MYC has also been identified as an
important direct target of Notch in T-ALL and in normal T-cell development. c-MYC
inhibitors have been shown to interfere with progrowth effects of activated Notch 1,
whereas forced c-MYC expression has been shown to rescue Notch 1 dependent T-ALL
cell lines from Notch withdrawal (Weng et al, 2006). These findings led to a phase I/II
clinical trial using a Notch pathway inhibitor to treat patients with refractory T-ALL
(Bolos et al, 2007). Despite a 48% reduction in mediastinal mass in one patient with
mutated Notch 1 out of 7 T-ALL patients after 28 days of treatment with Gamma
secretase inhibitors (GSI), there was subsequent disease progression in this patient and
none of the patients received an objective durable response. Furthermore, there was a

24
lot of gastro-intestinal toxicity associated with the impact of Notch inhibition on
intestinal linings (Tosello and Ferrando, 2013).
1.3.9.2 Solid Tumours
There is evidence that mammary stem cells might be the target of transformation during
mammary carcinogenesis. Notch signalling pathway has been implicated in the self-
renewal of normal mammary stem cells and there is a suggestion that the Notch
pathway plays a role in breast cancer (Bolos et al, 2007). Elevated expression of Notch
signalling pathway components have been reported in invasive breast cancer. Elevated
expression of Notch 1 and Jagged 1 has been linked to poor prognosis in breast cancer
patients (Acar et al, 2016). Work in mice has shown that activated Notch 4 leads to
arrested mammary gland development and eventually poorly differentiated
adenocarcinoma (Bolos et al, 2007). The role of Notch signalling pathway in breast
cancer is further supported by the study of NUMB expression, a cell fate determinant.
NUMB mediated negative regulation of Notch signalling has been found to be lost in
50% of human mammary carcinomas. This loss is due to increased Notch activation
which leads to specific NUMB ubiquitination and proteasomal degradation (Acar et al,
2016; Pece et al, 2004).
It has already been mentioned that Notch is essential for gut development and
homeostasis. However, the Wnt pathway has also been implicated in intestinal crypt
progenitor cell maintenance and its mutational activation is considered a play a major
role in the proliferative potential of intestinal adenomas and adenocarcinomas, due to
the loss of the intestinal suppressor gene Apc (Sancho, Batlle and Clevers, 2004).

25
Studies on the role of Notch signalling in intestine development and cancer have
indicated that Notch might function downstream of Wnt and both pathways synergize
as gatekeepers in the intestinal epithelium. Van Es et al have shown high levels of Hes-
1 expression in intestinal adenomas in mice, indicating Notch activation. Notch
inhibition by γ-secretase inhibitors, in these same cells, induces goblet cell
differentiation and reduces adenoma proliferation (van Es et al, 2005). Cross talk
between active Notch and WNT is important for tumourigenesis and cell proliferation
in colorectal cancer (Vinson et al, 2016). These results suggest that Notch signalling
and Wnt inhibitors could be combined in an approach for colorectal neoplasia
treatment.
Notch 1 acts as a tumour suppressor gene in mouse keratinocytes, promoting exit from
the cell cycle and entry into differentiation, whereas ras and Wnt signalling both work
upstream of Notch and suppress the activity of Notch (Bolos et al, 2007; Rangarajan et
al, 2001). Notch signalling does not inhibit melanoma, as it is does in keratinocyte
derived carcinomas. Experiments have shown that Notch activation is insufficient to
transform melanocytes into melanoma, but does have the ability to enable primary
melanoma cells to gain metastatic capability (Balint et al, 2005; Thelu, Rossio and
Favier, 2002).
Abnormal Notch expression has been reported in several other solid tumours. Cervical
(Zagouras et al, 1995), lung and brain malignancies (Cuevas et al, 2005; Sriuranpong et
al, 2001) are other examples of Notch 1 involvement. It has recently been found that the
Notch signalling has different effects on different stages of cervical cancer. In the early
stages of the disease Notch signalling is upregulated, whilst in the late stages Notch

26
signalling is downregulated (Sun et al, 2016). Notch 2 over-expression has been
reported in colorectal and cervical cancers, and meningioma. Notch 3 is involved in
melanoma and Notch 4 in breast cancer. Other malignancies which express high levels
of Notch ligands are prostatic, cervical and brain cancers (Cuevas et al, 2005; Santagata
et al, 2004; Gray et al, 1999).
1.3.10 Notch in Pancreatic Cancer
Notch signalling plays an important role in development of the pancreas by maintaining
pancreatic epithelial cells in a progenitor state and thereby delaying their differentiation
until the appropriate time (Mysliwiec and Boucher, 2009). It has been shown in mice
that reduced Notch signalling in the developing pancreas results in premature
differentiation and hypoplasia (Nakhai et al, 2008).
Although Notch 1 and Notch 2 are found to be expressed in the embryonic pancreas,
there is not much evidence of them being detected in the adult exocrine pancreatic cells.
Hes1 expression has been detected in the adult pancreas in only centroacinar cells and a
few ductal cells (Jensen et al, 2000; Fujikura et al, 2007). Increased expression of
Notch 1, Notch 2, Jagged 2 and Hes 1 were detected in the mouse exocrine tissue of
caerulein-induced regenerating pancreas (Jensen et al, 2000) and caerulein-induced
acute pancreatitis (Gomez et al, 2004). Pancreatic-specific Notch 1 deficiency also
results in impaired regeneration after caerulein-induced pancreatitis in mice (Siveke et
al, 2008). All these evidence supports the theory that although the Notch signalling
pathway remains relatively inactive in normal adult pancreas, it participates in the
regeneration process following pancreatic injury.

27
Pancreatic intraepithelial Neoplasia (PanIN) represents a pre-invasive form of
pancreatic ductal adenocarcinoma (PDAC)(Winter, Maitra and Yeo, 2006). There is
now an association of genetic alteration between the histological progression of low-
grade PanIN (PanIn-1) to intermediate grade PanIN (PanIn-2), to high grade PanIN
(PanIn-3), and finally to PDAC (Bardeesy and DePinho, 2002; Schneider et al, 2005;
Hezel et al, 2006). Compared to very minimal/no expression levels of Notch and their
ligands in normal adult pancreas, there is a moderate-to-high level expression of Notch
receptors, ligands and their target genes (Hes 1, Hes 4, Hey 1, Hey L) in metaplastic
ductal epithelium (Miyamoto et al, 2003).
Aberrant Notch 1 and/or Hes1 expression have been displayed in mutant mouse models
of PanIn-1 to PanIn-3 and PDAC. This supports the cumulative observations that
sustained re-activation of the Notch signalling pathway contributes to initiation,
progression and maintenance of pancreatic cancer in both humans and mice (Pasca di
Magliano et al, 2006; Miyamoto et al, 2003). A model, supported by several studies,
suggests that acinar cells are progressively replaced by duct-like epithelia (acinar-to-
ductal metaplasia), which can ultimately progress into PanIN and PDAC (Hezel et al,
2006; Bardeesy and DePinho, 2002; Schneider et al, 2005).
Treatment of primary acinar cells with TGFα causes acinar-to-ductal cell metaplasia, a
conversion associated with Notch 1 cleavage and Hey 1 expression. However,
prevention of Notch activation by γ-secretase inhibitors in these cell lines prevents
acinar to ductal metaplasia (Sawey, Johnson and Crawford, 2007). It has also been
shown that the Notch pathway can be activated in premalignant pancreatic epithelium
and malignant pancreatic cancer by transgenic overexpression of TGFα driven by an

28
acinar promoter (Sawey et al, 2007; Miyamoto et al, 2003). Since increased TGFα
signalling is seen as an initiating event (Bardeesy and DePinho, 2002; Schneider et al,
2005), these results indicate that sustained Notch re-activation, leading to PDAC, is an
early event.
Figure 1.5 Pancreatic intraepithelial neoplasia. Pancreatic intraepithelial neoplasia: PanIN-1A
(flat), PanIN-1B (papillary), PanIN-2 (papillary with nuclear changes), and PanIN-3 (severely atypical with mitoses,
budding, and luminal necrosis). Figure taken from Winter, Maitra and Yeo, 2006.
Although overexpression of NICD was sufficient to induce acinar-to-ductal metaplasia
in primary acinar cell cultures, it was not sufficient to initiate metaplastic lesions or
PanIN after 4 months. This led to the suggestion that NICD co-operates with other
signalling pathways to initiate pancreatic carcinogenesis (De La et al, 2008). Hes 1
expression has also been well documented in the Kras signalling model. It was possible
to form metaplastic and PanIN lesions in either pancreatic progenitors or mature acini,

29
by expressing NICD with an oncogenic Kras, at a time point where no such lesions
were observed in either NICD expressing or Kras expressing mice. This supports the
theory that both activated Kras signalling and aberrant Notch activity are needed to
initiate pancreatic carcinogenesis (De La et al, 2008).
Wang et al have shown that the acquisition of epithelial-mesenchymal transition (EMT)
phenotype of gemcitabine-resistant pancreatic cancer cells is linked with the activation
of the Notch signalling pathway (Z. Wang et al, 2009). Furthermore, they have
demonstrated partial reversal of EMT by inhibiting Notch activation. Their results
suggest that Notch signalling is associated with a chemoresistance phenotype of
pancreatic cancer cells, and so inactivation of Notch signalling by novel strategies could
be a potential targeted therapeutic approach for overcoming chemoresistance in
pancreatic cancer cells (Z. Wang et al, 2009) .
Interestingly, Plentz et al showed that γ-secretase activity is required for the progression
of pre-malignant to malignant pancreatic cells in vivo. Their experiment, using mice
exhibiting isolated PanIN lesions without detectable PDAC, involved treating animals
with γ-secretase inhibitors for 11 -13 weeks. Subsequent autopsies revealed that 12 out
of 34 mice without γ-secretase inhibitors developed PDAC, compared with none of the
25 mice treated with γ-secretase inhibitors. The findings were very important as it not
only confirmed the requirement of Notch signalling for PDAC progression, but also
offered a potential therapeutic target in this treatment-refractory malignancy (Plentz et
al, 2009).

30
The role of gamma-secretase as a potential therapeutic target for Notch signalling
pathway induced cancers was also further enforced by studies which demonstrated that
gamma-secretase inhibitors reduced the cell viability of T-ALL cell lines by inducing
cell cycle arrest and apoptosis (Lewis et al, 2007; Weng et al, 2004).
Gamma-secretase has been actively investigated in the past as a potential target which
could be exploited to prevent Alzheimer’s disease. Amyloid precursor protein is
cleaved sequentially by β secretase and gamma-secretase, and therefore releases the
amyloid β-peptide. Amyloid β-peptide is the precursor of the amyloid plaques found in
the brain of patients with Alzheimer’s disease (Shih and Wang, 2007). There are
toxicities associated with gamma-secretase inhibitors and these usually result from the
inhibition of Notch signalling. The toxicities primarily affect the intestine, thymus and
spleen (Jun et al, 2008). However, a phase 2 safety clinical trial demonstrated that γ-
secretase inhibitors can be safely tolerated for 14 weeks, and therefore prolonged use of
gamma-secretase inhibitor is conceivable (Fleisher et al, 2008). Since Notch signalling
does not play a major role in the normal adult pancreas, only cancerous cells should be
affected by gamma-secretase inhibition. Studies have shown that inhibition of Notch
signalling does not have deleterious effects on normal pancreatic exocrine and
endocrine functions (Fujikura et al, 2006; Siveke et al, 2008).
1.3.11 Notch Signalling as a potential Biomarker for
Pancreatic Cancer
There is a need for the discovery of specific blood biomarkers in the non-invasive
detection of pancreatic cancer as only 10% of tumours are amenable for surgical

31
resection at the time of diagnosis. The ineligibility of the other tumours are due to
factors such as late presentation, aggressive local spread and early metastasis (Stocken
et al, 2005). The most commonly used marker for pancreatic cancer is CA 19-9. This
has a median sensitivity of 79%, a median specificity of 82%, a median positive
predictive value of (PPV) 72 and a median negative predictive value of 81
(Goonetilleke and Siriwardena, 2007). CA 19-9 is a high-molecular-weight
glycoprotein and is expressed by several epithelial cancers, as well as in normal
pancreatic and biliary ductal epithelial cells, and it is also detectable in salivary mucus
and meconium (Marrelli et al, 2009). CA 19-9 is also elevated in patients with other
malignancies such as colorectal, liver, breast, and lung cancers, as well as non-
malignant diseases such as obstructive jaundice, pancreatitis, cirrhosis, and lung
disorders. Furthermore, CA 19-9 lacks sensitivity for early or small diameter pancreatic
cancer. Poorly differentiated pancreatic cancers also appear to produce less CA 19-9
compared to moderately or well-differentiated pancreatic cancer (Duffy et al, 2009;
Wu et al, 2013). Given all these limitations, CA 19-9 serum levels alone cannot
distinguish between benign, precursor lesions, and malignant pancreatic and biliary
tract conditions. The American Society of Clinical Oncology claimed the specificity
and sensitivity of Ca 19-9 alone is inadequate for a reliable diagnosis of pancreatic
cancer (Wu et al, 2013).
Biomarkers can be defined as molecules that acts as indicators of the physiological state
and are the hallmarks of change in tissues or bodily fluids during a disease process
(Yang et al, 2008). Cancer cells can secrete biomarkers into the bloodstream which are
absent or altered concentrations in healthy individuals (Yang et al, 2008). Measurement
of biomarkers in blood is a relatively non-invasive technique. Considerable and

32
dramatic improvement to genomic and proteomic technologies have contributed to the
molecular landscape of PANC being much greater understood (Bailey et al, 2016; Geng
et al, 2011).
The canonical pathway for Notch signalling is mediated by regulated intramembrane
proteolysis (RIP). Ligand binding generates sequential cleavages at S2, S3 and S4 sites
of the transmembrane receptor resulting in the release of NICD which translocate into
the nucleus and modifies target genes. Whereas the S2 cleavage occurs in the
extracellular juxtamembranous region, the resulting transmembrane fragment undergoes
intramembranous proteolysis at S3 and S4 sites. The S3 cleavage happens between the
cytosol and the membrane and results in the release of NICD into the cytosol, whereas
the S4 cleavage occurs in the transmembrane domain resulting in the release of a
putative Notch 1 fragment (Nβ) into the extracellular fluid (Okochi et al, 2002). By
methods of autoradiography and immunoprecipitation (using an antibody raised against
a peptide which corresponds to the N terminus of the Notch extracellular truncation),
Okochi et al were able to detect two Notch 1 peptides of ~3 and 6 kDa in methionine-
labelled HEK293 cells expressing Notch 1. They were also able to show that the level
of Notch 1 peptide increased with increased cleavage at S2 sites and decreased with the
addition of γ-secretase inhibitors. They were also able to show that the secretion of
Notch 1 peptides is greatly enhanced in cells expressing both Jagged-1 and Notch 1, but
it is hardly detectable in cells expressing either one of them. These results indicated that
the Notch 1 peptide secretion is a product of Notch receptor proteolysis and is a result
of Notch activation by its respective ligand. The production of the Notch 1 peptide is
also associated with the cleavage efficiency at S2 and S3/S4 sites (Okochi et al, 2006).

33
Using an antibody to immunoprecipitate the Notch 1 peptide, Okochi et al analysed the
molecular mass by matrix-assisted laser desorption ionisation time of flight (MALDI-
TOF) mass spectrometry (MS) and were able to pick up 2 major peaks with molecular
masses of 2306 and 2694 Da. The peptide sequences were determined based on the
sequence surrounding the epitope for the antibody and the Notch 1 peptides were found
to be composed of peptides S2 to S4. The shorter Nβ length was named Nβ21 and the
longer Nβ named Nβ25 (the numbers indicated their peptide length). (Okochi et al,
2006)
Artificial synthesis of these peptides and their subsequent examination using
immunoblotting on Tris-Tricine SDS-PAGE revealed that Nβ21 peptide corresponds to
a 3 kDa band and the Nβ25 peptide corresponds to a 6 kDa band. The results also
showed that there are extremely low levels of intracellular Nβ; Nβ21 is more stable in
SDS-PAGE; and the two species of Nβ fragments do not form a heterodimer. Based on
these results Okochi et al concluded that the secreted Nβ species corresponds to the
sequence of peptides between S2 and S4 cleavage, and Nβ21 is predominantly present
in cell culture. The N terminal of the Nβ is the same, whereas the C terminal is
dependent on the site of S4 cleavage. In Nβ25, the S4 cleavage takes place four amino
acids terminal to the site for Nβ21 cleavage (Okochi et al, 2006).
Ligand-induced Notch signalling is required for the metaplastic conversion of acinar-to-
ductal cells and ultimately pancreatic ductal adenocarcinoma and Notch signalling
inhibition could be used as a potential therapeutic target to prevent tumour progression.
The knowledge that Nβ fragments are secreted extracellularly during Notch activation

34
by their ligands suggests the possibility of exploring the idea of using Notch Nβ
fragments as biomarkers in malignancy of the pancreas.
Figure 1.6 Extracellular release of the Notch 1 peptides and its detection.
A. Schematic representation of the Notch 1 peptide release during activation. Cleavage
at S4 results in the extracellular secretion of Nβ peptide; whereas cleavage at S3 results
in NICD. B. Detection of the two Notch extracellular Nβ peptides on Mass
Spectrometry. C. schematic representation of two different Nβ peptides and the S2, S3,
S4 in Notch 1. The grey box indicates the putative transmembrane domain of murine
Notch 1. Figure adapted from Okochi et al 2006.
1.4. MicroRNAs
MicroRNAs (miRNAs) are a class of RNAs which are recently discovered and are
small (~22 nt), noncoding RNAs with gene-regulating functions. They are recognised
as epigenetic regulators of gene expression (J. Wang, Chen and Sen, 2016) Unlike most
biomarkers that are currently available, miRNAs appear to be cell type and disease
specific. They have been implicated in the regulation of a multitude of cellular

35
processes and also in the expression of cancer-related genes (Mardin and Mees, 2009; J.
Wang et al, 2016).
Figure 1.7 Biogenesis of miRNA.
miRNA begins as long primary miRNA (pri-miRNA) and is cleaved by Drosha and cofactor
DiGeorge Critical Region 8 protein complex to generate precursor miRNA (pre-miRNA).
Following the export of pre-miRNA from the nucleus by exportin 5 (EXP5), Dicer processes
the pre-miRNA into double stranded mature miRNA. Mature miRNA will be loaded into
Argonaute proteins (Ago), which separates mature miRNA into two single stranded miRNAs.
The functional strand becomes the mature miRNA and binds onto RNA-induced silencing
complex (RISC) and acts as its guide. Figure adapted from Blahna et al, 2012.
miRNAs are initially transcribed as long primary miRNAs (pri-miRNA), which are then
cleaved into precursor miRNA (pre-miRNA) in the nucleus by a nuclear
microprocessor complex composed of RNase III enzyme (Drosha) and cofactor
DiGeorge Critical Region 8 protein. The pre-miRNA is then exported into the
cytoplasm by a nuclear transport receptor, called Exportin 5, and then further cleaved
(by Dicer, another RNase III) into an imperfect miRNA double stranded RNA (dsRNA)
duplex that contains both the mature miRNA and its complimentary strand (miRNA*).
The dsRNA complex does not persist in the cell for long, and under the mediation of
argonaute 2 dissociates to a single functional guide strand (which becomes the mature

36
miRNA) and a passenger strand which disappears. The argonaute (Ago) are a group of
four proteins which arbitrate the effector function of the miRNAs either through
inhibiting translation of the target mRNA or by directly degrading the mRNA
transcript. The miRNA then loads onto the RNA-induced silencing complex (RISC) and
acts as its guide. The RISC binds to messenger RNA by the imperfect base pairing of
the miRNA to the 3’ untranslated region of the messenger RNA. The miRNA acts as a
guide thereby choosing which messenger RNA to bind to, whereas the RISC causes
posttranscriptional gene silencing by either cleaving the target messenger RNA or by
inhibiting the translational process. This essentially makes the miRNAs negative
regulators of gene expression, which can specifically and efficiently silence target genes
(Du and Zamore, 2005; Y. Li et al, 2010; Blahna and Hata, 2012; J. Wang et al, 2016).
1.4.1 MicroRNAs in cancer
In the last few years, there has been a lot of work documenting the biological
significance of miRNAs in tumour progression. miRNAs have been implicated in a
wide array of biological cell functions including cell proliferation, differentiation,
apoptosis, and stress resistance and also been shown to be key players in human cancers
(Z. Wang et al, 2010). miRNAs are involved in the process of cell proliferation and
apoptosis, the two key intimately linked process that are critical in the development and
progression of human malignancies. Aberrant expression of miRNAs has been reported
when comparing various types of cancer with normal tissues (Z. Wang et al, 2010). It is
thought that some miRNAs act as oncogenic and others act as tumour suppressors.
Oncogenic miRNAs are upregulated in cancers whereas tumour suppressive miRNAs
tend to be downregulated in malignancies (Z. Wang et al, 2010). Calin et al were the
first to show evidence of miRNA involvement in human cancer. They showed that miR-

37
15 and miR-16 were absent or downregulated in about 70% of chronic lymphocytic
leukaemia (CLL) cases (Calin et al, 2002). These miRNAs were later confirmed as
tumour suppressors (J. Y. Park et al, 2011). Several studies have identified some
miRNAs which are upregulated in specific cancers and other miRNAs which are
downregulated in other cancers (J. Y. Park et al, 2011). The studies have also shown
good correlation between miRNA expression signatures and specific clinical cancer
characteristics, which suggests that miRNA expression signatures could be used to
differentiate between normal and cancerous tissue (J. Y. Park et al, 2011).
1.4.2. MicroRNAs as potential biomarkers of pancreatic
cancer
miRNAs from solid tumours are detectable in peripheral blood samples and are also
found to be highly stable at room temperature (J. Y. Park et al, 2011). Many tissues
have been shown to have specific miRNA expression patterns (Mitchell et al, 2008; Fan
et al, 2008). Since Pancreatic Ductal Adenocarcinoma (PDAC) is a disease resulting
from both genetic and epigenetic alterations (Mardin and Mees, 2009), miRNAs could
be used a potential biomarker and therapeutic agent for this disease. miRNAs-216 and
217 have been identified to be specific for normal pancreas tissue, with only the
duodenum exhibiting a 15-25-fold lower expression on their tissue. These miRNAs
were shown to be downregulated more than 200-fold in PDAC samples, making them
potential biomarker candidates (Szafranska et al, 2007). miRNA-196a and miRNA-
196b were identified as miRNAs which are expressed in PDAC, but completely absent
in normal pancreatic and chronic pancreatitis tissue (Mardin and Mees, 2009;
Szafranska et al, 2007).

38
Using miRNA microarray expression profiling, Bloomston et al were able to identify
21 miRNAs with increased expression and 4 with decreased expression which
differentiated PDAC from benign pancreatic tissue in 90% of the samples. They were
also able to identify 15 overexpressed and 8 under-expressed miRNAs which
differentiated PDAC from chronic pancreatitis with 93% accuracy. Combining the
results, 11 miRNAs were found to differentiate cancer specimens from both chronic
pancreatitis and benign tissue (Bloomston et al, 2007). miRNA-196a-2 was found to be
higher in patients who had a lower median survival (14.3 months) compared to patients
with low expression levels of miRNA-196a-2 (median survival 26.5 months)
(Bloomston et al, 2007). The studies described so far have relied on expression profiles
from surgically excised tissue. This is not available pre-operatively and therefore not
useful in making therapy decisions.
Pancreatic juice can be collected during Endoscopic retrograde
cholangiopancreatography (ERCP) or by Endoscopic Ultrasound (EUS) guided Fine
needle aspiration (FNA) and examined for the presence of specific miRNAs. EUS FNA
is becoming a common modality used for preoperative diagnosis and staging of
pancreatic cancer (Jing et al, 2009). Szafranska et al were able to isolate miRNA from
FNAs of PDAC patients and controls. miRNA-196a was found to be specific for
PDAC, whilst miRNA-217 was found to be expressed in healthy normal pancreas
(Szafranska et al, 2007). miRNA-21 and miRNA-155 have been identified as the
miRNAs demonstrating the highest fold changes in intraductal papillary mucinous
neoplasms (IPMNs), which are non-invasive precursor lesions of pancreatic cancer
(Habbe et al, 2009). EUS-FNA is still an invasive procedure and development of
plasma or serum-based biomarkers still remains the desired outcome.

39
Wang et al selected a panel of only four miRNAs, miRNA-21, miRNA-210, miRNA-
155, miRNA-196a, and were able to show that these miRNAs were overexpressed in
blood plasma/serum and varying expression profiles of these samples can be used to
distinguish PDAC from normal healthy individuals with a sensitivity of 64% and a
specificity of 89%. It is important to remember that although these results are
encouraging, the small sample size consisting of extremes of adenocarcinomas and
healthy controls allow it to have limited clinical implications towards developing into
pancreatic cancer screening and an early detection modality currently (J. Wang et al,
2009). More work needs to be done with adequate sample size and varying grades and
stages of the disease before the miRNAs can be developed as biomarkers for early
detection of pancreatic cancer.
1.4.3 MicroRNAs and Notch
It is well established that loss of p53 tumour suppressor protein is a causative event in
the pathogenesis of at least 50% of all human malignancies (Ji et al, 2009; Fridman and
Lowe, 2003). Chang et al. demonstrated that miRNA-34a is a direct transcriptional
target of p53. They were also able to demonstrate that induction of miRNA-34a
promotes apoptosis through p53 dependent and independent mechanisms. MiRNA-34a
responsive genes are also highly enriched for those genes that regulate cell cycle
progression, cellular proliferation, apoptosis, DNA repair and angiogenesis (Chang et
al, 2007).
Since miRNA-34 has been implicated as a potential tumour suppressor, it has been
examined in some detail. Bommer et al reported that the anti-apoptotic Bcl-2 protein is
regulated directly by miRNA-34 (Bommer et al, 2007). He et al indicated that

40
expression of miRNA-34 induces cell cycle arrest in both primary and tumour-derived
cell lines (He et al, 2007). There are reports which link miRNA-34 to tumour initiating
cells, or cancer stem cells, in cancer initiation and progression. miRNA-34 is therefore
thought to target Notch, c-Met and Bcl-2 genes. These are genes which are involved in
the self-renewal and survival of cancer stem cells (L. L. Song and Miele, 2005;
Bommer et al, 2007; He et al, 2007).
Chang et al also observed a reduced expression of miRNA-34a of at least 2-fold in 15
pancreatic cell lines, when compared to normal pancreatic ductal epithelial cell lines
(Chang et al, 2007). A recent study by Ji et al examined the effects of functional
restoration of miRNA-34 on human p53-mutant pancreatic cancer cells. MiaPaCA2 and
BxPC3 cells were found to have very low expression levels of miRNA-34a, b, c but
high levels of their target genes Bcl-2 and Notch 1. They were able to show that
miRNA-34 restoration in human pancreatic cancer cells inhibited the expression of Bcl-
2, Notch 1 and 2. This significantly inhibited clonogenic cell growth and metastasis,
induced apoptosis and cell cycle arrest at G1 and G2/M. miRNA-34 restoration also
sensitised the cells to radiation and chemotherapy, and at least in part restored p53
tumour suppressive function in p53-deficient cancer cells. Most importantly, Ji et al
were able to show miRNA-34 restoration inhibits cancer stem cells accompanied by a
significant inhibition of tumour growth in both in vitro and in vivo (Ji et al, 2009). All
these findings suggest that miRNA-34 may provide a novel therapeutic approach for
p53 deficient pancreatic cancer.

41
1.5 Hypothesis, Aim and Objectives
Our overarching hypothesis is that there is sufficient evidence to suggest that Notch
plays a key role in pancreatic carcinogenesis and has the potential to be used as a
diagnostic and prognostic biomarker. There is also sufficient evidence to suggest that
miRNA can used as potential biomarkers in pancreatic ductal adenocarcinoma.
1.5.1 Aim
The aim of this study is to further investigate the role of the Notch 1 & 2 peptides and
miRNA and their potential as biomarkers in PDAC.
1.5.2 Objectives
1. To explore the potential of the Notch receptors as a biomarker in pancreatic
adenocarcinoma using solid phase extraction and mass spectrometry.
2. To investigate the expression of the Notch receptors in pancreatic
adenocarcinoma in vivo.
3. To explore the potential of miRNAs as a biomarker to differentiate between
healthy, early pancreatic cancer, late pancreatic cancer and chronic pancreatitis.

42
MATERIALS AND METHOD

43
2.1 Clinical Materials
A substantial part of this project involved work on human blood plasma obtained from
patients receiving treatment at University Hospitals of Leicester NHS Trust. Research
was also carried out on human pancreatic tissue, collected from the Department of
Pathology archives at the Leicester General Hospital. Ethics committee approval for the
use of this tissue in the study was obtained (LREC number 7176). A copy of the ethics
approval letter is contained in Appendix 1.
2.1.1 Patient recruitment for collection of blood
Along with healthy volunteers, patients included in the study were those treated for
pancreatic ductal adenocarcinoma (PDAC) or chronic pancreatitis, between 2010 and
2012 at the University Hospitals of Leicester NHS Trust. This timeframe was chosen in
order to allow for prospective plasma collection using the same collection and preparation
method for the different groups. PDAC patient lists were generated from Leicester
Hepatobiliary Multidisciplinary Team records. Chronic pancreatitis patients were
recruited from general Hepatobiliary clinics. Healthy volunteers were recruited by asking
relatives accompanying PDAC patients to clinics. This was done to include age-matched
volunteers for better comparison. Case notes were reviewed by a single observer (Clinical
Investigator) to confirm suitability for inclusion. Inclusion and exclusion criteria for all
patients and volunteers for the study are summarised below.

44
2.1.2 Patient Recruitment for immunohistochemistry
Patients included in this study had either resectable pancreatic cancer or advanced
pancreatic cancer which was deemed non-resectable. They were treated in Leicester
General Hospital, University Hospitals of Leicester NHS trust. The resectable group
were treated between October 2000 and May 2007. The non-resectable group were
treated between January 2003 and January 2007. Patients were identified from the
Inclusion criteria:
• Patients must be over 18 years of age
• Patients must be of sound mind to give written informed consent
• Patients must have a diagnosis of the following conditions
➢ Primary pancreatic ductal adenocarcinoma
➢ Chronic pancreatitis
• All patients with pancreatic malignancy must have disease amenable to
surgical exploration +/- resection/palliation or be suitable for treatment
with gemcitabine chemotherapy.
• All healthy volunteers must be over 18 years of age.
Exclusion criteria:
• Patients unfit for general anaesthesia.
• Patients with Alzheimer’s disease.
• For healthy volunteers, those with previous malignancy were excluded.

45
Leicester Hepatopancreatobiliary Multidisciplinary team database. The case notes were
reviewed by a single observer (previous PhD candidate Dr Chris Mann) to confirm
suitability for inclusion.
From the medical case notes and computerised hospital records, a database was created
containing the patients’ demographics and clinicopathological factors. These included
ages and genders, blood results including CA 19.9, treatment administered,
Inclusion criteria:
• Resectable group must have a surgical resection of pancreatic
adenocarcinoma.
• Non-resectable group is defined as patients with advanced cancer which have
been deemed unsuitable for curative resection.
• There must be tissue available for immunohistochemistry.
• Accurate follow up information must be available.
Exclusion criteria:
• Malignancy other than primary pancreatic ductal adenocarcinoma.
• Previous history of malignancy.
• Pre-operative chemoradiotherapy.
• Chemoradiotherapy before biopsy for tissue diagnosis in non-resectable
patients.
• Peri-operative mortality.

46
histopathological factors and survival data (updated as of 1st of January 2011). The
database was created by a previous PhD Candidate (Chris Mann) to investigate the
relationship of Notch 1,3 and 4 in pancreatic adenocarcinoma.
2.1.3 Tissue selection and assessment
Once suitable patients were identified from the case notes, original slides which were
used for histological diagnosis were retrieved from the Leicester General Hospital
pathology archive. The slides were then reviewed by an experienced Consultant
Histopathologist who specialised in Gastrointestinal pathology and blocks containing
PDAC and healthy tissue were identified. The selected blocks were then cut into
sections for immunohistochemical assessment.
2.2 Laboratory Materials
2.2.1 Materials for immunohistochemistry (chapter 4)
Details of materials used for immunohistochemistry are listed in table 2.1.
Table 2.1 Materials for immunohistochemistry
Material Company obtained from
Superfrost PlusTM slides Menzel-Glazer via Fisher Scientific
Glass cover slips Menzel-Glazer via Fisher Scientific
Haematoxylin-plus Vector Laboratories
DPX mountant Sigma
Envision+ detection kit Dakocytomation

47
2.2.2 Antibodies
Details of primary antibodies used for immunohistochemistry and mass spectrometry
work are shown in Table 2.2.
Table 2.2 Primary antibodies
Antibody against Species Clone Isotype Supplier
Notch 2 intracellular
domain (N2ICD)
Rabbit Polyclonal IgG Abcam
Notch 1 Nβ21
fragment
Rabbit Monoclonal IgG
Davids
Biotechnology
2.2.3 Materials for plasma preparation, solid phase extraction
and mass spectrometry (chapter 3)
Details of materials used for plasma preparation, solid phase extraction and mass
spectrometry are listed in table 2.3.
Table 2.3 Materials used for plasma preparation, solid phase extraction and
mass spectrometry
Material
Lithium Heparin tubes with Green BD
Hemogard™ Closure for blood collection
BD Vacutainer®
Oasis® HLB 1cc (30 mg) Extraction
Cartridges
Waters. Part no: WAT094225
Amicon Ultra Centrifugal Filters 0.5 mL
– 10K membrane
Millipore

48
Microcon Centrifugal Filter Devices;
Regenerated Cellulose 10,000 MWCO
Millipore
Dynabeads® Protein G. Invitrogen
Waters Q-ToF Ultima Global in MALDI
mode.
Waters
2.2.4 Materials for microRNA extraction and PCR (chapter 5)
Details of materials used for microRNA extraction and PCR are listed in table 2.4.
Table 2.4 Materials used for microRNA extraction and PCR
Material Company
EDTA KEA monovette collection tubes
used for blood collection
Sarstedt
miRneasy Mini Kit Qiagen
miScript II RT Kit Qiagen
miScript SYBR® Green PCR Kit Qiagen
Primers for use with miScript SYBR ®
Green PCR Kit
Biomers.net Germany
Optical 96-Well Reaction Plate Applied Biosystems
The primers for use with miScript SYBR ® Green PCR Kit were made into a
concentration of 5 pmol/µL by dissolving in Tris-HCl pH 7.5. The miRNA Primers used
were miR-10b, miR–21, miR-34a, miR–143, miR-148a, miR–155a, miR–196a, miR-
200c, miR–206, miR–375 and miR–503 (Table 2.5).

49
Table 2.5 miRNA Primers for use with MiScript SYBR® Green PCR Kit
Primer Name Sequence (5’ -3’)
miR-10b ATCCTGTAGAACCGAATTTGTG
miR-21 GCTAGCTTATCAGACTGATGTTGA
miR-34a GGCAGTGTCTTAGCTGGTTG
miR-143 TGAGATGAAGCACTGTAGCTC
miR-148a TCTCAGTGCACTACAGAACTTTGT
miR-155 TAATGCTAATCGTGATAGGGGTA
miR-196a GCTAGGTAGTTTCATGTTGTTGG
miR-200c TAATACTGCCGGGTAATGATG
miR-206 AGGAATGTAAGGAAGTGTGTGG
miR-375 TTGTTCGTTCGGCTCG
miR-503 TAGCAGCGGGAACAGTTCT
2.3 Solutions and Buffers
2.3.1 Solutions and buffers for immunohistochemistry
TBS (10x)
0.5 M Tris base (60.5 g); 1.5M NaCl (87.6 g) in 1 litre of distilled water and adjusted to
pH 7.6. The stock solution was kept at room temperature. Prior to use, the solution was
diluted to x1 with distilled water.
Tris-EDTA antigen retrieval buffer 10 mM Tris base, 1 mM EDTA.
This buffer was prepared fresh when required.
Tris base 1.818 g
EDTA 0.555 g
Tween-20 1 mL

50
The Tris base and EDTA were dissolved in distilled water. Tween was added and the
volume was made up to 1.5 L using distilled water
Tris Buffered Saline (TBS) (10x) wash buffer
Tris base 60.5 g Sodium chloride 87.6 g
The Tris base and NaCl were dissolved in distilled water and the pH adjusted to 7.6 using
concentrated HCl. The volume was made up to 1 L using distilled water. The solution
(500 mM Tris, 1.5 M NaCl) was stored at room temperature and diluted 1:10 prior to use.
Tris-HCl buffer for dilution of primary antibody
0.785 g Tris hydrochloride (MW 157.6) added to 100ml distilled water and was stored at
room temperature (50 mM, pH 7.2-7.6). Immediately prior to use the appropriate volume
was aliquoted and 1% BSA added.
Envision+ detection system
1. Peroxidase blocking solution
0.03% hydrogen peroxide containing sodium azide.
2. Secondary antibody
Peroxidase-labelled polymer conjugated to goat anti-rabbit immunoglobulin, in Tris-HCl
buffer containing stabilising protein and an anti-microbial agent.
3. Detection
One drop of 3,3-diaminobenzidine (DAB) added to 1ml substrate buffer, containing
hydrogen peroxide and a preservative immediately before use.

51
2.3.2 Buffers for Solid Phase Extraction
4% Phosphoric acid. Stored at room temperature
2 mL of concentrated phosphoric acid was added to 48 mL HPLC grade water. This
was stored at room temperature.
40% Acetonitrile, 0.1% trifluoroacetic acid (TFA)
40 mL acetonitrile was added to 60 mL HPLC grade water. 100 µL TFA was then
added to the solution. This solution was stored at room temperature.
50 mM Ammonium bicarbonate (NH4HCO3) pH 7.4
0.3953 g of Ammonium bicarbonate was dissolved in 100 mL HPLC grade water. pH
was adjusted to 7.4 using concentrated HCl, prepared fresh.
50 mM Tris pH 7.4
3.03 g Trizma was dissolved in 500 mL HPLC grade water and stirred until
dissolved. pH was adjusted to 7.4 using concentrated HCl. Buffer stored at room
temperature.
Citrate Phosphate Buffer pH 5.0
4.7 g of monohydrous citric acid and 9.2 g dibasic sodium phosphate were dissolved in
HPLC grade water and volume adjusted to 1 L after pH was adjusted to 5.0 using
concentrated HCL. Fresh buffer was made for each sample batch.
Citrate Phosphate Buffer + 0.01% Tween 20

52
2 µL of Tween 20 was added to 20 mL of the Citrate Phosphate Buffer.
Dimethyl Pimelimidate Dihydrochloride (DMP) in Triethanolamine
5.4 mg DMP (stored in -20°C) was dissolved in 1 mL triethanolamine pH 8.2 (stored in
4°C) immediately prior to use.
Phosphate buffered saline (PBS) with 0.01% Tween 20
To 40 mL of PBS was added 4µL Tween 20 and mixed.
0.1 M Citric acid pH 1.5
2.10 g of citric acid was dissolved in HPLC grade water and pH adjusted to 1.5 with
concentrated HCl. Final volume was made to 100 mL. Stored at room temperature. pH
was always checked before use.
-Cyano-hydroxycinnamic acid matrix (CHCA)
2 mg of -cyanno-hydroxycinnamic acid dissolved in 1 mL methanol:acetonitrile = 1:1
This solution was prepared freshly every week and stored in -20C.
0.1% Trifluoroacetic acid (TFA)
40 µL TFA was added to 40 mL of HPLC grade water. This was stored at room
temperature.

53
2.4 Methods – Immunohistochemistry
2.4.1 The EnVision+ immunohistochemistry technique
The technique employed for this study was the EnVision+ system, manufactured by
DAKO. Sabattini et al found this technique to compare favourably with other detection
methods such as LSAB and ABC (Sabattini et al, 1998) . The EnVision+ System, HRP
(horseradish peroxidase) is a two-step IHC staining technique and is based on an HRP
labelled polymer which is conjugated with secondary antibodies. The labelled polymer
does not contain avidin or biotin. As a result, nonspecific staining resulting from
endogenous avidin-biotin activity is eliminated or significantly reduced.
Figure 2.1 Schematic diagram depicting the Envision immunohistochemistry system.
The primary antibody binds to the antigen. The secondary antibody binds to the primary antibody.
The secondary antibody is attached to a dextran backbone. The dextran backbone has about 20
secondary antibodies and 100 enzymes, consisting of horseradish peroxidase (HRP) attached to it.
HRP reacts with a chromogen (DAB) to produce a brown colour.

54
The secondary antibody is conjugated with a dextran backbone (polymer) which is bound
to a large number of enzymes containing HRP molecules. Each dextran backbone holds
up to 20 secondary antibodies and 100 enzymes. This leads to marked signal
amplification. The advantages of this system include increased sensitivity, minimal non-
specific background staining and a reduction in the total number of assay steps as
compared to LSAB and ABC methods (Sabattini et al, 1998). (Figure 2.1) The HRP
forms a visible end product is by forming a complex with its substrate, hydrogen
peroxide. This complex reacts with a chromogen to produce a coloured molecule and
water. The chromogen in the EnVision+ System is 3,3 diaminobenzidine (DAB) which
produces a brown colour. It also has the advantage of being insoluble in alcohol and so it
can be dehydrated and mounted in conventional mounting media.
2.4.2 Preparation of tissue slides
The embedded tissues were processed by Karen Kulbicky (Department of Cancer
Studies and Molecular Medicine). The formalin-fixed, paraffin-embedded dehydrated
tissue blocks were cut into 5 µm sections onto Superfrost plus TM microscope slides
using a Shandon Citadel 2000 processor. The first section from each block was stained
with haematoxylin and eosin in order to identify different areas of histology. The rest of
the sections from the block were cut onto numbered slides so that serial sections from
the block could be examined.
A Shandon Varistain 24-4 staining machine (Shandon Inc, Pittsburgh, Pennsylvania,
USA) was used to perform the haematoxylin and eosin staining. Slides were initially
put through two changes of xylene for 3 min, followed by two changes of 100%
industrial methylated spirit (IMS), one change of 70% IMS, and one of distilled water,

55
for a minute each. The slides were then stained with haematoxylin for 1.5 min followed
by being rinsed in water for a minute. They were then dipped in 1% acid water for 15 s
followed by being washed 3 times in water. Eosin staining was carried out for 3 min,
followed by a 2 min wash in water. Slides were then put through 70% IMS, 4 changes
of 100% IMS and two changes of xylene.
2.4.3 Envision+ Immunohistochemistry protocol
Optimisation of immunohistochemistry for anti-Notch 2 antibody is described in Section
2.4.4. The general method is described below.
Paraffin sections were deparaffinised in two changes of xylene for 5 min each. The
sections were then rehydrated following two washes in 99% industrial methylated spirits
(IMS) and one in 95% IMS, all for 5 min each. The slides were washed in running tap
water for 5 min followed by distilled water for 5 min.
Antigen retrieval. One of the retrieval protocols recommended for the Envision kit is
microwave oven heating. This is a commonly used and easy method of heat-induced
antigen retrieval (HIAR). Tris-EDTA buffer was used. The buffer was preheated to
boiling and the slides then heated for 11 min at 900W. This was followed by heating at
360W for a further 21 min. Slides were then allowed to cool for 30 min at room
temperature in the Tris-EDTA buffer.
Peroxidase block. Following antigen retrieval, the slides are washed in tap water again
for 5 min and then in TBS for 5 min. Excess liquid was wiped from the slide around the
sections and one-two drops of the supplied peroxidase blocking solution placed over the

56
tissue (enough to cover the section). The slides were then incubated for 10 min in a
humidified chamber at room temperature. They were then rinsed with TBS before being
washed in a TBS bath for 5 min. The peroxidase block is done in order to prevent
generalised non-specific staining from small amounts of endogenous peroxidase which
are present within normal tissues.
Primary antibody. The primary antibody was diluted in 0.05M Tris-HCl buffer, to which
1% BSA was added before use. 150–200 µL of the diluted primary antibody was applied
to each section. The slides were then incubated in a humidified chamber. Optimised
antibody concentrations, incubation times and conditions are mentioned in section 2.4.4.
In order to exclude non-specific staining, a negative control was included in each run.
This consisted of a section incubated with a non-specific immunoglobulin, of the same
class as anti-Notch 2 used, which was diluted to the same concentration as the diluted
antibody in Tris-HCl buffer. A section of normal liver (positive control tissue) was
included in each run to ensure consistent staining between experiments. Following
incubation with the primary antibody, the slides were rinsed with TBS and then washed
twice in TBS for 5 min baths.
Peroxidase labelled polymer. Excess liquid was again wiped from around the sections
and adequate drops of the supplied peroxidase labelled polymer was added to each section
and incubated for 40 min in a humidified chamber at room temperature. Following
incubation, sections were rinsed with TBS and then washed twice in TBS baths for 5 min
each.

57
Substrate-chromogen. One drop of DAB+ chromagen was added to 1 mL of DAB+
substrate buffer and the solution was vortexed to mix. Excess liquid was wiped from
around the sections and two drops of the mixed DAB+ solution was added to each section.
Sections were incubated in a humidified chamber at room temperature for 10 min. They
were then rinsed with distilled water, followed by two distilled water baths for 5 min
each.
Counterstaining. The sections were then rinsed in tap water, followed by counterstaining
with vector haematoxylin QS for 5 s, and rinsed again in tap water. The slides were then
put back through 95% IMS for 3 min, followed by 99% IMS for 3 min x 2 and two
changes of xylene (3 min each). The slides were then wet mounted with DPX mountant
using glass coverslips.
2.4.4 Optimisation of immunohistochemistry
Tissue fixation by standard methods, such as the use of formalin, could result in masking
of antigenic sites due to crosslinking of proteins. This is especially the case for the
monoclonal antibodies, as there is a less of a chance of masking all epitopes recognised
by polyclonal antibodies. During the 1990s, it was shown that formalin-induced cross
linkages of proteins could be broken down by heat treatment with subsequent successful
antibody usage in formalin-fixed specimens (Shi, Key and Kalra, 1991). After review of
the literature it was established that heat-mediated antigen retrieval technique by
microwaving would be used.
Optimisation of staining was achieved using suitable positive control tissue. Normal
healthy liver was identified as a good positive control for Notch 2 (Gao et al 2007).

58
Experiments were conducted using serial dilutions of primary antibody to find the best
IgG concentration for Notch 2. A series of experiments were also done to check whether
the microwaving time for HIAR or primary antibody incubation conditions (at room
temperature for 1 h vs. 4oC for 18 h) was resulting in excessive background staining. In
this manner, an optimised protocol for Notch 2 was produced (shown in Table 2.6).
Table 2.6 Optimal conditions for Notch 2 antibody
Antibody Concentration Incubation
duration
Positive control
tissue
Notch 2 1/500 1 h at RT Normal Liver tissue.
2.4.5 Scoring of immunohistochemical staining
An Axioskop 2 Plus microscope was used for slide interpretation and image capture
(Carl Zeiss Ltd, Hertfordshire, UK). The scoring system was previously devised in the
department with the assistance of a consultant histopathologist and was already used to
investigate the expression of Notch 1, 3 and 4 in PDAC. Slides were initially assessed
under 100x magnification and areas of staining were identified, which were then
examined at a higher power (400x) to identify stain localisation (cytoplasmic or
nuclear). Cytoplasmic staining was measured by a semi-quantitative assessment of the
proportion of positive tumour cells/ductal epithelial cells, ranging from 0% to 100%,
with scores in 10% increments according to the percentage of the tumour cells/ductal
epithelial cells stained. Nuclear staining was graded positive if > 10% of tumour/ductal
epithelial cell nuclei stained positive. If less than 10% of tumour/ductal epithelial cell
nuclei stained positive, then the nuclear staining was graded negative. Staining intensity
was avoided since the degree of staining intensity has been shown to vary by tumour

59
type, as well as being partially influenced by the choice of fixatives and inversely
correlated with storage time of the unstained tissue sections. The inter-observer
agreement of staining intensity assessed by multiple observers was also noted to be only
moderate to poor (Zlobec et al., 2007). Slides were graded independently by two
observers (post graduate student Dr Masood and a consultant histopathologist Dr Kevin
West) blinded to the clinical data. In very few cases (<5%) where there were
discrepancies in the score given by each observer, the slides were re-reviewed by both
observers simultaneously and a final score agreed
2.5 Methods – Patient Plasma Preparation
Blood from patients was taken in both heparin coated tubes and EDTA tubes. The tubes
were immediately placed in ice. Within 2 h the bloods were fractionated into plasma,
white blood cell layer and red blood cell layer by centrifuging the sample for 10 min at
2000 g at 4°C. The resulting plasma was aliquoted into labelled cryotubes and stored at
-80°C.
2.6 Methods – MicroRNA
2.6.1 Extraction of miRNA from plasma (miRNeasy Kit)
The plasma samples were thawed on ice with gentle inversion periodically to mix the
sample. 4 mL (10 times the volume of plasma) of QIAzol lysis reagent was added to
400 µL of plasma and vortexed vigorously. This homogenous solution was left in a tube
on the bench top at room temperature for 5 min. The solution was then spiked with 5
µL of synthetic C elegans (5 fmol/µL) as control miRNA and vortexed to mix the

60
spiked synthetic with the homogenous solution. The homogenised plasma was
combined with 800 µL of chloroform (0.2 mL of chloroform per 1mL of QIAzol lysis
re-agent used) followed by at least 30 s of vigorous mixing by using a vortex at
maximum speed. The solution was then incubated at room temperature for 3 min
following which it was centrifuged at 12,000g for 15 min at 4°C. This separated the
solution into 3 phases: an upper, colourless, aqueous phase containing RNA and
miRNAs; a white interphase containing DNA; and a lower red phenol-chloroform
phase. The RNA containing aqueous phase was then transferred into a fresh tube and
the volume of aqueous phase measured and 1.5 times the volume of 100% ethanol was
added and vortexed. At least 700 µL portions of the sample was then applied into an
RNeasy Mini spin column in a 2 mL collection tube. The spin column was then
centrifuged at ≥ 8000g for 30 s at room temperature. Flow-through from the column
was discarded. This process was repeated as many times as necessary until all the
aqueous phase-ethanol-mix sample was exhausted.
The following step is the DNase treatment and was done to remove any possible traces
of DNA from the preparation. 350 µL of Buffer RWT was pipetted into the RNeasy
Mini spin column and centrifuged for 15 s at ≥ 8000g and the subsequent follow
through was discarded. 10 µL of DNase 1 stock solution was added to 70 µL of Buffer
RDD. This is mixed by gently inverting the tube. 80 µL of the DNase 1 incubation mix
was then pipetted directly onto the RNeasy Mini spin column membrane and placed on
the benchtop at room temperature (20–30°C) for 15 min. 350 µL of Buffer RWT was
then pipetted into the RNeasy Mini spin column and centrifuged for 15 s at ≥ 8000g.
The follow through was discarded.

61
After the DNase treatment, 500 µL of Buffer RPE was pipetted onto the RNeasy Mini
spin column. The lid was closed and centrifuged for 15 s at ≥ 8000g to dry the RNeasy
Mini spin column membrane and ensure that no ethanol was carried over during RNA
elution. Another 500 µL of Buffer RPE was added to the RNeasy Mini spin column and
the process repeated with centrifugation now lasting for 2 min. The RNeasy Mini spin
column was carefully removed from the collection tube with special consideration taken
to ensure that no contact was made with the follow-through. The RNeasy Mini spin
collection was transferred to a new 1.5 mL collection tube and 50 µL of RNase-free
water was pipetted directly onto the RNeasy Mini spin column membrane. The lid was
closed and the tube left standing in room temperature for 10 min, following which the
tube was centrifuged at ≥ 8000g for 1 minute at room temperature. This process was
repeated with 50 µL of RNase-free water. The total 100 µL eluent, containing the total
RNA and miRNA was collected and transferred to an eppendorf before being stored at -
20°C.
2.6.2 miScript Reverse Transcription and SYBR® Green R -T
qPCR
The RNA obtained from human plasma was reversed transcribed using the miScript II
RT Kit. The template RNA was thawed on ice. The 10x miScript Nucleics Mix and 5x
miScript HiSpec Buffer was thawed at room temperature. The reverse-transcription
master mix was prepared on ice with the different volume of the components of which
are outlined in Table 2.7. The template RNA was added to the tube containing reverse-
transcription master mix. This was mixed gently, followed by brief centrifugation and
then placed on ice. The solution was incubated for 60 min at 37°C, after which it was

62
incubated for 5 min at 95°C, to inactivate the miScript Reverse Transcriptase Mix, and
placed on ice. The 20 µL mix (containing cDNA) was diluted to 100 µL by adding 80
µL of RNase-free water and mixed by pipetting. The cDNA was either used for real-
time PCR immediately or stored in -20°C until used for real-time PCR.
Table 2.7 Reverse-transcription reaction components
Component Volume
5x miScript HiSpec Buffer 4 µL
10x miScript Nucleics Mix 2 µL
miScript Reverse Transcriptase Mix 2 µL
Template miRNA 12 µL
Total 20 µL
The miScript SYBR® Green PCR Kit was used to perform real-time qPCR on the
diluted cDNA. 2x QuantiTect SYBR Green PCR Mater Mix, 10x miScript Universal
Primer, 10x miScript Primer Assay and the template cDNA were thawed on ice. A
miScript mastermix was made with the different volume of the components as outlined
in Table 2.8. Three microlitres of the diluted cDNA template was added into the
individual wells of the 96-well PCR plate. The mastermix was thoroughly mixed and 13
µL of the mastermix was aliquoted into each well of the PCR plate. An optical adhesive
cover was used to seal the PCR plates. The plate was gently mixed followed by
centrifugation at 1000g for 1 minute. The samples were then analysed using a 7300
Real Time PCR system (Applied Biosystems). The cycling conditions are shown in
Table 2.9.

63
Table 2.8 Reaction setup for real-time PCR
Component Volume for 1 reaction
2x QuantiTect SYBR Green PCR Master Mix 8 µL
10x miScript Universal Primer 2.5 µL
10x miScript Primer Assay 2.5 µL
Template cDNA 3 µL
Total 16 µL

64
Table 2.9 Cycling conditions for real-time PCR
Step Time Temperature
PCR Initial activation step 15 min 95°C
3 -step cycling
Denaturation 15 s 94°C
Annealing 30 s 55°C
Extension 34 s 70°C
Cycle number 44 cycles
Melting curve Analysis
Denaturation 15 s 95°°C
Annealing 30 s 60°C
Extension 15 s 95°C
Cooling 4°C
2.7 Methods – Mass Spectrometry
2.7.1 Steps used for sample preparation.
2.7.1.1 Preparation, solid phase extraction and freeze drying
The samples were mixed in equal volume of 4% phosphoric acid and incubated in ice
for an hour. This was done to break the tertiary bonds of the proteins and therefore
make them more amenable to SPE as well as to make more binding sites available for

65
immunoprecipitation by antibody-bound magnetic dynabeads. SPE was carried out
using hydrophilic-lipophilic-balanced reversed phase 1 cc Oasis columns obtained from
Waters. They were primed before use and were placed on a vacuum manifold
maintaining a suction pressure of ~ 5 mmHg. The SPE cartridges were activated with 1
mL of HPLC grade methanol and then 1 mL of HPLC grade water was used to wash off
the activation solvent. The samples were then loaded onto the primed SPE columns.
Following SPE, the samples were placed in a centrifugal evaporator for 1 h to remove
any volatile liquids, which were acquired during SPE during elution, and also to
concentrate the eluates. After centrifugal evaporation, the samples were freeze dried to
remove all the solvent and to further concentrate the analytes. Freeze Dried Pellets
(FDP) which contained the sample were maintained at -80°C prior to the next step.
2.7.1.2 Dissolving the FDP and size-exclusion filtration
The freeze-dried pellets were then resuspended in 50 µL of 0.1% trifluoroacetic acid
(TFA) and passed through centrifugal filter devices with a molecular weight cut off at
10,000 Da.
2.7.1.3 Immunoprecipitation using magnetic dynabeads
Following size-exclusion filtration, the sample was incubated in 4°C with antibody
coupled magnetic dynabeads. The dynabeads were then washed and the peptides eluted.
The main steps during immunoprecipitation were washing of the dynabeads with
appropriate buffers; capture of IgG to the dynabeads; crosslinking of the antibody to the
dynabeads; resuspension of the FDP in ammonium bicarbonate followed by size-

66
exclusion filtration; capture of the Notch 1 peptide to the antibody-bound-dynabeads;
and elution of the Notch 1 peptide. The procedure was adapted from the product leaflet
provided by Invitrogen.
2.7.1.3.1 Dynabeads washing steps
Prior to using the dynabeads, the solution in which it was suspended was vortexed to
ensure that the dynabeads went back into suspension evenly. Dynabeads (100 µL) were
taken and placed in a magnetic rack (magnarack provided by Invitrogen) for two min.
The magnarack resulted in the beads coming out of suspension and sticking to a side of
the eppendorf allowing the removal of the solvent without disturbing the beads. The
beads were washed twice with 500 µL of citrate phosphate buffer pH 5.0 containing
0.01% Tween-20, using the magnetic rack after each wash to remove the buffer. This
method of using the magnetic rack to isolate the dynabeads was used at the end of every
step, whether it was to wash, or to remove the buffer.
Invitrogen recommended the use of PBS or citrate phosphate buffers with a pH range of
5-7, but their results indicated that the dynabeads captured more IgG at pH 5.0
compared to pH 7.4. Based on these findings citrate phosphate buffer, pH 5.0 with
0.01% Tween-20 was used as the wash buffer.
2.7.1.3.2 IgG capture procedure
The amount of Ig captured by the Dynabeads is dependent on the concentration of Ig
and the Dynabeads protein G in the starting sample. It has been recommended by the
manufacturer that the concentration of Dynabeads protein G in the antibody solution

67
should be similar to the concentration of the Dynabeads protein G in the starting vial.
Since 100 µL of suspended Dynabeads was used from the vial, the dynabeads stuck to
the side of the eppendorfs in the magnarack following the two washes were
resuspended in a total volume of 100 µL. This volume was composed of 50 µL of
buffer and 50 µL of antibody solution.
Invitrogen provided a graph which shows the relationship between the amount of IgG
captured and concentration (IgG/mL) in the sample. This shows a rapid increase in IgG
captured until 25 µg IgG/mL is reached. After this, the increase in IgG capture is very
slow and begins to plateau at 100 µg IgG/mL. Twenty-five µg IgG equates to 19 µL of
Notch 1 antibody and 100 µg IgG equates to 76 µL of antibody. Since there was a
limited supply of polyclonal antibody to Notch 1 peptide (5 mLs), 50 µLs of antibody
was used for each sample.
Fifty microlitres of antibody was diluted with 50 µL of citrate phosphate buffer and the
dynabeads were suspended in this solution and mixed gently using a rotating table for 2
h at room temperature to ensure maximum amount of Ig-binding, as recommended by
the manufacturer. Following capture of the antibody, the Dynabeads were washed three
times with the citrate phosphate buffer, pH 5.0 with 0.01% Tween-20.
2.7.1.3.3 Cross-linking of Ig to Protein G
The Dynabead protein G- Ig complex was washed twice in 1 mL of 0.2 M
triethanolamine, pH 8.2 using the magnetic rack. The beads were then resuspended in 1
mL freshly made 20 mM dimethyl pimelimidate hydrochloride (DMP) in 0.2 M
triethanolamine, pH 8.2. They were left to incubate in a gentle mixer for 30 min at room

68
temperature. They were again placed on the magnetic rack for 2 min and the
supernatant discarded. The dynabeads were then resuspended in 1 mL of 50 mM Tris,
pH 7.5, and incubated for 15 min by gentle mixing to stop the cross-linking reaction.
Following this, the supernatant was again discarded and the beads were washed three
times using 100 µL PBS containing 0.01% Tween-20 and finally the supernatant was
discarded leaving behind the cross-linked dynabeads.
2.7.1.3.4 Immunoprecipitation of Notch 1 peptide
The freeze-dried pellets (which were stored in -80°C until required) were dissolved in
100 µL of 50 mM ammonium bicarbonate buffer, pH 7.4. The solution was then passed
through a centrifugal filtration device with a cut off of 10,000Da. The resulting filtrate
which should contain the Notch peptide was incubated with the Notch 1 antibody
crosslinked-dynabeads at 4°C and gently mixed overnight for a minimum of 12 h.
2.7.1.3.5 Target Protein Elution Procedure
The suspension was placed on the magnetic rack for 2 min and the supernatant
discarded. The beads were washed with 1 mL of 50 mM ammonium bicarbonate (pH
7.4) three times. After each wash the supernatants were collected and retained as wash
1, 2 and 3 respectively. It was recommended by Invitrogen that 30 µL of 0.1 M citric
acid, pH 2-3 should be used to elute the target peptide from the cross-linked Ig G-
protein G complex. Following mixing for 2 min, the samples were placed on the
magnetic rack for 2 min and the supernatant collected as eluant 1. This step was
repeated again for eluant 2. The eluants were then mixed with 0.1% TFA and further
mixed with matrix for spotting onto the target plate for MALDI-MS analysis.

69
2.7.2. Preparing the sample for MALDI analysis
The final enriched sample was mixed with 1:1 with matrix {αCHCA dissolved in an
acetonitrile:methanol solution (1:1, V/V) in a ratio of 2 mg/mL}. The resulting solution
was then loaded onto MALDI target plates by using 1 µL for each spot and air dried.
The plate was analysed using MALDI-MS. All experiments were done using a Waters
Q-ToF Ultima Global in MALDI mode (Walters, Milford, US). Each spot was
subjected to 100 laser ablations giving a high resolution MALDI mass spectrum
containing 1.2 million events tagged with a sensitivity of m/z 0.01 or better covering a
range of m/z 800-3000. Thus, combining the spectra from 4 wells provided 5 million
events which are sufficient to produce high resolution spectra with a bin size of m/z
1. The resolution of the spectrometer is a function of m/z. The Full Width Half
Maximum (FWHM) rises from 2 to 7 over the m/z range 800-3000. The scatter of the
point about the regression line is largely introduced by the counting statistics on
individual peaks. The intrinsic resolution of the machine is better than this but the
resolution of peptide peaks is limited by the isotopic spread and confusion (see below).
The gain and calibration of the MS were regularly checked and accuracy achieved
repeatable to m/z 0.5 over the entire spectral range.

70
Part 1 - Solid Phase Extraction
50 µL of Plasma + 50 µL of 4% Phosphoric Acid
Solid Phase Extraction
Centrifugal Evaporator
1 hour room temperature
Oasis HLB 1cc CartridgesWashed – 1 ml HPLC H2OEluted – 40% Acetonitrile .1% TFA
1 hour
Freeze Dried Pellets. Stored in -80°C until required
Freeze Dried Overnight
-80°C for half an Hour until Frozen
Part 2 - Immunoprecipitation100 µL of Dynabeads extracted from Soultion
Washed with Citrate Phosphate Buffer
50µL Antibody + 50 µL Citrate Phosphate Buffer + Dynabeads
Mixed at room temperature for 2 hours
Crosslinking of Ig’s toDynabeads Protein G
Freeze Dried Pellets dissolved in Ammonium Bicarbonate
Centrifugal Filer 10,000 MWCO (Microcon/Amicon)
Dissolved Peptide & Crosslinked Dynabeads incubated overnight at -4°C
Washed with Ammonium Bicarbonate
Peptide Eluted using 0.1M Citric Acid pH 1.5Samples analysed using Mass Spectometry
Figure 2.2 Schematic diagram of the steps involved in sample purification and enrichment.
This is a diagram showing the steps involved in sample purification and enrichment. It has been
divided into two parts for simplification. Part 1 shows the steps involved in purification of the
sample. Part 2 shows the steps involved in enrichment of the peptides and its subsequent preparation
for MALDI-MS analysis. Before the start of immunoprecipitation, the sample undergoes size-
exclusion filtration.

71
INVESTIGATING NOTCH 1
AND NOTCH 3 AS POTENTIAL
BIOMARKERS FOR
PANCREATIC DUCTAL
ADENOCARCINOMA USING
MASS SPECTOMETRY

72
3.1 Introduction
This chapter describes the use of Notch signalling pathway products as potential
biomarkers in pancreatic ductal adenocarcinoma. Notch is mediated by intramembrane
proteolysis as described in chapter 1. Ligand binding generates sequential cleavages at
S2, S3 and S4 sites of the transmembrane receptor resulting in the release of Notch
Intracellular Domain (NICD) which translocates into the nucleus and modifies
expression of target genes. Whereas the S2 cleavage occurs in the extracellular
juxtamembranous region, the resulting transmembrane fragment undergoes
intramembranous proteolysis at S3 and S4 sites. The S3 cleavage happens between the
cytosol and the membrane and results in the release of NICD into the cytosol (Roy et al,
2007; Kopan and Ilagan, 2009). Okochi et al showed in murine cell line that the S4
cleavage in the transmembrane domain resulted in the release of a putative Notch 1
fragment (Nβ) into the extracellular fluid (Figure 3.1). They were further able to detect
two Nβ fragments, Nβ21 and Nβ25 by a process of immunoprecipitation and analysis of
the molecular masses of the immunoprecipitated peptides by matrix-assisted laser
desorption ionisation time of flight (MALDI-TOF) mass spectrometry. Nβ21 had a
molecular mass of 2306 and Nβ25 has a molecular mass of 2694 Daltons and both these
Notch 1 peptide sequences were found to be composed of peptides from the S2 to S4
cleavage sites (Okochi et al, 2006) (Figure 3.2).
It was also shown that the secretion of Notch 1 peptides was greatly enhanced in cells
expressing both Jagged-1 and Notch 1, but was hardly detectable in cells expressing
either one of them indicating that the Nβ peptide secretion is a product of Notch
receptor proteolysis as a result of activation by its respective ligands (Okochi et al,
2006). It is also known that ligand-induced Notch signalling is required for the

73
metaplastic conversion of acinar-to-ductal cells and ultimately pancreatic ductal
adenocarcinoma. Notch signalling inhibition is considered a potential therapeutic target
to prevent tumour progression (Sawey et al, 2007; Miyamoto et al, 2003). The
knowledge that Nβ fragments are secreted extracellularly during Notch activation by
their ligands suggests possible exploration of the idea of using Nβ fragments of Notch
as biomarkers in pancreatic malignancy.
Figure 3.1 Schematic diagram of Notch 1 signalling.
Notch receptors, when activated by their ligands, initiates a sequential cleavage of the
transmembrane receptor. S2 cleavage occurs at the extracellular juxtamembranous region. The S3
cleavage occurs between the cytosol and the membrane. The S4 cleavage occurs in the
transmembrane domain resulting in the release of the Nβ peptide fragment. Figure taken from
Okochi et al 2006.
The aim of this chapter is to determine whether Notch 1 Nβ fragment could be detected
in human plasma and assess its potential as a biomarker for pancreatic ductal
adenocarcinoma. If successful, the intention is to carry out similar analysis for other
Notch receptors.

74
Figure 3.2 Detection and sequencing of Notch 1 Nβ peptide.
A. Okochi et al were able to detect 2 major ions of m/z 2306 and 2694 in Notch 1-expressing
murine cells using their methods of immunoprecipitation. B. MALDI-TOFMS spectra of the
synthetic N21 and N25 peptides. C. schematic representation of two different N species and the
S2, S3, S4 cleaved sites in Notch 1. The grey box indicates the putative transmembrane domain of
murine Notch 1. Figure taken from Okochi et al 2006.
3.2 Background information on Mass Spectrometry
The principle of mass spectrometry relies on the formation of gas phase ions (either
positively or negatively charged) and their separation depending on the mass to charge
ratio (m/z). A typical mass spectrometer consists of three parts: an ionisation source
which ionises the sample, a mass analyser where the charged ions are separated
depending on their mass and charge, and an ion detector which detects the current and
amplifies it (El-Aneed, Cohen and Banoub, 2009). With the advent of soft ionisation

75
techniques, first described in 1974 (Karas and Hillenkamp, 1988), which did not
destroy thermally unstable, polar biological compounds, MS could be used for
proteomics studies. Soft ionisation means that minimal energy is used to ionise the
analytes. Matrix Assisted Laser Desorption Ionisation (MALDI) and ElectroSpray
Ionisation (ESI) represent the advancements required to allow researchers to use MS
easily in the study of biological substances, such as glycoconjugates, DNA and proteins
(Karas and Hillenkamp, 1988; Yamashita and Fenn, 1984; Whitehouse et al, 1985; El-
Aneed et al, 2009).
3.2.1 Electrospray Ionisation-Mass Spectrometry (ESI-MS)
This technique was optimised in the 1980s. It involved the samples being dissolved in a
polar solvent which is then fed into an ionisation source via a metal capillary, which is
electrically charged. The charged droplets are then bathed by a warm neutral gas, such
as nitrogen, resulting in the droplets becoming smaller and the charge on their surface
exerting a greater repulsive force against each other. Eventually when the repulsive
force exceeds the surface tension which holds the droplet together, ions desorb into the
gas phase. As this technique allows the desorbtion of ions into the gaseous phases
without destruction of molecules, it made it easier to study large proteins (Kebarle,
2000).
3.2.2 Matrix–Assisted Laser Desorption Ionisation (MALDI)
MALDI, a laser-based soft ionisation technique, is one of the most successful methods
for MS analysis of large biological molecules and a technique used for protein
sequencing and proteomic research. Samples are dissolved in a suitable solvent and

76
then mixed with a matrix. This solution is then spotted on a MALDI plate and allowed
to dry, forming a crystalline compound with the matrix. This complex is then placed in
the ionisation source where a laser beam is directed at the crystals. The energy from the
laser is absorbed by the matrix resulting in desorption and ionisation of the analytes in
the sample into the gas phase (El-Aneed et al, 2009).
The choice of matrix depends on the characteristics of the analytes as well as the charge
induced on the analytes. Acidic matrices are favoured where there is a proton donor and
base matrices are preferred for negative ionisation mode. The matrix, α-cyano-4-
hydroxy-cinnamic acid (CHCA), is normally used for analysing peptides with
molecular weights below 10 kDa (Baldwin, 2005).
3.2.3 Comparison of MALDI and ESI
In MALDI the sample is introduced into the ion source in the solid state; whereas in
ESI, the sample is introduced as a liquid. Although both these techniques can be used
for qualitative assessment for analytes in very low concentrations, ESI, especially when
interfaced with liquid chromatography, can produce efficient quantitative measurements
since it utilises dissolved samples. MALDI readings are dependent on the position
where the laser beam hits the sample, and are qualitative rather than quantitative (El-
Aneed et al, 2009). MALDI is more robust than ESI in the presence of contaminants
such as salts and detergents. In ESI, the contaminants can actually compete with the
ions of the analyte for ionisation and therefore influence results. In MALDI it is less of
a problem since analytes can escape impurities in the sample similar to the way they
escape the matrix when they absorb the laser energy (Breaux et al, 2000).

77
Another important difference between MALDI and ESI is the number of charges
acquired during each ionisation process. ESI can produce multiple charged analytes for
proteins and peptides and therefore multiple m/z values for the same analytes. This
makes identifying the analytes quite difficult in the spectrum of a complex sample.
MALDI, however, only tends to produce single charged analytes and therefore
identifying them is much easier (Karas, Gluckmann and Schafer, 2000).
Since our study was to determine the presence of Notch Nβ fragment in human plasma
(qualitative) and model of study was based on the work done by Okochi et al, MALDI-
MS was used.
3.3 Purification of Samples – The Principle
The objective was to detect a Notch 1 Nβ fragment in human plasma. Direct analysis of
patient plasma samples by MS would lead to too much interference making detection
very difficult. This is due to ionisation suppression from interfering proteins which are
present in the sample in large quantities relative to the protein of interest. Examples
include albumin present at 50 mg/mL and globulin at 35 mg/mL. Enrichment is
required to remove interfering substances in order to be able to detect the peptide of
interest which is likely to be present at femtomolar levels.
Okochi et al used agarose gel electrophoresis to immunoprecipitate Nβ fragments from
murine cell line media. The immunoprecipitates were washed three times with wash
buffer to remove further impurities and finally eluted before analysing using MALDI-
TOF MS (Okochi et al, 2006). Whiteaker et al (2007) were able to demonstrate ion
signal enhancement of >103 which is sufficient for quantifying biomarkers in plasma at

78
the ng/mL range, by using an antipeptide antibody bound magnetic bead based platform
for peptide enrichment. We used three levels of purification during namely solid phase
extraction (SPE), size-exclusion filtration and immunoprecipitation using antibody
bound magnetic dynabeads.
3.3.1 Solid Phase Extraction -The principle
Solid Phase Extraction (SPE) is a chromatographic technique which is commonly used
for sample purification prior to analysis. Samples are applied to columns or cartridge
devices containing a bed of chromatographic packing material (solid phase). If the
analytes which are to be extracted have a greater affinity for the solid phase compared
to the sample matrix they are dissolved in, they bind to the solid phase whilst the rest of
the sample matrix passes through the column or cartridge to waste. The analytes which
are retained on the solid phase can then be eluted by a solvent for which the analytes
have a greater affinity to than the solid phase (Berrueta, Gallo and Vicente, 1995).
SPE can be used to remove specific impurities from samples which, when present in
large quantities, can suppress the signal of the analyte of interest during mass
spectrometry analysis. This is especially important when analysing plasma extracts, as
phospholipids and several large proteins present in the plasma can cause severe
ionisation suppression. An optimised SPE protocol would provide a cleaner extract and
minimize any ionisation suppression. It can also be used to increase the concentration of
the analyte in the original sample to improve detection limits and also to separate a
sample into separate fractions of analytes, by using eluting agents of differing strengths
to obtain several fractions (Berrueta et al, 1995).

79
SPE involves several steps: pre-treatment of the sample, followed by priming and
conditioning of the cartridge, loading the sample and finally the elution of the
cartridges. Priming and conditioning involves activation of the solid phase in the
cartridge by passing an appropriate solvent through under positive pressure which
activates the surface of the solid phase, followed by passing a liquid solvent which is
similar to the sample matrix to remove the activation solvent. The samples are then
loaded onto the cartridges, followed by a washing step to remove any unwanted
substances and finally eluting the analytes required. The washing step of the SPE is
applicable during sample preparation in order to remove any unwanted interfering
compounds. This however does not affect the analytes since they are bound to the solid
phase and have a greater affinity for the solid phase (Berrueta et al, 1995).
There are several principal separation modes of chromatography used in SPE. Reversed
Phase Chromatography, the most commonly used SPE mode, was the method chosen in
this study. It involves the use of a non-polar solid phase and a polar, or moderately
polar, sample matrix to attract a non-polar analyte of interest. This mode can be used to
separate peptides, proteins and oligonucleotides according to their hydrophobicity. It is
the main technique for the purification of synthetic peptides and is used for desalting of
peptide and oligonucleotide samples (Thurman and Mills, 1998).
3.3.2 Size-exclusion filtration – The Principle
As our molecule of interest is in the region of 2,000 to 3,000 Daltons, a size-exclusion
filtration step will remove larger unwanted molecules and effectively provide a cleaner
sample for analysis. Centrifugal filter devices with a molecular weight cut off at 10,000
Daltons were used.

80
3.3.3 Immunoprecipitation using Magnetic Dynabeads – The
principle
Following SPE purification the samples will still contain large amounts of additional
peptides and proteins which will interfere with the mass spectrometry and lead to
suppression of the signal for the Notch 1 peptide. Therefore, further sample preparation
steps are still necessary to attain the best possible results. Immunoprecipitation can be
used to isolate the target antigen by binding it to specific antibodies. The use of
magnetic beads in the isolation and purification of peptides and proteins is a commonly
used purification method. Different types of magnetic beads with different surfaces are
commercially available (Whiteaker et al, 2007).
A Dynabeads capture system with a high antibody coupling affinity as well as good
crosslinking ability, which would bind to background serum proteins was required to
generate clean samples for mass spectrometric analysis. A panel of seven Dynal
magnetic beads (including Protein G, Myone streptavidin, M280 streptavidin, M270
streptavidin, tosylactivated, epoxy, and carboxyl beads) were previously assessed and
Protein G magnetic Dynal beads were found to provide optimal results based on their
low background binding, lack of chemical contamination, high coupling efficiency and
proper orientation of cross-linked antibody. (Whiteaker et al, 2007) Based on these
findings it was decided to use Dynabeads Protein G in the current study.

81
3.4 Methods
3.4.1 Synthetic Notch Nβ peptide
3.4.1.1 Sequencing the Notch Nβ peptide
Okochi et al determined the amino acid sequences of murine Notch 1 Nβ21 and Nβ 25
as VKSEPVEPPLPSQLHLMYVAA and VKSEPVEPPLPSQLHLMYVAAAAFV,
respectively. Using this peptide sequence to compare with human Notch 1 and Notch 3
sequences, available from UniProtKB/Swiss-Prot database, the following amino acid
sequences were found (Table 1). The predicted Nβ 21 peptide sequence for human was
considered to start from the site of the S2 cleavage and continue 21 amino acids distally
towards the site of the S3 cleavage.
Table 3.1 Amino acid sequence of 1) Notch 1 Nβ21 in mouse and human 2)
Notch 3 Nβ21 in human
Notch 1 mouse VKS EPV EPP LPS QLH LMY VAA
Notch1 human VQS ETV EPP PPA QLH FMY VAA
Notch 3 human VRG EPL EPP EPS VPL LPL LVA
3.4.1.2 Determination of the mass of synthetic Notch 1 Nβ peptide
fragment by MALDI
A synthetic peptide for human Notch 1 Nβ was synthesised and a rabbit polyclonal
antibody was raised against it by Davids Biotechnology. The synthetic Human Notch 1
peptide was dissolved in 0.1% TFA and this solution was mixed 1:1 with matrix {α-
cyano-4-hydroxy-cinnamic acid dissolved in an acetonitrile:methanol solution (1:1,

82
V/V) in a ratio of 2 mg/mL}. The resulting solution was then loaded onto MALDI
target plates by using 1µL for each spot and air dried. The plate was then analysed
using MALDI-MS. Each spot received 100 laser ablations to acquire a chromatogram
which was extracted to produce a spectrum of mass/charge ratio for the detection range
from m/z 800-3000.
The Human Notch 1 peptide gave a signal of m/z 2311. This was the expected value as
the correct molecular weight of the synthetic peptide is 2310.14 Da and a positive ion is
added since the MS was operated in positive ionisation mode (Figure 3.3A). There was
a delay obtaining the synthetic Notch 1 human peptide and so to minimise delays for
the initial method development work involving sample purification, a Notch 1 peptide
fragment of murine species, which was already available, was used and this gave a
reading of m/z of 2303 (Figure 3.3B). Due to the similarities in sequencing and
ultimately weight, it was thought that this peptide would be a suitable alternative to use
for the initial method development work involving SPE using pancreatic cancer cell
medium. For the latter stages of SPE method development and the Dynabeads
extraction stage, a human form of Notch 1 peptide fragment and its corresponding
antibody (made by David’s Biotechnology) were used.
Prior to sample analysis the MALDI-MS was always calibrated by using either the
Notch1 synthetic peptide or using a commercially available synthetic peptide, human
Glu Fibrinopeptide B (Glu FiB) with a molecular weight of 1570.57 Da. In most of the
MALDI-MS spectra a peak corresponding to the expected m/z of the Notch peptide +
16 Da was seen. This peak corresponds to methionine oxidation {M+16 (oxygen)}
(Larsen and Roepstorff, 2000) of the Notch 1 peptide and so m/z values of 2322

83
(mouse) and 2327 (human) were observed. (Figure 3.3). For the purposes of our study,
m/z 2322 was also recognised as Notch 1 Nβ fragment during the MALDI-MS spectrum
analysis.
Figure 3.3 MALDI-MS signals for Notch 1 Human and Mouse peptide.
A. Human Notch 1 peptide gave a signal at 2311. B. Mouse Notch 1 peptide gave a signal at 2303.
Please note a signal at 2319 which represents a M+16 oxidation of the methionine in the peptide
sequence.
3.4.2 Sample preparation
The steps used for sample preparation are described in Chapter 2, section 2.7.
3.5 Method Development
The method was developed using synthetic Notch 1 peptides. The areas requiring
development were SPE, size-exclusion filtration, and immunoprecipitation using
Dynabeads followed by mass spectrometric analysis.

84
3.5.1 Solid Phase Extraction
The initial work for the SPE method development was carried out using pancreatic
ductal adenocarcinoma cell culture medium. The medium was prepared by centrifuging
at 2,000g for 5 min and collecting the supernatant to remove the cells. The following
experiments were carried out to optimise the SPE.
3.5.1.1 Detection of Notch 1 and Notch 3 peptide in ASPC cell medium
Cell medium (50 µL) was mixed with an equal volume of 4% phosphoric acid and then
left incubated on ice for 1 h. The samples were then loaded onto the primed SPE
columns. Washing is designed to remove any non-bound salts and interfering
substances. Previous work in the lab involving SPE on Notch peptides used 10%
acetonitrile/0.1% TFA as the washing agent and 80% acetonitrile/0.1% TFA as the
eluting agent (Mann, 2012). Using these agents, SPE was performed.
Following the steps required for sample purification, samples were analysed using
MALDI-MS as already described. No signals were observed for Notch 1 peptides
(2311) nor Notch 3, which were expected to be m/z 2311 and 2223 in PDAC cancer cell
medium (Figure 3.4). The experiment was repeated with 500 µL of medium and
although it gave a similar result, there was a lot more background noise. This shows
that increasing sample size introduces a lot more impurities which might result in
ionisation suppression in MALDI-MS analysis (Figure 3.5).

85
Figure 3.4 MALDI-MS spectrum reading of 50 µL of ASPC cell culture medium.
No signal for Notch 1 peptide (2311) nor Notch 3 peptide (2223) can be seen. The signals which
can be seen are unknown peptides which are not significant in the current study. The TOF MS
LD+ reading on the top right side represents the signal strength of the most abundant peptide
which in this spectrum is 2190.
Figure 3.5 MALDI-MS spectrum of 500 µL ASPC cell culture medium.
Neither Notch 1 nor Notch 3 peptide signals can be detected. Please note a lot more background
noise, indicating impurities. The signal strength of the 2190 ion is 13.5 compared to 1730 in
figure 4, where 50 µL of medium was used. This proves that 500 µl medium introduces more
impurities and therefore suppresses ionisation.
3.5.1.2 Development of the SPE washing step
Washing the columns is designed to remove any salts and interfering substances by
using an aqueous substance similar to the sample matrix. This method was modified in
the current study by washing with HPLC grade water instead of 10% acetonitrile/0.1%
TFA as previously used. To validate whether this change in washing protocol altered
the final results, experiments were carried out comparing the two washes. For both
samples, no signals could be observed for Notch 1 (m/z 2311) or Notch 3 (m/z 2223)

86
following MALDI-MS analysis. However, it was noticeable that washing with HPLC
grade water resulted in much less background noise (Fig 3.6).
Figure 3.6 MALDI-MS spectra of 50 µL ASPC cell culture medium after different washes.
A. This sample was washed by 10% acetonitrile/0.1% TFA. B. This sample was washed with
ultra-pure water. Notice the higher signal reading in B compared to A indicating more ionisation
occurs when washed with water.
3.5.1.3 Detection of Notch1 peptide in spiked culture medium
Synthetic mouse Notch 1 peptide (50 pmol), dissolved in a solution of 0.1%TFA, was
added to 50 µL of culture medium and subjected to SPE as described previously. The
MALDI-MS was able to detect Notch 1 peptide for this sample. This experiment
validated the changes made to the SPE procedure and showed that in principle Notch 1
peptide can be detected in a solution such as cell culture medium/plasma using the
methods described so far, provided it is present in high enough concentrations (Figure
3.7).

87
Figure 3.7 MALDI-MS spectrum of ASPC cell culture medium spiked with mouse Notch 1
peptide.
A. 50 µL of medium spiked with 50 pmol of peptide. Note that the Notch 1 signal can be detected
at 2303 and 2319 (M+ 16). B. 500 µL of cell medium was spiked with 50 pmol of Notch 1
peptide. Please note that the signal intensity in B is considerably less than that of A, indicating
that with increased sample volume there is less ionisation.
3.5.1.4 Determination of the volume of medium required for SPE
It was hypothesised that the amount of Notch 1 peptide present in culture medium and
patient plasma samples would be at femtomolar levels and that it should be possible to
detect it in 50 µL or 500 µL of sample using MALDI-MS. Notch 1 peptide (50 pmol)
was added to 50 µL and 500µL of medium and mixed with an equal volume of 4%
phosphoric acid. MALDI analysis detected Notch 1 peptide with much higher signal
intensity in 50 µL medium (Figure 3.7). Although 500 µL of cell culture medium will
contain more Notch 1 peptide than 50 µL, it also contained a lot more impurities. This
resulted in ionisation suppression, leading to much poorer detection of peptide.
Following the results of this experiment the volume of patient plasma/ medium to be
analysed was fixed at 50 µL.

88
3.5.1.5 Determination of the optimal solvent for SPE
The ultimate aim of sample preparation is to provide an enriched sample with the least
amount of impurities. A less hydrophobic eluting agent than 80% acetonitrile/0.1%
TFA might result in less contaminating compounds. The optimal concentration of the
eluting agent was determined in order to release the Notch 1 peptide from the SPE
columns with the fewest impurities.
Medium (50 µL) was spiked with 50 pmol of Notch1 peptide and SPE was carried out
on the sample. The eluting solvent initially used was 10% acetonitrile/0.1% TFA and
this was increased in 10% increments to 80% acetonitrile. Samples were collected and
processed separately. Notch 1 peptide was detected in samples with the eluting agents at
30% acetonitrile/0.1% TFA and 40% acetonitrile/0.1% TFA. This suggests that all
detectable Notch peptides are eluted by 40% acetonitrile/0.1% TFA and 80%
acetonitrile/0.1% TFA is not necessary (Figure 3.8).
When a further experiment was done to compare 30% acetonitrile/0.1%TFA and 40%
acetonitrile/0.1% TFA as eluting solvents, the 40% acetonitrile/0.1% TFA gave much
higher signal intensity. These experiments suggested that although some of the Notch 1
peptide was eluted using 30% acetonitrile/0.1% TFA, most the peptide was eluted using
40% acetonitrile/0.1% TFA. Since peptides are present at femtomolar levels and some
are bound to be lost during the purification process, 40% acetonitrile/0.1%TFA was
deemed as the optimal concentration of the eluting solvent (Figure 3.9).

89

90
Figure 3.8 MALDI-MS spectra of 50 µL ASPC culture medium spiked with 50 pmol of mouse
Notch 1 peptide.
A – H are increasing concentrations of acetonitrile/0.1% TFA used to elute the peptides during SPE.
The Notch 1 mouse peptide (2306 & 2320) can only be detected in C and D (30% and 40%
acetonitrile/0.1% TFA) meaning that all Notch peptides are eluted at 40% acetonitrile/0.1% TFA.

91
Figure 3.9 MALDI-MS spectrum of 50 µL of ASPC cell culture medium spiked with 50
pmol of Mouse Notch 1 peptide.
The sample which was eluted with 40% acetonitrile 0.1% TFA during SPE gives the higher signal
intensity for Notch 1 peptide. This indicates that 40% acetonitrile/0.1% TFA is the optimal
eluting agent during SPE for this peptide.
3.5.1.6 Recovery of the Notch 1 Peptide following SPE
An experiment was performed to check whether any Notch 1 peptide samples were lost
during SPE, centrifugal evaporation, freeze drying, size-exclusion filtration. Cell
medium (50 µL) was spiked with 50 pmol of Notch1 peptide and underwent SPE and
the subsequent preparation process and eventual MALDI-MS analysis. A 50 µL of cell
medium also went through the same process and just prior to mixing with matrix, this
sample was spiked with 50 pmol of Notch 1 peptide. A control experiment was also
done with 50 µL of cell medium to ensure that the MALDI-MS was not giving any
false positive results. The MALDI-MS results between the first and the second set of
samples were very similar. This showed that there was almost 100% recovery of the
Notch 1 peptide during SPE and all the other purification processes (Figure 3.10).

92
Figure 3.10 MALDI-MS spectra of ASPC cell culture medium spiked with 50p mol of
human Notch 1 peptide before and after SPE.
A) Sample spiked before SPE. B) Sample spiked after SPE, centrifugal evaporation and freeze
drying, just prior to mixing with matrix before loading onto target plate for MALDI-MS analysis.
Note that the signal intensity for both spectrums are roughly similar. This indicates that hardly
any Notch 1 peptide is lost during the process of SPE, centrifugal evaporation and freeze-drying.
3.5.2 Validation of antibody
A dot blot analysis was carried out to validate the anti-Notch 1 peptide antibody
obtained from Davids Biotechnology. Several dilutions of peptide were spotted onto a
nitrocellulose membrane and this was incubated in anti-Notch 1 antibody diluted
1:10,000 in 5% milk at 4°C overnight. Positive results were obtained with 20 pmol, 1
pmol, 500 fmol and 250 fmol of peptide indicating that the antibody has an affinity for
Notch 1 peptides.
3.5.3 Immunoprecipitation using magnetic Dynabeads.
Method development of the immunoprecipitation procedure using dynabeads was done
using healthy human plasma. The plasma was either spiked with synthetic Notch1

93
peptide or not depending on the experiment. Each sample then underwent SPE,
centrifugal evaporation, freeze-drying, and the freeze-dried pellet would be stored in -
80°C, until required for immunoprecipitation with the antibody-coupled dynabeads. As
mentioned in section 3.4.2.6, the FDP were resuspended in 50 mM ammonium
bicarbonate (pH 7.4) in order to provide an optimal environment for the peptide to bind
to the antibody bound magnetic dynabeads.
3.5.3.1 Validation of immunoprecipitation of Notch 1 peptide using
Dynabeads.
To validate the method of immunoprecipitation using dynabeads, 100 pmol of Notch 1
peptide, diluted in 100 µL of ammonium bicarbonate, was immunoprecipitated as
described in section 2.7. A signal for the Notch 1 peptide was detected following
MALDI-MS analysis of this sample. This experiment was repeated using 25 pmol of
Notch 1 peptide with positive results (Figure 3.11).
3.5.3.2 Determination of the elution conditions of the Notch 1 peptide
from the IgG-protein G complex.
The final sample preparation step was elution of the bound peptide. It was initially
thought that eluting the peptide from the antigen IgG-protein G complex using 0.1%
TFA might reduce the interference and suppression of the peptide ionisation to give an
improved response. An experiment was set up where two samples each containing 25
pmol of Notch 1 peptide were analysed using the method described above. One of the
samples was eluted using 0.1% TFA, pH 2.0 and the other using 0.1 M citric acid, pH
2.0. Notch 1 peptide signal was detected in both the samples. However, the better
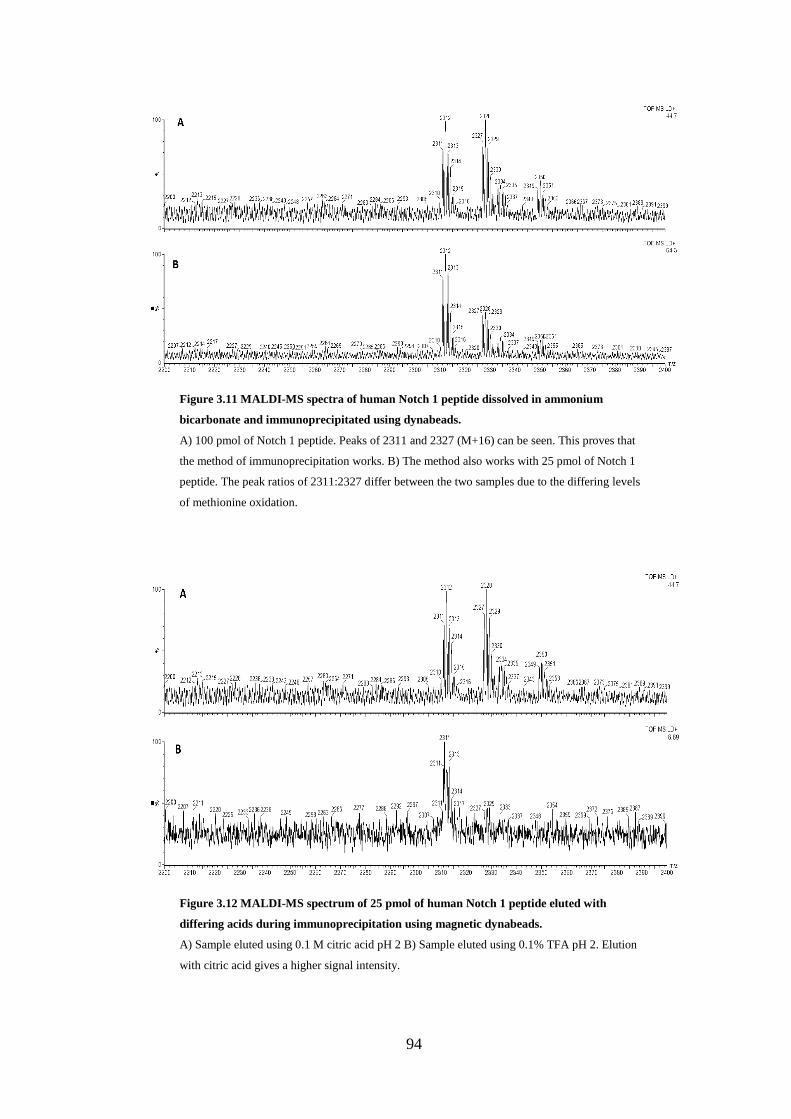
94
Figure 3.11 MALDI-MS spectra of human Notch 1 peptide dissolved in ammonium
bicarbonate and immunoprecipitated using dynabeads.
A) 100 pmol of Notch 1 peptide. Peaks of 2311 and 2327 (M+16) can be seen. This proves that
the method of immunoprecipitation works. B) The method also works with 25 pmol of Notch 1
peptide. The peak ratios of 2311:2327 differ between the two samples due to the differing levels
of methionine oxidation.
Figure 3.12 MALDI-MS spectrum of 25 pmol of human Notch 1 peptide eluted with
differing acids during immunoprecipitation using magnetic dynabeads.
A) Sample eluted using 0.1 M citric acid pH 2 B) Sample eluted using 0.1% TFA pH 2. Elution
with citric acid gives a higher signal intensity.

95
Figure 3.13 MALDI-MS spectra of 100 pmol of human Notch 1 peptide eluted with differing
pH of 0.1 M citric acid during immunoprecipitation using magnetic dynabeads.
A) Sample eluted using pH 1.5 B) Sample eluted using pH 2. Stronger signal intensity was
obtained using 0.1 M citric acid pH 1.5.
response was obtained using citric acid and so it was chosen for elution in subsequent
experiments. (Figure 3.12)
3.5.3.3 Determination of the optimal pH of the eluting agent
Although Notch 1 peptide signals were detected for samples where 0.1 M citric acid pH
2.0 was used as the eluting agent, the response was weak. It was therefore decided to
investigate whether further peptide could be eluted. An experiment using two samples
of 1 pmol/µL of peptide dissolved in 100 µL of ammonium bicarbonate was carried out.
One sample was eluted using 0.1 M citric acid pH 2.0 and the other sample was eluted
using 0.1 M citric acid pH 1.5. It was decided not to try pH less than 1.5, since
denaturation of the peptide will happen in the presence of a very strong acid. The
sample eluted with 0.1 M citric acid, pH 1.5 gave stronger Notch 1 peptide signals

96
when compared with that using 0.1M citric acid, pH 2.0. This showed that it was
possible to increase the number of peptides eluted by reducing the pH. (Figure 3.13)
3.5.3.4 Validation of the method by spiking Notch 1 peptide in healthy
human plasma samples
A 50 µL sample of healthy human plasma was pre-treated with an equal volume of 4%
phosphoric acid and processed as described. A second sample spiked with 100 pmol of
Notch 1 peptide was processed in parallel. Following MALDI-MS analysis, no signal
for the Notch 1 peptide was detected in the unspiked sample. This result was expected
since the Notch 1 peptide signal was not expected to be observed in healthy individuals.
However, signals for Notch 1 peptide were seen in the spiked samples, indicating that
the method works (Figure 3.14).
Figure 3.14 MALDI-MS spectra of healthy human plasma and plasma spiked with Notch 1
peptide.
A) Healthy human plasma shows no Notch 1 peptide signals. B) Healthy human plasma spiked
with 100 pmol of Notch 1 peptide. Signals can be seen at m/z 2311 and 2327 (M+16) indicating
that the method works n=3.

97
3.5.3.5 Determination of the number of elutions required for optimum
detection of Notch 1 by MALDI-MS analysis
As described in section 2.7.1.3.5, eluents were collected from each sample. When 50
µL of healthy plasma was spiked with 100 pmol of Notch 1 peptide, eluant 1 gave the
strongest signals, followed by eluant 2 and in eluant 3 the signal was very weak. Thus,
most of the Notch 1 peptide is eluted in the first two samples (Figure 3.15). Following
this, for the remainder of the method development, the samples were eluted twice.
The first eluant had the strongest signal for Notch 1, whereas the second eluant gave a
considerably less signal. This showed that most of the Notch 1 peptide was eluted in the
first eluant (Figure 3.15). Since this study was designed for detection of Notch 1
peptides rather than quantification, it was decided to elute patient samples only once
before MALDI-MS analysis.
3.5.3.6 Determination of the optimal incubation time for antigen capture
There are several factors which can determine the binding of target antigen to the
Dynabeads. These include the concentration of the target antigen, the concentration of
Dynabeads ProteinG-Ig complex, the affinity of the immobilised Ig for the target
protein/antigen and the incubation time and temperature. It was previously shown that
there was no improvement in the yield of the Notch 1 peptide when analysing 500 µL
of medium compared to 50 µL of medium. Similarly, this should be applicable to the
plasma samples as well. The information about the optimal amount of Dynabeads to be
used and the appropriate amount of corresponding antibody was provided by
Invitrogen.

98
Figure 3.15 MALDI-MS spectrum of healthy human plasma spiked with 100 pmol Notch 1 peptide.
Eluant 1 shows the highest signal intensity for Notch 1 peptides. This indicates that most of the Notch 1
peptide is recovered during the first elution with >95% found in the first and second eluants.
According to the Invitrogen product sheet, an incubation time of 1 h would be sufficient
for binding for most peptides. In this experiment, it was attempted to reduce the
incubation time to speed up the analysis. Two healthy human plasma samples spiked
with 25 pmol of Notch 1 peptide were processed using the methods already described.
For one sample, the incubation time of the Notch 1 peptide with the Ig G–protein G
complex was 2 h at 4°C and for the other sample the incubation time was 12 h at 4°C.
Samples which were incubated overnight gave better Notch 1 peptide signals and
therefore it was decided to continue incubating antigens with Ig G–protein G complexes
for a minimum of 12 h at 4°C (Figure 3.16).

99
Figure 3.16 MALDI-MS spectra of healthy human samples spiked with 25 pmol of Notch 1
peptide, incubated with antibody for 2 h and 12 h.
A) Sample incubated for 2 h at 4°C. B) Sample incubated for 12 h at 4°C. The sample which has
been incubated for 12 h gives a higher signal intensity.
3.5.3.7 Determination of the optimal amount of antibody for Notch 1
response on the MALDI-MS
An experiment was carried out to check whether Notch 1 could be detected on the
MALDI-MS using less antibody in order to maximise the number of analysis which
could be carried out with the limited amount of antibody available.
As mentioned in section 2.7.1.3.2, between 25 µg Ig G/mL (25 µg Ig G =19 µL of
antibody) and 100 µg Ig G/mL (100 µg Ig G =76 µL of antibody) there was not a great
increase in the amount of Ig G captured. The starting volume for this part of the method
development was 50 µL of antibody. An experiment was carried out using 50 µL (65 µg
Ig G), 25 µL (33 µg Ig G) and 20 µL (26 µg Ig G) of antibody with 50 µL of healthy
plasma spiked with 10 pmol of synthetic Notch 1 peptide respectively. Only the sample
using 50 µL of antibody gave a Notch 1 signal at three times the background signal. For

100
MALDI-MS analysis, a signal was only considered above background if it was at least
3 times the baseline noise. From the result of this experiment, it was determined that the
optimal amount of antibody to be used for this method is 75 µg which equates to a
volume of 50 µL (Figure 3.17).
Figure 3.17 MALDI-MS spectra of healthy human plasma spiked with 10 pmol of Notch 1
peptide.
Sample incubated with A) 20 µL of antibody. B) 25 µL of antibody. C) 50 µL of
antibody. Only the sample incubated with 50 µL gives a reading which is three times
the background noise.
3.5.3.8 Determination of peptide loss during washing steps prior to
elution
Prior to elution, the peptide bound dynabeads are washed three times in ammonium
bicarbonate (section 2.7.1.3.5). The washes were analysed in MALDI-MS to check if
any peptides were eluted during the washes. None of the washes gave any reading for

101
Notch 1 peptide, even when diluted 5 times with trifluoroacetic acid. The washes gave
signals for spiked control ACTH, proving that the Notch peptide was genuinely not
present in the washes and its ionisation was not being suppressed. This step proved that
Notch peptides were not lost during the washes prior to elution by citric acid. (Figure
3.18)
Figure 3.18 MALDI-MS spectra of the first wash with ammonium bicarbonate prior to
elution with 0.1 M citric acid pH 1.5.
A) Shows that no signals for Notch 1 peptide can be detected, but signals for ACTH (m/z 2466)
can be detected proving that there is no ionisation suppression in the sample. B) A magnified
image of A which shows that there is no Notch 1 peptide detected, suggesting that Notch 1
peptide is not lost during the washing procedure.
3.5.3.9 Determination of the limit of detection of Notch 1 in plasma
samples
To determine the limit of detection, 50 µL of plasma was spiked with 5 pmol, 10 pmol
or 30 pmol of synthetic Notch 1 peptide and immunoprecipitation was carried out using
50 µL of antibody with an incubation period of at least 12 h at 4°C. The sample spiked
with 10 pmol provided a Notch 1 signal which was above (3 times) background and
therefore was considered the limit of detection. This was equivalent to a concentration

102
of 121.67 fmol/µL of plasma. Therefore, assuming no loss of the Notch 1 peptide
during the preparation steps, it would have to be present in the plasma at a
concentration equal to or greater than 121.67 fmol/µL for detection by our method and
subsequent MALDI-MS analysis (Figure 3.19).
Figure 3.19 MALDI-MS spectra of healthy human plasma spiked with Notch 1 peptide.
Sample spiked with A) 5 pmol B) 10 pmole C) 30 pmol. In the samples with 10 pmol and 30
pmol signal at 2311 or 2327 (M+16) were detected.
3.5.4 Development of the size exclusion filtration method
The size exclusion filtration was initially carried out using Microcon Centrifugal Filter
Devices (Regenerated Cellulose 10,000 MWCO provided by Millipore). They were pre-
rinsed twice using 500 µL ultrapure water to remove trace amounts of glycerine which
might have interfered with analysis. The filter devices were centrifuged at 14,000 g at
4°C, for different times to investigate whether all the water had been removed but

103
without the filter drying out. It was found that 20 min was the optimal centrifugation
time. Freeze dried samples, dissolved in either ammonium bicarbonate or 0.1% TFA,
were loaded onto the pre-rinsed Microcon devices and centrifuged at 14,000 g at 4°C.
The optimal time for centrifugation was 45 min for the samples to be filtered through at
4°C without any damage to the membrane.
Microcon filters were discontinued by Millipore during the study. Therefore, method
development for future patient sample analysis was undertaken using Amicon filters.
When the Amicon filters were used initially, no Notch 1 peptide was detected in healthy
plasma which was spiked with 30 pmol of synthetic Notch 1 peptide. In a simultaneous
experiment performed using Microcon filters Notch 1 peptide was detected (Figure
3.20).
It was possible that the Notch 1 signal was not being detected by MALDI-MS due to
suppression of ionisation by salt in the eluants where the Amicon filters were used.
Some of the Amicon-filtrated eluants were therefore diluted and re-analysed but with no
improvement. This suggested that ionisation suppression of the Notch 1 peptide was not
occurring. Some of the original Amicon-filtrated eluants were then spiked with
synthetic Notch 1 peptide (500fmol of Notch 1 on each spot) and in these samples a
signal was detected suggesting that the loss of Notch 1 peptide signal was not due to
ionisation suppression and was due to the Notch 1 peptide being retained by the
Amicon filters (Figure 3.20).

104
To confirm whether this was the case or whether it was a faulty batch of Amicon filters,
four samples of freeze dried pellets of healthy plasma were each dissolved in
ammonium bicarbonate. Two of them were spiked with Notch 1 peptide prior to
Figure 3.20 MALDI-MS spectra of 50 µL of healthy human plasma spiked with 50 pmol of
Notch 1 peptide.
A) Sample filtered using microcon filter, where Notch 1 signal can be seen. B) Sample filtered
using amicon filter with no Notch 1 signal. C) Eluant from sample B further diluted with TFA to
reduce possible ionisation suppression. Still no Notch 1 signal can be seen. D) Eluant from
sample B spiked with Notch 1 peptide so there would be approximately 500 fmol of Notch 1
peptide on target MALDI plates. Notch 1 signal can be seen. This proves that the loss of Notch 1
signal is due to the peptide being lost during filtration and is not due to ionisation suppression.

105
filtration to give about 500 fmol on the MALDI-MS target plate and two were spiked
post filtration. One sample of each set was centrifuged using an old batch of Amicon
filters and the other two were centrifuged using a new batch of Amicon filters. For the
samples which were spiked prior to filtration, no signal was detected with either batch
of Amicon filters. For both samples which were spiked following filtration, the peptide
was detected. This experiment suggested that the failure to detect the Notch 1 peptide
was because the peptide was being retained by the Amicon filters during filtration and
not because of a faulty batch (Figure 3.21).
It was assumed that the Notch 1 peptide was binding to the plastic structure of the
Amicon device. Passivation (pre-treating) of the device before use could be used to
block any binding sites and potentially make the device suitable for use with Notch 1
peptides. It was mentioned in the literature provided by Millipore that 1% Milk or 5%
Tween-20 could be used as a passivation/pre-treatment agent. An experiment was
performed where the Amicon filters were pre-treated with either 1% milk or 5%
Tween-20 and left overnight. Samples of healthy plasma spiked with synthetic Notch 1
peptide were analysed using the pre-treated Amicon filters and Notch 1 peptide signal
was detected only in the samples where the Amicon filters were pre-treated with 5%
Tween- 20 (Figure 3.22).
A solution of 5% Tween-20 produced significant amount of foam which could interfere
with sample analysis. Therefore, an attempt was made to lower the concentration of
Tween-20 comparing 5%, 1%, 0.5%, 0.25% and 0.05%. Since one percent Tween-20
gave good signals for Notch 1 peptide it was decided to use this as the passivation agent
for Amicon filters (Figure 3.23).

106
Figure 3.21 MALDI-MS spectrum showing development of the size exclusion filtration method.
Healthy plasma spiked with Notch 1 peptide A) before filtration using old Amicon filters. No Notch 1
signal can be detected. B) after filtration using old Amicon filters. Notch 1 signal can be detected in
this sample. C) before filtration using new batch of Amicon filters. No Notch 1 signal can be
detected. D) after filtration using new batch of Amicon filters. Notch 1 signals can be detected. This
suggests that the loss of signals was due to the filters retaining the peptide.

107
Figure 3.22 MALDI-MS spectra following passivation of the Amicon filters.
Healthy plasma spiked with Notch 1 peptides were used as samples. A) Amicon filters treated with
1% milk. No signals for Notch 1 peptide can be detected. B) The eluant from A was spiked with
Notch 1 peptide. Notch 1 signals can be seen, indicating that no salt induced ionisation suppression
was taking place in A and Notch 1 was genuinely absent from the eluant C) Amicon filters treated
with 5% Tween-20. Notch 1 signals can be seen in this sample, indicating that Tween-20 can be
used as a passivation solution for Amicon filters.
Passivation thus involved adding 500 µL of 1% Tween-20 into the sample reservoir
which was left overnight at room temperature. The following day the devices were
rinsed thoroughly with ultrapure water. A further 500 µL of ultrapure water was then
added to the reservoir and the filter centrifuged for 20 min at 14,000 g at 4°C. Any
remaining water was discarded by inverting the reservoir and the washing step was
repeated with a further 500 µL of ultrapure water. To remove any remaining water, the
reservoir was then inverted again in the filtrate vial, and then centrifuged once at 1,000
g for 3 min making the Amicon filters before use.

108
Figure 3.23 MALDI-MS spectra following Tween-20 passivation of Amicon filters.
Healthy plasma was spiked with Notch 1 peptide. Amicon filter was treated overnight with A) 0.05%
Tween-20. B) 0.25% Tween-20 overnight. C) 0.5% Tween-20 D) 1% Tween-20. One percent Tween-
20 gave the best signal intensity for Notch 1 peptide.

109
3.6 Results
3.6.1 Analysis of Notch 1 peptide in patient samples
Prior to analysing patient samples, the MALDI-MS was calibrated using a standard
peptide Glu-fibrinopeptide B (GFP) (MW 1570.57). A Notch 1 peptide standard was
also analysed.
Plasma samples from 20 non-resectable pancreatic ductal adenocarcinoma patients and
10 healthy volunteers were analysed. Notch 1 signals for either Nβ21 and Nβ25 could not
be detected in any of the samples. The samples were also reanalysed using another
MALDI-MS instrument which produced the same result. (MW: Notch 1 Nβ21 = 2310.14
Da; Notch 1 Nβ25= 2700 Da). There were also no peaks detected at +16 for both Nβ21
and Nβ25 (Figure 3.24).
.
3.6.2 Analysis of Notch 3 peptide in patient samples
Using the amino acid sequence available for human Notch 3 and comparing it to that of
Notch 1, it was possible to predict the sequence of a putative Nβ fragment. This is the
site of the S2 cleavage {N terminal of the Notch Extracellular Truncation (NEXT)} at
amino acid number 1629. Assuming that Notch 3 also has Nβ21 fragment, a peptide
sequence of 21 amino acids was synthesised for Notch 3 Nβ21 fragment. The sequence
for Notch 3 Nβ21 is VRG EPL EPP EPS VPL LPL LVA {GAVLLLVILVLG}. The
area in grey shading is part of the transmembrane domain just prior to where the N
terminus for the NICD starts and is not part of Notch 3 Nβ21. Davids Biotechnology

110
were commissioned to synthesise a synthetic Notch 3 Nβ21 peptide and to raise a
polyclonal antibody against the peptide.
Figure 3.24 MALDI-MS spectra analysis of PDAC patient and healthy volunteer plasma.
A) Notch 1 standard peptide giving a signal of m/z of 2311. B) A healthy plasma showing no Notch 1
peptide signals. The signal at m/z of 2168 is not relevant in the current study and we do not know
what it is. C) A patient plasma showing no Notch 1 peptide signals.
Analysis of Notch 3 Nβ21 synthetic peptide by MALDI-MS resulted in a major ion at
m/z 2223. This was the correct signal as the calculated MW of the peptide is 2222.65
Da and the MALDI-MS analysis was performed in positive ionisation mode (Figure
3.25).
Using the method described for the Notch 1 peptide, 5 patient samples and 5 healthy
volunteers were initially analysed for the Notch 3 Nβ21 fragment. The Notch 3 peptide

111
was present in all samples. An internal standard adrenocorticotrophic hormone (ACTH)
{m/z 2466} was incorporated into the matrix (25 fmol per spot). For every sample, 4
spectra were obtained from 4 different spots on the MALDI target plate and the signal
intensity for Notch 3 peptide averaged and normalised to ACTH intensity (Figure 26).
There was no significant difference in Notch 3 signal intensity between the two groups
(p= 0.142, p< 0.05 Mann-Whitney U test).
To investigate whether there were any differences in Notch 3 peptide levels in plasma
from healthy volunteers and non-resectable PDAC patients, a further 20 patients and 16
healthy volunteers’ plasma were analysed. The experiment was carried out by a BSc
student in the department, using the author’s method and patient samples. The MALDI-
MS analysis and subsequent statistical calculations were carried out by the author.
There was no significant difference in Notch 3 signal intensity between healthy
volunteers and non-resectable PDAC patients. (p= 0.65, p<0.05 Mann-Whitney U test).
Healthy volunteers had a slightly higher median signal intensity (0.37186) compared to
PDAC patients (0.301470).
The distribution of age across the two groups was significantly different (p=0.04,
Mann-Whitney U test) and the median of the patient group (68.8 years) was
significantly higher compared to the healthy volunteers (56 years). {p=0.07, Median
test}. To compare evenly across the two groups, samples from healthy volunteers aged
55 and above were compared with patient samples. There were no significant
differences in Notch 3 signal intensity between the two groups. (p= 0.420, p<0.05
Fishers exact test).

112
Figure 3.25 MALDI-MS spectrum of Notch 3 peptide in healthy plasma and PDAC patient's
plasma.
A) Notch 3 standard peptide giving a m/s signal of 2223. B) Notch 3 can be detected in healthy
plasma. ACTH (m/z 2466) can also be seen as the internal control. The fourth image also identified B,
is a magnified version of the peak in interest. C) Notch 3 can also be detected in PDAC patient’s
plasma with roughly the same signal intensity. The fifth image also identified C, is a magnified
version of the peak in interest.

113
3.7 Discussion
In this study, an optimal method for detecting Notch peptides in human plasma using
MALDI-MS analysis was developed. It was determined that Notch 1 peptide needs to
be present at a concentration of at least 121.67 fmol/µL in the human plasma for this
method to be able to detect the peptide. Although Notch 1 Nβ fragment could not be
detected in any of the patient and healthy volunteer samples, Notch 3 Nβ fragment
could be detected in both groups. This provides evidence that this is a valid method of
detecting circulating Notch Nβ fragments, and is the first report of Notch 3 peptides
detected in human plasma.
It could be argued that enzyme-linked immunosorbent assay (ELISA), which is the gold
standard for detecting potential protein biomarkers, should have been used for our study
instead of MS. Although ELISA has extraordinary sensitivity and specificity for
quantifying the target analyte, its development is extremely costly and time consuming
and has a high failure rate. This leads to reduced validations of potential diagnostic
biomarkers and therefore less than optimal patient outcomes. Purification of samples
and immunoprecipitation using antibody bound dynabeads followed by MS analysis
(IA-MS) has several advantages over ELISA. IA-MS requires only one antibody to be
developed, whereas ELISA requires two different antibodies for the sandwich assay,
associated with higher costs as well as a longer developing time. It is also easier to
generate antibodies for IA-MS because there are no restrictions to just target the
nonoverlapping epitopes as well as the intact protein. IA-MS can also monitor several
targets within one sample, whereas the standard ELISA can only monitor one target per
sample. This leads to more throughput from one sample as well as lower sample
consumption. All these advantages have led us to use IA-MS (Whiteaker et al, 2007).

114
Although previous studies have suggested that Notch 1 is a potential oncogene in
PDAC, Mazur et al (2010) have proved with their work on murine models that Notch 2
is required for the progression of pancreatic intraepithelial neoplasia and the
development of pancreatic ductal adenocarcinoma. Moreover, Hanon et al (2010) were
also able to prove in murine models of K-ras induced tumourigenesis, that depletion of
Notch 1 actually resulted in increased tumour incidence and progression of PDAC. This
suggests that Notch 1 acts more as a tumour suppressor gene rather than an oncogene in
PDAC. These findings could possible explain why Notch 1 circulating levels were not
high enough in patients with non-resectable PDAC, in order to be detected by our
method.
Notch 3 peptides were detected in both healthy volunteers and non-resectable PDAC
with no significant difference in levels between them. This result validates the method
of detecting Notch Nβ fragments using IA-MS, but limits its potential as a biomarker.
Previous work had established that Notch 3 is associated with an aggressive PDAC
phenotype (Doucas et al, 2008). Notch 3 is also shown to be important in other solid
tumours such as ovarian and breast carcinomas (Xiao et al, 2011; Jung et al, 2010). It
not only plays a vital role in the development of vascular smooth muscle cells (VSMCs)
during embryogenesis but is also expressed in adult VSMCs. Notch 3 is considered to
be a downstream mediator of growth factors in vascular injury as well as playing a part
in regulating VSMC growth and apoptosis. Such is the importance of Notch 3 in
VSMCs homeostasis, mutations in Notch 3 have resulted in a genetic stroke syndrome
CADASIL (cerebral autosomal dominant arteriopathy with subcortical infarcts and
leukoencephalopathy) due to a loss of VSMCs (T. Wang et al, 2008). This role in the

115
vasculature would explain the presence of Notch 3 Nβ fragments in healthy volunteers.
Due to the limitations of time and consumption of the entire Notch 3 peptide antibody, a
further method was not developed using ESI-MS, which could provide more accurate
quantification of the Notch 3 Nβ fragments between healthy human plasma and non-
resectable PDAC patients.
Therefore, in conclusion we have determined that Notch 1 Nβ fragments cannot be
detected in human plasma and therefore cannot be used as a potential biomarker for
PDAC. Notch 3 Nβ fragments can be detected in plasma of patients with PDAC but
more work is required using ESI Mass Spectrometry for accurate quantification.

116
NOTCH 2 EXPRESSION IN
PANCREATRIC
ADENOCARCINOMA IN VIVO

117
4.1 Introduction
Notch plays a critical role in the early development of pancreas organogenesis by
maintaining pancreatic epithelial cells in a progenitor state until it is appropriate for the
cells to differentiate (Z. Wang et al, 2011). Little is known about the role of Notch
signalling in the adult pancreas and most studies suggest that the expression and
activation of Notch receptors are downregulated in the adult pancreas under normal
physiological conditions (Z. Wang et al, 2011; Avila and Kissil, 2013). However, there
is mounting evidence that the Notch signalling pathway contributes to pancreatic cancer
development and progression (Miyamoto et al, 2003; Avila and Kissil, 2013). Notch is
a ligand receptor pathway and is involved in cell proliferation, apoptosis, migration,
invasion, metastases, and angiogenesis in a variety of human cancers including
pancreatic ductal adenocarcinoma (PDAC) (Ma et al, 2013).
Whilst Notch had already been demonstrated to be upregulated in PDAC with specific
upregulation of Notch 1, Notch 2, Jagged 1, Jagged 2 and Notch downstream target
genes Hes 1 and Hey 1 (Miyamoto et al, 2003; Büchler et al, 2005), previous work in
our laboratory was the first to examine the expression of Notch pathway constituents in
PDAC, using immunohistochemistry (IHC), with reference to disease progression and
correlate Notch expression with clinicopathological characteristics and prognosis
(Mann, 2012). Mann investigated Notch 1, Notch 3, Notch 4, Hes 1 and Hey 1. This
chapter is a continuation of the same work and investigates the role of Notch 2 in
PDAC in different stages of the disease and correlates Notch 2 expression with
clinicopathological characteristics and disease prognosis.

118
4.2 Patient Demographics
The database used in this study is the same used by a previous PhD candidate Dr Chris
Mann for his study on immunohistochemistry for Notch 1, 3, 4, Hes 1 and Hey 1. Local
ethics approval (REC 7176) was obtained for the study. Dr Mann had identified the
patients for his study from the hepatobiliary MDT database at the University Hospitals
of Leicester NHS Trust. A combination of archival tissue and freshly collected
specimens from patients with pancreatic adenocarcinoma undergoing surgery at biopsy
were used by him. Patient data was obtained from case notes, pathology and laboratory
computer systems. Survival status was determined by checking hospital patient
information systems and general practice records (Mann, 2012).
The patients were separated into two groups. The resectable group (42) consisted of
patients who underwent curative surgery for pancreatic ductal adenocarcinoma between
October 200 and May 2007. Pancreatic tissue was available from all these patients. In
addition, non-cancerous healthy pancreatic tissue (control) were obtained from 35 of
these patient samples. 16 patients had locally advanced lymph nodes out of which 9
were available for us to stain for immunohistochemistry.
The unresectable group (50) consisted of two types of patients. Twenty-six patients
were deemed unresectable at the time of the operation due to locally advanced disease
and so pancreatic tissue sample were obtained for these patients. 24 patients had
metastatic disease and out of these, 14 samples were from liver metastases, 8 from
peritoneal metastases and 2 from distant lymph node metastases.
119
The full clinicopathological data of the patients who underwent potentially curative
resections are illustrated in Table 4.1. Patients were followed up in the
hepatopancreatobiliary and oncology clinics. Patient survival was last updated on 1st
January 2011, at which point seven patients were alive, all of them disease-free. Median
survival of patients who underwent potentially curative resections was 30.5 months
with a 1 year, 3 year and 5 year survival of 87.5%, 32.5% and 21.3%. Median value of
disease free survival was 25 months giving 1, 3, and 5 year disease free survival rates of
64.1%, 25.6% and 16.6%. Following recurrence, median survival was 5.2 months
(Mann, 2012) .
In the unresectable group the median survival was 5.9 months (range 1.0 – 18.2
months) giving a 6 and 12 months survival of 48.9% and 17.0% (p <0.0001 vs the
overall survival in the resectable group). At the time of last data collection, all the
patients in this group had died (Mann, 2012).

120
Table 4.1 Clinicopathological data of patients undergoing potentially
curative resection for pancreatic ductal adenocarcinoma.
Taken from Mann 2012.

121
4.3 Results
4.3.1 Notch 2 expression
There was quite a degree of cytoplasmic staining in the pancreatic ductal cells across
the 3 groups with all of them ranging between 0–100%. In background pancreas,
involved lymph nodes and in advanced disease, a median of 100% of ductal carcinoma
cells stained positive for cytoplasmic Notch 2, ranging from 0-100%. Cytoplasmic
Notch 2 expression was downregulated somewhat in the resectable cancer cells with a
median of 85% of pancreatic ductal adenocarcinoma (PDAC) cells staining positive for
cytoplasmic Notch 2. Although the median of percentage of cells staining positive for
Notch 2 is 100% for most of the groups, there is a statistically significant difference in
the distribution of Notch 2 cytoplasmic staining between groups (p = 0.014, Kruskal-
Wallis test). There is a statistically significant difference in the distribution of
cytoplasmic Notch 2 staining between healthy tissue and resectable PDAC (p = 0.001
Related-Samples Wilcoxon Signed Rank Test); between resectable cancer tissue and
non-resectable cancer tissue (p = 0.013, Independent samples Mann-Whitney U test);
and between resectable and locally advanced cancer tissue (p = 0.039).
Although Notch 2 was positively expressed in the nuclei of 3 (7.9%) healthy tissue
samples, it was statistically significantly lower when compared to all the other groups:
versus resectable cancer group (42.9%, p = 3.86E-04, Pearson Chi-square); versus
involved lymph nodes (77.8%, p = 4E-06,); versus non-resectable group (62.2%, p =

122
Table 4.2 Expression of Notch 2 in normal pancreas, early and advanced
pancreatic adenocarcinoma.
* p< 0.05 compared to background pancreas; ψ p <0.05 compared to resectable
pancreatic carcinoma tissue; ᵹ compared to locally advanced disease.
Notch 2 Expression
Nuclear
n (%)
Cytoplasmic
median
% (range)
Cytoplasmic
mean %
(standard
deviation)
Normal
Background
pancreas
(n=38) 3 (7.9%) 100% (0-100) 87.9% (28.9)
Resectable
disease
Pancreatic
tissue
(n=42) 18 (42.9%)* 85% (0-100) * 61.3% (41.8)
Local
lymph
nodes (n=9) 7 (77.8%)* 100% (0-100) 71.1% (43.4)
Advanced
disease
Overall
(n=45) 28 (62.2%)* 100% (0-100) ψ 82.44 (30.9)
Locally
advanced
(n=22)
18
(81.8%)* ψ 100% (0-100) ψ 85.0% (26.0)
Metastatic
(n=23) 10 (43.5%)*ᵹ 100% (0-100) 80.0% (35.4)
0.071); versus locally advanced (81.8%, p = 7.24E-09); versus metastatic disease
(43.5%, p = 0.001). There is also significant upregulation of positive Notch 2 nuclear
staining in locally advanced PDAC tissue when compared to resectable PDAC tissue (p
= 0.003) and when compared to metastatic PDAC tissue (p = 0.008). There is no
significant difference in the frequency of Notch 2 nuclear staining between resectable
PDAC tissue and metastatic PDAC tissue (p =0.961).
Cytoplasmic Notch 2 expression was significantly positively correlated with nuclear
Notch 2 expression in PDAC cells (p = 1.23E-04, Table 4.3). There were no significant

123
relationships between Notch 2 cytoplasmic expression and Notch 1, Notch 3, Notch 4,
Hes 1 and Hey 1 cytoplasmic and nuclear expressions. Similarly, there were no
significant relationships between Notch 2 nuclear expression and Notch 1, Notch 3,
Notch 4, Hes 1 and Hey 1 cytoplasmic and nuclear expressions (Table 4.3). The data for
Notch 1, Notch 3, Notch 4, Hes 1 and Hey 1 nuclear and cytoplasmic expression was
obtained from Dr Chris Mann
Nuclear Notch 2 expression was not found to be significantly associated with any of the
clinicopathological factors investigated (Table 4.4). Cytoplasmic Notch 2 expression
was found to be significantly associated with higher CA 19.9 levels (p = 0.030), and
positive resection margins (p = 0.012); however, reduced cytoplasmic Notch expression
(median = 15%) was associated with positive microvessel invasion (p = 0.041).
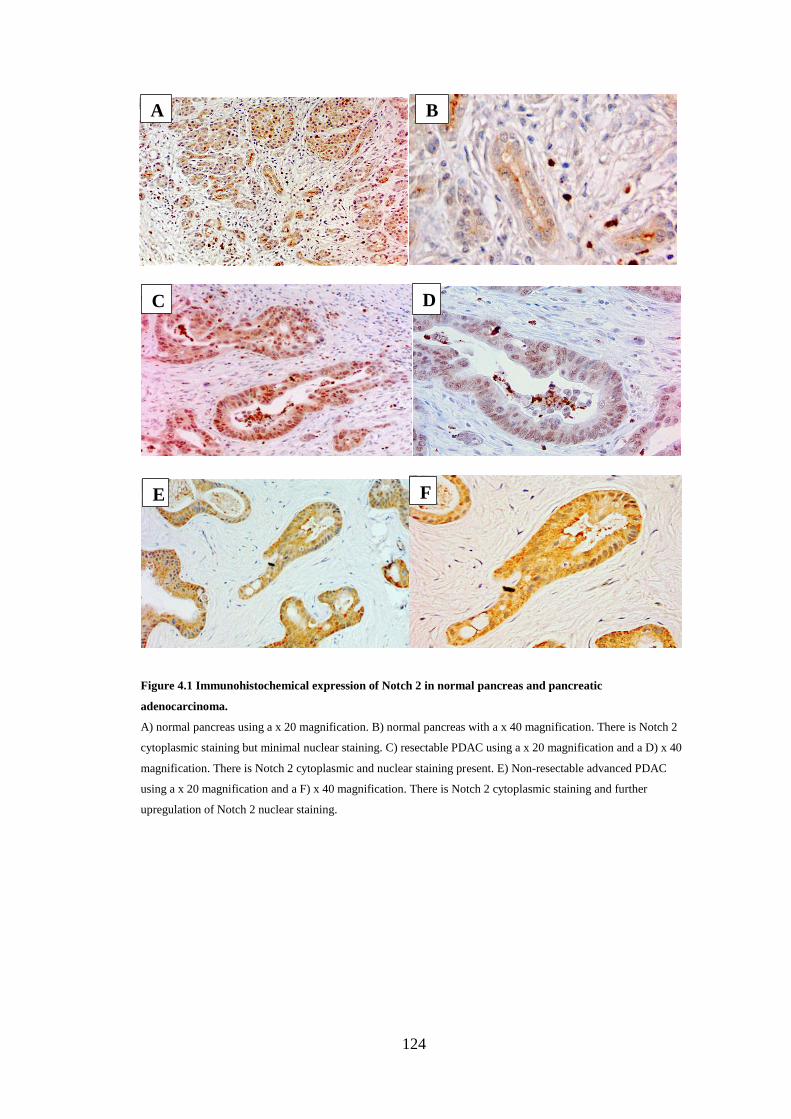
124
Figure 4.1 Immunohistochemical expression of Notch 2 in normal pancreas and pancreatic
adenocarcinoma.
A) normal pancreas using a x 20 magnification. B) normal pancreas with a x 40 magnification. There is Notch 2
cytoplasmic staining but minimal nuclear staining. C) resectable PDAC using a x 20 magnification and a D) x 40
magnification. There is Notch 2 cytoplasmic and nuclear staining present. E) Non-resectable advanced PDAC
using a x 20 magnification and a F) x 40 magnification. There is Notch 2 cytoplasmic staining and further
upregulation of Notch 2 nuclear staining.
A B
C D
E F

125
Table 4.3 Correlations between Notch 2 protein expression and other Notch
proteins and pathway constituents.
Nucl = nuclear; cyto = cytoplasmic; * = correlation is significant at the 0.01 level (2 -
tailed), Spearman’s rank correlation coefficient.
Notch 2 nucl Notch 2 cyto
Coeff. Sig. Coeff. Sig.
Notch 2 nucl 1.000 . 0.565* 0.000
Notch 2 cyto 0.565* 0.000 1.000 .
Notch 1 nucl 0.031 0.844 0.238 0.128
Notch 1 cyto -0.059 0.710 0.082 0.608
Notch 3 nucl 0.138 0.385 0.210 0.182
Notch 3 cyto 0.121 0.445 -0.013 0.937
Notch 4 nucl 0.193 0.222 0.089 0.575
Notch 4 cyto -0.248 0.114 -0.232 0.139
HES 1 nucl 0.075 0.644 0.148 0.361
HES 1 cyto -0.073 0.657 -0.107 0.509
HEY 1 nucl 0.031 0.844 -0.040 0.803
HEY 1 cyto 0.168 0.288 0.052 0.745

126
Table 4.4 Associations of nuclear and cytoplasmic Notch 2 expression in
resectable PDAC tissue with clinicopathological variables.
* = Chi squared or Fisher’s exact test as appropriate; ** = Mann–Whitney U test.
Alk Phos = alkaline phosphatase; ALT = alanine transaminase; NLR =
neutrophil/lymphocyte ratio.
Factor Category Nuclear Notch 2 expression Cytoplasmic Notch 2
expression
Present Absent P* Median (range) P**
Gender Male
Female
11
7
13
10
0.767 77.5% (0-100%)
90% (0-100%)
0.804
Age ≥64 years
<64 years
8
10
13
11
0.533 80% (0-100%)
90% (0-100%)
0.520
CA19.9 ≥320 (U/ml)
<320 (U/ml)
10
8
8
16
0.150 100% (10-100%)
40% (0-100%)
0.030
Alk phos ≥258 (IU/L)
<258 (IU/L)
8
10
12
12
0.721 85% (0-100%)
70% (0-100%)
0.990
ALT ≥91 (IU/L)
<91 (IU/L)
9
9
11
13
0.789 95% (0-100%)
50% (0-100%)
0.407
Bilirubin ≥146 (µmol/L)
<146 (µmol/L)
7
11
13
11
0.327 77.5% (0-100%)
95% (0-100%)
0.318
WCC ≥7.5 (x 109/L)
<7.5 (x 109/L)
6
12
13
11
0.179 50% (0-100%)
90% (0-100%)
0.210
Lymphocytes ≥1.5 (x 109/L)
<1.5 (x 109/L)
11
7
9
14
0.162 50% (0-100%)
90% (0-100%)
0.989
Neutrophils ≥5.0 (x 109/L)
5.0 (x 109/L)
8
10
12
12
0.721 50% (0-100%)
95% (0-100%)
0.216
NLR ≥5.0
<5.0
5
13
6
16
0.972 80% (0-100%)
90% (0-100%)
0.599
Albumin ≥36 (g/L)
<36 (g/L)
11
7
11
3
0.327 85% (0-100%)
70% (0-100%)
0.486
Creatinine ≥72 (µmol/L)
<72 (µmol/L)
11
7
9
15
0.129 95% (0-100%)
50% (0-100%)
0.242
Tumour
diameter
≥29mm
<29mm
9
9
10
14
0.591 90% (0-100%)
75% (0-100%)
0.579

127
Tumour
differentiation
Poor
Well/Mod
9
9
9
13
0.565 82.5% (0-100%)
85% (0-100%)
0.702
Nodal status Positive
Negative
9
9
13
10
0.678 50% (0-100%)
90% (0-100%)
0.446
Microvessel
invasion
Present
Absent
4
12
10
12
0.197 15% (0-100%)
90% (0-100%)
0.041
Perineural
invasion
Present
Absent
12
6
16
6
0.677 50% (0-100%)
100% (0-100%)
0.183
Resection
margin
Positive
Negative
7
11
8
15
0.786 100% (10-100%)
50% (0-100%)
0.012
4.3.2 Survival Analyses
Survival analyses were performed to associate the expression of Notch 2 with overall
and disease- free survival following resection with curative intent of pancreatic
adenocarcinoma. In the univariate Cox regression model, neither Notch 2 nuclear
expression nor cytoplasmic expression made any significant contribution to the overall
survival or disease-free survival (Table 4.5). To investigate if Notch 2 expression had
any effect on overall or disease-free survival following clear resections margins,
another univariate Cox regression model was done. Again, Notch 2 nuclear expression
nor cytoplasmic expression made any significant contribution to the overall survival or
disease-free survival (Table 4.6).
There was no significant difference in overall survival between expression of nuclear
Notch 2 and no expression of nuclear Notch 2 (p =0.642 Log Rank test). For patients
undergoing curative resections, the median survival was 30.1 months, 95% CI 22.8 –
37.4 months for patients with positive Notch 2 nuclear expression, whereas the median
survival was 30.5 months, 95% CI 25.2 – 37.8 months for patients without nuclear

128
Notch 2 expression. 5-year survival for patients with positive nuclear Notch 2
expression was 27.8% and for patients without nuclear Notch 2 expression was 21.7%.
(Figure 4.2). There was also no significant difference in disease free survival between
expression of nuclear Notch 2 and no expression of nuclear Notch 2 (p =0.867 Log
Rank test) with a median of 25.0 months (95% CI 12.6 -37.4 months) and 21.8 months
(95% CI 13.2 – 30.4 months) respectively (Figure 4.3).
Similarly, there was no significant difference in overall survival between upregulated
cytoplasmic expression of Notch 2 (≥ 50%) and low cytoplasmic expression of Notch 2
(≤ 50%) (p =0.813 Log Rank test). For patients undergoing curative resections, the
median survival was 27.5 months (95% CI 24.1 – 30.9 months) for patients with
upregulated cytoplasmic expression of Notch 2 (≥ 50%) whereas the median survival
was 31.3 months (95% CI 29.3 – 33.3 months) for patients with lower cytoplasmic
Notch 2 expression. 5-year survival for patients with upregulated cytoplasmic
expression of Notch 2 was 26.9% and for patients with low cytoplasmic Notch 2
expression was 18.8%. (Figure 4.2). There was also no significant difference in disease
free survival between upregulated expression of cytoplasmic Notch 2 and low
expression of cytoplasmic Notch 2 (p =0.763 Log Rank test) with a median of 21.8
months (95% CI 6.9 – 36.7 months) and 28.7 months (95% CI 19.1 – 38.3 months)
respectively (Figure 4.3).
Univariate Cox regression model analysis on overall survival was done using
clinicopathological factors as variables. CA 19.9 ≥ 320 (p = 0.028), Alanine
Transaminase ≥ 91 (p = 0.049), lymph node involvement (p = 0.002), microvessel
invasion (p = 0.023) and positive resection margins (p = 0.015) gave statistically

129
significant results. WCC ≥ 7.5 (p = 0.080) and neutrophils ≥ 5 (p = 0.090) were the
other variables who gave p values of less than 0.1. (Table 4.7) Therefore, a forward
logistic multivariate Cox regression model analysis was done on overall survival using
the above variables. Alanine Transaminase ≥ 91 (p = 0.018, HR 2.437), lymph node
involvement (p = 0.003, HR 3.526), microvessel invasion (p=0.026, HR 2.407) and
involved resection margin (p = 0.009, HR 2.852) all made significant contributions to
the model, with lymph node involvement giving the highest hazard ratio for overall
survival.
A similar univariate cox regression model analysis for disease free survival found CA
19.9 ≥ 320 (p = 0.028), Lymph node involvement (p = 0.001), microvessel invasion
(p=0.034), and neural invasion (p =0.075) gave statistically significant results. Alanine
Transaminase ≥ 91 (p = 0.071) was the other variable which gave p values of less than
0.1. (Table 4.7) A forward logistic multivariate Cox regression model analysis was
done on overall survival using the above variables. Alanine Transaminase ≥ 91 (p =
0.037, HR 2.269) and lymph node involvement (p = 0.001, HR 4.184) made statistically
significant contributions to the model with lymph node involvement giving the higher
hazard ratio for disease-free survival.

130
Table 4.5 Univariate Cox Regression survival analyses for Notch 2 pathway
biomarkers for all patients undergoing potentially-curative resection for
pancreatic adenocarcinoma (n=42)
Overall Survival Disease-free Survival
Hazard Ratio
(95% CI)
P Hazard Ratio
(95% CI)
P
Notch 2 nuclear
expression: +/-
0.850 (0.428-
1.688)
0.643 0.941 (0.463-
1.913)
0.867
Notch 2 cytoplasmic
expression: ≥50%/<50%
staining
0.922 (0.470-
1.809)
0.813 0.896 (0.437-
1.837)
0.763
Table 4.6 Univariate Cox Regression survival analyses for Notch 2 pathway
biomarkers for patients who had a clear R0 resection margin following surgery
for pancreatic adenocarcinoma (n=27)
Overall Survival Disease-free Survival
Hazard Ratio
(95% CI)
P Hazard Ratio
(95% CI)
P
Notch 2 nuclear
expression: +/-
0.897 (0.366-
2.200)
0.813 1.005 (0.395-
2.559)
0.992
Notch 2 cytoplasmic
expression: ≥50%/<50%
staining
0.623 (0.260-
1.490)
0.287 0.618 (0.247-
1.549)
0.305

131
Figure 4.2 Kaplan Meier curve demonstrating the impact of Notch 2 expression on overall
survival in patients who had potentially curative resection (n = 42)
A = Nuclear Notch 2 expression. No significant difference (p =0.642). B = Cytoplasmic Notch
expression. No significant difference (p= 0.813). Log-rank test)

132
Figure 4.3 Kaplan Meier curve demonstrating the impact of Notch 2 expression on
disease-free survival in patients who had potentially curative resection (n = 42)
A = Nuclear Notch 2 expression. No significant difference (p =0.867). B = Cytoplasmic Notch
expression. No significant difference (p= 0.763). Log-rank test)

133
Table 4.7 Univariate Cox regression survival using clinicopathologic factors for
patients undergoing potentially-curative resection for pancreatic
adenocarcinoma (n = 42). Variables with P values < 0.1 are highlighted in bold.
Factor Variables Overall Survival
Hazard ratio P value
(95% CI)
Disease Free Survival
Hazard ratio P value
(95% CI)
Gender Male/
Female
0.611
(0.313 – 1.192)
0.149 1.243
(0.617 – 2.506)
0.545
Age ≥64 /<64 years 1.158
(0.592 – 2.264)
0.668 1.056
(0.524 – 2.127)
0.880
CA19.9 ≥320/<320
(U/ml)
2.142
(1.084 – 4.231)
0.028 2.245
(1.091 – 4.618)
0.028
Alkaline
phosphatase
≥258/<258
(IU/L)
0.955
(0.488 – 1.866)
0.892 1.018
(0.506 – 2.047)
0.960
Alanine
Transaminase
≥91/<91
(IU/L)
1.975
(1.004 – 3.882)
0.049 1.920
(0.592 – 2.264)
0.071
Bilirubin ≥146/<146
(µmol/L)
1.121
(0.577 – 2.180)
0.736 1.109
(0.552 – 2.230)
0.771
White Cell
count
≥7.5/<7.5
(x 109/L)
0.547
(0.279 – 1.074)
0.080 0.695
(0.344 – 1.405)
0.311
Lymphocytes ≥1.5/<1.5
(x 109/L)
0.865
(0.441 – 1.698)
0.674 1.113
(0.547 – 2.268)
0.767
Neutrophils ≥5.0/<5.0
(x 109/L)
0.558
(0.284 – 1.095)
0.090 0.693
(0.344 – 1.394)
0.303
Neutrophil
Lymphocyte
ratio
≥5.0/<5.0 0.790
(0.375 – 1.663)
0.535 0.891
(0.418 – 1.900)
0.766
Albumin ≥36/<36
(g/L)
1.045
(0.534 – 2.045)
0.899 0.944
(0.470 – 1.896)
0.872
Creatinine ≥72/<72
(µmol/L)
0.696
(0.354 – 1.370)
0.294 0.643
(0.316 – 1.308)
0.233
Tumour
diameter
≥29/<29 mm 0.959
(0.490 – 1.876)
0.902 0.835
(0.415 – 1.680)
0.612
Tumour
differentiation
Poor/
Well/Mod
0.833
(0.415 – 1.673)
0.608 0.864
(0.417 – 1.791)
0.694
Nodal status Positive/
Negative
3.312
(1.566 – 7.004)
0.002 4.047
(1.786 – 9.172)
0.001
Microvessel
invasion
Present/
Absent
2.304
(1.124 – 4.719)
0.023 2.275
(1.065 – 4.860)
0.034
Perineural
invasion
Present/
Absent
1.790
(0.824 – 3.890)
0.142 2.108
(0.929 – 4.786)
0.075
Resection
margin
Positive/
Negative
2.373
(1.186 – 4.747)
0.015 1.645
(0.803 – 3.369)
0.174

134
4.4 DISCUSSION
This chapter reports the immunohistochemical assessment of Notch 2 receptors in
PDAC. It is the first study to examine Notch 2 expression throughout disease
progression from early, through advanced local disease to metastatic disease. This study
is also the first to explore the association of Notch 2 expression with clinicopathological
factors. Finally, this study also looks at the correlation of Notch 2 with other Notch
receptors and its target genes Hes 1 and Hey 1, and the effect of Notch 2 expression on
overall and disease-free survival. There were only two widely recognized studies
exploring the expression of Notch 2 in human PDAC tissue using
immunohistochemistry (Miyamoto et al, 2003; Büchler et al, 2005).
Miyamoto et al found Notch 2 cRNA to be upregulated in PDAC tissue, with a 2-3-fold
increase compared to normal pancreas. Using real-time quantitative RT-PCR analysis,
they demonstrated a 3.4-fold overexpression of Notch 2 in infiltrating pancreatic ductal
adenocarcinomas compared to normal pancreas. Using 34 resected human pancreas
tissue samples which contained both PDAC and PanIN lesions, they demonstrated little-
to-no expression in normal pancreatic ductal epithelium but moderate to high levels of
detectable Notch 2 in 47% of the cancer samples (Miyamoto et al, 2003). Bucher et al
found Notch 2 to be consistently expressed in 6 different human pancreatic cancer cell
lines, at different levels, with the highest levels of Notch 2 expression in the
undifferentiated cell lines. They examined the expression of the Notch gene family by
real-time quantitative PCR using 31 pancreatic cancer patients and 22 healthy organ
donors. They detected all 4 members of the Notch gene family in normal pancreatic
tissue, however higher levels of Notch 2 mRNA were detected in both normal and
pancreatic cancer specimens. Furthermore, the Notch 2 gene was not significantly

135
upregulated in pancreatic cancer samples in comparison to normal pancreatic tissue.
Using IHC, Bucher et al reported strong Notch 2 expression present in ductal pancreatic
cancer cells and in vascular smooth muscle cells of the tumour blood vessels, but
disappointingly there was no comparison with normal pancreatic tissue (Büchler et al,
2005).
The results of this study found cytoplasmic Notch 2 was expressed highly in the
cytoplasm of the ductal epithelial cells of both normal pancreas tissue and PDAC,
including lymph node metastases, locally advanced disease and distant metastasis. This
increased expression is in keeping with the findings of Bucher et al (2005) which
detected Notch 2 mRNA in both normal and pancreatic cancer specimen. However,
there is a statistically significant difference in the cytoplasmic expression of Notch 2
between healthy tissue and resectable PDAC tissue with reduced expression in the
cancer tissues. This result is slightly unexpected since we were expecting Notch 2 to be
upregulated in cancer. One possible explanation for this could be due to the relatively
high proportion of positive cytoplasmic staining and our choice of semi-quantitative
method of scoring. Our median value for all the tissue types, except for resectable
cancer, was 100% and therefore any reduction in the median value could have resulted
in a difference. The alternate explanation could be that Notch 2 signalling is complex
and there is still a lot of it that we do not understand. We found minimal nuclear
expression in healthy pancreas tissue in keeping with the findings of Miyomoto et al
(2003). We also found nuclear expression of Notch 2 to be significantly upregulated in
all cancer tissues (including resectable tissues, locally advanced non-resectable tissues,
involved lymph nodes and distant metastases). This is in keeping with the finding of
Miyomoto et al (2003) and also confirms the immunohistochemical presence of Notch

136
2 proteins in cancer specimens as described by Bucher et al (2005). We found that the
nuclear expression of Notch 2 was also significantly upregulated in locally advanced
non-resectable disease when compared to resectable disease. This is similar to the
findings of Mann (2012) in which he found the expression of Notch 1, 3,4 and its
downstream targets Hes 1 and Hey 1 upregulated in locally advanced non-resectable
cancers. However, we also found that there is significant downregulation in Notch 2
nuclear expression in distant metastasis of PDAC when compared to locally advanced
non-resectable tissue and resectable (early) PDAC tissue. This is different from Mann
2012, where he found that the expression of the other receptors in the Notch family was
upregulated in metastatic PDAC, in comparison to resectable (early) PDAC tissue. This
finding is potentially interesting and could suggest that Notch 2 does not behave like the
rest of the Notch receptors but in a rather complex manner depending on the stage of
the disease. This could also suggest that Notch 2 might have a differing role to the rest
of its family in relation to pancreatic cancer. Our findings that the nuclear expression of
Notch 2 in distant metastasis is significantly lower compared to locally advanced non-
resectable tissue and resectable (early) PDAC tissue seems to suggest a theory that
Notch 2 is required for progression of PDAC up to a certain point, after which its role is
somewhat reduced. This theory is supported by a study examining the role of Notch
signalling in radiologically evident pancreatic tumours in mice, which demonstrated
that GSI treatment failed to extend lifespan thus suggesting that Notch signalling may
not be involved in the maintenance of advanced pancreatic tumours (Cook et al, 2012).
We have found that Notch 2 nuclear and cytoplasmic expression are significantly
positively correlated as is expected, but found no other significant associations with the
other Notch family and the downstream targets Hes 1 and Hey 2. This suggests that

137
Notch 2 works independently of the Notch family and its downstream targets are not
Hes 1 or Hey 1. Among the 4 members of the Notch family protein, only Notch 1 and
Notch 2 are thought to have significant roles in pancreatic embryonic development and
pancreatic carcinogenesis (Hu et al, 2013). Notch 1 and Notch 2 have also been shown
to have different effects on pancreatic organogenesis as well as carcinogenesis (Mazur
et al, 2010). So, the lack of association with the other Notch family is not surprising. It
is also unsurprising that there is no association with Hes 1 and Hey 1. Hes 1 is
commonly used as an identification marker of the activation of the Notch pathway, but
Hes 1 expression does not necessarily correlate with Notch activation and does not
differentiate between Notch receptors (Avila and Kissil, 2013). There has been several
studies where the inhibition of Notch signalling in pancreatic cancer has not led to
decreased expression of Hes 1(Hanlon et al, 2010; Mazur et al, 2010). Similarly, Hes 1
expression has also failed to recreate the effects of Notch activation (Miyamoto et al,
2003; Plentz et al, 2009). There has also been reports of Hes 1 activation in a Notch-
independent manner (Mazur et al, 2010; Hashimoto et al, 2006). A very recent study by
Liu et al in human pancreatic cancer cells lines have found that only a small subset of
Notch 1 and Notch 2 binding sites overlap with the binding sites of transcription factor
CSL (CBF1, Suppressor of Hairless, Lag1), whilst about half of the CSL binding sites
overlap with that of Notch 1 or Notch 2, indicating most Notch signalling activities are
actually CSL independent (H. Liu et al, 2017). Furthermore, they have also identified
TPM3, NFκ-BIA, NFκ-B, GSK -3β and GNAQ as Notch 2 target genes in pancreatic
cell lines (H. Liu et al, 2017).
We also found an association of higher level of Notch 2 cytoplasmic staining with
higher levels of CA 19.9 and positive resection margins. This is again in-keeping with

138
the findings that Notch 2 activation is upregulated and required for the progression of
PDAC (Mazur et al, 2010). We found no statistical difference in overall survival and
disease-free survival between patients with positive Notch 2 expression and patients
with negative Notch 2 expression in patients who had a potentially curative resection
for PDAC. This is somewhat surprising as Mazur et al were able to show that Notch 2
knockdown in Kras mice led to significantly longer median survival (Mazur et al,
2010).
There has been contrasting reports on the role of Notch 1 and Notch 2 in pancreatic
carcinogenesis. Miyamoto et al reported that the increased expression of Notch
receptors and its ligands promoted the activation of Notch in early PanIN lesions. In
mice cells, they were able to show that activation of Notch 1 and Notch 2 resulted in
metaplastic conversion of acinar -cell predominant epithelium to a ductal cell-
predominant epithelium and that transforming growth factor alpha (TGFα)- induced γ-
secretase- dependent Notch activation is required for initiation of the
metaplasia/neoplasia sequence (Miyamoto et al, 2003). Mazur et al found that, in
KrasG12D mice, Notch 2 is the predominant Notch receptor in ductal, centroacinar and
PanIN cells and by far the most prominently expressed Notch receptor during PanIN
development and in PDAC, whilst Notch 1 is predominantly in the acinar cells (Mazur
et al, 2010). They were also able to show that Notch 2 knockdown in Kras mice led to
significantly longer median survival, whereas Notch 1 knockdown led to no significant
change. This led to the suggestion that Notch 2 is involved in the progression of PanIN
and is associated with decreased survival, whereas Notch 1 has no oncogenic role in
Kras mice. Interestingly Mazur et al did not observe loss of Hes 1 expression in either
Notch 1 or Notch 2 knocked down pancreas, suggesting that Hes 1 may be regulated by

139
other signalling pathways. Mazur et al also found evidence to support the theory that
Notch 2 modulates Myc signalling in Kras mice and Notch–dependent Myc signalling
is a key regulator of the carcinogenic process in the pancreas (Mazur et al, 2010).
Mullendore et al showed that loss of Notch 2 in a mouse model of pancreatic cancer
resulted in inhibition of PanIN progression, highlighting the important role of Notch 2
in PanIN progression (Mullendore et al, 2009).
By working in human foetal tissue, Hu et al (2013) found that Notch 1/Hes 1 signalling
pathway is activated during early pancreatic embryogenesis and reaches the highest
level at birth. Once the pancreas is fully developed, the Notch 1/Hes 1 pathway is
inactivated. They also show that the expression of both Notch 1 and Hes 1 are present
in 50% of PDACs, but not in PanINs, indicating that Notch 1 activation is only apparent
in late stage pancreatic carcinogenesis (Hu et al, 2013). Notch 2 has also been
implicated in the chemoresistance of PDAC. Gugnor et al (2011) found that
chemotherapy-induced MK (a heparin- binding growth factor) secretion, triggered
activation of extracellular Notch 2 that resulted in up-regulation downstream targets,
Hes 1 and NF-κB, which in turn, promoted the epithelial-mesenchymal transition
(EMT) that accompanies increased resistance to chemotherapy and migration potential
(Güngör et al, 2011; Gungor et al, 2014). Notch signalling pathway is believed to play
an important role in pancreatic cancer stem cells (CSC). Several studies have shown
high expression of Notch 1 and Notch 2 in CSC and it is thought that that there is a link
between CSC and EMT cells and gemcitabine-resistant cells, both of which are linked
with Notch 2 activation (Z. Wang et al, 2011).

140
As mentioned earlier, Liu et al (2017) identified Notch 2 target genes in the cancer
pathway, from a pancreatic cancer cell line. Two of the target genes are NFκ-BIA and
NFκ-B. NFκ-BIA is an inhibitor of NFκ-B and both these genes are highly expressed in
the pancreatic cell line. Whereas NFκ-B plays a key role in pancreatic cancer cell
proliferation, cell survival and invasion, NFκ-BIA seeks to inhibit it resulting in
chemosensitization and apoptosis. Therefore Notch 2 has the potential to act as an
oncogene and tumour suppressor in the same cancer cell (H. Liu et al, 2017).
Notch 2 therefore has multiple complex roles in pancreatic carcinogenesis and only
some of the functions are now known. More work needs to be done on Notch 2
signalling pathway to fully understand its role in pancreatic carcinogenesis and
therefore to evaluate it potential as a therapeutic option and as a possible biomarker for
prognosis and detection.

141
INVESTIGATING miRNA
EXPRESSION IN PLASMA OF
PATIENTS WITH PANCREATIC
DUCTAL ADENOCARCINOMA AND
CHRONIC PANCREATITIS AS
POTENTIAL BIOMARKERS

142
5.1 Introduction
miRNAs (Micro RNAs) are a class of small (~22 nucleotides) noncoding RNAs which
act as negative regulators of gene expression by either cleaving the target messenger RNA
or by inhibiting the translational process (Mardin and Mees, 2009). Due to their ability
to alter gene expression they play a significant physiological role in the maintenance of
cellular homeostasis and development. As a result, their dysregulation also has an adverse
effect on biological processes, including proliferation, differentiation and apoptosis
(Hwang and Mendell, 2006; Dykxhoorn, 2010).
There have been wide reports of aberrant expression of miRNAs in human cancers. They
have been found to be both overexpressed and under expressed in neoplastic cells
compared with their normal healthy counterparts (J. Wang et al, 2009). miRNAs have
been profiled in many different malignancies including breast, lung, colorectal cancer
and pancreatic cancer (P. Xu et al, 2016; Iorio et al, 2005; Johnson et al, 2005; C. Xu et
al, 2015; Bloomston et al, 2007). miRNAs have been found to be very stable in tissue,
plasma, stool and other fluids. They can also be quantified in very small sample sizes
making it an excellent choice for biomarkers (Hernandez and Lucas, 2016). The first
circulating miRNAs in serum to be used as biomarkers were in patients with diffuse large
B-cell lymphoma (Lawrie et al, 2007).
Using miRNA microarray expression profiling, Bloomston et al identified 30 miRNAs
that were upregulated in pancreatic cancers and 3 miRNAs that were down-regulated
when compared to normal pancreatic tissue. 15 miRNAs were overexpressed, and 8
miRNAs were under expressed in pancreatic cancer tissue when compared with chronic
pancreatitis tissue. 22 miRNAs were overexpressed in chronic pancreatitis tissue and 2

143
miRNAs were under-expressed when compared with normal pancreatic tissue
(Bloomston et al, 2007).
Szafranska et al, through the process of miRNA expression profiling of tissue samples
and pancreatic cancer cell lines, found a total of 94 miRNAs were differentially expressed
at significant level between any two of the 3 tissue types (normal pancreas, pancreatic
ductal adenocarcinoma and chronic pancreatitis). Out of this, they selected the top 26
miRNAs which they thought represented the best novel potential candidates for
biomarkers and therapeutic target selection for PDAC (Szafranska et al, 2007).
Szafranska et al also found miR–196a and miR–196b to be upregulated in PDAC and
also expressed in cancer cell lines, but completely absent in normal pancreatic and
chronic pancreatitis tissue. This led them to suggest miR–196 overexpression is specific
to PDAC and its potential as an excellent biomarker and therapeutic potential (Szafranska
et al, 2007). Interestingly, Bloomston et al found miR-196a-2 did not help differentiate
between pancreatic cancers and non-cancers but found it to be overexpressed in
pancreatic cancer patients with a lower median survival compared to pancreatic cancer
patients with a slightly higher median survival (Bloomston et al, 2007).
Wang et al selected a panel of only four miRNAs, miRNA-21, miRNA-210, miRNA-
155, miRNA-196a, and were able to show that these miRNAs were overexpressed in
blood plasma/serum and varying expression profiles of these samples can be used to
distinguish PDA from normal healthy individuals with a sensitivity of 64% and a
specificity of 89% (J. Wang et al, 2009).

144
It was therefore thought that expression levels of certain miRNAs can be used to
differentiate between PDAC patients, chronic pancreatitis patients and healthy
volunteers. The aim of this chapter is to examine the plasma for 11 miRNAs of interest
in PDAC patients, chronic pancreatitis patents and healthy volunteers in order to examine
their potential as a biomarker.
5.2 Results
5.2.1 Micro RNAs investigated
The miRNAs which were investigated were miR–10b, miR–21, miR–34a, miR–143,
miR–148, miR–155, miR–196a2, miR–200c, miR–206, miR–375 and miR–503. Our
study was aimed as a proof of principle pilot study to evaluate the utility of a few
selected miRNAs in developing a blood-plasma biomarker assay for pancreatic cancer
and chronic pancreatitis. MicroRNA–21, miR–143, miR-155a and miR–196a were
already known to be upregulated in PDAC tissue, whereas miR–10b and miR–143 were
known to be upregulated in both PDAC and chronic pancreatitis tissues (Szafranska et
al, 2007; Habbe et al, 2009; Bloomston et al, 2007). MicroRNA–148a and miR-375
have been shown to be downregulated in PDAC compared to healthy tissues
(Bloomston et al, 2007; Szafranska et al, 2007). MicroRNA– 34a have been shown to
inhibit human pancreatic cancer tumour initiating cells and Chang et al have shown the
expression of miR–34a to be reduced 2-fold in 15 pancreatic cancer cells lines when
compared to normal pancreas (Ji et al, 2009; Chang et al, 2007). Song et al found miR–
206 to be a pro-apoptotic activator of cell death by inhibiting Notch 3 signalling and
tumour formation (G. Song, Zhang and Wang, 2009). MicroRNA 200c was already
linked with increased aggressiveness and chemoresistance in female reproductive

145
malignancies and Park et al reported that miR–200c regulates epithelial to
mesenchymal transition (EMT) in breast and ovarian cancer cells (S. Park et al, 2008).
Yu et al found that increased levels of miR–200c was associated with a significantly
higher survival rates in PDAC and there was a strong positive correlation with E
Cadherin expression and this led them to suggest this miRNA as a prognostic marker
(Yu et al, 2010). Micro RNA–503 is shown to be required for the development of islet
cells in the pancreas and was also shown to be upregulated in endometrial cancer.
(Lynn et al, 2007; Wentz-Hunter and Potashkin, 2011). Simultaneous work in our
laboratory on 4 pancreatic cell lines by a PhD candidate (Lara Lewis) found miR–503
clearly downregulated in all 4 pancreatic cells line when compared to normal pancreatic
tissue. We also found that miR– 206 to be slightly upregulated in 3 cell lines; miR–200c
to be downregulated in 3 of the 4 cancer cell lines; and miR–34a to be clearly
upregulated in 3 cell lines whilst being slightly downregulated in one cell line. These
results along with the evidence from the literature prompted us to finally decide on the
11 miRNAs of interest. A summary of the expression profiling is found in Table 5.1.
The methodology of the miRNA extraction and real-time qPCR are described in section
2.6.
5.2.2 Micro RNA statistical analysis
Following quantitative real-time qPCR, the cycle threshold (Ct) values were recorded
for the tested miRNAs and the internal spike control miR-cel-238. The Ct value is the
quantitative endpoint for a PCR cycle. The numerical value of the Ct is inversely
related to the amount of cDNA created by reverse transcription and therefore is
inversely related to the amount of miRNA in the sample (Schmittgen and Livak, 2008).

146
Table 5.1 Summary of expression profiles in literature of the 11 miRNAs
which were chosen for our study to differentiate between PDAC patients,
chronic pancreatitis and healthy volunteers.
miRNA Reason
miR-10b upregulated in PDAC and chronic pancreatitis tissue
miR-21s upregulated in PDAC tissue
miR-34a downregulated in PDAC tissue
miR-143 Upregulated in PDAC and chronic pancreatitis tissue
miR-
148a
Downregulated in PDAC
miR-
155a
Upregulated in PDAC tissue
miR-
196a
Upregulated in PDAC tissue
miR-
200c
Increased levels associated with significantly higher survival rates in
PDAC
miR-206 Pro-apoptotic activator of cell death. Slightly upregulated in ¾ PDAC cell
lines in our lab.
miR-375 Downregulated in PDAC tissue
miR-503 Required for development of islet cells in the pancreas. Found to be
downregulated in 4/4 PDAC cell lines in our lab.
Relative quantification for the tested miRNAs were calculated by subtracting the Ct
values of the internal spiked control from the Ct values of the miRNA is question. For
each sample, the ∆ Ct = Ct (miRNA) – Ct (cel-miR-238 of that sample). The ∆ Ct for

147
every sample and each subgroup of patients were studied and spurious readings which
were confirmed as definite outliers were further explored using the duplicate raw Ct
values. If the samples were giving consistent extreme outlier Ct values, they were
removed from the statistical analysis. Two healthy volunteers and 2 PDAC patient
samples were consistently giving outlier readings on most of the miRNAs and their raw
readings were observed. It was found that these four samples were processed at the
same time and it was thought that there was either something wrong with the samples or
the master mix and therefore all the readings from those samples were discarded. A
normality test, Kolmogorov-Smirnov test was done for all ∆ Ct values. The ∆ Ct data
for all the miRNAs except miR-206 and miR–155a and miR–10b, followed a normal
distribution and so a parametric test ANOVA, followed by post-hoc test with
Bonferroni corrections were used for their analysis. Non-parametric tests Kruskal
Wallis followed by Mann Whitney U test were performed for calculations involving
miR-206, miR–155a and miR-10b.
5.2.1 Patient Demographics
There was a total of 56 patients included in this analysis, 18 pancreatic ductal
adenocarcinoma patients (PDAC), 20 chronic pancreatitis patients (CP) and 18 healthy
volunteers (HV). (Table 5.2) The process of selecting patients has been described in
section 2.1.1.
There was a significant statistical difference between the mean age of healthy
volunteers and pancreatic cancer patients (p = 0.028) and between patients with
pancreatic cancer and chronic pancreatitis (p = 7.9E -5). There was no significant
statistical difference in mean age between healthy volunteers and chronic pancreatitis

148
patients (p = 0.218). There was no statistical significance between the frequency of
male and female patients amongst the three patient groups (p = 0.061, chi square test).
Table 5.2 Age and Gender of patients included in this study.
Male Female Mean Age (years);
(Range)
Healthy Volunteers 5 (28%) 13 (72%) 58.5 (40.3 – 82.7)
Pancreatic Cancer 10 (56%) 8 (44%) 69.6 (39.9 – 84.4)
Chronic Pancreatitis 13 (65%) 7 (35%) 51.1 (19.3 – 73.8)
5.2.3 Micro RNA Results
An ANOVA test with post hoc analysis of the miRNAs with normally distributed data
was done. A non-parametric (Kruskal Wallis test) was done for the miRNAs with non-
normally distributable data. The full list of miRNAs and their results are listed in
Table 5.3. It can be seen from the table that there are statistically significant differences
in means/medians between groups in miR–155a, miR–196a, miR–200c, miR–375 and
miR-503. Although both miR–10b and miR–34a had a p value of 0.0503 and 0.0504
respectively, there was a difference in medians of ∆ Ct values between HV and PDAC
groups in miR–10b (p = 0.0331); and a difference in means of ∆ Ct values between HV
and PDAC in miR–34a (p = 0.049).
The miRNAs where there is a significant statistical difference in mean/median values of
∆ Ct between HV and PDAC are miR–10b (p = 0.0331), miR–34a (p = 0.049), miR–155a
(p = 0.049) and miR–200c (p = 0.002) (Figure 5.1). The miRNAs where there is a
significant statistical difference in the mean/median ∆ Ct values between HV and CP

149
groups are miR–155a (p = 0.001) and miR–375 (p = 0.001) (Figure 5.2). The miRNAs
where there is a significant statistical difference in the mean/median ∆ Ct values between
PDAC and CP groups are miR–155a (p = 0.009) and miR–196a (p = 0.028). miR–503 is
almost significant with a p value of 0.055 (Figure 5.3). miR–155a is the only miRNA
where there is a significant statistical difference between all patient groups highlighting
its potential as a biomarker (Figure 5.2).
Table 5.3 The mean/median of the ∆ Ct values of the miRNAs and p value of the
ANOVA/Kruskal Wallis test for ∆ Ct values within groups.
Statistically significant results are highlighted in yellow. * denotes non-normally
distributed data and where non-parametric tests were done.
miRNA Patient
type
Mean/median
*∆ Ct
Standard
Deviation/Interquartile
Range for Median
values*
(p value)
between
groups
Healthy
Volunteer
12.0603
1.3899
miR–10b Pancreatic
Cancer
10.8550*
1.24*
0.053
Chronic
Pancreatitis
11.5708
0.7310
Healthy
Volunteer
4.7883
0.8218
miR–21s Pancreatic
Cancer
4.0583
1.0709
0.081
Chronic
Pancreatitis
4.4100
1.0085
Healthy
Volunteer
12.3867
0.8899
miR–34a Pancreatic
Cancer
11.5888
0.6346
0.054
Chronic
Pancreatitis
11.9480
1.1940
Healthy
Volunteer
12.3150
1.3312
miR-143 Pancreatic
Cancer
11.9070
0.9673
0.641
Chronic
Pancreatitis
12.0381
1.2842
Healthy
Volunteer
9.7419
1.3206

150
miR–148a Pancreatic
Cancer
9.2881
1.60549
0.307
Chronic
Pancreatitis
9.0292
1.2853
Healthy
Volunteer
15.6919
2.3407
miR–155a Pancreatic
Cancer
14.2597
1.4398
0.001
Chronic
Pancreatitis
13.3225*
1.65*
Healthy
Volunteer
11.2938
0.8432
miR–196a Pancreatic
Cancer
11.8253
1.2234
0.033
Chronic
Pancreatitis
12.7024
0.6919
Healthy
Volunteer
11.1958
1.0107
miR–200c Pancreatic
Cancer
9.5969
1.7761
0.002
Chronic
Pancreatitis
10.4485
0.9645
Healthy
Volunteer
12.4750* 4.20*
miR-206 Pancreatic
Cancer
11.8975* 5.07* 0.213
Chronic
Pancreatitis
12.3925* 4.58*
Healthy
Volunteer
8.3542
0.7922
miR-375 Pancreatic
Cancer
7.3931
0.7141
0.001
Chronic
Pancreatitis
7.7195
0.6360
Healthy
Volunteer
12.0856
0.9578
miR-503 Pancreatic
Cancer
11.4056
0.8914
0.035
Chronic
Pancreatitis
12.1471
0.9301

151
Figure 5.1 Box plot of ∆ Ct of miR-10b, miR–34a, and miR–200c.
In these miRNAs, only the differences in mean/median between healthy volunteers (HV) and pancreatic
cancer (PDAC) are statistically significant. In all of these miRNAs, the value of ∆ Ct is higher for HV,
meaning that the actual number of micro RNAs is actually lower in HV compared to PDAC.

152
Figure 5.2 Box plot of ∆ Ct of miR-375, miR–155a.
In miR-375 there is a statistically significant difference in ∆ Ct values between HV and PDAC and
between HV and CP (chronic pancreatitis). However, miR–155a is the only miRNA where there is a
statistically significant difference in ∆ Ct values between all three groups, indicating that this is
potentially a suitable miRNA to differentiate chronic pancreatitis from PDAC and HV.

153
Figure 5.3 Box plot of ∆ Ct of miR-196a, miR–503.
There is a statistically significant difference between PDAC and CP groups in miR-196a. miR–503 levels
are almost significant. In both of these miRNAs, the ∆ Ct value is lower for PDAC group indicating that the
actual number of miRNA is higher in the PDAC group.

154
To further, explore the potential of the miRNAs as biomarkers to differentiate between
PDAC and non-cancer, we entered all the miRNAs where there was a significant
difference in the ∆ Ct values between PDAC and healthy volunteers into a binary forward
conditional logistic regression model. The miRNAs which were included were miR–10b,
miR–34a, miR–155a, miR–196a, miR–200c, miR–375 and miR-503. The full model
containing all the predictors was statistically significant, χ2 (1, N = 42) = 9.284, p = 0.002,
indicating that model could distinguish between pancreatic cancers and non-cancers. The
model explained 27.2 % of the variance in disease status, and correctly classified 73.8%
of the cases. This model has a sensitivity of 60%, a specificity of 92.6%, a positive
predictive value of 81.8% and a negative predictive value of 80.6%. Only miR–200c
made a unique statistically significant contribution to the model with an odd ratio of 0.451
(p = 0.016). This model therefore implies that for every 1 unit rise in ∆ Ct value of miR–
200c, the chances of having pancreatic cancer decreases by a factor of 0.451. A Receiver
Operating Characteristics curve using the predicted probabilities form this model gave an
area under the curve of 0.722 with a p value of 0.008 (Figure 5.4).
Since there is also a statistical difference in age between PDAC and healthy volunteers
another binary logistic regression model was run with miR–200c and age (in years) as
variables. This model was also statistically significant, χ2 (2, N = 56) = 22.284, p = 1.4E
-5, indicating that model could distinguish between pancreatic cancers and non-cancers.
This model explains 45.9 % of the variance in disease status between PDAC and non-
cancer. This model also correctly 75% of the cases with a sensitivity and specificity of
50% and 86.8% respectively. This model gives a positive predictive value of 64.2% and
a negative predictive value of 78.6%.

155
Figure 5.4 A ROC curve using the probabilities of the model where miR-200c was the only
statistically significant variable and the binary outcome was PDAC vs non-cancer.
Please note that the area under the curve is 0.722 with a significant p value. This implies a fair test.
Figure 5.5 A ROC curve using the predicted probabilities of the model where age (in years) and
miR-200c were the covariables and the binary outcome was PDAC vs non-cancer.
Please note that the area under the curve is 0.854 with a significant p value. This implies a good test.

156
Both age and miR–200c made statistically significant contributions to the model with
odds ratio of 1.101 (p = 0.004) and 0.540 (p= 0.044). This model therefore implies that
for every 1 year rise in age, the chances of having PDAC increases by a factor of 1.101
provided the miRNA values of miR–200c remains constant. However, if age is constant,
for each one unit rise in ∆ Ct of miR–200c odds of having PDAC decreases by a factor
of 0.540. A Receiver Operating Characteristics curve using the predicted probabilities
from this model gave an area under the curve of 0.854 with a p value of 2.2E -5 (Figure
5.5).
In order to identify a miRNA or a panel of miRNAs which would be effective in
distinguishing HV from PDAC, a logistic regressions analysis was done including miR–
10b, miR–34a, miR–155a, miR–200c and miR–375 as co-variables. This model was
statistically significant, χ2 (2, N = 32) = 16.727, p = 2.33E -4, indicating that model could
distinguish between healthy volunteers and pancreatic ductal adenocarcinoma. The
model explained 54.3 % of the variance in disease status, and correctly classified 71.9 %
of the cases. This model has a sensitivity of 75%, a specificity of 68.8%, a positive
predictive value of 70.6% and a negative predictive value of 73.3%. Both miR–200c and
miR–375 made statistically significant contributions to the model (p = 0.027 and p =
0.046 respectively) with an odds ratio of 0.350 and 0.209 respectively. A ROC curve
using the predicted probabilities from this model gave an area under the curve of 0.849
with a p value of 3.5E -4 (Figure 5.6).

157
Figure 5.6 A ROC curve using the predicted probabilities of the model where miR-200c and
miR–375 made statistically significant contributions and the binary outcome was HV vs PDAC.
Please note that the area under the curve is 0.849 with a significant p value. This implies a good test.
Once age (in years) is added into a new model containing the two significant variables
from the previous model an even better fit of a model is achieved. This model is
statistically significant, χ2 (3, N = 36) = 24.383, p = 2.1E -5 and explains 65.6 % of the
variance in disease status, and correctly classified 77.8 % of the cases. This model has a
sensitivity of 83.3%, a specificity of 72.2%, a positive predictive value of 75% and a
negative predictive value of 81.3%. However only miR – 375 made a statistically
significant contribution to the model (p = 0.027) with an odds ratio of 0.131. Age (in
years) almost makes a significant statistical contribution to the model with a p value of
0.054) and an odds ratio of 1.099. A ROC curve using the predicted probabilities form
this model gave an area under the curve of 0.910 with a p value of 2.6E -5 (Figure 5.7).

158
Figure 5.7 A ROC curve using the predicted probabilities of the model where miR–375 made
statistically significant contributions to the binary outcome of HV vs PDAC.
Please note that the area under the curve is 0.910 with a significant p value. This implies an excellent
test.
A binary logistic regression analysis was done to identify the best miRNAs to
differentiate between PDAC and CP. miR–155a, miR–196a and miR–503 were added as
co-variables. The model was statistically significant, χ2 (3, N = 33) = 18.138, p = 4.12E
-4 and explains 56.5 % of the variance in disease status, and correctly classified 81.8 %
of the cases. This model has a sensitivity and positive predictive value of 80%, a
specificity and a negative predictive value of 83%. miR–503 and miR–155a made
statistically significant contributions to the model (p = 0.030 and 0.021 respectively) with
odds ratio of 0.208 and 3.176 respectively. A ROC curve using the predicted probabilities
form this model gave an area under the curve of 0.881 with a p value of 1.96E -4 (Figure
5.8).

159
Figure 5.8 A ROC curve using the predicted probabilities of the model where miR-503 and miR–
155a made statistically significant contributions and the binary outcome was PDAC vs chronic
pancreatitis.
Please note that the area under the curve is 0.881 with a significant p value. This implies a good test.
Once age (in years) is added into a new model containing the two significant variables
from the previous model an even better fit of a model is achieved. This model is
statistically significant, χ2 (2, N = 36) = 28.949, p = 5.1741E -7 and explains 73.7 % of
the variance in disease status, and correctly classified 86.1 % of the cases. This model
has a sensitivity of 88.2%, a specificity of 84.2%, a positive predictive value of 83.3%
and a negative predictive value of 88.9%. However only age (in years) and miR–155a
make statistically significant contributions to the model (p = 0.003 and p = 0.008
respectively). There was an odd ratio of 3.537 for miR–155a and an odds ratio of 1.262
for age in years. A ROC curve using the predicted probabilities form this model gave an
area under the curve of 0.953 with a p value of 3E -6 (Figure 5.9).

160
Figure 5.9 A ROC curve using the predicted probabilities of the model where age (in years) and
miR – 155a made statistically significant contributions to the binary outcome of PDAC vs chronic
pancreatitis.
Please note that the area under the curve is 0.953 with a significant p value. This implies an excellent
test.
A final logistic regression analysis was done to find the best miRNA to differentiate
between healthy volunteers and chronic pancreatitis patients and so miR-155a and
miR–375 were included as co-variables. The model is statistically significant with a χ2
(2, N = 38) = 20.091, p = 4.3E -5 and explains 54.8 % of the variance in disease status.
This model has a sensitivity of 85%, a specificity of 77.8%, a positive predictive value
of 81% and a negative predictive value of 82.4%. Only miR–155a makes a statistical
significant contribution to the model (p = 0.007) with an odds ratio of 0.468. miR–375
almost makes a statistically significant contribution with a p value of 0.053 and an odds
ratio of 0.321. A ROC curve using the predicted values of this model gives an area
under the curve of 0.875 (p = 7.9E -5) (Figure 5.10). Since there was no statistical
difference in age between healthy volunteers and patients with chronic pancreatitis, age

161
was not added to a logistic regression model to differentiate between healthy volunteers
and chronic pancreatitis patients.
Figure 5.10 A ROC curve using the predicted probabilities of the model where miR–155a made
statistically significant contributions to the binary outcome of healthy volunteers’ vs chronic
pancreatitis.
Please note that the area under the curve is 0.875 with a significant p value. This implies a good test.
5.3 Discussion
The purpose of this study was to examine the levels of certain miRNAs of interest in the
plasma of patients with PDAC, chronic pancreatitis and healthy volunteers and to assess
whether any of the chosen miRNAs had any potential to act as biomarkers. The
miRNAs were chosen due to their previously established role in pancreatic
carcinogenesis or carcinogenesis in general and also because some of the miRNAs were
being researched in our laboratory in pancreatic cancer cell lines and showed
upregulation compared to normal pancreas.

162
Our study was based on plasma samples which was collected in non-heparinised EDTA
bottles and so did not require any additional treatment with heparin (Tiberio et al, 2015;
Moldovan et al, 2014). The samples used were frozen rather than fresh as it has been
shown to bear no significance (Tiberio et al, 2015). During the process of plasma
preparation, visual analysis was made to ensure that the samples were not haemolysed
in-vitro which would have otherwise impaired the quantification of plasma miRNAs.
The miRNeasy Mini kit (Qiagen) was used to extract the RNA from plasma as several
studies have shown that this kit normally yields the greatest recovery of circulating
RNA with regards to quantity and quality (Tiberio et al, 2015). There are several
platforms available for micRNA profiling and the popular ones include Northern
blotting, miRNA microarray technology, miRNA quantitative reverse transcription PCR
(qRT-PCR) assays, next generation sequencing platforms and multiplex miRNA
profiling (Hunt et al, 2015). Quantitative reverse transcription PCR (qRT-PCR) assays,
is the amplification- based method used to detect and quantify the miRNAs of interest.
This is because qRT-PCR is a well-established, highly sensitive method and is
considered as the “gold standard” for miRNA detection and also because of our
relatively low sample numbers and our choice of miRNA, this platform is the most cost
effective (Tiberio et al, 2015).
There will always be technical variability amongst samples, due to issues such as
variation in the starting material, amount of RNA extracted, and efficiency during the
qRT-PCR process (Tiberio et al, 2015). There are several accepted methods in the
literature on how to account for the variability and effectively normalise the data.
Housekeeping transcripts have been suggested and miR–16 is probably the most

163
common housekeeping transcript which has been reported in the literature. However, it
is also one of the miRNAs most affected by haemolysis and therefore should not be
considered as a reference for data normalisation. There have been proposals of other
miRNAs as candidates for housekeeping transcripts but without any global consensus
(Tiberio et al, 2015). We followed the normalisation strategy suggested by Kroh et al. It
involved the use of spiked-in synthetic C. elegans as control miRNAs during the first
phase of the extraction which involved the denaturation of plasma (Kroh et al, 2010).
This was done to normalise the biological variability that could otherwise could affect
the extraction efficiency. It was not possible to extract miRNA from 60 plasma
samples at the same time. It was spread out over several days, but equal number of
random samples between the 3 groups (healthy volunteers, PDAC and chronic
pancreatitis) were processed at the same time to reduce technical variability. Similarly,
it was not possible to perform qRT-PCR on 60 samples for 11 miRNAs of interest at the
same time on a 96 well plate. The qRT – PCR was carried out over a few days but
again to reduce technical variability, equal number of random samples between the 3
groups were processed at the same time. We believe we have been successful in
effectively minimising our technical variability as much as possible. This is reflected in
our data. The Ct values of our synthetic spike-in miRNA miR-cel-238 follows a normal
distribution. The Ct values of a miRNA of interest, miR-143a, also has a significant
correlation with miR–cel–238 and also follows a normal distribution pattern.
Furthermore, there was also no statistically significant difference between the mean ∆
Ct of 143a between the 3 groups with an equal homogeneity of variances (p = 0.54). If
needed, our data can also be normalised to miR–143a and this miRNA can act as an
endogenous internal control. To normalise the data, the ∆ Ct was calculated for every

164
miRNA. This was the Ct value for the miRNA of interest in that sample minus the Ct
value of miR-cel–238 for that sample.
The Ct values are actually log-linear plot of the PCR signal versus the cycle number
and has therefore already undergone a log transformation. It is therefore not necessary
to use the 2-∆ Ct data and the ∆ Ct would suffice (Schmittgen and Livak, 2008). We have
presented our data as ∆ Ct as we are interested in the relative gene expression and this
reduces the variability of the data and normalises it (Livak and Schmittgen, 2001).
Using ∆ Ct also allows us to do much stronger statistical test such as T- test and
ANOVA which yields ∆∆ Ct (Yuan et al, 2006). Since we are using ∆ Ct to present our
data, it is important to remember than a decrease in ∆ Ct suggests higher levels of the
miRNA and an increase in ∆ Ct suggest lower levels of the miRNA.
During statistical analysis, it was noticed that there was a lot of variability in data
involving the healthy volunteer group. We now know that individual variability and
external factors can all contribute to affect miRNA levels in the circulation. Although
the exclusion criteria for healthy volunteers included anyone less than 18 years of age
and also anyone who previously has been diagnosed with cancer, pancreatitis and
Alzheimer disease (appendix 1), we do not know whether the individual had
hypertension, diabetes or hypercholesterolemia or any other illnesses. We also did not
consider the lifestyle of the healthy volunteers such as smoking status and food habits.
These could have been contributing factors towards the variability of the healthy
volunteers’ samples and this is a weakness of this study.

165
At the time of the study (autumn 2011 to spring 2012), there were a few high-profile
papers on the differential expression of miRNAs in tissue samples highlighting
miRNAs which might be useful to differentiate between healthy controls, PDAC and
chronic pancreatitis. (Szafranska et al, 2007; E. J. Lee et al, 2007; Bloomston et al,
2007) However, there were only two published papers which have looked at circulating
miRNAs in blood for their usefulness as biomarkers in pancreatic cancer. Wang et al
selected a panel of four miRNAs, miR–21, miR–210, miR–155 and miR–196a, which
were reported to be over expressed in PDAC and reported a combined sensitivity of
64% and specificity of 89% with an area under the curve (for a ROC analysis) of
0.82%. This was detectable in plasma (J. Wang et al, 2009). Bauer et al adopted a
slightly different approach and studied the variations of the miRNA levels in blood
cells. They were able to distinguish between healthy and diseased pancreas from their
blood analysis, but were unable to separate pancreatic inflammation from cancer. This
was therefore not clinically useful (Bauer et al, 2012).
We have found that miR-200c is a significant variable in a binary logistics model of
several micro RNAs when trying to differentiate between PDAC and non-cancer. This
model gave us 60% sensitivity and 92.6% specificity with an area under the curve
(ROC curve analysis) of 0.722, which indicates a fair test. Our result compared very
well with Wang et al where they achieved sensitivity of 64% and a specificity of 89%
and an area under the curve of 0.82 using a combination of miR–21, miR–210, miR–
155 and miR–196a (J. Wang et al, 2009). Furthermore, when combining age with the
miR-200c, we have managed to increase the area under the curve to 0.854, which
indicates a good test. It is encouraging the odd ratio of miR-200c is 0.511 in this model
which supported the theory that miR–200c was associated with a significantly higher

166
survival rates in PDAC and a strong positive correlation with E Cadherin expression
(Yu et al, 2010). MicroRNA–200c has also been shown to directly inhibit Jagged 1,
which is a ligand of Notch, resulting in stopping the proliferation of human metastatic
prostatic cancer cells(Vallejo, Caparros and Dominguez, 2011). Micro RNA–200c is
interesting since it has not been identified as a biomarker in any of the studies using
plasma, serum or whole blood (Diab et al, 2016). Li et al were able to distinguish
between PDAC and healthy control in serum using miR–200a and miR–200c as
markers achieving a sensitivity of 84.4% and a specificity of 87.5% for miR–200a and a
sensitivity of 71.1% and a specificity of 96.9% for miR -200b (A. Li et al, 2010).
We have also found that miR–375 is the significant variable when trying to distinguish
PDAC from healthy volunteers giving an odds ratio of 0.131. This suggests that miR–
375 is over-expressed in PDAC plasma compared to healthy volunteers. This is
interesting but not surprising. It has reported in the two major studies on miRNA
expression in pancreatic tissue that miR-375 is one of the few miRNA which is
downregulated in PDAC compared to healthy volunteers and chronic pancreatitis tissue
(Bloomston et al, 2007; Szafranska et al, 2007). However, Carlsen et al found increased
expression of miR–375 in plasma of PDAC patients as opposed to control. Carlsen et al
found that miR-375 did not improve detection rates nor predict prognosis in PDAC
patients when compared to CA 19-9 (Carlsen et al, 2013).
We were also able to differentiate between healthy volunteers and chronic pancreatitis
using a regression analysis model which identified miR–155a as the significant variable
with an odds ratio of 0.321 suggesting relatively higher levels of miR-155a in chronic
pancreatitis when compared to healthy volunteers. This is evident from our box plot in

167
figure 5.2 which shows that the highest levels of miRNA–155a is in the chronic
pancreatitis group, followed by PDAC group and with the lowest levels in the healthy
volunteers. This model has a sensitivity of 85%, a specificity of 77.8%, with an area
under the curve (ROC curve analysis) of 0.875, which indicates a good test.
When comparing PDAC to chronic pancreatitis, we initially identified two significant
micro RNAs which contributed significantly to a multiple binary logistic regression
models and explained 56.5% of the variation in the outcome. This model gave a
sensitivity of 80% and a specificity of 83% with an area under the curve (ROC curve
analysis) of 0.881, which implies a good test. MicroRNA–155a gave an odds ratio of
3.176 which suggests that this miRNA is under-expressed in PDAC compared to
chronic pancreatitis. This is somewhat different from the findings in other studies where
miR–155a plasma levels were found to be elevated in pancreatic cancer compared to
benign diseases (Cote et al, 2014; J. Wang et al, 2009). The odds ratio for miR–503 in
this model is 0.208 which suggests that higher levels of miR–503 in PDAC compared to
chronic pancreatitis. Both miR–503 and miR–155 have been known to have pro-
differentiation roles in monocytes and miR–503 also has a role in the development of
the endocrine function of the pancreas (Forrest et al, 2009; Lynn et al, 2007). Whilst
little is known about miR–503’s role in pancreatic cancer, miR–503 has been found to
be involved in several cancers (H. Liu et al, 2015). It has shown to be up-regulated in
parathyroid carcinoma, adrenocorticoid carcinoma and promotes tumour progression
and acts as a prognostic biomarker for oesophageal cancer. It also acts as a tumour
suppressor in gastric cancer, endometrial cancer and non-small cell lung cancer (H. Liu
et al, 2015).

168
Our most impressive results came when we added age to the logistic regression analysis
when comparing PDAC to chronic pancreatitis. This model explained 73.7% variation
in the outcome with a sensitivity of 88.2% and a specificity of 84.2% and an area under
the curve (ROC curve analysis) of an impressive 0.953, which is deemed an excellent
test. The micro RNA which significantly contributed to this model is miR-155a. Since
our study, there has been several pilot studies reported in the literature identifying micro
RNAs as possible biomarkers (Hernandez and Lucas, 2016; Diab et al, 2016). However,
the only study which has managed to achieve results similar to us when differentiating
PDAC and chronic pancreatitis is Liu et al, who combined CA 19-9 with miR–16 and
miR–196a, thereby achieving a sensitivity of 88.4% and a specificity of 96.3%. (J. Liu
et al, 2012).
Our study suggests that miR–200c. miR-375 and especially miR–155a have significant
roles to play as potential biomarkers for PDAC. Several studies have identified several
circulating micro RNA as potential biomarkers, however there are limitation such as
standardisation of extraction, reproducibility of results and small sample size
(Hernandez and Lucas, 2016) . More understanding is required of the biological process
of these miRNAs in PDAC. Further understanding is also required of the various ways
miRNAs travel in blood and the external and internal factors which could affect their
circulating levels before widespread application as biomarkers. However, despite these
limitations miRNA expression has also been successfully analysed in pancreatic juices,
saliva and stools which are very encouraging (Hernandez and Lucas, 2016).

169
DISCUSSION

170
Pancreatic cancer is one of the more lethal tumours presented at oncology clinics. Late
presentation is a key factor in this lethal manifestation. The late presentation is mainly
due to vague symptoms during the early stages and lack of suitable biomarkers. It is one
of the most aggressive tumour and not very sensitive to current chemotherapeutic
treatment agent gemcitabine (Cancer Research UK, 2016). Current biomarker CA 19.9
is neither very specific nor very sensitive and is also elevated in benign diseases (Wu et
al, 2013). This creates a problem when the clinician is faced with a pancreatic mass and
has to differentiate between PDAC or chronic pancreatitis without having to resort to an
invasive open biopsy. The molecular mechanisms that underpin the development of
pancreatic tumours are still far from understood. In this thesis, we have attempted to
explore a couple of mechanisms namely Notch (and more precisely NOTCH 1 and 2)
and miRNAs that could provide key clinical information in regard to the disease and
progress of the disease, in the hope that these would help us develop novel biomarkers.
We have firstly developed a technique of detecting Notch Nβ-fragments in the plasma
of human at concentrations of 121.67 fmol/µL. Notch Nβ-fragments are part of the
Notch juxtamembranous receptor which is released between the two cleavage sites S3
and S4 as part of γ-secretase mediated cleavages following ligand activation. The Notch
pathway has been implicated in several solid and haematological malignancies in both
an oncogenic and a tumour suppressive capacity, as well as in pancreatic
adenocarcinoma (H. Liu et al, 2017; Cook et al, 2012). Previous work in our lab by a
PhD student has showed that that Notch 1, 3 and 4 receptors and its down-stream
targets Hes 1 and Hey 1 were upregulated in pancreatic ductal carcinoma and further
upregulated in non-resectable locally advanced pancreatic cancer and metastatic disease
(Mann, 2012). Furthermore, there has also been several studies implicating Notch 1 in

171
pancreatic carcinogenesis (Hu et al, 2013). This led us to examine the hypothesis that
Notch 1 Nβ-fragments might be detectable in the plasma of PDAC patients, especially
after Okochi et al first identified these Notch Nβ-fragments in murine cell lines (Okochi
et al, 2006). Although we were not able to detect Notch 1 in the plasma of patients with
PDAC and healthy plasmas, we were able to prove that our method of
immunoprecipitation followed by detection of signals on mass spectrometry works. Our
results could also suggest that Notch 1 does not play a significant role in the
progression of PDAC as initially thought. There have been some papers which have
suggested that it is Notch 2, not Notch 1, which is required for the progression of PanIN
and is associated with a worse prognosis (Mazur et al, 2010). In our study, we were
able to detect Notch 3 Nβ-fragments in the plasma of PDAC patients but were also able
to detect it in the plasma of healthy volunteers. This provides a proof of principle that
our method works, but also raises questions about the role of Notch 3 in pancreatic
carcinogenesis. We did not find a statistically significant difference in the signal levels
of Notch 3 Nβ-fragments between the groups, suggesting that Notch 3 activation is
something which is encountered on a daily basis in normal healthy people. Our findings
were supported by reports of Notch 3 having a role in maintaining vascular smooth
muscle cells and response to vascular injury (T. Wang et al, 2008). This probably
explains why Notch 3 is highly upregulated and therefore is found in abundance in
healthy people. Our study was a qualitative study and was designed in a way to check
for the presence of Notch Nβ-fragments and therefore our methods are not the best for
accurate quantification of Notch Nβ-fragments between groups. An alternative would
be to examine the levels of Notch 3 between patient groups using liquid
chromatography mass spectrometry selected reaction monitoring (LC-MS-SRM) assay
for the specific, sensitive and selective determination of Notch fragments. Another

172
alternative would be to concentrate future efforts on Notch 1 as there are not any reports
of Notch 1 being involved in any wide spread system in a developed adult, as opposed
to Notch 3 which is involved in maintaining the vascular endothelial cells and is
therefore present in abundance in both healthy people and those with cancer. This way,
if Notch 1 Nβ- peptide fragment is detected, it is most likely due to the disease. One
way of doing that would be to develop an enzyme-linked immunosorbent assay
(ELISA) for Notch 1 Nβ peptide fragment. Although ELISA is the gold standard for
detecting potential protein biomarkers and has extraordinary sensitivity and specificity
for quantifying the target analyte, it comes with its own specific drawbacks. Its
development is extremely costly and time consuming with a high failure rate. This
therefore leads to reduced validations of potential diagnostic biomarkers (Whiteaker et
al, 2007).
Our next section of work concentrated on the immunohistochemical expression of
Notch 2 receptors in healthy tissue, resectable pancreatic cancer, non-resectable
advanced disease and metastatic disease. We found Notch 2 expression to be
upregulated in resectable PDAC and further upregulated in non-resectable locally
advanced cancer, but down regulated in metastatic PDAC tissue in comparison to non-
resectable locally advanced tissue. This data is interesting as this is the only Notch
receptor which has behaved as such. Previous findings in our group has found that the
expression of Notch receptors in the rest of the family has only gone up with increasing
advancing disease (Mann, 2012). We have also found that Notch 2 has no effects on
long term survival or disease-free survival. Some parts of our data are supported by a
study, where Notch downregulation in mice with radiologically proven cancers has not
resulted in increased survival suggesting that although Notch might play a role in initial

173
carcinogenesis, it has a reduced role in the maintenance of advanced PDAC disease
(Cook et al, 2012). It was long thought that Notch 2 was involved in the process of
Epithelial to Mesenchymal transition (EMT) which makes PDAC cells resistant to
Gemcitabine and therefore a more aggressive tumour. More recently, it has been
suggested that Notch 2 also generates cancer stem cells which is thought to contribute
to chemoresistance and metastasis (Z. Wang et al, 2011). Despite several papers on
Notch 2 expression and its effects in cell lines, human tissue and mice tissue being
available, our study is probably the first to explore the expression of Notch 2 in
differing stages of the disease and correlate it with clinicopathological factors and
compare the effect of Notch 2 in patient survival following curative resection for
PDAC.
There are a few limitations with our work on immunohistochemistry. Firstly, the
number of resectable patients used in this study is small. However, because of the
aggressive nature of the disease it is difficult to get large patient numbers in a single
centre and the number of patients in our study are comparable if not larger than most of
the other studies reported. To get more number, would necessitate a multi-centre study
and more correlations would probably be observed. There are also the known concerns
about antigen degradation in formalin-fixed, paraffin-embedded tissue (Xie et al, 2011;
Vis et al, 2000). This is unavoidable in this type of research, but steps taken to reduce
this included only using specimens collected after 2000. Lastly one of the problems
with investigating Notch 2 is lack of availability of a good quality commercially
available Notch 2 antibody. We have found it a struggle to find an antibody which
worked well with both immunohistochemistry and western blotting and the same
problems have been reported by other researchers (Hu et al, 2013). This probably

174
explains the lack of good quality papers which has investigated the
immunohistochemical expression of Notch 2 in human tissue. Going forward, we
suggest developing a validated antibody against Notch 2 and examining its expression
in cell lines, including metastatic ones and exploring cell viability following specific
knockdowns on Notch 2 in these cells lines to explore the significance of Notch 2 in
advanced and metastatic PDAC.
Our final section of work concentrated on quantifying some miRNAs in the plasma of
PDAC and chronic pancreatitis (CP) and comparing it to healthy volunteers to find a
miRNA or a panel of miRNA which might act as potential biomarkers. There has been
a lot of work on miRNAs recently and a large body of literature has emerged
documenting the significance of miRNAs in tumour progression. miRNAs are thought
to play a role in cancer is that because they play a critical role in the biological
processes of cell proliferation, differentiation, apoptosis and stress resistance (Z. Wang
et al, 2010). Some miRNAs are thought to have an oncogenic role and so are elevated
in cancers whilst others are thought to have a tumour suppressive effect. It has been
found that several miRNAs play critical roles in Notch signalling pathway. Although
the exact nature of their roles is unclear, the effect is more obvious. miR–34 is meant to
regulate Notch 1 and Notch 2 in pancreatic cancer and therefore acts as a tumour
suppressor. It was also found that there is loss of miR-34 in PDAC cancer stem cells,
but high levels of Notch 1 and 2 suggesting that miR-34 is involved in cancer stem cells
self-renewal. Similarly, the miR–200 family has also been shown to regulate the Notch
signalling pathway in pancreatic cancer and in PDAC stem cells. miR-21 is a well-
known oncogene and is also found to upregulated with over-expression of Notch 1.(Ma
et al, 2013) There are some other miRNAs which cross talk with Notch signalling

175
pathway but they have not been shown to play a role in pancreatic cancer. Keeping the
relation between Notch and miRNAs in mind, we tested a panel of miRNAs and
explored their potential as biomarkers. We have managed to identify miR-200c, miR–
155a and miR–375 which could help differentiate between healthy volunteers, PDAC
and chronic pancreatitis. Furthermore, when patient’s age was added to the equation,
we had some very impressive results with ROC curves of above 0.95.
It is also encouraging that we found miR-200c as a potential biomarker, as this is a part
of the miR-200 family which has a tumour suppressive effect on EMT via the Notch
signalling pathway (Zaravinos, 2015). Curcumin induces apoptosis in pancreatic cancer
through inactivation of the Notch signalling pathway, but more recently has also been
shown to upregulate miR–200 and downregulate miR-21 leading to increased
gemcitabine sensitivity (Z. Wang et al, 2011). This points at potential therapeutic
option for these tumour suppressive miRNAs.
The limitation of our miRNA work is mainly due to the sample numbers. This was a
proof of existence study done with some remaining samples to look at the relationship
of some miRNAs and PDAC and chronic pancreatitis. Reverse transcriptase RT-PCR is
expensive. We were therefore limited to just 60 samples and only eleven miRNAs of
choice. However, the results of our study are very encouraging and justifies further
work on larger sample numbers and with some more miRNAs.
In summary, this thesis demonstrates that Notch 2 signalling plays a very complex role
in pancreatic carcinogenesis but does not correlate or behave like the rest of the Notch
family. Future work needs to concentrate on the role of Notch 2 signalling in pancreatic

176
carcinogenesis before using the qualitative method developed in this thesis to try and
detect Notch 2 Nβ-fragments in plasma as a potential biomarker. This thesis has also
identified 3 miRNAs which could play a role as biomarkers in differentiating PDAC,
CP and health volunteers.

177
REFERENCES
Bibliography
Ables, J.L., Breunig, J.J., Eisch, A.J. and Rakic, P. (2011) 'Not( ch) just development:
Notch signalling in the adult brain', Nature Reviews Neuroscience, 12(5), pp. 269.
Acar, A., Simões, B.M., Clarke, R.B. and Brennan, K. (2016) 'A Role for Notch
Signalling in Breast Cancer and Endocrine Resistance', Stem Cells International,
2016.
Aster, J.C. (2005) 'Deregulated NOTCH signaling in acute T-cell lymphoblastic
leukemia/lymphoma: New insights, questions, and opportunities.', International
journal of hematology, 82(4), pp. 295-301.
Avila, J.L. and Kissil, J.L. (2013) 'Notch signaling in pancreatic cancer: oncogene or
tumor suppressor?', Trends in molecular medicine, 19(5), pp. 320-327.
Bailey, P., Chang, D.K., Nones, K., Johns, A.L., Patch, A., Gingras, M., Miller, D.K.,
Christ, A.N., Bruxner, T.J.C., Quinn, M.C., Nourse, C., Murtaugh, L.C.,
Harliwong, I., Idrisoglu, S., Manning, S., Nourbakhsh, E., Wani, S., Fink, L.,
Holmes, O., Chin, V., Anderson, M.J., Kazakoff, S., Leonard, C., Newell, F.,
Waddell, N., Wood, S., Xu, Q., Wilson, P.J., Cloonan, N., Kassahn, K.S., Taylor,
D., Quek, K., Robertson, A., Pantano, L., Mincarelli, L., Sanchez, L.N., Evers, L.,
Wu, J., Pinese, M., Cowley, M.J., Jones, M.D., Colvin, E.K., Nagrial, A.M.,
Humphrey, E.S., Chantrill, L.A., Mawson, A., Humphris, J., Chou, A., Pajic, M.,
Scarlett, C.J., Pinho, A.V., Giry-Laterriere, M., Rooman, I., Samra, J.S., Kench,
J.G., Lovell, J.A., Merrett, N.D., Toon, C.W., Epari, K., Nguyen, N.Q., Barbour,
A., Zeps, N., Moran-Jones, K., Jamieson, N.B., Graham, J.S., Duthie, F., Oien, K.,
Hair, J., Grutzmann, R., Maitra, A., Iacobuzio-Donahue, C.A., Wolfgang, C.L.,
Morgan, R.A., Lawlor, R.T., Corbo, V., Bassi, C., Rusev, B., Capelli, P., Salvia,
R., Tortora, G., Mukhopadhyay, D., Petersen, G.M., Australian Pancreatic Cancer
Genome Initiative, Munzy, D.M., Fisher, W.E., Karim, S.A., Eshleman, J.R.,
Hruban, R.H., Pilarsky, C., Morton, J.P., Sansom, O.J., Scarpa, A., Musgrove,
E.A., Bailey, U.H., Hofmann, O., Sutherland, R.L., Wheeler, D.A., Gill, A.J.,
Gibbs, R.A., Pearson, J.V., Waddell, N., Biankin, A.V. and Grimmond, S.M.
(2016) 'Genomic analyses identify molecular subtypes of pancreatic cancer.',
Nature, 531(7592), pp. 47-52.
Baldwin, M.A. (2005) 'Mass spectrometers for the analysis of biomolecules.', Methods
in enzymology, 402(pp 3-48), pp. Arte Number: 1. ate of Pubaton: 2005.
Balint, K., Xiao, M., Pinnix, C.C., Soma, A., Veres, I., Juhasz, I., Brown, E.J.,
Capobianco, A.J., Herlyn, M. and Liu, Z.J. (2005) 'Activation of Notch1 signaling
is required for beta-catenin-mediated human primary melanoma progression.',
Journal of Clinical Investigation, 115(11), pp. 3166-3176.

178
Bardeesy, N. and DePinho, R.A. (2002) 'Pancreatic cancer biology and genetics',
Nature Reviews.Cancer, 2(12), pp. 897-909.
Baron, M. (2003) 'An overview of the Notch signalling pathway.', Seminars in Cell and
Developmental Biology, 14(2), pp. 113-119.
Bauer, A.S., Keller, A., Costello, E., Greenhalf, W., Bier, M., Borries, A., Beier, M.,
Neoptolemos, J., Büchler, M., Werner, J., Giese, N. and Hoheisel, J. (2012)
'Diagnosis of Pancreatic Ductal Adenocarcinoma and Chronic Pancreatitis by
Measurement of microRNA Abundance in Blood and Tissue (microRNA-Based
Diagnosis of Pancreatic Cancer)', PLoS ONE, 7(4), pp. e34151.
Berrueta, L.A., Gallo, B. and Vicente, F. (1995) 'A review of solid phase extraction:
Basic principles and new developments.', Chromatographia, 40(7-8) (pp 474-483),
pp. ate of Pubaton: 1995.
Bianchi, S., Dotti, M.T. and Federico, A. (2006) 'Physiology and pathology of notch
signalling system.', Journal of cellular physiology, 207(2), pp. 300-308.
Blahna, M.T. and Hata, A. (2012) 'Regulation of miRNA biogenesis as an integrated
component of growth factor signaling', Current opinion in cell biology, .
Bloomston, M., Frankel, W.L., Petrocca, F., Volinia, S., Alder, H., Hagan, J.P., Liu, C.-
., Bhatt, D., Taccioli, C. and Croce, C.M. (2007) 'MicroRNA expression patterns to
differentiate pancreatic adenocarcinoma from normal pancreas and chronic
pancreatitis.', Journal of the American Medical Association, 297(17), pp. 1901-
1908.
Bolos, V., Grego-Bessa, J. and De La Pompa, J.L. (2007) 'Notch signaling in
development and cancer.', Endocrine reviews, 28(3), pp. 339-363.
Bommer, G.T., Gerin, I., Feng, Y., Kaczorowski, A.J., Kuick, R., Love, R.E., Zhai, Y.,
Giordano, T.J., Qin, Z.S., Moore, B.B., MacDougald, O.A., Cho, K.R. and Fearon,
E.R. (2007) 'p53-mediated activation of miRNA34 candidate tumor-suppressor
genes.', Current Biology, 17(15), pp. 1298-1307.
Borggrefe, T. and Oswald, F. (2009) 'The Notch signaling pathway: Transcriptional
regulation at Notch target genes.', Cellular and Molecular Life Sciences, 66(10),
pp. 1631-1646.
Breaux, G.A., Green-Church, K.B., France, A. and Limbach, P.A. (2000) 'Surfactant-
aided, matrix-assisted laser desorption/ionization mass spectrometry of
hydrophobic and hydrophilic peptides.', Analytical Chemistry, 72(6), pp. 1169-
1174.
Brennan, K., Tateson, R., Lewis, K. and Arias, A.M. (1997) 'A functional analysis of
Notch mutations in Drosophila.', Genetics, 147(1), pp. 177-188.

179
Brennan, K., Tateson, R., Lieber, T., Couso, J.P., Zecchini, V. and Arias, A.M. (1999)
'The Abruptex mutations of Notch disrupt the establishment of proneural clusters
in Drosophila.', Developmental biology, 216(1), pp. 230-242.
Büchler, P., Gazdhar, A., Schubert, M., Giese, N., Reber, H.A., Hines, O.J., Giese, T.,
Ceyhan, G., Müller, M., Büchler, M.,W. and Friess, H. (2005) 'The Notch signaling
pathway is related to neurovascular progression of pancreatic cancer', Annals of
Surgery, 242(6), pp. 791.
Calin, G.,Adrian., Dumitru, C.,Dan, Shimizu, M., Bichi, R., Zupo, S., Noch, E., Aldler,
H., Rattan, S., Keating, M., Rai, K., Rassenti, L., Kipps, T., Negrini, M., Bullrich,
F. and Croce, C.M. (2002) 'Frequent deletions and down-regulation of micro- RNA
genes miR15 and miR16 at 13q14 in chronic lymphocytic leukemia', Proceedings
of the National Academy of Sciences of the United States of America, 99(24), pp.
15524.
Cancer Research UK (2016) Pancreatic cancer - UK incidence statistics. Available at:
http://www.cancerresearchuk.org/health-professional/cancer-statistics/statistics-by-
cancer-type/pancreatic-cancer/incidence#heading-Three.
Carlsen, A.L., Joergensen, M.T., Knudsen, S., de Muckadell, O.B. and Heegaard, N.H.
(2013) 'Cell-free plasma microRNA in pancreatic ductal adenocarcinoma and
disease controls', Pancreas, 42(7), pp. 1107-1113.
Chang, T.C., Wentzel, E.A., Kent, O.A., Ramachandran, K., Mullendore, M., Lee,
K.H., Feldmann, G., Yamakuchi, M., Ferlito, M., Lowenstein, C.J., Arking, D.E.,
Beer, M.A., Maitra, A. and Mendell, J.T. (2007) 'Transactivation of miR-34a by
p53 broadly influences gene expression and promotes apoptosis.', Molecular cell,
26(5), pp. 745-752.
Chiba, S. (2006) 'Notch signaling in stem cell systems.', Stem cells, 24(11), pp. 2437-
2447.
Cook, N., Frese, K.K., Bapiro, T.E., Jacobetz, M.A., Gopinathan, A., Miller, J.L., Rao,
S.S., Demuth, T., Howat, W.J., Jodrell, D.I. and Tuveson, D.A. (2012) 'Gamma
secretase inhibition promotes hypoxic necrosis in mouse pancreatic ductal
adenocarcinoma', The Journal of experimental medicine, 209(3), pp. 437-444.
Cote, G.A., Gore, A.J., McElyea, S.D., Heathers, L.E., Xu, H., Sherman, S. and Korc,
M. (2014) 'A pilot study to develop a diagnostic test for pancreatic ductal
adenocarcinoma based on differential expression of select miRNA in plasma and
bile', The American Journal of Gastroenterology, 109(12), pp. 1942-1952.
Cuevas, I.C., Slocum, A.L., Jun, P., Costello, J.F., Bollen, A.W., Riggins, G.J.,
McDermott, M.W. and Lal, A. (2005) 'Meningioma transcript profiles reveal
deregulated Notch signaling pathway.', Cancer research, 65(12), pp. 5070-5075.
De La, O.J.P., Emerson, L.L., Goodman, J.L., Froebe, S.C., Illum, B.E., Curtis, A.B.
and Murtaugh, L.C. (2008) 'Notch and Kras reprogram pancreatic acinar cells to
180
ductal intraepithelial neoplasia.', Proceedings of the National Academy of Sciences
of the United States of America, 105(48), pp. 18907-18912.
Deregowski, V., Gazzerro, E., Priest, L., Rydziel, S. and Canalis, E. (2006) 'Notch 1
overexpression inhibits osteoblastogenesis by suppressing Wnt/beta-catenin but not
bone morphogenetic protein signaling.', Journal of Biological Chemistry, 281(10),
pp. 6203-6210.
Diab, M., Muqbil, I., Mohammad, R.M., Azmi, A.S. and Philip, P.A. (2016) 'The Role
of microRNAs in the Diagnosis and Treatment of Pancreatic Adenocarcinoma',
Journal of clinical medicine, 5(6).
Dorsky, R.I., Chang, W.S., Rapaport, D.H. and Harris, W.A. (1997) 'Regulation of
neuronal diversity in the Xenopus retina by delta signalling.', Nature, 385(6611),
pp. 67-70.
Doucas, H., Mann, C.D., Sutton, C.D., Garcea, G., Neal, C.P., Berry, D.P. and Manson,
M.M. (2008) 'Expression of nuclear Notch3 in pancreatic adenocarcinomas is
associated with adverse clinical features, and correlates with the expression of
STAT3 and phosphorylated Akt.', Journal of surgical oncology, 97(1), pp. 63-68.
D'Souza, B., Miyamoto, A. and Weinmaster, G. (2008) 'The many facets of Notch
ligands.', Oncogene, 27(38), pp. 5148-5167.
Du, T. and Zamore, P.D. (2005) 'microPrimer: The biogenesis and function of
microRNA.', Development, 132(21), pp. 4645-4652.
Duffy, M.J., Sturgeon, C., Lamerz, R., Haglund, C., Holubec, V.L., Klapdor, R.,
Nicolini, A., Topolcan, O. and Heinemann, V. (2009) 'Tumor markers in pancreatic
cancer: a European Group on Tumor Markers (EGTM) status report', Annals of
Oncology, 21(3), pp. 441-447.
Dykxhoorn, D.M. (2010) 'MicroRNAs and metastasis: little RNAs go a long way',
Cancer research, 70(16), pp. 6401.
El-Aneed, A., Cohen, A. and Banoub, J. (2009) 'Mass Spectometry, Review of the
Basics: Electrospray, MALDI, and Commonly Used Mass Analyzers', Applied
Spectrosocpy Reviews, 44(3), pp. 210-230.
Ellisen, L.W., Bird, J., West, D.C., Soreng, A.L., Reynolds, T.C., Smith, S.D. and
Sklar, J. (1991) 'TAN-1, the human homolog of the Drosophila Notch gene, is
broken by chromosomal translocations in T lymphoblastic neoplasms.', Cell, 66(4),
pp. 649-661.
Fan, A.C., Goldrick, M.M., Ho, J., Liang, Y., Bachireddy, P. and Felsher, D.W. (2008)
'A quantitative PCR method to detect blood microRNAs associated with
tumorigenesis in transgenic mice.', Molecular Cancer, 7, pp. 74.
Fearon, E.R. and Vogelstein, B. (1990) 'A genetic model for colorectal tumorigenesis',
Cell, 61(5), pp. 759-767.

181
Fiuza, U.-. and Arias, A.M. (2007) 'Cell and molecular biology of Notch.', Journal of
Endocrinology, 194(3), pp. 459-474.
Fleisher, A.S., Raman, R., Siemers, E.R., Becerra, L., Clark, C.M., Dean, R.A., Farlow,
M.R., Galvin, J.E., Peskind, E.R., Quinn, J.F., Sherzai, A., Sowell, B.B., Aisen,
P.S. and Thal, L.J. (2008) 'Phase 2 safety trial targeting amyloid beta production
with a gamma-secretase inhibitor in Alzheimer disease.', Archives of Neurology,
65(8), pp. 1031-1038.
Forrest, A.,R.R., Kanamori-Katayama, M., Tomaru, Y., Lassmann, T., Ninomiya, N.,
Takahashi, Y., M J L De, H., Kubosaki, A., Kaiho, A., Suzuki, M., Yasuda, J.,
Kawai, J., Hayashizaki, Y., D, A.H. and Suzuki, H. (2009) 'Induction of
microRNAs, mir- 155, mir- 222, mir- 424 and mir- 503, promotes monocytic
differentiation through combinatorial regulation', Leukemia, 24(2), pp. 460.
Fortini, M.E. (2009) 'Notch Signaling: The Core Pathway and Its Posttranslational
Regulation.', Developmental Cell, 16(5), pp. 633-647.
Fridman, J.S. and Lowe, S.W. (2003) 'Control of apoptosis by p53', Oncogene, 22(56),
pp. 9030-9040.
Fryer, C.J., White, J.B. and Jones, K.A. (2004) 'Mastermind recruits CycC:CDK8 to
phosphorylate the Notch ICD and coordinate activation with turnover.', Molecular
cell, 16(4), pp. 509-520.
Fujikura, J., Hosoda, K., Iwakura, H., Tomita, T., Noguchi, M., Masuzaki, H., Tanigaki,
K., Yabe, D., Honjo, T. and Nakao, K. (2006) 'Notch/Rbp-j signaling prevents
premature endocrine and ductal cell differentiation in the pancreas.', Cell
Metabolism, 3(1), pp. 59-65.
Fujikura, J., Hosoda, K., Kawaguchi, Y., Noguchi, M., Iwakura, H., Odori, S., Mori, E.,
Tomita, T., Hirata, M., Ebihara, K., Masuzaki, H., Fukuda, A., Furuyama, K.,
Tanigaki, K., Yabe, D. and Nakao, K. (2007) 'Rbp-j regulates expansion of
pancreatic epithelial cells and their differentiation into exocrine cells during mouse
development.', Developmental Dynamics, 236(10), pp. 2779-2791.
Geng, R., Li, Z., Li, S. and Gao, J. (2011) 'Proteomics in Pancreatic Cancer Research',
International Journal of Proteomics, 2011.
Ghaneh, P., Smith, R., Tudor-Smith, C., Raraty, M. and Neoptolemos, J.P. (2008)
'Neoadjuvant and adjuvant strategies for pancreatic cancer.', European Journal of
Surgical Oncology, 34(3), pp. 297-305.
Gibert, J.-. and Simpson, P. (2003) 'Evolution of cis-regulation of the proneural genes.',
International Journal of Developmental Biology, 47(7-8), pp. 643-651.
Giudicelli, F. and Lewis, J. (2004) 'The vertebrate segmentation clock.', Current
Opinion in Genetics and Development, 14(4), pp. 407-414.

182
Gomez, G., Englander, E.W., Wang, G. and Greeley, G.H.,Jr (2004) 'Increased
expression of hypoxia-inducible factor-1alpha, p48, and the Notch signaling
cascade during acute pancreatitis in mice.', Pancreas, 28(1), pp. 58-64.
Goonetilleke, K.S. and Siriwardena, A.K. (2007) 'Systematic review of carbohydrate
antigen (CA 19-9) as a biochemical marker in the diagnosis of pancreatic cancer',
European Journal of Surgical Oncology, 33(3), pp. 266-270.
Gray, G.E., Mann, R.S., Mitsiadis, E., Henrique, D., Carcangiu, M.-., Banks, A.,
Leiman, J., Ward, D., Ish-Horowitz, D. and Artavanis-Tsakonas, S. (1999) 'Human
ligands of the Notch receptor.', American Journal of Pathology, 154(3), pp. 785-
794.
Güngör, C., Zander, H., Effenberger, K.E., Vashist, Y.K., Kalinina, T., Izbicki, J.R.,
Yekebas, E. and Bockhorn, M. (2011) 'Notch signaling activated by replication
stress- induced expression of midkine drives epithelial-mesenchymal transition and
chemoresistance in pancreatic cancer', Cancer research, 71(14), pp. 5009.
Gungor, C., Hofmann, B.T., Wolters-Eisfeld, G. and Bockhorn, M. (2014) 'Pancreatic
cancer', British journal of pharmacology, 171(4), pp. 849-858.
Haass, C. and De Strooper, B. (1999) 'The presenilins in Alzheimer's disease -
Proteolysis holds the key.', Science, 286(5441), pp. 916-919.
Habbe, N., Koorstra, J.-.M., Mendell, J.T., Offerhaus, G.J., Ji, K.R., Feldmann, G.,
Mullendore, M.E., Goggins, M.G., Hong, S.-. and Maitra, A. (2009) 'MicroRNA
miR-155 is a biomarker of early pancreatic neoplasia.', Cancer Biology and
Therapy, 8(4), pp. 340-346.
Hanahan, D. and Weinberg, R.A. (2000) 'The hallmarks of cancer.', Cell, 100(1), pp.
57-70.
Hanahan, D. and Weinberg, R. (2011) 'Hallmarks of Cancer: The Next Generation',
Cell, 144(5), pp. 646-674.
Hanlon, L., Avila, J.L., Demarest, R.M., Troutman, S., Allen, M., Ratti, F., Rustgi,
A.K., Stanger, B.Z., Radtke, F., Adsay, V., Long, F., Capobianco, A.J. and Kissil,
J.L. (2010) 'Notch1 functions as a tumor suppressor in a model of K-ras-induced
pancreatic ductal adenocarcinoma.', Cancer research, 70(11), pp. 4280-4286.
Hashimoto, T., Zhang, X., Chen, B.Y. and Yang, X. (2006) 'VEGF activates divergent
intracellular signaling components to regulate retinal progenitor cell proliferation
and neuronal differentiation', Development (Cambridge, England), 133(11), pp.
2201.
Hayward, P., Brennan, K., Sanders, P., Balayo, T., DasGupta, R., Perrimon, N. and
Martinez Arias, A. (2005) 'Notch modulates Wnt signalling by associating with
Armadillo /beta-catenin and regulating its transcriptional activity.', Development,
132(8), pp. 1819-1830.

183
He, L., He, X., Lim, L.P., de Stanchina, E., Xuan, Z., Liang, Y., Xue, W., Zender, L.,
Magnus, J., Ridzon, D., Jackson, A.L., Linsley, P.S., Chen, C., Lowe, S.W.,
Cleary, M.A. and Hannon, G.J. (2007) 'A microRNA component of the p53 tumour
suppressor network.', Nature, 447(7148), pp. 1130-1134.
Hernandez, Y.G. and Lucas, A.L. (2016) 'MicroRNA in pancreatic ductal
adenocarcinoma and its precursor lesions', World journal of gastrointestinal
oncology, 8(1), pp. 18.
Hezel, A.F., Kimmelman, A.C., Stanger, B.Z., Bardeesy, N. and Depinho, R.A. (2006)
'Genetics and biology of pancreatic ductal adenocarcinoma', Genes & development,
20(10), pp. 1218-1249.
Hu, H., Zhou, L., Awadallah, A. and Xin, W. (2013) 'Significance of Notch1-signaling
pathway in human pancreatic development and carcinogenesis.', Applied
Immunohistochemistry & Molecular Morphology, 21(3), pp. 242-247.
Hunt, E.A., Broyles, D., Head, T. and Deo, S.K. (2015) 'MicroRNA Detection: Current
Technology and Research Strategies', Annual Review of Analytical Chemistry;
Annu.Rev.Anal.Chem., 8, pp. 217-237.
Hutterer, A. and Knoblich, J.A. (2005) 'Numb and alpha-Adaptin regulate Sanpodo
endocytosis to specify cell fate in Drosophila external sensory organs.', EMBO
reports, 6(9), pp. 836-842.
Hwang, H. and Mendell, J.,T.. (2006) 'MicroRNAs in cell proliferation, cell death, and
tumorigenesis', British journal of cancer, 94(6), pp. 776.
Iorio, M.V., Ferracin, M., Liu, C., Veronese, A., Spizzo, R., Sabbioni, S., Magri, E.,
Pedriali, M., Fabbri, M., Campiglio, M., Ménard, S., Palazzo, J.P., Rosenberg, A.,
Musiani, P., Volinia, S., Nenci, I., Calin, G.A., Querzoli, P., Negrini, M. and
Croce, C.M. (2005) 'MicroRNA gene expression deregulation in human breast
cancer', Cancer research, 65(16), pp. 7065.
Jensen, J., Pedersen, E.E., Galante, P., Hald, J., Heller, R.S., Ishibashi, M., Kageyama,
R., Guillemot, F., Serup, P. and Madsen, O.D. (2000) 'Control of endodermal
endocrine development by Hes-1.', Nature genetics, 24(1), pp. 36-44.
Ji, Q., Hao, X., Zhang, M., Tang, W., Meng, Y., Li, L., Xiang, D., DeSano, J.T.,
Bommer, G.T., Fan, D., Fearon, E.R., Lawrence, T.S. and Xu, L. (2009)
'MicroRNA miR-34 inhibits human pancreatic cancer tumor-initiating cells.', PLoS
ONE, 4(8), pp. Arte Number: e6816. ate of Pubaton: 28 Aug 2009.
Jing, X., Wamsteker, E.-., Li, H. and Pu, R.T. (2009) 'Combining fine needle aspiration
with brushing cytology has improved yields in diagnosing pancreatic ductal
adenocarcinoma.', Diagnostic cytopathology, 37(8), pp. 574-578.
Johnson, S.M., Grosshans, H., Shingara, J., Byrom, M., Jarvis, R., Cheng, A.,
Labourier, E., Reinert, K.L., Myller, R. and Slack, F.J. (2005) 'RAS is regulated by
the let- 7 MicroRNA family', Cell, 120(5), pp. 635.

184
Jun, H.T., Stevens, J. and Kaplan-Lefko, P. (2008) 'Top NOTCH targets: Notch
signaling in cancer.', Drug Development Research, 69(6), pp. 319-328.
Jung, S.G., Kwon, Y.D., Song, J.A., Back, M.J., Lee, S.Y., Lee, C., Hwang, Y.Y. and
An, H.J. (2010) 'Prognostic significance of Notch 3 gene expression in ovarian
serous carcinoma.', Cancer Science, 101(9), pp. 1977-1983.
Karas, M., Gluckmann, M. and Schafer, J. (2000) 'Ionization in matrix-assisted laser
desorption/ionization: Singly charged molecular ions are the lucky survivors.',
Journal of Mass Spectrometry, 35(1), pp. 1-12.
Karas, M. and Hillenkamp, F. (1988) 'Laser desorption ionization of proteins with
molecular masses exceeding 10,000 daltons', Analytical Chemistry, 60(20), pp.
2299.
Kebarle, P. (2000) 'A brief overview of the present status of the mechanisms involved
in electrospray mass spectrometry.', Journal of Mass Spectrometry, 35(7), pp. 804-
817.
Kiernan, A.E., Cordes, R., Kopan, R., Gossler, A. and Gridley, T. (2005) 'The Notch
ligands DLL1 and JAG2 act synergistically to regulate hair cell development in the
mammalian inner ear.', Development, 132(19), pp. 4353-4362.
King, R.J.B. (2000) 'Natural history: The life of a cancer', in King, R.J.B. (ed.) Cancer
Biology. 2nd edn. Singapore: Pearson Education Limited, pp. 8-9-30.
Kita, A., Imayoshi, I., Hojo, M., Kitagawa, M., Kokubu, H., Ohsawa, R., Ohtsuka, T.,
Kageyama, R. and Hashimoto, N. (2007) 'Hes1 and Hes5 control the progenitor
pool, intermediate lobe specification, and posterior lobe formation in the pituitary
development.', Molecular Endocrinology, 21(6), pp. 1458-1466.
Klein, T., Brennan, K. and Martinez Arias, A. (1997) 'An intrinsic dominant negative
activity of serrate that is modulated during wing development in Drosophila.',
Developmental biology, 189(1), pp. 123-134.
Kloppel, C. and Adsay, N.V. (2009) 'Chronic pancreatitis and the differential diagnosis
versus pancreatic cancer.', Archives of Pathology and Laboratory Medicine,
133(3), pp. 382-387.
Kopan, R. and Ilagan, M.X.G. (2009) 'The Canonical Notch Signaling Pathway:
Unfolding the Activation Mechanism.', Cell, 137(2), pp. 216-233.
Kovall, R.A. (2007) 'Structures of CSL, Notch and Mastermind proteins: piecing
together an active transcription complex.', Current opinion in structural biology,
17(1), pp. 117-127.
Krebs, L.T., Deftos, M.L., Bevan, M.J. and Gridley, T. (2001) 'The Nrarp gene encodes
an ankyrin-repeat protein that is transcriptionally regulated by the Notch signaling
pathway.', Developmental biology, 238(1), pp. 110-119.

185
Kroh, E.M., Parkin, R.K., Mitchell, P.S. and Tewari, M. (2010) 'Analysis of circulating
microRNA biomarkers in plasma and serum using quantitative reverse
transcription-PCR (qRT-PCR)', Methods, 50(4), pp. 298-301.
Larsen, M.R. and Roepstorff, P. (2000) 'Mass spectrometric identification of proteins
and characterization of their post-translational modifications in proteome analysis.',
Fresenius' journal of analytical chemistry, 366(6-7) (pp 677-690), pp. ate of
Pubaton: 2000 Mar-Ar.
Lawrence, N., Klein, T., Brennan, K. and Martinez Arias, A. (2000) 'Structural
requirements for Notch signalling with Delta and Serrate during the development
and patterning of the wing disc of Drosophila.', Development, 127(14), pp. 3185-
3195.
Lawrie, C.H., Soneji, S., Marafioti, T., Cooper, C.D.O., Palazzo, S., Paterson, J.C.,
Cattan, H., Enver, T., Mager, R., Boultwood, J., Wainscoat, J.S. and Hatton, C.S.R.
(2007) 'Microrna expression distinguishes between germinal center B cell‐like and
activated B cell‐like subtypes of diffuse large B cell lymphoma', International
Journal of Cancer, 121(5), pp. 1156-1161.
Le Borgne, R. and Schweisguth, F. (2003) 'Unequal segregation of neuralized biases
Notch activation during asymmetric cell division.', Developmental Cell, 5(1), pp.
139-148.
Lee, C.S. and Kaestner, K.H. (2004) 'Development of gut endocrine cells.', Best
Practice and Research in Clinical Endocrinology and Metabolism, 18(4), pp. 453-
462.
Lee, E.J., Gusev, Y., Jiang, J., Nuovo, G.J., Lerner, M.R., Frankel, W.L., Morgan, D.L.,
Postier, R.G., Brackett, D.J. and Schmittgen, T.D. (2007) 'Expression profiling
identifies microRNA signature in pancreatic cancer', International Journal of
Cancer, 120(5), pp. 1046-1054.
Lewis, H.D., Leveridge, M., Strack, P.R., Haldon, C.D., O'neil, J., Kim, H., Madin, A.,
Hannam, J.C., Look, A.T., Kohl, N., Draetta, G., Harrison, T., Kerby, J.A.,
Shearman, M.S. and Beher, D. (2007) 'Apoptosis in T cell acute lymphoblastic
leukemia cells after cell cycle arrest induced by pharmacological inhibition of
notch signaling.', Chemistry & biology, 14(2), pp. 209-219.
Li, A., Omura, N., Hong, S., Vincent, A., Walter, K., Griffith, M., Borges, M. and
Goggins, M. (2010) 'Pancreatic cancers epigenetically silence SIP1 and
hypomethylate and overexpress miR-200a/200b in association with elevated
circulating miR-200a and miR-200b levels', Cancer research, 70(13), pp. 5226.
Li, Y., Kong, D., Wang, Z. and Sarkar, F. (2010) 'Regulation of microRNAs by Natural
Agents: An Emerging Field in Chemoprevention and Chemotherapy Research',
Pharmaceutical research; An Official Journal of the American Association of
Pharmaceutical Scientists, 27(6), pp. 1027-1041.

186
Liu, H., Song, Z., Liao, D., Zhang, T., Liu, F., Zheng, W., Luo, K. and Yang, L. (2015)
'miR-503 inhibits cell proliferation and invasion in glioma by targeting L1CAM',
International Journal of Clinical and Experimental Medicine, 8(10), pp. 18441-
18447.
Liu, H., Zhou, P., Lan, H., Chen, J. and Zhang, Y. (2017) 'Comparative analysis of
Notch1 and Notch2 binding sites in the genome of BxPC3 pancreatic cancer cells',
Journal of Cancer, 8(1), pp. 65-73.
Liu, J., Gao, J., Du, Y., Li, Z., Ren, Y., Gu, J., Wang, X., Gong, Y., Wang, W. and
Kong, X. (2012) 'Combination of plasma microRNAs with serum CA19‐ 9 for
early detection of pancreatic cancer', International Journal of Cancer, 131(3), pp.
683-691.
Livak, K.J. and Schmittgen, T.D. (2001) 'Analysis of Relative Gene Expression Data
Using Real- Time Quantitative PCR and the 2−ΔΔCT Method', Methods, 25(4), pp.
402-408.
Logeat, F., Bessia, C., Brou, C., LeBail, O., Jarriault, S., Seidah, N.G. and Israel, A.
(1998) 'The Notch1 receptor is cleaved constitutively by a furin-like convertase.',
Proceedings of the National Academy of Sciences of the United States of America,
95(14), pp. 8108-8112.
Lowell, S. and Watt, F.M. (2001) 'Delta regulates keratinocyte spreading and motility
independently of differentiation.', Mechanisms of development, 107(1-2), pp. 133-
140.
Lynn, F.C., Skewes-Cox, P., Kosaka, Y., Mcmanus, M.T., Harfe, B.D. and German,
M.S. (2007) 'MicroRNA expression is required for pancreatic islet cell genesis in
the mouse', Diabetes, 56(12), pp. 2938.
Ma, J., Xia, J., Miele, L., Sarkar, F.H. and Wang, Z. (2013) 'Notch Signaling Pathway
in Pancreatic Cancer Progression', Pancreatic disorders & therapy, 3(114).
Maillard, I., He, Y. and Pear, W.S. (2003) 'From the yolk sac to the spleen: New roles
for Notch in regulating hematopoiesis.', Immunity, 18(5), pp. 587-589.
Maillard, I. and Pear, W.S. (2003) 'Notch and cancer: Best to avoid the ups and downs.',
Cancer Cell, 3(3), pp. 203-205.
Mann, C.D. (2012) The Notch Pathway as a Biomarker in Pancreatic Ductal
Adenocarcinoma and its Potential Therapeutic Modulation. University of
Leicester.
Mardin, W.A. and Mees, S.T. (2009) 'MicroRNAs: Novel diagnostic and therapeutic
tools for pancreatic ductal adenocarcinoma?.', Annals of Surgical Oncology,
16(11), pp. 3183-3189.
Marrelli, D., Caruso, S., Pedrazzani, C., Neri, A., Fernandes, E., Marini, M., Pinto, E.
and Roviello, F. (2009) 'CA19- 9 serum levels in obstructive jaundice: clinical

187
value in benign and malignant conditions', The American Journal of Surgery,
198(3), pp. 333-339.
Mazur, P., Einwachter, H., Lee, M., Sipos, B., Nakhai, H., Rad, R., Zimber-Strobl, U.,
Strobl, L., Radtke, F., Klppel, G., Schmid, R.M. and Siveke, J. (2010) 'Notch2 is
required for panin progression and development of pancreatic ductal
adenocarcinoma.', Pancreatology, Conference: 42nd European Pancreatic Club,
EPC Meeting Stockholm Sweden. Conference Start: 20100616 Conference End:
20100619. Conference Publication(var.pagings), pp. ate of Pubaton: June 2010.
McCleary-Wheeler, A.L., McWilliams, R. and Fernandez-Zapico, M.E. (2012)
'Aberrant signaling pathways in pancreatic cancer: A two compartment view',
Molecular carcinogenesis, 51(1), pp. 25-39.
Mercher, T., Cornejo, M.G., Sears, C., Kindler, T., Moore, S.A., Maillard, I., Pear,
W.S., Aster, J.C. and Gilliland, D.G. (2008) 'Notch Signaling Specifies
Megakaryocyte Development from Hematopoietic Stem Cells.', Cell Stem Cell,
3(3), pp. 314-326.
Milner, L.A. and Bigas, A. (1999) 'Notch as a mediator of cell fate determination in
hematopoiesis: Evidence and speculation.', Blood, 93(8), pp. 2431-2448.
Milner, L.A., Kopan, R., Martin, D.I.K. and Bernstein, I.D. (1994) 'A human
homologue of the Drosophila developmental gene, Notch, is expressed in CD34+
hematopoietic precursors.', Blood, 83(8), pp. 2057-2062.
Mitchell, P.S., Parkin, R.K., Kroh, E.M., Fritz, B.R., Wyman, S.K., Pogosova-
Agadjanyan, E.L., Peterson, A., Noteboom, J., O'Briant, K.C., Allen, A., Lin,
D.W., Urban, N., Drescher, C.W., Knudsen, B.S., Stirewalt, D.L., Gentleman, R.,
Vessella, R.L., Nelson, P.S., Martin, D.B. and Tewari, M. (2008) 'Circulating
microRNAs as stable blood-based markers for cancer detection.', Proceedings of
the National Academy of Sciences of the United States of America, 105(30), pp.
10513-10518.
Miyamoto, Y., Maitra, A., Ghosh, B., Zechner, U., Argani, P., Iacobuzio-Donahue,
C.A., Sriuranpong, V., Iso, T., Meszoely, I.M., Wolfe, M.S., Hruban, R.H., Ball,
D.W., Schmid, R.M. and Leach, S.D. (2003) 'Notch mediates TGF alpha-induced
changes in epithelial differentiation during pancreatic tumorigenesis.', Cancer Cell,
3(6), pp. 565-576.
Moldovan, L., Batte, K.E., Trgovcich, J., Wisler, J., Marsh, C.B. and Piper, M. (2014)
'Methodological challenges in utilizing miRNAs as circulating biomarkers',
Journal of Cellular and Molecular Medicine, 18(3), pp. 371-390.
Mullendore, M.E., Koorstra, J., Li, Y., Offerhaus, G.J., Fan, X., Henderson, C.M.,
Matsui, W., Eberhart, C.G., Maitra, A. and Feldmann, G. (2009) 'Ligand-
dependent Notch signaling is involved in tumor initiation and tumor maintenance
in pancreatic cancer', Clinical cancer research : an official journal of the American
Association for Cancer Research, 15(7), pp. 2291.

188
Muller, J.-., Chevrier, L., Cochaud, S., Meunier, A.-. and Chadeneau, C. (2007)
'Hedgehog, Notch and Wnt developmental pathways as targets for anti-cancer
drugs.', Drug Discovery Today: Disease Mechanisms, 4(4), pp. 285-291.
Mysliwiec, P. and Boucher, M.J. (2009) 'Targeting Notch signaling in pancreatic cancer
patients - Rationale for new therapy.', Advances in Medical Sciences, 54(2), pp.
136-142.
Nakhai, H., Siveke, J.T., Klein, B., Mendoza-Torres, L., Mazur, P.K., Algul, H.,
Radtke, F., Strobl, L., Zimber-Strobl, U. and Schmid, R.M. (2008) 'Conditional
ablation of Notch signaling in pancreatic development.', Development, 135(16), pp.
2757-2765.
National Cancer Institute (2016) Pancreatic Cancer Treatment (PDQ) - Health
Professional Version.
Stage I and Stage II Pancreatic Can cer Treatment. Available at:
https://www.cancer.gov/types/pancreatic/hp/pancreatic-treatment-
pdq#section/_120.
National Cancer Institute (2015) Pancreatic Neuroendocrine Tumors (Islet Cell
Tumors) Treatment (PDQ®)–Health Professional Version. Available at:
https://www.cancer.gov/types/pancreatic/hp/pnet-treatment-pdq.
Nickoloff, B.J., Osborne, B.A. and Miele, L. (2003) 'Notch signaling as a therapeutic
target in cancer: A new approach to the development of cell fate modifying
agents.', Oncogene, 22(43), pp. 6598-6608.
O'Connor, C. and Adams, J. (2010) 'Unit :4. How do cells sense their information?', in
Anonymous Essentials of Cell Biology. Cambridge: MA: NPG Education.
Okochi, M., Fukumori, A., Jiang, J., Itoh, N., Kimura, R., Steiner, H., Haass, C.,
Tagami, S. and Takeda, M. (2006) 'Secretion of the Notch-1 Abeta-like peptide
during Notch signaling.', Journal of Biological Chemistry, 281(12), pp. 7890-7898.
Okochi, M., Steiner, H., Fukumori, A., Tanii, H., Tomita, T., Tanaka, T., Iwatsubo, T.,
Kudo, T., Takeda, M. and Haass, C. (2002) 'Presenilins mediate a dual
intramembranous gamma-secretase cleavage of Notch-1.', EMBO Journal, 21(20),
pp. 5408-5416.
O'Neil, J., Grim, J., Strack, P., Rao, S., Tibbitts, D., Winter, C., Hardwick, J., Welcker,
M., Meijerink, J.P., Pieters, R., Draetta, G., Sears, R., Clurman, B.E. and Look,
A.T. (2007) 'FBW7 mutations in leukemic cells mediate NOTCH pathway
activation and resistance to gamma-secretase inhibitors.', Journal of Experimental
Medicine, 204(8), pp. 1813-1824.
Oswald, F., Kostezka, U., Astrahantseff, K., Bourteele, S., Dillinger, K., Zechner, U.,
Ludwig, L., Wilda, M., Hameister, H., Knochel, W., Liptay, S. and Schmid, R.M.
(2002) 'SHARP is a novel component of the Notch/RBP-Jkappa signalling
pathway.', EMBO Journal, 21(20), pp. 5417-5426.

189
Park, J.Y., Helm, J., Malafa, M., Coppola, D., Kim, D. and Kim, S.J. (2011)
'MicroRNAs in pancreatic ductal adenocarcinoma', World Journal of
Gastroenterology, 17(7), pp. 817-827.
Park, S., Gaur, A.B., Lengyel, E. and Peter, M.E. (2008) 'The miR-200family
determines the epithelial phenotype of cancer cells by targeting the E- cadherin
repressors ZEB1 and ZEB2', Genes & development, 22(7), pp. 894-907.
Pasca di Magliano, M., Sekine, S., Ermilov, A., Ferris, J., Dlugosz, A.A. and Hebrok,
M. (2006) 'Hedgehog/Ras interactions regulate early stages of pancreatic cancer.',
Genes & development, 20(22), pp. 3161-3173.
Pece, S., Serresi, M., Santolini, E., Capra, M., Hulleman, E., Galimberti, V., Zurrida, S.,
Maisonneuve, P., Viale, G. and Di Fiore, P.P. (2004) 'Loss of negative regulation
by Numb over Notch is relevant to human breast carcinogenesis.', Journal of Cell
Biology, 167(2), pp. 215-221.
Plentz, R., Park, J.S., Rhim, A.D., Abravanel, D., Hezel, A.F., Sharma, S.V.,
Gurumurthy, S., Deshpande, V., Kenific, C., Settleman, J., Majumder, P.K.,
Stanger, B.Z. and Bardeesy, N. (2009) 'Inhibition of gamma-secretase activity
inhibits tumor progression in a mouse model of pancreatic ductal
adenocarcinoma.', Gastroenterology, 136(5), pp. 1741-9.e6.
Radosevic, M., Fargas, L. and Alsina, B. (2014) 'The Role of her4 in Inner Ear
Development and Its Relationship with Proneural Genes and Notch
Signalling.(Research Article)', PLoS ONE, 9(10).
Radtke, F. and Raj, K. (2003) 'The role of Notch in tumorigenesis: Oncogene or tumour
suppressor.', Nature Reviews Cancer, 3(10), pp. 756-767.
Ralph, H.H. and Fukushima, N. (2007) 'Pancreatic adenocarcinoma: update on the
surgical pathology of carcinomas of ductal origin and PanINs', Modern Pathology,
20(1), pp. S61.
Rangarajan, A., Talora, C., Okuyama, R., Nicolas, M., Mammucari, C., Oh, H., Aster,
J.C., Krishna, S., Metzger, D., Chambon, P., Miele, L., Aguet, M., Radtke, F. and
Dotto, G.P. (2001) 'Notch signaling is a direct determinant of keratinocyte growth
arrest and entry into differentiation.', EMBO Journal, 20(13), pp. 3427-3436.
Roy, M., Pear, W.S. and Aster, J.C. (2007) 'The multifaceted role of Notch in cancer.',
Current Opinion in Genetics and Development, 17(1), pp. 52-59.
Sabattini, E., Bisgaard, K., Ascani, S., Poggi, S., Piccioli, M., Ceccarelli, C., Pieri, F.,
Fraternali-Orcioni, G. and Pileri, S.A. (1998) 'The EnVision++ system: a new
immunohistochemical method for diagnostics and research. Critical comparison
with the APAAP, ChemMate, CSA, LABC, and SABC techniques', Journal of
clinical pathology, 51(7), pp. 506.

190
Sancho, E., Batlle, E. and Clevers, H. (2004) 'Signaling pathways in intestinal
development and cancer', Annual Review of Cell & Developmental Biology, 20, pp.
695-723.
Santagata, S., Demichelis, F., Riva, A., Varambally, S., Hofer, M.D., Kutok, J.L., Kim,
R., Tang, J., Montie, J.E., Chinnaiyan, A.M., Rubin, M.A. and Aster, J.C. (2004)
'JAGGED1 expression is associated with prostate cancer metastasis and
recurrence.', Cancer research, 64(19), pp. 6854-6857.
Saura, C.A., Choi, S.-., Beglopoulos, V., Malkani, S., Zhang, D., Rao, B.S.S., Chattarji,
S., Kelleher III, R.J., Kandel, E.R., Duff, K., Kirkwood, A. and Shen, J. (2004)
'Loss of presenilin function causes impairments of memory and synaptic plasticity
followed by age-dependent neurodegeneration.', Neuron, 42(1), pp. 23-36.
Sawey, E.T., Johnson, J.A. and Crawford, H.C. (2007) 'Matrix metalloproteinase 7
controls pancreatic acinar cell transdifferentiation by activating the Notch signaling
pathway.', Proceedings of the National Academy of Sciences of the United States of
America, 104(49), pp. 19327-19332.
Schmittgen, T.D. and Livak, K.J. (2008) 'Analyzing real-time PCR data by the
comparative C(T) method', Nature protocols, 3(6), pp. 1101-1108.
Schneider, G., Siveke, J.T., Eckel, F. and Schmid, R.M. (2005) 'Pancreatic cancer: basic
and clinical aspects', Gastroenterology, 128(6), pp. 1606-1625.
Shawber, C., Nofziger, D., Hsieh, J.J.-., Lindsell, C., Bogler, O., Hayward, D. and
Weinmaster, G. (1996) 'Notch signaling inhibits muscle cell differentiation through
a CBF1-independent pathway.', Development, 122(12), pp. 3765-3773.
Shi, S.R., Key, M.E. and Kalra, K.L. (1991) 'Antigen retrieval in formalin- fixed,
paraffin- embedded tissues: an enhancement method for immunohistochemical
staining based on microwave oven heating of tissue sections', The journal of
histochemistry and cytochemistry : official journal of the Histochemistry Society,
39(6), pp. 741.
Shih, I. and Wang, T.L. (2007) 'Notch signaling, gamma-secretase inhibitors, and
cancer therapy', Cancer research, 67(5), pp. 1879-1882.
Siveke, J.T., Lubeseder-Martellato, C., Lee, M., Mazur, P.K., Nakhai, H., Radtke, F.
and Schmid, R.M. (2008) 'Notch Signaling Is Required for Exocrine Regeneration
After Acute Pancreatitis.', Gastroenterology, 134(2), pp. 544-555.e3.
Song, G., Zhang, Y. and Wang, L. (2009) 'MicroRNA- 206 targets notch3, activates
apoptosis, and inhibits tumor cell migration and focus formation', The Journal of
biological chemistry, 284(46), pp. 31921.
Song, L.L. and Miele, L. (2005) 'Role of Notch signaling in cell-fate determination of
human mammary stem/progenitor cells.', Women's Oncology Review, 5(1), pp. 9-
11.

191
Sriuranpong, V., Borges, M.W., Ravi, R.K., Arnold, D.R., Nelkin, B.D., Baylin, S.B.
and Ball, D.W. (2001) 'Notch signaling induces cell cycle arrest in small cell lung
cancer cells.', Cancer research, 61(7), pp. 3200-3205.
Stocken, D.D., Buchler, M.W., Dervenis, C., Bassi, C., Jeekel, H., Klinkenbijl, J.H.G.,
Bakkevold, K.E., Takada, T., Amano, H. and Neoptolemos, J.P. (2005) 'Meta-
analysis of randomised adjuvant therapy trials for pancreatic cancer.', British
journal of cancer, 92(8), pp. 1372-1381.
Sun, L., Liu, M., Sun, G.C., Yang, X., Qian, Q., Feng, S., Mackey, L.V. and Coy, D.H.
(2016) 'Notch Signaling Activation in Cervical Cancer Cells Induces Cell Growth
Arrest with the Involvement of the Nuclear Receptor NR4A2', Journal of Cancer,
7(11), pp. 1388-1395.
Szafranska, A.E., Davison, T.S., John, J., Cannon, T., Sipos, B., Maghnouj, A.,
Labourier, E. and Hahn, S.A. (2007) 'MicroRNA expression alterations are linked
to tumorigenesis and non-neoplastic processes in pancreatic ductal
adenocarcinoma.', Oncogene, 26(30), pp. 4442-4452.
Thelu, J., Rossio, P. and Favier, B. (2002) 'Notch signalling is linked to epidermal cell
differentiation level in basal cell carcinoma, psoriasis and wound healing.', BMC
Dermatology, 2, pp. 7.
Thurman, E. and Mills, S. (1998) Solid-Phase extraction: Principles and Practice. 1st
edn. United States of America: Wiley-Interscience.
Tiberio, P., Callari, M., Angeloni, V., Daidone, M.G. and Appierto, V. (2015)
'Challenges in using circulating miRNAs as cancer biomarkers', BioMed research
international, 2015, pp. 731479.
Tosello, V. and Ferrando, A.A. (2013) 'The NOTCH signaling pathway: role in the
pathogenesis of T-cell acute lymphoblastic leukemia and implication for therapy',
Therapeutic Advances in Hematology, 4(3), pp. 199-210.
Urbán, N. and Guillemot, F. (2014) 'Neurogenesis in the embryonic and adult brain:
same regulators, different roles', Frontiers in Cellular Neuroscience, 8, pp. 396.
Vallejo, D.M., Caparros, E. and Dominguez, M. (2011) 'Targeting Notch signalling by
the conserved miR-8/200 microRNA family in development and cancer cells', The
EMBO journal, 30(4), pp. 756-769.
van Es, J.H., van Gijn, M.E., Riccio, O., van den Born, M., Vooijs, M., Begthel, H.,
Cozijnsen, M., Robine, S., Winton, D.J., Radtke, F. and Clevers, H. (2005)
'Notch/gamma-secretase inhibition turns proliferative cells in intestinal crypts and
adenomas into goblet cells.', Nature, 435(7044), pp. 959-963.
Vinson, K.E., George, D.C., Fender, A.W., Bertrand, F.E. and Sigounas, G. (eds.)
(2016) The Notch pathway in colorectal cancer.

192
Vis, A.N., Kranse, R., Nigg, A.L. and Van, D.K. (2000) 'Quantitative analysis of the
decay of immunoreactivity in stored prostate needle biopsy sections', American
Journal of Clinical Pathology, 113(3), pp. 369-373.
Wang, J., Chen, J., Chang, P., LeBlanc, A., Li, D., Abbruzzesse, J.L., Frazier, M.L.,
Killary, A.M. and Sen, S. (2009) 'MicroRNAs in plasma of pancreatic ductal
adenocarcinoma patients as novel blood-based biomarkers of disease.', Cancer
Prevention Research, 2(9), pp. 807-813.
Wang, J., Chen, J. and Sen, S. (2016) 'MicroRNA as Biomarkers and Diagnostics',
Journal of cellular physiology, 231(1), pp. 25-30.
Wang, T., Baron, M. and Trump, D. (2008) 'An overview of Notch3 function in
vascular smooth muscle cells.', Progress in biophysics and molecular biology,
96(1-3) (pp 499-509), pp. ate of Pubaton: January 2008.
Wang, Z., Li, Y., Kong, D., Banerjee, S., Ahmad, A., Azmi, A.S., Ali, S., Abbruzzese,
J.L., Gallick, G.E. and Sarkar, F.H. (2009) 'Acquisition of Epithelial-
Mesenchymal Transition Phenotype of Gemcitabine-Resistant Pancreatic Cancer
Cells Is Linked with Activation of the Notch Signaling Pathway', Cancer research,
69(6), pp. 2400-2407.
Wang, Z., Ahmad, A., Li, Y., Azmi, A.S., Miele, L. and Sarkar, F.H. (2011) 'Targeting
notch to eradicate pancreatic cancer stem cells for cancer therapy', Anticancer
Research, 31(4), pp. 1105.
Wang, Z., Li, Y., Kong, D., Ahmad, A., Banerjee, S. and Sarkar, F.H. (2010) 'Cross-
talk between miRNA and Notch signaling pathways in tumor development and
progression', Cancer letters, 292(2), pp. 141-148.
Weinberg, R.A. (1989) 'Oncogenes, antioncogenes, and the molecular bases of
multistep carcinogenesis', Cancer research, 49(14), pp. 3713.
Weledji, E.P., Enoworock, G., Mokake, M. and Sinju, M. (2016) 'How Grim is
Pancreatic Cancer?', Oncology Reviews, 10(1), pp. 294.
Weng, A.P., Ferrando, A.A., Lee, W., Morris IV, J.P., Silverman, L.B., Sanchez-
Irizarry, C., Blacklow, S.C., Look, A.T. and Aster, J.C. (2004) 'Activating
mutations of NOTCH1 in human T cell acute lymphoblastic leukemia.', Science,
306(5694), pp. 269-271.
Weng, A.P., Millholland, J.M., Yashiro-Ohtani, Y., Arcangeli, M.L., Lau, A., Wai, C.,
Del Bianco, C., Rodriguez, C.G., Sai, H., Tobias, J., Li, Y., Wolfe, M.S., Shachaf,
C., Felsher, D., Blacklow, S.C., Pear, W.S. and Aster, J.C. (2006) 'c-Myc is an
important direct target of Notch1 in T-cell acute lymphoblastic
leukemia/lymphoma.', Genes and Development, 20(15), pp. 2096-2109.
Wentz-Hunter, K. and Potashkin, J.A. (2011) 'The Role of miRNAs as Key Regulators
in the Neoplastic Microenvironment', Molecular Biology International, 2011.

193
Whiteaker, J.R., Zhao, L., Zhang, H.Y., Feng, L.-., Piening, B.D., Anderson, L. and
Paulovich, A.G. (2007) 'Antibody-based enrichment of peptides on magnetic beads
for mass-spectrometry-based quantification of serum biomarkers.', Analytical
Biochemistry, 362(1), pp. 44-54.
Whitehouse, C.M., Dreyer, R.N., Yamashita, M. and Fenn, J.B. (1985) 'Electrospray
interface for liquid chromatographs and mass spectrometers', Analytical Chemistry,
57(3), pp. 675.
Winter, J.M., Maitra, A. and Yeo, C.J. (eds.) (2006) Genetics and pathology of
pancreatic cancer. Oxford, UK: .
Wu, E., Zhou, S., Bhat, K. and Ma, Q. (2013) 'CA 19-9 and pancreatic cancer.', Clinical
Advances in Hematology & Oncology, 11(1), pp. 53-55.
Xiao, Y., Ye, Y., Zou, X., Jones, S., Yearsley, K., Shetuni, B., Tellez, J. and Barsky,
S.H. (2011) 'The lymphovascular embolus of inflammatory breast cancer exhibits a
Notch 3 addiction.', Oncogene, 30(3), pp. 287-300.
Xie, R., Chung, J., Ylaya, K., Williams, R., Guerrero, N., Nakatsuka, N., Badie, C. and
Hewitt, S.M. (eds.) (2011) Factors Influencing the Degradation of Archival
Formalin- Fixed Paraffin- Embedded Tissue Sections.
Xu, C., Zheng, Y., Lian, D., Ye, S., Yang, J. and Zeng, Z. (2015) 'Analysis of
microRNA expression profile identifies novel biomarkers for non-small cell lung
cancer', Tumori, 101(1), pp. 104-110.
Xu, P., Zhu, Y., Sun, B. and Xiao, Z. (2016) 'Colorectal cancer characterization and
therapeutic target prediction based on microRNA expression profile', Scientific
Reports, 6, pp. 10.1038/srep20616.
Yamada, T., Yamazaki, H., Yamane, T., Yoshino, M., Okuyama, H., Tsuneto, M.,
Kurino, T., Hayashi, S.-. and Sakano, S. (2003) 'Regulation of osteoclast
development by Notch signaling directed to osteoclast precursors and through
stromal cells.', Blood, 101(6), pp. 2227-2234.
Yamamoto, N., Yamamoto, S.-., Inagaki, F., Kawaichi, M., Fukamizu, A., Kishi, N.,
Matsuno, K., Nakamura, K., Weinmaster, G., Okano, H. and Nakafuku, M. (2001)
'Role of Deltex-1 as a Transcriptional Regulator Downstream of the Notch
Receptor.', Journal of Biological Chemistry, 276(48), pp. 45031-45040.
Yamashita, M. and Fenn, J.B. (1984) 'Electrospray ion source. Another variation on the
free-jet theme', The Journal of physical chemistry, 88(20), pp. 4451-4459.
Yang, Y., Iyer, L.K., Adelstein, S.J. and Kassis, A.I. (2008) 'Integrative genomic data
mining for discovery of potential blood-borne biomarkers for early diagnosis of
cancer.', PLoS ONE, 3(11), pp. Arte Number: e3661. ate of Pubaton: 06 No 2008.
Yu, J., Ohuchida, K., Mizumoto, K., Sato, N., Kayashima, T., Fujita, H., Nakata, K. and
Tanaka, M. (2010) 'MicroRNA, hsa- miR- 200c , is an independent prognostic

194
factor in pancreatic cancer and its upregulation inhibits pancreatic cancer invasion
but increases cell proliferation.(Research)(Report)', Molecular Cancer, 9, pp. 169.
Yuan, J.S., Reed, A., Chen, F. and Stewart, C.N. (2006) 'Statistical analysis of real-
time PCR data', BMC bioinformatics, 7, pp. 85.
Yun, T.J. and Bevan, M.J. (2003) 'Notch-regulated ankyrin-repeat protein inhibits
Notch1 signaling: Multiple Notch1 signaling pathways involved in T cell
development.', Journal of Immunology, 170(12), pp. 5834-5841.
Zagouras, P., Stifani, S., Blaumueller, C.M., Carcangiu, M.L. and Artavanis-Tsakonas,
S. (1995) 'Alterations in Notch signaling in neoplastic lesions of the human
cervix.', Proceedings of the National Academy of Sciences of the United States of
America, 92(14), pp. 6414-6418.
Zaravinos, A. (2015) 'The Regulatory Role of MicroRNAs in EMT and Cancer',
Journal of Oncology, 2015.
Zeng, Q., Li, S., Chepeha, D.B., Giordano, T.J., Li, J., Zhang, H., Polverini, P.J., Nor,
J., Kitajewski, J. and Wang, C.-. (2005) 'Crosstalk between tumor and endothelial
cells promotes tumor angiogenesis by MAPK activation of Notch signaling.',
Cancer Cell, 8(1), pp. 13-23.
Zhang, P., Yan, X., Chen, Y., Yang, Z. and Han, H. (2014) 'Notch signaling in blood
vessels: from morphogenesis to homeostasis', Science China Life Sciences, 57(8),
pp. 774-780.
Zhou, S., Fujimuro, M., Hsieh, J.J.-., Chen, L., Miyamoto, A., Weinmaster, G. and
Hayward, S.D. (2000) 'SKIP, a CBF1-associated protein, interacts with the ankyrin
repeat domain of NotchIC to facilitate NotchIC function.', Molecular and cellular
biology, 20(7), pp. 2400-2410.

195
APPENDIX
Ethics approval for this project