Invest for Long Term Growth
27
Invest for Long Term Growth while Saving Taxes Baroda Pioneer ELSS'96 Invest Now In Baroda Pioneer ELSS'96 Factsheet as on December 2017 Tax weighing scale Taxes Savings ` With ELSS u/s 80C ` * Investors should consult their financial advisers if in doubt about whether the product is suitable for them. Capital growth over long term Investment predominantly in equity and equity related instruments. This product is suitable for investors who are seeking* (An Open Ended Tax Benefit-Cum-Growth Scheme)
Transcript of Invest for Long Term Growth
Invest for Long Term Growthwhile Saving Taxes
Baroda Pioneer ELSS'96Invest Now In
Baroda Pioneer ELSS'96
Factsheetas on December 2017
Tax weighingscale
TaxesSavings
`
With ELSS
u/s 80C
`
* Investors should consult their financial advisers if in doubt about
whether the product is suitable for them.
Capital growth over long term
Investment predominantly in equity and equity related instruments.
This product is suitable for investors who are seeking*
(An Open Ended Tax Benefit-Cum-Growth Scheme)

31st December, 2017
BARODA PIONEER MUTUAL FUND
Dear Investors,
Warm Greetings!
Markets closed positively during the month of December, registering gains of 2.7%. For the year 2017 markets are up by 28%. While data points were negative, BJP’s win in both Gujarat and Himachal state elections helped drive positive sentiments. The performance of both developed and emerging markets were mixed with Dow Jones and Turkey stock index giving best returns of 5% and 6% respectively. In India, midcaps outperformed the Nifty by 3%. Auto, metals, FMCG and IT outperformed the Nifty, while banks and energy underperformed.
As widely expected, federal reserve raised rates by 25bps from 1.25% to1.50%. Its statement is largely unchanged i.e. economic outlook with labour market is strengthening while inflation may remain below 2% target. US Fed policy is likely to remain accommodative & interest rates may rise gradually. Fed may be expected
to stay on guided path, three rate hikes in 2018 with balance sheet tightening.
Locally, CPI inflation accelerated to 4.9% in November from 3.7% in October, led partly by adverse base effect and also by across-the-board surge in food inflation and core inflation. Food inflation picked up to 4.4% as compared to 1.9% in October. On a sequential basis, the food index moved up 1.6% m-o-m primarily led by eggs, vegetables and sugar. Pulses price’s continued to contract sequentially. Fuel and light inflation surged upto 8%, led by a 2% m-o-m increase reflecting the impact of higher prices of LPG, kerosene and electricity.
IIP growth in October slowed to 2.2% compared to upwardly revised growth of 4.1% in September. Sector-wise, manufacturing growth was at 2.5% compared to a 10-month high of 3.8% in September. Sequentially manufacturing production contracted 1% m-o-m after two consecutive months of positive growth. Mining also recorded a sharp slowdown to 0.2% from 7.8% in September, led by adverse base effect, even though the sequential momentum remained firm at 7.1% m-o-m. Electricity grew by 3.2%. On use-based basis, capital goods posted the third consecutive growth at 6.8% suggesting nascent signs of stability on the investment activity. Infrastructure and construction sector also grew at a 10-month high of 5.2%. Consumer non-durables grew firm at 7.7%, while consumer durables contracted by 6.9%.
The BJP’s election momentum continued to hold sway. It has retained all-important part(s) of Gujarat with a clear majority and wrested power from Congress in Himachal Pradesh. The saffron party had its share of challenges-was up against rural distress, near-term disruption due to demonetisation & GST and two decades of anti-incumbency in Gujarat. That said, Gujarat’s contest turned out to be a close fight, with BJP’s tally at the lower end of exit polls. While it performed well in urban centres (despite GST/ demonetisation impact), it lost ground in rural areas amidst high farm distress.
We may see a policy bias towards fiscal spend with rural focus. While we see the economic/earnings cycle picking up, the election cycle is probably now upon us, and this will add to the swings in the market.
For the markets, the focus may shift back to earnings since now we would be entering the quarterly earnings season.
Currently, Nifty is trading at PEof 16.5 for FY19 as per the consensus earnings estimates. Consensus expects earnings growth of 17% CAGR for two years which could see some moderation going forward. I take this opportunity to wish you a very happy and wonderful year ahead. Happy investing.
Happy Investing!
Sanjay Chawla
Chief Investment Officer
Sources : Bloomberg, Economic Times
CIO Letter
2
Mr. Sanjay ChawlaChief Investment Officer

31st December, 2017
BARODA PIONEER MUTUAL FUND
INDEX
Title
How To Read Factsheet Pg 4
Baroda Pioneer Growth Fund Pg 5
Baroda Pioneer ELSS’ 96 Pg 6
Baroda Pioneer Mid Cap Fund Pg 7
Baroda Pioneer Large Cap Fund Pg 8
Baroda Pioneer Banking and Financial Services Fund Pg 9
Baroda Pioneer Balance Fund Pg 10
Baroda Pioneer Monthly Income Plan (MIP) Fund(Monthly income is not assured and is subject to the availability of distributable surplus)
Pg 11
Baroda Pioneer Credit Opportunities Fund Pg 12
Baroda Pioneer Gilt Fund Pg 13
Baroda Pioneer Income Fund Pg 14
Baroda Pioneer Dynamic Bond Fund Pg 15
Baroda Pioneer Short Term Bond Fund Pg 16
Baroda Pioneer Treasury Advantage Fund Pg 17
Baroda Pioneer Liquid Fund Pg 18
Investment Performance Pg 19
SIP Returns Pg 23
Dividend History Pg 24
3

31st December, 2017
BARODA PIONEER MUTUAL FUND
Fund Manager : An employee of the asset management company such as a mutual fund or life insurer, who manages investments of the scheme. He is usually part of a larger team of fund managers and research analysts.
Application Amount for Fresh Subscription : This is the minimum investment amount for a new investor in a mutual fund scheme.
Minimum Additional Amount : This is the minimum investment amount for an existing investor in a mutual fund scheme.
Yield to Maturity : The Yield to Maturity or the YTM is the rate of return anticipated on a bond if held until maturity. YTM is expressed as an annual rate. The YTM factors in the bond’s current market price, par value, coupon interest rate and time to maturity.
SIP : SIP or systematic investment plan works on the principle of making periodic investments of a fixed sum. It works similar to a recurring bank deposit. For instance, an investor may opt for an SIP that invests Rs 500 every 15th of the month in an equity fund for a period of three years.
NAV : The NAV or the net asset value is the total asset value per unit of the mutual fund after deducting all related and permissible expenses. The NAV is calculated at the end of every business day. It is the value at which the investor enters or exits the mutual fund.
Benchmark : A group of securities, usually a market index, whose performance is used as a standard or benchmark to measure investment performance of mutual funds, among other investments. Some typical benchmarks include the Nifty, Sensex, BSE200, BSE500, 10-Year Gsec.
Entry Load : A mutual fund may have a sales charge or load at the time of entry and/or exit to compensate the distributor/agent. Entry load is charged at the time an investor purchases the units of a mutual fund. The entry load is added to the prevailing NAV at the time of investment. For instance, if the NAV is Rs. 100 and the entry load is 1%, the investor will enter the fund at Rs. 101.
Note: SEBI, vide circular dated June 30, 2009 has abolished entry load and mandated that the upfront commission to distributors will be paid by the investor directly to the distributor, based on his assessment of various factors including the service rendered by the distributor.
Exit Load : Exit load is charged at the time an investor redeems the units of a mutual fund. The exit load is deducted from the prevailing NAV at the time of redemption. For instance, if the NAV is Rs 100 and the exit load is 1%, the redemption price would be Rs 99 Per Unit.
Modified Duration : Modified duration is the price sensitivity and the percentage change in price for a unit change in yield
Standard Deviation : Standard deviation is a statistical measure of the range of an investment’s performance. When a mutual fund has a high standard deviation, its means its range of performance is wide, implying greater volatility.
Sharpe Ratio : The Sharpe Ratio, named after its founder, the Nobel Laureate William Sharpe, is a measure of risk-adjusted returns. It is calculated using standard deviation and excess return to determine reward per unit of risk.
Beta : Beta is a measure of an investment’s volatility vis-à-vis the market. Beta of less than 1 means that the security will be less volatile than the market. A beta of greater than 1 implies that the security’s price will be more volatile than the market.
AUM : AUM or assets under management refers to the recent / updated cumulative market value of investments managed by a mutual fund or any investment firm.
Holdings : The holdings or the portfolio is a mutual fund’s latest or updated reported statement of investments/securities. These are usually displayed in terms of percentage to net assets or the rupee value or both. The objective is to give investors an idea of where their money is being invested by the fund manager.
Nature of Scheme : The investment objective and underlying investments determine the nature of the mutual fund scheme. For instance, a mutual fund that aims at generating capital appreciation by investing in stock markets is an equity fund or growth fund. Likewise, a mutual fund that aims at capital preservation by investing in debt markets is a debt fund or income fund. Each of these categories may have sub-categories.
Rating Profile : Mutual funds invest in securities after evaluating their creditworthiness as disclosed by the ratings. A depiction of the mutual fund in various investments based on their ratings becomes the rating profile of the fund. Typically, this is a feature of debt funds.
How To Read Factsheet?
4

31st December, 2017
BARODA PIONEER MUTUAL FUND
Baroda Pioneer Growth Fund
PORTFOLIO
Name of Instruments Ratings / Industries
% to Net Assets
EQUITY & EQUITY RELATED
Listed / awaiting listing on the stock exchanges
HDFC Bank Ltd. Banks 6.52%
Maruti Suzuki India Ltd. Auto 4.52%
Hindalco Industries Ltd.Non - Ferrous Metals
3.43%
ICICI Bank Ltd. Banks 3.40%
Mahindra & Mahindra Financial Services Ltd.
Finance 3.37%
Kansai Nerolac Paints Ltd.Consumer Non Durables
3.29%
Tata Steel Ltd. Ferrous Metals 3.29%
Yes Bank Ltd. Banks 3.17%
Petronet LNG Ltd. Gas 2.80%
Motherson Sumi Systems Ltd.
Auto Ancillaries 2.76%
SBI Life Insurance Company Ltd.
Finance 2.69%
The Federal Bank Ltd. Banks 2.69%
GAIL (India) Ltd. Gas 2.67%
Britannia Industries Ltd.Consumer Non Durables
2.62%
Whirlpool of India Ltd.Consumer Durables
2.45%
Bharti Airtel Ltd.Telecom - Services
2.29%
State Bank of India Banks 2.16%
Bharat Forge Ltd.Industrial Products
2.15%
Indraprastha Gas Ltd. Gas 2.08%
Blue Star Ltd.Consumer Durables
2.02%
Pidilite Industries Ltd. Chemicals 2.02%
HCL Technologies Ltd. Software 1.93%
Godrej Consumer Products Ltd.
Consumer Non Durables
1.89%
Apollo Tyres Ltd. Auto Ancillaries 1.87%
Reliance Industries Ltd.Petroleum Products
1.85%
NBCC (India) Ltd. Construction 1.81%
Bank of Baroda Banks 1.74%
Sadbhav Engineering Ltd.Construction Project
1.72%
Indian Oil Corporation Ltd.
Petroleum Products
1.56%
Astral Poly Technik Ltd.Industrial Products
1.55%
Titan Company Ltd.Consumer Durables
1.46%
Mahindra & Mahindra Ltd. Auto 1.39%
Capital First Ltd. Finance 1.39%
WABCO India Ltd. Auto Ancillaries 1.39%
Central Depository Services (I) Ltd.
Finance 1.38%
The Ramco Cements Ltd. Cement 1.34%
Larsen & Toubro Ltd.Construction Project
1.31%
Ultratech Cement Ltd. Cement 1.20%
Ashok Leyland Ltd. Auto 1.20%
PORTFOLIO
Name of Instruments Ratings / Industries
% to Net Assets
Shriram Transport Finance Company Ltd.
Finance 1.15%
Eicher Motors Ltd. Auto 1.08%
Vedanta Ltd.Non - Ferrous Metals
1.02%
Bajaj Finserv Ltd. Finance 0.97%
Engineers India Ltd.Construction Project
0.93%
Union Bank of India Banks 0.76%
Security and Intelligence Services (I) Ltd.
Commercial Services
0.65%
NMDC Ltd. Minerals/Mining 0.53%
Grasim Industries Ltd. Cement 0.45%
Syndicate Bank Banks 0.15%
Total 98.06%
CBLO / Reverse Repo Investments 2.77%
Total 2.77%
Cash & Cash Equivalents
Net Receivable/Payable -0.83%
Total -0.83%
Grand Total 100.00%
INDUSTRIES/RATINGS
20.59%
10.95%
8.19%
7.80%
7.55%
6.02%
5.93%
4.45%
3.96%
3.70%
3.41%
3.29%
2.99%
2.29%
2.02%
1.94%
1.93%
1.81%
0.65%
0.53%
Banks
Finance
Auto
Consumer Non Durables
Gas
Auto Ancillaries
Consumer Durables
Non - Ferrous Metals
Construction Project
Industrial Products
Petroleum Products
Ferrous Metals
Cement
Telecom - Services
Chemicals
Cash & Equivalent
Software
Construction
Commercial Services
Minerals/Mining
Investors understand that their principal will be at Moderately High risk
This product is suitable for investors who are seeking*• Capital appreciation over long term• Investment predominantly in equity and equity related
instruments.* Investors should consult their financial advisers if in doubt about whether the product is suitable for them.
INVESTMENT OBJECTIVE
To generate long term capital appreciation from an actively managed portfolio of equity & equity related instruments.
FUND DETAILS
Type of Scheme An Open Ended Growth Scheme
Date of Allotment September 12, 2003
Fund Manager# Mr. Sanjay Chawla& (Experience 29 yrs) Mr. Dipak Acharya (Experience 13 yrs)
Benchmark S&P BSE 200*
Monthly Average AUM (`)
625.26 Crs
Month end AUM (`) 646.37 Crs
Minimum Investment ` 5,000/- & in multiples of ` 1/- thereafter
Entry Load NAExit Load 1% if redeemed on or before
365 days from the date ofallotment of units, Nil if redeemed after 365 days from the date of allotment of units
Plans Plan A and Plan B (Direct)Option A. Growth Option (default
option in case no option specified by investor);B. Dividend Option1. Payout2. Re-investment (default sub-option in case no option specified by investor) C. Bonus Option$
SIP (Minimum) ` 500/month - 12 Installments` 1500/quarter - 4 Installments
RISk PROFILE 29 DECEMBER 2017Standard deviation 14.19%Sharpe@ 0.36Beta 0.98Portfolio Turnover (last 12 months) 1.12
NAV AS ON 29 DECEMEBER 2017NAV (Per Unit) `Plan AGrowth 104.7900Dividend 40.0500Plan B - DirectGrowth 109.5100Dividend 39.7200
TOTAL EXPENSE RATIOPlan A 2.96%Plan B (Direct) 2.07%
$ The Bonus Option in the Schemes has been discontinued effective June 08, 2015 # For performance of the Scheme and other funds managed by the said Fund manager, either individually or jointly, please refer page no 19 - 22*For Disclaimer please refer page no 22@risk free rate (FBIL Overnight MIBOR) 6.20%& Mr. Chawla is managing the Scheme along with Mr. Acharya effective November 1, 2015
An Open Ended Growth Scheme
5

31st December, 2017
BARODA PIONEER MUTUAL FUND
PORTFOLIO
Name of Instruments Ratings / Industries
% to Net Assets
EQUITY & EQUITY RELATED
Listed / awaiting listing on the stock exchanges
HDFC Bank Ltd. Banks 6.53%
Maruti Suzuki India Ltd. Auto 4.34%
Mahindra & Mahindra Financial Services Ltd.
Finance 3.67%
Yes Bank Ltd. Banks 3.66%
Kansai Nerolac Paints Ltd.Consumer Non Durables
3.57%
Hindalco Industries Ltd.Non - Ferrous Metals
3.50%
Tata Steel Ltd. Ferrous Metals 3.24%
Whirlpool of India Ltd.Consumer Durables
2.98%
Petronet LNG Ltd. Gas 2.96%
The Federal Bank Ltd. Banks 2.94%
ICICI Bank Ltd. Banks 2.80%
Motherson Sumi Systems Ltd.
Auto Ancillaries 2.79%
Bharat Financial Inclusion Ltd.
Finance 2.71%
GAIL (India) Ltd. Gas 2.71%
Apollo Tyres Ltd. Auto Ancillaries 2.60%
Britannia Industries Ltd.Consumer Non Durables
2.56%
Carborundum Universal Ltd.
Industrial Products 2.48%
Bata India Ltd.Consumer Durables
2.32%
Bharti Airtel Ltd. Telecom - Services 2.26%
Pidilite Industries Ltd. Chemicals 2.10%
Bajaj Finserv Ltd. Finance 2.03%
Cholamandalam Investment and Finance Company Ltd.
Finance 2.01%
The Karnataka Bank Ltd. Banks 2.00%
Indraprastha Gas Ltd. Gas 1.95%
State Bank of India Banks 1.92%
NBCC (India) Ltd. Construction 1.91%
Security and Intelligence Services (I) Ltd.
Commercial Services
1.86%
HCL Technologies Ltd. Software 1.73%
WABCO India Ltd. Auto Ancillaries 1.71%
Central Depository Services (I) Ltd.
Finance 1.66%
Vedanta Ltd.Non - Ferrous Metals
1.66%
Symphony Ltd.Consumer Durables
1.63%
Capital First Ltd. Finance 1.61%
Blue Star Ltd.Consumer Durables
1.41%
Ashok Leyland Ltd. Auto 1.39%
Mahindra & Mahindra Ltd.
Auto 1.28%
Ambuja Cements Ltd. Cement 1.27%
City Union Bank Ltd. Banks 1.12%
Century Textiles & Industries Ltd.
Cement 1.11%
PORTFOLIO
Name of Instruments Ratings / Industries
% to Net Assets
Larsen & Toubro Ltd.Construction Project
1.10%
NMDC Ltd. Minerals/Mining 0.80%
Can Fin Homes Ltd. Finance 0.55%
GMR Infrastructure Ltd.Construction Project
0.52%
The South Indian Bank Ltd.
Banks 0.48%
Syndicate Bank Banks 0.37%
Sadbhav Engineering Ltd.Construction Project
0.07%
Total 97.87%
CBLO / Reverse Repo Investments 2.53%
Total 2.53%
Cash & Cash Equivalents
Net Receivable/Payable -0.40%
Total -0.40%
Grand Total 100.00%
INDUSTRIES/RATINGS
21.82%
14.24%
8.34%
7.62%
7.10%
7.01%
6.13%
5.16%
3.24%
2.48%
2.38%
2.26%
2.13%
2.10%
1.91%
1.86%
1.73%
1.69%
0.80%
Banks
Finance
Consumer Durables
Gas
Auto Ancillaries
Auto
Consumer Non Durables
Non - Ferrous Metals
Ferrous Metals
Industrial Products
Cement
Telecom - Services
Cash & Equivalent
Chemicals
Construction
Commercial Services
Software
Construction Project
Minerals/Mining
Baroda Pioneer ELSS’ 96
Investors understand that their principal will be at Moderately High risk
This product is suitable for investors who are seeking*• Capital growth over long term• Investment predominantly in equity and equity related
instruments.* Investors should consult their financial advisers if in doubt about whether the product is suitable for them.
INVESTMENT OBJECTIVE
The main objective of the scheme is to provide the investor long term capital growth as also tax benefit under section 80C of the Income Tax Act, 1961.
FUND DETAILS
Type of Scheme An Open Ended Tax Benefit-Cum-Growth Scheme
Date of Allotment March 31, 1996Fund Manager# Mr. Sanjay Chawla& (Experience
29 yrs) Mr. Dipak Acharya (Experience 13 yrs)
Benchmark S&P BSE 200*Monthly Average AUM (`)
125.02 Crs
Month end AUM (`) 129.00 Crs Minimum Investment ` 500/- & in multiples of ` 1/-
thereafterEntry Load NAExit Load NilPlans Plan A and Plan B (Direct)
Option A. Growth Option (default option in case no option specified by investor);B. Dividend Option C. Bonus Option$
SIP (Minimum) ` 500/month - 12 Installments` 1500/quarter - 4 Installments
RISk PROFILE 29 DECEMBER 2017Standard deviation 17.74%Sharpe@ 0.27Beta 1.02Portfolio Turnover (last 12 months) 1.22
NAV AS ON 29 DECEMEBER 2017NAV (Per Unit) `Plan ADividend 35.5900Bonus 49.3200Growth 49.3200Plan B - DirectDividend 41.7400Bonus 52.3900Growth 52.3900
TOTAL EXPENSE RATIOPlan A 3.09%Plan B (Direct) 1.89%
$ The Bonus Option in the Schemes has been discontinued effective June 08, 2015 # For performance of the Scheme and other funds managed by the said Fund manager, either individually or jointly, please refer page no 19 - 22@risk free rate (FBIL Overnight MIBOR) 6.20%*For Disclaimer please refer page no 22& Mr. Chawla is managing the Scheme along with Mr. Acharya effective November 1, 2015
An Open Ended Tax Benefit - Cum - Growth Scheme
6

31st December, 2017
BARODA PIONEER MUTUAL FUND
Baroda Pioneer Mid-Cap Fund
Investors understand that their principal will be at High risk
This product is suitable for investors who are seeking*• Capital appreciation over long term.• Investment predominantly in equity and equity related
securities of growth oriented Mid-Cap stocks.* Investors should consult their financial advisers if in doubt about whether the product is suitable for them.
INVESTMENT OBJECTIVE
The primary objective of the Scheme is to generate capital appreciation by investing predominantly in a diversified portfolio of equity and equity related securities of growth oriented mid cap stocks. However, there is no assurance or guarantee that the investment objective of the Scheme will be realized
FUND DETAILS
Type of Scheme An Open Ended Equity Scheme
Date of Allotment October 4, 2010
Fund Manager# Mr. Sanjay Chawla (Experience 29 yrs) Mr. Dipak Acharya (Experience 13 yrs)
Benchmark S&P BSE Mid-cap index*Monthly Average AUM (`) 37.00 Crs
Month end AUM (`) 38.37 Crs
Minimum Investment ` 5,000/- & in multiples of ` 1/- thereafter
Entry Load NAExit Load 1.00% if redeemed on or before 365
days from the date of allotment of units, Nil if redeemed after 365 days from the date of allotment of units
Plans Plan A and Plan B (Direct)
Option A. Growth Option (default option in case no option specified by investor);B. Dividend Option 1. Payout;2. Reinvestment (default sub-option in case no option specified by investor)C. Bonus Option$
SIP (Minimum) ` 500/month - 12 Installments` 1500/quarter - 4 Installments
PORTFOLIO
Name of Instruments Ratings / Industries
% to Net
Assets
EQUITY & EQUITY RELATED
Listed / awaiting listing on the stock exchanges
Whirlpool of India Ltd.Consumer Durables
3.74%
Symphony Ltd.Consumer Durables
3.64%
Carborundum Universal Ltd.Industrial Products
3.43%
BEML Ltd.Industrial Capital Goods
3.37%
City Union Bank Ltd. Banks 3.37%
Mahindra & Mahindra Financial Services Ltd.
Finance 3.33%
Bata India Ltd.Consumer Durables
3.31%
Astral Poly Technik Ltd.Industrial Products
3.30%
Bharat Financial Inclusion Ltd. Finance 3.26%
Gujarat State Fertilizers & Chemicals Ltd.
Fertilisers 3.25%
Kalpataru Power Transmission Ltd.
Power 3.08%
Crompton Greaves Consumer Electricals Ltd.
Consumer Durables
2.87%
The Karnataka Bank Ltd. Banks 2.77%
Raymond Ltd. Textile Products 2.76%
K.P.R. Mill Ltd. Textile Products 2.72%
Bajaj Electricals Ltd.Consumer Durables
2.59%
NBCC (India) Ltd. Construction 2.57%
Cholamandalam Investment and Finance Company Ltd.
Finance 2.54%
The Federal Bank Ltd. Banks 2.47%
Indraprastha Gas Ltd. Gas 2.41%
PC Jeweller Ltd.Consumer Durables
2.38%
Blue Dart Express Ltd. Transportation 2.37%
GMR Infrastructure Ltd.Construction Project
2.34%
Jubilant Foodworks Ltd.Consumer Non Durables
2.30%
National Aluminium Company Ltd.
Non - Ferrous Metals
2.24%
Security and Intelligence Services (I) Ltd.
Commercial Services
2.19%
Rallis India Ltd. Pesticides 2.07%
Solar Industries India Ltd. Chemicals 2.00%
Tata Sponge Iron Ltd. Ferrous Metals 1.93%
Gulf Oil Lubricants India Ltd.Petroleum Products
1.93%
WABCO India Ltd. Auto Ancillaries 1.91%
Century Textiles & Industries Ltd. Cement 1.87%
Blue Star Ltd.Consumer Durables
1.71%
JK Cement Ltd. Cement 1.45%
Century Plyboards (India) Ltd.Consumer Durables
1.33%
Bajaj Corp Ltd.Consumer Non Durables
1.25%
Balkrishna Industries Ltd. Auto Ancillaries 1.25%
Can Fin Homes Ltd. Finance 1.23%
PORTFOLIO
Name of Instruments Ratings / Industries
% to Net
Assets
Sundram Fasteners Ltd. Auto Ancillaries 1.14%
Union Bank of India Banks 0.70%
Syndicate Bank Banks 0.50%
Orient Cement Ltd. Cement 0.47%
Total 97.34%
CBLO / Reverse Repo Investments 1.84%
Total 1.84%
Cash & Cash Equivalents
Net Receivable/Payable 0.82%
Total 0.82%
Grand Total 100.00%
INDUSTRIES/RATINGS
21.57%10.36%9.81%
6.73%5.48%
4.30%3.79%3.55%3.37%3.25%3.08%2.66%2.57%2.41%2.37%2.34%2.24%2.19%2.07%2.00%1.93%1.93%
Consumer DurablesFinance
BanksIndustrial Products
Textile ProductsAuto Ancillaries
CementConsumer Non DurablesIndustrial Capital Goods
FertilisersPower
Cash & EquivalentConstruction
GasTransportation
Construction ProjectNon - Ferrous MetalsCommercial Services
PesticidesChemicals
Ferrous MetalsPetroleum Products
An Open Ended Equity Scheme
$ The Bonus Option in the Schemes has been discontinued effective June 08, 2015*For Disclaimer please refer page no 22 # For performance of the Scheme and other funds managed by the said Fund manager, either individually or jointly, please refer page no 19 - 22@risk free rate (FBIL Overnight MIBOR) 6.20%
7
RISk PROFILE 29 DECEMBER 2017
Standard deviation 16.43%Sharpe@ -0.07Beta 0.92Portfolio Turnover (last 12 months) 1.67
NAV AS ON 29 DECEMEBER 2017
NAV (Per Unit) `Plan AGrowth 10.3500Dividend 10.3500Plan B - DirectGrowth 10.7600Dividend 10.7600
TOTAL EXPENSE RATIO
Plan A 3.18%Plan B (Direct) 2.29%

31st December, 2017
BARODA PIONEER MUTUAL FUND
Baroda Pioneer Large Cap Fund
Investors understand that their principal will be at Moderately High risk
This product is suitable for investors who are seeking*• Capital appreciation over long term• Investment predominantly in a diversified portfolio
of equity and equity related securities of Large Cap companies.* Investors should consult their financial advisers if in doubt about whether the product is suitable for them.
INVESTMENT OBJECTIVE
The primary objective of the Scheme is to generate capital appreciation by investing predominantly in a diversified portfolio of equity and equity related securities of large cap companies. The Scheme may also invest in debt and money market securities.However, there is no assurance or guarantee that the investment objective of the Scheme will be realized.
FUND DETAILS
Type of Scheme An Open Ended Equity SchemeDate of Allotment June 22, 2010Fund Manager# Mr. Sanjay Chawla (Experience 29 yrs)
Mr. Dipak Acharya (Experience 13 yrs)
Benchmark Nifty 100*Monthly Average AUM (`) 28.93 CrsMonth end AUM (`) 29.61 Crs Minimum Investment ` 5,000/- & in multiples of ` 1/-
thereafterEntry Load NAExit Load 1.00% if redeemed on or before
365 days from the date of allotment of units, Nil if redeemed after 365 days from the date of allotment of units
Plans Plan A and Plan B (Direct)
Option A. Growth Option (default option in case no option specified by investor);B. Dividend Option 1. Payout;2. Reinvestment (default sub-option in case no option specified by investor)C. Bonus Option$
SIP (Minimum) ` 500/month - 12 Installments` 1500/quarter - 4 Installments
PORTFOLIO
Name of Instruments Ratings / Industries
% to Net
Assets
EQUITY & EQUITY RELATED
Listed / awaiting listing on the stock exchanges
HDFC Bank Ltd. Banks 7.59%
Maruti Suzuki India Ltd. Auto 6.57%
Reliance Industries Ltd. Petroleum Products 6.22%
Hindalco Industries Ltd.Non - Ferrous Metals
6.01%
Larsen & Toubro Ltd.Construction Project
5.10%
ICICI Bank Ltd. Banks 4.77%
GAIL (India) Ltd. Gas 4.56%
Ultratech Cement Ltd. Cement 4.38%
Yes Bank Ltd. Banks 4.26%
Tata Steel Ltd. Ferrous Metals 3.71%
Bharti Airtel Ltd. Telecom - Services 3.22%
Hindustan Unilever Ltd.Consumer Non Durables
2.77%
Ambuja Cements Ltd. Cement 2.76%
State Bank of India Banks 2.62%
MRF Ltd. Auto Ancillaries 2.44%
Mahindra & Mahindra Financial Services Ltd.
Finance 2.40%
Godrej Consumer Products Ltd.
Consumer Non Durables
2.36%
Grasim Industries Ltd. Cement 2.36%
Zee Entertainment Enterprises Ltd.
Media & Entertainment
2.16%
Colgate Palmolive (India) Ltd.
Consumer Non Durables
2.04%
Nestle India Ltd.Consumer Non Durables
1.99%
Indian Oil Corporation Ltd. Petroleum Products 1.97%
Container Corporation of India Ltd.
Transportation 1.86%
PNB Housing Finance Ltd. Finance 1.81%
ABB India Ltd.Industrial Capital Goods
1.66%
Bank of Baroda Banks 1.63%
Mahindra & Mahindra Ltd. Auto 1.52%
HCL Technologies Ltd. Software 1.50%
NMDC Ltd. Minerals/Mining 1.16%
Vedanta Ltd.Non - Ferrous Metals
1.11%
Cadila Healthcare Ltd. Pharmaceuticals 1.10%
Hindustan Zinc Ltd.Non - Ferrous Metals
1.04%
Adani Ports and Special Economic Zone Ltd.
Transportation 0.96%
Total 97.61%
CBLO / Reverse Repo Investments 10.00%
Total 10.00%
Cash & Cash Equivalents
Net Receivable/Payable -7.61%
Total -7.61%
Grand Total 100.00%
INDUSTRIES/RATINGS
20.87%
9.50%
9.16%
8.19%
8.16%
8.09%
5.10%
4.56%
4.21%
3.71%
3.22%
2.82%
2.44%
2.39%
2.16%
1.66%
1.50%
1.16%
1.10%
Banks
Cement
Consumer Non Durables
Petroleum Products
Non - Ferrous Metals
Auto
Construction Project
Gas
Finance
Ferrous Metals
Telecom - Services
Transportation
Auto Ancillaries
Cash & Equivalent
Media & Entertainment
Industrial Capital Goods
Software
Minerals/Mining
Pharmaceuticals
An Open Ended Equity Scheme
$ The Bonus Option in the Schemes has been discontinued effective June 08, 2015 # For performance of the Scheme and other funds managed by the said Fund manager, either individually or jointly, please refer page no 19 - 22*For Disclaimer please refer page no 22@risk free rate (FBIL Overnight MIBOR) 6.20%
8
RISk PROFILE 29 DECEMBER 2017
Standard deviation 15.30%
Sharpe@ 0.10
Beta 0.99
Portfolio Turnover (last 12 months) 1.39
NAV AS ON 29 DECEMEBER 2017
NAV (Per Unit) `
Plan AGrowth 14.1900
Dividend 13.0600
Plan B - DirectGrowth 14.6800
Dividend 13.5400
TOTAL EXPENSE RATIO
Plan A 3.23%
Plan B (Direct) 2.16%

31st December, 2017
BARODA PIONEER MUTUAL FUND
Baroda Pioneer Banking and Financial Services Fund
Investors understand that their principal will be atHigh risk
This product is suitable for investors who are seeking*• Capital appreciation over long term• Investment predominantly in equity and equity related
securities of companies engaged in the Banking & Financial Services Sector* Investors should consult their financial advisers if in doubt about whether the product is suitable for them.
INVESTMENT OBJECTIVE
The investment objective is to generate long-term capital appreciation for unit holders from a portfolio invested predominantly in equity and equity related securities of companies engaged in the Banking & Financial Services Sector.
FUND DETAILS
Type of Scheme An Open Ended Sectoral Scheme
Date of Allotment June 22, 2012
Fund Manager# Mr. Dipak Acharya(Experience 13 yrs)
Benchmark Nifty Bank Index*
Monthly Average AUM (`) 41.63 Crs
Month end AUM (`) 41.89 Crs
Minimum Investment ` 5,000/- & in multiples of ` 1/- thereafter
Entry Load NA
Exit Load Exit Load - 1.00% if redeemed on or before 365 days from the date of allotment of units, Nil if redeemed after 365 days from the date of allotment of units
Plans Plan A and Plan B (Direct)
Option A. Growth Option (default option in case no option specified by investor);B. Dividend Option 1. Payout;2. Reinvestment (default sub-option in case no option specified by investor)C. Bonus Option$
SIP (Minimum) ` 500/month - 12 Installments` 1500/quarter - 4 Installments
RISk PROFILE 29 DECEMBER 2017Standard deviation 17.87%Sharpe@ 0.13Beta 0.92Portfolio Turnover (last 12 months) 1.19
NAV AS ON 29 DECEMEBER 2017NAV (Per Unit) `Plan AGrowth 20.9200Dividend 17.7900Bonus 20.9200Plan B - DirectGrowth 21.7700Dividend 18.5700Bonus NA
TOTAL EXPENSE RATIOPlan A 3.15%Plan B (Direct) 2.49%
PORTFOLIO
Name of Instruments Ratings / Industries
% to Net Assets
EQUITY & EQUITY RELATED
Listed / awaiting listing on the stock exchanges
HDFC Bank Ltd. Banks 23.47%
ICICI Bank Ltd. Banks 10.87%
Yes Bank Ltd. Banks 9.78%
Bharat Financial Inclusion Ltd. Finance 9.55%
State Bank of India Banks 8.14%
Kotak Mahindra Bank Ltd. Banks 6.63%
The Federal Bank Ltd. Banks 3.47%
Mahindra & Mahindra Financial Services Ltd.
Finance 3.39%
City Union Bank Ltd. Banks 3.01%
Axis Bank Ltd. Banks 2.69%
Bank of Baroda Banks 2.69%
Bajaj Finserv Ltd. Finance 2.50%
Cholamandalam Investment and Finance Company Ltd.
Finance 2.33%
IIFL Holdings Ltd. Finance 1.75%
Shriram Transport Finance Company Ltd.
Finance 1.41%
The Karnataka Bank Ltd. Banks 1.36%
Central Depository Services (I) Ltd.
Finance 1.28%
The South Indian Bank Ltd. Banks 1.11%
The Jammu & Kashmir Bank Ltd.
Banks 1.03%
Union Bank of India Banks 0.98%
Syndicate Bank Banks 0.68%
Karur Vysya Bank Ltd. Banks 0.38%
Total 98.50%
CBLO / Reverse Repo Investments 2.02%
Total 2.02%
Cash & Cash Equivalents
Net Receivable/Payable -0.52%
Total -0.52%
Grand Total 100.00%
INDUSTRIES/RATINGS
76.29%
22.21%
1.50%
Banks
Finance
Cash & Equivalent
An Open Ended Sectoral Scheme
$ The Bonus Option in the Schemes has been discontinued effective June 08, 2015 # For performance of the Scheme and other funds managed by the said Fund manager, either individually or jointly, please refer page no 19 - 22*For Disclaimer please refer page no 22@risk free rate (FBIL Overnight MIBOR) 6.20%
9

31st December, 2017
BARODA PIONEER MUTUAL FUND
Baroda Pioneer Balance Fund
Investors understand that their principal will be at Moderately High risk
This product is suitable for investors who are seeking*• Capital appreciation along with stability over long term• Investment predominantly in equity and equity related
instruments with balance exposure to money market instruments and debt securities.* Investors should consult their financial advisers if in doubt about whether the product is suitable for them.
INVESTMENT OBJECTIVE
The scheme is targeted for long-term capital appreciation along with stability through a well balanced portfolio comprising of equity, equity related instruments, money market instrument and debt securities.
FUND DETAILS
Type of Scheme An Open Ended Balanced Scheme
Date of Allotment September 12, 2003
Fund Manager# Mr. Sanjay Chawla& (Experience 29 yrs) Mr. Dipak Acharya (Experience 13 yrs)
Benchmark CRISIL Balanced Fund Aggressive index(effective April 4, 2016)
Monthly Average AUM (`) 481.02 CrsMonth end AUM (`) 527.60 Crs
Minimum Investment ` 5,000/- & in multiples of ` 1/- thereafter
Entry Load NA
Exit Load 1% if redeemed on or before 12 months from the date of allotment of units, Nil if redeemed after 12 months from the date of allotment of units
Plans Plan A and Plan B (Direct)
Option A. Growth Option (default option in case no option specified by investor);B. Dividend Option 1. Payout;2. Reinvestment (default sub-option in case no option specified by investor)C. Bonus Option$
SIP (Minimum) ` 500/month - 12 Installments` 1500/quarter - 4 Installments
RISk PROFILE 29 DECEMBER 2017Standard deviation 10.94%Sharpe@ 0.53Beta 1.08Portfolio Turnover (last 12 months) 1.47
NAV AS ON 29 DECEMEBER 2017NAV (Per Unit) `Plan AGrowth 58.1100Dividend 19.6100Bonus NAPlan B - DirectGrowth 61.4200Dividend 21.3900
TOTAL EXPENSE RATIOPlan A 2.92%Plan B (Direct) 1.22%
$ The Bonus Option in the Schemes has been discontinued effective June 08, 2015 # For performance of the Scheme and other funds managed by the said Fund manager, either individually or jointly, please refer page no 19 - 22@risk free rate (FBIL Overnight MIBOR) 6.20% & Mr. Chawla is managing the Scheme along with Mr. Acharya effective November 1, 2015
PORTFOLIO
Name of Instruments Ratings / Industries
% to Net
Assets
EQUITY & EQUITY RELATED
Listed / awaiting listing on the stock exchanges
HDFC Bank Ltd. Banks 5.32%
Maruti Suzuki India Ltd. Auto 3.32%
Kansai Nerolac Paints Ltd.Consumer Non Durables
2.78%
Yes Bank Ltd. Banks 2.51%
Mahindra & Mahindra Financial Services Ltd.
Finance 2.38%
ICICI Bank Ltd. Banks 2.26%
Hindalco Industries Ltd.Non - Ferrous Metals
2.26%
Tata Steel Ltd. Ferrous Metals 2.08%
Ambuja Cements Ltd. Cement 2.06%
The Federal Bank Ltd. Banks 2.06%
Cholamandalam Investment and Finance Company Ltd.
Finance 1.97%
Bata India Ltd.Consumer Durables
1.91%
Pidilite Industries Ltd. Chemicals 1.88%
NBCC (India) Ltd. Construction 1.87%
Motherson Sumi Systems Ltd. Auto Ancillaries 1.87%
Petronet LNG Ltd. Gas 1.83%
Whirlpool of India Ltd.Consumer Durables
1.81%
GAIL (India) Ltd. Gas 1.80%
KEC International Ltd.Construction Project
1.78%
Indraprastha Gas Ltd. Gas 1.59%Container Corporation of India Ltd.
Transportation 1.57%
WABCO India Ltd. Auto Ancillaries 1.53%
Carborundum Universal Ltd. Industrial Products 1.50%
Security and Intelligence Services (I) Ltd.
Commercial Services
1.39%
Bharat Financial Inclusion Ltd. Finance 1.33%
Rallis India Ltd. Pesticides 1.32%
Bharti Airtel Ltd. Telecom - Services 1.31%
Bajaj Finserv Ltd. Finance 1.29%
Bharat Forge Ltd. Industrial Products 1.25%
State Bank of India Banks 1.17%
Bajaj Electricals Ltd.Consumer Durables
1.13%
Ashok Leyland Ltd. Auto 1.13%Shriram Transport Finance Company Ltd.
Finance 1.12%
Supreme Industries Ltd. Industrial Products 1.10%
Apollo Tyres Ltd. Auto Ancillaries 1.09%
City Union Bank Ltd. Banks 1.02%Central Depository Services (I) Ltd.
Finance 1.02%
The South Indian Bank Ltd. Banks 0.71%
MRF Ltd. Auto Ancillaries 0.69%
Grasim Industries Ltd. Cement 0.66%
Larsen & Toubro Ltd.Construction Project
0.55%
NMDC Ltd. Minerals/Mining 0.52%
Emami Ltd.Consumer Non Durables
0.51%
HCL Technologies Ltd. Software 0.51%
Hindustan Zinc Ltd.Non - Ferrous Metals
0.44%
GMR Infrastructure Ltd.Construction Project
0.34%
Syndicate Bank Banks 0.18%
Total 71.72%
CENTRAL GOVERNMENT SECURITIES
07.61% CGL 2030 Sovereign 0.95%
PORTFOLIO
Name of Instruments Ratings / Industries
% to Net
Assets
07.88% CGL 2030 Sovereign 0.35%08.24% CGL 2027 Sovereign 0.26%08.83% CGL 2023 Sovereign 0.10%08.60% CGL 2028 Sovereign 0.02%08.28% CGL 2027 Sovereign 0.02%
Total 1.70%
STATE GOVERNMENT SECURITIES
09.72% SDL 2023 Sovereign 0.62%
Total 0.62%
BONDS & NCDs
Listed / awaiting listing on the stock exchanges
HDFC Bank Ltd. CRISIL AA+ 3.80%
ICICI Bank Ltd. [ICRA]AA+ 2.87%
Yes Bank Ltd. [ICRA]AA 2.77%
Bank of Baroda CRISIL AA+ 2.62%
PNB Housing Finance Ltd. IND AAA 2.07%
Edelweiss Commodities Services Ltd.
CARE AA 1.92%
Indian Railway Finance Corporation Ltd.
CRISIL AAA 1.89%
Vijaya Bank [ICRA]AA- 0.96%
Dewan Housing Finance Corporation Ltd.
BWR AAA 0.39%
Total 19.29%
Unlisted
IIFL Wealth Finance Ltd. [ICRA]AA 1.95%
Total 1.95%
CBLO / Reverse Repo Investments 3.87%
Total 3.87%
Cash & Cash Equivalents
Net Receivable/Payable 0.85%
Total 0.85%
Grand Total 100.00%
All corporate ratings are assigned by rating agencies like CRISIL; CARE; ICRA; IND.
INDUSTRIES/RATINGS
15.23%9.11%
6.42%5.22%5.18%4.85%4.72%4.72%4.45%
3.85%3.29%2.87%2.72%2.70%2.67%2.32%2.08%2.07%1.92%1.89%1.88%1.87%1.57%1.39%1.32%1.31%0.96%0.52%0.51%0.39%
BanksFinance
CRISIL AA+Gas
Auto AncillariesConsumer Durables
Cash & Equivalent[ICRA]AA
AutoIndustrial Products
Consumer Non Durables[ICRA]AA+
CementNon - Ferrous MetalsConstruction Project
SovereignFerrous Metals
IND AAACARE AA
CRISIL AAAChemicals
ConstructionTransportation
Commercial ServicesPesticides
Telecom - Services[ICRA]AA-
Minerals/MiningSoftware
BWR AAA
An Open Ended Balanced Scheme
10

31st December, 2017
BARODA PIONEER MUTUAL FUND
Baroda Pioneer Monthly Income Plan (MIP) Fund
Investors understand that their principal will be at Moderate risk
This product is suitable for investors who are seeking*• Regular Income and capital appreciation over medium
term with providing liquidity• Investment in debt and money market instruments and
in equity and equity related instruments.* Investors should consult their financial advisers if in doubt about whether the product is suitable for them.
INVESTMENT OBJECTIVE
To generate regular income through investment in debt and money market instruments and also to generate long-term capital appreciation by investing a portion in equity and equity related instruments.
FUND DETAILS
Type of Scheme An Open Ended Income Scheme with no assured returns.
Date of Allotment September 08, 2004
Fund Manager Ms. Hetal Shah#
(Experience 15 yrs)
Benchmark CRISIL MIP Blended Index
Monthly Average AUM (`) 27.26 Crs
Month end AUM (`) 26.44 Crs
Minimum Investment ` 5,000/- & in multiples of ` 1/- thereafter
Entry Load NA
Exit Load NIL
Plans Plan A and Plan B (Direct)
Options • Growth (default option in case no option specified by investor);• Monthly Dividend (default) 1. Payout 2. Reinvestment (default sub-option in case no option specified by investor)• Quarterly Dividend 1. Payout 2. Reinvestment (default sub-option in case no option specified by investor)• Bonus Option$
SIP (Minimum) ` 500/month - 12 Installments` 1500/quarter - 4 Installments
NAV AS ON 29 DECEMEBER 2017
NAV (Per Unit) `Plan AGrowth 22.3253Dividend - Monthly 13.6611Dividend - Quarterly 13.4790Plan B - Direct
Growth 23.2646Dividend - Monthly 14.0243Dividend - Quarterly 13.8724
PORTFOLIO CHARACTERISTIC
Average Maturity (Days) 3398.79Modified Duration (Years) 6.05Portfolio Yield (%) 7.63
TOTAL EXPENSE RATIO
Plan A 2.37%Plan B (Direct) 1.37%
$ The Bonus Option in the Schemes has been discontinued effective June 08, 2015 # For performance of the Scheme and other funds managed by the said Fund manager, either individually or jointly, please refer page no 19 - 22
PORTFOLIO
Name of Instruments Ratings / Industries
% to Net
Assets
EQUITY & EQUITY RELATEDListed / awaiting listing on the stock exchangesHDFC Bank Ltd. Banks 1.42%
MRF Ltd. Auto Ancillaries 1.37%
Kansai Nerolac Paints Ltd.Consumer Non Durables
1.20%
ICICI Bank Ltd. Banks 1.19%
Mahindra & Mahindra Financial Services Ltd.
Finance 1.16%
Hindalco Industries Ltd.Non - Ferrous Metals
1.03%
Britannia Industries Ltd.Consumer Non Durables
0.89%
GAIL (India) Ltd. Gas 0.76%
Maruti Suzuki India Ltd. Auto 0.74%
Tata Steel Ltd. Ferrous Metals 0.69%
Pidilite Industries Ltd. Chemicals 0.68%
BEML Ltd.Industrial Capital Goods
0.61%
Carborundum Universal Ltd.Industrial Products
0.57%
Ashok Leyland Ltd. Auto 0.54%
Can Fin Homes Ltd. Finance 0.54%
Apollo Tyres Ltd. Auto Ancillaries 0.53%
NMDC Ltd. Minerals/Mining 0.52%
Bharti Airtel Ltd.Telecom - Services
0.50%
National Aluminium Company Ltd.
Non - Ferrous Metals
0.49%
Nestle India Ltd.Consumer Non Durables
0.45%
Gujarat State Fertilizers & Chemicals Ltd.
Fertilisers 0.44%
PC Jeweller Ltd.Consumer Durables
0.43%
Petronet LNG Ltd. Gas 0.39%
IIFL Holdings Ltd. Finance 0.38%
Container Corporation of India Ltd.
Transportation 0.37%
Yes Bank Ltd. Banks 0.36%
Ambuja Cements Ltd. Cement 0.31%
Rallis India Ltd. Pesticides 0.30%
The Federal Bank Ltd. Banks 0.29%
Tata Sponge Iron Ltd. Ferrous Metals 0.28%
Total 19.43%
CENTRAL GOVERNMENT SECURITIES
06.68% CGL 2031 Sovereign 17.70%
08.60% CGL 2028 Sovereign 12.16%
07.61% CGL 2030 Sovereign 11.33%
07.88% CGL 2030 Sovereign 9.66%
07.59% CGL 2026 Sovereign 3.82%
08.24% CGL 2027 Sovereign 1.97%
07.59% CGL 2029 Sovereign 1.89%
Total 58.53%
BONDS & NCDs
Listed / awaiting listing on the stock exchanges
IndusInd Bank Ltd. CRISIL AA 3.81%
Tata Capital Financial Services Ltd.
[ICRA]AA+ 3.75%
India Infoline Housing Finance Ltd.
[ICRA]AA 3.03%
IIFL Facilities Services Ltd. [ICRA]AA 2.46%
PORTFOLIO
Name of Instruments Ratings / Industries
% to Net
Assets
Power Grid Corporation of India Ltd.
CRISIL AAA 2.37%
Total 15.42%
CBLO / Reverse Repo Investments 3.22%
Total 3.22%
Cash & Cash Equivalents
Net Receivable/Payable 3.40%
Total 3.40%
Grand Total 100.00%
All corporate ratings are assigned by rating agencies like CRISIL; CARE; ICRA; IND.
RATING PROFILE
58.53%6.62%5.49%3.81%3.75%3.26%2.54%2.37%2.08%1.90%1.52%1.28%1.15%0.97%0.68%0.61%0.57%0.52%0.50%0.44%0.43%0.37%0.31%0.30%
SovereignCash & Equivalent
[ICRA]AACRISIL AA
[ICRA]AA+Banks
Consumer Non DurablesCRISIL AAA
FinanceAuto Ancillaries
Non - Ferrous MetalsAutoGas
Ferrous MetalsChemicals
Industrial Capital GoodsIndustrial Products
Minerals/MiningTelecom - Services
FertilisersConsumer Durables
TransportationCement
Pesticides
INSTRUMENTS
58.53%
19.43%
15.42%
3.40% 3.22% CENTRALGOVERNMENTSECURITIES
EQUITY & EQUITYRELATED
BONDS & NCDs
Cash & CashEquivalents
CBLO / Reverse RepoInvestments
An Open Ended Income Scheme with no assured returns.(Monthly income is not assured and is subject to the availability of distributable surplus.)
11

31st December, 2017
BARODA PIONEER MUTUAL FUND
Baroda Pioneer Credit Opportunities Fund
Investors understand that their principal will be at Moderate risk
This product is suitable for investors who are seeking*• Income over medium term.• Investment in a mix of debt and money market
instruments across the credit and maturity spectrum.* Investors should consult their financial advisers if in doubt about whether the product is suitable for them.
INVESTMENT OBJECTIVE
The primary objective of the Scheme is to generate returns by investing in debt and money market instruments across the credit spectrum. There is no assurance or guarantee that the investment objective of the Scheme will be realized.
FUND DETAILS
Type of Scheme An Open Ended Debt SchemeDate of Allotment January 23, 2015Fund Manager Mr. Alok Sahoo#
(Experience 17 yrs), Mr. Karn Kumar&
(Experience 13 yrs)Benchmark CRISIL Short Term Bond Fund
IndexMonthly Average AUM (`)
916.41 Crs
Month end AUM (`) 914.91 CrsMinimum Investment ` 5,000/- & in multiples of ` 1/-
thereafterEntry Load NAExit Load If units are redeemed upto 10%
of the units, on or before one year from the date of allotment : Nil If units are redeemed over and above the 10% limit, on or before one year from the date of allotment : 1% of the applicable Net Asset Value (NAV) If units are redeemed after one year from the date of allotment : Nil
Plans Plan A and Plan B (Direct)Options • Growth (default option in case no
option specified by investor);• Monthly Dividend 1.Payout 2.Reinvestment (default sub-option in case no option specified by investor)• Quarterly Dividend 1.Payout 2.Reinvestment (default sub-option in case no option specified by investor)• Bonus Option$
SIP (Minimum) ` 500/month - 12 Installments` 1500/quarter - 4 Installments
PORTFOLIO CHARACTERISTIC
Average Maturity (Days) 985.46Modified Duration (Years) 2.13Portfolio Yield (%) 8.85
TOTAL EXPENSE RATIO
Plan A 1.83%Plan B (Direct) 0.80%
$ The Bonus Option in the Schemes has been discontinued effective June 08, 2015 # For performance of the Scheme and other funds, if any, managed by the said Fund manager, either individually or jointly, please refer page no 19 - 22& Mr. Karn Kumar is managing the Scheme along with Mr. Alok Sahoo effective July 24, 2017
PORTFOLIO
Name of Instruments Ratings / Industries
% to Net
Assets
MONEY MARkET INSTRUMENT
Commercial Paper**
Peninsula Land Ltd. [ICRA]A1 6.43%
Adani Enterprises Ltd. BWR A1+ 2.70%
Total 9.13%
CENTRAL GOVERNMENT SECURITIES
06.68% CGL 2031 Sovereign 1.02%
08.40% CGL 2024 Sovereign 0.34%
07.61% CGL 2030 Sovereign 0.11%
Total 1.47%
BONDS & NCDsListed / awaiting listing on the stock exchanges
Piramal Enterprises Ltd. [ICRA]AA 7.64%
Apollo Hospitals Enterprise Ltd. CRISIL AA 7.51%
Edelweiss Commodities Services Ltd.
[ICRA]AA 6.10%
Aspire Home Finance Corporation Ltd.
[ICRA]AA- 5.68%
IndusInd Bank Ltd. CRISIL AA 4.95%
Dewan Housing Finance Corporation Ltd.
BWR AAA 4.37%
IIFL Facilities Services Ltd. [ICRA]AA 4.20%
India Infoline Housing Finance Ltd.
CRISIL AA 3.90%
Edelweiss Housing Finance Ltd. [ICRA]AA 2.86%
Edelweiss Commodities Services Ltd.
CARE AA 2.77%
ICICI Bank Ltd. [ICRA]AA+ 2.76%
Indiabulls Housing Finance Ltd. BWR AAA 2.24%
Indiabulls Housing Finance Ltd. CARE AAA 1.66%
Indian Railway Finance Corporation Ltd.
CRISIL AAA 1.24%
Bank of Baroda CRISIL AA+ 1.18%
Edelweiss Asset Reconstruction Company Ltd.
[ICRA]AA 1.10%
HDFC Bank Ltd. CRISIL AA+ 1.09%
Yes Bank Ltd. [ICRA]AA 1.07%
Janalakshmi Financial Services Ltd. [ICRA]A- 0.65%
JSW Steel Ltd. CARE AA- 0.56%
Bank of Baroda CARE AA 0.11%
Total 63.64%
UnlistedARM Infra & Utilities Private Ltd. BWR A1+ (SO) 6.52%
IIFL Wealth Finance Ltd. [ICRA]AA 4.49%
Cyquator Media Services Private Ltd.
BWR A1+ (SO) 4.37%
Janalakshmi Financial Services Ltd. [ICRA]A- 1.92%
Powergrid Vizag Transmission Ltd.
CRISIL AAA (SO)
1.12%
Total 18.42%
Investment Funds/Mutual FundsBaroda Pioneer Liquid Fund - Plan B (Direct) - Growth Option
[ICRA]A1+mfs 3.28%
Total 3.28%
CBLO /Reverse Repo investments 1.39%
Total 1.39%
Cash & Cash Equivalents
Net Receivable/Payable 2.67%
Total 2.67%
Grand Total 100.00%
All corporate ratings are assigned by rating agencies like CRISIL; CARE; ICRA; IND.**Thinly traded / Non traded securities and illiquid securities as defined in SEBI Regulations and Guidelines.
RATING PROFILE
27.46%
16.36%
10.89%
6.61%
6.43%
5.68%
4.06%
3.28%
2.88%
2.76%
2.70%
2.57%
2.27%
1.66%
1.47%
1.24%
1.12%
0.56%
[ICRA]AA
CRISIL AA
BWR A1+ (SO)
BWR AAA
[ICRA]A1
[ICRA]AA-
Cash & Equivalent
[ICRA]A1+mfs
CARE AA
[ICRA]AA+
BWR A1+
[ICRA]A-
CRISIL AA+
CARE AAA
Sovereign
CRISIL AAA
CRISIL AAA (SO)
CARE AA-
INSTRUMENTS
63.64%
18.42%
9.13%
3.28%2.67%
1.47%1.39%
BONDS & NCDsUnlistedMONEY MARKETINSTRUMENTInvestmentFunds/Mutual FundsCash & CashEquivalentsCENTRALGOVERNMENTSECURITIESCBLO / Reverse RepoInvestments
NAV AS ON 29 DECEMEBER 2017
NAV (Per Unit) `Plan ABonus NAGrowth 13.2367Dividend - Quarterly 10.8913Dividend - Monthly 10.8076Plan B - Direct
Bonus 13.7132Growth 13.7132Dividend - Quarterly 11.2929Dividend - Monthly 11.2656
An Open Ended Debt Scheme
12

31st December, 2017
BARODA PIONEER MUTUAL FUND
Baroda Pioneer Gilt Fund
Investors understand that their principal will be at Moderate risk
This product is suitable for investors who are seeking*
• Credit risk free regular Income over long term
• Investment only in Government (both Central and State Government) Securities* Investors should consult their financial advisers if in doubt about whether the product is suitable for them.
INVESTMENT OBJECTIVE
To generate income by investing in a portfolio of Government securities.
FUND DETAILS
Type of Scheme An Open Ended Gilt SchemeDate of Allotment March 21, 2002Fund Manager Ms. Hetal Shah#
(Experience 15 yrs)
Benchmark I SEC-MI BEXMonthly Average AUM (`)
46.00 Crs
Month end AUM (`) 45.63 CrsMinimum Investment ` 5,000/- & in multiples of ` 1/-
thereafterEntry Load NAExit Load 0.25% if redeemed on or before
1 month (30 days) from the date of allotment of units. Nil if redeemed after 1 month (30 days) from the date of allotment of units
Plans Plan A and Plan B (Direct)Options • Growth (default option in case no
option specified by investor);• Dividend 1 .Payout 2 .Reinvestment (default sub-option in case no option specified by investor)• Bonus Option$
SIP (Minimum) ` 500/month - 12 Installments` 1500/quarter - 4 Installments
NAV AS ON 29 DECEMEBER 2017
NAV (Per Unit) `Plan AGrowth 26.4020Dividend 20.2344Plan B - DirectGrowth 27.6297Dividend 23.9197
PORTFOLIO CHARACTERISTIC
Average Maturity (Days) 3147.43Modified Duration (Years) 5.61Portfolio Yield (%) 7.35
TOTAL EXPENSE RATIO
Plan A 1.97%
Plan B (Direct) 1.16%
PORTFOLIO
Name of Instruments Ratings / Industries
% to Net Assets
CENTRAL GOVERNMENT SECURITIES
07.59% CGL 2029 Sovereign 17.13%
07.61% CGL 2030 Sovereign 13.13%
06.68% CGL 2031 Sovereign 10.26%
07.88% CGL 2030 Sovereign 9.99%
08.24% CGL 2027 Sovereign 7.32%
08.28% CGL 2027 Sovereign 5.51%
08.83% CGL 2023 Sovereign 2.82%
08.60% CGL 2028 Sovereign 1.64%
07.59% CGL 2026 Sovereign 1.11%
Total 68.91%
STATE GOVERNMENT SECURITIES
09.39% SDL 2023 Sovereign 5.91%
Total 5.91%
CBLO / Reverse Repo Investments 22.20%
Total 22.20%
Cash & Cash Equivalents
Net Receivable/Payable 2.98%
Total 2.98%
Grand Total 100.00%
RATING PROFILE
74.82%
25.18%
Sovereign
Cash & Equivalent
INSTRUMENTS
68.91%
22.20%
5.91% 2.98% CENTRALGOVERNMENTSECURITIES
CBLO / Reverse RepoInvestments
STATE GOVERNMENTSECURITIES
Cash & CashEquivalents
$ The Bonus Option in the Schemes has been discontinued effective June 08, 2015 # For performance of the Scheme and other funds managed by the said Fund manager, either individually or jointly, please refer page no 19 - 22
An Open Ended Gilt Scheme
13

31st December, 2017
BARODA PIONEER MUTUAL FUND
Baroda Pioneer Income Fund
Investors understand that their principal will be at Moderate risk
This product is suitable for investors who are seeking*• Regular Income over long term• Investment predominantly in good quality Fixed Income
Securities by maintaining a balance between Risk & Return.* Investors should consult their financial advisers if in doubt about whether the product is suitable for them.
INVESTMENT OBJECTIVE
To generate regular income by investing in a portfolio of good quality Fixed Income Securities by maintaining a balance between Risk & Return.
FUND DETAILS
Type of Scheme An Open Ended Income SchemeDate of Allotment March 21, 2002Fund Manager Ms. Hetal Shah#
(Experience 15 yrs)
Benchmark CRISIL Composite Bond Fund IndexMonthly Average AUM (`)
22.07 Crs
Month end AUM (`) 21.88 CrsMinimum Investment ` 5,000/- & in multiples of ` 1/-
thereafterEntry Load NAExit Load If units are redeemed upto 10%
of the units, on or before one year from the date of allotment : NilIf units are redeemed over and above the 10% limit, on or before one year from the date of allotment : 1% of the applicable Net Asset Value (NAV)If units are redeemed after one year from the date of allotment : Nil
Plans Plan A and Plan B (Direct)Options • Growth (default option in case no
option specified by investor);• Dividend 1.Payout 2.Reinvestment (default sub-option in case no option specified by investor)• Bonus Option$
SIP (Minimum) ` 500/month - 12 Installments` 1500/quarter - 4 Installments
NAV AS ON 29 DECEMEBER 2017
NAV (Per Unit) `Plan AGrowth 26.0362Dividend 22.9182Plan B - DirectGrowth 27.1076Dividend 23.2186
PORTFOLIO CHARACTERISTIC
Average Maturity (Days) 2384.67Modified Duration (Years) 4.73Portfolio Yield (%) 7.94
TOTAL EXPENSE RATIO
Plan A 2.52%Plan B (Direct) 1.88%
PORTFOLIO
Name of Instruments Ratings / Industries
% to Net Assets
CENTRAL GOVERNMENT SECURITIES
07.59% CGL 2026 Sovereign 11.53%
08.40% CGL 2024 Sovereign 9.60%
07.88% CGL 2030 Sovereign 9.34%
08.83% CGL 2023 Sovereign 8.83%
08.60% CGL 2028 Sovereign 4.41%
07.59% CGL 2029 Sovereign 2.29%
Total 46.00%
STATE GOVERNMENT SECURITIES
09.35% SDL 2024 Sovereign 3.72%
08.58% SDL 2023 Sovereign 3.37%
09.39% SDL 2023 Sovereign 2.13%
08.60% SDL 2023 Sovereign 0.64%
Total 9.86%
BONDS & NCDs
Listed / awaiting listing on the stock exchanges
IndusInd Bank Ltd. CRISIL AA 9.20%
Edelweiss Commodities Services Ltd.
[ICRA]AA 9.11%
Dewan Housing Finance Corporation Ltd.
BWR AAA 8.37%
Indian Railway Finance Corporation Ltd.
CRISIL AAA 8.22%
Total 34.90%
CBLO / Reverse Repo Investments 6.90%
Total 6.90%
Cash & Cash Equivalents
Net Receivable/Payable 2.34%
Total 2.34%
Grand Total 100.00%
All corporate ratings are assigned by rating agencies like CRISIL; CARE; ICRA; IND.
RATING PROFILE
55.86%
9.24%
9.20%
9.11%
8.37%
8.22%
Sovereign
Cash & Equivalent
CRISIL AA
[ICRA]AA
BWR AAA
CRISIL AAA
INSTRUMENTS
46.00%
34.90%
9.86%
6.90%2.34% CENTRAL
GOVERNMENTSECURITIESBONDS & NCDs
STATE GOVERNMENTSECURITIES
CBLO / Reverse RepoInvestments
Cash & CashEquivalents
$ The Bonus Option in the Schemes has been discontinued effective June 08, 2015# For performance of the Scheme and other funds managed by the said Fund manager, either individually or jointly, please refer page no 19 - 22
An Open Ended Income Scheme
14

31st December, 2017
BARODA PIONEER MUTUAL FUND
Baroda Pioneer Dynamic Bond Fund
Investors understand that their principal will be at Moderate risk
This product is suitable for investors who are seeking*• Regular Income over medium term with providing
liquidity• Investment in medium to long term corporate bonds
and / or government securities and manage the portfolio dynamically through different interest rate cycles* Investors should consult their financial advisers if in doubt about whether the product is suitable for them.
INVESTMENT OBJECTIVE
The investment objective of the scheme is to generate returns with liquidity by managing the portfolio dynamically through interest rate cycles.
FUND DETAILS
Type of Scheme An Open Ended Income Scheme
Date of Allotment June 30, 2012
Fund Manager Mr. Alok Sahoo# (Experience 17 yrs), Ms. Hetal Shah# (Experience 15 yrs)
Benchmark CRISIL Composite Bond Fund Index
Monthly Average AUM (`) 21.24 Crs
Month end AUM (`) 21.17 Crs
Minimum Investment ` 5,000/- & in multiples of ` 1/- thereafter
Entry Load NA
Exit Load 0.50% if redeemed within 3 months from the date of allotment of units, Nil if redeemed after 3 months from the date of allotment of units
Plans Plan A and Plan B (Direct)
Options • Growth (default option in case no option specified by investor);• Dividend 1. Payout 2. Reinvestment (default sub-option in case no option specified by investor)• Bonus Option$
SIP (Minimum) ` 500/month - 12 Installments` 1500/quarter - 4 Installments
NAV AS ON 29 DECEMEBER 2017
NAV (Per Unit) `Plan AGrowth 16.1719Dividend 13.3327Plan B - DirectGrowth 16.8504Dividend 13.9819
PORTFOLIO CHARACTERISTIC
Average Maturity (Days) 1851.92Modified Duration (Years) 3.63Portfolio Yield (%) 7.91
TOTAL EXPENSE RATIO
Plan A 1.62%
Plan B (Direct) 1.09%
PORTFOLIO
Name of Instruments Ratings / Industries
% to Net Assets
CENTRAL GOVERNMENT SECURITIES
08.28% CGL 2027 Sovereign 12.37%
08.83% CGL 2023 Sovereign 7.60%
07.59% CGL 2029 Sovereign 5.68%
07.59% CGL 2026 Sovereign 4.76%
08.60% CGL 2028 Sovereign 1.52%
Total 31.93%
STATE GOVERNMENT SECURITIES
09.72% SDL 2023 Sovereign 10.30%
Total 10.30%
BONDS & NCDs
Listed / awaiting listing on the stock exchanges
Dewan Housing Finance Corporation Ltd.
BWR AAA 9.61%
Indian Railway Finance Corporation Ltd.
CRISIL AAA 8.49%
Janalakshmi Financial Services Ltd.
[ICRA]A- 8.47%
IndusInd Bank Ltd. CRISIL AA 4.75%
Total 31.32%
CBLO / Reverse Repo Investments 24.41%
Total 24.41%
Cash & Cash Equivalents
Net Receivable/Payable 2.04%
Total 2.04%
Grand Total 100.00%
All corporate ratings are assigned by rating agencies like CRISIL; CARE; ICRA; IND.
RATING PROFILE
42.23%
26.45%
9.61%
8.49%
8.47%
4.75%
Sovereign
Cash & Equivalent
BWR AAA
CRISIL AAA
[ICRA]A-
CRISIL AA
INSTRUMENTS
31.93%
31.32%
24.41%
10.30%2.04% CENTRAL
GOVERNMENTSECURITIES
BONDS & NCDs
CBLO / Reverse RepoInvestments
STATEGOVERNMENTSECURITIES
Cash & CashEquivalents
$ The Bonus Option in the Schemes has been discontinued effective June 08, 2015 # For performance of the Scheme and other funds managed by the said Fund manager, either individually or jointly, please refer page no 19 - 22
An Open Ended Income Scheme
15
31st December, 2017
BARODA PIONEER MUTUAL FUND
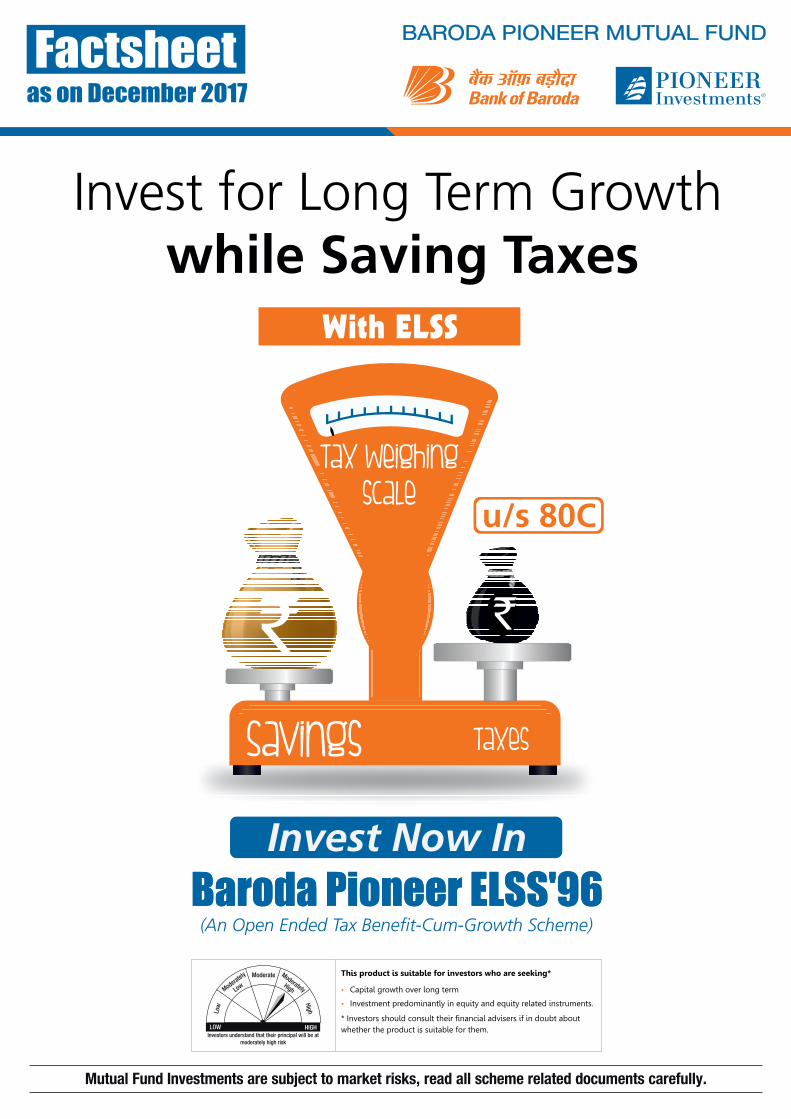
Baroda Pioneer Short Term Bond Fund
Investors understand that their principal will be at Moderately Low risk
This product is suitable for investors who are seeking*• Regular Income over short term• Investment predominantly in Money Market Instruments
(i.e. CP/CD) and Short Term Debt Market Instruments* Investors should consult their financial advisers if in doubt about whether the product is suitable for them.
INVESTMENT OBJECTIVE
The objective of the Scheme is to generate income from a portfolio constituted of short term debt and money market securities.
FUND DETAILS
Type of Scheme An Open Ended Income Scheme
Date of Allotment June 30, 2010
Fund Manager Mr. Alok Sahoo# (Experience 17 yrs), Ms. Hetal Shah# (Experience 15 yrs)
Benchmark CRISIL Short Term Bond Fund Index
Monthly Average AUM (`) 531.90 Crs
Month end AUM (`) 376.54 Crs
Minimum Investment ` 5,000/- & in multiples of ` 1/- thereafter
Entry Load NA
Exit Load 0.25% if redeemed on or before 15 days from the date of allotment of units. Nil if redeemed after 15 days from the date of allotment of units
Plans Plan A and Plan B (Direct)
Options • Growth (default option in case no option specified by investor);• Monthly Dividend^ 1. Payout 2. Reinvestment (default sub-option in case no option specified by investor)• Quarterly Dividend^ 1. Payout 2. Reinvestment (default sub-option in case no option specified by investor)
SIP (Minimum) ` 500/month - 12 Installments` 1500/quarter - 4 Installments
NAV AS ON 29 DECEMEBER 2017
NAV (Per Unit) `Plan AGrowth 18.1261Dividend 10.0578Plan B - DirectGrowth 18.6797Dividend 10.0383
PORTFOLIO CHARACTERISTIC
Average Maturity (Days) 671.67Modified Duration (Years) 1.57Portfolio Yield (%) 8.72
TOTAL EXPENSE RATIO
Plan A 1.25%
Plan B (Direct) 0.57%
PORTFOLIO
Name of Instruments Ratings / Industries
% to Net Assets
MONEY MARkET INSTRUMENT
Commercial Paper**
Peninsula Land Ltd. [ICRA]A1 1.83%
Total 1.83%
BONDS & NCDs
Listed / awaiting listing on the stock exchanges
Piramal Enterprises Ltd. [ICRA]AA 9.29%
Indiabulls Housing Finance Ltd. CARE AAA 8.05%
Power Finance Corporation Ltd.
CRISIL AAA 7.92%
Manappuram Finance Ltd. CRISIL AA- 7.54%
Dewan Housing Finance Corporation Ltd.
BWR AAA 6.74%
L&T Finance Ltd. [ICRA]AA+ 6.62%
Tata Capital Financial Services Ltd.
[ICRA]AA+ 6.32%
PNB Housing Finance Ltd. IND AAA 6.32%
Edelweiss Commodities Services Ltd.
CARE AA 5.93%
Housing Development Finance Corporation Ltd.
CRISIL AAA 5.36%
Edelweiss Commodities Services Ltd.
[ICRA]AA 3.97%
Edelweiss Asset Reconstruction Company Ltd.
[ICRA]AA 3.48%
Aspire Home Finance Corporation Ltd.
CRISIL A+ 2.41%
Janalakshmi Financial Services Ltd.
[ICRA]A- 1.90%
India Infoline Finance Ltd. [ICRA]AA 1.66%
Aspire Home Finance Corporation Ltd.
[ICRA]AA- 1.09%
Power Grid Corporation of India Ltd.
CRISIL AAA 0.13%
Total 84.73%
Unlisted
IIFL Wealth Finance Ltd. [ICRA]AA 6.82%
Janalakshmi Financial Services Ltd.
[ICRA]A- 1.81%
Total 8.63%
CBLO / Reverse Repo Investments 0.60%
Total 0.60%
Cash & Cash Equivalents
Net Receivable/Payable 4.21%
Total 4.21%
Grand Total 100.00%
All corporate ratings are assigned by rating agencies like CRISIL; CARE; ICRA; IND.**Thinly traded / Non traded securities and illiquid securities as defined in SEBI Regulations and Guidelines.
RATING PROFILE
25.22%
13.41%
12.94%
8.05%
7.54%
6.74%
6.32%
5.93%
4.81%
3.71%
2.41%
1.83%
1.09%
[ICRA]AA
CRISIL AAA
[ICRA]AA+
CARE AAA
CRISIL AA-
BWR AAA
IND AAA
CARE AA
Cash & Equivalent
[ICRA]A-
CRISIL A+
[ICRA]A1
[ICRA]AA-
INSTRUMENTS
84.73%
8.63%
4.21%1.83%
0.60%BONDS & NCDs
Unlisted
Cash & CashEquivalents
MONEY MARKETINSTRUMENT
CBLO / Reverse RepoInvestments
An Open Ended Income Scheme
^ The Dividend Option has been renamed as Monthly Dividend Option and a Quarterly Dividend Option has been introduced effective December 23, 2016.$ The Bonus Option in the Schemes has been discontinued effective June 08, 2015 # For performance of the Scheme and other funds managed by the said Fund manager, either individually or jointly, please refer page no 19 - 22
16
31st December, 2017
BARODA PIONEER MUTUAL FUND
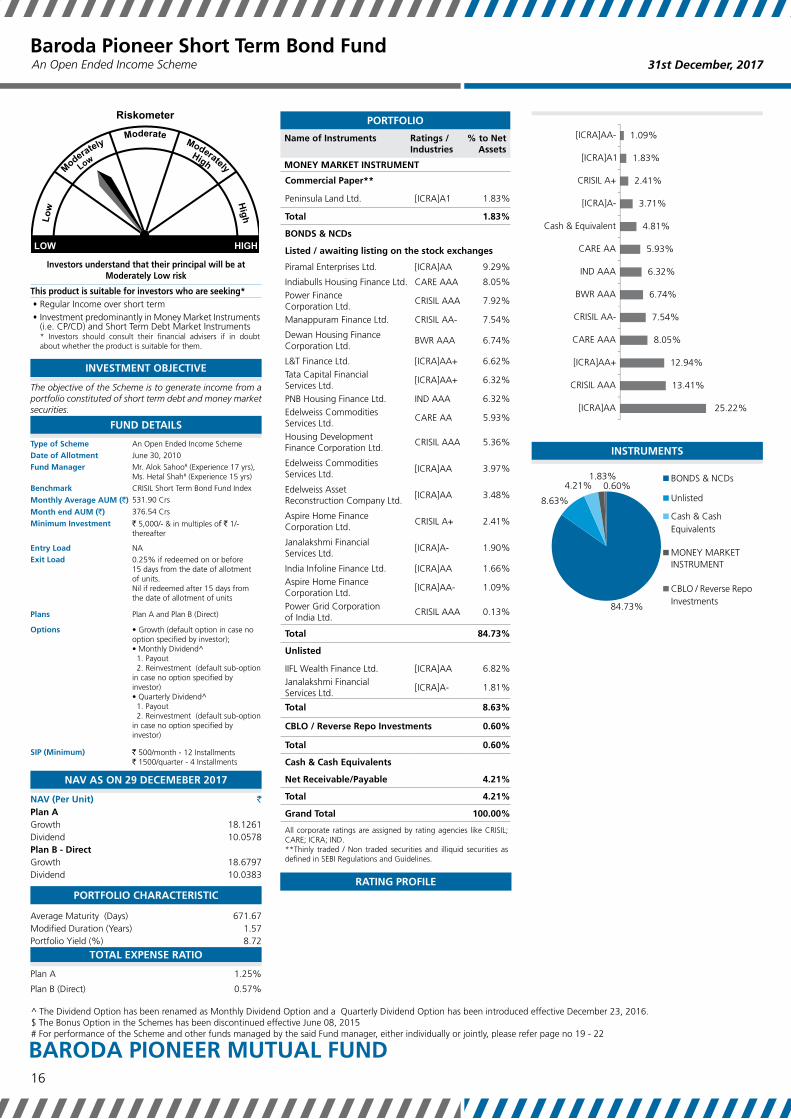
[ICRA] A1+ mfs*Baroda Pioneer Treasury Advantage Fund
$ The Bonus Option in the Schemes has been discontinued effective June 08, 2015 Effective November 01, 2012, dividends declared under the Regular Plan (which has been discontinued from October 01, 2012) will be reinvested in Baroda Pioneer Treasury Advantage Fund (earlier called Institutional Plan) *For Disclaimer please refer page no 22# For performance of the Scheme and other funds managed by the said Fund manager, either individually or jointly, please refer page no 19 - 22
Investors understand that their principal will be at Moderately Low risk
This product is suitable for investors who are seeking*• Regular income over short term with maintaining a
balance between returns and liquidity• Investment predominantly in Money Market (i.e. CP/
CDs) and Debt Market Instruments* Investors should consult their financial advisers if in doubt about whether the product is suitable for them.
INVESTMENT OBJECTIVE
The main objective of the scheme is to provide optimal returns and liquidity through a portfolio comprising of debt securities and money market instruments
FUND DETAILS
Type of Scheme An Open Ended Debt Scheme
Date of Allotment June 24, 2009
Fund Manager Mr. Alok Sahoo#
(Experience 17 yrs), Ms. Hetal Shah#
(Experience 15 yrs)
Benchmark CRISIL Liquid Fund Index
Monthly Average AUM (`)
2,424.81 Crs
Month end AUM (`) 1,923.20 Crs
Minimum Investment ` 5,000/- & in multiples of ` 1/- thereafter
Entry Load NA
Exit Load Nil
Plans Plan A and Plan B (Direct)
Options
• Growth (default option in case no option specified by investor); • Daily Dividend 1 .Reinvestment • Weekly Dividend 1 .Reinvestment • Monthly Dividend 1 .Payout 2 . Reinvestment (default sub-option in case no option specified by investor)• Quarterly Dividend 1.Payout 2 . Reinvestment (default sub-option in case no option specified by investor)• Bonus Option$
SIP (Minimum) ` 500/month - 12 Instalments` 1500/quarter - 4 Instalments
PORTFOLIO CHARACTERISTIC
Average Maturity (Days) 431.42Modified Duration (Years) 1.05Portfolio Yield (%) 8.04
TOTAL EXPENSE RATIO
Plan A 0.81%
Plan B (Direct) 0.52%
PORTFOLIOName of Instruments Ratings /
Industries% to
Net Assets
MONEY MARkET INSTRUMENTCertificate of Deposit**IndusInd Bank Ltd. CRISIL A1+ 5.03%Axis Bank Ltd. CRISIL A1+ 3.77%Total 8.80%Commercial Paper**Edelweiss Commodities Services Ltd.
[ICRA]A1+ 8.95%
IIFL Wealth Finance Ltd. CRISIL A1+ 6.24%JM Financial Products Ltd. CRISIL A1+ 3.84%Piramal Enterprises Ltd. [ICRA]A1+ 3.84%Edelweiss Agri Value Chain Ltd.
[ICRA]A1+ 3.84%
Godrej Properties Ltd. CRISIL A1+ 1.29%Kotak Commodity Services Private Ltd.
[ICRA]A1+ 1.29%
Peninsula Land Ltd. [ICRA]A1 0.41%National Bank for Agriculture and Rural Development
CRISIL A1+ 0.26%
Total 29.96%Treasury BillsTBILL 317 DAY 15 Mar 18 Sovereign 4.88%Total 4.88%BONDS & NCDsListed / awaiting listing on the stock exchangesIndiabulls Housing Finance Ltd. CARE AAA 8.14%Dewan Housing Finance Corporation Ltd.
BWR AAA 7.45%
Piramal Enterprises Ltd. [ICRA]AA 6.24%Power Finance Corporation Ltd. CRISIL AAA 5.21%Yes Bank Ltd. [ICRA]AA 2.54%Manappuram Finance Ltd. CRISIL AA- 2.48%Aspire Home Finance Corporation Ltd.
[ICRA]AA- 2.44%
Janalakshmi Financial Services Ltd.
[ICRA]A- 1.81%
Apollo Hospitals Enterprise Ltd. CRISIL AA 1.76%IndusInd Bank Ltd. CRISIL AA 1.36%Bank of Baroda CARE AA 1.26%Edelweiss Commodities Services Ltd.
CARE AA 0.95%
Aspire Home Finance Corporation Ltd.
CRISIL A+ 0.84%
Power Grid Corporation of India Ltd.
CRISIL AAA 0.60%
ICICI Bank Ltd. [ICRA]AA+ 0.52%India Infoline Finance Ltd. [ICRA]AA 0.49%Indiabulls Housing Finance Ltd. BWR AAA 0.27%Housing Development Finance Corporation Ltd.
CRISIL AAA 0.26%
Edelweiss Asset Reconstruction Company Ltd.
[ICRA]AA 0.10%
Edelweiss Commodities Services Ltd.
[ICRA]AA 0.10%
Total 44.82%Unlisted
ARM Infra & Utilities Private Ltd.BWR A1+ (SO)
6.21%
Cyquator Media Services Private Ltd.
BWR A1+ (SO)
1.82%
Total 8.03%CBLO / Reverse Repo Investments 1.73%Total 1.73%Cash & Cash EquivalentsNet Receivable/Payable 1.78%Total 1.78%Grand Total 100.00%
All corporate ratings are assigned by rating agencies like CRISIL; CARE; ICRA; IND.**Thinly traded / Non traded securities and illiquid securities as defined in SEBI Regulations and Guidelines.
RATING PROFILE
20.43%
17.92%
9.47%
8.14%
8.03%
7.72%
6.07%
4.88%
3.51%
3.12%
2.48%
2.44%
2.21%
1.81%
0.84%
0.52%
0.41%
CRISIL A1+
[ICRA]A1+
[ICRA]AA
CARE AAA
BWR A1+ (SO)
BWR AAA
CRISIL AAA
Sovereign
Cash & Equivalent
CRISIL AA
CRISIL AA-
[ICRA]AA-
CARE AA
[ICRA]A-
CRISIL A+
[ICRA]AA+
[ICRA]A1
INSTRUMENTS
44.82%
29.96%
8.80%
8.03%
4.88%1.78%
1.73%BONDS & NCDs
Commercial Paper
MONEY MARKETINSTRUMENT
Unlisted
Treasury Bills
Cash & CashEquivalents
CBLO / Reverse RepoInvestments
NAV AS ON 29 DECEMEBER 2017
NAV (Per Unit) `Regular
Growth 1945.4180
Dividend - Daily 1006.5930
Dividend - Weekly 1001.8371
Dividend - Monthly 1002.0797
Dividend - Quarterly NA
Plan A
Bonus 1980.4033
Growth 1994.8496
Dividend - Daily 1030.7119
Dividend - Weekly 1001.8331
Dividend - Monthly 1002.0796
Dividend - Quarterly 1045.5234
Plan B - Direct
Bonus NA
Growth 2027.3398
Dividend - Daily 1008.8997
Dividend - Weekly 1001.8568
Dividend - Monthly 1002.1086
Dividend - Quarterly 1053.1210
An Open Ended Debt Scheme
17

31st December, 2017
BARODA PIONEER MUTUAL FUND
[ICRA] A1+ mfs*Baroda Pioneer Liquid Fund
$ The Bonus Option in the Schemes has been discontinued effective June 08, 2015 Effective November 01, 2012, dividends declared under the Regular Plan (which has been discontinued from October 01, 2012) will be reinvested in Baroda Pioneer Liquid Fund (earlier called Institutional Plan) *For Disclaimer please refer page no 22# For performance of the Scheme and other funds managed by the said Fund manager, either individually or jointly, please refer page no 19 - 22 & Aggregate investments made by other schemes of Baroda Pioneer Mutual Fund – Rs.30.02 crores
Investors understand that their principal will be atLow risk
This product is suitable for investors who are seeking*
• Regular income over short term with high level of liquidity
• Investment predominantly in Money Market (i.e. CP / CDs) Instruments* Investors should consult their financial advisers if in doubt about whether the product is suitable for them.
INVESTMENT OBJECTIVE
To generate income with a high level of liquidity by investing in a portfolio of money market and debt securities.
FUND DETAILS
Type of Scheme An Open Ended Liquid Scheme
Date of Allotment February 5, 2009
Fund Manager Mr. Alok Sahoo#
(Experience 17 yrs), Ms. Hetal Shah#
(Experience 15 yrs)
Benchmark CRISIL Liquid Fund Index
Monthly Average AUM (`)&
5,932.39 Crs
Month end AUM (`) 3,931.12 Crs
Minimum Investment ` 5,000/- & in multiples of ` 1/- thereafter
Entry Load NA
Exit Load Nil
Plans Plan A and Plan B (Direct)
Options • Growth (default option in case no option specified by investor);• Daily Dividend 1.Reinvestment• Weekly Dividend 1.Reinvestment• Bonus Option$
SIP (Minimum) ` 500/month - 12 Instalments` 1500/quarter - 4 Instalments
PORTFOLIO CHARACTERISTIC
Average Maturity (Days) 56.32Modified Duration (Years) 0.15Portfolio Yield (%) 6.49
TOTAL EXPENSE RATIOPlan A 0.20%
Plan B (Direct) 0.11%
PORTFOLIO
Name of Instruments Ratings / Industries
% to Net
Assets
MONEY MARkET INSTRUMENT
Certificate of Deposit**
IDFC Bank Ltd. [ICRA]A1+ 3.24%
HDFC Bank Ltd. IND A1+ 3.22%National Bank for Agriculture and Rural Development
CRISIL A1+ 2.18%
ICICI Bank Ltd. CARE A1+ 2.15%
Axis Bank Ltd. CRISIL A1+ 1.08%
Total 11.87%
Commercial Paper**
Export-Import Bank of India CRISIL A1+ 5.38%Housing Development Finance Corporation Ltd.
CARE A1+ 5.38%
India Infoline Housing Finance Ltd. CRISIL A1+ 3.25%
SREI Equipment Finance Ltd. CARE A1+ 3.25%
Piramal Enterprises Ltd. [ICRA]A1+ 3.24%
National Bank for Agriculture and Rural Development
CRISIL A1+ 3.23%
IIFL Wealth Finance Ltd. CRISIL A1+ 3.23%
Larsen & Toubro Ltd. CRISIL A1+ 3.22%
Tata Capital Housing Finance Ltd. CRISIL A1+ 3.22%
Edelweiss Commodities Services Ltd. [ICRA]A1+ 3.21%
India Infoline Finance Ltd. CRISIL A1+ 3.21%
Edelweiss Agri Value Chain Ltd. [ICRA]A1+ 3.21%
IIFL Facilities Services Ltd. CRISIL A1+ 2.59%
Indian Railway Finance Corporation Ltd.
CRISIL A1+ 2.15%
Muthoot Homefin (I) Ltd. [ICRA]A1+ 2.15%
PNB Housing Finance Ltd. CRISIL A1+ 2.15%
Small Industries Development Bank of India
CRISIL A1+ 1.95%
Adani Enterprises Ltd. BWR A1+ 1.29%
Total 55.31%
Treasury Bills
TBILL 329 DAY 12 Mar 18 Sovereign 6.46%
TBILL 364 DAY 29 Mar 18 Sovereign 2.15%
TBILL 91 DAY 15 Feb 18 Sovereign 1.14%
TBILL 91 DAY 15 Mar 18 Sovereign 1.06%
TBILL 91 DAY 01 Mar 18 Sovereign 0.92%
Total 11.73%
Fixed Deposit
The South Indian Bank Ltd. Unrated 5.45%
RBL Bank Ltd. Unrated 3.27%
The South Indian Bank Ltd. Unrated 2.18%
Ujjivan Small Finance Bank Ltd. Unrated 2.18%
Yes Bank Ltd. Unrated 2.18%
Total 13.08%
CBLO /Reverse Repo investments 18.83%
Total 18.83%
Cash & Cash Equivalents
Net Receivable/Payable -10.82%
Total -10.82%
Grand Total 100.00%
All corporate ratings are assigned by rating agencies like CRISIL; CARE; ICRA; IND.**Thinly traded / Non traded securities and illiquid securities as defined in SEBI Regulations and Guidelines.
RATING PROFILE
36.84%
15.05%
13.08%
11.73%
10.78%
8.01%
3.22%
1.29%
CRISIL A1+
[ICRA]A1+
Unrated
Sovereign
CARE A1+
Cash & Equivalent
IND A1+
BWR A1+
INSTRUMENTS
55.31%
18.83%
13.08%
11.87%
11.73%
-10.82% Commercial Paper
CBLO/ReverseRepoInvestments
Fixed Deposit
MONEY MARKETINSTRUMENT
Treasury Bills
Cash & CashEquivalents
NAV AS ON 31 DECEMEBER 2017
NAV (Per Unit) `RegularGrowth 2876.4607
Dividend 2464.4190Dividend - Daily 1006.0602Plan AGrowth 1954.7866Dividend - Daily 1001.1191Dividend - Weekly 1000.9844Plan B - DirectBonus 1964.2767Growth 1963.9394Dividend - Daily 1001.8422Dividend - Weekly 1220.1631
An Open Ended Liquid Scheme
18
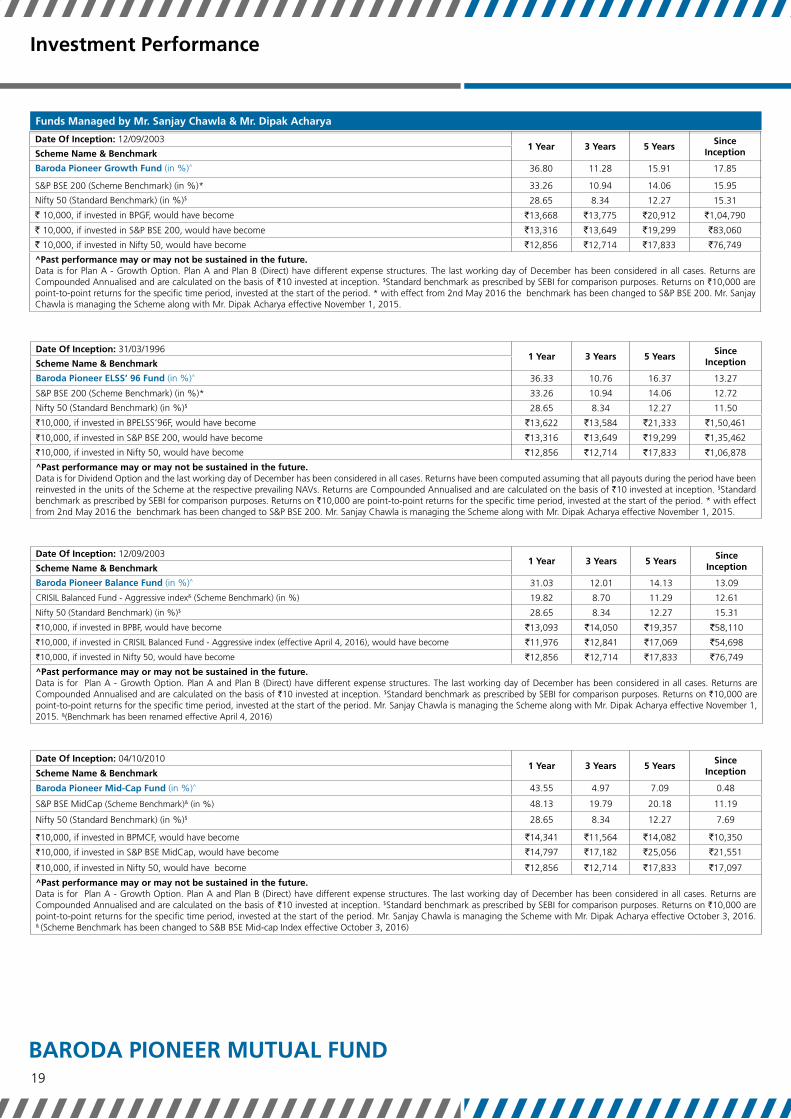
31st December, 2017
BARODA PIONEER MUTUAL FUND
Investment Performance
Funds Managed by Mr. Sanjay Chawla & Mr. Dipak Acharya
Date Of Inception: 12/09/20031 Year 3 Years 5 Years
Since InceptionScheme Name & Benchmark
Baroda Pioneer Growth Fund (in %)^ 36.80 11.28 15.91 17.85
S&P BSE 200 (Scheme Benchmark) (in %)* 33.26 10.94 14.06 15.95
Nifty 50 (Standard Benchmark) (in %)$ 28.65 8.34 12.27 15.31
` 10,000, if invested in BPGF, would have become `13,668 `13,775 `20,912 `1,04,790
` 10,000, if invested in S&P BSE 200, would have become `13,316 `13,649 `19,299 `83,060
` 10,000, if invested in Nifty 50, would have become `12,856 `12,714 `17,833 `76,749
^Past performance may or may not be sustained in the future.Data is for Plan A - Growth Option. Plan A and Plan B (Direct) have different expense structures. The last working day of December has been considered in all cases. Returns are Compounded Annualised and are calculated on the basis of `10 invested at inception. $Standard benchmark as prescribed by SEBI for comparison purposes. Returns on `10,000 are point-to-point returns for the specific time period, invested at the start of the period. * with effect from 2nd May 2016 the benchmark has been changed to S&P BSE 200. Mr. Sanjay Chawla is managing the Scheme along with Mr. Dipak Acharya effective November 1, 2015.
Date Of Inception: 31/03/19961 Year 3 Years 5 Years
Since InceptionScheme Name & Benchmark
Baroda Pioneer ELSS’ 96 Fund (in %)^ 36.33 10.76 16.37 13.27
S&P BSE 200 (Scheme Benchmark) (in %)* 33.26 10.94 14.06 12.72
Nifty 50 (Standard Benchmark) (in %)$ 28.65 8.34 12.27 11.50
`10,000, if invested in BPELSS’96F, would have become `13,622 `13,584 `21,333 `1,50,461
`10,000, if invested in S&P BSE 200, would have become `13,316 `13,649 `19,299 `1,35,462
`10,000, if invested in Nifty 50, would have become `12,856 `12,714 `17,833 `1,06,878
^Past performance may or may not be sustained in the future.Data is for Dividend Option and the last working day of December has been considered in all cases. Returns have been computed assuming that all payouts during the period have been reinvested in the units of the Scheme at the respective prevailing NAVs. Returns are Compounded Annualised and are calculated on the basis of `10 invested at inception. $Standard benchmark as prescribed by SEBI for comparison purposes. Returns on `10,000 are point-to-point returns for the specific time period, invested at the start of the period. * with effect from 2nd May 2016 the benchmark has been changed to S&P BSE 200. Mr. Sanjay Chawla is managing the Scheme along with Mr. Dipak Acharya effective November 1, 2015.
Date Of Inception: 12/09/20031 Year 3 Years 5 Years
Since InceptionScheme Name & Benchmark
Baroda Pioneer Balance Fund (in %)^ 31.03 12.01 14.13 13.09
CRISIL Balanced Fund - Aggressive index& (Scheme Benchmark) (in %) 19.82 8.70 11.29 12.61
Nifty 50 (Standard Benchmark) (in %)$ 28.65 8.34 12.27 15.31
`10,000, if invested in BPBF, would have become `13,093 `14,050 `19,357 `58,110
`10,000, if invested in CRISIL Balanced Fund - Aggressive index (effective April 4, 2016), would have become `11,976 `12,841 `17,069 `54,698
`10,000, if invested in Nifty 50, would have become `12,856 `12,714 `17,833 `76,749
^Past performance may or may not be sustained in the future.Data is for Plan A - Growth Option. Plan A and Plan B (Direct) have different expense structures. The last working day of December has been considered in all cases. Returns are Compounded Annualised and are calculated on the basis of `10 invested at inception. $Standard benchmark as prescribed by SEBI for comparison purposes. Returns on `10,000 are point-to-point returns for the specific time period, invested at the start of the period. Mr. Sanjay Chawla is managing the Scheme along with Mr. Dipak Acharya effective November 1, 2015. &(Benchmark has been renamed effective April 4, 2016)
Date Of Inception: 04/10/20101 Year 3 Years 5 Years
Since InceptionScheme Name & Benchmark
Baroda Pioneer Mid-Cap Fund (in %)^ 43.55 4.97 7.09 0.48
S&P BSE MidCap (Scheme Benchmark)& (in %) 48.13 19.79 20.18 11.19
Nifty 50 (Standard Benchmark) (in %)$ 28.65 8.34 12.27 7.69
`10,000, if invested in BPMCF, would have become `14,341 `11,564 `14,082 `10,350
`10,000, if invested in S&P BSE MidCap, would have become `14,797 `17,182 `25,056 `21,551
`10,000, if invested in Nifty 50, would have become `12,856 `12,714 `17,833 `17,097
^Past performance may or may not be sustained in the future.Data is for Plan A - Growth Option. Plan A and Plan B (Direct) have different expense structures. The last working day of December has been considered in all cases. Returns are Compounded Annualised and are calculated on the basis of `10 invested at inception. $Standard benchmark as prescribed by SEBI for comparison purposes. Returns on `10,000 are point-to-point returns for the specific time period, invested at the start of the period. Mr. Sanjay Chawla is managing the Scheme with Mr. Dipak Acharya effective October 3, 2016. & (Scheme Benchmark has been changed to S&B BSE Mid-cap Index effective October 3, 2016)
19

31st December, 2017
BARODA PIONEER MUTUAL FUND
Investment Performance
Funds Managed by Mr. Sanjay Chawla & Mr. Dipak Acharya
Date Of Inception: 22/06/20101 Year 3 Years 5 Years
Since InceptionScheme Name & Benchmark
Baroda Pioneer Large Cap Fund (in %)^ 22.96 7.67 12.38 4.76
Nifty 100 (Scheme Benchmark)& (in %) 31.05 9.84 13.45 10.25
Nifty 50 (Standard Benchmark) (in %)$ 28.65 8.34 12.27 9.51
`10,000, if invested in BPLCF, would have become `12,289 `12,480 `17,917 `14,190
`10,000, if invested in Nifty 100 would have become `13,095 `13,250 `18,786 `20,836
`10,000, if invested in Nifty 50, would have become `12,856 `12,714 `17,833 `19,807
^Past performance may or may not be sustained in the future.Data is for Plan A - Growth Option. Plan A and Plan B (Direct) have different expense structures. The last working day of December has been considered in all cases. Returns are Compounded Annualised and are calculated on the basis of `10 invested at inception. $Standard benchmark as prescribed by SEBI for comparison purposes. Returns on `10,000 are point-to-point returns for the specific time period, invested at the start of the period. Mr. Sanjay Chawla is managing the Scheme with Mr. Dipak Acharya effective October 3, 2016. &(Scheme Benchmark has been changed to Nifty 100 effective October 3, 2016)
Funds Managed by Mr. Dipak AcharyaDate Of Inception: 22/06/2012
1 Year 3 Years 5 YearsSince
InceptionScheme Name & Benchmark
Baroda Pioneer Banking and Financial Services Fund (in %)^ 32.91 8.44 11.99 14.30
Nifty Bank Index (Scheme Benchmark) (in %) 40.50 10.89 15.42 18.42
Nifty 50 (Standard Benchmark) (in %)$ 28.65 8.34 12.27 13.84
`10,000, if invested in BPBFSF, would have become `13,281 `12,748 `17,609 `20,920
`10,000, if invested in Nifty Bank Index, would have become `14,037 `13,631 `20,474 `25,442
`10,000, if invested in Nifty 50, would have become `12,856 `12,714 `17,833 `20,464
^Past performance may or may not be sustained in the future.Data is for Plan A - Growth Option. Plan A and Plan B (Direct) have different expense structures. The last working day of December has been considered in all cases. Returns are Compounded Annualised and are calculated on the basis of `10 invested at inception. $Standard benchmark as prescribed by SEBI for comparison purposes. Returns on `10,000 are point-to-point returns for the specific time period, invested at the start of the period.
Date Of Inception: 30/06/20101 Year 3 Years 5 Years
Since InceptionScheme Name & Benchmark
Baroda Pioneer Short Term Bond Fund (in %)^ 7.63 8.58 8.65 8.25
CRISIL Short Term Bond Fund Index (Scheme Benchmark) (in %) 6.03 8.17 8.64 8.29
CRISIL 1 year T-Bill (Standard Benchmark) (in %)$ 5.83 7.11 7.15 6.91
`10,000, if invested in BPSTBF, would have become `10,761 `12,800 `15,135 `18,126
`10,000, if invested in CRISIL Short Term Bond Fund Index, would have become `10,601 `12,653 `15,134 `18,180
`10,000, if invested in CRISIL 1 year T-Bill, would have become `10,581 `12,286 `14,120 `16,513
^Past performance may or may not be sustained in the future.Data is for Plan A - Growth Option. Plan A and Plan B (Direct) have different expense structures. The last working day of December has been considered in all cases. Returns are Compounded Annualised and are calculated on the basis of `10 invested at inception. $Standard benchmark as prescribed by SEBI for comparison purposes. Returns on `10,000 are point-to-point returns for the specific time period, invested at the start of the period.
Funds Managed by Mr. Alok Sahoo and Ms. Hetal Shah
20
Date Of Inception: 05/02/2009 1 Year 3 Years 5 Years
Since InceptionScheme Name & Benchmark
Baroda Pioneer Liquid Fund (in %)^ 6.67 7.60 8.23 7.82
CRISIL Liquid Fund Index (Scheme Benchmark) (in %) 6.66 7.45 8.12 7.44
CRISIL 1 year T-Bill (Standard Benchmark) (in%)$ 5.85 7.11 7.15 6.20
`10,000, if invested in BPLF, would have become `10,669 `12,459 `14,852 `19,548
`10,000, if invested in CRISIL Liquid Fund Index, would have become `10,668 `12,410 `14,777 `18,945
`10,000, if invested in CRISIL 1 year T-Bill, would have become `10,587 `12,290 `14,124 `17,086
^Past performance may or may not be sustained in the future.Data is for Plan A - Growth Option. Plan A and Plan B (Direct) have different expense structures. The last working day of December has been considered in all cases. Returns are Compounded Annualised and are calculated on the basis of `1000 invested at inception. $Standard benchmark as prescribed by SEBI for comparison purposes. Returns on `10,000 are point-to-point returns for the specific time period, invested at the start of the period.
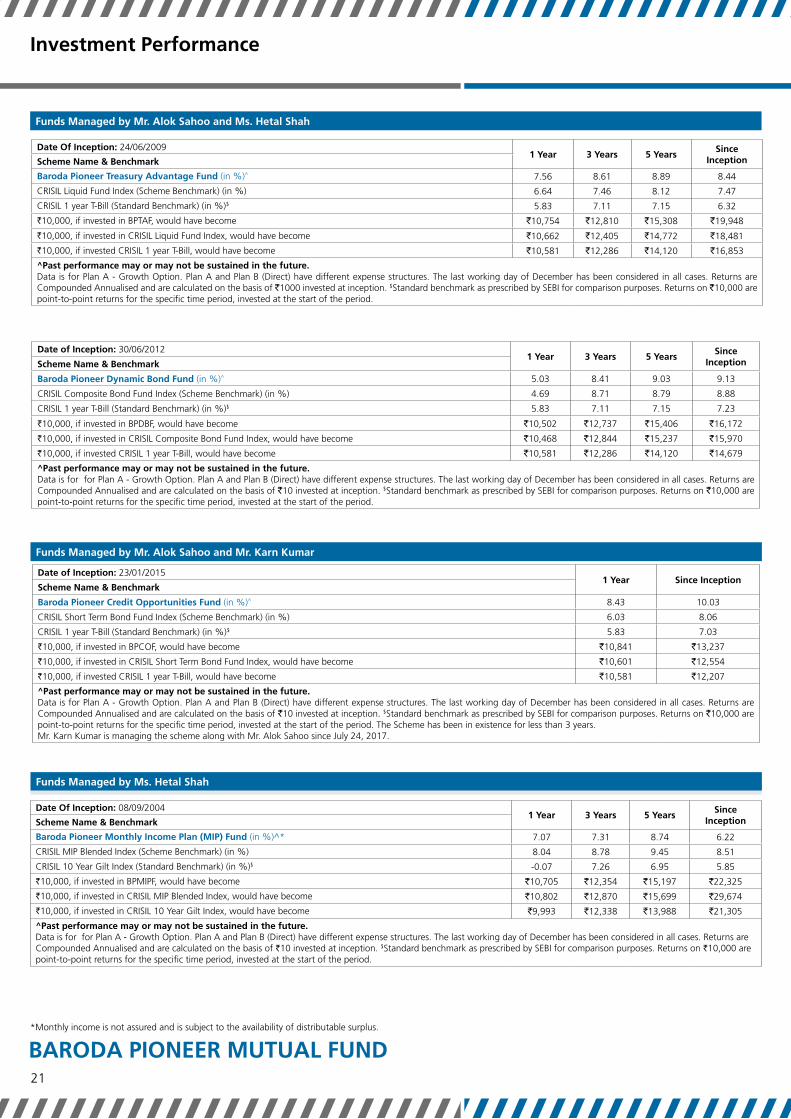
31st December, 2017
BARODA PIONEER MUTUAL FUND
Investment Performance
Funds Managed by Mr. Alok Sahoo and Ms. Hetal Shah
Date Of Inception: 24/06/2009 1 Year 3 Years 5 Years
Since InceptionScheme Name & Benchmark
Baroda Pioneer Treasury Advantage Fund (in %)^ 7.56 8.61 8.89 8.44
CRISIL Liquid Fund Index (Scheme Benchmark) (in %) 6.64 7.46 8.12 7.47
CRISIL 1 year T-Bill (Standard Benchmark) (in %)$ 5.83 7.11 7.15 6.32
`10,000, if invested in BPTAF, would have become `10,754 `12,810 `15,308 `19,948
`10,000, if invested in CRISIL Liquid Fund Index, would have become `10,662 `12,405 `14,772 `18,481
`10,000, if invested CRISIL 1 year T-Bill, would have become `10,581 `12,286 `14,120 `16,853
^Past performance may or may not be sustained in the future.Data is for Plan A - Growth Option. Plan A and Plan B (Direct) have different expense structures. The last working day of December has been considered in all cases. Returns are Compounded Annualised and are calculated on the basis of `1000 invested at inception. $Standard benchmark as prescribed by SEBI for comparison purposes. Returns on `10,000 are point-to-point returns for the specific time period, invested at the start of the period.
Date of Inception: 23/01/20151 Year Since Inception
Scheme Name & Benchmark
Baroda Pioneer Credit Opportunities Fund (in %)^ 8.43 10.03
CRISIL Short Term Bond Fund Index (Scheme Benchmark) (in %) 6.03 8.06
CRISIL 1 year T-Bill (Standard Benchmark) (in %)$ 5.83 7.03
`10,000, if invested in BPCOF, would have become `10,841 `13,237
`10,000, if invested in CRISIL Short Term Bond Fund Index, would have become `10,601 `12,554
`10,000, if invested CRISIL 1 year T-Bill, would have become `10,581 `12,207
^Past performance may or may not be sustained in the future.Data is for Plan A - Growth Option. Plan A and Plan B (Direct) have different expense structures. The last working day of December has been considered in all cases. Returns are Compounded Annualised and are calculated on the basis of `10 invested at inception. $Standard benchmark as prescribed by SEBI for comparison purposes. Returns on `10,000 are point-to-point returns for the specific time period, invested at the start of the period. The Scheme has been in existence for less than 3 years.Mr. Karn Kumar is managing the scheme along with Mr. Alok Sahoo since July 24, 2017.
Date Of Inception: 08/09/2004 1 Year 3 Years 5 Years
Since InceptionScheme Name & Benchmark
Baroda Pioneer Monthly Income Plan (MIP) Fund (in %)^* 7.07 7.31 8.74 6.22
CRISIL MIP Blended Index (Scheme Benchmark) (in %) 8.04 8.78 9.45 8.51
CRISIL 10 Year Gilt Index (Standard Benchmark) (in %)$ -0.07 7.26 6.95 5.85
`10,000, if invested in BPMIPF, would have become `10,705 `12,354 `15,197 `22,325
`10,000, if invested in CRISIL MIP Blended Index, would have become `10,802 `12,870 `15,699 `29,674
`10,000, if invested in CRISIL 10 Year Gilt Index, would have become `9,993 `12,338 `13,988 `21,305
^Past performance may or may not be sustained in the future.Data is for for Plan A - Growth Option. Plan A and Plan B (Direct) have different expense structures. The last working day of December has been considered in all cases. Returns are Compounded Annualised and are calculated on the basis of `10 invested at inception. $Standard benchmark as prescribed by SEBI for comparison purposes. Returns on `10,000 are point-to-point returns for the specific time period, invested at the start of the period.
Funds Managed by Ms. Hetal Shah
21
*Monthly income is not assured and is subject to the availability of distributable surplus.
Date of Inception: 30/06/20121 Year 3 Years 5 Years
Since InceptionScheme Name & Benchmark
Baroda Pioneer Dynamic Bond Fund (in %)^ 5.03 8.41 9.03 9.13
CRISIL Composite Bond Fund Index (Scheme Benchmark) (in %) 4.69 8.71 8.79 8.88
CRISIL 1 year T-Bill (Standard Benchmark) (in %)$ 5.83 7.11 7.15 7.23
`10,000, if invested in BPDBF, would have become `10,502 `12,737 `15,406 `16,172
`10,000, if invested in CRISIL Composite Bond Fund Index, would have become `10,468 `12,844 `15,237 `15,970
`10,000, if invested CRISIL 1 year T-Bill, would have become `10,581 `12,286 `14,120 `14,679
^Past performance may or may not be sustained in the future.Data is for for Plan A - Growth Option. Plan A and Plan B (Direct) have different expense structures. The last working day of December has been considered in all cases. Returns are Compounded Annualised and are calculated on the basis of `10 invested at inception. $Standard benchmark as prescribed by SEBI for comparison purposes. Returns on `10,000 are point-to-point returns for the specific time period, invested at the start of the period.
Funds Managed by Mr. Alok Sahoo and Mr. karn kumar

31st December, 2017
BARODA PIONEER MUTUAL FUND
Investment Performance
Funds Managed by Ms. Hetal Shah
Date Of Inception: 21/03/20021 Year 3 Years 5 Years
Since InceptionScheme Name & Benchmark
Baroda Pioneer Income Fund (in %)^ 2.52 6.71 7.71 6.25
CRISIL Composite Bond Fund Index (Scheme Benchmark) (in %) 4.69 8.71 8.79 7.05
CRISIL 10 Year Gilt Index (Standard Benchmark) (in %)$ -0.07 7.26 6.95 6.55
`10,000, if invested in BPIF, would have become `10,251 `12,150 `14,496 `26,036
`10,000, if invested in CRISIL Composite Bond Fund Index, would have become `10,468 `12,844 `15,237 `29,295
`10,000, if invested in CRISIL 10 Year Gilt Index, would have become `9,993 `12,338 `13,988 `27,205
^Past performance may or may not be sustained in the future.Data is for Plan A - Growth Option. Plan A and Plan B (Direct) have different expense structures. The last working day of December has been considered in all cases. Returns are Compounded Annualised and are calculated on the basis of `10 invested at inception. $Standard benchmark as prescribed by SEBI for comparison purposes. Returns on `10,000 are point-to-point returns for the specific time period, invested at the start of the period.
Disclaimers: Nifty Bank Index and Nifty 100: Baroda Pioneer Large Cap Fund and Baroda Pioneer Banking and Financial Services Fund (“said Schemes”) offered by Baroda Pioneer Mutual Fund are not sponsored, endorsed, sold or promoted by India Index Services & Products Limited (“IISL”). IISL does not make any representation or warranty, express or implied (including warranties of merchantability or fitness for particular purpose or use) and disclaims all liability to the owners of the said Schemes or any member of the public regarding the advisability of investing in securities generally or in the said Schemes linked to Nifty 100 and Nifty Bank Index or particularly in the ability of the Nifty Bank Index to track general stock market performance in India. Please read the full disclaimers in relation to the Nifty 100 and Nifty Bank Index in the Offer Document / Prospectus / Information Statement.
S&P BSE 200: Baroda Pioneer Growth Fund and Baroda Pioneer ELSS’ 96 Fund (“said Schemes”) offered by Baroda Pioneer Mutual Fund are not sponsored, endorsed, sold or promoted by India Index Services & Products Limited (“IISL”). IISL does not make any representation or warranty, express or implied (including warranties of merchantability or fitness for particular purpose or use) and disclaims all liability to the owners of the said Schemes or any member of the public regarding the advisability of investing in securities generally or in the said Schemes linked to S&P BSE 200 or particularly in the ability of the S&P BSE 200 and to track general stock market performance in India. Please read the full disclaimers in relation to the S&P BSE 200 in the Offer Document / Prospectus / Information Statement.
S&P BSE Midcap Index is a product of AIPL, a joint venture among affiliates of S&P Dow Jones Indices LLC (“SPDJI”) and BSE Limited (“BSE”), and has been licensed for use by Baroda Pioneer Asset Management Company Ltd. Standard & Poor’s® and S&P® are registered trademarks of Standard & Poor’s Financial Services LLC (“S&P”); BSE® is registered trademarks of BSE Limited; Dow Jones® is a registered trademark of Dow Jones Trademark Holdings LLC (“Dow Jones”); and these trademarks have been licensed for use by AIPL and sublicensed for certain purposes by Baroda Pioneer Asset Management Company Ltd. Baroda Pioneer Mid-Cap Fund is not sponsored, endorsed, sold or promoted by SPDJI, BSE, Dow Jones, S&P or their respective affiliates and none of such parties make any representation regarding the advisability of investing in such product(s) nor do they have any liability for any errors, omissions, or interruptions of the S&P BSE Midcap Index.
*ICRA Credit Ratings: The rating indicates highest-credit quality rating assigned by ICRA Ltd. to debt funds. Schemes with this rating are considered to have very strong degree of safety regarding timely receipt of payments from the investments that they have made. This rating should however not be construed as an indication of the performance of the Mutual Fund scheme or of volatility in its returns. The rating should not be treated as a recommendation to buy, sell or hold the units issued by the Mutual Fund.
22
Date Of Inception: 21/03/20021 Year 3 Years 5 Years
Since InceptionScheme Name & Benchmark
Baroda Pioneer Gilt Fund (in %)^ 1.72 7.10 8.04 6.34
I-Sec Mi-BEX (Scheme Benchmark) (in %) 4.50 8.79 9.04 7.73
CRISIL 10 Year Gilt Index (Standard Benchmark)$ -0.07 7.26 6.95 6.55
`10,000, if invested in BPGF, would have become `10,171 `12,284 `14,720 `26,402
`10,000, if invested in I-Sec Mi-BEX, would have become `10,448 `12,872 `15,408 `32,418
`10,000, if invested in CRISIL 10 Year Gilt Index, would have become `9,993 `12,338 `13,988 `27,205
^Past performance may or may not be sustained in the future.Data is for for Plan A - Growth Option. Plan A and Plan B (Direct) have different expense structures. The last working day of December has been considered in all cases. Returns are Compounded Annualised and are calculated on the basis of `10 invested at inception. $Standard benchmark as prescribed by SEBI for comparison purposes. Returns on `10,000 are point-to-point returns for the specific time period, invested at the start of the period.
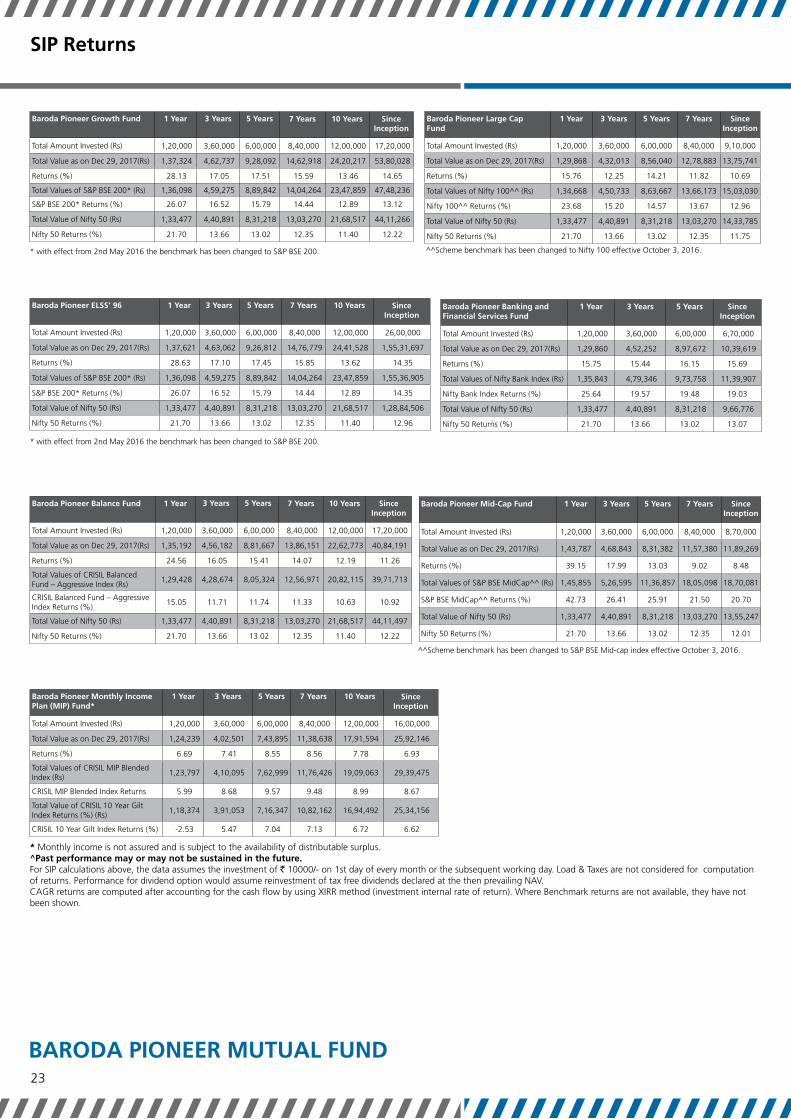
31st December, 2017
BARODA PIONEER MUTUAL FUND
SIP Returns
23
Baroda Pioneer Growth Fund 1 Year 3 Years 5 Years 7 Years 10 Years Since Inception
Total Amount Invested (Rs) 1,20,000 3,60,000 6,00,000 8,40,000 12,00,000 17,20,000
Total Value as on Dec 29, 2017(Rs) 1,37,324 4,62,737 9,28,092 14,62,918 24,20,217 53,80,028
Returns (%) 28.13 17.05 17.51 15.59 13.46 14.65
Total Values of S&P BSE 200* (Rs) 1,36,098 4,59,275 8,89,842 14,04,264 23,47,859 47,48,236
S&P BSE 200* Returns (%) 26.07 16.52 15.79 14.44 12.89 13.12
Total Value of Nifty 50 (Rs) 1,33,477 4,40,891 8,31,218 13,03,270 21,68,517 44,11,266
Nifty 50 Returns (%) 21.70 13.66 13.02 12.35 11.40 12.22
Baroda Pioneer ELSS’ 96 1 Year 3 Years 5 Years 7 Years 10 Years Since Inception
Total Amount Invested (Rs) 1,20,000 3,60,000 6,00,000 8,40,000 12,00,000 26,00,000
Total Value as on Dec 29, 2017(Rs) 1,37,621 4,63,062 9,26,812 14,76,779 24,41,528 1,55,31,697
Returns (%) 28.63 17.10 17.45 15.85 13.62 14.35
Total Values of S&P BSE 200* (Rs) 1,36,098 4,59,275 8,89,842 14,04,264 23,47,859 1,55,36,905
S&P BSE 200* Returns (%) 26.07 16.52 15.79 14.44 12.89 14.35
Total Value of Nifty 50 (Rs) 1,33,477 4,40,891 8,31,218 13,03,270 21,68,517 1,28,84,506
Nifty 50 Returns (%) 21.70 13.66 13.02 12.35 11.40 12.96
Baroda Pioneer Large CapFund
1 Year 3 Years 5 Years 7 Years Since Inception
Total Amount Invested (Rs) 1,20,000 3,60,000 6,00,000 8,40,000 9,10,000
Total Value as on Dec 29, 2017(Rs) 1,29,868 4,32,013 8,56,040 12,78,883 13,75,741
Returns (%) 15.76 12.25 14.21 11.82 10.69
Total Values of Nifty 100^^ (Rs) 1,34,668 4,50,733 8,63,667 13,66,173 15,03,030
Nifty 100^^ Returns (%) 23.68 15.20 14.57 13.67 12.96
Total Value of Nifty 50 (Rs) 1,33,477 4,40,891 8,31,218 13,03,270 14,33,785
Nifty 50 Returns (%) 21.70 13.66 13.02 12.35 11.75
Baroda Pioneer Banking andFinancial Services Fund
1 Year 3 Years 5 Years Since Inception
Total Amount Invested (Rs) 1,20,000 3,60,000 6,00,000 6,70,000
Total Value as on Dec 29, 2017(Rs) 1,29,860 4,52,252 8,97,672 10,39,619
Returns (%) 15.75 15.44 16.15 15.69
Total Values of Nifty Bank Index (Rs) 1,35,843 4,79,346 9,73,758 11,39,907
Nifty Bank Index Returns (%) 25.64 19.57 19.48 19.03
Total Value of Nifty 50 (Rs) 1,33,477 4,40,891 8,31,218 9,66,776
Nifty 50 Returns (%) 21.70 13.66 13.02 13.07
Baroda Pioneer Balance Fund 1 Year 3 Years 5 Years 7 Years 10 Years Since Inception
Total Amount Invested (Rs) 1,20,000 3,60,000 6,00,000 8,40,000 12,00,000 17,20,000
Total Value as on Dec 29, 2017(Rs) 1,35,192 4,56,182 8,81,667 13,86,151 22,62,773 40,84,191
Returns (%) 24.56 16.05 15.41 14.07 12.19 11.26
Total Values of CRISIL Balanced Fund – Aggressive Index (Rs)
1,29,428 4,28,674 8,05,324 12,56,971 20,82,115 39,71,713
CRISIL Balanced Fund – Aggressive Index Returns (%)
15.05 11.71 11.74 11.33 10.63 10.92
Total Value of Nifty 50 (Rs) 1,33,477 4,40,891 8,31,218 13,03,270 21,68,517 44,11,497
Nifty 50 Returns (%) 21.70 13.66 13.02 12.35 11.40 12.22
Baroda Pioneer Monthly Income Plan (MIP) Fund*
1 Year 3 Years 5 Years 7 Years 10 Years Since Inception
Total Amount Invested (Rs) 1,20,000 3,60,000 6,00,000 8,40,000 12,00,000 16,00,000
Total Value as on Dec 29, 2017(Rs) 1,24,239 4,02,501 7,43,895 11,38,638 17,91,594 25,92,146
Returns (%) 6.69 7.41 8.55 8.56 7.78 6.93
Total Values of CRISIL MIP Blended Index (Rs)
1,23,797 4,10,095 7,62,999 11,76,426 19,09,063 29,39,475
CRISIL MIP Blended Index Returns 5.99 8.68 9.57 9.48 8.99 8.67
Total Value of CRISIL 10 Year Gilt Index Returns (%) (Rs)
1,18,374 3,91,053 7,16,347 10,82,162 16,94,492 25,34,156
CRISIL 10 Year Gilt Index Returns (%) -2.53 5.47 7.04 7.13 6.72 6.62
* Monthly income is not assured and is subject to the availability of distributable surplus.^Past performance may or may not be sustained in the future.For SIP calculations above, the data assumes the investment of ` 10000/- on 1st day of every month or the subsequent working day. Load & Taxes are not considered for computation of returns. Performance for dividend option would assume reinvestment of tax free dividends declared at the then prevailing NAV.CAGR returns are computed after accounting for the cash flow by using XIRR method (investment internal rate of return). Where Benchmark returns are not available, they have not been shown.
* with effect from 2nd May 2016 the benchmark has been changed to S&P BSE 200.
* with effect from 2nd May 2016 the benchmark has been changed to S&P BSE 200.
^^Scheme benchmark has been changed to Nifty 100 effective October 3, 2016.
^^Scheme benchmark has been changed to S&P BSE Mid-cap index effective October 3, 2016.
Baroda Pioneer Mid-Cap Fund 1 Year 3 Years 5 Years 7 Years Since Inception
Total Amount Invested (Rs) 1,20,000 3,60,000 6,00,000 8,40,000 8,70,000
Total Value as on Dec 29, 2017(Rs) 1,43,787 4,68,843 8,31,382 11,57,380 11,89,269
Returns (%) 39.15 17.99 13.03 9.02 8.48
Total Values of S&P BSE MidCap^^ (Rs) 1,45,855 5,26,595 11,36,857 18,05,098 18,70,081
S&P BSE MidCap^^ Returns (%) 42.73 26.41 25.91 21.50 20.70
Total Value of Nifty 50 (Rs) 1,33,477 4,40,891 8,31,218 13,03,270 13,55,247
Nifty 50 Returns (%) 21.70 13.66 13.02 12.35 12.01

31st December, 2017
BARODA PIONEER MUTUAL FUND
Record Date Ex-Dividend NAV (Rs) Per Unit$ (Rs)
Baroda Pioneer Growth Fund - Plan A - Dividend23-Mar-17 35.86 2.50
24-Jun-16 33.72 2.80
24-Jul-15 39.49 3.50
Baroda Pioneer Growth Fund - Plan B - Direct - Dividend23-Mar-17 35.33 2.50
24-Jun-16 33.05 2.80
24-Jul-15 38.61 3.50
Baroda Pioneer ELSS 96 - Plan A - Dividend23-Mar-17 32.07 2.50
22-Mar-16 28.50 2.50
23-Feb-15 32.32 2.25
Baroda Pioneer ELSS 96 - Plan B - Direct - Dividend23-Mar-17 36.88 2.50
23-Feb-15 33.19 2.25
14-Mar-14 23.15 2.00
Baroda Pioneer Large Cap Fund - Plan A - Dividend09-Jan-15 10.38 0.90
Baroda Pioneer Large Cap Fund - Plan B - Direct - Dividend09-Jan-15 10.54 0.90
Baroda Pioneer Banking and Financial Services Fund - Plan A - Dividend23-Mar-17 17.44 1.50
09-Sep-14 13.29 1.00
Baroda Pioneer Banking and Financial Services Fund - Plan B - Direct - Dividend23-Mar-17 18.04 1.50
09-Sep-14 13.46 1.00
Baroda Pioneer Balance Fund - Plan A - Dividend29-Dec-17 19.05 0.50
27-Sep-17 18.06 0.50
30-Jun-17 18.34 0.40
Baroda Pioneer Balance Fund - Plan B - Direct - Dividend29-Dec-17 20.84 0.50
27-Sep-17 19.64 0.50
30-Jun-17 19.80 0.40
Baroda Pioneer MIP Fund - Plan A - Monthly Dividend*27-Dec-17 13.6053 0.07
27-Nov-17 13.7223 0.07
27-Oct-17 13.6860 0.07
Baroda Pioneer MIP Fund - Plan B - Direct - Monthly Dividend*27-Dec-17 13.9664 0.07
27-Nov-17 14.0741 0.07
27-Oct-17 14.0253 0.07
Baroda Pioneer MIP Fund - Plan A - Quarterly Dividend*29-Dec-17 13.2845 0.20
27-Sep-17 13.2248 0.20
30-Jun-17 13.4843 0.20
Baroda Pioneer MIP Fund - Plan B - Direct - Quarterly Dividend*29-Dec-17 13.6800 0.20
27-Sep-17 13.5806 0.20
30-Jun-17 13.8116 0.20
Baroda Pioneer Credit Opportunities Fund - Plan A - Quarterly Dividend29-Dec-17 10.6908 0.21
27-Sep-17 10.7686 0.21
30-Jun-17 10.9728 0.21
Baroda Pioneer Credit Opportunities Fund - Plan B - Direct - Quarterly Dividend29-Dec-17 11.0937 0.21
27-Sep-17 11.1347 0.21
30-Jun-17 11.2964 0.21
Baroda Pioneer Credit Opportunities Fund - Plan A - Monthly Dividend27-Dec-17 10.7977 0.07
27-Nov-17 10.8517 0.07
27-Oct-17 10.8891 0.07
Baroda Pioneer Credit Opportunities Fund - Plan B - Direct - Monthly Dividend27-Dec-17 11.2549 0.07
27-Nov-17 11.2987 0.07
27-Oct-17 11.3255 0.07
Record Date Ex-Dividend NAV (Rs) Per Unit$ (Rs)
Baroda Pioneer Dynamic Bond Fund - Plan A - Dividend27-Jun-16 12.1528 0.40
22-Mar-16 12.5843 0.70
25-Jun-13 10.0000 0.41
Baroda Pioneer Dynamic Bond Fund - Plan B - Direct - Dividend27-Jun-16 12.5981 0.40
22-Mar-16 13.0024 0.70
25-Jun-13 10.0000 0.43
Baroda Pioneer Gilt Fund - Plan A - Dividend24-Jun-16 19.4927 1.20
22-Mar-16 20.3147 1.20
21-Mar-14 16.4233 2.70
Baroda Pioneer Gilt Fund - Plan B - Direct - Dividend21-Mar-14 16.5462 2.70
Baroda Pioneer Liquid Fund - Plan A - Dividend04-Mar-05 1016.27 35.00
06-Jan-04 1004.32 95.00
13-May-02 1002.43 7.50
Baroda Pioneer Short Term Bond Fund - Plan A - Monthly Dividend27-Nov-17 10.0323 0.05
27-Oct-17 10.0525 0.07
27-Sep-17 10.0638 0.07
Baroda Pioneer Short Term Bond Fund - Plan B - Direct - Monthly Dividend27-Nov-17 10.0071 0.06
27-Oct-17 10.0295 0.07
27-Sep-17 10.0399 0.07
Baroda Pioneer Short Term Bond Fund - Plan A - Quaterly Dividend29-Dec-17 10.1629 0.17
27-Sep-17 10.1685 0.17
Baroda Pioneer Short Term Bond Fund - Plan B - Direct - Quaterly Dividend29-Dec-17 10.1696 0.17
27-Sep-17 10.1926 0.17
Baroda Pioneer Treasury Advantage Fund Reg - Monthly Dividend27-Dec-17 1001.46 5.55
27-Nov-17 1003.30 6.10
27-Oct-17 1005.17 7.23
Baroda Pioneer Treasury Advantage Fund - Plan A - Monthly Dividend27-Dec-17 1001.46 5.55
27-Nov-17 1003.30 6.10
27-Oct-17 1005.17 7.23
Baroda Pioneer Treasury Advantage Fund - Plan B - Direct - Monthly Dividend27-Dec-17 1001.48 5.79
27-Nov-17 1003.32 6.35
27-Oct-17 1005.21 7.47
Baroda Pioneer Treasury Advantage Fund Reg - Quarterly Dividend27-Jun-14 1006.66 23.38
21-Mar-14 1011.22 7.79
24-Jun-16 1036.72 14.45
Baroda Pioneer Treasury Advantage Fund - Plan A - Quarterly Dividend29-Dec-17 1029.32 17.00
27-Sep-17 1030.50 17.00
30-Jun-17 1045.97 17.00
Baroda Pioneer Treasury Advantage Fund - Plan B - Direct - Quarterly Dividend29-Dec-17 1036.95 17.00
27-Sep-17 1037.23 17.00
30-Jun-17 1051.84 17.00
Baroda Pioneer Income Fund - Plan A - Dividend24-Jun-16 22.1257 1.40
22-Mar-16 23.1386 1.40
Baroda Pioneer Income Fund - Plan B - Direct - Dividend24-Jun-16 22.1642 1.40
22-Mar-16 23.1530 1.40
Dividend History
24
$ Face value is Rs. 10/- in all schemes other than Baroda Pioneer Liquid Fund and Baroda Pioneer Treasury Advantage Fund where the face value is Rs. 1,000/- per unit.
* Monthly income is not assured and is subject to the availability of distributable surplus.# Pursuant to payment of dividend, the NAVs of the schemes would fall to the extent of payout and statutory levy (if applicable).

31st December, 2017
BARODA PIONEER MUTUAL FUND25
karvy Computershare Private LimitedAddress and Contact detailsMFS Branches
• Bangalore [email protected] 080-26600785 • Belgaum [email protected] 0831 2402544 • Bellary [email protected] 08392 – 254750 • Davangere [email protected] 0819-2258714 • Dharwad [email protected] 0836- 2744207• Gulbarga [email protected] 0847-2310040 • Hassan [email protected] 08172 262065 • Hubli [email protected] 0836-2252444 • Mangalore [email protected] 0824-2496289 • Margoa [email protected] 0832-2731823 • Mysore [email protected] 0821-2438006 • Panjim [email protected] 0832-2426873 • Shimoga [email protected] 08182-228799 • Ahmedabad [email protected] 079-65445550 • Anand [email protected] 9662020623 • Ankleshwar [email protected] 02646 645326 • Baroda [email protected] 0265-6640870 • Bharuch [email protected] 02642-225022 • Bhavnagar [email protected] 278-3003149 • Gandhidham [email protected] 02836 651296 • Gandhinagar [email protected] 079-23244955 • Jamnagar [email protected] 0288-2558887 • Junagadh [email protected] 0285-2652220 • Mehsana [email protected] 02762-242950 • Nadiad [email protected] 0268-2563245 • Navsari [email protected] 02637-280367 • Rajkot [email protected] 2816545888 • Surat [email protected] 0261-3042170 • Valsad [email protected] 02632-258481 • Vapi [email protected] 9228012909 • Chennai [email protected] 044-42028512 • Alleppy [email protected] 0477 2263055 • Calicut [email protected] 0495-4022480 • Cochin [email protected] 0484 3000232 • Kannur [email protected] 0497-2764190 • Kollam [email protected] 0474-2747055 • Kottayam [email protected] 0481-2300868 • Malappuram [email protected] 0483-2731480 • Palghat [email protected] 491 6061110 • Thodupuzha [email protected] 0486-2211209 • Tiruvalla [email protected] 0469-3205676 • Trichur [email protected] 0487-3246231 • Trivandrum [email protected] 0471-2725728 • Coimbatore [email protected] 0422 - 4388011 • Dindigul [email protected] 0451- 6451043 • Erode [email protected] 0424-4021212 • Karaikudi [email protected] 04565-237192 • Karur [email protected] 04324-241755 • Madurai [email protected] 0452-2605856 • Nagerkoil [email protected] 04652 - 233552 • Namakkal [email protected] 04286- 23480 • Pollachi [email protected] 04259- 235111 • Pondicherry [email protected] 0413 2220640 • Pudukottai [email protected] 04322 - 220050 • Rajapalayam [email protected] 04563 - 232952 • Salem [email protected] 0427-4020300 • Sivakasi [email protected] 04562 228816 • Thanjavur [email protected] 04362-275415 • Tirunelveli [email protected] 0462 2335137 • Tirupur [email protected] 0421-2214221 • Trichy [email protected] 0431-4020227 • Tuticorin [email protected] 0461-2334603 • Vellore [email protected] 0416 2215007 • Agartala [email protected] 0381-2317519 • Guwahati [email protected] 8811036746 • Shillong [email protected] 0364 2506106 • Silchar [email protected] 03842 261714 • Ananthapur [email protected] 08554-244449 • Eluru [email protected] 08812-227851 • Guntur [email protected] 0863-2339094 •Hyderabad [email protected] 040-44677075/ 44677076/44677077/44677348 • Karimnagar [email protected] 0878-2261779 • Kurnool [email protected] 08158-228550 • Nanded [email protected] 02462-237885 • Nellore [email protected] 0861-2349940 • Nizamabad [email protected] 08462-224366 • Proddatur [email protected] 08564 - 242898 • Rajahmundry [email protected] 0883-2434468 • Solapur [email protected] 0217-2300021 • Srikakulam [email protected] 08942-225384 • Tirupathi [email protected] 0877-6544567 • Vijayanagaram [email protected] 08922-236962 • Vijayawada [email protected] 0866-2475126 • Visakhapatnam [email protected] 0891-2714125 • Warangal [email protected] 0870-2501664 • Akola [email protected] 0724-2451874 • Amaravathi [email protected] 0721-3291081 • Aurangabad [email protected] 0240-2343414 • Betul [email protected] 07141 - 231301 • Bhopal [email protected] 0755-4092712 • Chandrapur [email protected] 07172-270262 • Dewas [email protected] 07272-426010 • Dhule [email protected] 02562-282823 • Indore [email protected] 0731-4266828 • Jabalpur [email protected] 0761-3204376 • Jalgaon [email protected] 0257-2226761 • Nagpur [email protected] 0712-2533040 • Nasik nasikmfs@karvy.

31st December, 2017
BARODA PIONEER MUTUAL FUND
com 0253-6611395 • Ratlam [email protected] 07412-402007 • Sagar [email protected] 07582-402404 • Ujjain [email protected] 0734-4250007 • Asansol [email protected] 0341-3266507 • Balasore [email protected] 06782-260503 • Bankura [email protected] 03242-255964 • Barhampore (Wb) [email protected] 03482 274494 • Berhampur (Or) [email protected] 0680-2228106 • Bhilai [email protected] 0788-2295999 • Bhubaneswar [email protected] 0674-6534585 • Bilaspur [email protected] 07752-408436• Bokaro [email protected] 9204061959 • Burdwan [email protected] 0342-2665140 • Chinsura [email protected] 033-26810164 • Cuttack [email protected] 0-9238102118 • Dhanbad [email protected] 0326-6452027, 0326- 2301045 • Durgapur [email protected] 0343-6512111 • Gaya [email protected] 0631-2220065 • Jalpaiguri [email protected] 03561-222136 • Jamshedpur [email protected] 0657-6655000 • Kharagpur [email protected] 03222-253380 • Kolkata [email protected] ; [email protected] 033-40611135/ 36; 033-24659263/9267, 24635432, 24669450, 24196462 • Malda [email protected] 03512-223763 • Patna [email protected] 0612-6453098 • Raipur [email protected] 0771-4052620 • Ranchi [email protected] 0651-2331320 • Rourkela [email protected] 0661-2500005 • Sambalpur [email protected] 0663-2522105 • Siliguri [email protected] 0353-2526393, 0353-2522579 • Agra [email protected] 9369918603 • Aligarh [email protected] 9369918604 • Allahabad [email protected] 9369918605 • Ambala [email protected] 9315017301 • Azamgarh [email protected] 9307910001 • Bareilly [email protected] 9369918607 • Begusarai [email protected] 9308793949 • Bhagalpur [email protected] 9386256100 • Darbhanga [email protected] 06272-220145 • Dehradun [email protected] 9369918608 • Deoria [email protected] 7499496134 • Faridabad [email protected] 9310448851 • Ghaziabad [email protected] 9310448804 • Ghazipur [email protected] 7499496131 •Gonda [email protected] 7499496127 • Gorakhpur [email protected] 9369918610 • Gurgaon [email protected] 9310448806 • Gwalior [email protected] 9300004262 • Haldwani [email protected] 9369918611 • Haridwar [email protected] 9369918612 • Hissar [email protected] 9315017303 • Jaunpur [email protected] 9369918613 • Jhansi [email protected] 9369918614 • Kanpur [email protected] 9369918615/6 • Korba [email protected] 9300155683 • Lucknow [email protected] 9369918600 • Mandi [email protected] 9318873501• Mathura [email protected] 9369918618 • Meerut [email protected] 9369918619 •Mirzapur [email protected] 7499496133 • Moradabad [email protected] 9369918620 •Morena [email protected] 7489361265 • [email protected] 9386256101 •Noida [email protected] 9310448805 • Panipat [email protected] 9315017304 • Renukoot [email protected] 7499495854 • Rewa [email protected] 7489755878 • Rohtak [email protected] 9315017305 • Roorkee [email protected] 9369918621 • Saharanpur [email protected] 9369918622 • Satna [email protected] 9300004263 • Shaktinagar [email protected] 7499496129 • Shimla [email protected] 9318644501 • Shivpuri [email protected] 9303028921 • Sitapur [email protected] 9369918623 • Solan [email protected] 9318991871 • Sonepat [email protected] 9315457164 • Sultanpur [email protected] 9369918624 • Varanasi [email protected] 9369918626 • Yamuna Nagar [email protected] 9315017306 • Kolhapur [email protected] 0231 2653656 • Mumbai [email protected] 022-66235353 • Pune [email protected] 020-25533795 • Ajmer [email protected] 0145-5120725 • Alwar [email protected] 0144-3291200 • Amritsar [email protected] 0183-5053802 •Bhatinda [email protected] 0164-5006725 • Bhilwara [email protected] 01482-246362 •Bikaner [email protected] 0151-2200014 •Chandigarh [email protected] 0172-5101342 •Ferozpur [email protected] 01632-241814 •Hoshiarpur [email protected] 01882-500143 •Jaipur [email protected] 0141-4167714 • Jalandhar [email protected] 0181-5094410 • Jammu [email protected] 0191-2458820 • Jodhpur [email protected] 0291-6454590 • Karnal [email protected] 0184-2252524 •Kota [email protected] 0744-5100964 • Ludhiana [email protected] 0161-4648747 • Moga [email protected] 01636-230792 • New Delhi [email protected] 011-43681700 • Pathankot [email protected] 0186-5080188 • Patiala [email protected] 0175-5004349 • Sikar [email protected] 01572-250398 • Sri Ganganagar [email protected] 0154-2470177 • Udaipur [email protected] 0294-2429370 • Chembur 022-662215536 • Vashi 022-27802684 • Borivali 022- 28916319
26

31st December, 2017
BARODA PIONEER MUTUAL FUND
Contact Points:Toll Free Number: 1-800-267 0189 | Email: [email protected] | Website:www.barodapioneer.inRegistered OfficeBaroda Pioneer Asset Management Company Ltd.CIN : U65991MH1992PLC069414501 Titanium, 5th Floor, Western Express Highway, Goregaon (E), Mumbai - 400063.Phone: +91 22 3074 1000 / 4219 7999. Fax: +91 22 3074 1001.Branch OfficeBaroda Pioneer Asset Management Company Ltd.Flat No. 103 & 104, First Floor,Prakash Deep Building, 7 Tolstoy Marg, New Delhi - 110001. Phone: 011-43514662Branch OfficeBaroda Pioneer Asset Management Company Ltd. HP Complex, Flat No.12, 3rd Floor, Door No. 124/1,2&3 New No. 14, G N Chetty Road,T.Nagar, Chennai - 600017 Phone: 044 - 2834 3530, Fax: 044 - 2834 3539Mutual fund investments are subject to market risks,read all scheme related documents carefully.
• Thane 022 25428475 • Agartala [email protected] 0381-2317519 • Amaravathi [email protected] 0721-3291081 • Anand [email protected] 9662020623 • Bangalore [email protected] 080-26600785 • Berhampur (Or) [email protected] 0680-2228106 • Bhavnagar [email protected] 0278-3004116 • Bhubaneswar [email protected] 0674-6534585 • Chandigarh [email protected] 0172-5042279 • Dhule [email protected] 02562-282823 • Ferozepur [email protected] 01632-241814 • Gwalior [email protected] 9300004262 • Hubli [email protected] 0836-2252444 • Hyderabad [email protected] 040-44677075/ 44677076/44677077/44677348 • Indore [email protected] 0731-4266828 • Jalgaon [email protected] 0257-2226761 • Jalpaiguri [email protected] 03561-222136 • Jamshedpur [email protected] 0657-6655000 • Kollam [email protected] 0474-2747055 • Mirzapur [email protected] 7499496133 • Moga [email protected] 01636-230792 • Nellore [email protected] 0861-2349940 • Noida [email protected] 9310448805 • Panipat [email protected] 9315017304 • F C Road, Pune [email protected] 020-25533795 • Rajapalayam [email protected] 04563 - 232952 • Shimoga [email protected] 08182-228799 • Solapur [email protected] 0217-2300021 • Tirupathi [email protected] 0877-6544567 • Visakhapatnam [email protected] 0891-2714125