Invertase Production by Production by Saccharomyces cerevisise Y07 and YOgStraine Grown on by...
110
Invertase Production by Saccharomyces cerevisise Y07 and YOg Straine Grown on by Submitted in partial fufilment of the requirements for the degree of MasteD"of Technology in the Department of Biological Sciences M.L. Sultan Technikon Durban South Africa 4001
Transcript of Invertase Production by Production by Saccharomyces cerevisise Y07 and YOgStraine Grown on by...
Invertase Production by
Saccharomyces cerevisise Y07
and YOg Straine Grown on
by
Submitted in partial fufilment of the
requirements for the degree of
MasteD"of Technology
in the
Department of Biological Sciences
M.L. Sultan Technikon
Durban
South Africa
4001
OEClARA T~ON
I declare that this dissertation is my own, unaided work. It is being submitted for the
degree of Master of Technology to the M.L. Sultan Technikon, Durban.
It has not been submitted before for any degree or examination to any other tertiary
institution.
March 2001

DEDICATION
I dedicate this work to my wife, Monica, who has supported, encouraged and
believed in me and showed me that success is attainable through perseverance, and
to Dr. B. Odhav for her guidance and patience, and for her confidence in my ability to
succeed.

TABLE OF CONTENTS
lPage
ACKNOWLEDGEMENTS
UST OF FIGURES iii
UST OF TABLES iv
ABSTRACT vi
ABBRIEVIATIONS viii
1.0 INTRODUCTION AND UTIERATURIE RIEVIEW 1
1.1 Introduction 1
1.2 The Invertase Enzyme 6
1.3 Factoll"S Affecting IEnzyme Production 8
1.4 Yeast Morplhology 9
1.5 Yeast NutritioD1l 14
1.5.1 CarlboD1lSOIUlD"ce 15
1.5.2 OltygeD1lReqlUlireme01ts 18
1.5.3 NitrogeD1lSources 19
1.5.4 Phosphate Sources 20
1.5.5 Trace Mineral Elements 21
1.6 Genetics of the Invertase IEnzyme 21
1.6.1 Glucose Reprression of Invertase 21
1.7 Production of Invertase by Fermentation 24
1.7.1 Batch Fermentation 25
1.7.2 COD1ltorlllJlOIUISClUlltlUlrre(Chemestet) 26
1.7.3 Fed! Batch ClUllture 27
1.7.4 Commercial ED1IzymePreparations 29
Page
1.8 Current Status of Yeast Invertase Production 31
2.0 MAT IERIALS AND MIETHODS 36
2.1 Commercial Scale fermentations 37
2.1.1 Feed! Stock Preparation 38
2.1.2 Feed Rate 38
2.1.3 Separation 39
2.1.4 Fermentation Control 39
2.2 Yeast Strains and! inoculum Development 42
2.3 Baslc Fermentation Medium Composition 42
2.3.1 Carlbon Source 44
2.3.2 Nitmgen Source 44
2.3.2.1 Nitrogen from Molasses 45
2.3.2.2INitrogen from Inoculum 45
2.3.2.3 Nitrogen Required! from Urea 45
2.3.3 Phosphate SOlUlrces 46
2.3.3.1 Phosphate from Inoculum 46
2.3.3.2 Phosphate Required! from Phosphoric Acid 46
2.3.4 Volume of Wort 47
2.3.5 Volume of Inoculum 48
2.3.6 Trace IElements 49
2.3.7 pH Control 49
2.4 Analysis 49
2.4.1 Alcohol Determination 49
Page
2.4.2 Biomass Determination 50
2.4.3 Assay for lntracellular Invertase 50
2.4.4 Assay for IExtracellular Invertase 52
2.4.5 Nitrogen Analysis 53
2.4.6 Phosphate Determination 54
2.4.6.1.1 Molylbdovanadate Reagent 54
2.4.6.1.2 Phosphate solution 54
2.4.6.2Sample Preparation and Anaiysis 55
2.4.7 Separation of Biomass (Lab. Scale Fermentations) 55
2.4.8 Dry Matter (solids) Determination 56
2.4.9 Determination of Total Invert Sugar (liS) in Wort 56
2.5 Laboratory Fermentations
2.5.1 Manipulation of Sources of Nitrogen
2.5.2 ManilPlUllationof Fermentation Time
2.5.3 Change of feed Pattern
Plant Trials
3.0
3.1
RESULTS AND DiSCUSSION
Enzyme levels Under current Fermentation Conditions
57
58
58
59
59
60
60
2.6
3.2 invertase levels as a Function of Varying Fermentation
Conditions
3.2.1 Enzyme Production using Urea and DAP
3.2.2 Enzyme Production as a function of fermentation
Time 65
62
63
3.2.3 Invertase levels in Batch and Fed Batch Cultures 68
3.2.3.1IBatclhCulture 68
Page
3.2.3.2IFed Balch CultlUlre 70
3.3 Model forr Optimum Enzyme Production 001 Plant Scale 72
4.0 CONCLUSION 79
5.0 RECOMMENDATIONS AND POTENTIAL USIES 84
LIST OF REFERENCES 86
APPENDIX 94
APPENDIX ii 95
ACKNOWLEDGEMENTS
The author wishes to express his sincere gratitude to the following individuals
for their assistance in preparation of this dissertation.
My Supervisor, 101r.lB. Odllhlay, Department of Biological Sciences, ML Sultan
Technikon, for her invaluable advice, encouragement and constructive
criticism.
Mir. J. A. DIUJlP~essos, Operations Director, Nep Yeast (PTV) Ltd., for
providing financial assistance and making available the laboratory and
facilities at Nep Yeast (Durban), where the practical aspects of this study
were carried out, and also for the advice and information afforded.
Mw. ~. Il<. McClreadly, Technical Manager, Nep Yeast (PTV) Ltd., for
guidance, assistance and constructive criticism during writing up of this
dissertation.
MIT'S.L. Heads, Financial Manager, Nep Yeast (PTV) Ltd., for her valuable
input into the layout of the dissertation.
Mir. J. Jall1lselnl van lRelnlslblUJrg, Engineering Manager, Nep Yeast (PTV) Ltd.,
for permission to reproduce the factory layout and assistance with drawings.
Mr. A. SUlI1glhl ami V. ~gcolbo, for assistance with the running of
fermentations and analyses on the yeast produced.
Mr. J. van Aswegall1, Technical Director, Enzymes SA, for providing samples
of purified enzymes and information on the enzyme industry in South Africa.
101r.S. SOll1glhl,Dr. IK. Permaul amll Dr, IR. Govomllell1, Department of Biological
Sciences, ML Sultan Technikon, for guidance during the write-up phase.
Mw. IF. Molhlamedl, my friend and colleague, for the time and effort he put into
proof reading the dissertation.
ii
Figure 1.
Figure 2.
Figure 3.
Figure 4.
Figure 5.
Figure 6.
Figure 7.
Figure 8.
Figure 9.
UST alf flGURIES
Flow diagram of the process for high-test molasses production.
Graphical representation of the hydrolysis of sucrose by
invertase to a levorotatory mixture of glucose and fructose.
Regulation of glucose metabolism in S. cerevisiae.
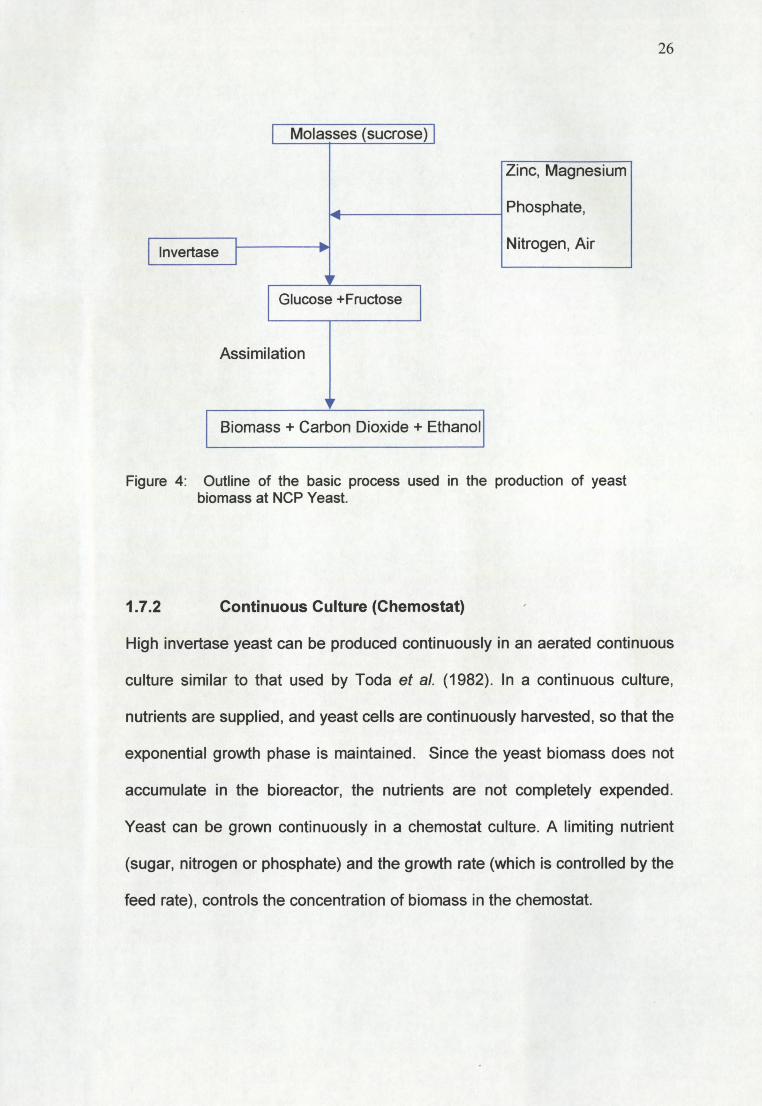
Outline of the basic process used in the production of
yeast biomass at NCP Yeast.
Layout of the fermentation plant at NCP Yeast (Durban).
Molasses sterilization equipment showing direct steam injection,
holding pipe and expansion tank.
Effect of fermentation time on invertase production by S. cerevisiae
strains Y07 and Y09 grown on sugarcane blackstrap-molasses.
Page
3
7
23
26
40
41
67
pH and alcohol profiles of batch fermentations with S. cerevlsiee
strains Y07 and Y09 grown on sugarcane blackstrap molasses. 69
Average alcohol profiles of 24 hour fermentations of S. cerevisiae Y07,
grown on sugarcane blackstrap molasses, that yielded invertase activities
of below 20% (Low Invertase) and above 20% (High Invertase). 78
iii
UST Of TABLES
Page
Table 1. Sugar added per hour, alcohol and growth profile of
a 14 hour fermentation carried out on the plant scale,
demonstrating the Crabtree Effect. 29
Table 2. Composition of the basic fermentation medium. 43
Table 3. Levels of the enzymes obtained using current conditions at
NCP Yeast plant, Durban. 63
Table 4. The effect of urea and di-ammonium phosphate (DAP) on the
production of invertase by S. cerevisiae Y07 and YOg strains
grown on sugarcane blackstrap molasses at 30aC with
incremental feeding for 14 hours. 65
Table 5. The effect of fermentation time on enzyme activity of
S. cerevisiae grown for 14 hours and 24 hours on sugarcane
blackstrap molasses 68
Table 6. Average alcohol level of 14 hour fermentations of S. cerevisiae
Y07 and YOg strains at start, the 7th hour and the 14th hour. 71
Table 7. Average alcohol levels of 24 hour fermentations of S. cerevisiae
Y07 and YOg strains at start, the 6th hour, the 12th hour,
and 24th hour. 72
iv
Page
Table 8. Alcohol levels of 24h fermentations of S. cerevisiae
Y07 strain grown on sugarcane blackstrap molasses that yielded
intracellular invertase levels of below 20% 76
Table 9. Alcohol profiles of 24 hour fermentations of S. cerevisiae strain
Y07 grown on sugarcane blackstrap molasses that produced
intracellular invertase with a specific invertase activity of over
20%. 77
Table 10. Invertase activities of 11 batches of invertase yeast produce
on the plant scale at Nep Yeast, using the proposed
optimised fermentation profile. 83
v
ABSTRACT
Yeast invertase is used in the sugar industry to produce high-test
molasses in South Africa. Invertase also has important applications in the
sweet and confectionery industry. Currently, NCP Yeast (PTY) Ltd.
(Durban) is producing high invertase activity yeast by fermentation of S.
cerevisiae Y07, using sugar cane blackstrap molasses as a substrate.
There are two problems with this fermentation: -
a) The high invertase activity yeast produced, has an enzyme activity of
10-15% lower than the minimum acceptable limit required by the sugar
refineries,
b) There is little or no consistency in the invertase activity from batch to
batch.
In an attempt to increase the invertase activity of the yeast, two nitrogen
sources, viz., urea and diammonium phosphate (DAP), batch and
incrementally fed batch and fermentation times of 14 hours and 24 hours
were studied using two different strains (Y07 and YOg) of S. cerevisiae.
The intracellular and extracellular enzyme levels were measured to
determine the effect of the manipulations on invertase production. Urea
was found to be the nitrogen source that was more suited to enzyme
production than DAP. Fermentations after 24 hours produced increased
intracellular enzyme activity as compared to 14 hour fermentations. Strain
Y07 was found to produce higher levels of invertase than strain YOg. A
VI
feed profile for a 24 hour fermentation using urea as the nitrogen source,
based on controlling the alcohol concentration, by manipulating the rate of
molasses addition is proposed for the production of invertase by S.
cerevisiae strain Y07. The proposed feed pattern is a two stage
fermentation with the first 5 hours of fermentation being batch
fermentation, becoming an incrementally fed batch fermentation from the
6th hour onwards. The sugar added to the fermentation at start should be
sufficient to allow the alcohol concentration to peak at a maximum of 1.0%
by the 6th hour. The feed rate should then be controlled so as to decrease
the alcohol level from 1.0% to about 0.50% over the next 10 hours and
maintain an alcohol level of between 0.40% and 0.50% until the end of
fermentation. The marked increase in the enzyme activity of the broth
observed using this fermentation feed pattern, allows for the possibility of
using the broth of baker's yeast fermentations as a source of enzyme in a
process for the production of purified invertase. Harvesting invertase from
the broth presents a financially rewarding opportunity to add extra value to
the effluent of yeast biomass fermentation, which otherwise is very
expensive to dispose. The results of this study are now being
implemented on the plant scale and have contributed to an increased
profit margin of 30% for invertase yeast.
VII
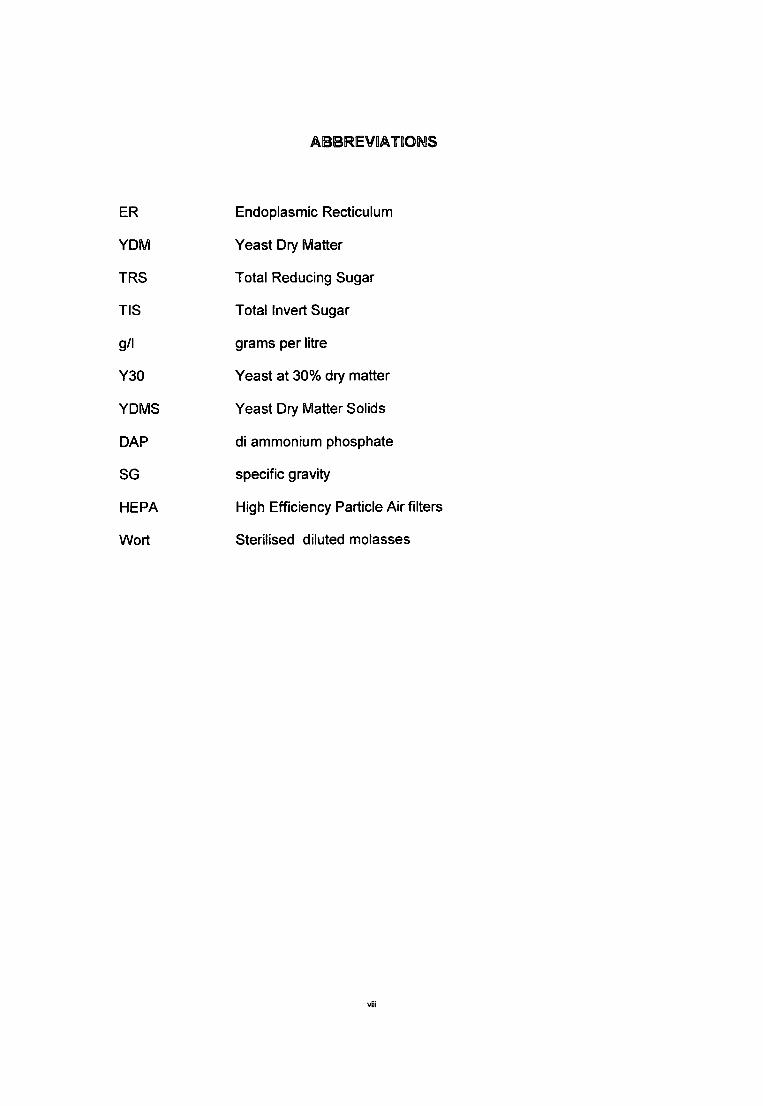
ABIBREV~AT~OINlS
ER Endoplasmic Recticulum
YDM Yeast Dry Matter
TRS Total Reducing Sugar
TIS Total Invert Sugar
g/I grams per litre
Y30 Yeast at 30% dry matter
YDMS Yeast Dry Matter Solids
DAP di ammonium phosphate
SG specific gravity
HEPA High Efficiency Particle Air filters
Wort Sterilised diluted molasses
viii
1
1.0 INTRODUCTION AND LITERATURE REVIEW
1.1 Introduction
There are two major yeast manufacturers in South Africa, Anchor Yeast and
NCP Yeast. Anchor Yeast holds about 60% and NCP Yeast about 40% of the
market share in South Africa. The income generated by this sector of the
food industry is estimated at R400 million per annum (Du Plessis, J., pers.
comm.). The yeast produced is used primarily for baking by commercial
bakeries and to a smaller extent for home baking. Yeast is also produced for
the brewing of sorghum beer, for commercial and for home brewing. Smaller
amounts of speciality yeasts are produced for applications in the wine
industry, for biocontrol in the agriculture sector and for enzyme production,
such as invertase, which catalyses the hydrolysis of sucrose to glucose and
fructose.
A strain of Saccharomyces cerevisiae (S. cerevisiae) has been selected for its
ability to produce high invertase levels. This yeast is produced in the same
production process as that of commercial Baker's yeast. The income
generated by the sale of this specific yeast strain to the sugar industry in 1998
was approximately R600 000 (Du Plessis, J., pers. comm). The enzyme
invertase has important applications in the sweet and confectionery industry
and more recently in the sugar refining industry in South Africa, where it is
used to produce high-test molasses, which is used as the substrate for lysine
fermentation.
{Du Plessis, J., Nep Yeast (PTY) Ltd. 200 Stanger Street, Durban, RSA.]
2
In the sweet and confectionery industry, invertase is used in the production of
soft centered sweets and chocolates. The enzyme provides a plastic
consistency to the centres and prevents the crystalisation of sucrose during
storage (Reed and Nagodawithana, 1991).
Another important application for the invertase enzyme is the production of
high-test molasses. In South Africa, this industry has grown significantly over
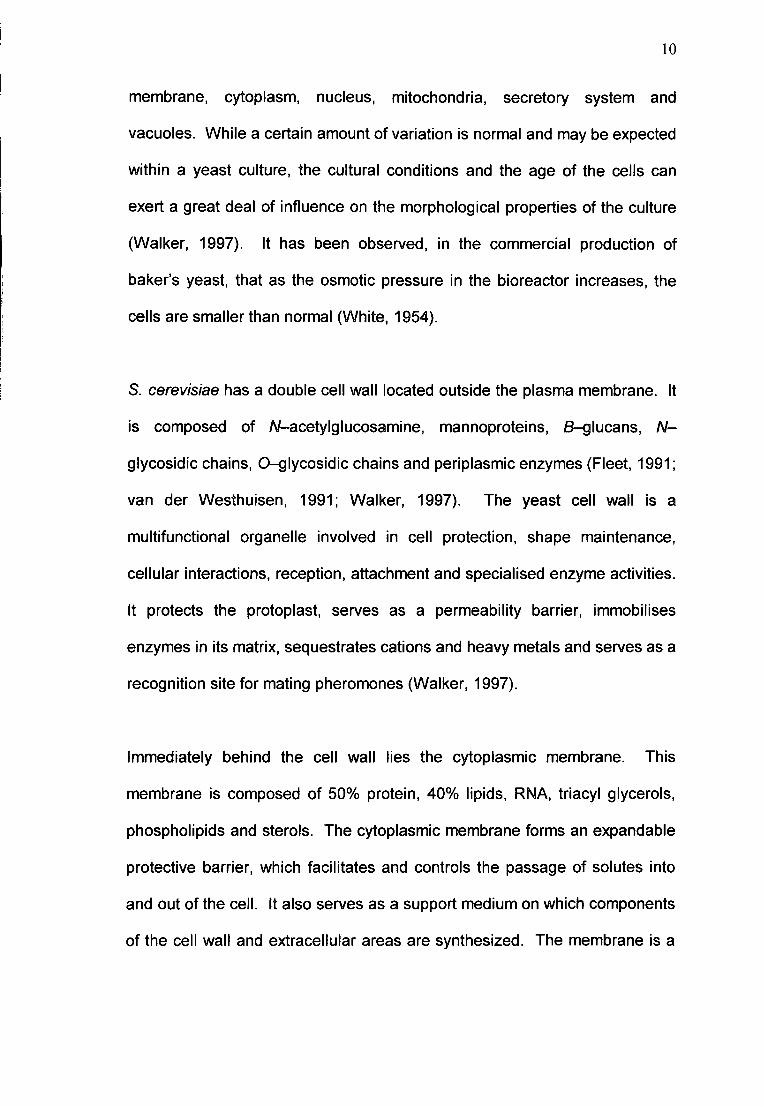
recent years. About 150 tons of high-test molasses was produced daily in
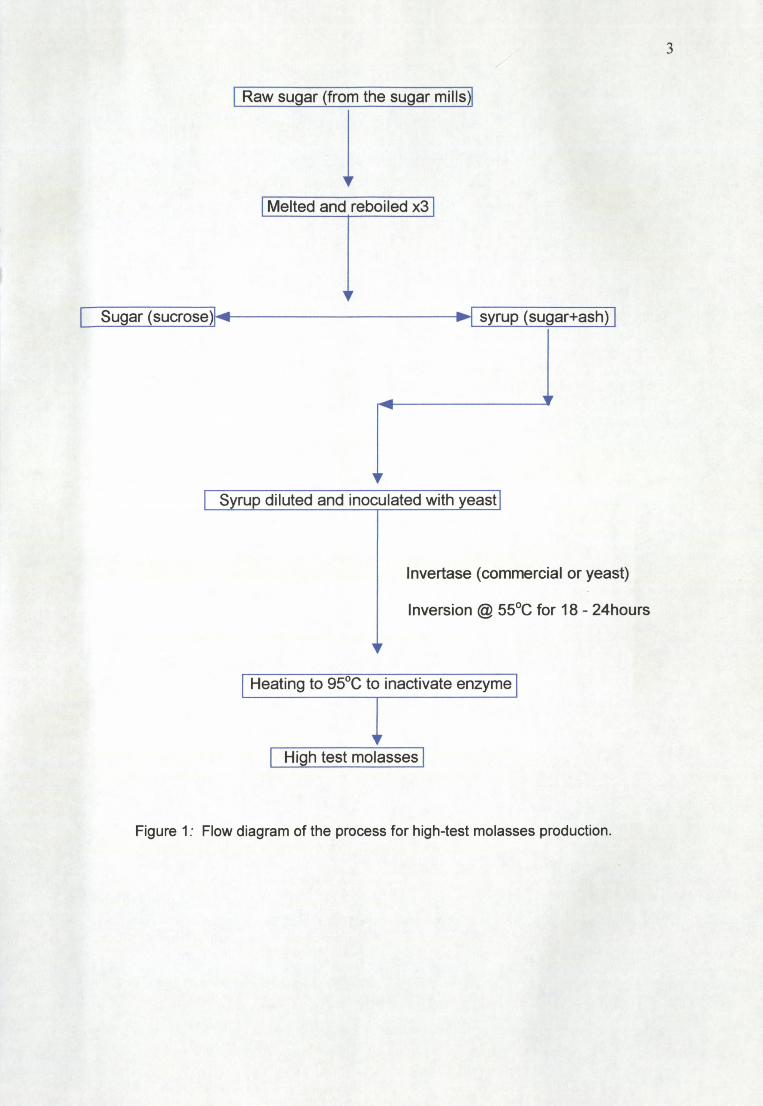
1998 (Soji, C. N., pers. comm.). The process of high-test molasses
production is outlined in Fig. 1.
In this process, according to Imrith (pers. comm.), sugar cane syrup at about
75° brix is diluted with water to 55° brix. A special strain of yeast that is a
high-producer of invertase enzyme is inoculated into the batch, and the
temperature is maintained at 55°C for 18 to 24 hours. The temperature is then
raised to 95°C to inactivate the enzyme. The inverted solution is then
concentrated up to about 80° brix. The resultant high-test molasses can now
be used as a substrate for fermentation. The main use of this high
glucose/fructose syrup at present is as a raw material in the production of
lysine by fermentation (Imrith, N., pers. comm.). Other possible uses for high-
test molasses include, usage as a substrate for ethanol and yeast biomass
fermentations. Using yeast with a high invertase activity to carry out the
inversion of the sucrose reduces the cost of production of high-test molasses.
[Soji, c. N., and Imrith, N., Hul/ets Sugar Refineries, South Coast Road, Durban, RSA]
3
I Raw sugar (from the sugar mills)1
j
Sugar (sucrose ),...I~II------------~...Isyrup (sugar+ash) I
Syrup diluted and inoculated with yeast
Invertase (commercial or yeast)
Inversion @ 55°C for 18 - 24hours
Heating to 95°C to inactivate enzyme
High test molasses I
Figure 1: Flow diagram of the process for high-test molasses production.
4
The enzymeïs available commercially as a powder with an enzyme activity of
about 200 000 Sumner units. One Sumner unit represents the amount of
invertase that produces 1.0 mg of invert sugar in 5 minutes in 6 ml of 5.4%
sucrose solution at 20°C and at pH 4.? (van Aswegan, J., pers. comm.).
Commercial enzyme preparations with this activity would cost in the region of
R2 000 per kilogram. Since a pure enzyme preparation is not a critical
requirement for the production of high-test molasses, a cheaper alternative
would be to use yeast that has a high invertase activity.
Currently, NCP Yeast (PTY) Ltd. (Durban) is producing high invertase activity
yeast by fermentation of S. cerevisiae YO?, using sugar cane blackstrap
molasses as a substrate. There are two problems with this fermentation: -
a) The high invertase activity yeast produced, has an enzyme activity of 10-
15% lower than the minimum acceptable limit required by the sugar
refineries,
b) There is little or no consistency in the invertase activity from batch to
batch.
To overcome these problems the enzyme activity of the yeast may be
improved by: -
i) Using a different strain of yeast,
ii) Producing invertase yeast in a chemostat culture,
iii) Genetically manipulating the yeast, and
iv) Manipulating current fermentation conditions.
[van Aswegan, J., Enzymes South Africa (ESA), Sandton, RSA]
5
In view of the infrastructure that is in place at NCP Yeast (Durban), the
manipulation of the current fermentation conditions is the best option available
since:
• Changing the strain of yeast may not be an ideal alternative as this will
result in lost time in a manufacturing plant that produces baker's yeast as
the primary product.
G Production of invertase in a chemostat type of fermentation will not be
feasible in the existing plant that is designed for batch fermentation
processes.
(;) Genetically manipulated yeast has to comply with stringent legislation, and
there is always the possibility that genetically modified organisms or
products of these organisms, may draw negative reactions from the
general public.
The overall aim of this project is to increase the invertase activity and to
improve the reproducibility of this activity by manipulation of the fermentation
conditions. In order to achieve this objective, the following experimental steps
were designed and undertaken: -
ct Analysis of the effect of current and past fermentation conditions on
invertase activity.
& Determining the effect of urea and diammonium phosphate on enzyme
production.
• Comparing the enzyme productions of 14 hour and 24 hour fermentations.
• Determining the location of the enzyme (intracellular and extracellular).
6
ft Implementing the above optimized conditions for invertase production on
the plant scale to assess the effect of the modifications on· invertase
production
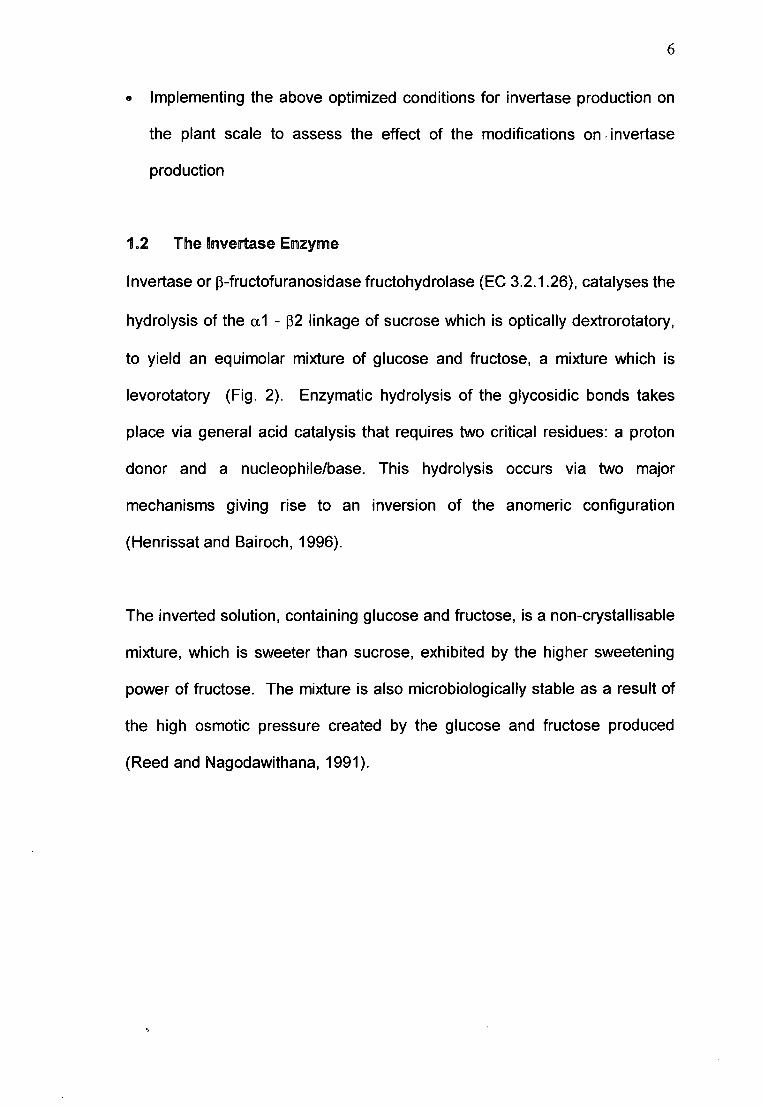
1.2 The InvertaseEnzyme
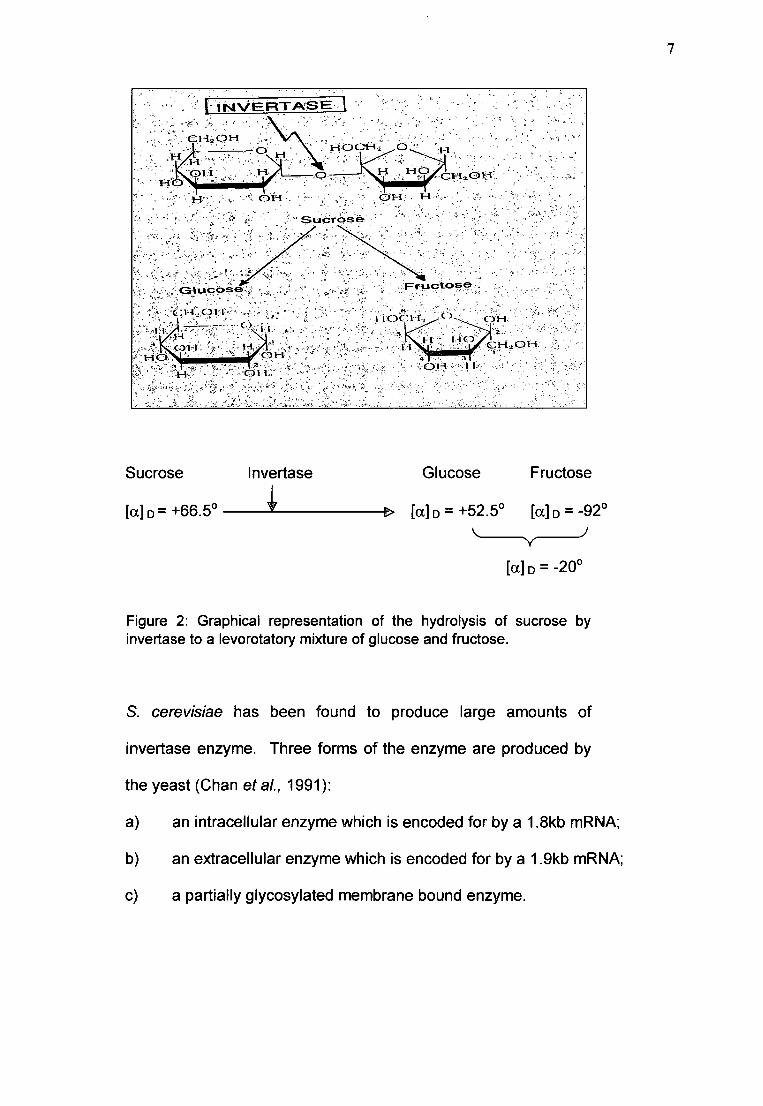
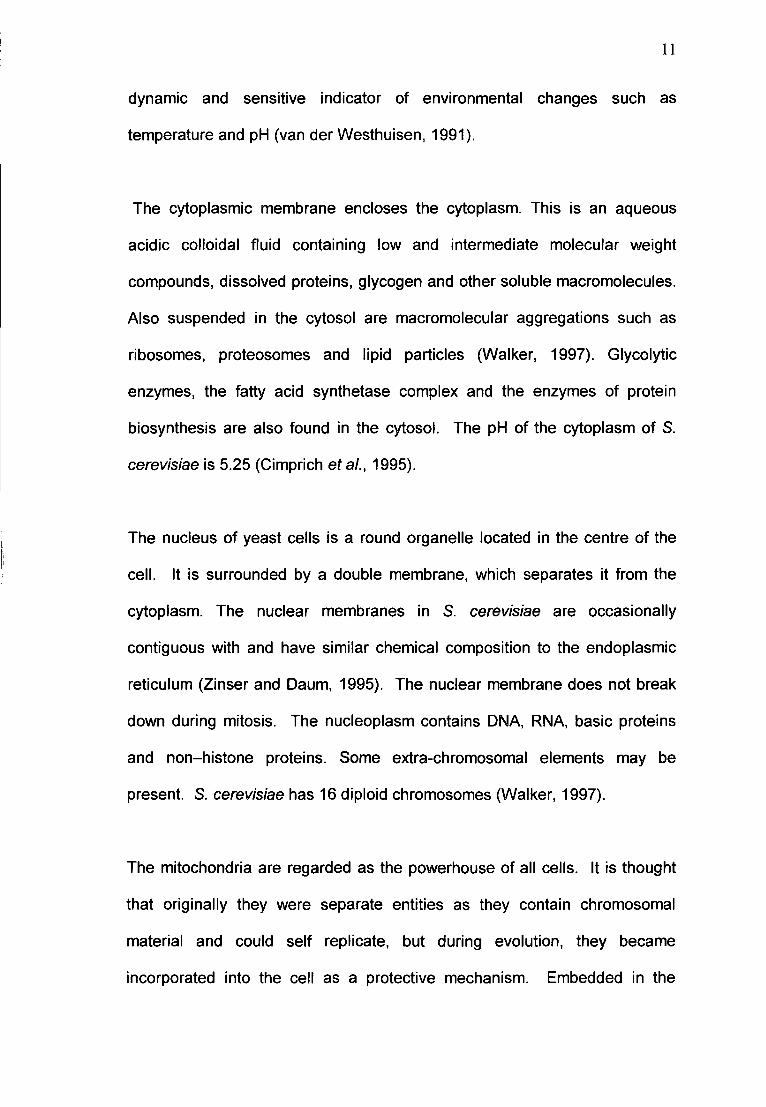
Invertase or p-fructofuranosidase fructohydrolase (EC 3.2.1.26), catalyses the
hydrolysis of the a 1 - p2 linkage of sucrose which is optically dextrorotatory,
to yield an equimolar mixture of glucose and fructose, a mixture which is
levorotatory (Fig. 2). Enzymatic hydrolysis of the glycosidic bonds takes
place via general acid catalysis that requires two critical residues: a proton
donor and a nucleophile/base. This hydrolysis occurs via two major
mechanisms giving rise to an inversion of the anomeric configuration
(Henrissat and Bairoch, 1996).
The inverted solution, containing glucose and fructose, is a non-crystallisable
mixture, which is sweeter than sucrose, exhibited by the higher sweetening
power of fructose. The mixture is also microbiologically stable as a result of
the high osmotic pressure created by the glucose and fructose produced
(Reed and Nagodawithana, 1991).
7
Sucrose Invertase
[a] D = +66.50-_ ......~-----I!l> [a] D = +52.50
'-....._--... - ......JY
Glucose Fructose
[a] D = -920
[a] D = -200
Figure 2: Graphical representation of the hydrolysis of sucrose byinvertase to a levorotatory mixture of glucose and fructose.
S. cerevisiae has been found to produce large amounts of
invertase enzyme. Three forms of the enzyme are produced by
the yeast (Chan et ai., 1991):
a) an intracellular enzyme which is encoded for by a 1.8kb mRNA;
b) an extracellular enzyme which is encoded for by a 1.9kb mRNA;
c) a partially glycosylated membrane bound enzyme.
8
Both forms of mRNA's are differently regulated in response to glucose
concentration, as is the synthesis of the two forms of invertase. The
intracellular enzyme has a molecular weight of 135 000 daltons, it is non-
glycosylated and insoluble. The extracellular enzyme has been found to
contain phosphomannan, which makes up approximately half of it's molecular
weight of 270 000 daltons. The extracellular enzyme exhibits optimum
stability in the pH range 3.5 to 7.5, while the intracellular enzyme has a pH
stability range of 6.0 to 9.0. Both enzymes exhibit optimum activity between
pH 3.5 and pH 5.5 (Gascon et aI., 1968; Reed and Nagodawithana, 1991).
The extracellular enzyme is stable at a temperature of 55°C and is inactivated
at 65°C. This stability is due to the protective role of the phosphomannan
moieties present in the extracellular enzyme (Arnold, 1969).
1.3 lFactorrs Affectolr1lgElr1lzymeProduction
Studies indicate that the glucose concentration, inorganic phosphate levels
and the cell cycle of the yeast affect the production of the invertase enzyme.
To produce S. cerevisiae cells suitable for invertase production, the following
factors must be considered: -
• Glucose inhibition of invertase, which occurs at glucose concentrations higher
that 2 g/I (Patkar and Seo, 1992; Vitolo et aI., 1995) .
., Invertase activity of intact cells oscillates at intervals of about 2 h in either
steady state continuous or fed batch cultures, as glucose concentrations
range from 2 g/I to 5 g/1. This oscillation in enzyme activity is related to the
budding cycle of the yeast (Patkar and Seo, 1992; Rouwenhorst et aI., 1991;
Vitolo et aI., 1995).
9
• Finally, the cost of production will be greatly reduced if the raw materials used
were cheap. In the case of yeast biomass production, sugar is the most
expensive of the raw materials used and this can be derived from molasses,
which is the waste product of the sugar industry. Knowledge of the
morphology and function of yeast cells is relevant in yeast biotechnology.
This knowledge is beneficial when industrial exploitation of yeasts is
undertaken, e.g. knowledge of the secretory pathway in S. cerevisiae would
be beneficial in the production of the invertase enzyme. It would facilitate the
optimisation of the down stream processing of the enzyme and minimise the
cost of production of the enzyme, since lysing of the cells can be eliminated
from the processing step.
1.4 YeastMorphology
The yeast of importance in the baking and fermentation industries is S.
cerevisiae. It is classified as follows:
Kingdom: Protista
Division: Mycota
Subdivision: Eumycotina
Class: Ascomycetes
Sub class: Hemiascomycetidea
Order: Endomycetales
Family: Saccharomycetaceae
Genus: Saccharomyces
Species: cerevisiae
The morphology of the yeast cells varies within the same species. However
the cells have the same basic organelles such as the cell wall, cytoplasmic
10
membrane, cytoplasm, nucleus, mitochondria, secretory system and
vacuoles. While a certain amount of variation is normal and may be expected
within a yeast culture, the cultural conditions and the age of the cells can
exert a great deal of influence on the morphological properties of the culture
(Walker, 1997). It has been observed, in the commercial production of
baker's yeast, that as the osmotic pressure in the bioreactor increases, the
cells are smaller than normal (White, 1954).
s. cerevisiae has a double cell wall located outside the plasma membrane. It
is composed of N-acetylglucosamine, mannoproteins, B-glucans, N-
glycosidic chains, O-glycosidic chains and peri plasmic enzymes (Fleet, 1991;
van der Westhuisen, 1991; Walker, 1997). The yeast cell wall is a
multifunctional organelle involved in cell protection, shape maintenance,
cellular interactions, reception, attachment and specialised enzyme activities.
It protects the protoplast, serves as a permeability barrier, immobilises
enzymes in its matrix, sequestrates cations and heavy metals and serves as a
recognition site for mating pheromones (Walker, 1997).
Immediately behind the cell wall lies the cytoplasmic membrane. This
membrane is composed of 50% protein, 40% lipids, RNA, triacyl glycerols,
phospholipids and sterols. The cytoplasmic membrane forms an expandable
protective barrier, which facilitates and controls the passage of solutes into
and out of the cell. It also serves as a support medium on which components
of the cell wall and extracellular areas are synthesized. The membrane is a
11
dynamic and sensitive indicator of environmental changes such as
temperature and pH (van der Westhuisen, 1991).
The cytoplasmic membrane encloses the cytoplasm. This is an aqueous
acidic colloidal fluid containing low and intermediate molecular weight
compounds, dissolved proteins, glycogen and other soluble macromolecules.
Also suspended in the cytosol are macromolecular aggregations such as
ribosomes, proteosomes and lipid particles (Walker, 1997). Glycolytic
enzymes, the fatty acid synthetase complex and the enzymes of protein
biosynthesis are also found in the cytosol. The pH of the cytoplasm of S.
cerevisiae is 5.25 (Cimprich et aI., 1995).
The nucleus of yeast cells is a round organelle located in the centre of the
cell. It is surrounded by a double membrane, which separates it from the
cytoplasm. The nuclear membranes in S. cerevisiae are occasionally
contiguous with and have similar chemical composition to the endoplasmic
reticulum (Zinser and Daum, 1995). The nuclear membrane does not break
down during mitosis. The nucleoplasm contains DNA, RNA, basic proteins
and non-histone proteins. Some extra-chromosomal elements may be
present. S. cerevisiae has 16 diploid chromosomes (Walker, 1997).
The mitochondria are regarded as the powerhouse of all cells. It is thought
that originally they were separate entities as they contain chromosomal
material and could self replicate, but during evolution, they became
incorporated into the cell as a protective mechanism. Embedded in the
12
double membrane of each mitochondrion are a series of metal complexed
proteins, which are responsible for the production of energy in the respiratory
pathway (van der Westhuisen, 1991). Visser et al. (1995) studied the
morphology of the mitochondria of yeast cells grown under conditions of
variable oxygen supply and carbon source availability and found distinct
differences in the morphology of the mitochondria of S. cerevisiae grown
under these conditions. Under aerobic conditions, yeast mitochondria were
primarily involved in ATP synthesis during respiration. When there was an
excess of glucose as the substrate, a few large mitochondria were present.
Cells grown under the same conditions with excess ethanol as the substrate,
yielded, many small mitochondria. In a glucose limited, aerobic chemostat
culture many small mitochondria prevailed. Under anaerobic conditions,
mitochondria were redundant in the respiratory sense due to the absence of
oxygen as terminal electron acceptor. With excess, as well as limiting glucose
concentrations, few large mitochondria were observed (Visser et al. 1995).
The export of proteins by secretion from yeast cells involves intra- and inter-
membranous trafficking (via vesicles) in which the endoplasmic reticulum
(ER), golgi apparatus and plasma membrane all participate. Proteins
destined for the vacuole are also transported by secretory organelles
(Walker, 1997). The secretory pathway has been extensively studied in S.
cerevisiae by a number of researchers (Lupashin et al., 1996; Pryer et al.,
1992; Salama and Schekman, 1995). Briefly, the secretion of proteins by
budding yeasts can be outlined as:
13
• Proteins destined for secretion are synthesized on ER - associated
polysomes.
• These proteins are then discharged into the lumen of the ER.
e In the ER, protein cleavage of a signal peptide and chaperone - assisted
protein folding occurs along with glycosylation.
I!l The proteins are then directed from the ER by vesicles, which fuse to the cis -
golgi apparatus.
e In the golgi apparatus, further modifications of carbohydrate side chains on the
proteins occur.
o Vesicles derived from budding of the late - golgi transports the proteins to the
final destination.
Pfeffer and Rothman (1987) proposed a pathway for the transport of protein
through the cell (i.e., intermembranous transport). They proposed that the
transport steps connecting compartments are mediated by fusion and budding
of transport vesicles. Each of these steps are unidirectional and energy
dependant. The golgi apparatus consists of three functional areas termed cis,
medial and trans. They suggest that the path of protein from the ER through
to the cis-golgi, then the medial-golgi, the trans-golgi and finally the cell
surface is signal independent and accounts for the bulk of the protein flow.
They propose that the retention of resident proteins in the ER and the golgi
apparatus, as well as the transport to the Iysosomes and storage secretory
vesicles is signal mediated.
14
Another integral member of the intra-membranous system is the vacuole.
The vacuole is separated from the rest of the cytoplasm by a single
membrane called the tonoplast. The vacuole is a lysosome-like acidic
compartment, which is responsible for intracellular proteolysis in yeasts. The
enzymes found in the vacuole are endopeptidases, aminopeptidases and
carboxypeptidases, which are delivered to the vacuole by the secretory
pathway (van der Westhuisen, 1991; Walker, 1997).
1.5 Yeast Nutrotoon
Yeasts generally have simple nutrient requirements for growth. These are: a
source of sugar (energy), nitrogen, water and air (for biomass production). A
chemical compound can, in general, have two effects on yeast when present
at a particular concentration. It may be beneficial which usually means that it
acts as a nutrient to promote some activity, usually growth. Alternatively, it
can have an adverse effect on the yeast and act as an anti-microbial
compound. A third possibility is that the yeast may be indifferent to its
presence in the medium, an example of such a compound is agar, which is
used to solidify media, and has no effect on the yeast behaviour (Rose,
1987). A comprehensive analysis of the yeast is required in order to
determine the kinds and quantities of compounds to be supplied in the
medium for satisfactory yeast growth. The average composition of baker's
yeast as a percentage of Yeast Dry Matter (YOM) is as follows (White, 1954):
• Carbon
• Oxygen
• Nitrogen
46% of YOM
32% of YOM
8.5% of YOM
15
• Hydrogen
• Total Ash
6 % of YOM
7.5% of YOM
The main components of the ash are phosphate, potassium and magnesium.
Calcium, silica, alumimium, iron, sulphur, copper and chlorine are present in
trace amounts. On the assumption that 200 g of sucrose is require to
produce 100 g of yeast biomass under optimum growth conditions, the
following material balance equation can be used: -
200 g sucrose + 10.32 g NH3 + 100.44 g 02 + 7.5 g "ash": ----I>~ 100 g yeast
solids + 140.14 g CO2 + 78.12 g H20
In addition to sucrose, 10.32 g ammonia (or other suitable nitrogen source),
100.44 g oxygen (1 g of oxygen per gram of yeast biomass produced) and 7.5
g of "ash" is required (van der Westhuisen, 1991; White, 1954).
1.5.1 CarboD1lSource
Yeast requires a source of carbon for energy and growth generally derived
from the carbohydrates in the medium (White, 1954). Approximately 5% of
the carbon requirement of yeast can be derived from carbon dioxide. Such
"fixation" is necessary in anaplerotic reactions to replace dicarboxylic acids of
the tricarboxylic acid cycle employed in the biosynthesis of amino acids, fatty
acids, purines and pyrimidines (Bull and Bushell, 1976; Walker, 1997). Yeasts
are chemoorganotrophic organisms. This means that they can obtain carbon
and energy from compounds in fixed, organic linkages (Walker, 1997). S.
cerevisiae has only a narrow range of sugars which can be considered as
good growth and fermentation substrates; viz., glucose, fructose, mannose,
16
galactose, sucrose and maltose. Other carbon substrates such as ethanol
and acetate can act as respiratory substrates only in S. cerevisiae (van der
Westhuisen, 1991).
Sugar cane molasses is generally used in subtropical areas where cane is
grown. In the Northern Hemisphere where sugar beets are grown
extensively, beet molasses is used widely. In yeast plants using beet
molasses as the main sugar source, 20% cane molasses is added to supply
enough biotin, which is deficient in beet molasses, for yeast growth
(McCready, 1992; Reed and Nagodawithana, 1991; White, 1954). Beet
molasses also has the advantage of being easier to clarify than cane
molasses, which contains colloidal substances that make it difficult to clarify.
Sugar cane molasses has a total sugar content of 73.1% compared to 66.5%
in beet molasses. Of this, 45.5% of the total sugar in cane molasses is
sucrose, while 63.5% of the total sugars in beet, is sucrose. Cane molasses
also does not contain any raffinose, whereas, beet molasses contains 1.5%
raffinose. The invert sugar content of cane molasses is 22.5%, while beet
molasses does not contain any invert sugar. The total organic matter of cane
molasses is 15.5% compared to 23.0% in beet. The inorganic matter of cane
molasses is slightly higher than that of beet, at 11.7% compared to 10.5% in
beet molasses (Reed and Nagodawithana, 1991; White, 1954).
17
In commercial yeast fermentation the main source of carbohydrate is sugar
cane or beet molasses (Maharaj and Naidoo, 1993). In South Africa, yeast is
manufactured, using Sugar cane Blackstrap molasses as the only source of
sugar. Maharaj and Naidoo (1993) compared the quality of the molasses
produced by the different sugar mills in the sugar belt of Kwa-Zulu Natal and
the Eastern Transvaal and found that there were significant variations in the
molasses from different areas with regard to the sugar concentration and
metal (iron, copper, chromium) concentrations. It was noted that the sugar
concentration at the start of the crushing season was generally higher in all
samples and this was attributed to the poor efficiency of mills at start up.
About four weeks into the season the sugars start to drop and once the mills
are running at optimum efficiency, the sugar levels stabilise. To the yeast
manufacturer, this variation in sugar content of the molasses could cause
problems with quality of the yeast produced and would impact on the overall
efficiency of the fermentation process, if not managed and actioned properly.
S. cerevisiae is unable to assimilate sucrose. Sucrose must first be
hydrolysed to glucose and fructose by the invertase enzyme, before the yeast
can take it up. There are two mechanisms by which sugars can by
transported into the cell:
ct passive facilitated diffusion, which is a simple diffusion across a
concentration gradient and no cellular energy is used; and
• active transport, which is a slower system, and involves the movement of
metabolites against a concentration gradient into the cell. These metabolites
18
are attached to an energised carrier, carried across the cell membrane and
released inside the cell. This transport system requires the expenditure of
cellular energy (van der Westhuisen, 1991).
1.5.2 OxygenRequirements
White (1954) observed that when passing a stream of compressed air in a
state of fine division into the growth medium, the normal yeast fermentation is
completely changed and yeast growth is encouraged at the expense of
alcohol production. Aeration also improves the dispersal of carbon dioxide
from the medium and provides agitation, which stimulates cell growth. Yeast
is unable to grow in the total absence of oxygen. This is because, as well as
providing a substrate for respiratory enzymes during aerobic growth, oxygen
is required for certain growth maintaining hydroxylation reactions. The
ergosterol and oleic acid requirement by S. cerevisiae for growth in the
absence of oxygen dispels the notion that this yeast can grow truly
anaerobically. Oxygen is therefore regarded as an important growth factor
(Walker, 1997).
Oxygen is added to the bioreactor in commercial yeast production plants by
pumping filtered air through a sparger assembly located at the bottom (inside)
of the vessel. There are several types and makes of blowers used for this
purpose. These can be broadly divided into two classes, i.e., wet blowers or
dry blowers. With the wet blower, water is used for cooling of the bearings of
the motor and the pump. Air from the atmosphere is drawn through a series
of High Efficiency Particulate Air filters (HEPA filters) and passed through an
air/water separator, to remove the water from the air, before it enters the
19
bioreactor via the spargers. The dry blowers do not use water for cooling
hence the name dry blower. Air is filtered, as with the wet blowers and
pumped directly into the fermentation vessel. Also available and used in
some yeast plants are variable speed blowers. These blowers have a facility
to control the motor speed, thus making it possible to control the amount of air
pumped into the fermenter. With the variable speed blower, the air supply is
increased incrementally, as the biomass increases in the vessel. The
average amount of air that is pumped into a 100 kl bioreactor is about
5000 m3/hr (Du Plessis, J., pers. comm.).
With yeast biomass fermentations, the air available invariably becomes a
limiting factor as fermentation progresses. This means that if a fixed speed
blower is used, the air pumped into the fermenter at the early stages of the
fermentation would be in excess, and at the later stages this would become
limiting due to the rapid increase in biomass (Du Plessis, 1991).
1.5.3 Nitlfogen SOUllfces
The average fixed nitrogen composition of baker's compressed yeast is
between 8.0 and 8.5%. Beet and cane molasses contain small quantities of
nitrogen that are insufficient to sustain yeast growth (White 1954). Therefore,
the medium has to be supplemented with a source of nitrogen. Commercially,
ammonium salts, such as ammonium sulphate or diammonium phosphate, or
urea, are used as nitrogen sources. The nitrogen and phosphate derived
diammonium phosphate is taken up completely by the yeast as no trace of
this compound is found in the medium after fermentation (White, 1954).
[Du Plessis, J., Nep Yeast (PTY) Ltd. 200 Stanger Street, Durban, RSA.]
z.~ - 2..1 <.;;, ,
BQ_", 10,+-9,':) 20
The yeast assimilates a maximum of 90% of the urea added to the medium
(Du Plessis, 1991). In commercial yeast production urea is the preferred
source of nitrogen since it is cheaper than the other available nitrogen
sources.
The final nitrogen content of the yeast is an important indicator of the gassing
activity and more importantly of the shelf life or stability of the yeast. At high
nitrogen content, the yeast will have high gassing activity but the shelf life will
be reduced, and vice versa. It is therefore critical that the correct amounts of
nitrogen be added to the fermentation, in order to find the right balance
between gassing activity and shelf life. Too high or too low nitrogen levels in
the yeast can also cause filtration problems. Yeast with high nitrogen levels
would not filter properly and appear sticky or putty-like, while yeast with
nitrogen levels that are too low will filter to dryness (Du Plessis, 1991).
1.5.4 PhosphateSources
Phosphorous is present in nucleic acid and phospholipids and is therefore an
essential nutrient for yeast growth. The negative charge in the yeast
cytoplasm is due to the presence of inorganic phosphates and phosphate
groups in organic compounds (Walker, 1997). The yeast contains between
2.0 and 4.0% phosphate (on dry matter). Phosphate in both beet and cane
molasses is very low. This deficiency is overcome by the addition of
phosphate in the form of phosphoric acid and some times as diammonium
phosphate. As a rule, the concentration of phosphorous in the medium
should be one third that of the nitrogen concentration (Reed and
Nagodawithana, 1991).
IT LIB A
21
1.5.5 Trace Mineral Elements
As a general rule, molasses is supplemented with zinc and magnesium by the
addition of small quantities of zinc sulphate and magnesium sulphate to the
medium. Biotin is required by the yeast for growth. Cane molasses has
sufficient amounts of this vitamin for yeast growth. Beet molasses, however,
has to be supplemented with biotin. Thiamine hydrochloride (vitamin B1) and
pyridoxine hydrochloride (vitamin B6) are added in trace quantities to the
medium. Reed and Nagodawithana (1991) reported that these vitamins did
not affect yeast growth in any way but did have a small effect on yeast
fermentation activity.
1.6 Genetics Of The lnvertase Enzyme
1.6.1 G~lLIcoseRepressoonof lnvertase
When S. cerevisiae cells are grown on a mixture of glucose and other
fermentable sugars such as sucrose, maltose or galactose, the metabolism is
diauxic, Le. glucose is metabolised first, whereas the other sugars are
metabolised only after glucose is exhausted. This phenomenon is known as
catabolite repression (Dynesen et al., 1998). Six unlinked loci for invertase
structural genes are known in S. cerevisiae. These are SUC1 - SUC5 and
SUC7. These genes are similar in structure and expression but are not
identical (Hohmann and Zimmerman, 1986). At glucose concentrations of
0.2% and higher, these genes undergo catabolite repression. In a study of
glucose repression in S. cere visiae , Trumbly (1992) used the SUC2 gene as a
22
reporter gene and reported a pathway for general glucose repression, which
has several key elements: Hexokinase Pil, encoded for by HXK2, plays a
role in the sensing of glucose levels; the protein kinase encoded for by SNF1,
is required for the de-repression of many glucose repressible genes; and the
MIG1 repressor protein which binds to upstream regions of SUC2 and other
glucose repressible genes (Trumbly, 1992). Glucose repression seems to be
controlled by the general glucose repression pathway, acting in concert with
other mechanisms.
Hubbard et al. (1994) reported that the SNF1 protein kinase is required to
relieve glucose repression of transcription. SNF1 is a serine/threonine protein
kinase, which acts with SNF4p, probably in activating MIG1p in order to
relieve glucose repression.
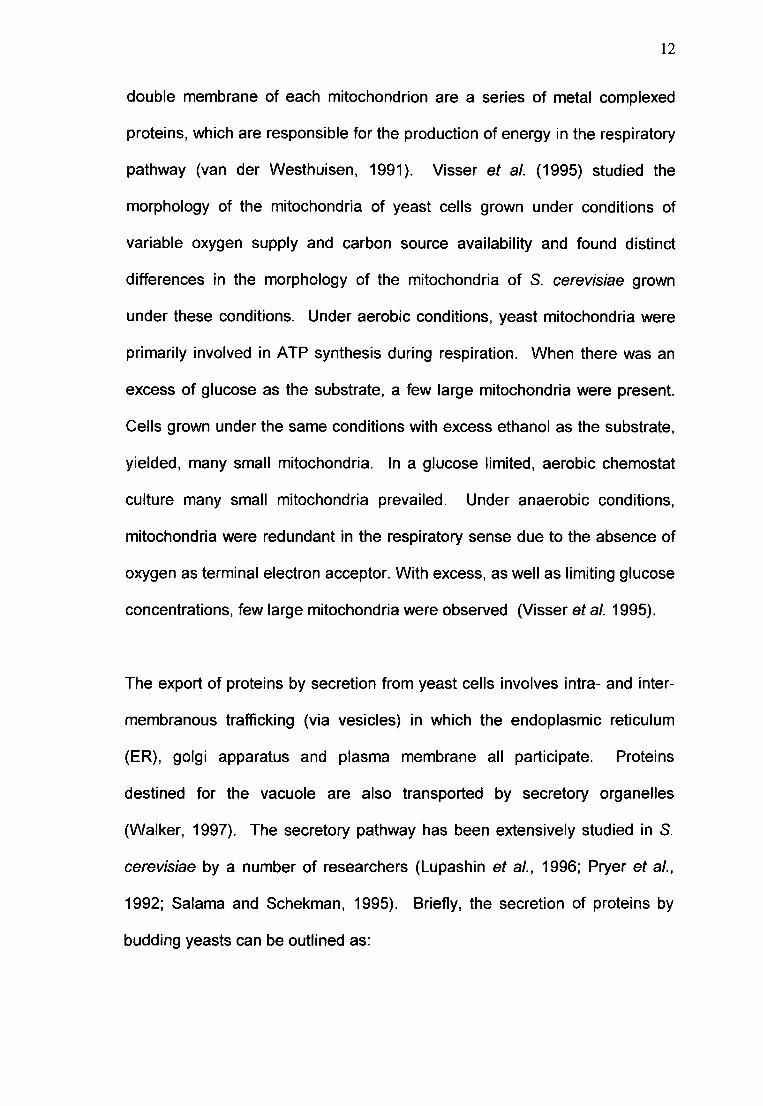
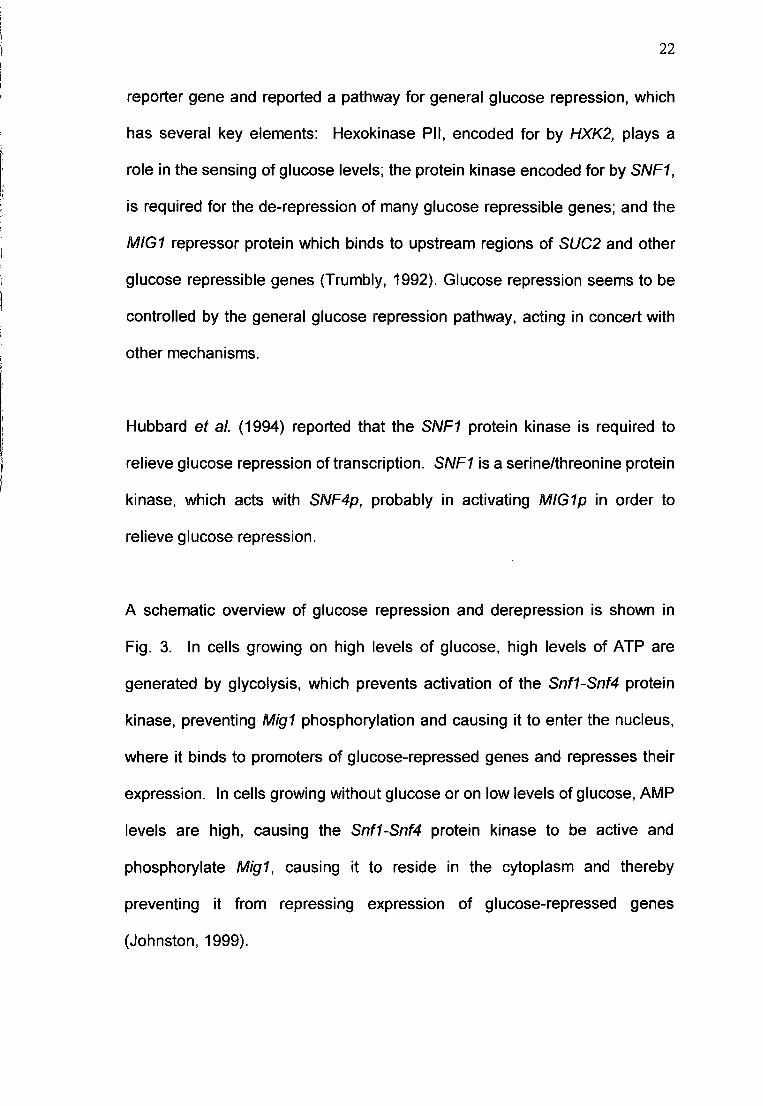
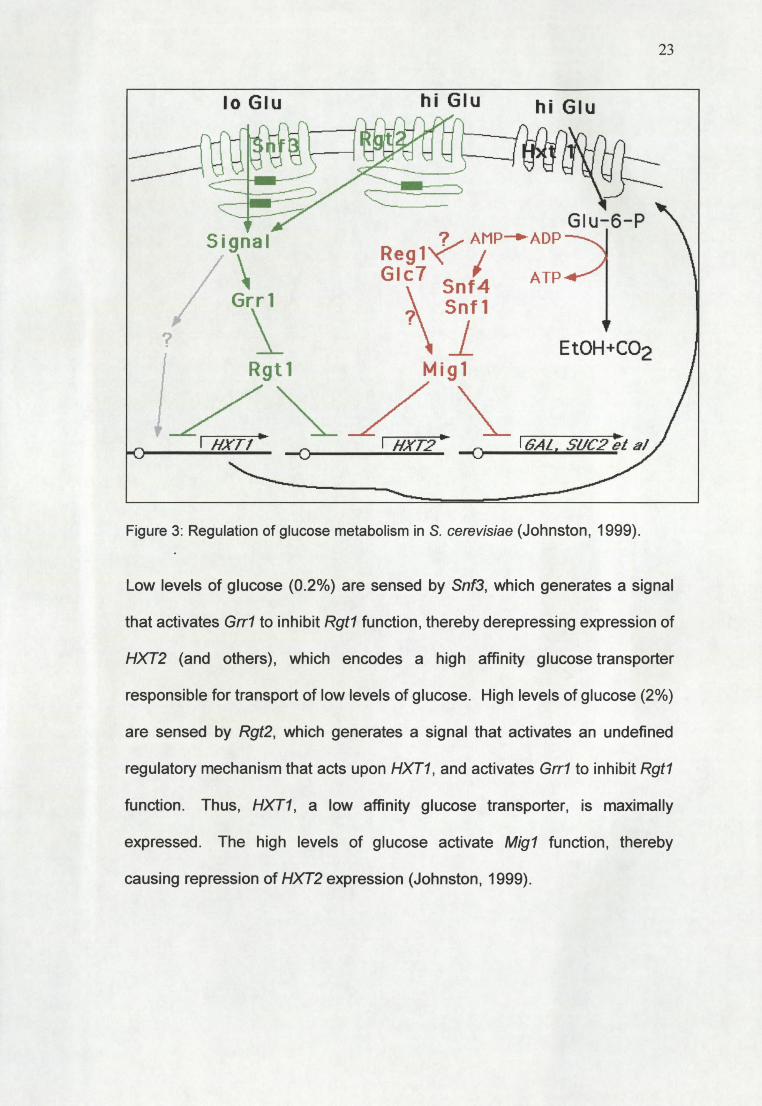
A schematic overview of glucose repression and derepression is shown in
Fig. 3. In cells growing on high levels of glucose, high levels of ATP are
generated by glycolysis, which prevents activation of the Snf1-Snf4 protein
kinase, preventing Mig1 phosphorylation and causing it to enter the nucleus,
where it binds to promoters of glucose-repressed genes and represses their
expression. In cells growing without glucose or on low levels of glucose, AMP
levels are high, causing the Snf1-Snf4 protein kinase to be active and
phosphorylate Mig1, causing it to reside in the cytoplasm and thereby
preventing it from repressing expression of glucose-repressed genes
(Johnston, 1999).
23
lo Glu hi Glu hi Glu
Glu-6-P5 igna I '-Y AMP--+-ADP
Regl" IGlc7 Snf4 AlP
Rgtl Migl
L~/~~1-0---1 ..:.1i~~:..:T..:/:....-"-0 1 HXT2· -0 I GAL , SI./C2 ;t al
Figure 3: Regulation of glucose metabolism in S. cerevisiae (Johnston, 1999).
Low levels of glucose (0.2%) are sensed by Snf3, which generates a signal
that activates Grr1 to inhibit Rgt1 function, thereby derepressing expression of
HXT2 (and others), which encodes a high affinity glucose transporter
responsible for transport of low levels of glucose. High levels of glucose (2%)
are sensed by Rgt2, which generates a signal that activates an undefined
regulatory mechanism that acts upon HXT1, and activates Grr1 to inhibit Rgt1
function. Thus, HXT1, a low affinity glucose transporter, is maximally
expressed. The high levels of glucose activate Mig1 function, thereby
causing repression of HXT2 expression (Johnston, 1999).
24
De-repression in a commercial yeast fermentation can be achieved by
controlling the feed rate of sucrose so as to maintain a glucose concentration
of lower than 0.2%, at all times. In practice, however, the glucose levels do
not normally reach this level since the feed rate is controlled by the amount of
alcohol present in the broth.
1.7 Production of Invertaseby Fermentation
The substrate for fermentation of S. cerevisiae, (baker's yeast), is composed
of molasses (which is a source of sugar), a source of nitrogen (derived from
urea, di-ammonium phosphate or ammonium sulphate), a phosphate source
(in the form of phosphoric acid or other phosphate containing compounds,
such as, di-ammonium phosphate or mono ammonium phosphate), zinc
sulphate and magnesium sulphate (added in trace amounts). The production
of yeast biomass by fermentation, using sugarcane blackstrap molasses as a
substrate, is depicted in Fig. 4.
The fermentation is aerated at a very high aeration rate. The molasses is fed
into the fermenter incrementally. The feed rate is governed by the amount of
alcohol and biomass in the fermenter. Under these conditions, the yeast
biomass will double every 2 to 3 hours, and the fermentation will yield a
minimum amount of ethanol and carbon dioxide and a rapid increase in
biomass.
Under anaerobic conditions, the yeast will ferment the glucose and fructose to
produce ethanol and carbon dioxide with a minimum increase in the biomass.
However, under aerobic conditions, if too much molasses is fed into the
25
fermenter, there will be an increase in the alcohol concentration and a
subsequent decrease in biomass production. The invertase enzyme is an
induced enzyme, produced in response to sucrose in the medium.
To produce the invertase enzyme, the yeast can be grown in batch
fermentations (Bokossa et al., 1993; Naudin et al., 1986; Vitolo et al., 1995),
continuous culture (Toda et al., 1982), chemostat culture (Chan et al., 1991)
or fed batch fermentations (Vitolo et al., 1995).
1.7.1 Batch Fermentation
In batch culture, growth nutrients are expended and metabolic products
accumulate in a closed environment. All the nutrients for growth are added to
the fermenter or flask before inoculation. No other nutrients are added to the
medium after it has been sterilised and inoculated. The fermentation is
allowed to proceed with aeration until all the sugars are depleted and the
fermentation stops, or for a predetermined time period. The yeast is then
harvested from the medium by centrifugation. The temperature and pH are
the only two parameters that are monitored and controlled. The alcohol levels
in the fermenter may be determined at regular intervals but this is not used for
fermentation control.
26
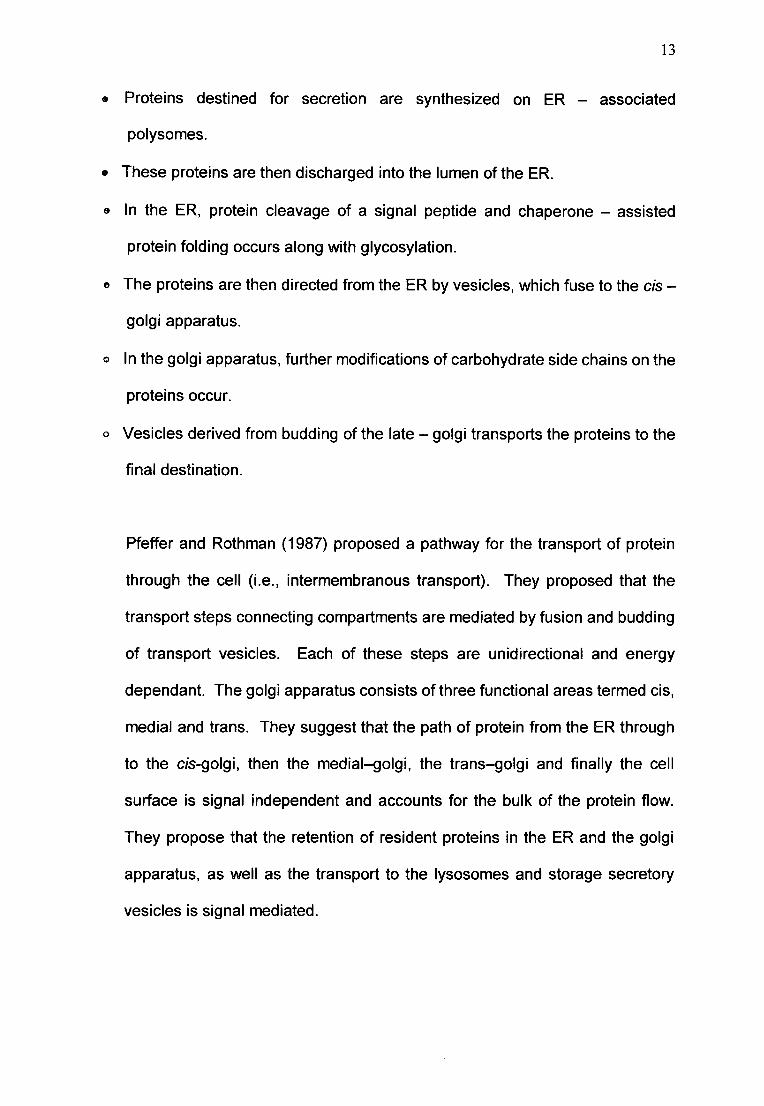
I Molasses (sucrose) I
..
Zinc, Magnesium
......I----------i Phosphate,.....
Nitrogen, AirI Invertase I ...
I Glucose +Fructose I
Assimilation
I Biomass + Carbon Dioxide + EthanOl1
Figure 4: Outline of the basic process used in the production of yeastbiomass at Nep Yeast.
1.7.2 ContinuousCulture(Chemostat)
High invertase yeast can be produced continuously in an aerated continuous
culture similar to that used by Toda et al. (1982). In a continuous culture,
nutrients are supplied, and yeast cells are continuously harvested, so that the
exponential growth phase is maintained. Since the yeast biomass does not
accumulate in the bioreactor, the nutrients are not completely expended.
Yeast can be grown continuously in a chemostat culture. A limiting nutrient
(sugar, nitrogen or phosphate) and the growth rate (which is controlled by the
feed rate), controls the concentration of biomass in the chemostat.
27
Compared to batch fermentations, flow through fermentations are more prone
to contamination by undesirable microorganisms. The flow through design,
however, has the advantage of producing a continuous supply of product that
can be recovered.
1.7.3 fed! Batch Culture
As the name suggests, this is in essence a batch culture, with the exception
that one or more of the essential nutrients, usually the source of sugar is fed
into the culture incrementally over a period of time. After this specified period
of time, or when the maximum amount of biomass is reached, the feed is
stopped and the yeast cells harvested by centrifugation. Fed batch culture is
the preferred fermentation technique used in industry for the production of
yeast biomass. Maximum sugar to biomass conversion can be achieved more
efficiently with fed batch cultures as compared to batch and continuous
cultures.
The temperature and pH of the fermentation is monitored at regular intervals.
The feed rate is generally determined by the alcohol and biomass
concentration in the broth. The desired alcohol concentration in the broth is
between 0.10% and 0.2%. The rationale for controlling the alcohol
concentration between 0.1% and 0.2% was to prevent over feeding or under
feeding (Crabtree effect (p66) and the negative Pasteur effect (p69)). The
control range of 0.1% to 0.2% for alcohol concentration was chosen according
to technology used at the NCP Yeast plant in accordance with a technology
agreement that was bought from Australia. If the alcohol content of the broth
28
rises, it is an indication of over feeding. This effect is called the Crabtree
effect (van der Westhuisen, 1991).
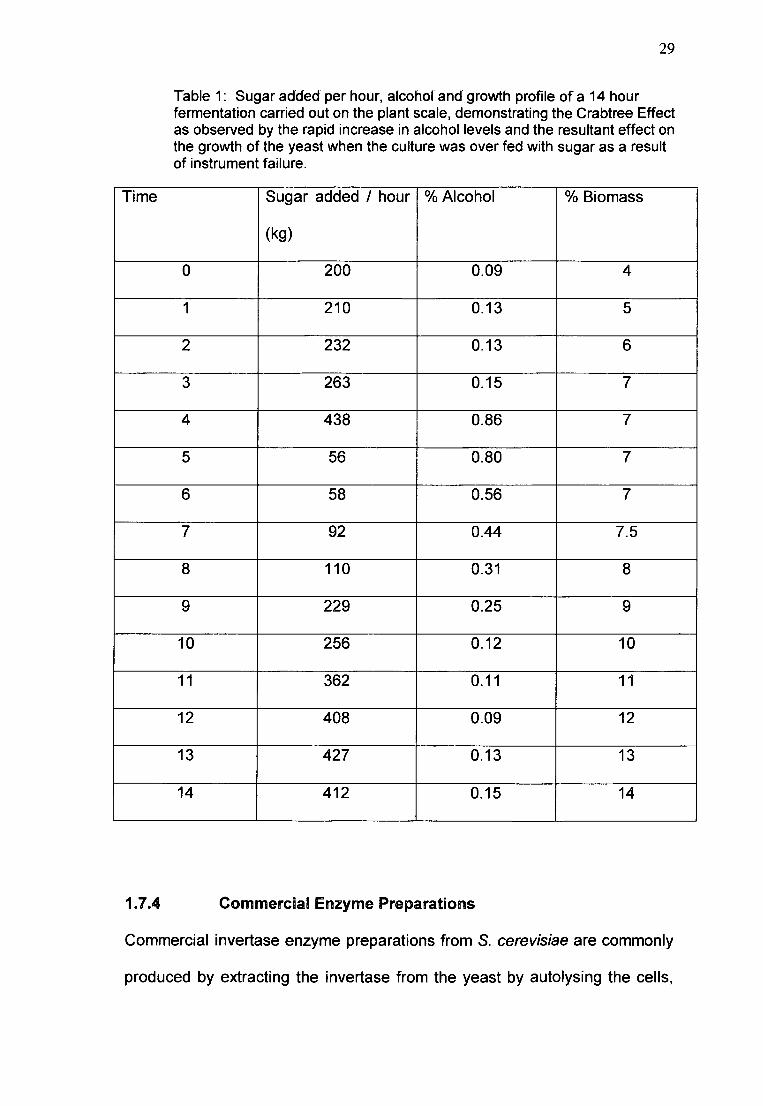
Over feeding can also result in glucose repression of invertase production by
the yeast. The yield of biomass is also reduced since the Crabtree effect
results in the sugar added to the fermentation being used to produce ethanol
rather than yeast. This effect can, however, be reversed by reducing the feed
rate until the level of alcohol starts to drop, which is an indication of excess
sugars in the broth being depleted. Once this condition is attained, normal
feed rates can be resumed. Table 1 shows the profile of a 14 hour
fermentation carried out on the plant scale where failure of the feed control
instrumentation resulted in over feeding of sugar. The alcohol levels start to
increase and the growth of biomass is reduced. The feed rate in this
fermentation was reduced and the alcohol started to decrease. Only once a
decrease in the alcohol was observed did the feed pattern revert to normal and
the culture started to grow again. The yield of biomass in this particular
fermentation is reduced since for three hours, there was minimal increase in
biomass. Had this fermentation run normally, the % biomass at the end of 14
hours would have been 18 %.
Generally fed batch fermentations are run for a specific time period. This
time period is normally a maximum of 17 hours. After this time, the efficiency
of the process is reduced. Contamination by undesirable microorganisms is
reduced in a fed batch culture as compared to a chemostat culture, however
the risk of contamination is higher in a fed batch culture than a batch culture.
29
Table 1: Sugar added per hour, alcohol and growth profile of a 14 hourfermentation carried out on the plant scale, demonstrating the Crabtree Effectas observed by the rapid increase in alcohol levels and the resultant effect onthe growth of the yeast when the culture was over fed with sugar as a resultof instrument failure.
Time Sugar added I hour % Alcohol % Biomass
(kg)
0 200 0.09 4
1 210 0.13 5
2 232 0.13 6
3 263 0.15 7
4 438 0.86 7
5 56 0.80 7
6 58 0.56 7
7 92 0.44 7.5
8 110 0.31 8
9 229 0.25 9
10 256 0.12 10
11 362 0.11 11
12 408 0.09 12
13 427 0.13 13
14 412 0.15 14
1.7.4 CommercialEnzymePreparations
Commercial invertase enzyme preparations from S. cerevisiae are commonly
produced by extracting the invertase from the yeast by autolysing the cells,
30
recovering the enzyme by precipitation with either ethanol, acetone or
ammonium sulphate to form a precipitate that readily dissolves in water (Reed
and Nagodawithana, 1991). Arnold (1969) used the method of Myrback and
Schilling, which involves autolysis of the cells with toluene, pH adjustment and
fractional precipitation with ethanol at 4°C, to produce high yields of enzyme
from fresh commercial baker's yeast. Another method for producing yeast
invertase involves autolysis with chloroform, toluene or ethyl acetate at 30°C
for a maximum of 3 hours. Underkofler and Hickey (1954) reported a 15-fold
increase in the invertase activity by using an accumulation step prior to
extraction. This step involved suspending the yeast in a solution of
diammonium hydrogen phosphate, potassium dihydrogen phosphate,
magnesium nitrate and potassium nitrate. The mixture was aerated for 3 to 8
hours. The pH was maintained at 4.5. The temperature was controlled
between 28°C and 30°C and sucrose in solution was added continuously.
In the United States Patent Number 5256556 of October 1993, assigned to
GBH (Germany), inventors Hudstedt et al. (1993) laid claim to a process for
the production of invertase from commercial baker's yeast which involves
disruption of the cell, subjecting the disrupted cell suspension to heat
treatment in a strong acid medium, and removal of denatured undesirable
proteins and cell fragments by centrifugation. The enzyme was extracted
using a polysulfone ultrafiltration membrane with a pore size of 1 000 000
daltons to produce a permeate with an invertase activity of 3 IJ/ml. (1 IJ/ml
invertase corresponds to 1 micromole of reducing sugars, liberated in 3
minutes for, 1 mg of dry matter used).
31
The above methods can be used to produce various grades or degrees of
purity of the enzyme. It is therefore necessary for the enzyme producer to
determine the purity of the enzyme required by the end users. For the
manufacture of sweets and chocolates invertase enzyme of high purity is
required, whereas for the production of high test molasses, it is not necessary
for the enzyme to be purified. A "crude" enzyme solution would suffice.
1.8 CUlirreD1lt StatIUIS Of Yeast lnvertase Preduetion
Yeast invertase has been researched extensively. As early as 1953, Demis
et al. had determined that the rate of hydrolysis of sucrose to glucose and
fructose by invertase from baker's yeast was 300 times faster than that at
which the cell could assimilate the glucose. Bokossa et al. (1993) studied the
relationship between yeast growth and invertase production by S. cerevisiae
01k32 grown on sugar cane blackstrap molasses. They found that there was
an inverse relationship between enzyme production and the concentration of
molasses in the medium. They concluded that S. cerevisiae 01k32 possessed
the potential to produce invertase at a fast rate when grown on 3% sugarcane
molasses (as equivalents of total reducing sugar).
Krastanov et al. (1995) used the same strain of yeast, S. cerevisiae 01k32, in
a two stage culture and observed a four times increase in the concentration of
the intracellular enzyme. The purpose of this study was to determine the
32
possibility ot invertase synthesis in the yeast cells after the cells were used in
an alcoholic fermentation on sugar cane blackstrap molasses and to
investigate the influence of sugar concentrations in the molasses on enzyme
biosynthesis. They found that the optimum sugar concentration in the medium
for maximum invertase production was between 4 - 6%. This concentration
was lower than that of 15 - 20% that were cited by other authors. It was also
noted that at TRS (Total Reducing Sugars) of 8% there was a 50% decrease
in intracellular enzyme activity. Their conclusions were that sugarcane
molasses could be used for inducing invertase production in waste alcohol
yeasts. Also, that S. cerevisiae 01k32 strain could be used for commercial
invertase production.
Naudin et al. (1986) studied the invertase activity of S. cerevisiae cells during
a batch fermentation of glucose and reported a variation in the yeast invertase
activity from 10.5 international units at inoculation to 2.5 international units
after 48 hours. One international unit for invertase corresponds to 1
micromale of reducing sugars, liberated in 3 minutes for, 1 mg of dry matter
used.
The effect of pH, aeration and sucrose feeding on the invertase activity of
intact S. cerevisiae cells grown in sugarcane blackstrap molasses was
investigated by Vitolo et al. (1995). It was observed that the invertase activity
in the first 5 hours of fermentation was low and started to increase from the 6th
hour onwards. They attributed this to glucose inhibition of the enzyme. With
regard to the effect of pH and aeration on enzyme production, it was observed
33
that in the absence of aeration, there was no effect by the pH on the yield
factor (substrate consumption/dry cell ratio). However the invertase activity
was 20% higher at pH 5.5 than at pH 4.0. The effect of oxygen on invertase
expression in continuous culture of a recombinant strain of S. cerevisiae
containing the SUC2 gene was studied by Pyun (1999). It was observed,
from a single stage continuous culture under microaerobic conditions, that
invertase expression was strongly dependent on oxygen availability, and that
moving from anaerobic to aerobic conditions led to a five fold increase in the
specific invertase activity.
S. cere visiae , strain LK2G12, was the organism used by Sutton and Lampen
(1961), in their study of the localisation of sucrose and maltose fermenting
systems in S. cerevisiae. They reported that the major portion of the
invertase was located in the cell wall structure. Approximately 10 - 30% of the
total invertase was found to be intracellular and not accessible to the external
substrate. They concluded that the internal invertase represents the enzyme
at its site of synthesis. Chu and Maley (1980, Cited by Chan et aI., 1991)
reported the existence of a third form of the invertase enzyme, which they
described as being partially glycosylated and membrane bound. Bokossa et
al. (1993) observed that the biosynthesis of invertase by S. cerevisiae 01k32
was inversely proportional to the concentration of sugar cane blackstrap
molasses included in the medium. Vitolo et al. (1995) reported that glucose
inhibition of invertase occurs at glucose concentrations higher than 2 g/1. The
findings of Vitolo et al. (1995) and Bokossa et al. (1993) are in agreement
since with a high concentration of molasses in the medium there would be a
34
high concentration of glucose and fructose in the medium after inversion. This
increased glucose concentration, if allowed to reach levels of 2 gIl, will result
in catabolite repression of the invertase enzyme.
Toda et al. (1982), in their study of invertase production by S. carlsbergensis
in a continuous culture, observed a hyper production of invertase, which was
related to a deficiency of inorganic phosphate in the medium. They found that
glucose depletion in a chemostat culture reduces the catabolite repression of
invertase.
The yeast strain S. cerevisiae Y07 is used by NCP Yeast for the commercial
production of high invertase yeast for specific use in the sugar industry for the
production of high-test molasses. This yeast was selected for it's higher than
normal invertase activity, measured as the % inversion I h of a sugar solution
containing 55 g sucrose, at 55°C. S. cerevisiae Y07 has an average
invertase activity of about 16%. This is double the average activity of the
baker's yeast strain S. cerevisiae YOg. Although, S. cerevisiae Y07 has a
high invertase activity, this activity is still about 33% lower than the minimum
acceptable activity required for the production of high-test molasses. Using
about 33% more yeast (to carry out the inversion of the molasses in about the
same time as yeast with an activity of 21%) can compensate for this low
activity. The sugar refinery is comfortable with this since the yeast supplier
would have to carry the cost of the extra yeast, as a result of the supplier
being unable to meet the customer's minimum requirements and negotiating
the concessionary use of the sub standard product with the customer. This
35
could mean a 33% loss in revenue to the yeast manufacturer. Therefore, it
would be in the interest of the yeast manufacturer, to find ways of increasing
this activity to the required level.
In view of the literature reviewed, two of the conditions that probably would
affect the production of invertase in the yeast are the concentration of glucose
in the medium, which could result in repression of the enzyme and the
inorganic phosphate content of the medium, a deficiency of which would
result in hyper production of enzyme (Toda et al., 1982). From this it can be
assumed that by manipulating the nutrient levels in the medium it may be
possible to achieve an increase in invertase production by the yeast.
However, since phosphate is essential for obtaining increase yields in
biomass and the natural phosphates in the molasses would not suffice, the
medium is supplemented with inorganic phosphate sources usually
phosphoric acid (White, 1954). Thus studying the effect of a deficiency in
inorganic phosphate would not be feasible since the product required is yeast
that is high in invertase. Therefore, in this project fermentation conditions
were manipulated by changing the source of nitrogen, feed patterns and
fermentation time, and their effect on invertase production was studied by
analyzing the biomass and the fermentation broth for invertase activity.
36
2.0 MATERIALSAND METHODS
The NCP Yeast plant produces about 132 tonnes of high invertase yeast per
annum. The problem experienced with the yeast produced is that the
enzyme activity of the yeast is below the minimum specification required by
the customer. In order to produce a product that would meet the customer's
minimum specification, experiments were designed consisting of three
phases.
Phase 1 involved the analysis of the current commercial scale fermentations
in an attempt to identify possible reasons for the low enzyme activity.
Experiments involved analysing the inconsistent invertase levels obtained on
a commercial scale. Six fermentations that were run for 24 hours, with urea
as a source of nitrogen, phosphoric acid as a phosphate source and with
incremental feeding of molasses were monitored. The pH, total sugars fed, %
nitrogen, % alcohol and their effects on invertase production were studied
using S. cerevisiae strain YO?
In phase 2, two different strains of S. cerevisiae were evaluated for enzyme
production. There are two yeast strains currently being used for biomass
production on the NCP Yeast (Durban) plant; S. cerevisiae YO? and YOg. The
strain YOg is a commercial Baker's yeast strain that has been selected for its
ability to produce high amounts of carbon dioxide in dough. The strain YO?
37
has been selected for its ability to accumulate high amounts of invertase
intracellularly.
Phase 3 involved the manipulation of the nitrogen source, fermentation time
and feed patterns and the effect of these manipulations on enzyme production
were assayed. This involved the manipulation of the nitrogen source,
fermentation time and two different modes of fermentation, i.e. batch and fed
batch, on a 10 I laboratory system. Fermentation parameters used were as
used on the commercial scale, scaled down to 10 I. Intracellular and
extracellular distribution of the invertase enzyme on two strains, YO?and YOg
were assayed for each parameter manipulated. The conditions that produced
increased invertase levels in laboratory fermentation experiments were
implemented on the plant at NCP Yeast to assess their effect on invertase
production on the commercial scale.
2.1 Commercial Scale Fermentations
The production plant at NCP Yeast was used for commercial scale
fermentations. A stainless steel vessel with a 60 000 I working volume was
used as the fermentation vessel. The vessel was fitted with a sparger
network at the base of the fermenter through which air was pumped into the
fermentation at a rate of 5000 m3/h. The air was first drawn through a series
of three HEPA filters and bubbled through water before entering the
fermenter. Air was bubbled through water so as to minimise evaporation in
the fermentation. Water used was treated with sodium hypochlorite, dosed to
a level of 3 ppm free chlorine. Temperature control was achieved by
38
circulating the contents of the fermenter through a plate heat exchanger.
Figure 5 shows the layout of the plant used to conduct the plant trials. The
nutrient additions were calculated using the method described in section 2.3,
scaled up to 60 000 I.
2.1.1 lFeedStock Preparation
The feedstock used was diluted molasses (wort) (Illovo Sugar Mill,
Umzimkulu). Wort was prepared by injecting live steam directly into the
molasses as it was pumped through a steriliser pipe, the length of which
allowed for the molasses to be held at a temperature of 1200e for about 30
seconds. Just before the molasses entered a holding tank, water was added
to the molasses to drop the specific gravity (SG) to about 1.200. This process
is shown in Figure 6. The amount of water added was controlled by an inline
SG controller. The wort was held in the holding tank for an hour at 1000e
before transfer to a second tank, the wort tank, for feeding into the fermenter.
Total invert sugar of the wort was determined using the Fehlings Method for
Invert Sugar (van der Westhuisen and Spek, 1994), before the feed rate was
calculated.
2.1.2 FeedRate
Feed rate was calculated based on the expected biomass and alcohol yield
per hour. The first 5 hours of fermentation was batch fermentation. Wort
containing sufficient sugar to produce an alcohol level of about 1.0% was fed
into the fermenter before inoculation. Alcohol levels, pH and biomass were
measured hourly using the methods described in section 2.4. The pH profile
39
was monitored until the pH started to rise; at which stage the fermentation
was changed to fed batch fermentation, with the wort being fed incrementally
into the fermentation. Feed pattern was adjusted according to the alcohol
level present in the fermentation, in order to control the alcohol level between
0.6% and 0.8%. This process ensured that the fermentation was not being
overfed or under fed. Fermentations were run using this feed pattern for 24
hours.
2.1.3 Separation
Separation of the biomass from the broth was achieved by using three
Westfalia (HOB 75) Centrifuges in series, operating at 5500 rpm.
Fermentation broth was fed into the first separator, where the biomass was
removed from the broth. The biomass was then fed into the second separator,
where it was washed and the process repeated in the third separator. From
the third separator, the yeast was pumped through a plate heat exchanger to
drop the temperature to about 4°C before entering the storage tank.
2.1.4 Fermentation Control
Alcohol level, pH and the biomass present in the fermentation broth were
tested every hour. These results were used to determine the amount of sugar
that was to be introduced into the fermenter over the next hour.
40
Nutrients andAir
SeedFermenter
MainFermenter
CreamStorageTank
WortStorage
l8eat Exchangerl
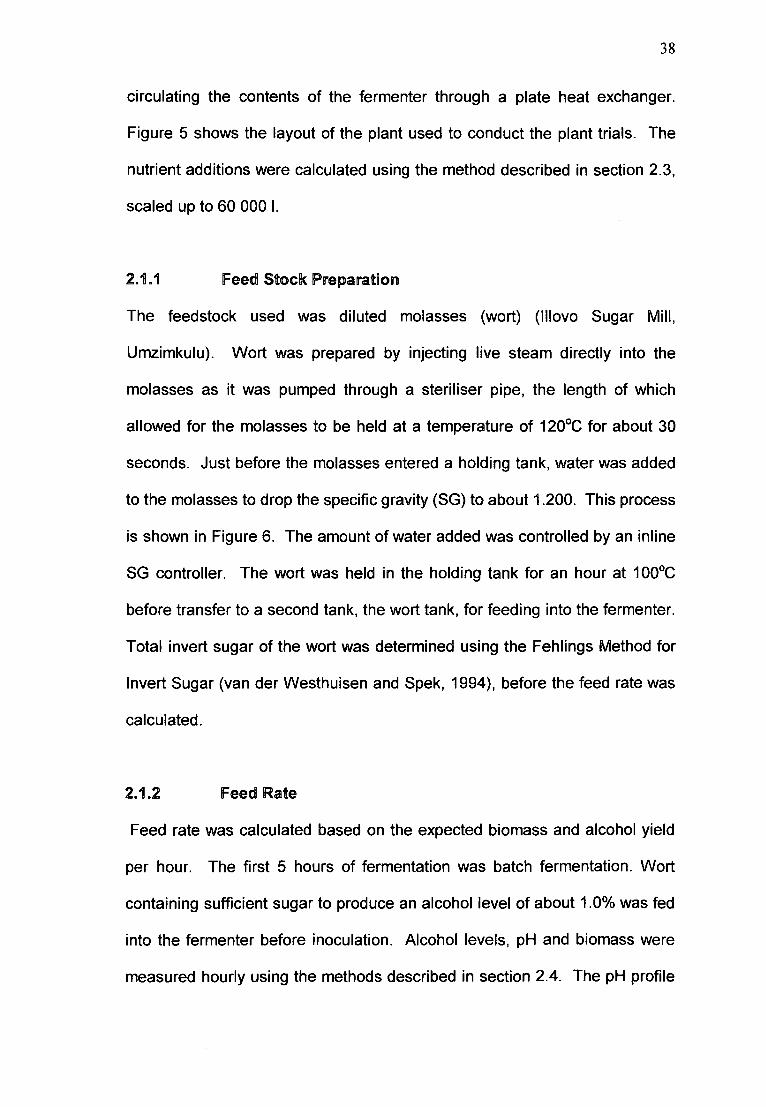
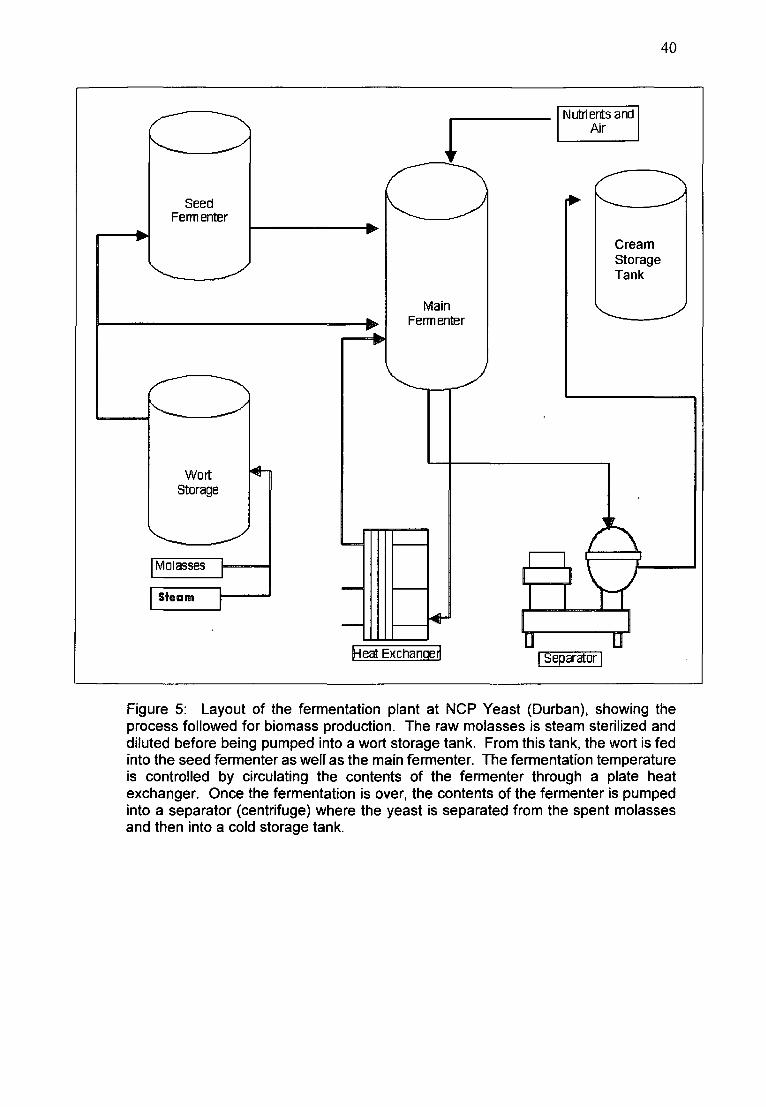
Figure 5: Layout of the fermentation plant at Nep Yeast (Durban), showing theprocess followed for biomass production. The raw molasses is steam sterilized anddiluted before being pumped into a wort storage tank. From this tank, the wort is fedinto the seed fermenter as wen as the main fermenter. The fermentation temperatureis controlled by circulating the contents of the fermenter through a plate heatexchanger. Once the fermentation is over, the contents of the fermenter is pumpedinto a separator (centrifuge) where the yeast is separated from the spent molassesand then into a cold storage tank.
[WortlE_j
ExpansionTank
Molasses
Holding Pipe
Pump
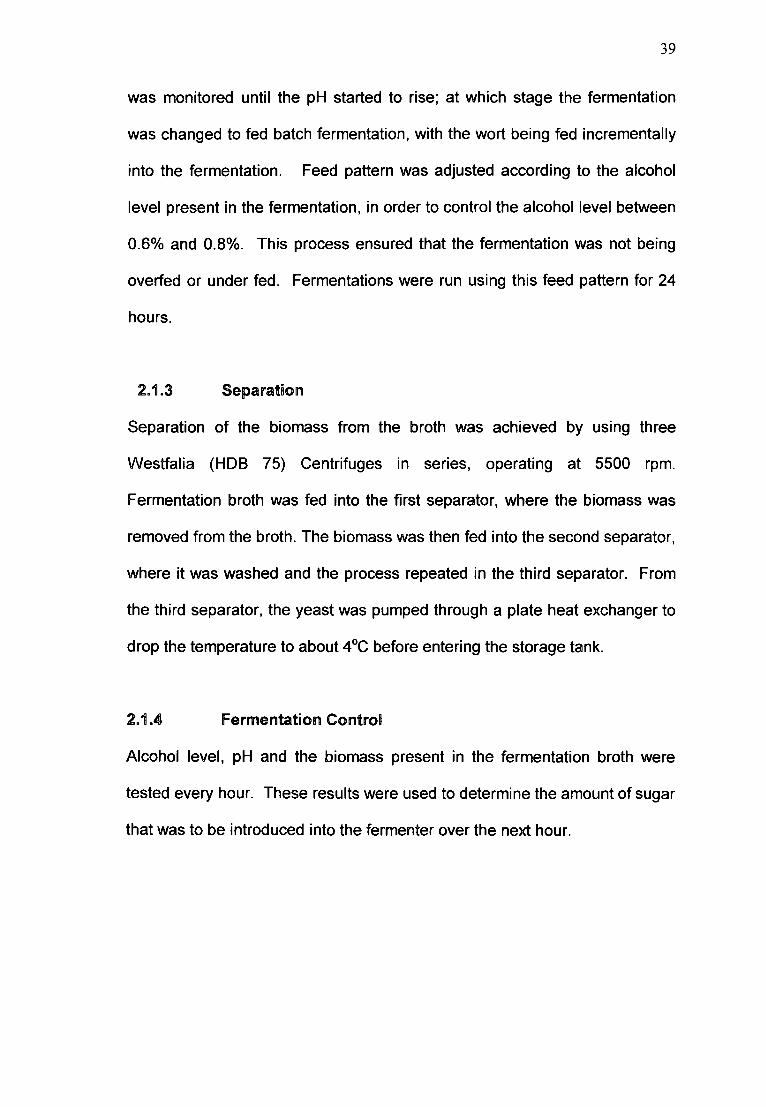
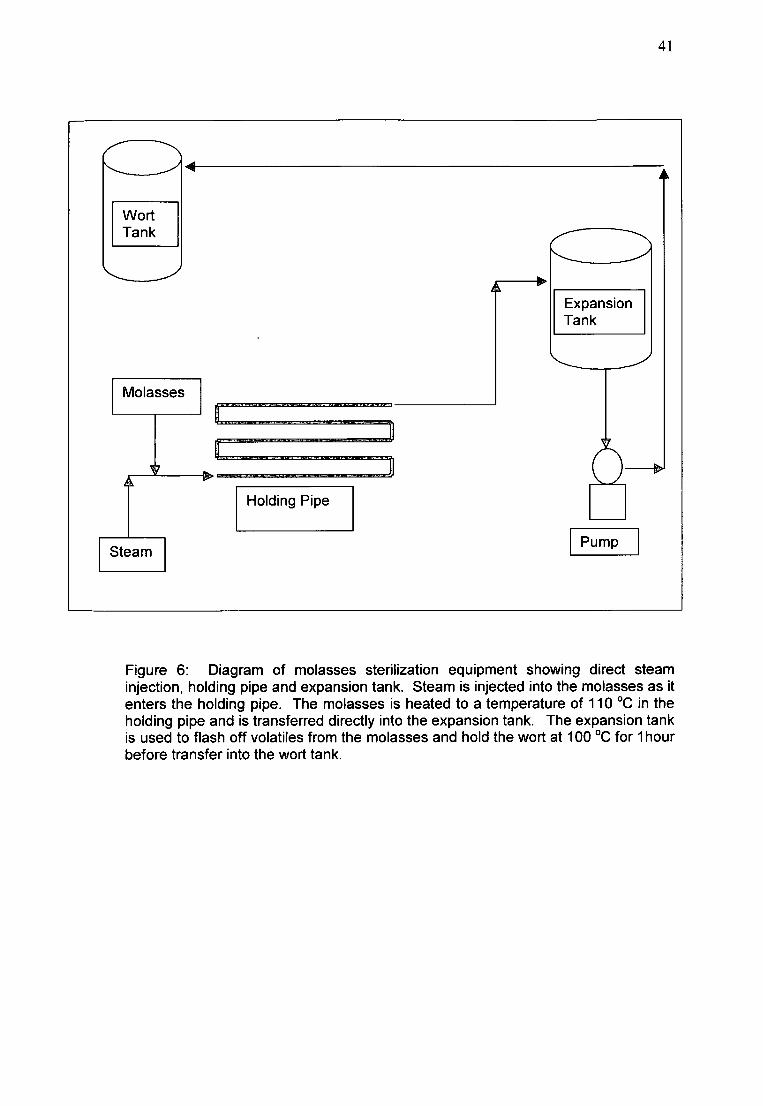
Figure 6: Diagram of molasses sterilization equipment showing direct steaminjection, holding pipe and expansion tank. Steam is injected into the molasses as itenters the holding pipe. The molasses is heated to a temperature of 110°C in theholding pipe and is transferred directly into the expansion tank. The expansion tankis used to flash off volatiles from the molasses and hold the wort at 100 oe for 1hourbefore transfer into the wort tank.
41
42
2.2 Yeast Strains and Inoculum Development
S. cerevisiae strains YO? and YOg were obtained from NGP Yeast (PTV) Ltd..
(Durban) and subcultured onto malt extract agar (Oxoid) slants, and
incubated at 30eG for ?2 hours. The slants were stored at 2eG in a
refrigerator. Inoculum was prepared by transferring a loopful of the culture
from the slant into 100 ml of molasses wort (obtained from the production
plant at NGP Yeast), which was supplemented with 1 ml 10% urea solution,
one ml 10% phosphoric acid and 1 ml each of 1% zinc sulphate and
magnesium sulphate. The mixture was incubated at 30eG for 48 hours. After
this time, the yeast was separated from the molasses medium by
centrifugation at 20 x g for 5 min. The yeast was washed twice and re-
inoculated into a flask containing 500 ml of the molasses wort medium
(described above) and allowed to ferment for a further 48 hours at 30eG. The
yeast was recovered from the molasses medium and used as inoculum for
the laboratory fermentations.
2.3 Basic felrmell1ltatioU1lMedium Composition
The fermentation medium was composed of molasses wort (sterilized and
diluted molasses), supplemented with urea, phosphoric acid, zinc sulphate
and magnesium sulphate as described in Table 2. Soda ash and sulphuric
acid were used to adjust the initial pH of the medium. The nutrients described
above are used in the production plant of NGP Yeast for the production of
both Baker's yeast and Invertase yeast. The amount of these nutrients that
were added to the fermentation was calculated using the method described
43
by Du Plessis (1991). The first step in planning the fermentation was to
determine the fermenter volume and the working volume by using the formula
1t.~ X h. The volume of the fermenter used was 10 000 ml. (As a rule the
working volume of a fermenter is 70% of its total volume. In this case it works
out to be: 10000 ml x 70% = 7 000 ml.) By using an estimate of the final
concentration of yeast per litre (g/I) and the final estimated output (In the
yeast industry, medium composition is calculated based on the expected
output of the production facility. Although this seems mechanistic, it is a
practical approach. Expected biomass was not an objective of this
investigation and therefore was not measured and reported), the initial
inoculum was calculated as follows: -
7000 ml (final volume) x 200 g/I (yeast) = 1400 g final yeast @Y30(at30% dry
matter).
The yeast inoculum should be 15% of the estimated biomass production i.e.
1400 g x 15% = 210 g @Y30.
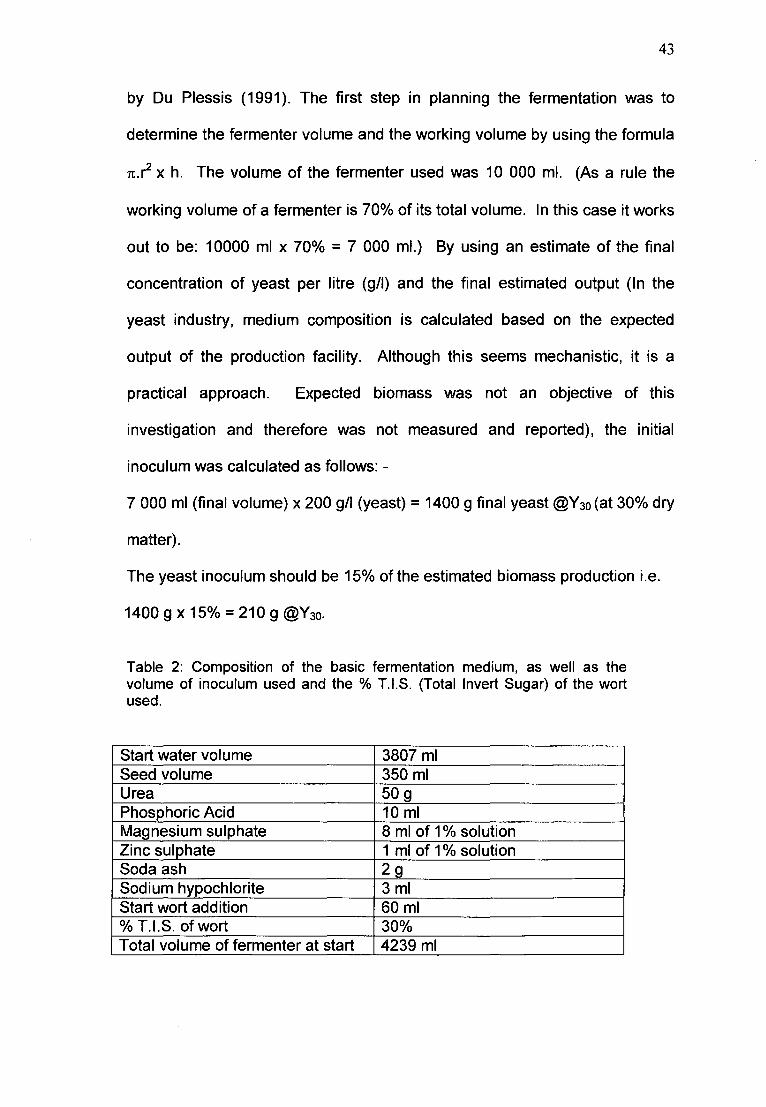
Table 2: Composition of the basic fermentation medium, as well as thevolume of inoculum used and the % T.I.S. (Total Invert Sugar) of the wortused.
Start water volume 3807 mlSeed volume 350 mlUrea 50 gPhosphoric Acid 10 mlMagnesium sulphate 8 ml of 1% solutionZinc sulphate 1 ml of 1% solutionSoda ash 2gSodium hypochlorite 3mlStart wort addition 60ml% T.I.S. of wort 30%Total volume of fermenter at start 4239 ml
44
2.3.1 CarbonSource
The weight of molasses required to produce 1400 g of yeast had to be
determined. A 45% conversion of fermentable sugar to yeast biomass has
been reported by White (1954). New yeast grown in the fermenter is
equivalent to the final yeast output less the inoculum,
Le.1.400 kg - 210 g = 1.190 kg @Y30.
The fermentable sugar required to produce 1.190 kg yeast was determined as
follows: -
1.190 kg Y30x 30% = 357 g Yeast Dry Matter Solids (YDMS).
357 g YDMS + 45% efficiency = 793 g fermentable sugar.
The average fermentable substances available in sugar cane black strap
molasses is 42% therefore:
793 g fermentable substances + 40% = 1.983 kg molasses. Therefore 1.983
kg molasses, which is equivalent to: 793 g fermentable substances would be
required to produce 1.190 kg yeast @ Y30at 45% efficiency of conversion in a
10 I fermenter (7 I working volume). Also the amount of inoculum to be used
is 210 g.
2.3.2 NitrogenSource
Typically, compressed yeast has a final nitrogen content of 8% on dry matter.
The total nitrogen content of the final biomass produced would be: -
1400 g Y30x 30% = 420 g YDMS
420 g YDMS x 8% = 33.6 g Nitrogen.
45
This nitrogen comes from 3 different sources, viz. molasses, inoculum and
urea. In order to determine the amount of urea to be added to the
fermentation, the amount of available nitrogen in the molasses and the seed
is calculated and subtracted from the total expected nitrogen of the final
yeast.
2.3.2.1 Nitrogen from Molasses
Molasses contains an average of 4% nitrogen as determined using the
Kjeldahl method (Maharaj and Naidoo, 1993). Of this only about 10% is
assimilated by the yeast. Hence the nitrogen contributed by the molasses
would be: 1.983 kg x 4% x10% = 7.9 g N2
2.3.2.2 Notrogell1lfrom lnoculum
The average for the seed yeast was determined to be 8.5% N2 on dry matter,
using the Kjeldahl method
Seed used = 210 g Y30
= 63 g YDMS x 8.5%
= 5.36 g nitrogen.
Therefore the nitrogen contributed by the inoculum is 5.36 g. Hence the
nitrogen required from the urea is:
33.6 g - (7.9 g + 5.4 g) = 20.3 g
2.3.2.3 Nitrogen Required from Urea
Urea contains 46% w/w available nitrogen. If 100% assimilation of nitrogen
from urea is achieved, the amount of urea to be added would be: 20.3 g 7
46
46% = 44.13 g. However in practice 100% assimilation does not occur. A
maximum assimilation of 90% is achieved. Thus the amount of urea to be
added to the fermenter is 44.13 9 -;-90% = 49.03 g.
2.3.3 Phosphate Sources
There are two sources of phosphate in the fermentation, i.e. inoculum and
phosphoric acid. The amount of phosphate contributed by the seed yeast is
determined and subtracted from the total required. The balance is equal to
the amount required from phosphoric acid. The average phosphate level as
P20S in the final yeast typically is 2.5% on dry matter. The total phosphates
of the final yeast in grams will be:
1400 9 Y30x 30% = 420 9 YDMS
420 9 YDMS x 2.5% = 10.5 9 phosphate.
2.3.3.1 Phosphate from IlI'1IocLIIllUlm
The phosphate content of the seed was determined to be 3% on YDMS.
The inoculum used was calculated to be 210 9 Y30,which is equivalent to
6.3 9 YDMS. Therefore 6.3 9 YDMS with 3% phosphate content will yield
1.89 9 phosphate.
2.3.3.2 Phosphate Requored from Phosphoric Acid
Since the seed yeast contained 1.89 9 of phosphate, the phosphate required
from phosphoric acid was: 10.5 9 -1.89 9 = 8.61 9
The amount of phosphate (P20S) in phosphoric acid (H3P04) was calculated
as follows: -
47
Molecular mass: 196 = 142 + 54
196 g of H3P04 will produce
= 142 x 100 of the weight of H3P04196 1
= 72.45%.
Therefore the phosphoric acid needed was: -
= 8.61 g +72.45%
= 11.88 g if 100% H3P04 was used.
The phosphoric acid used was only 85%.
Therefore 11.88 g + 85% = 13.98 g of 85% H3P04
The volume of water to be added at start was then calculated:
Start water (volume) = Final volume - (seed + wort)
Before this could be done, the volume of wort (diluted and sterilised
molasses) to be added and the volume of the seed yeast to be added had to
be determined.
2.3.4 VO~lUIme of Wor1t
Analysis of the molasses reveals a total invert sugar (T.l.S.) content of 43%,
i.e. 430 g/1. This molasses was diluted with water to produce a T.I.S.
concentration of 30% or 300 g/1. It has already been determined that 1.983 kg
of molasses is required to grow the new biomass. Since there is 43% T.I.S.
available in the molasses, the actual amount of sugar to be added is:
48
1.983 kg x 43% = 853 g T.I.S. At a dilution of 30%, this would be 853 g -i-
30% = 2.843 I of wort.
2.3.5 Volume of lnoculum
An average 18% was obtained for the dry mass of the seed yeast. It has been
calculated that 210 g of seed at 30% is required. This is equal to 210 g x 30%
= 63 g YDMS. Therefore the volume of seed = 63 g + 18% = 350 ml.
The final volume of the fermenter has been calculated to be 7 I. The volume
of wort and seed to be added is 2.843 I and 350 ml respectively. Therefore
the start water volume = 7 I - 3.193 I = 3.807 I.
The volume of wort to be added at the start of the fermentation had to be
calculated. As a rule, 100 kg fermentable sugar will produce 50 kg alcohol
and 50 kg biomass. Since there is no alcohol in the seed yeast and the
alcohol level at the start of the fermentation should be 0.2%, sugar has to be
added to produce the alcohol.
The start volume = start water + seed volume
= 3.8071 + 350 I = 4.1571
0.2% alcohol in this volume is equivalent to 4.157 I x 0.2% = 8.3 ml alcohol.
The fermentable sugar required to produce 8.3 ml of alcohol = 8.3 ml x 2 =16.62 g.
T.I.S. required will = 16.62 g x 43 = 17.87 g40
Since wort contains 300 gil T.I.S (30%). The volume of start wort required =
17.87 g + 30% = 59.55 ml.
49
2.3.6 TraceElements
Magnesium sulphate and zinc sulphate were added in trace amounts. A 1%
stock solution of each salt was made and 8 ml of magnesium sulphate stock
solution and 1 ml of zinc sulphate stock solution were added to the fermenter
at start.
2.3.1 pHCOll1lftIl'O~
After the water, wort and all the chemicals were added to the fermenter, the
pH was adjusted to 4.8 using either soda ash or sulphuric acid as required.
Before the addition of molasses, 3 ml of sodium hypochlorite was added to
sterilise the contents of the fermenter.
2.4. AfI"1la~ysos
2.4. ~ Alcohlo~ Detefl"minatooll1l
Alcohol level was determined by distilling 5 ml of the broth, collecting the
distillate in acidic potassium dichromate solution (Appendix ii) and titrating
against acidic ammonium ferrous sulphate using phenylanthranillic acid as
indicator. Ten ml of 0.145 M potassium dichromate solution, 20 ml distilled
.water and 10 ml 98% sulphuric acid were added to a flask connected to the
receiving end of the condenser. Five ml of fermentation broth was pipetted
into a boiling flask, 2 glass beads added and the flask connected to the
distillation unit. The contents of the flask were boiled for exactly 5 minutes.
The contents of the receiving flask were quantitatively transferred into a 250
ml Erlenmeyer flask. One ml of 0.005 M phenylanthranilic acid indicator was
50
added to the flask and titrated with 0.321 M ferrous ammonium sulphate
(containing 1% H2S04) to a green end point. This titre was called A.
A blank titration using the dichromate mixture, minus the sample was carried
out. This titre was called B.
The % alcohol was calculated follows: -
(A - B) -i- B x 2.52
Where 2.52 is the conversion factor used to determine, based on the molarity
and volumes of the chemicals in the reaction, the % alcohol in the original
sample.
2.4.2 Biomass Detell'mill1latioll1l
Biomass was measured by centrifuging 10 ml of the broth at 20 x g for 10
minutes. The supernatant was discarded; the yeast was reconstituted with
distilled water and made up to 10 ml before centrifuging again. This step was
repeated once more. After the second washing, the volume of yeast in the
bottom of the centrifuge tube was read as the percentage of the total volume.
This percentage was used to calculate the biomass present in the fermenter
in g/I as follows: -
%Yeast x total volume in fermenter = biomass (g/I)
2.4.3 Assay for lntracellular Invertase
Yeast harvested from the broth was assayed for invertase activity using the
method described by van der Westhuisen and Spek (1994). The assay
involves end-product determination Le. measuring of the total reducing sugars
produced from sucrose when the yeast is added to the solution and incubated
51
at 55°C for 1 hour. Reducing sugars were determined by using the Fehlings
titration method. 55.0 g of refined sucrose was weighed into a 250 ml
Erlenmeyer flask and 35.5 ml of distilled water at 62°C was added to the flask
from a burette. The sugar was dissolved using a mechanical stirrer and 1
drop of 50% (v/v) HCI and 5 ml of ammonium citrate solution (pH 6.0) was
added to the sugar solution. This solution was then placed in the refrigerator
while the yeast solution was prepared. Yeast (5.5 g) was suspended in 30 ml
distilled water. The solution was quantitatively transferred to a 50 ml
volumetric flask and made up to mark. Immediately, 5 ml of the well-shaken
yeast solution was added to the sugar solution. The time between the
preparation of the yeast solution and addition of the yeast to the sugar
solution was kept to a minimum. The sugar solution was then placed in a
water bath at 55°C for 1 hour following which it was immediately heated to
90°C to inactivate the enzyme.
The sample was cooled and 26 g transferred into a 200 ml volumetric flask,
then diluted with distilled water to 200 ml. This sample was filtered through
Whatman No. 91 filter paper to remove any solid matter. An aliquot of 20 ml of
the filtrate was transferred to another 200 ml volumetric flask and diluted to
200 ml. This solution was used as the titrant in the Fehlings titration method
for the determination of reducing sugars. To an Erlenmeyer flask containing
12.5 ml each of Fehlings A and Fehlings B, 20 ml of distilled water and 15 ml
of the titrant were added. The solution was boiled for exactly 1.5 minutes and
5 drops of 1% methylene blue indicator were added and the sample boiled for
another 30 seconds. After this time the titrant was added at a rate of a drop
52
every 5 seconds until a brick red endpoint was reached. All the titrations were
done in duplicate.
%Inversion = x X 0.1325 x 100 x 0.35
Titre x 0.00715 x 1.052
Where: x = volume of Fehlings solution (ml) used in the titration.
0.00715 = amount of sucrose (g) present in 1ml of titrating solution.
1.052 = inversion factor
0.13 9 = invert factor of Fehlings solution.
0.35 = conversion factor used to convert results to equivalent on dry
basis
2.4.4 Assay foil' IExtll'é!lceIIilJlIé!l1l'Invertase
The fermentation broth was analysed for enzyme activity in order to determine
if the yeast did in fact secrete any enzymes into the broth, as reported by
Reed and Nagodawithana (1991) and Gascon et al. (1968) and to determine
the effect of the different conditions studied on the levels of these extracellular
enzymes.
The enzyme assay method used to determine the specific enzyme activity of
the yeast was modified and applied to assay for invertase in the broth. The
modification involved the addition of 50 ml of broth to the sugar solution
instead of 5 ml of yeast solution.
53
2.4.5 Nitrogen Analysis
Nitrogen and phosphate determinations were carried out according to the
Combined Method for Nitrogen and Phosphate Determination by Kjeldahl
Distililation (NCP Yeast Laboratory Method No. 2.1.1). The digestion block
temperature was preset to 425°C. To a 200 ml Tecator digestion tube 10 ml
conc. sulphuric acid was added. 1 g of yeast from the press cake was
weighed and transferred to the Tecator Tube. One Tecator catalyst tablet
(copper sulphate/potassium sulphate) was added to the tube. 10 ml 30%
hydrogen peroxide was pipetted into the tube. Extreme care was taken when
adding the hydrogen peroxide, because the subsequent chemical reaction is
very vigorous and exothermic. Once the solution in the tube had stopped
fizzing, the tube was placed in the preheated digestion block and allowed to
digest for 45 minutes. When digestion was complete, the tubes were removed
from the digestion block and allowed to cool for 15 minutes, and then 40 ml
distilled water was added to the sample to prevent it from solidifying.
Digestion tube contents were quantitatively transferred to a 100 ml volumetric
flask and diluted to mark with distilled water. Ten ml of sample was
transferred to another 100 ml volumetric flask. This sample was used for the
phosphate determination. The remaining 90 ml of sample was put back into
the Tecator tube. The Tecator tube was placed in the distillation unit and 40
ml alkali (40% NaOH) was added. In a 250 ml volumetric flask, 25 ml of 4%
boric acid solution, containing methyl red/bromocresol green indicator (10 ml
of 0.2% alcoholic methyl red mixed with 50 ml of 0.2% alcoholic bromocresol
54
green solution) was added and the flask placed on the receiving platform of
distillation unit. The platform of the distillation unit was raised and the steam
for distillation switched on. The sample was distilled for 5 minutes and titrated
with 0.1 N Hel. A blank was run using the above procedure using all
reagents, except for the yeast.
The % nitrogen on dry basis was calculated as follows: -
(titre - blank) x 1.4007 x normality of HelMass of sample
x 100%dry matter
2.4.6
2.4.6.~.~ Mo~ylbdlovalTlladlatelReagelTllt
Forty grams ammonium molybdate (Merck) was dissolved in 400 ml hot
distilled water and cooled to room temperature. Two grams ammonium
metavanadate was dissolved in 250 ml distilled water, and 362 ml of 55%
nitric acid was added. Slowly the molybdate solution was added to
metavanadate solution and diluted to 2 litres using distilled water.
2.4.6.1.2 Phosphate solutlon
Standard Phosphate Solution (1 ml contains 1 mg P2051
Four grams of potassium di hydrogen orthophosphate was dried in a drying
oven at 105°e for 2 hours, cooled in a dessicator and 1.9173 g weighed and
dissolved in distilled water to 1 litre in a volumetric flask.
Working Phosphate Solution (1 ml contains 0.1 mg Pf051
Using a pipette, 50 ml of the standard phosphate solution was transferred into
a 500 ml volumetric flask and made up to mark.
55
2.4.6.2 SamplePreparationand Analysis
The 10 ml sample that was previously retained from the nitrogen analysis was
used to determine the phosphate concentration in the yeast. To this sample,
20 ml of molybdovanadate solution and 20 ml phosphate solution were added
and the solution diluted to 100 ml. Two 100 ml volumetric flasks were
prepared by the addition of 20 ml and 35 ml phosphate solution respectively
Twenty ml of molybdovanadate was added to each of these flasks and diluted
to 100 ml. The flask containing the 20 ml phosphate solution was the blank
while the flask with the 35 ml phosphate solution was the standard. All the
samples were allowed to stand for 15 minutes in order for colour development
to occur. Absorbanees of the samples were measured using a UVNIS
spectrophotometer (Milton Roy Spectronic 20 D+) set at a wavelength of 420
nm and calibrated using the blank. The cuvette containing the standard
sample was inserted into the machine and the absorbance read. This sample
should give an absorbance of 0.35% (a). Once the instrument had been
calibrated, the absorbanees of the samples were determined (b).
Calculation
Q x (1.5 x 1000) + (sample mass + % dry matter)a
Where a = absorbance of standard and b = absorbance
of sample
2.4.7 Separationof Biomass (lab. Scale Fermentations)
Ten ml of sample was added to 15 ml centrifuge tubes and centrifuged at

56
20 x 9 for 10 minutes. The supernatant was retained for invertase analysis.
The yeast was washed twice and the supernatant discarded. The yeast was
reconstituted with distilled water and diluted to 18% Yeast Dry Matter Solids
(YDMS). The yeast was filtered under vacuum to produce a press cake
using Whatman no.1 filter paper and a Buchner funnel and filtration flask.
Once the biomass was separated from the broth, the yeast was tested for
nitrogen and phosphate content, dry matter (solids), and invertase activity.
2.4.8 DII'lfMatter (solids) Determoll1latiolnl
An aluminium dish was weighed and the weight was recorded (a). About 5 g
of yeast was added to the weighed dish and distributed over the entire inner
surface of dish using a spatula. The dish was reweighed and the weight of
dish + yeast recorded (b). The sample was placed in the drying oven for 5
hours at 105°C and dried to a constant mass. After 5 hours, the sample was
removed from the oven and cooled in a dessicator. The dish and dry matter
was then reweighed (c).
% Dry Matter = (c - a) +(b - a) x 100.
2.4.9 DeteB"minationof Total invert SlUIgall'(riS) in Wort
The TIS in the wort samples was determined by the Fehlings method (NCP
Method 2.2.1). Wort samples were cooled to 20°C and 2 ml sample was
pipetted into an Erlenmeyer flask containing 15 ml of 1M HCI and 125 ml of
distilled water. This solution was boiled for exactly 2 minutes and cooled
rapidly and neutralised with 1 M NaOH using litmus paper as indicator of
neutrality. The sugar solution was quantitatively transferred into a 250 ml
57
volumetric flask and diluted with distilled water to 250 ml. A 50 ml burette was
filled with this solution. 5 ml each of Fehlings A and Fehlings B solutions
were pipetted into a 250 ml Erlenmeyer flask containing 25 ml of distilled
water. From the 50 ml burette, 15 ml of sugar solution was run into the mixed
Fehlings solution and the mixture boiled for exactly 2 minutes. Three drops of
1% methylene blue was added to the still boiling solution and the titration
continued until the blue colour was completely discharged. The amount of
sugar solution required to bring about a complete discharge of the blue colour
was noted (A). From the Lane and Eynon table (Appendix i), the sugar
concentration (C) corresponding to the titre obtained was determined.
TIS (%g/I) = C x25Ax2
2.5 Laboratory Ferrmentations
A 10-litre glass Chemap laboratory fermenter (model Neptune LF 14/7/20,
Chemap AG, Switzerland), fitted onto a Chemap "Neptune" base was used for
laboratory scale fermentations. Temperature was controlled using a pt100
probe connected to an electronic display. Temperature of the fermentation
was controlled between 29.0eC and 30eC by passing water over an electric
heater/cooler through the water jacket of the fermenter. The agitator was set
at a speed of 125 rpm. Compressed air was passed through a filter and into
the fermenter, just below the agitator blade. Scaled down fermentations
mimicking conditions of plant scale fermentations were conducted in order to
58
optimise invertase production (nitrogen source, fermentation time and feed
patterns were modified).
2.5.1 Manipulation of Sources of Nitrogen
The urea in the basic fermentation medium was replaced by di-ammonium
phosphate (DAP) as the source of nitrogen. Based on previous calculations,
the amount of urea added was calculated to be 11.42 g/I, i.e. amount of urea
added divided by the total start volume of the fermenter, to yield a final
nitrogen concentration in the yeast of 8% on dry matter. The amount of DAP
required to yield 8% nitrogen in the yeast was calculated as follows: -
The formula for DAP is (NH4) 2HP04, this means that there is 21.2% nitrogen
as N2. Therefore in order to produce yeast with 8% nitrogen, using DAP as
the sole nitrogen source, 20.6 g nitrogen would be required from DAP. Since
DAP has 21.2% nitrogen, the amount required would be 20.6 g + 21.2% =97.17 g. This is equivalent to 22.2 g/I DAP at start to yield a final nitrogen
content in the yeast of 8% on dry basis. DAP contains 53.78% phosphate as
P205. The amount of phosphoric acid added to the fermenter was reduced
accordingly.
2.5.2 Manipulation of Fermentation lime
Two fermentation periods were tested for all the laboratory experiments. A
standard fermentation of 14 hours and an extended fermentation of 24 hours
were used. 14 and 24 hour fermentation times were chosen based on the
fermentation times that are currently being used on the production plant at
59
NCP Yeast. Although it was mentioned that enzyme synthesis cycles in the
yeast, this parameter was not studied.
2.5.3 Change of Feed Patterns
Batch and fed batch fermentations were carried out, the yeast produced, and
the fermentation broths were assayed for enzyme production. In the batch
fermentation, all the nutrients were added before inoculation of the fermenter.
The fermentation was aerated and allowed to proceed without any further
additions being made.
With the fed batch fermentations, all the nutrients except the molasses were
added at the start of the fermentation. A small amount of molasses, enough
to produce 0.2% alcohol, was added before inoculation of the fermenter. The
balance of the molasses was added incrementally over the duration of the
fermentation. The feed rate was adjusted hourly and was determined by the
concentration of alcohol present in the broth at the start of the hour. Feed
was increased by a maximum of 20% from hour to hour (the previous hour's
feed rate x 1.2) to prevent over feeding of the culture.
2.6 Plant Trials
Once optimal conditions for invertase production were established in the
laboratory scale fermentations, the conditions were applied in the plant
bioreactors at the NCP Yeast factory in Durban. The operational conditions of
the plant scale fermentations were as described in section 2.1.
60
3.0 RESULTS AND DISCUSSION
3.1 ElI1lzymeLevels under Current Fermentation Conditions
Initially, the levels of enzyme obtained under current fermentation conditions
used at the Nep plant were analysed with a view to determining the possible
cause of low and inconsistent enzyme activity of the yeast produced. The
minimum specification for yeast invertase activity as determined by the sugar
refineries is 21%. The levels obtained under present fermentation conditions
are between 12% and 18%. In the 6 fermentations studied, the effect of pH,
total sugar added, % phosphate and % nitrogen on invertase production was
looked at. Phosphate was chosen as a parameter based on the studies of
Toda et al. (1982), who stated that a hyper production of invertase was related
to a deficiency of inorganic phosphate in the medium of a continuous culture
of S. carlsbergensis. Nitrogen was selected since it is one of the important
process control tests carried out in industry, since nitrogen levels in the yeast
influences the gassing activity, filtration properties and shelf life of the yeast.
The pH was looked at since according to Vitolo et al. (1995), invertase activity
was higher at pH 5.5 than at pH 4.0. In their studies there was no indication of
the effect of aeration on invertase. Studies of Pyun et al. (1999) showed some
effect of oxygen on invertase production but this was related to moving from
aerobic to anaerobic conditions. Therefore aeration was not looked at. The
only parameter that would impact these results is the feed rate, which was
controlled but not reported since the inclusion of the feed rate of supply of
sugars would involve publishing the fermentation profile of the company,
61
which is not permissible. However, written permission was granted to divulge
alcohol levels.
Analysis of six fermentations carried out over a 6 week period (Table 3)
showed that the final pH of the fermentation indicated no correlation with
invertase activity as fermentations 1 and 2 had a final pH of 5.62 and 5.60,
and produced enzyme activities of 12.00% and 16.60%, respectively.
Fermentation 3 had the lowest pH of 5.07 but the enzyme activity was
16.35%, which is similar to the activity of fermentation 2 with a higher pH of
5.60. Fermentations 5 and 6 both had pH values of 5.50 but enzyme
activities were 20.30% and 22.40%, respectively. Fermentation 4 produced
an enzyme activity of 18.33% at a similar pH. Hence, the final pH of the
fermentation does not seem to influence invertase levels or production.
The amount of sugar added to the fermentation did not affect the enzyme
production. Fermentation 1 and fermentation 5, with similar amounts of sugar
added (7548 kg and 7517 kg), had different invertase activity (12% and
20.3%, respectively), whereas the fermentation with highest activity (22.4%)
was fed with 5540 kg sugar.
Phosphate levels in the yeast of between 3.00% and 3.70% and nitrogen
content of between 9.00% and 9.60% are more likely to yield higher invertase
activities, as seen by the results of fermentations 4, 5 and 6. Fermentations 2
and 3 had the highest levels of nitrogen and phosphate and similar invertase
activities, i.e. 16.60% and 16.35%, suggesting that the higher nitrogen and
/
62
phosphate level in the yeast has a negative effect on invertase production.
Fermentation 1 had the lowest nitrogen and phosphate levels and the lowest
invertase activity, however, fermentations 4, 5 and 6 which yielded invertase
activities of 18.33%, 20.30% and 22.40%, respectively, had nitrogen contents
of 9.60%, 9.14% and 9.59%, and phosphate levels of 3.52%, 3.61% and
3.08%, respectively. Thus it would appear that the fermentation which yields
nitrogen levels in the yeast of between 9.00% and 9.60%, and phosphate
levels of approximately 3.?O%, might produce higher invertase activities.
Invertase levels produced in 6 fermentations due to the influence of the final
pH, total sugars, nitrogen and phosphate content showed that only nitrogen
and phosphate had any influence on enzyme activity. Phosphate was looked
at initially based on the studies of Toda et al. (1982), who stated that a hyper
production of invertase was related to a deficiency of inorganic phosphate in
the medium of a continuous culture of S. carlsbergensis. However, since
phosphate is essential for obtaining increase yields in biomass and the
medium is supplemented with inorganic phosphate sources usually
phosphoric acid (White, 1954), the phosphate concentration was not
manipulated. These results are shown in Table 3.
3.2 Invertase levels as a Function of Varying FeumeratationConditions
In an attempt to increase the concentration of the invertase enzyme produced
by S. cerevisiae, the enzyme production by two industrial strains was studied.
Both strains of yeast were obtained from Nep Yeast Limited. Strain YO?, is
known to produce a high concentration of the invertase enzyme, and strain
Y09, Baker's Yeast, is known for it's high gassing activity in dough mixtures.
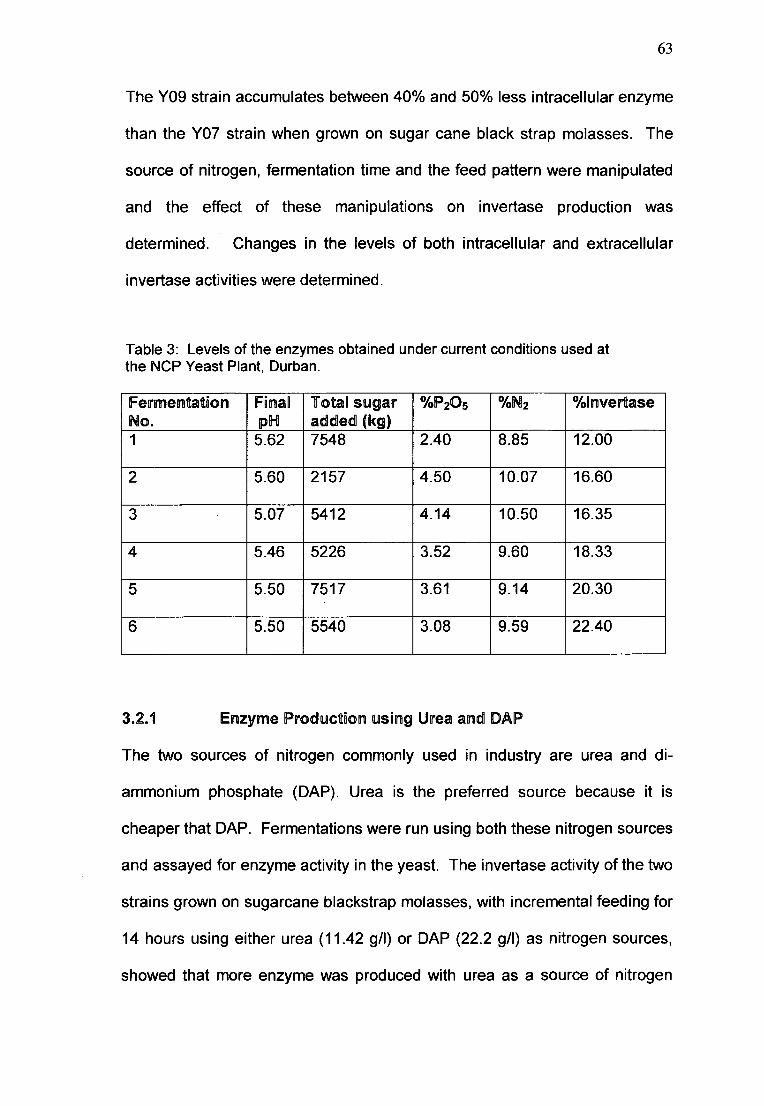
63
The Y09 strain accumulates between 40% and 50% less intracellular enzyme
than the Y07 strain when grown on sugar cane black strap molasses. The
source of nitrogen, fermentation time and the feed pattern were manipulated
and the effect of these manipulations on invertase production was
determined. Changes in the levels of both intracellular and extracellular
invertase activities were determined.
Table 3: Levels of the enzymes obtained under current conditions used atthe Nep Yeast Plant, Durban.
Fermentatooll'1l Fina~ Total sugar %P20s %1N2 %InvertaseNo. plHl added (kg)1 5.62 7548 2.40 8.85 12.00
2 5.60 2157 4.50 10.07 16.60
3 5.07 5412 4.14 10.50 16.35
4 5.46 5226 3.52 9.60 18.33
5 5.50 7517 3.61 9.14 20.30
6 5.50 5540 3.08 9.59 22.40
3.2.1 Enzyme Production USDII'1IQ] Urea and DAP
The two sources of nitrogen commonly used in industry are urea and di-
ammonium phosphate (DAP). Urea is the preferred source because it is
cheaper that DAP. Fermentations were run using both these nitrogen sources
and assayed for enzyme activity in the yeast. The invertase activity of the two
strains grown on sugarcane blackstrap molasses, with incremental feeding for
14 hours using either urea (11.42 g/I) or DAP (22.2 g/I) as nitrogen sources,
showed that more enzyme was produced with urea as a source of nitrogen
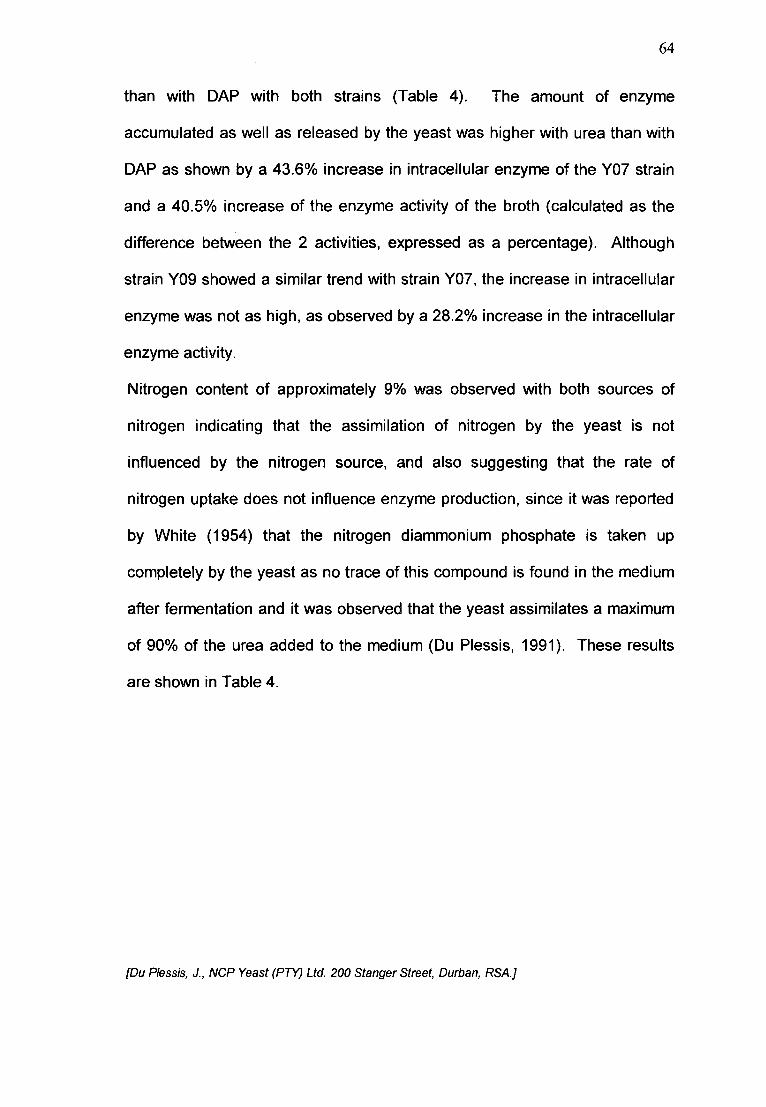
64
than with DAP with both strains (Table 4). The amount of enzyme
accumulated as well as released by the yeast was higher with urea than with
DAP as shown by a 43.6% increase in intracellular enzyme of the YO?strain
and a 40.5% increase of the enzyme activity of the broth (calculated as the
difference between the 2 activities, expressed as a percentage). Although
strain Y09 showed a similar trend with strain YO?,the increase in intracellular
enzyme was not as high, as observed by a 28.2% increase in the intracellular
enzyme activity.
Nitrogen content of approximately 9% was observed with both sources of
nitrogen indicating that the assimilation of nitrogen by the yeast is not
influenced by the nitrogen source, and also suggesting that the rate of
nitrogen uptake does not influence enzyme production, since it was reported
by White (1954) that the nitrogen diammonium phosphate is taken up
completely by the yeast as no trace of this compound is found in the medium
after fermentation and it was observed that the yeast assimilates a maximum
of 90% of the urea added to the medium (Du Plessis, 1991). These results
are shown in Table 4.
[Du Plessis, J., Nep Yeast (PTY) Ltd. 200 Stanger Street, Durban, RSA.]
65
Table 4: The effect of urea and di-ammonium phosphate (DAP) on the production ofinvertase by S. cerevisiae Y07 and Y09 strains grown on sugarcane blackstrapmolasses at 30°C with incremental feeding for 14 hours.
Nitrogen Yeast Inversion of lnversion of
Source Strasn Broth Yeast %Nitrogen*
(Extracellular) (Intracellular)
(%/ml) * (%/ml)*
Urea Y07 0.2633 ±0.0152 1.8500 ±0.0500 9.0600 ±0.0400
DAP Y07 0.1567 ±0.0153 1.0433 ±0.0208 8.9567 ±0.0839
Urea Y09 0.1800 ±0.0100 0.1300 ±0.0265 9.0367 ±0.0321
DAP Y09 0.1233 ±0.0208 0.0933 ±0.0153 9.0400 ±0.0300
*Mean and standard deviation of three replicate fermentation experiments
3.2.2 EnzymeProductionas a fllmctooll1l of fermell1lttaftooll1l Tome
The enzyme activities of the 14 and 24 hour fermentations showed that there
was an increase in enzyme activity over time (Fig. 7). The enzyme activity of
the yeast cells was 8 times higher than that of the fermentation broth in the 14
hour fermentations for the Y07 strain. In 24 hours, however, the enzyme
activity of the yeast cells was almost doubled, but that of the broth increased
by an average of 14 fold. Although there was a doubling of the enzyme
activity of the cells in 24 hours, there was more enzymes activity accumulated
in the broth than the cells. This is evident by the 14 fold increase in the
activity of the broth between the 14 hour and the 24 hour fermentation; as
compared to 2.5 fold average increase in the enzyme activity of the yeast
cells (Table 5).
66
With strain Y09, 30% higher enzyme activity was achieved in the broth than
inside the yeast, although enzyme concentrations were very low at the end of
14 hours. In the 24 hour fermentation, it can be observed that the enzyme
concentration of the yeast cells of the Y09 strain is lower than that of the YO?
strain grown for 24 hours. Interestingly, the enzyme concentration of the broth
of the Y09 fermentation is almost the same as that of the YO? 24 hour
fermentation broth. The enzyme concentrations of the cells show an increase
from the levels observed in the 14 hour fermentations. There is a 19 fold
increase in the total enzyme concentration, (both intracellular and
extracellular) in the 24 hour fermentation of strain Y09 compared to the 14
hour fermentation, but the total amount of enzymes produced by the YO?
strain in 24 hours was only 3.5 times higher than that produced in 14 hours.
These results are in agreement with the fact that the YO? strain accumulates
more intracellular invertase than the Y09 strain, but both strains produced
similar levels of extracellular enzyme in the broth. The YO? strain has a
higher level of intracellular enzyme at 14 hours, compared to Y09, but this
only doubles at 10 hours. On the other hand, the Y09 strain has a lower
concentration of intracellular enzyme after 14 hours, as compared with the
YO? strain, but seems to be producing the enzyme at a faster rate than YO?
This can be seen by the 19 fold average increase in the enzyme
concentration in 10 hours from the 14th to 24th hour of fermentation. Both
strains produced similar amounts of enzymes in the broth after 24 hours.
These results are in agreement with the findings of Chan et al. (1991), who
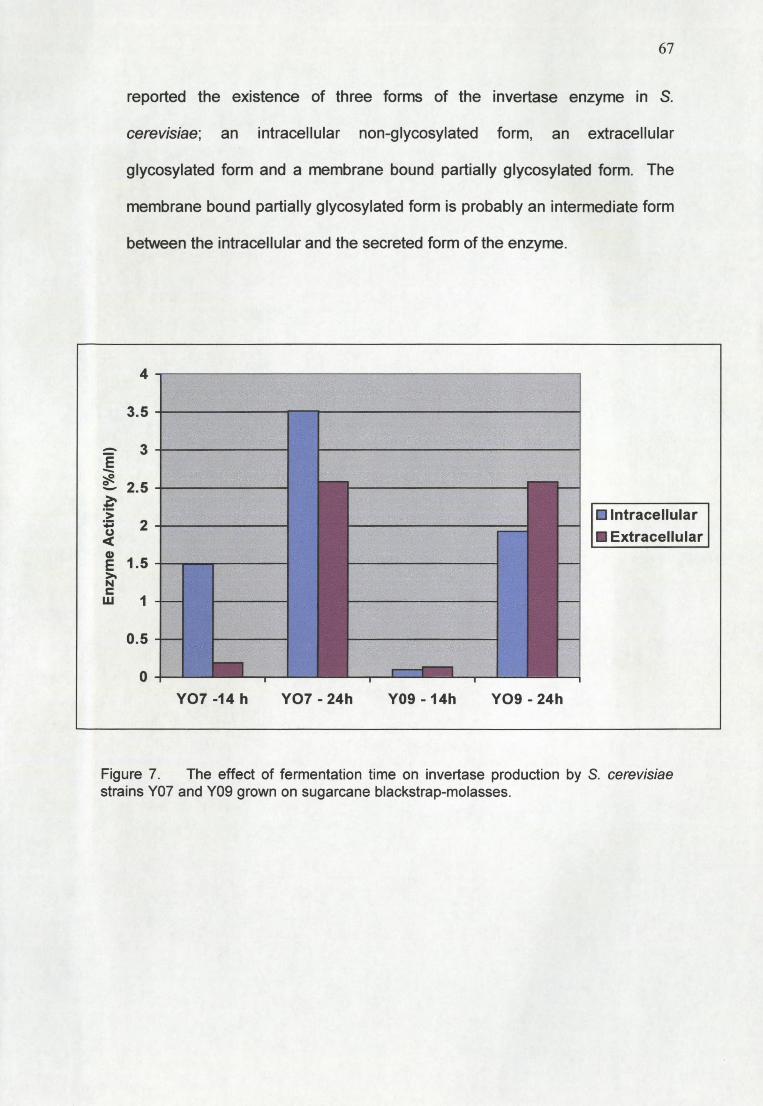
67
reported the existence of three forms of the invertase enzyme in S.
cerevisiae; an intracellular non-glycosylated form, an extracellular
glycosylated form and a membrane bound partially glycosylated form. The
membrane bound partially glycosylated form is probably an intermediate form
between the intracellular and the secreted form of the enzyme.
4
3.5
=- 3E-~0 2.5-~.S:.. 2CJca:Cl)
1.5E>-Ns::::w 1
0.5
0
Intracellular
V07 -14 h V07 - 24h VOg - 24hVOg - 14h
Figure 7. The effect of fermentation time on invertase production by S. cerevisiaestrains Y07 and YOggrown on sugarcane blackstrap-molasses.
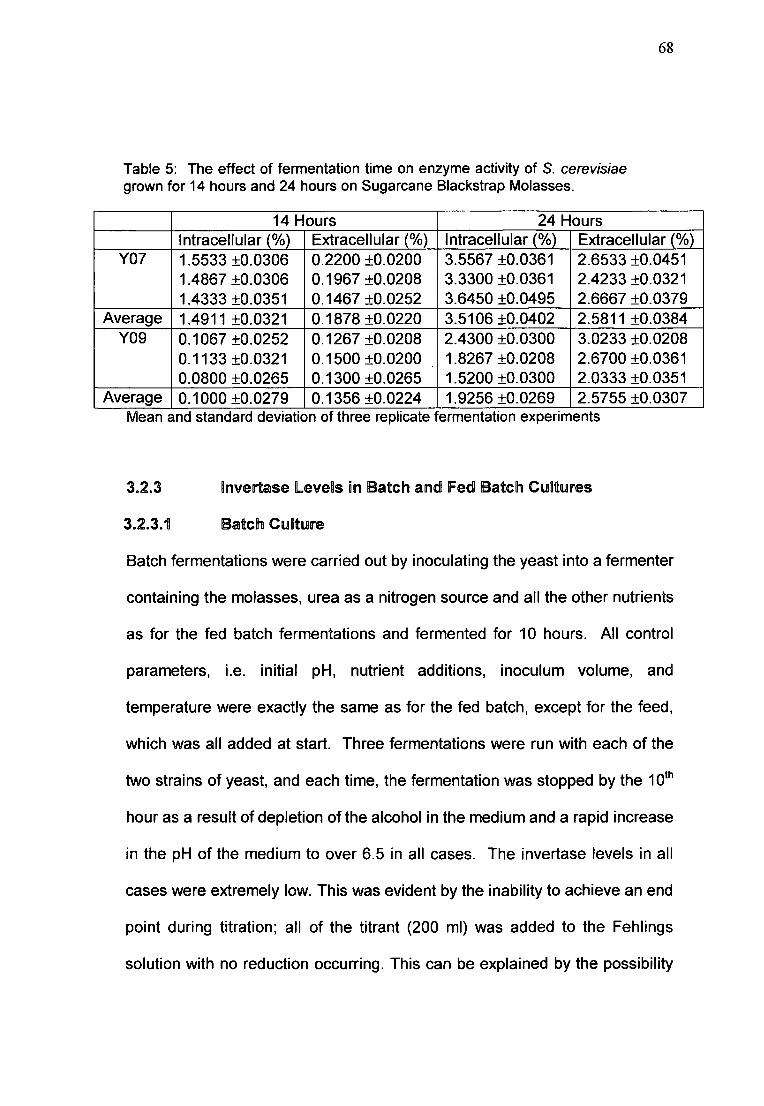
68
Table 5: The effect of fermentation time on enzyme activity of S. cerevisiaegrown for 14 hours and 24 hours on Sugarcane Blackstrap Molasses.
14 Hours 24 HoursIntracellular (%) Extracellular (%) Intracellular (%) Extracellular (%)
Y07 1.5533 ±0.0306 0.2200 ±0.0200 3.5567 ±0.0361 2.6533 ±0.04511.4867 ±0.0306 0.1967 ±0.0208 3.3300 ±0.0361 2.4233 ±0.03211.4333 ±0.0351 0.1467 ±0.0252 3.6450 ±0.0495 2.6667 ±0.0379
Average 1.4911 ±0.0321 0.1878 ±0.0220 3.5106 ±0.0402 2.5811 ±0.0384Y09 0.1067 ±0.0252 0.1267 ±0.0208 2.4300 ±0.0300 3.0233 ±0.0208
0.1133 ±0.0321 0.1500 ±0.0200 1.8267 ±0.0208 2.6700 ±0.03610.0800 ±0.0265 0.1300 ±0.0265 1.5200 ±0.0300 2.0333 ±0.0351
Average 0.1000 ±0.0279 0.1356 ±0.0224 1.9256 ±0.0269 2.5755 ±0.0307Mean and standard deviation of three replicate fermentation expenments
3.2.3 Invertase levels ln Batch! and fed Batch! CLJlltlUlires
3.2.3.1 Batch CLJlltlUlre
Batch fermentations were carried out by inoculating the yeast into a fermenter
containing the molasses, urea as a nitrogen source and all the other nutrients
as for the fed batch fermentations and fermented for 10 hours. All control
parameters, i.e. initial pH, nutrient additions, inoculum volume, and
temperature were exactly the same as for the fed batch, except for the feed,
which was all added at start. Three fermentations were run with each of the
two strains of yeast, and each time, the fermentation was stopped by the io"
hour as a result of depletion of the alcohol in the medium and a rapid increase
in the pH of the medium to over 6.5 in all cases. The invertase levels in all
cases were extremely low. This was evident by the inability to achieve an end
point during titration; all of the titrant (200 ml) was added to the Fehlings
solution with no reduction occurring. This can be explained by the possibility
69
that the sucrose was hydrolysed to glucose and fructose rapidly resulting in
excess fermentable sugars being available in the broth. The yeast invertase
is capable of hydrolyzing sucrose to glucose and fructose 300 times faster
than the rate of metabolism (Demis et al., 1953). This phenomenon could
explain the elevated glucose levels in the fermentation broth. Presence of
excess glucose and fructose in the medium would result in the culture
following the negative Pasteur effect, which is evident by the sharp increase
in the alcohol between 2 hours and 6 hours of fermentation (Fiq. 8). Since no
invertase activity was detected in the yeast and the broth after 10 hours of
fermentation, it would suggest that the initial induction of invertase production
by the presence of sucrose at the start of fermentation was rapidly repressed
by the presence of excess glucose in the medium. These observations are
consistent with the findings of Naudin et al. (1986), who studied the invertase
activity of S. cerevisiae cells during batch fermentation of glucose. They
reported a variation in the yeast invertase activity from 10.5 international units
at inoculation to 2.5 international units after 48 hours. Another possibility for
the non-detection of enzyme activity and the rapid metabolism rate observed
could be the hydrolysis of the sucrose as a result of strong acidification of the
medium, as observed by the sharp decrease in the pH of the medium to a
level of 3.22 by the 6th hour of fermentation, resulting in the acid hydrolysis of
the sucrose present. De Medeiros and de Carvalho (1999) reported a similar
phenomenon in their study of the relationship of invertase production to
nitrogen source in Hansenula anamola. They reported a >22% breakdown of
sucrose occurring in the medium as a result of acid hydrolysis, and no
invertase was detected under these conditions.
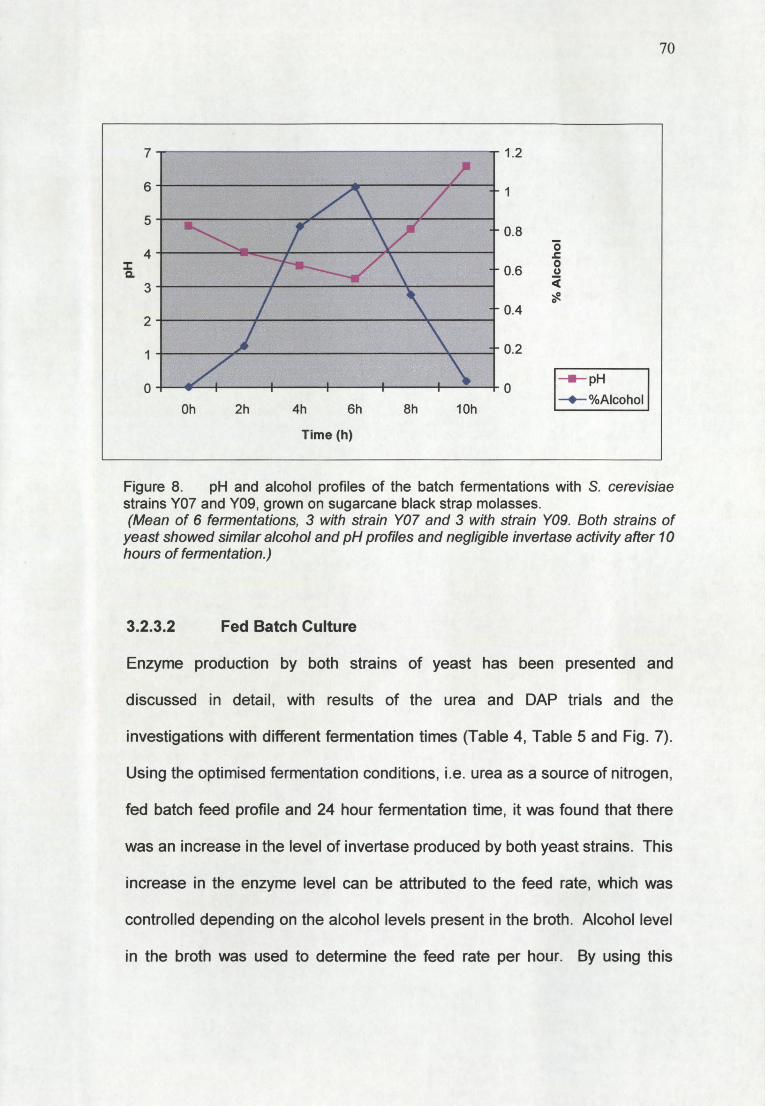
70
7 1.2
6 1
50.8
4 "0J:
:I: 0.6 0Cl. u
3 :cc~0
0.42
1 0.2
0 0--pH
Oh 2h 4h 6h 8h 10h--+- %Alcohol
Time (h)
Figure 8. pH and alcohol profiles of the batch fermentations with S. cerevisiaestrains YO? and YOg, grown on sugarcane black strap molasses.(Mean of 6 fermentations, 3 with strain Y07 and 3 with strain YOg. Both strains of
yeast showed similar alcohol and pH profiles and negligible invertase activity after 10hours of fermentation.)
3.2.3.2 Fed Batch Culture
Enzyme production by both strains of yeast has been presented and
discussed in detail, with results of the urea and DAP trials and the
investigations with different fermentation times (Table 4, Table 5 and Fig. 7).
Using the optimised fermentation conditions, i.e. urea as a source of nitrogen,
fed batch feed profile and 24 hour fermentation time, it was found that there
was an increase in the level of invertase produced by both yeast strains. This
increase in the enzyme level can be attributed to the feed rate, which was
controlled depending on the alcohol levels present in the broth. Alcohol level
in the broth was used to determine the feed rate per hour. By using this
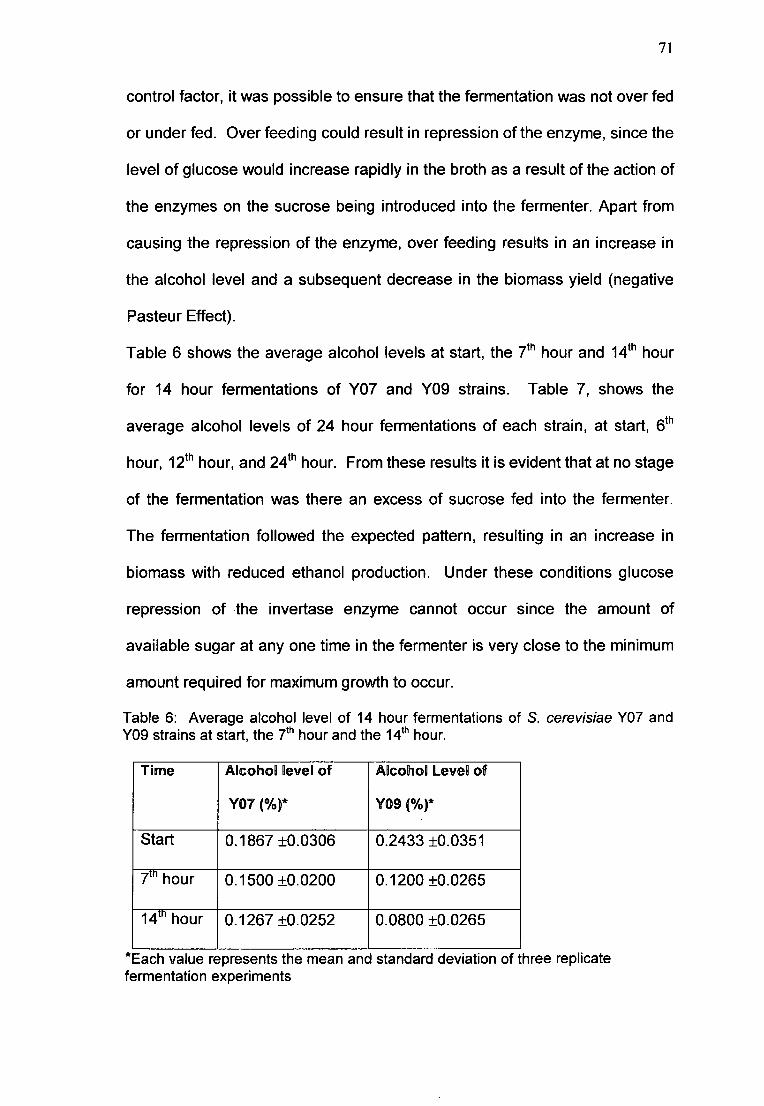
71
control factor, it was possible to ensure that the fermentation was not over fed
or under fed. Over feeding could result in repression of the enzyme, since the
level of glucose would increase rapidly in the broth as a result of the action of
the enzymes on the sucrose being introduced into the fermenter. Apart from
causing the repression of the enzyme, over feeding results in an increase in
the alcohol level and a subsequent decrease in the biomass yield (negative
Pasteur Effect).
Table 6 shows the average alcohol levels at start, the ih hour and 14th hour
for 14 hour fermentations of Y07 and YOg strains. Table 7, shows the
average alcohol levels of 24 hour fermentations of each strain, at start, 6th
hour, 12th hour, and 24th hour. From these results it is evident that at no stage
of the fermentation was there an excess of sucrose fed into the fermenter.
The fermentation followed the expected pattern, resulting in an increase in
biomass with reduced ethanol production. Under these conditions glucose
repression of the invertase enzyme cannot occur since the amount of
available sugar at anyone time in the fermenter is very close to the minimum
amount required for maximum growth to occur.
Table 6: Average alcohol level of 14 hour fermentations of S. cerevisiae YO? andYOg strains at start, the ?th hour and the 14th hour.
Time Alcohol level of Alcohol leve! of
Y07 (%)* YOg (%)*
Start 0.1867 ±0.0306 0.2433 ±0.0351
7'" hour 0.1500 ±0.0200 0.1200 ±0.0265
14m hour 0.1267 ±0.0252 0.0800 ±0.0265
*Each value represents the mean and standard deviation of three replicatefermentation experiments
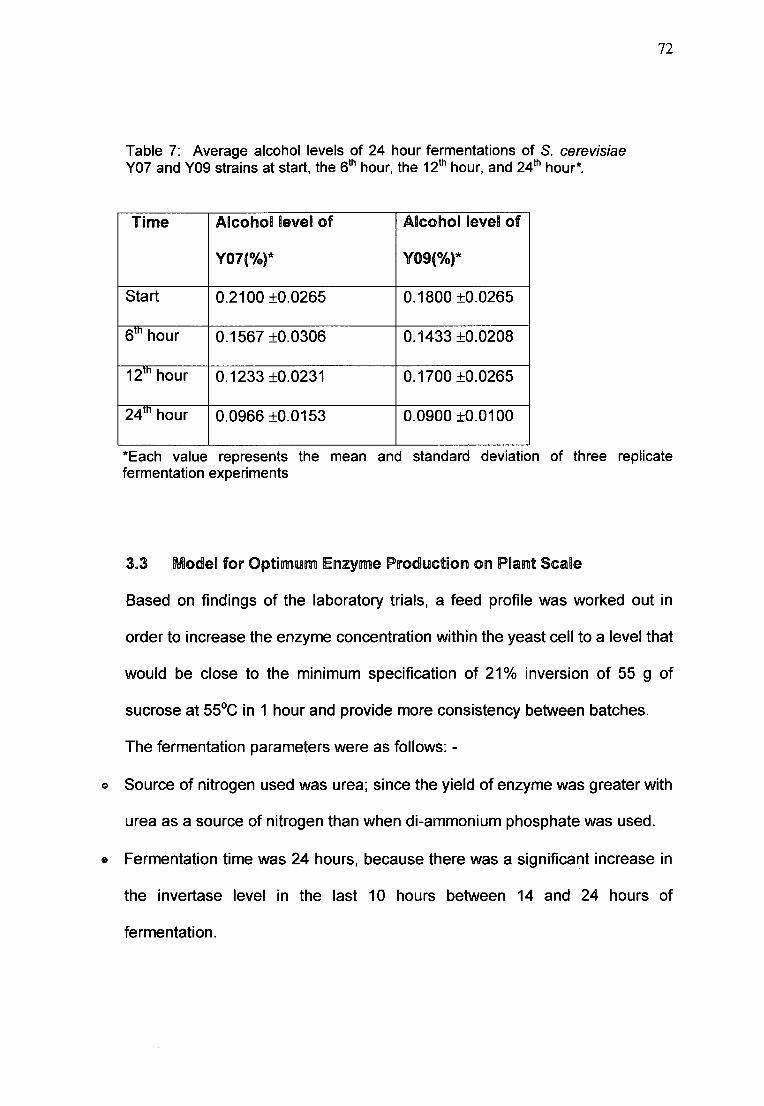
72
Table 7: Average alcohol levels of 24 hour fermentations of S. cerevisiaeY07 and YOg strains at start, the 6th hour, the 1ih hour, and 24th hour*.
Time Alcohol level of Alcohol level of
Y07(%)* Y09(%)*
Start 0.2100 ±0.0265 0.1800 ±0.0265
6tn hour 0.1567 ±0.0306 0.1433 ±0.0208
12m hour 0.1233 ±0.0231 0.1700 ±0.0265
24m hour 0.0966 ±0.0153 0.0900 ±0.01 00
*Each value represents the mean and standard deviation of three replicatefermentation experiments
3.3 Mode~for Optimum IElI11zymeProduction 01111 Plant Scale
Based on findings of the laboratory trials, a feed profile was worked out in
order to increase the enzyme concentration within the yeast cell to a level that
would be close to the minimum specification of 21% inversion of 55 g of
sucrose at 55°C in 1 hour and provide more consistency between batches.
The fermentation parameters were as follows: -
e Source of nitrogen used was urea; since the yield of enzyme was greater with
urea as a source of nitrogen than when di-ammonium phosphate was used.
• Fermentation time was 24 hours, because there was a significant increase in
the invertase level in the last 10 hours between 14 and 24 hours of
fermentation.
73
• The feed pattern used was that of fed batch fermentation, because negligible
amounts of invertase were produced in batch fermentations.
• The temperature of the fermentation was controlled at 30°C to 33°C (as with
the laboratory trials) by circulating the contents of the fermenter through a
plate heat exchanger.
e Fermentation control was the same as the laboratory fermentations where the
parameters measured hourly were pH, alcohol and the biomass present.
These factors determined the rate of molasses feed per hour. Feed rate was
controlled so as to ensure that the concentration of alcohol in the fermentation
was maintained between 0.4% and 0.8% in the latter half of the fermentation.
By maintaining the alcohol concentration within this range it was possible to
ensure that glucose repression of the invertase as a result of overfeeding was
avoided and also that the fermentation was not being under fed. (In which
case, growth would have slowed).
e The yeast strain that produced the higher levels of the invertase enzyme in
the laboratory fermentations was the strain Y07 and this strain was chosen for
the plant trials.
o Fermentation performance is looked at in tables 8 and 9. Inclusion of the feed
rate of supply of sugars would involve publishing the fermentation profile of
the company, which is not permissible. However, written permission was
granted to divulge alcohol levels. In the Batch Phase, the amount of sugar
added to the fermenter before inoculation was calculated to produce a
maximum of 1% alcohol before the fermentation feed pattern was changed to
that of a fed batch fermentation (Tables 8 & 9).
74
The alcohol profile of the batches that produced specific invertase activities of
the intracellular enzyme below 20%, are represented in Table 8 and Figure 9
and that for the fermentations, which produced invertase levels of 20%, and
more, are shown in Table 9 and Figure 9. These results indicate that the feed
pattern followed is crucial to the production of invertase. Batches that
produced lower enzyme yields showed a lower average concentration of
alcohol in the first 6 hours of fermentation than the fermentations with
acceptable enzyme concentrations. Another interesting observation was that
the alcohol concentrations over the next 10 hours of fermentation was higher,
averaging between 0.88% and 1.32% as compared to 0.52% and 1.00% over
the same period for the fermentations that produced increased enzyme
concentrations. The last 8 hours of fermentation saw a rapid decrease in the
alcohol level from an average alcohol of 0.88% to 0.17% in the batches with
low invertase production whereas the alcohol levels of the batches with the
higher invertase concentrations was maintained between 0.49% and 0.43%
over this same period. Possible reasons for the reduced invertase levels
observed in the batches represented by the results in Table 8 are: -
e Glucose levels were too elevated in the first 6 hours of fermentation, as
indicated by the higher alcohol levels by the 8th hour of fermentation. The
increased glucose concentration resulted in catabolite repression of the
invertase enzyme.
ct To reduce the alcohol levels, the feed had to be reduced which resulted in the
fermentation being starved of glucose, causing a diauxic shift in metabolism
from glucose as a source of carbon to the metabolism of alcohol as a carbon
source; hence the sharp decrease in the alcohol levels in the last 10 hours of
75
fermentation. When a decrease in the alcohol level was observed, the feed
was increased incrementally to maintain the level above 0.4%, resulting in an
increased concentration of glucose in the broth, which could be attributed to
two factors. Firstly, enzymes already present in the broth would have inverted
the sucrose that was being fed into the fermentation at a rate that is 300 times
faster than the rate of metabolism (Demis et al., 1953); and secondly, the
switch to glucose metabolism does not seem to occur immediately.
In the laboratory fermentations, the enzyme concentration increased at a
more rapid rate in the last 10 hours of fermentation (between 14 and 24
hours). At this stage of fermentation, the feed rate would be at maximum, as
would the growth rate. With the fermentations that produced the lower
invertase levels, at this critical stage of fermentation, feed rate was reduced to
control the alcohol level, resulting in the growth rate and budding also being
reduced. This would be another contributory factor to the lower levels of
enzymes produced, and is in agreement with the findings of Patkar and Seo
(1992), who reported that invertase production was related to the budding
cycle of yeast.
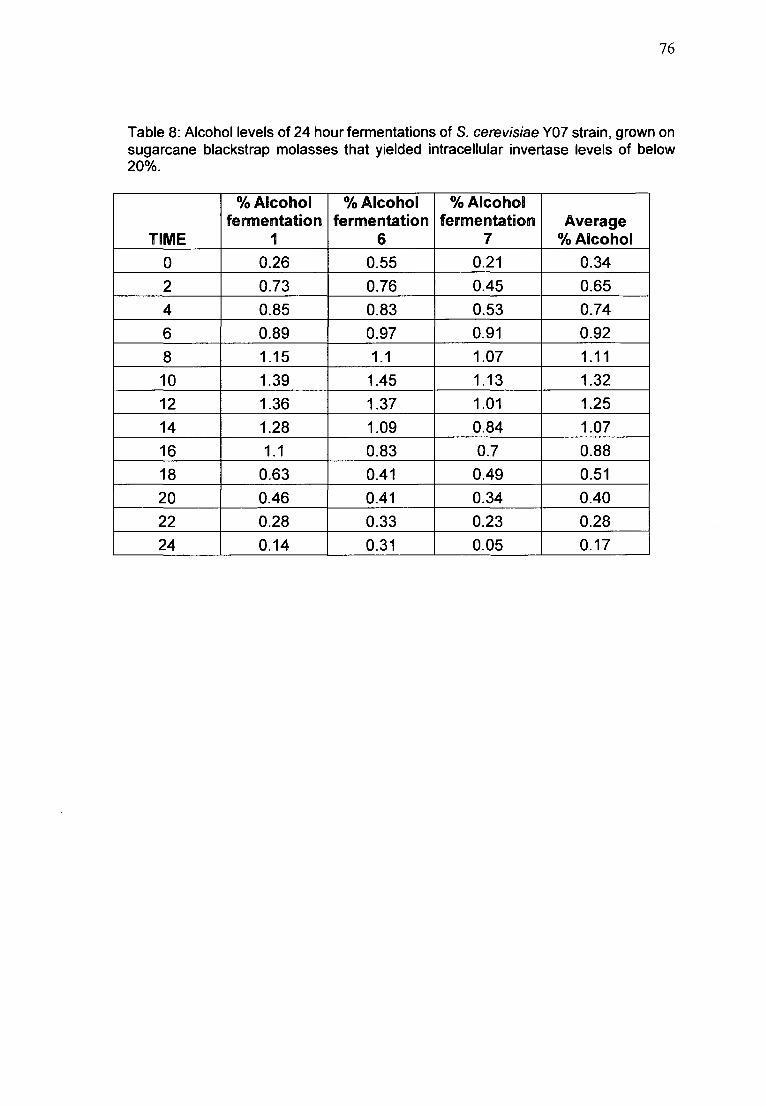
76
Table 8: Alcohol levels of 24 hour fermentations of S. cerevisiae YO?strain, grown onsugarcane blackstrap molasses that yielded intracellular invertase levels of below20%.
%Alcohol %Alcohol %Alcoholfermentation fermentation fermentation Average
TIME 1 6 7 %Alcohol0 0.26 0.55 0.21 0.342 0.73 0.76 0.45 0.654 0.85 0.83 0.53 0.746 0.89 0.97 0.91 0.928 1.15 1.1 1.07 1.1110 1.39 1.45 1.13 1.3212 1.36 1.37 1.01 1.2514 1.28 1.09 0.84 1.0716 1.1 0.83 0.7 0.8818 0.63 0.41 0.49 0.5120 0.46 0.41 0.34 0.4022 0.28 0.33 0.23 0.2824 0.14 0.31 0.05 0.17
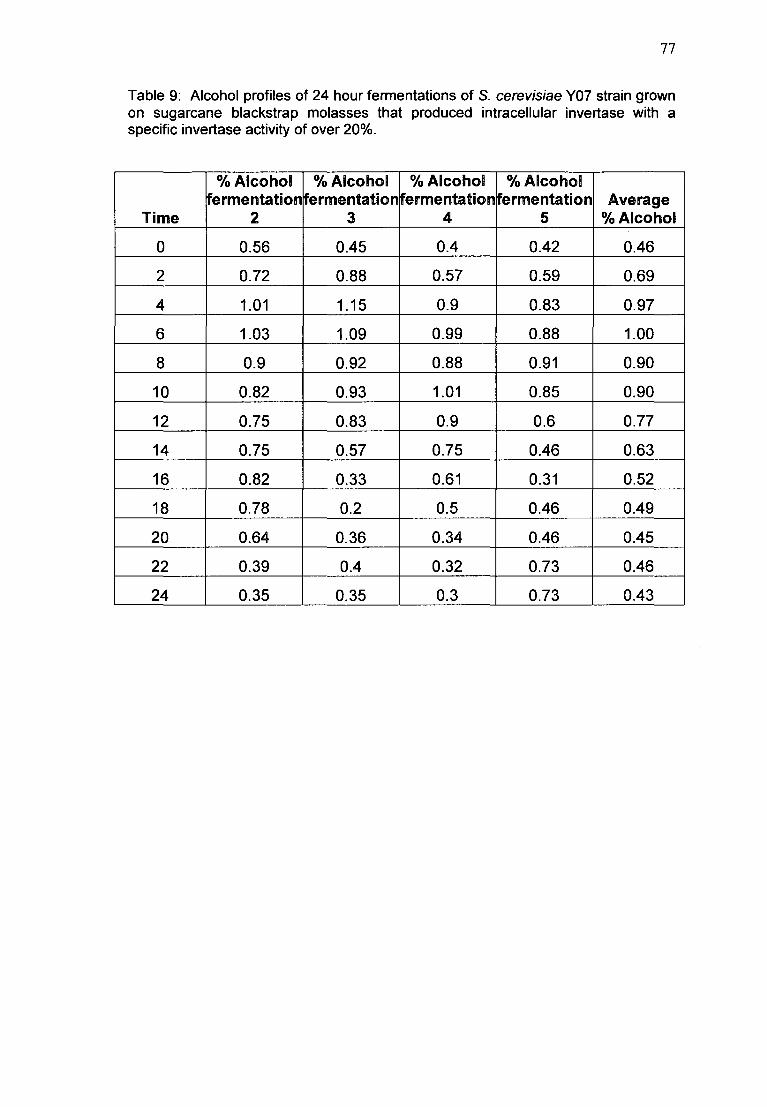
77
Table 9: Alcohol profiles of 24 hour fermentations of S. cerevisiae YO?strain grownon sugarcane blackstrap molasses that produced intracellular invertase with aspecific invertase activity of over 20%.
%Alcohol %Alcohol %Alcohol %Alcohol~ermentation~ermentationfermentation ~ermentation Average
Time 2 3 4 5 %Alcohol
0 0.56 0.45 0.4 0.42 0.46
2 0.72 0.88 0.57 0.59 0.69
4 1.01 1.15 0.9 0.83 0.97
6 1.03 1.09 0.99 0.88 1.00
8 0.9 0.92 0.88 0.91 0.90
10 0.82 0.93 1.01 0.85 0.90
12 0.75 0.83 0.9 0.6 0.77
14 0.75 0.57 0.75 0.46 0.63
16 0.82 0.33 0.61 0.31 0.52
18 0.78 0.2 0.5 0.46 0.49
20 0.64 0.36 0.34 0.46 0.45
22 0.39 0.4 0.32 0.73 0.46
24 0.35 0.35 0.3 0.73 0.43
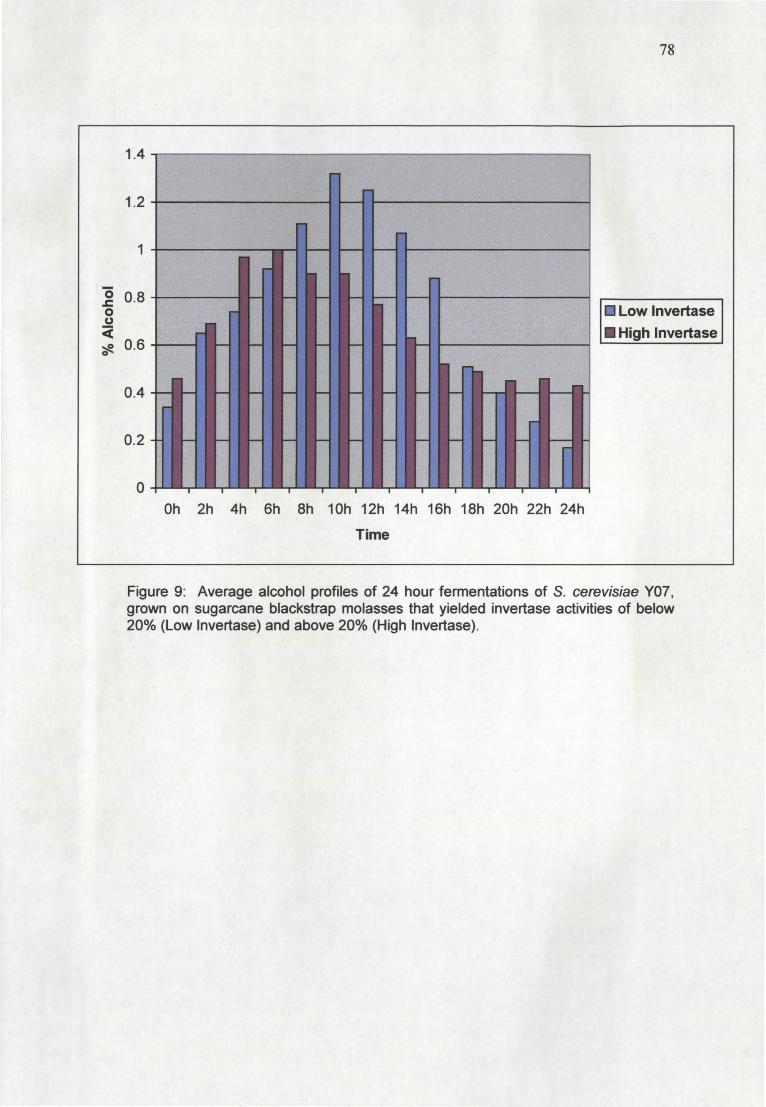
78
1.2
1
0 0.8J:0e
oe(
?Je 0.6
0.4
0.2
Oh 2h 4h 6h 8h 10h 12h 14h 16h 18h 20h 22h 24h
Time
• Low Invertase• High Invertase
Figure 9: Average alcohol profiles of 24 hour fermentations of S. cerevisiae YO?,grown on sugarcane blackstrap molasses that yielded invertase activities of below20% (Low Invertase) and above 20% (High Invertase).
79
4.0 CONCLUSION
The aim of this project was to study the production of invertase by two
industrial strains of S. cerevisiae and to manipulate the fermentation
conditions in order to increase the levels of enzyme produced. To attain this
aim, the effect of the source of nitrogen used, the length of the fermentation
and the feed patterns were studied. The levels of both intracellular and
extracellular invertase activity were determined in order to establish whether
there was any relationship in the rate of production of the two forms of the
enzyme.
From the results obtained, the following conclusion can be drawn: -
• Nitrogen Source
There was a 43% increase in the intracellular invertase produced by the Y07
strain and a 28.2% increase in production by the Y09 strain when urea was
used as the sole nitrogen source as opposed to di-ammonium phosphate
(DAP). It is evident that urea is more suitable for enzyme production than
DAP, when S. cerevisiae strains Y07 and Y09 are grown on sugar cane
blackstrap molasses. The difference in the levels of enzyme produced is
possibly due to the yeast assimilation of the available nitrogen being different
with the urea being assimilated almost completely within the first few hours of
fermentation (White, 1954) and DAP being taken up at a much slower rate
over a longer period.

80
• Fermentation Time
Currently the fermentation of high invertase yeast is being run for 18 to 21
hours, with incremental feeding. The source of nitrogen used is urea and the
feed rate is controlled such that the alcohol concentration in the fermentation
is reduced to a level of between 0.20% and 0.30% and maintained for the
duration of the fermentation.
A 24 hour fermentation time is recommended for the production of invertase
by S. cerevisiae strains Y07 grown on sugar cane blackstrap molasses. Strain
Y07 was observed to accumulate more intracellular enzymes than strain Y09.
The bulk of the enzymes is produced during the last 10 hours, between the
14th and 24th, of fermentation. This is in agreement with the findings of Patkar
and Seo (1992), who reported that the invertase production was related to the
budding cycle of the yeast. In the latter half of the fermentation, the bioreactor
is in a state of maximum growth and maximum feed rate. Budding of the
yeast cells is also at its peak during this period. This may explain why both
yeast strains showed a rapid increase in enzyme concentration of the broth
during this time and could be related to the high demand for glucose in this
vigorous growth phase. These results are in agreement with the findings of
Rouwenhorst et al. (1991), and Vitolo et al. (1995), who reported an
oscillation of invertase activity that was related to the budding cycle of the
yeast.

81
e Feed Patterns
Batch fermentations are not suited to enzyme production. Naudin et al. (1986)
also found batch fermentation to be unsuitable for invertase production. This
is because all the sugar is added at the start of fermentation, before
inoculation. Once inoculated, the yeast will start to hydrolyse the sucrose to
glucose and fructose using the invertase enzyme. Demis et al. (1953)
reported that the rate of conversion of sucrose to glucose and fructose was
300 times faster than the rate of metabolism. This results in an excess of
glucose and fructose in the medium, which could lead to catabolite repression
of the invertase enzyme.
The incrementally fed batch culture method is a more favorable method for
production of invertase by S. cerevisiae strains Y07 and Y09 grown on sugar
cane blackstrap molasses. By using the incremental feeding method in the
fermentation, diauxic metabolism is maintained throughout the fermentation,
i.e. glucose is metabolised first (Dynesen et al., 1998). Other available
sugars are only metabolised after glucose is depleted in the culture. The feed
pattern is such that the glucose is neither depleted, nor in excess, thus
preventing a diauxic shift in metabolism neither and the occurrence of
catabolite repression in the culture.
The proposed feed pattern for the production of invertase by S. cerevisiae
Y07 strain grown on sugarcane blackstrap molasses should result in an
82
alcohol profile as described in Table 9. The fermentation should be a two
stage fermentation with the first 5 hours of fermentation being a batch
fermentation, becoming an incrementally fed batch fermentation from the 6th
hour onwards. The total amount of sugar added to the fermentation at start
should be sufficient to allow the alcohol concentration to peak at a maximum
of 1.00% by the 6th hour of fermentation. Feed rate per hour after the 6th
hour should be controlled so as to achieve a decrease in alcohol from 1.00%
to about 0.50% in the next 10 hours of fermentation up to the 16th hour. The
alcohol concentration should be maintained between 0.40% and 0.50% until
the end of fermentation. By following this alcohol and the subsequent feed
profile,
o the catabolite repression of the invertase enzyme is averted; and
o by ensuring that the culture is not over or under fed, the yeast growth
rate and resultant enzyme concentration is increased.
By following this proposed feed profile, the enzyme yield would be increased
to a level acceptable to the sugar refineries. The yeast manufacturer would
not have to compensate the customer with extra yeast, free of charge, to
offset the low inversion rates. This would increase the profits from the sales
of invertase yeast by at least 30%, thus allowing the yeast manufacturer to
realise the profit margins that are expected.
The above optimised fermentation profile was implemented on the plant scale
at Nep Yeast in May 2000. Since implementation, 11 batches of invertase
yeast were produced of which only 2 batches produced invertase activities of
below 20 %. These batches were produced in January 2001 and February
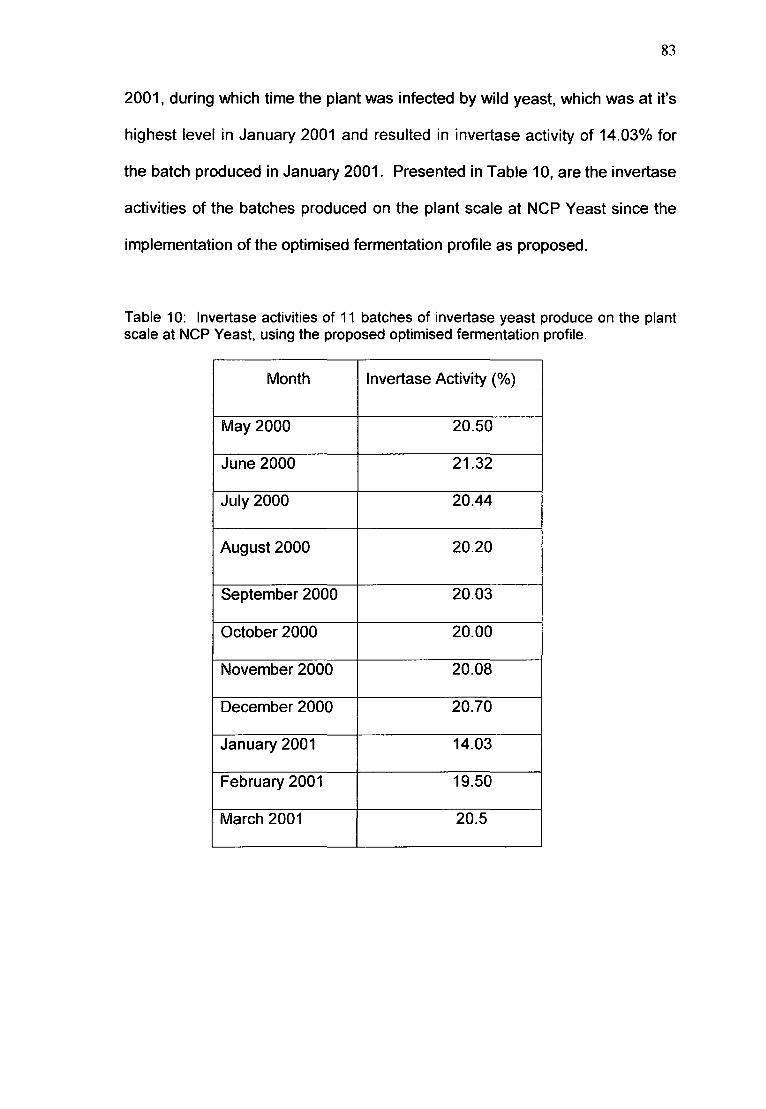
83
2001, during which time the plant was infected by wild yeast, which was at it's
highest level in January 2001 and resulted in invertase activity of 14.03% for
the batch produced in January 2001. Presented in Table 10, are the invertase
activities of the batches produced on the plant scale at Nep Yeast since the
implementation of the optimised fermentation profile as proposed.
Table 10: Invertase activities of 11 batches of invertase yeast produce on the plantscale at Nep Yeast, using the proposed optimised fermentation profile.
Month Invertase Activity (%)
May 2000 20.50
June 2000 21.32
July 2000 20.44
August 2000 20.20
September 2000 20.03
October 2000 20.00
November 2000 20.08
December 2000 20.70
January 2001 14.03
February 2001 19.50
March 2001 20.5
84
• Enzyme Levels
S. cerevisiae strain Y07 was selected for it's natural ability to accumulate high
levels of invertase within the cell, and this is considered more suitable for
enzyme production than the YOgstrain, which is a Baker's Yeast strain. This
is evident by the higher rate of inversion of sucrose that was achieved using
the Y07 strain than with the YOg strain. Both yeast strains yielded a 19-fold
increase in invertase concentration in the fermentation broth between the 14th
and 24th hours of fermentation. This rapid increase in extracellular enzyme
concentration may be attributed to fact that at this period of fermentation the
bioreactor was in a state of maximum feed and growth rate. With an increase
in biomass in the bioreactor, there would be an increased demand for glucose
hence more enzymes would be released into the medium in order to meet the
nutritional requirements of the culture.
5.0 RECOMMENDAT~ONSAND IPOTENTIAllUlSES
Harvesting invertase from the broth presents a financially rewarding
opportunity to add extra value to the effluent of yeast biomass fermentation,
which otherwise is very expensive to dispose. The cost of disposal of the
effluent from a yeast plant forms a large part of the cost of production. The
extraction of the enzymes from the broth will help in offsetting the cost of
disposal of the effluent. Currently research is being done to determine the
feasibility and hence the viability of the process of harvesting the enzymes
from the broth. Results obtained thus far show that by applying the new

85
technologies that have been developed in the field of adsorption
chromatography, the enzyme can be extracted from the broth and purified in a
one step process. Future research will be concentrated on adapting the
adsorption chromatography technology available to suit the process of
extracting invertase from the sugar cane blackstrap molasses broth of S.
cerevisiae fermentations.
86
UST OF REFERENCES
AlI"I11Io~d,W. NI. 1969. Heat inactivation kinetics of yeast p-fructofuranosidase.
A polydisperse system. Biochimica et Biophysica acta 178: 347 - 353.
Bokossa, tIP., Krastanov, A. L, Rochkova, Z. and AlI'llge~ov, A. 1993.
Biosynthesis of invertase by Saccharomyces cerevisiae with sugarcane
molasses as substrate. World Journal of Microbiology and Biotechnology 9:
662 - 663.
IBIUI~~,A. T. amll IBlUIshe~~,M. IE. 1976. Environmental of fungal growth, pp 1 -
31. ~1I'll: Smith, J. E., and Berry, D. R. (eds.) The Filamentous Fungi, Volume
2. J. Wiley, New York.
Chari!, E., Cheri!, C. S., GOll'llg, C. S. and Chell'll, L. IF. 1991. Production,
separation and purification of yeast invertase as a by-product of continuous
ethanol fermentation. Applied Microbiology and Biotechnology 36: 44 - 47.
Cimpl1'Dch, P., S~alvik, J. ami Kotyk, A. 1995. Distribution of individual
cytoplasmic pH values in a population of the yeast Saccharomyces
cerevisiae. FEMS Microbiology Letters 130: 245 - 252.

87
De Medeiros, M. B. and de Carvalho, P. M. B. 1999. Invertase production
is related to the nitrogen source in Hansenula anomala. Applied Biochemistry
and Biotechno/ogy71 (9): 181 -189.
Demis, D. J., Rothstein, A. and! Meier, R. 1953. The relation of the cell
surface to metabolism. The location and function of invertase in the yeast cell.
Archives of Biochemistry and Biophysics 48: 55 - 61.
ClUJI?~essis, J. Operations Director, NCP Yeast (PTV) Ltd., Durban. Personal
communication. June 1999.
Il)IUJPlessis, J. A. 1991. Basics of Yeast Manufacturing. Proceedings of
NCP Technical Conference, Brandwag Hotel, Golden Gate, Free State. 26-
42
Il)ynesen, J., Smits, H.P., Olsson, lo and Nielsen, J. 1998. Carbon
catabolite repression of invertase during batch cultivations of Saccharomyces
cerevisiae: the role of glucose, fructose, and mannose. Applied Microbiology
and Biochemistry SID: 579 - 582.
Fleet, G.H. 1991. Cell Walls, pp 199 - 277. ill: Rose, AH., and Harrison,
J.S. (Eds.) The Yeasts ,Yeast Organelles, 2nd ed .. Academic Press, London.
88
GaSCOD1l,S., NelJlmall'1ID1l,IE.ami! Lampen, J. O. 1968. Comparative study of
the properties of purified internal and external invertase from yeast. Journal
of Biological Chemistry 243: 1573 - 1577.
Henrissat, lB. and Bairoch, A. 1996. Updating the sequence based
classification of glycosyl hydrolases. Journal of Biochemistry 316: 695 - 696
Hohmann, S. and Zimmerman, f. K. 1986. Cloning and expression on a
multicopy vector of five invertase genes of Saccharomyces cerevisiae.
Current Genetics 2: 217 - 225.
HlUlbbard, IE. J., Joall'1lg,R. and Carlsoll'1l, M. 1994. Dosage-dependant
modulation of glucose repression by MSN3 (STD 1) in Saccharomyces
cerevisiae. Molecular and Cell Biology 14: 1972 - 1978.
Hudstedt, H., Bijll'1ltemeyer, K., Kroner, K. H., Bomer, B. 1993. Process for
obtaining invertase from yeast. United States Patent, No. 5256556.
Assigned to Gesellschaft fur Biotechnologische Forschung GmbH (GBF),
Braunschweig, Federal Republic of Germany.
lmrlth, 11\9. Chemical Engineer, Hullets Sugar Refineries, Durban. Personal
communication. August 1999.
89
JohlT1lstOIT1l,M. 1999. Summary of mechanisms responsible for glucose
repression and glucose induction. [on line]. Available from:
www.mips.biochem.mpg.de/proj/yeasUpathways/glucose repression. html
[accessed 3 December 1999].
IKlI"asbmov, A., Bokossa, I. alT1ldRochkova, Z. L 1995. Invertase
biosynthesis by Saccharomyces cerevisiae using cane molasses.
Biotechnology and Biotechnology Eq. 9: 60 - 65.
Lupashin, V.V., Hamamoto, S. and SchelkmalT1l,R. 1996. Biochemical
requirements for the targeting and fusion of ER-derived transport vesicles with
purified yeast Golgi membranes. Journal of Cell Biology 132: 277 - 289.
Maharaj, A.D. ane lNIaodoo,INl. 1993. Comparison of the molasses quality in
the Sugar Belt of Natal. Proceedings of NCP Yeast Technical Conference,
Fanies Island, Kwa -Zulu Natal. 72-86
McCready, M. IK. 1992. Yeast in baking. Proceedings of Nep Technical
Conference, Fanies Island, Kwa-Zulu Natal. 21-30
NalUldolT1l,0., Boudarez, M. J. and Ramirez, A. 1986. Measurement of yeast
invertase during alcohol fermentation. Biotechnology Letters 8: 591 - 592.
90
NCP Yeast Laboratory Method lNo. 2.2.1, Fehlings Method for the
Determination of Total Reducing Sugars in Molasses Wort, NCP Yeast
Laboratory Manual.
Nep Yeast Laboratory Method No. 2.1.1, Combined Method For Nitrogen
and Phosphate Determination by Kjeldahl Distillation, NCP Yeast Laboratory
Manual.
Patkar, A. all1ldlSeo, J. IHI. 1992. Fermentation kinetics of recombinant yeast
in batch and fed batch cultures. Biotechnology and Bioengineering 40: 103-
109.
Pfeffer, S. IR. and Rothman, J. E. 1987. Biosynthetic protein transport and
sorting by the endoplasmic reticulum and golgi. Annual Review of
Biochemistry 56: 829 - 852.
IPlI'lfell', INI.K., WlUlestelhtlUIbe, l.J. and Sclhtelkmall1l, R. 1992. Vesicle-
mediated protein sorting. Annual Review of Biochemistry 61: 471 - 516.
PyIUlIl1l, Y. R. 1999. Effects of oxygen on invertase expression in continuous
culture of recombinant Saccharomyces cerevisiae containing the SUC 2
gene. Applied Microbiology and Biotechnology 51: 334 - 339.
lReed, G. and Nagodawithana, T.W. 1991. Yeast Technology, 2nd Ed. Van
Nostrand Reinhold, New York.
91
Rose, A. IHI. 1987. Responses to the chemical environment, pp. 5 - 37. ln:
Rose, A.H. and Harrison J.S. (Eds.) The Yeasts, Volume 2: The Yeasts and
the Environment. Academic Press, London.
Rouwenhorst, IR. J., Valin dell" Baan, A. A., SchleffelrS, A. W. and Vall'll
IOnjlkeU1l, J. lP. 1991. Production and localization of j3-fructofuranosidase in
asynchronous and synchronous chemostat cultures of yeast. Applied and
Environmental Microbiology 57: 557 - 562.
Sa~ama, N.R. and Schekman, IR. 1995. The role of coat proteins in the
biosynthesis of secretory proteins. Current Opinion in Cell Biology 7: 536-
543.
Sojn, C. INl. Production Manager, Hullets Sugar Refineries, Durban. Personal
communication. August 1999.
SlUIttOU1l, D. 10.amil Lampen, J. O. 1961. Localisation of sucrose and maltose
fermenting systems in Saccharomyces cerevisiae. Biochimica et Biophysica
acta 56: 303 - 312.
Toda, IK., Yabe, I. and Yamagata, T. 1982. Invertase and phosphatase of
yeast in a phosphate limited continuous culture. European Journal of Applied
Microbiology and Biotechnology 16: 17 - 22.
92
Trumbly, R. J. 1992. Glucose repression in the yeast Saccharomyces
cerevisiae. Molecular Microbiology 6: 15 - 21.
Underkofler, l. A. and Hockey, R. J. 1954. Industrial Fermentations, Vol. 2.
Chemical Publishing Co., New York.
Vall1l Aswegall1l, J. Technical Director, Enzyme SA, Sandton. Personal
communication, February 1999.
Van IDer WestlhllUlosell1l, A. 1991. Yeast Physiology. Paper read at NCP
Technical Conference, Brandwag Hotel, Golden Gate, Free State. 102-116
Vall1l IDeIT'WestlhllUlosell1l, A. and Spellt, J. 1994. NCP R&D Report Number
P94/007/F. Method for assaying invertase activity of Saccharomyces
cerevisiae. NCP Yeast Laboratory Manual.
VisseIT', W., Vall1l Spoll1lseB1l, IE. A., Nalll1lUll1lga, IN., Pronk, J.T., Kuenen, J. G.
and VaD1l Dijken, J. P. 1995. Effects of growth conditions on mitochondrial
morphology in Saccharomyces cerevisiae. Antonie van Leeuwenhoek 67:
243 - 253.
Vitolo, M., Duranti. M. A. and Pelleqrim, M. B. 1995. Effect of pH, aeration,
and sucrose feeding on the invertase activity of intact Saccharomyces
cerevisiae cells grown on sugarcane black - strap molasses. Journal of
Industrial Microbiology 15: 75 - 79.
93
Walker, G.M. 1997. Yeast Physiology, pp. 22 - 28. In: Walker, G.M. (Ed.)
Yeast Physiology and Biotechnology. John Wiley and Sons Ltd., England.
Wlhlote,J. 1954. Yeast Technology, pp. 124 - 132. Chapman and Hall Ltd.,
London.
ZOlT1lser,IE.émd Daum, G. 1995. Isolation and biochemical characterization of
organelles from the yeast Saccharomyces cerevisiae. Yeast 2: 493 - 536.
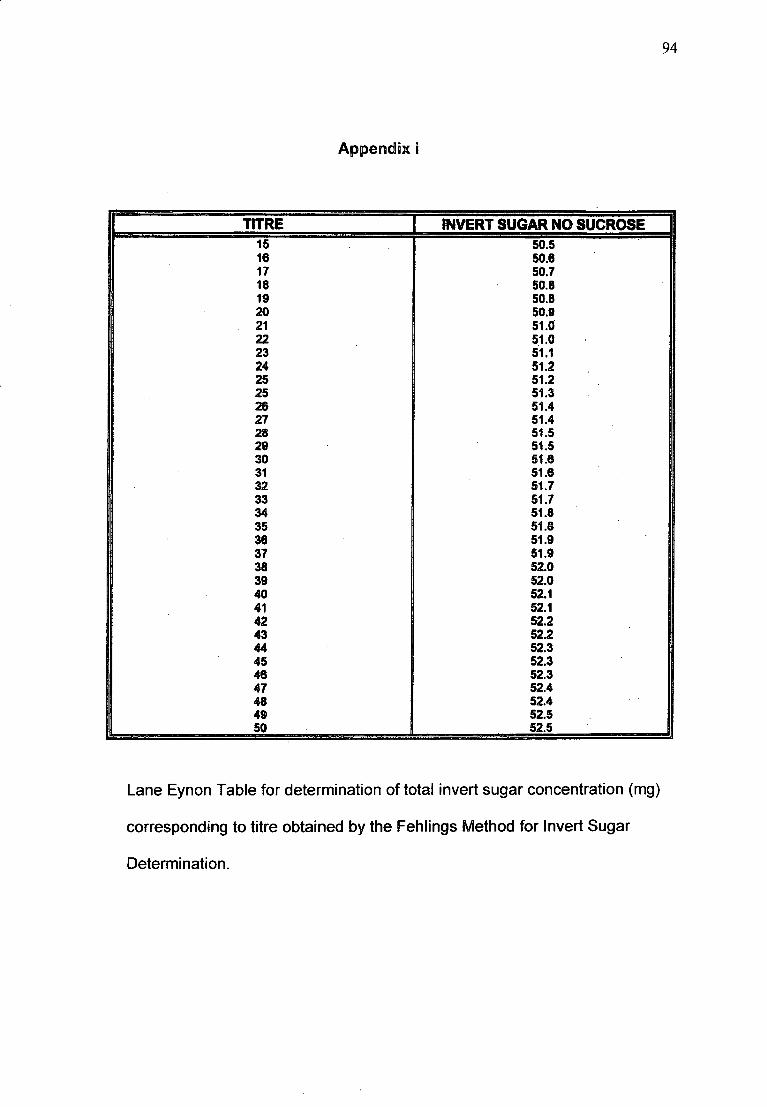
94
Appendix 0
TITRE INVERT SUGAR NO SUCROSE15 50.516 50.617 50.718 50.819 50.820 50.921 51.022 5.1.023 51.124 51.225 51.225 51.326 51.427 51.428 51.529 51.530 51.831 51.832 51.733 51.734 51.835 51.S36 51.937 51.938 52.039 52.040 52.141 52.142 52.243 52.244 52.345 52.348 52.347 52.448 52.449 52.550 62.5
Lane Eynon Table for determination of total invert sugar concentration (mg)
corresponding to titre obtained by the Fehlings Method for Invert Sugar
Determi nation.
,""
95
Appendix ii
Reagents for Alcohlo~ Determination
Acidic Ammonium Ferrous Sulphate
92 9 of ammonium ferrous sulphate 6-hydrate «NH4)2S04.FeS04.6H20), was
dissolved in about 800 ml distilled water, 10 ml concentrated sulphuric acid
was added and the solution was diluted to 1 litre.
Acidic Potassium Di-Chromate
42.608 9 of potassium di-chromate (K2Cr207) was dissolved in 800 ml distilled
water and diluted to 1 liter. To 20 ml of the K2Cr207 solution, 10 ml of sulphuric
acid was added and this solution was used to collect the distillate.
Phenylanthranilic acid indicate
1.07 9 n-phenylantharanilic acid was dissolved in 20 ml of 5% sodium
carbonate and diluted to 1 litre. 1 ml of indicator was added to the sample
before titration.