Inversion Oxygenation and Bio augmentation Reduces...
27
Inversion Oxygenation and Bio augmentation Reduces Invasive Eurasian Watermilfoil Growth in Four Michigan Inland Lakes Jennifer L. Jermalowicz-Jones Restorative Lake Sciences © Restorative Lake Sciences
Transcript of Inversion Oxygenation and Bio augmentation Reduces...
Inversion Oxygenation and Bio augmentation Reduces Invasive Eurasian Watermilfoil Growth in
Four Michigan Inland Lakes
Jennifer L. Jermalowicz-JonesRestorative Lake Sciences
© Restorative Lake Sciences


Austin Lake, Kalamazoo County, MI
• Lake Volume = 4,408 acre-feet• Mean Depth = 4.0 feet• Max Depth = 14.0 feet• Mean Annual Runoff = 330
acre-feet• Mean Annual Pfizer Outputs =
350 acre-feet• Mean Annual Inlet Inputs =
724 acre-feet• Mean Annual Precip = 3,191
acre-feet• Mean Evaporative Losses =
2,600 acre-feet

Austin Lake South Basin System
• 27 micro-porous ceramic diffusers from Clean-Flo, Inc.®; Installed by Lake-Savers, Inc.
• 28,500 feet of self-sinking airline• Bacteria and enzyme treatments
which consist of 50 gallons of Lake Clear® bacteria for nitrogen reduction, 200 gallons of Clean and Clear ®Enzyme as a catalyst for muck reduction, and 200 lbs of Clean-Flo® bacteria for muck reduction.
• On-land components consist of 3 locally-sourced sheds (Lake-Savers®) and 5.4HP compressors along with cooling fans and ventilation.


16.5
5.9
3.9
00
2
4
6
8
10
12
14
16
18
July 2012 (Pre-Aeration)
July 2013 (Post-Aeration)
July 2014 (Post-Aeration)
July 2015 (Post-Aeration)
Perc
enta
ge o
f tot
al (n
=98)
sam
plin
g si
tes
Time
Austin Lake South Basin EWM Changes due to Aeration + Bio augmentation
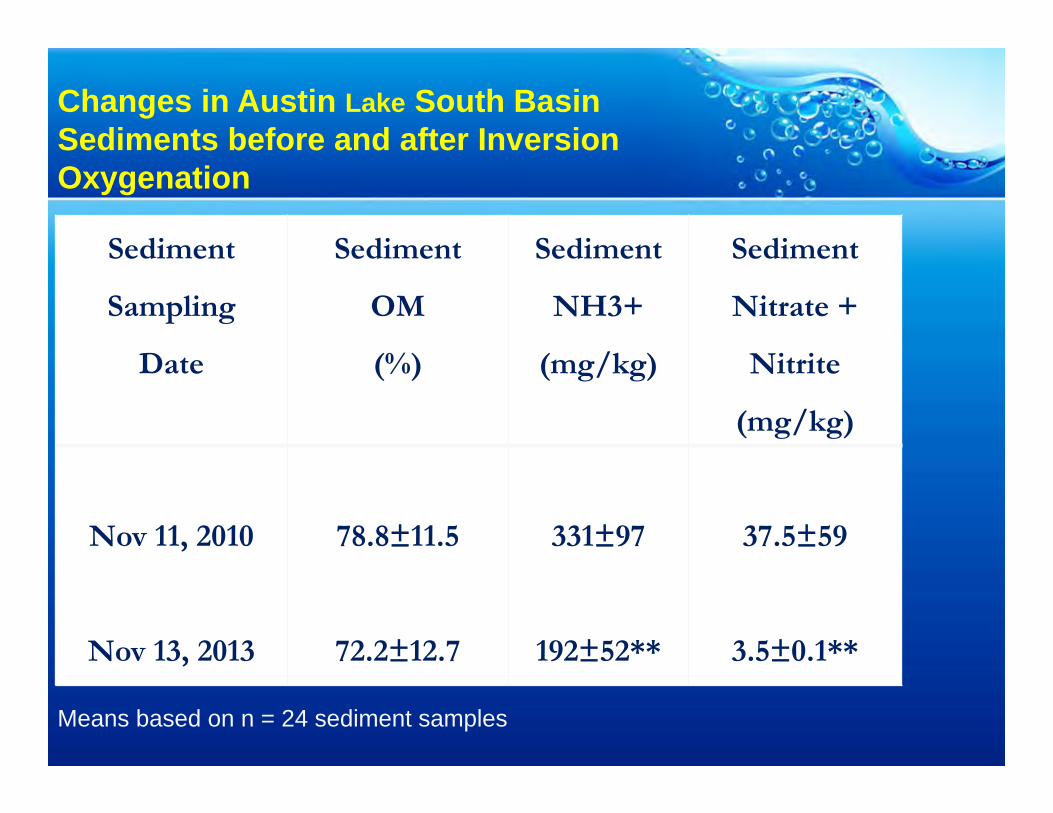
Changes in Austin Lake South Basin Sediments before and after Inversion Oxygenation
Sediment
Sampling
Date
Sediment
OM
(%)
Sediment
NH3+
(mg/kg)
Sediment
Nitrate +
Nitrite
(mg/kg)
Nov 11, 2010
Nov 13, 2013
78.8±11.5
72.2±12.7
331±97
192±52**
37.5±59
3.5±0.1**
Means based on n = 24 sediment samples
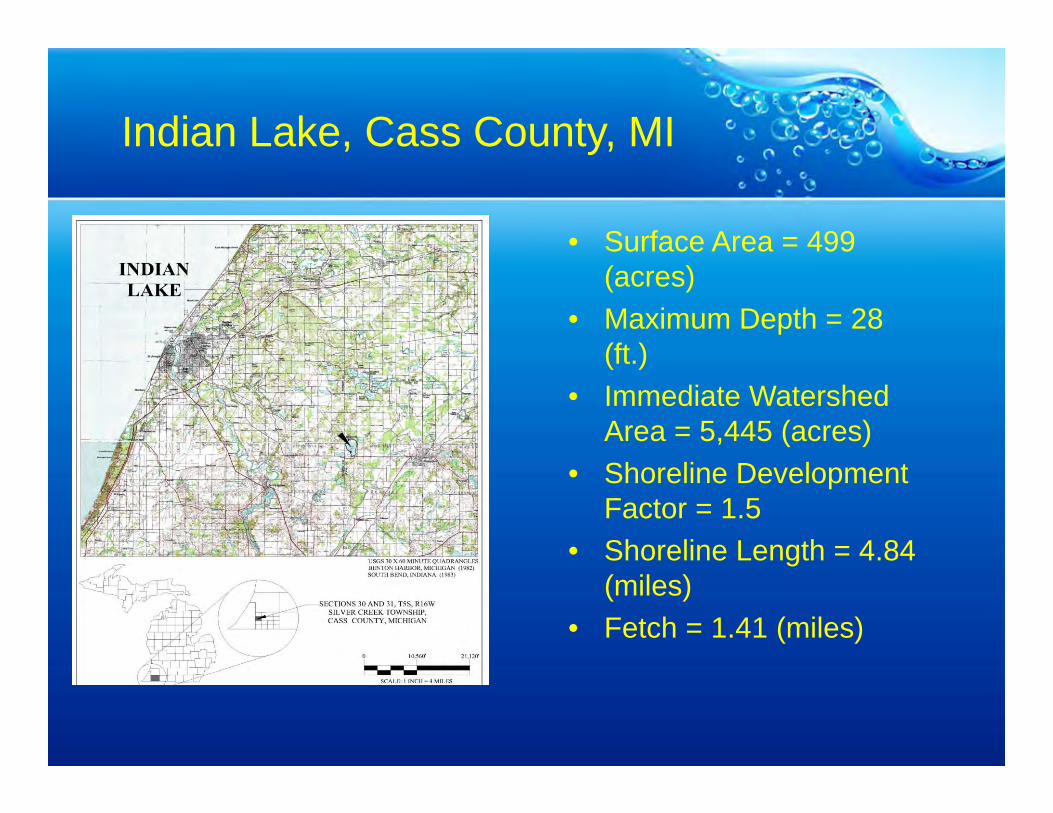
Indian Lake, Cass County, MI
• Surface Area = 499 (acres)
• Maximum Depth = 28 (ft.)
• Immediate Watershed Area = 5,445 (acres)
• Shoreline Development Factor = 1.5
• Shoreline Length = 4.84 (miles)
• Fetch = 1.41 (miles)


87 85
2 10
10
20
30
40
50
60
70
80
90
100
June 2012 (Pre‐Aeration)
June 2013 (Post‐Aeration)
May 2014 (Post‐Aeration)
August 2015 (Post‐Aeration)
Freq
uency of sam
pling sites o
ut of 2
38
Time
Indian Lake EWM Changes due to Aeration + Bio augmentation
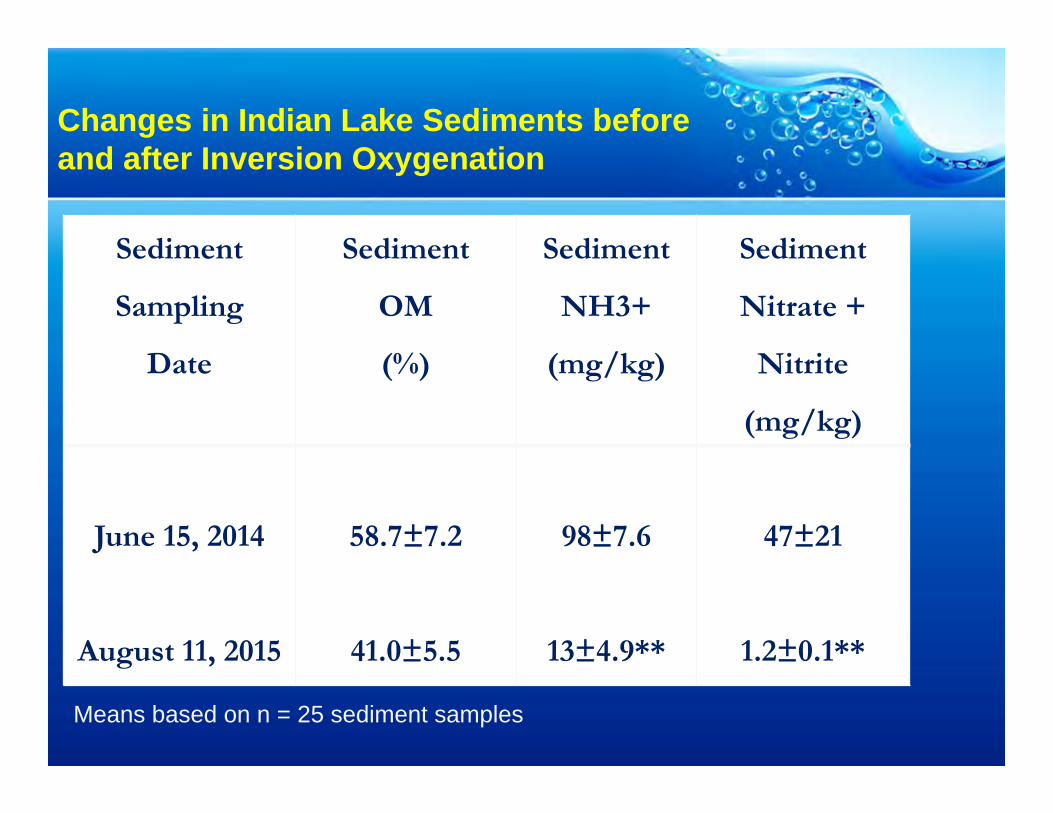
Changes in Indian Lake Sediments before and after Inversion Oxygenation
Sediment
Sampling
Date
Sediment
OM
(%)
Sediment
NH3+
(mg/kg)
Sediment
Nitrate +
Nitrite
(mg/kg)
June 15, 2014
August 11, 2015
58.7±7.2
41.0±5.5
98±7.6
13±4.9**
47±21
1.2±0.1**
Means based on n = 25 sediment samples

Indian Lake Bottom Hardness Changes
May 2014 (Pre-aeration) August 2015 (Post-aeration)
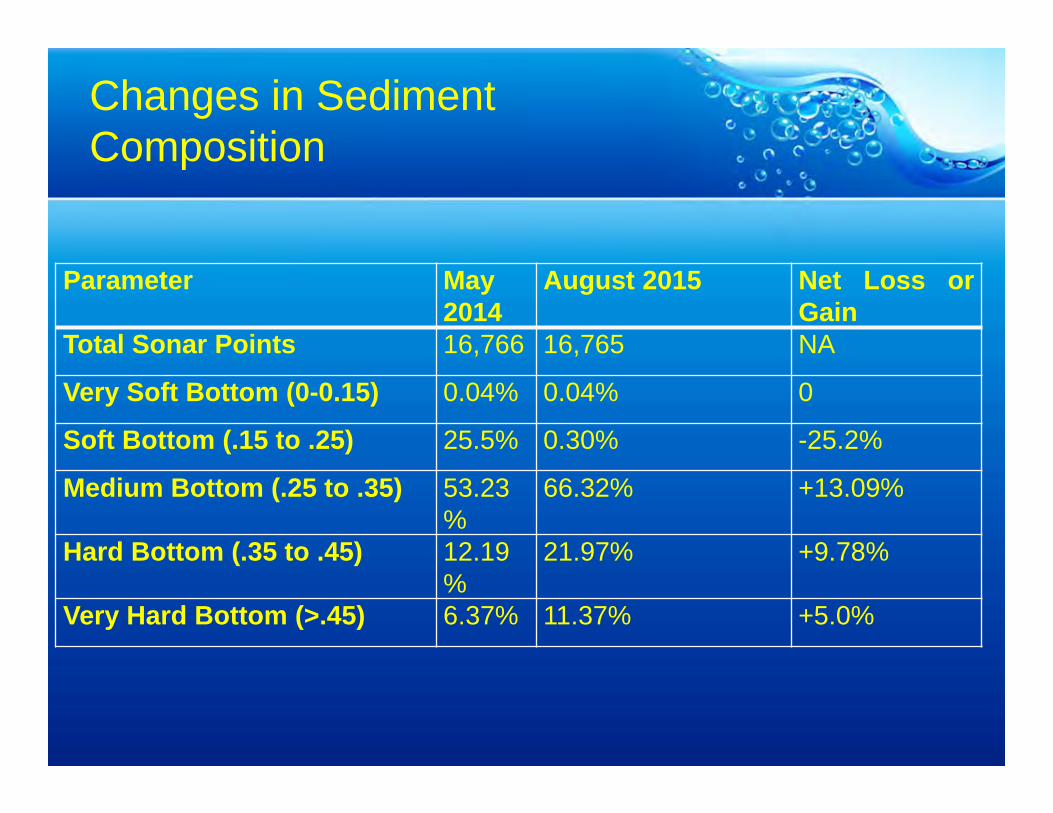
Parameter May2014
August 2015 Net Loss orGain
Total Sonar Points 16,766 16,765 NA
Very Soft Bottom (0-0.15) 0.04% 0.04% 0
Soft Bottom (.15 to .25) 25.5% 0.30% -25.2%
Medium Bottom (.25 to .35) 53.23%
66.32% +13.09%
Hard Bottom (.35 to .45) 12.19%
21.97% +9.78%
Very Hard Bottom (>.45) 6.37% 11.37% +5.0%
Changes in Sediment Composition

Paradise Lake, Emmet & Cheboygan Counties, MI
• Surface Area = 1,878 acre (acres); West Basin = 400 acres
• Maximum Depth = 15.1 (ft.)
• Shoreline Length = 14.3 (miles)
• Watershed: Lake = 8.9:1• One inlet and one outlet
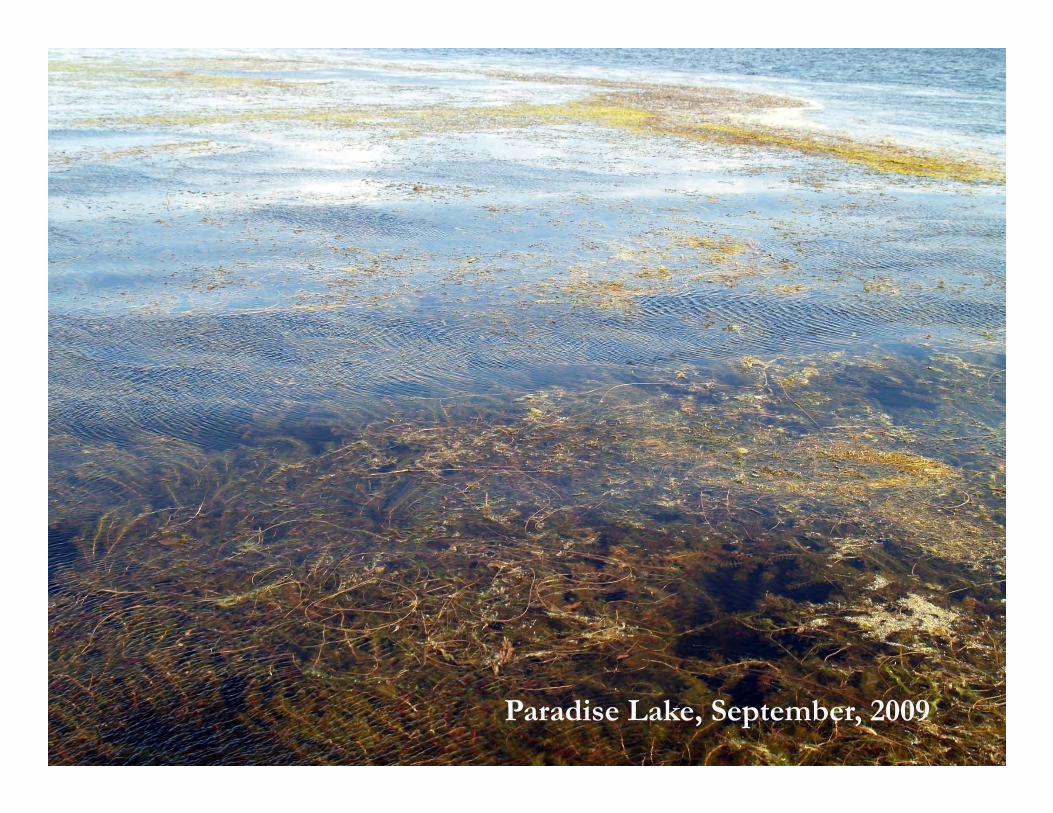
Paradise Lake, September, 2009
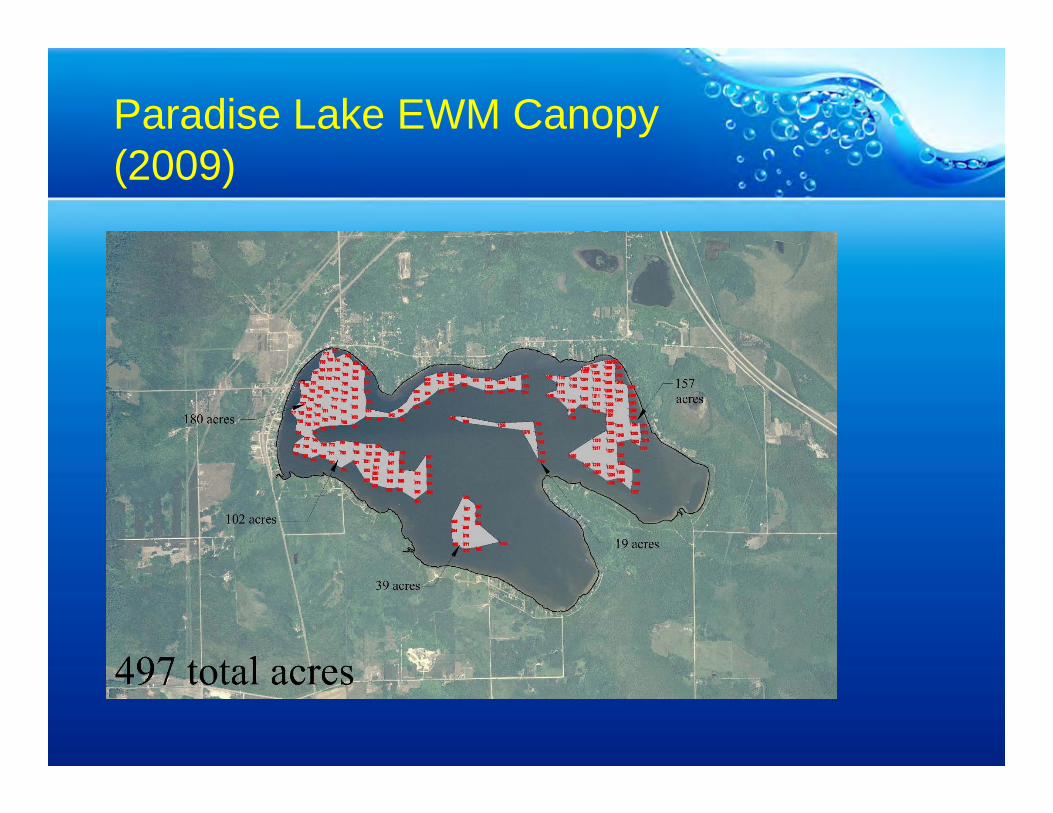
Paradise Lake EWM Canopy (2009)
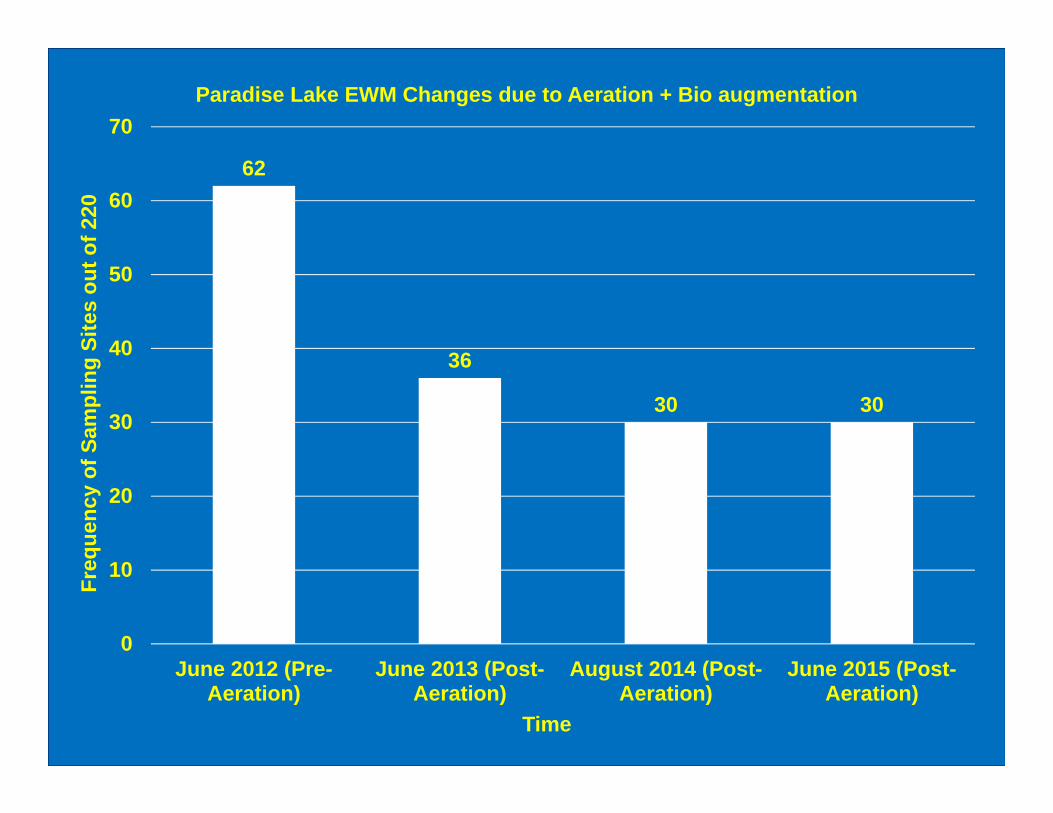
62
36
30 30
0
10
20
30
40
50
60
70
June 2012 (Pre-Aeration)
June 2013 (Post-Aeration)
August 2014 (Post-Aeration)
June 2015 (Post-Aeration)
Freq
uenc
y of
Sam
plin
g Si
tes
out o
f 220
Time
Paradise Lake EWM Changes due to Aeration + Bio augmentation

Changes in Paradise Lake Sediments before and after Inversion Oxygenation
Sediment
Sampling
Date
Sediment
OM
(%)
Sediment
NH3+
(mg/kg)
Sediment
Nitrate +
Nitrite
(mg/kg)
August 10, 2012
June 30, 2015
62.7±13.9
32.8±8.9
119±24.9
6.3±8.8**
29±12
2.7±0.9**
Means based on n = 12 sediment samples

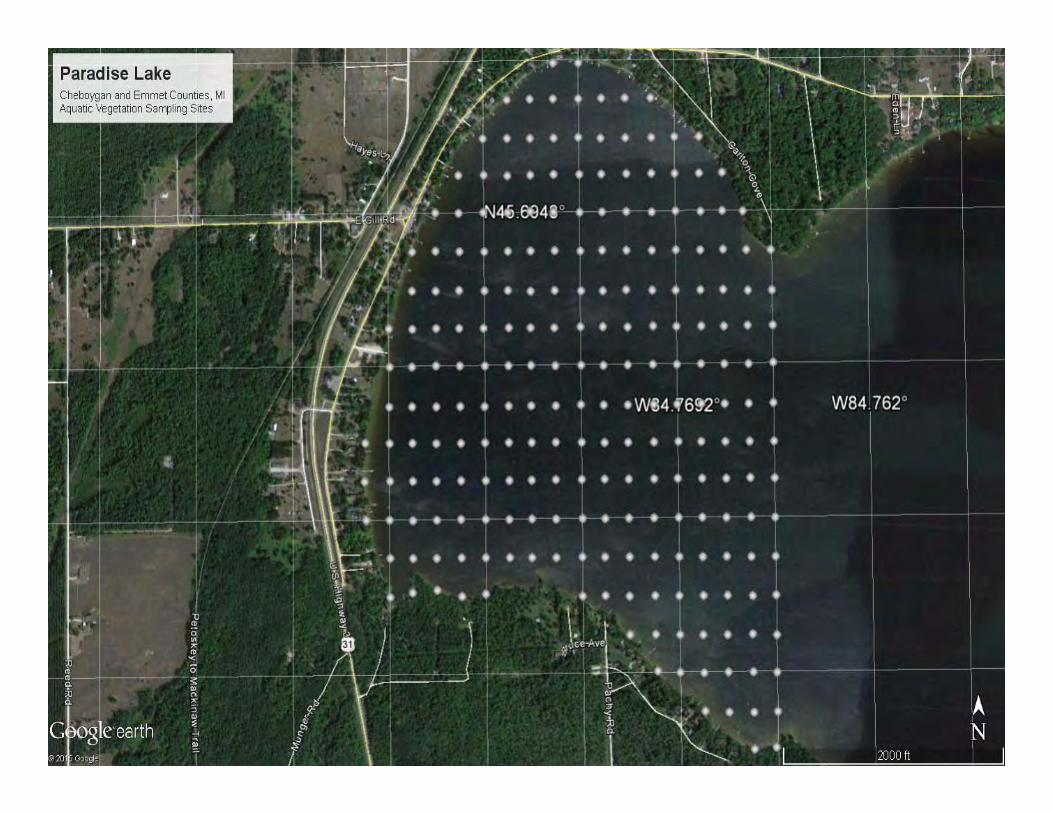
Paradise Lake EWM Polygons
August 2014 (Post-aeration) June 2015 (Post-aeration)

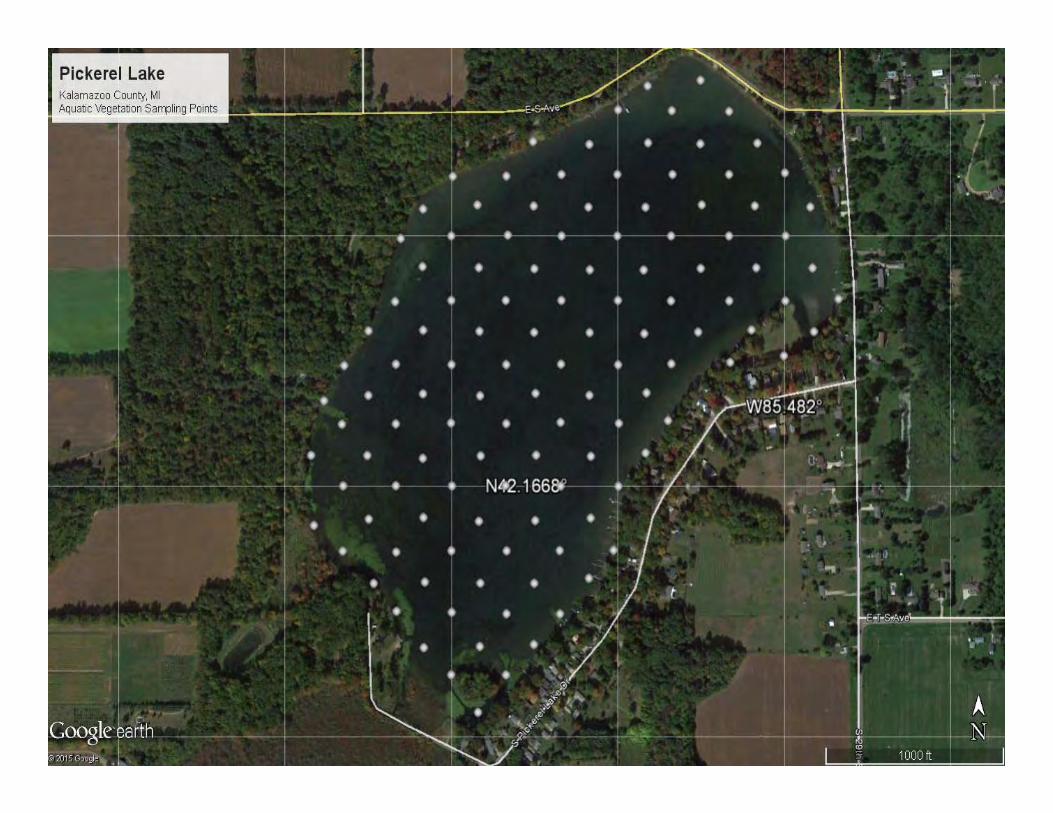
Pickerel Lake, Kalamazoo County, MI
• Surface Area = 135 (acres)
• Maximum Depth = 10 (ft.)
• Shoreline Length = 2.44 (miles)
• Fetch = 0.7 (miles)
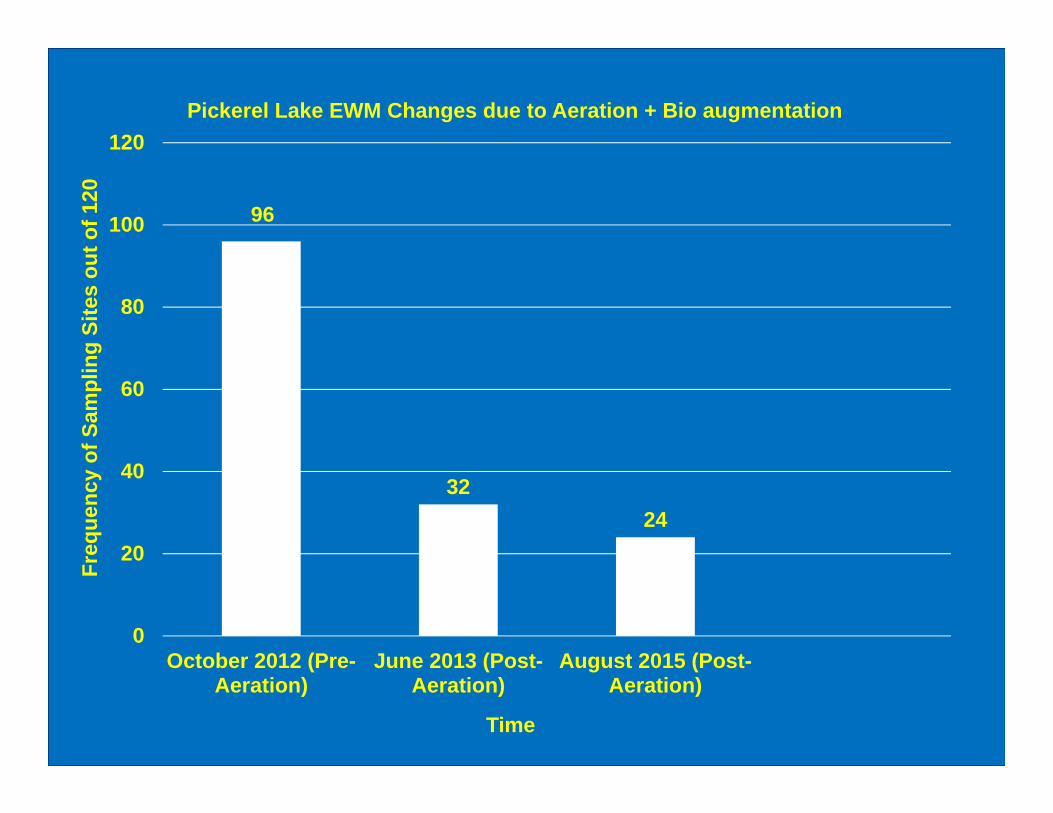
96
3224
0
20
40
60
80
100
120
October 2012 (Pre-Aeration)
June 2013 (Post-Aeration)
August 2015 (Post-Aeration)
Freq
uenc
y of
Sam
plin
g Si
tes
out o
f 120
Time
Pickerel Lake EWM Changes due to Aeration + Bio augmentation

Pickerel Lake Aquatic Vegetation Biovolume Changes
July 2014 (Pre-aeration) August 2015 (Post-aeration)
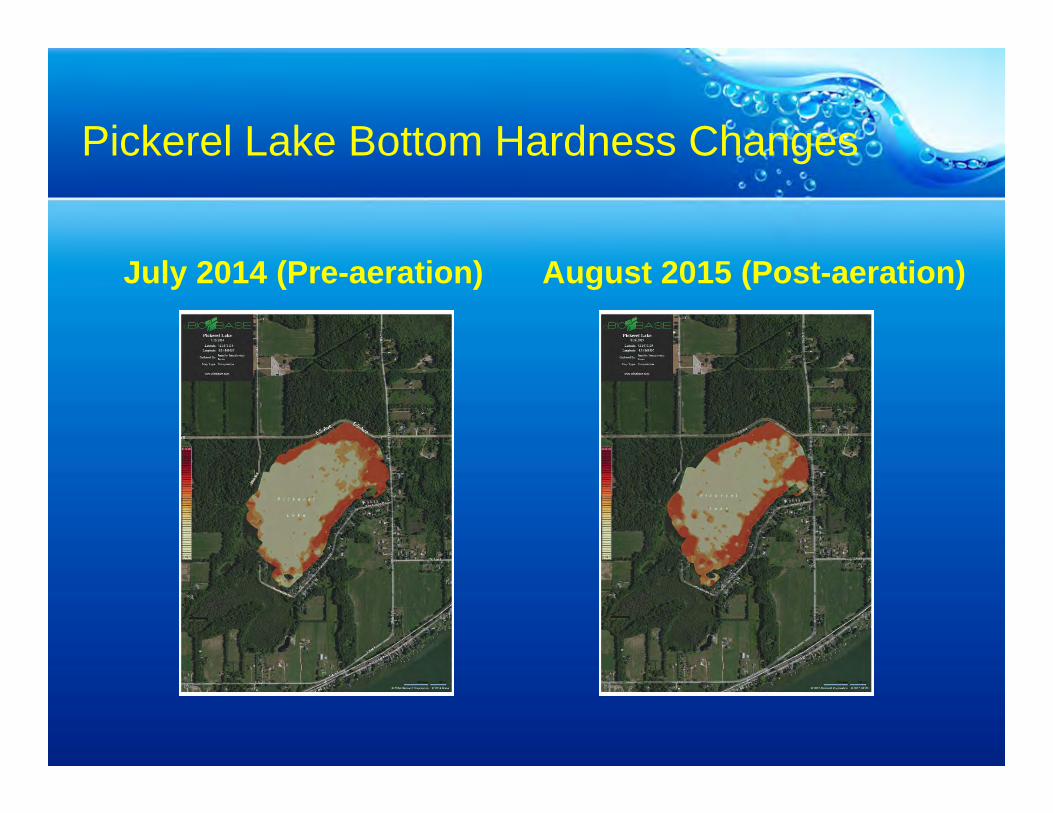
Pickerel Lake Bottom Hardness Changes
July 2014 (Pre-aeration) August 2015 (Post-aeration)
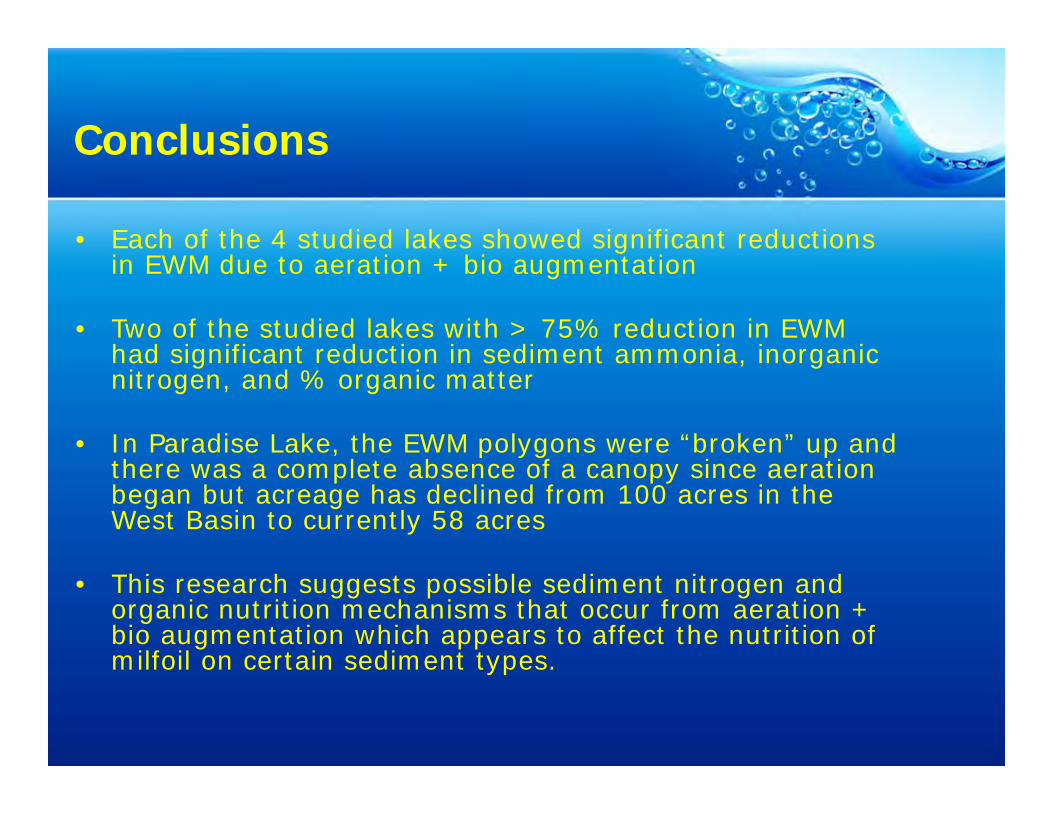
Conclusions
• Each of the 4 studied lakes showed significant reductions in EWM due to aeration + bio augmentation
• Two of the studied lakes with > 75% reduction in EWM had significant reduction in sediment ammonia, inorganic nitrogen, and % organic matter
• In Paradise Lake, the EWM polygons were “broken” up and there was a complete absence of a canopy since aeration began but acreage has declined from 100 acres in the West Basin to currently 58 acres
• This research suggests possible sediment nitrogen and organic nutrition mechanisms that occur from aeration + bio augmentation which appears to affect the nutrition of milfoil on certain sediment types.

Acknowledgements
• Paradise Lake Improvement Board• Austin Lake Governmental Lake Board• Indian Lake Improvement Association• Pickerel Lake Association• Clean-Flo, International, Inc.• Lake-Savers, Inc.• Nicholas Gressick• Grant Jones• Kevin Sylvester• Dr. Jon Bartholic, Michigan State University