Poro-elastic Materials and the Control of Low Frequency Sound

Purdue UniversityPurdue e-Pubs
Publications of the Ray W. Herrick Laboratories School of Mechanical Engineering
10-29-2009
Inverse Characterization of Poro-Elastic MaterialsBased on Acoustical Input DataJ Stuart BoltonPurdue University, [email protected]
Kwanwoo Hong
Follow this and additional works at: http://docs.lib.purdue.edu/herrick
This document has been made available through Purdue e-Pubs, a service of the Purdue University Libraries. Please contact [email protected] foradditional information.
Bolton, J Stuart and Hong, Kwanwoo, "Inverse Characterization of Poro-Elastic Materials Based on Acoustical Input Data" (2009).Publications of the Ray W. Herrick Laboratories. Paper 30.http://docs.lib.purdue.edu/herrick/30
Inverse Characterization of Poro Elastic Materials based on
Acoustical Input Data
J. Stuart Bolton and Kwanwoo HongRay W. Herrick Laboratories
School of Mechanical EngineeringPurdue University
ASA San Antonio – 29 October 2009ASA San Antonio – 29 October 2009
1

Introduction
Brief history of standing wave tube Brief history of standing wave tube
Four microphone standing wave tube Four-microphone standing wave tube
E ti ti f Bi t t b d ti l Estimation of Biot parameters based on acoustical measurements
2

3
4

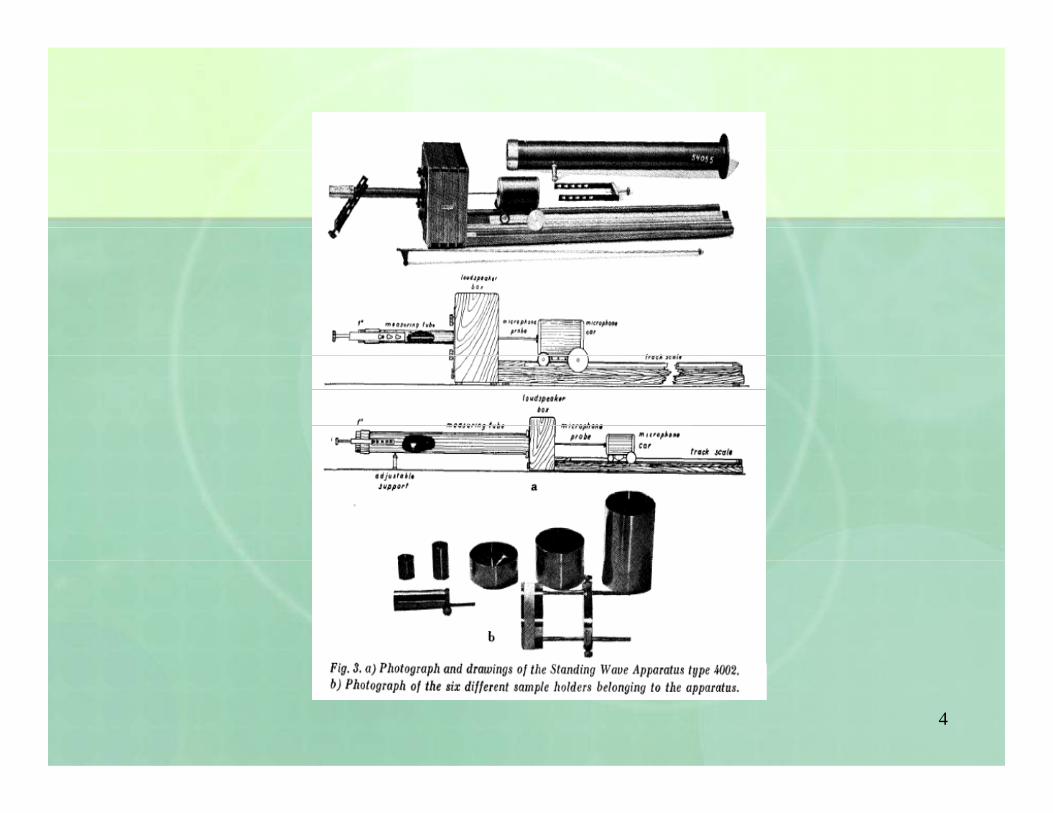
Standing Wave Tubeg
Standing wave method for measuring normal Standing wave method for measuring normal incidence absorption coefficients more than 100 years oldy
Method is credited by a number of authors to J Method is credited by a number of authors to J. Tuma (1902)
Subsequent experiments conducted by Weisbach (1910) and Taylor (1913)
5
( ) y ( )

6PHYSICAL REVIEW, 2(4): 270-287 OCT 1913
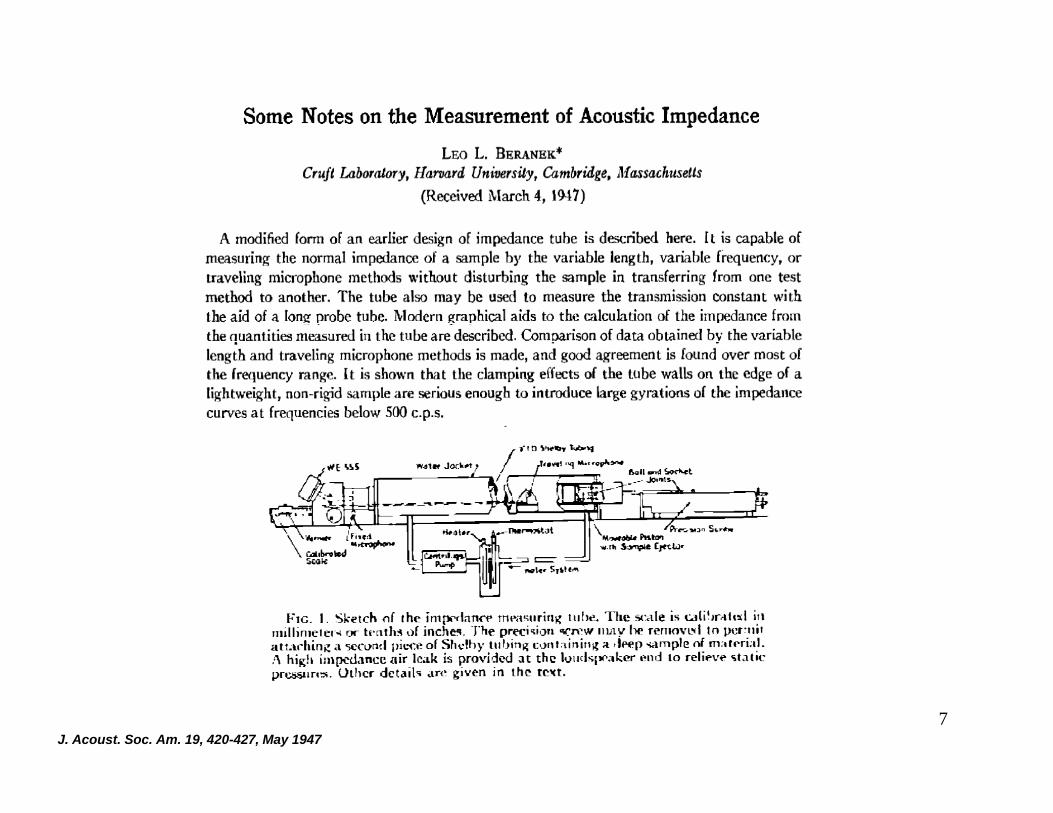
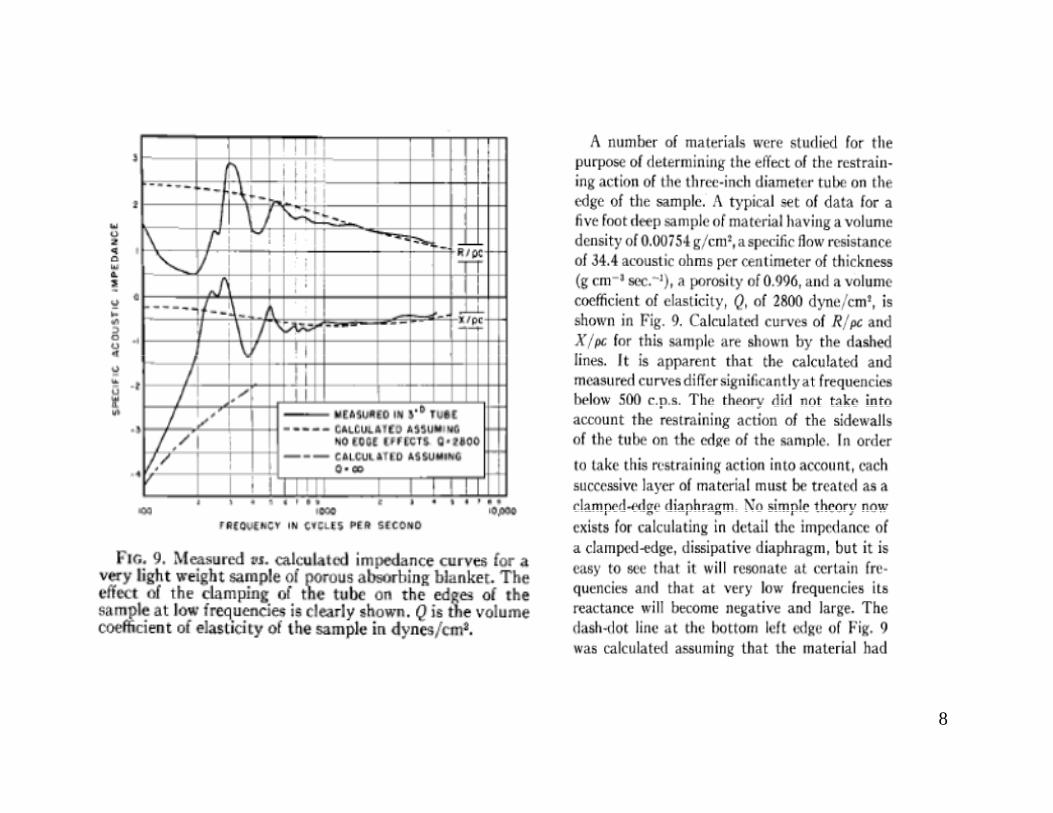
7J. Acoust. Soc. Am. 19, 420-427, May 1947
8

9
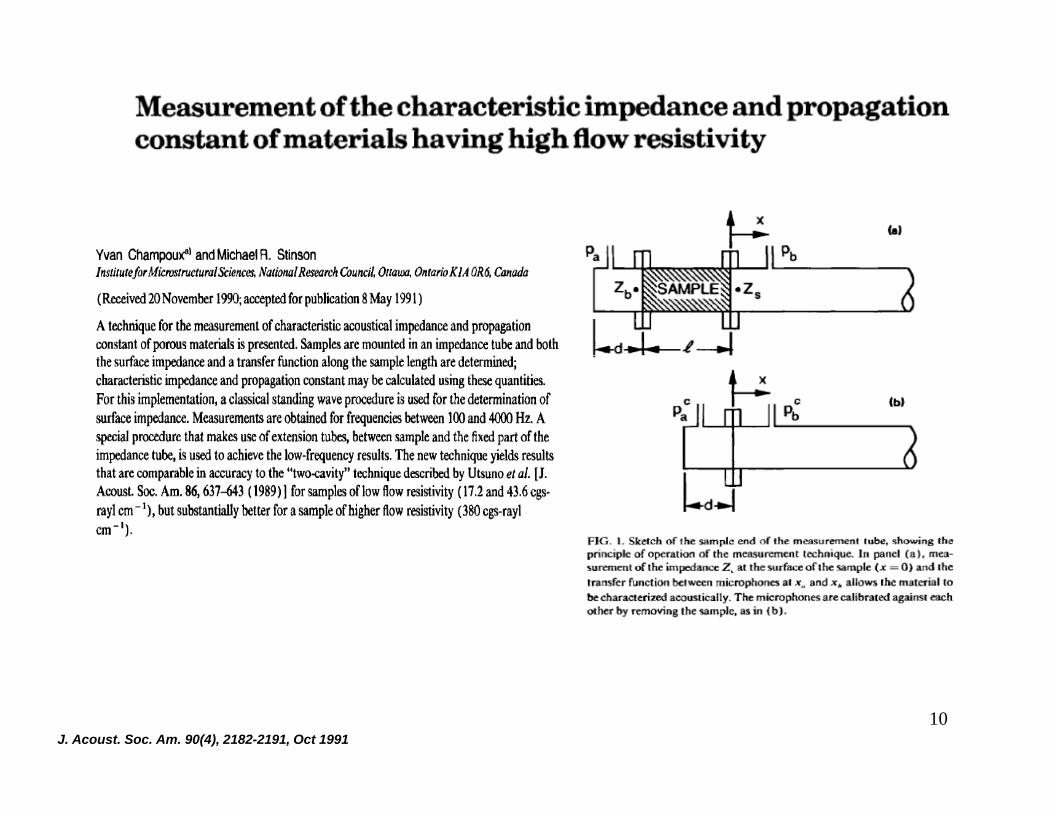
10J. Acoust. Soc. Am. 90(4), 2182-2191, Oct 1991

Four Microphone Methodp
Four-microphone tube for silencer testing Munjal (Duct Acoustics) Two-load method Two-source method
Four-microphone tube for material testing Four microphone tube for material testing Suggested by Joseph Pope Yun and Bolton (1997 SAE) Song and Bolton (2000 JASA) introduce transfer matrix approach Song and Bolton (2000 JASA) introduce transfer matrix approach Many articles since then
11

Transfer Matrix Method
Mic 1 Mic 4Mic 3Mic 2 tjjkxjkx eDeCeP )( 333 tjjkxjkx eBeAeP )( 11
1
AB
CD
Speaker d
tjjkxjkx eDeCeP )( 444
)(sin2)(
21
2112
xxkePePjA
jkxjkx
)(sin2)(
43
4334
xxkePePjC
jkxjkx
tjjkxjkx eBeAeP )( 222
Anechoic x3x2
x4x1
x
)(s 21 xxk
)(sin2)(
21
1221
xxkePePjB
jkxjkx
3
)(sin2)(
43
3443
xxkePePjD
jkxjkx
0011
xxdxdx
VPVPVPVP
T22
012
dxx
VPVPPP
T
termination (not required)
Sound pressuredxx V
PTTTT
VP
2221
1211
0
00
xdxdxxVPVP 00
xdxdxx
VPVP
00
22
021
xdxdxx
dxx
VPVPVV
T00
0022
xdxdxx
xxdxdx
VPVPVPVP
T
2eTjkd
T/1l20TL h
Sound pressureand velocity relationship
Symmetric sample T11=T22, T11T22-T12T21=1
Transmission loss
111cos1 T
dk p
2221001211 )/(2
TcTcTTeT
dkcdkj
dkcjdkTTTT pppp
cos/sinsincos1211
1 T
T/1log20TL 10 where Transmission loss
Transfer matrix
12
dkcdkjTT pppp cos/sin2221
21
121TT
cpp
Limp or rigid porous material
Property of material

Anechoic Transmission LossAviation grade glass fiber (density=9.6 kg/m3, flow resistivity= 31000 Rayls/m)
30
35
40
ExperimentPrediction using FEM (with edge constraint)Prediction without edge constraint
2.9 cm tube
20
25
30
L (d
B)
10
15
TL
Increase in TLdue to
102
103
104
0
5
Frequency (Hz)
due to edge constraint Shearing Resonance
13
q y ( )
Above shearing resonance – finite size sample represents infinite sample
Below shearing resonance – all properties affected by edge-constraint
Estimation of Biot Parameters
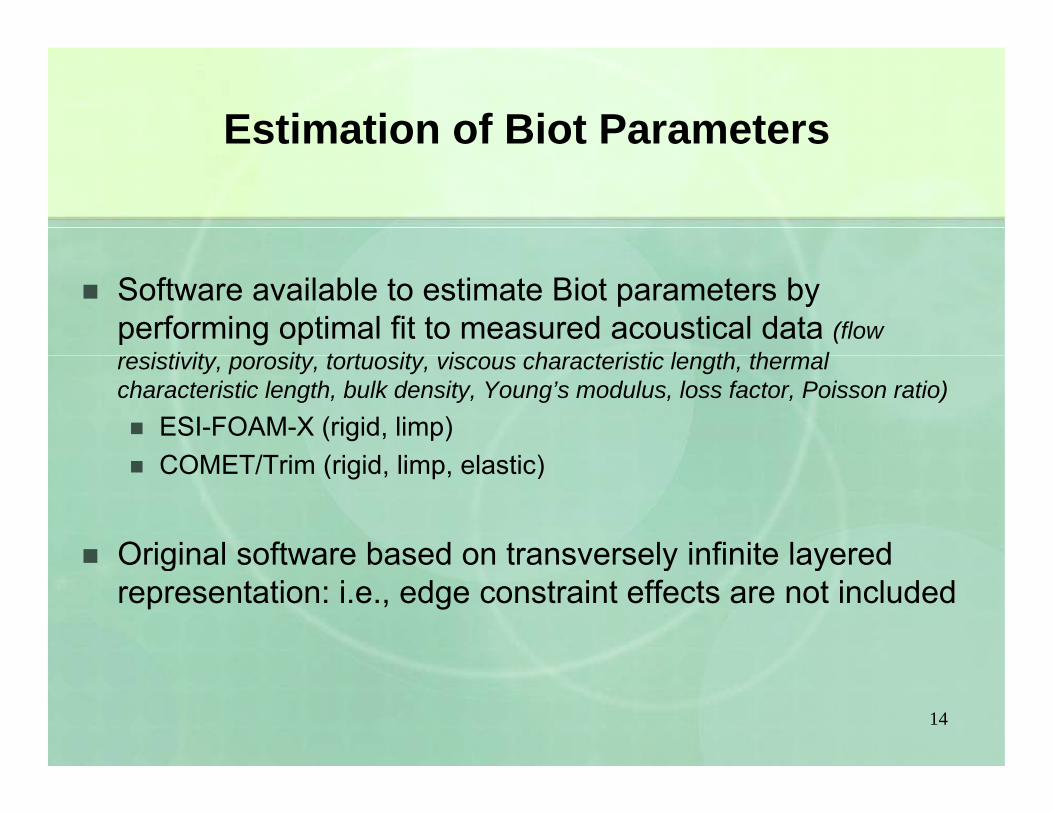
Software available to estimate Biot parameters by performing optimal fit to measured acoustical data (flow
i ti it it t t it i h t i ti l th th lresistivity, porosity, tortuosity, viscous characteristic length, thermal characteristic length, bulk density, Young’s modulus, loss factor, Poisson ratio) ESI-FOAM-X (rigid, limp)
COMET/T i ( i id li l ti ) COMET/Trim (rigid, limp, elastic)
Original software based on transversely infinite layered Original software based on transversely infinite layered representation: i.e., edge constraint effects are not included
14

Infinite Panel Model: COMET/TRIM
1515

Infinite Panel Model: Limitation
101
6
8
10
ss [d
B]
0 6
0.8
1
ficie
nt
4
6
Tran
smis
sion
Los
0.4
0.6
Abs
orpt
ion
Coe
ff
1000 2000 3000 4000 5000 60000
2
Frequency [Hz]
ExperimentTrim
1000 2000 3000 4000 5000 60000
0.2
Frequency [Hz]
ExperimentTrim
Note that this model does not simulate the low frequencytransmission loss fluctuation caused by shearing
1616
transmission loss fluctuation caused by shearing resonance of the sample

Finite Element Models: COMET/SAFE
The software COMET/SAFE is used to model and compute the absorption and transmission loss having a finite depth and finite size layer of porous material.A fi it l t b d th t ll f th A finite element based program that allows for the analysis of sound traveling through various media including fluids, solids and foam-like substances.
Finite element implementation is based on u-U and p-Uversions of Biot theory.All d l d i thi k i l d i t i All models used in this work involved axisymmetric elements.
The new version of TRIM supports automated inverse
1717
The new version of TRIM supports automated inverse characterization capability based on SAFE.

Finite Element Model
Note that finite model can simulate the low frequencytransmission loss fluctuation caused by shearing
1818
transmission loss fluctuation caused by shearing resonance of the sample

Inverse Characterization
Questions: Is it possible to determine the Biot parameters from acoustical measurements? Do parameters act independently? How many parametersparameters act independently? How many parameters can be estimated?
To help answer these questions, introduce a procedure b d Si l V l D itibased on Singular Value Decomposition
Singular Value Decomposition is widely used linear algebraic method to identify the principal components inalgebraic method to identify the principal components in the field of image processing and signal processing.
1919

Sensitivity Matrix AnalysisProcedures
1 Li i b i d i i ffi i l
Procedures
1. Linearize absorption and transmission coefficient close to a certain parameter set
2. Use absorption and/or transmission coefficient values for certain number of frequencies to construct a sensitivity matrixsensitivity matrix
3. Perform singular value decomposition on the sensitivity t i d t t i l l t d t i ff timatrix and extract singular values to determine effective
rank (number of independent parameters)
20204. Calculate condition number (the smaller the better)

Sensitivity Matrix Analysis
Linearize the expression for the absorption and
y y
p ptransmission coefficient in the vicinity of a certain parameter setFor 1 frequencyq y
9
10 )()()(
11i
ii
xff dx
xxx i
RealSolution
Calculate by using “central difference scheme”±1 % difference of material properties
ix
2
ix
Solution
ApproximateSolution
2121ix
ix2

Sensitivity Matrix Analysis
For n frequencies the equation can be combined as a matrix
y y
For n frequencies, the equation can be combined as a matrix
19210
...)()(912111
11dxxxxxx
xfxfxf
ff
9
921
921
0
...
...
............)(
...)(
...921
11
dxxxx
xx xfxfxfff
nnnnn
Sensitivity MatrixPerform singular value decomposition: g pM=UΣV*
The rank of the matrix M equals the number of non-zero
2222
singular values which is the same as the number of nonzero elements in the matrix Σ.
Rigid FoamS iti it M t i A l i
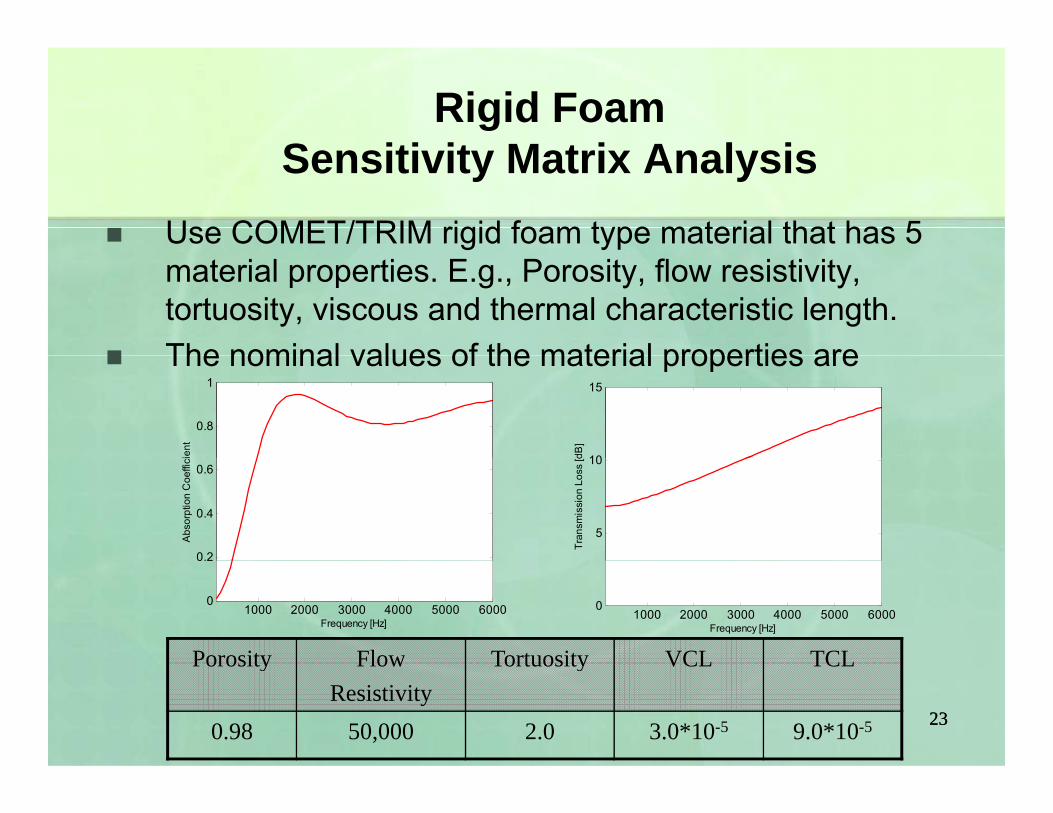
Use COMET/TRIM rigid foam type material that has 5
Sensitivity Matrix Analysis
material properties. E.g., Porosity, flow resistivity, tortuosity, viscous and thermal characteristic length.
The nominal values of the material properties are The nominal values of the material properties are
0.8
1
ient
10
15
dB]
0.2
0.4
0.6
Abs
orpt
ion
Coe
ffici
5
10
Tran
smis
sion
Los
s [d
Porosity Flow Tortuosity VCL TCL
1000 2000 3000 4000 5000 60000
0.2
Frequency [Hz]1000 2000 3000 4000 5000 6000
0
Frequency [Hz]
2323
Porosity FlowResistivity
Tortuosity VCL TCL
0.98 50,000 2.0 3.0*10-5 9.0*10-5
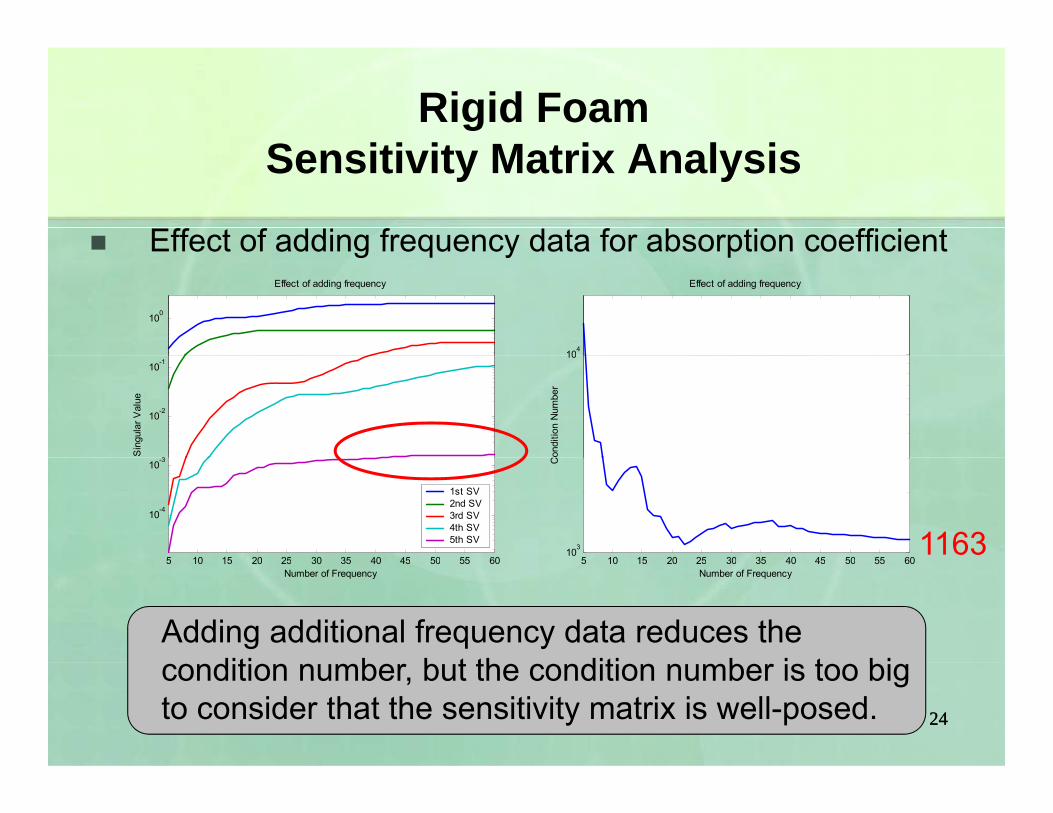
Rigid FoamS iti it M t i A l i
Effect of adding frequency data for absorption coefficient
Sensitivity Matrix Analysis
100
Effect of adding frequency
g q y p
104
Effect of adding frequency
3
10-2
10-1
Sin
gula
r Val
ue
10
Con
ditio
n N
umbe
r5 10 15 20 25 30 35 40 45 50 55 60
10-4
10-3
1st SV2nd SV3rd SV4th SV5th SV 1163
5 10 15 20 25 30 35 40 45 50 55 60103
C5 10 15 20 25 30 35 40 45 50 55 60
Number of Frequency
Adding additional frequency data reduces the diti b b t th diti b i t bi
5 10 15 20 25 30 35 40 45 50 55 60Number of Frequency
2424
condition number, but the condition number is too big to consider that the sensitivity matrix is well-posed.
Rigid FoamSensitivity Matrix Analysis
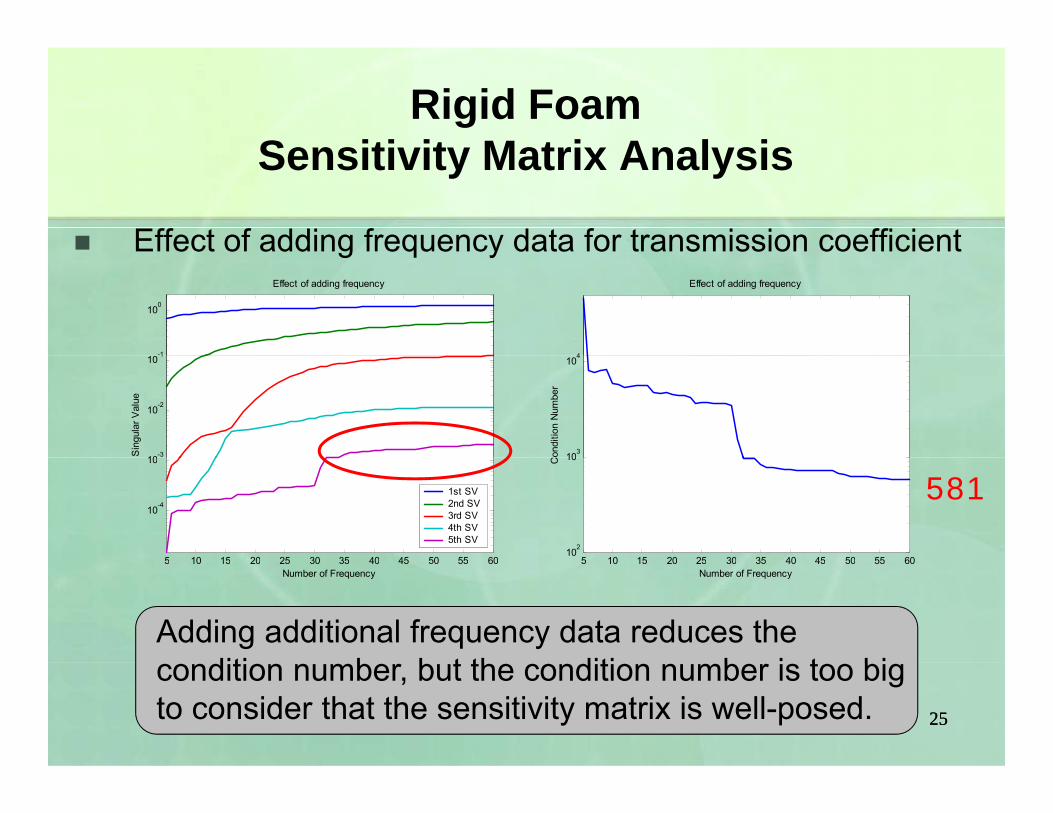
Effect of adding frequency data for transmission coefficient
Sensitivity Matrix Analysis
-1
100
Effect of adding frequency
g q y
4
Effect of adding frequency
10-3
10-2
10 1
Sin
gula
r Val
ue
103
104
Con
ditio
n N
umbe
r5 10 15 20 25 30 35 40 45 50 55 60
10-4
10
1st SV2nd SV3rd SV4th SV5th SV
581
5 10 15 20 25 30 35 40 45 50 55 60102
10C5 10 15 20 25 30 35 40 45 50 55 60
Number of Frequency
Adding additional frequency data reduces the diti b b t th diti b i t bi
5 10 15 20 25 30 35 40 45 50 55 60Number of Frequency
2525
condition number, but the condition number is too big to consider that the sensitivity matrix is well-posed.
Rigid FoamSensitivity Matrix Analysis
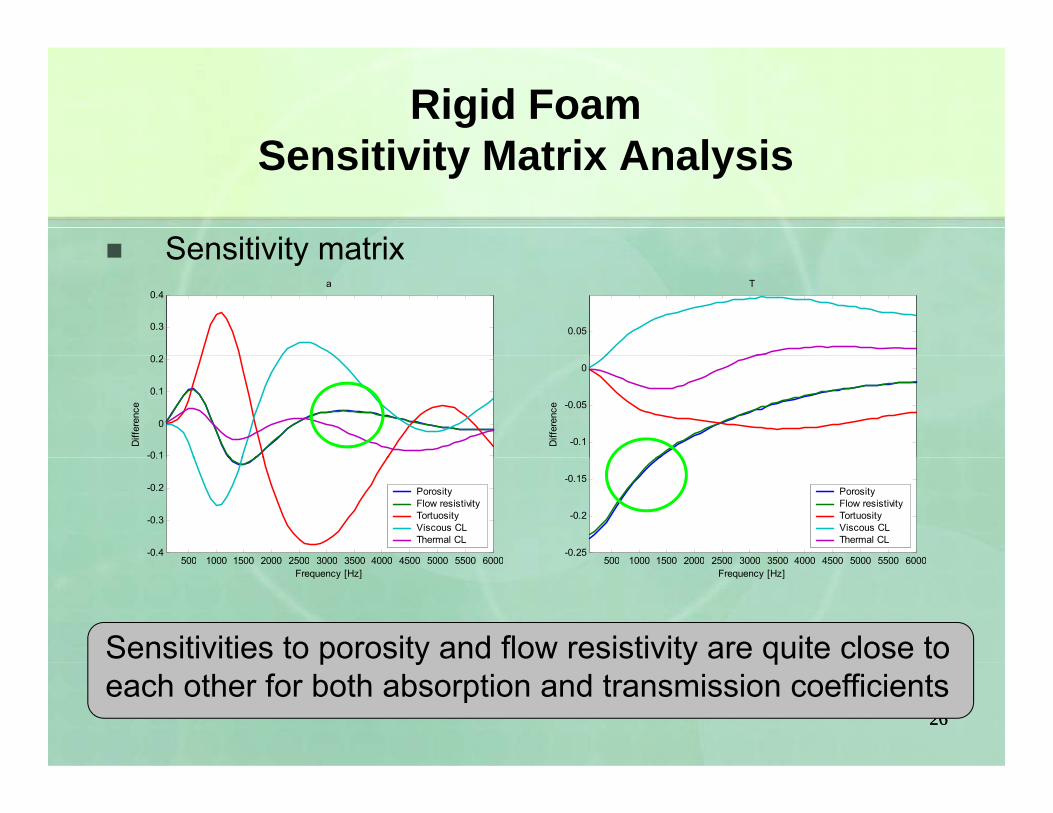
Sensitivity matrix
Sensitivity Matrix Analysis
Sensitivity matrix
0 2
0.3
0.4a
0.05
T
-0.1
0
0.1
0.2
Diff
eren
ce
-0.1
-0.05
0
Diff
eren
ce500 1000 1500 2000 2500 3000 3500 4000 4500 5000 5500 6000
-0.4
-0.3
-0.2
0.1
PorosityFlow resistivityTortuosityViscous CLThermal CL
500 1000 1500 2000 2500 3000 3500 4000 4500 5000 5500 6000-0.25
-0.2
-0.15PorosityFlow resistivityTortuosityViscous CLThermal CL
Sensitivities to porosity and flow resistivity are quite close to
500 1000 1500 2000 2500 3000 3500 4000 4500 5000 5500 6000Frequency [Hz]
500 1000 1500 2000 2500 3000 3500 4000 4500 5000 5500 6000Frequency [Hz]
2626
p y y qeach other for both absorption and transmission coefficients
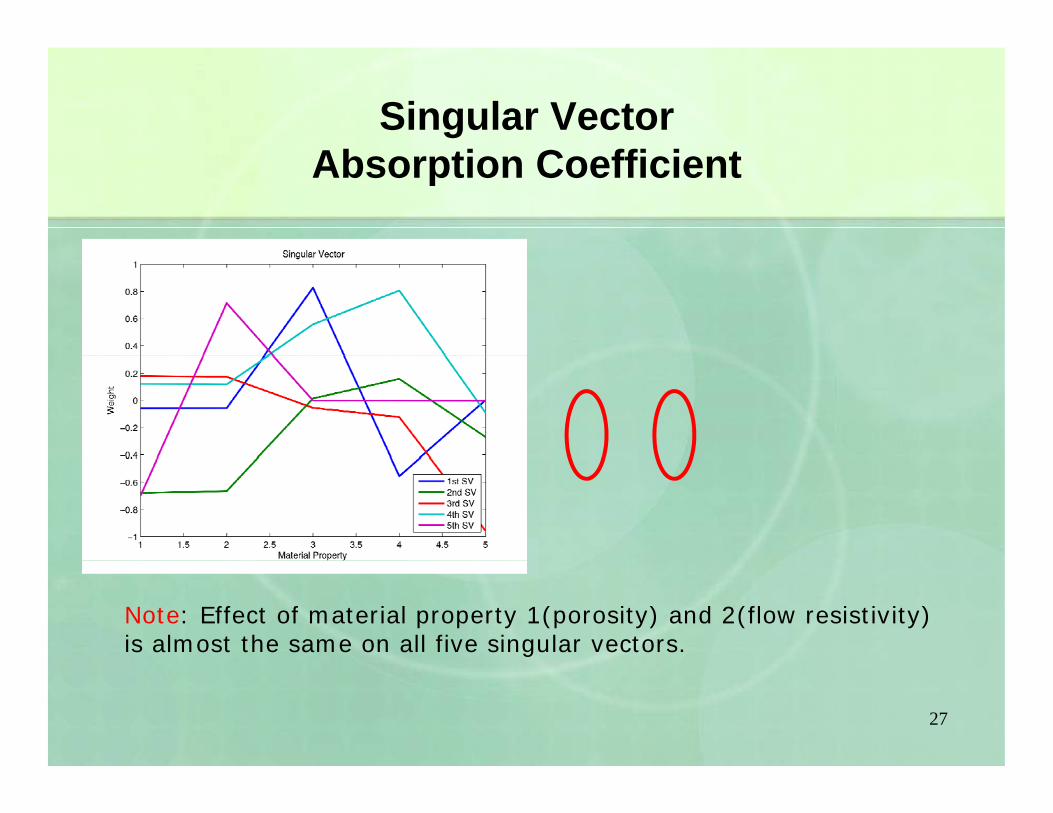
Singular VectorAb ti C ffi i tAbsorption Coefficient
Note: Effect of material property 1(porosity) and 2(flow resistivity)is almost the same on all five singular vectors.
27

Rigid FoamSensitivity Matrix Analysis
Fixed porosity case result for absorption coefficient
Sensitivity Matrix Analysis
p y p
100
Effect of adding frequency104
Effect of adding frequency
10-2
10-1
Sin
gula
r Val
ue
103
ondi
tion
Num
ber
185 10 15 20 25 30 35 40 45 50 55 60
10-4
10-3
S
1st SV2nd SV3rd SV4th SV
5 10 15 20 25 30 35 40 45 50 55 60101
102Co
Fixing porosity reduces the condition number
5 10 15 20 25 30 35 40 45 50 55 60Number of Frequency
5 10 15 20 25 30 35 40 45 50 55 60Number of Frequency
2828
g p ysignificantly and makes the sensitivity matrix well-posed.
Rigid FoamSensitivity Matrix Analysis
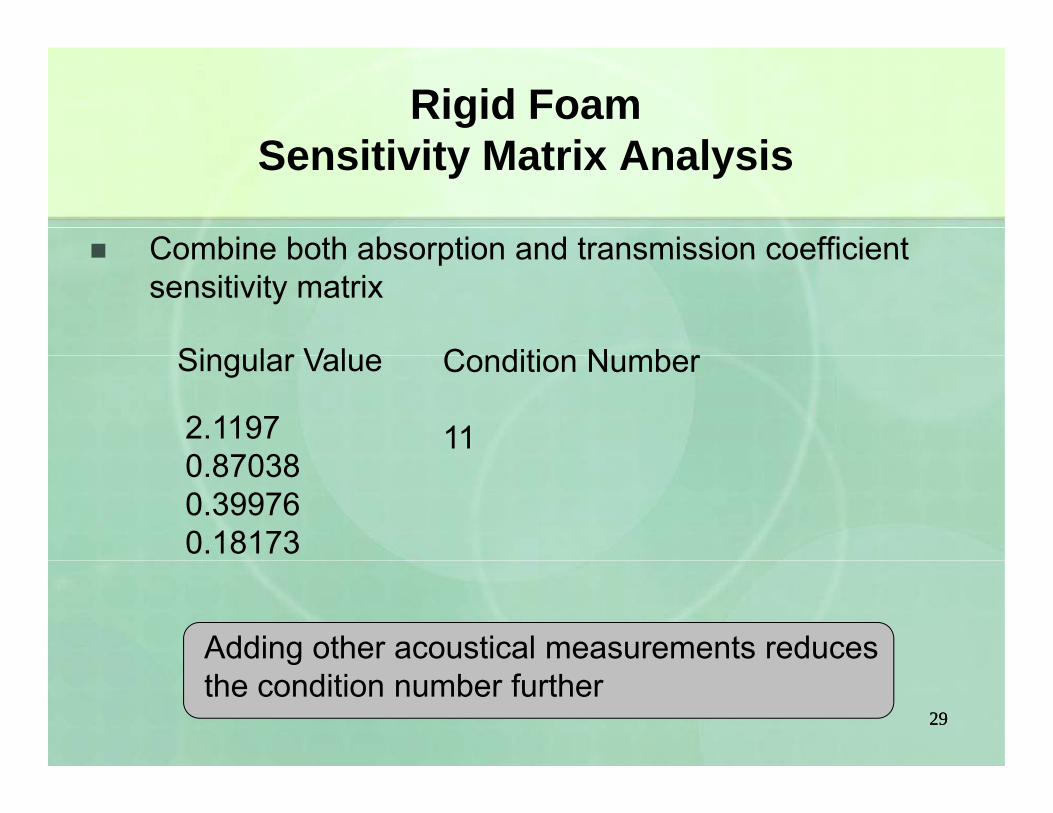
Combine both absorption and transmission coefficient
Sensitivity Matrix Analysis
Combine both absorption and transmission coefficient sensitivity matrix
Singular Value Condition NumberSingular Value
2.11970 87038
Condition Number
110.870380.399760.18173
Adding other acoustical measurements reduces
2929
gthe condition number further

Rigid FoamSensitivity Matrix Analysis
To verify the effect of low and high condition number
Sensitivity Matrix Analysis
To verify the effect of low and high condition number during the automatic inverse characterization in COMET/TRIM, two different cases were studied
Solution Initial value
Found value 1
Found value 2
Porosity 0.98 0.5 0.54 0.98Flow resistivity 50,000 125,000 165,000 51,050
Tortuosity 2.0 6.0 1.47 2.073Viscous C.L 3.0*10-5 9.0*10-5 1.77*10-5 3.08*10-5
3030Thermal C.L 9.0*10-5 2.7*10-4 7.85*10-4 9.06*10-5

O ti l I Ch t i tiOptimal Inverse Characterization
4 parameter search gives near optimal result 4 parameter search gives near optimal result
31
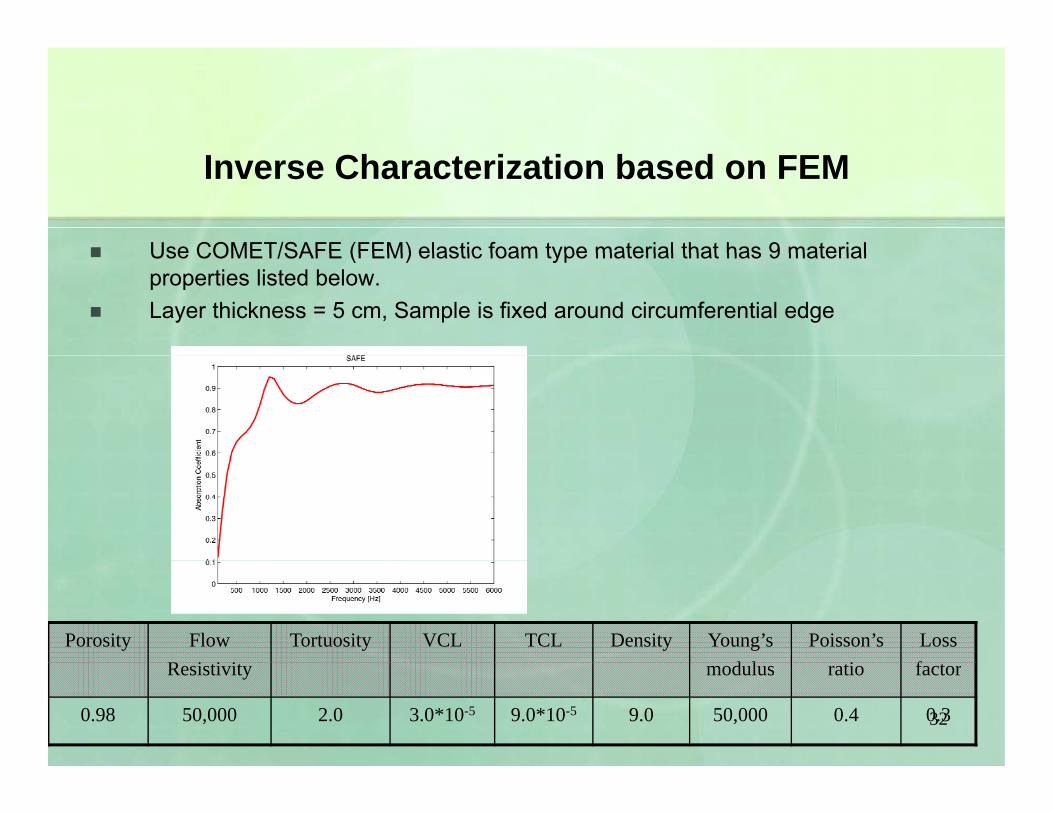
Inverse Characterization based on FEM
Use COMET/SAFE (FEM) elastic foam type material that has 9 material Use COMET/SAFE (FEM) elastic foam type material that has 9 material properties listed below.
Layer thickness = 5 cm, Sample is fixed around circumferential edge
Porosity FlowR i i i
Tortuosity VCL TCL Density Young’sd l
Poisson’si
Lossf
32
Resistivity modulus ratio factor
0.98 50,000 2.0 3.0*10-5 9.0*10-5 9.0 50,000 0.4 0.3

Singular Vectors for Absorption and T i iTransmission
Higher order singular vectors for absorption & transmission coefficient Higher order singular vectors for absorption & transmission coefficient case
E hi h (6th 7th 8th d 9th) d i l t33
Even higher (6th, 7th, 8th, and 9th) order singular vectors have wide range of values – all parameters independent

S l ti I iti l U fi d
Inverse Characterization Results
Solution Initial guess Unfixed
Porosity 0.98 0.75 0.88
Flow resistivity 50,000 45,000 51,203y , , ,
Tortuosity 2.0 1.7 2.04
Viscous C.L 3.0*10‐5 3.5*10‐5 3.16*10‐5
Thermal C.L 9.0*10‐5 1.05*10‐4 8.66*10‐5
Density 9.0 7.5 9.87
Young’s modulus 50,000 45,000 53,445
Poisson’s ratio 0.4 0.35 0.399
Loss factor 0 3 0 25 0 302
34
Loss factor 0.3 0.25 0.302
• 9 parameters estimated with reasonable accuracy

I Ch t i ti R ltInverse Characterization Results
35
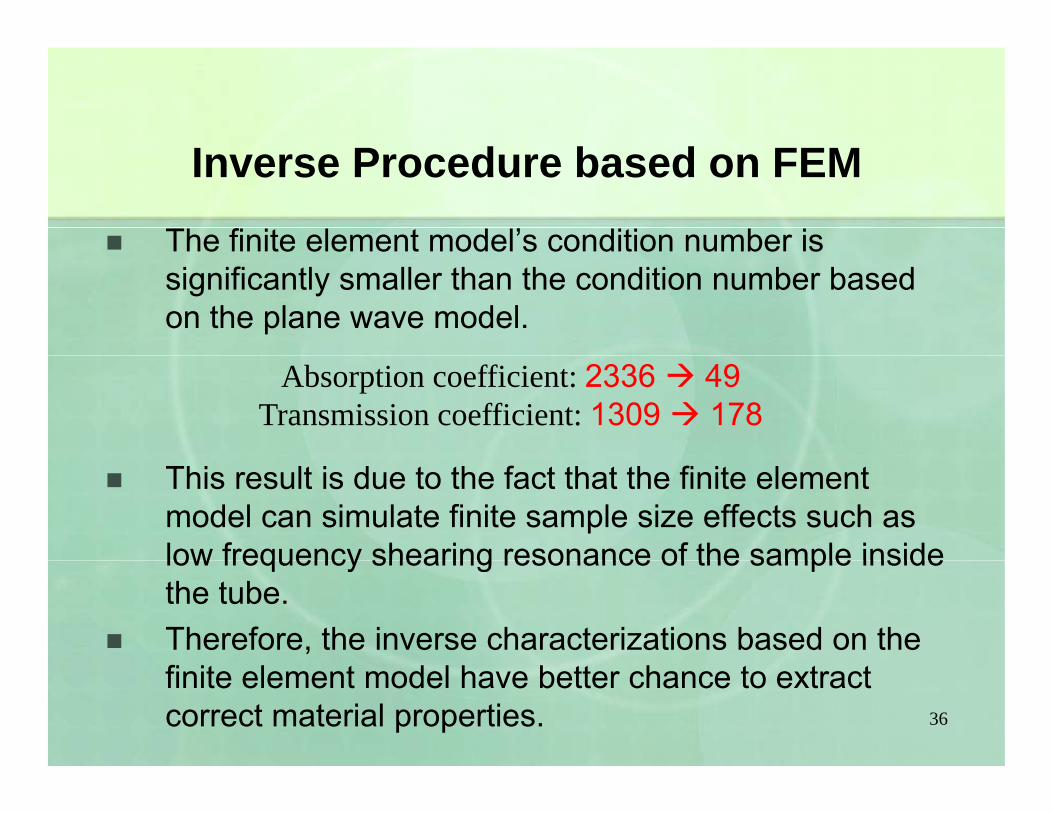
I P d b d FEM
The finite element model’s condition number is
Inverse Procedure based on FEM
significantly smaller than the condition number based on the plane wave model.
Absorption coefficient: 2336 49Transmission coefficient: 1309 178
This result is due to the fact that the finite element model can simulate finite sample size effects such as low frequency shearing resonance of the sample insidelow frequency shearing resonance of the sample inside the tube.
Therefore, the inverse characterizations based on the
36
finite element model have better chance to extract correct material properties.
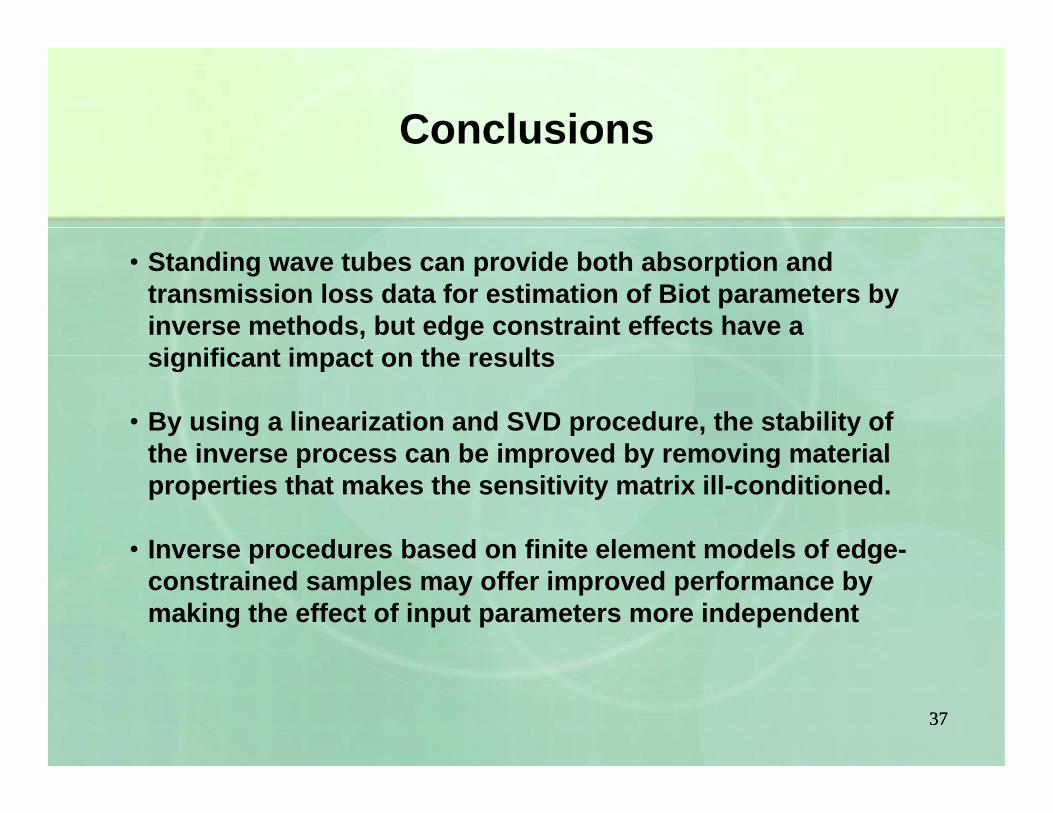
Conclusions
St di t b id b th b ti d• Standing wave tubes can provide both absorption and transmission loss data for estimation of Biot parameters by inverse methods, but edge constraint effects have a significant impact on the resultssignificant impact on the results
• By using a linearization and SVD procedure, the stability of the inverse process can be improved by removing materialthe inverse process can be improved by removing material properties that makes the sensitivity matrix ill-conditioned.
• Inverse procedures based on finite element models of edge-p gconstrained samples may offer improved performance by making the effect of input parameters more independent
3737

Acknowledgments
P E D k
g
P. E. Doak Joe Pope L&L Products L&L Products United Technologies Research Center 3M Corporation (Jon Alexander) Bruel & Kjaer (Oliviero Olivieri, Jason Kunio, Jorgen
Hald) NASA (Richard Silcox) NASA (Richard Silcox) Richard Yun, Heuk Jin (Bryan) Song, Jinho Song,
Jeong-woo Kim, Taewook Yoo, Kwanwoo Hong, Kang Hou
3838
Hou Tanya Wulf


![WTNV144 - Consolidation of a column of ground poro- []](https://static.fdocuments.us/doc/165x107/615a1883ffd8cc6e45269573/wtnv144-consolidation-of-a-column-of-ground-poro-.jpg)