INVERMERE TIMBER SUPPLY AREA PREDICTIVE...
69
INVERMERE TIMBER SUPPLY AREA PREDICTIVE ECOSYSTEM MAPPING (PEM) FINAL PROJECT REPORT For Vivian Jablanczy RPF Slocan Forest Product Radium Division 6 Radium Plaza, Box 39 Radium Hotsprings, BC V0A 1M0 (250) 347-6407 And Ken Gorsline Regional Planning Manager Ministry of Sustainable Resource Management #401 – 333 Victoria Street Nelson, BC V1L 4K3 (250) 354-6350 By Maureen V. Ketcheson R.P.Bio Lawson Bradley Tom Dool BES Gareth Kernaghan For Tech Keyes Lessard For Tech Vicky Lipinski BA JMJ Holdings Inc. Suite 208 – 507 Baker Street Nelson, BC V1L 4J2 (250) 354-4913 And Dr. Bob MacMillan Landmapper Environmental Solutions Inc. 7415 118A Street Edmonton, Alberta T6G 1V4 (780) 435-5431 January 31, 2004.
Transcript of INVERMERE TIMBER SUPPLY AREA PREDICTIVE...

INVERMERE TIMBER SUPPLY AREA PREDICTIVE ECOSYSTEM MAPPING
(PEM) FINAL PROJECT REPORT
For
Vivian Jablanczy RPF Slocan Forest Product Radium Division
6 Radium Plaza, Box 39 Radium Hotsprings, BC V0A 1M0
(250) 347-6407
And
Ken Gorsline Regional Planning Manager
Ministry of Sustainable Resource Management #401 – 333 Victoria Street
Nelson, BC V1L 4K3 (250) 354-6350
By
Maureen V. Ketcheson R.P.Bio Lawson Bradley Tom Dool BES
Gareth Kernaghan For Tech Keyes Lessard For Tech
Vicky Lipinski BA JMJ Holdings Inc.
Suite 208 – 507 Baker Street Nelson, BC V1L 4J2
(250) 354-4913
And
Dr. Bob MacMillan Landmapper Environmental Solutions Inc.
7415 118A Street Edmonton, Alberta T6G 1V4
(780) 435-5431
January 31, 2004.

Invermere TSA Predictive Ecosystem Mapping (PEM) Report
JMJ Holdings Inc. 208-507 Baker Street, Nelson BC, V1L 4J2 phone (250) 354-4913 fax (250) 354-1162
email [email protected] Page ii.
January 31, 2004.
Table of Contents 1.0 Introduction................................................................................................................. 1
1.1 History of the Project................................................................................................ 1 1.2 Location .................................................................................................................... 2 1.3 Ecosection and BEC setting ..................................................................................... 6
2.0 Methods...................................................................................................................... 12 2.1 An Overview of the PEM Process........................................................................... 12 2.2 Landscape Facet Model ........................................................................................... 15
2.2.1 LMES Automated Landform Model ................................................................. 15 2.2.1.1 Landform Facet Generation ........................................................................ 15 2.2.1.2 Landform..................................................................................................... 17
2.3 Generalized Materials Mapping .............................................................................. 17 2.4 Invermere PEM Model Map Entities Knowledge Bases......................................... 18 2.5 PEM Model Building Field Data Collection ........................................................... 25
2.5.1 Field Data Collection Sampling Design............................................................ 25 2.5.1.1 Timber Harvesting Landbase...................................................................... 25
2.5.2 Field Sampling Standards.................................................................................. 29 2.5.3 Field Data Internal Quality Control .................................................................. 29 2.5.4 Field Data Entry ................................................................................................ 30 2.5.5 Field Data Synthesis.......................................................................................... 30 2.5.6 Internal Quality Control .................................................................................... 31 2.5.7 External Quality Control ................................................................................... 31 2.5.8 Structural Stage Model...................................................................................... 31
2.6 Spatial and Database Formats.................................................................................. 33 2.7 Internal Quality Control........................................................................................... 33
2.7.1 Meidinger Approach ......................................................................................... 33 2.7.2 Wilson Approach............................................................................................... 33
3.0 Results ........................................................................................................................ 34 3.1 PEM Model Accuracy and Fit to Field Data ........................................................... 34
3.1.1 Independent Assessment of Model Accuracy in the THLB Using Meidinger 2003 Protocol ............................................................................................................. 34 3.1.2 Model Goodness of Fit to Field Data ................................................................ 36 3.1.3 Wilson Approach to Assessment of Model Reliability..................................... 39
3.2 PEM Model Result .................................................................................................. 39 3.2.1 Map Entity Area by BEC Variant by THLB, NHLB and TSA......................... 39 3.2.2 Structural Stage Area by BEC Variant.............................................................. 45
3.3 An Illustrated Depiction of Some Site Series of the Invermere TSA...................... 49 4.0 Discussion................................................................................................................... 61 5.0 References.................................................................................................................. 62

Invermere TSA Predictive Ecosystem Mapping (PEM) Report
JMJ Holdings Inc. 208-507 Baker Street, Nelson BC, V1L 4J2 phone (250) 354-4913 fax (250) 354-1162
email [email protected] Page iii.
January 31, 2004.
List of Figures Figure 1. Invermere TSA PEM location within south east British Columbia .................... 3 Figure 2. Invermere TSA 1:20,000 TRIM Map Sheet Coverage ...................................... 5 Figure 3. The Ecosections of the Invermere TSA............................................................... 7 Figure 4. Biogeoclimatic Subzones of the Invermere TSA .............................................. 11 Figure 5. Invermere TSA PEM Model Overview............................................................. 14 Figure 6. Timber and Non-Timber Harvesting Landbases of the Invermere TSA........... 27
List of Tables
Table 1. TRIM Derived Inputs for the Invermere PEM Model First Run........................ 13 Table 2. Targeted Materials Mapping and Forest Cover Data Used to Modify the Results of the First Run of the Invermere PEM Model ................................................................. 13 Table 3. Targeted Materials Mapping Criteria. ................................................................ 18 Table 4. BEC Variants and Map Entities Mapped in the Invermere PEM Project........... 19 Table 5. Non-Vegetated Site Series .................................................................................. 21 Table 6. Example Portion of IDFdm2 Knowledge Bases Invermere PEM Model........... 22 Table 7. Second Run Materials Depth Mapping Corrections example IDFdm2.............. 23 Table 8. Proportioning Rules for the IDFdm2................................................................. 24 Table 9. Transect Field Data Collection Format............................................................... 26 Table 10. Structural Stages Modeled in the Invermere TSA............................................ 32 Table 11. An Example of a Portion of a Structural Stage Knowledge Table Forest Cover Classification..................................................................................................................... 32 Table 12. Results of an Independent Assessment of PEM Map Accuracy THLB Invermere TSA (Timberline 2003) ................................................................................... 35 Table 13. PPdh2 Confusion Matrix 2003 Field Plot Data Invermere TSA ...................... 36 Table 14. IDFdm2 Confusion Matrix 2003 Field Plot Data Invermere TSA ................... 37 Table 15. ICHmk1 Confusion Matrix 2003 Field Plot Data Invermere TSA.................. 37 Table 16. MSdk Confusion Matrix 2003 Field Plot Data Invermere TSA....................... 38 Table 17. ESSFdk1 Confusion Matrix 2003 Field Plot Data Invermere TSA.................. 38 Table 18. Area of Subzones and Site Series in the Invermere TSA Mapped by the PEM Model ................................................................................................................................ 40 Table 19. Structural Stage Distribution by BEC, Invermere TSA.................................... 46

Invermere TSA Predictive Ecosystem Mapping (PEM) Report
JMJ Holdings Inc. 208-507 Baker Street, Nelson BC, V1L 4J2 phone (250) 354-4913 fax (250) 354-1162
email [email protected] Page iv.
January 31, 2004.
List of Appendices (contained on accompanying CD)
APPENDIX I – Input Data Quality Assessment Reports tinp_inv.doc APPENDIX II – Knowledge Bases Dec2_mvkall.xls APPENDIX IIIa – Timber Harvesting Landbase Plot Data VENUS data base for plot data – INVR_PEM.MDB EXCEL plot data summaries – PEM_venus_extract.xls EXCEL transect data – inv_transects_reclass_final.xls APPENDIX IIIb – Non Timber Harvesting Landbase Plot Data VENUS data base for plot data – INV_NHLB.MDB EXCEL plot data summaries – NHLB_venus_extract.xls APPENDIX IV – List of Map Entities by BEC Provincial map codes Invermere TSA December 2.xls APPENDIX V – Proportion of Site Series Within Each Map Entity Dec11 Site Series Proportions All BECs.xls APPENDIX VI – Structural Stage Knowledge Bases Invermere PEM Structural Stage Model Jan 1804.xls APPENDIX VII – Second RUN Bioterrain Modification Rule Sets Second Run Bioterrain Modification Rules.xls APPENDIX VIII – Project Metadata Reports tknb_inv.doc tpro_inv.doc tusr_inv.csv tpro_inv.csv tsts_inv.doc tinp_inv.csv APPENDIX IX – PEM Spatial and Data Bases tecp_inv.zip – (tecp_inv.csv, tecp_inv.e00) teci_inv.e00 APPENDIX X – Dr. Steve Wilson’s PEM Reliability Report for MSRM Nelson Region -Experience map Invermere TSA PEM – experience.jpg -Reliability map Invermere TSA PEM – reliability.jpg Wilson Improvements to PEM.doc APPENDIX XI – Timberline Accuracy Assessment Report ITSA PEMAA censored final reports.pdf

Invermere TSA Predictive Ecosystem Mapping (PEM) Report
JMJ Holdings Inc. 208-507 Baker Street, Nelson BC, V1L 4J2 phone (250) 354-4913 fax (250) 354-1162
email [email protected] Page v.
January 31, 2004.
Acknowledgements We would like to thank the client, Vivian Jablanczy of Slocan Forest Products, Radium Division for initiating this project and for her support and patience as funding levels were decreased after the onset of the original Invermere PEM mapping project. We would also like to thank Pat Field and Ken Gorsline, MSRM Nelson for their eleventh hour financial support which insured that the entire TSA would be mapped and that field plot data was collected in the non-timber harvesting as well as timber harvesting portions of the Invermere TSA. We appreciate input into this project by Marcie Belcher, TEMBEC Forest Industries, Cranbrook and for her support for SIBEC related activities which supported the TSR portion of this project. We would also like to thank Cam Brown, FORSITE for his comments and patience in receiving the final PEM for his TSR activities. Thanks also to Tom Braumandl of Biome Consulting for providing us with the updated BEC mapping and documentation within tight timelines at the end of a busy field season. Dr. Steve Wilson of Ecologic Research provided a lot of valuable input around dealing with the utility of plot data to model fit determinations. Dan Bernier, of Timberline Forest Inventory Consultants also provided a lot of very useful input towards the determination of the final PEM model in the face of tight deadlines for the final assessment of model accuracy. Field personnel for this project were coordinated by Gareth Kernaghan and consisted of the following JMJ Holdings Inc. personnel; Donna Ross, Keyes Lessard, Catherine Littlewood and Ben Shock. They were, as usual, hardworking, cheerful and thorough. We appreciate being able to use Dr. Bob MacMillan’s LMES terrain surrogate model and think that it provided an adequate and affordable substitute for traditional and more costly bioterrain mapping. The “Invermere Model” of PEM mapping is being applied to the Quesnel PEM project as an inexpensive alternative to other forms of raster based PEM mapping.

Invermere TSA Predictive Ecosystem Mapping (PEM) Report
JMJ Holdings Inc. 208-507 Baker Street, Nelson BC, V1L 4J2 phone (250) 354-4913 fax (250) 354-1162
email [email protected] Page 1.
January 31, 2004.
1.0 Introduction 1.1 History of the Project
Predictive Ecosystem Mapping (PEM) was tendered by Slocan Forest Products, Radium Division in February 2003 to be used in support of Timber Supply Review activities scheduled for the fall of 2003. Budget restrictions early in the 2003/2004 fiscal year resulted in the contract for PEM throughout the Invermere TSA to be split between the Timber Harvesting Landbase, funded through Slocan Forest Products, Radium Division, and the Non-Timber Harvesting Landbase, funded by the Ministry of Sustainable Resource Management, Nelson BC. As the Invermere PEM model was run throughout the TSA using a single process we felt that it was appropriate that the process and result be described within a single report, as the complete coverage was provided to both clients. The primary, critical component of this project is that the PEM product is able to provide credible, spatially accurate, site series data to support a site index adjustment in the Invermere TSA. This coverage is appropriate for use with VRI or Forest Cover spatial and database information. Together they create a powerful combination of ecological and inventory attributes. A reconnaissance level PEM, prepared for MSRM for planning purposes and known as the “East Kootenay PEM” (Ketcheson et al, 2002) already existed for the Invermere TSA. This model was based on landscape shape and lacked traditional bioterrain mapping. Its accuracy was unknown, but it did provide an excellent starting point from which a more elaborate PEM model could be developed. The original “East Kootenay PEM” was created using existing spatial inventories and models and was not tested with spatially accurate field data. Existing site series data from the ISIS data base indicated that the original PEM was reasonably adept at finding circum-mesic sites, but lacked resolution in dry and wet areas. The Canal Flats PEM (Ketcheson et al, 2001) also occurs within the Invermere TSA and was developed with spatially accurate plot data, but lacked bioterrain mapping. This PEM model gave an excellent representation of the landscape with a very good correlation between randomly located plot data and the overall output of the PEM model. It did not have a formal assessment of accuracy and only overlaps with a portion of the Invermere TSA. However, both of these mapping projects provide a baseline from which improvements to the PEM model could be made. A secondary, but also key, requirement of this project is that the PEM product supported other site series based interpretations, such as biodiversity (structural stage distribution) and critical wildlife habitats, which are directly of interest to the Invermere TSA in the future. The output from this product can be used directly for such interpretations, but those interpretations are not included within the scope of this project. The PEM output is required to be produced and documented in a manner that meets the PEM Data Committee April 2000 Specifications for Digital Data Capture. It is also critical that the mapping be subjected to the appropriate accuracy and model goodness of fit assessments proposed in the Protocol for Quality Assurance and Accuracy Assessment
Invermere TSA Predictive Ecosystem Mapping (PEM) Report
JMJ Holdings Inc. 208-507 Baker Street, Nelson BC, V1L 4J2 phone (250) 354-4913 fax (250) 354-1162
email [email protected] Page 2.
January 31, 2004.
of Ecosystem Maps proposed by Meidinger (2003). The mapping had to meet the specified levels of accuracy before being accepted for use in the SIBEC site index adjustment process. The assessment of accuracy was completed by an independent party and submitted to Slocan Forest Products and BC Ministry of Forests Research Branch for consideration. In order to maintain independence of the accuracy data we were not privy to the final accuracy assessment report, it has been submitted to the client and we were given the indication that the PEM model achieved the level of accuracy necessary for use in TSR activities. New field data collection for this project met Provincial Standards as well as the needs of PEM model development and verification. Existing field data collected within the Invermere TSA was also used to augment model-building and verification processes. The approach to terrain mapping within a tight time line and restricted budget is taken from the Canim Lake PEM project being undertaken by Weldwood, 100 Mile House (MacMillan et al., 2003). In this project there were considerable cost savings seen by using a simplified approach to bioterrain mapping that involves a combination of the LMES (Landmapper Environmental Solutions Inc.) landscape facet models and targeted depth and texture mapping. The final product met tests of accuracy using this approach to terrain delineation. However, this simplified approach to terrain delineation means that the client does not have the benefit of traditional bioterrain mapping (Howes and Kenk, 1997) throughout the project area. What is key to this project is that the process and methods used have already demonstrated themselves to be applicable to the goal of adjustment of the forest estate model analysis unit. It is critical that the PEM project works in concert with that effort. 1.2 Location The Invermere TSA PEM project area is located in the south east corner of British Columbia (see Figure 1), and occupies an area of approximately 1,113,513 ha. It is located within the dry and moist climatic zones with precipitation increasing from south to north (Braumandl and Curran, 1992).

Invermere TSA Predictive Ecosystem Mapping (PEM) Report
JMJ Holdings Inc. 208-507 Baker Street, Nelson BC, V1L 4J2 phone (250) 354-4913 fax (250) 354-1162
email [email protected] Page 3.
January 31, 2004.
Figure 1. Invermere TSA PEM location within south east British Columbia

Invermere TSA Predictive Ecosystem Mapping (PEM) Report
JMJ Holdings Inc. 208-507 Baker Street, Nelson BC, V1L 4J2 phone (250) 354-4913 fax (250) 354-1162
email [email protected] Page 4.
January 31, 2004.
Mapping was completed using newly updated and defined subzones recently completed by Braumandl and Dykstra (2003) and approved for use by Dennis Lloyd, Research Ecologist, BC Ministry of Forests, Kamloops. The Invermere TSA is located within the following 1:20,000 TRIM map sheets as illustrated in Figure 2:
082F.079 082J.014 082J.063 082K.040 082K.099 082F.080 082J.015 082J.064 082K.047 082N.007 082F.089 082J.021 082J.071 082K.048 082N.008 082F.090 082J.022 082J.072 082K.049 082N.009 082F.098 082J.023 082J.073 082K.050 082N.016 082F.099 082J.024 082J.074 082K.057 082N.017 082F.100 082J.025 082J.081 082K.058 082N.018 082G.071 082J.031 082J.082 082K.059 082O.001 082G.072 082J.032 082J.083 082K.060 082O.002 082G.081 082J.033 082J.091 082K.067 082G.082 082J.034 082J.092 082K.068 082G.083 082J.035 082J.093 082K.069 082G.084 082J.041 082K.008 082K.070 082G.091 082J.042 082K.009 082K.076 082G.092 082J.043 082K.010 082K.077 082G.093 082J.044 082K.018 082K.078 082G.094 082J.045 082K.019 082K.079 082J.001 082J.051 082K.020 082K.080 082J.002 082J.052 082K.028 082K.086 082J.003 082J.053 082K.029 082K.087 082J.004 082J.054 082K.030 082K.088 082J.011 082J.055 082K.037 082K.089 082J.012 082J.061 082K.038 082K.090 082J.013 082J.062 082K.039 082K.098

Invermere TSA Predictive Ecosystem Mapping (PEM) Report
JMJ Holdings Inc. 208-507 Baker Street, Nelson BC, V1L 4J2 phone (250) 354-4913 fax (250) 354-1162
email [email protected] Page 5.
January 31, 2004.
Figure 2. Invermere TSA 1:20,000 TRIM Map Sheet Coverage

Invermere TSA Predictive Ecosystem Mapping (PEM) Report
JMJ Holdings Inc. 208-507 Baker Street, Nelson BC, V1L 4J2 phone (250) 354-4913 fax (250) 354-1162
email [email protected] Page 6.
January 31, 2004.
1.3 Ecosection and BEC setting
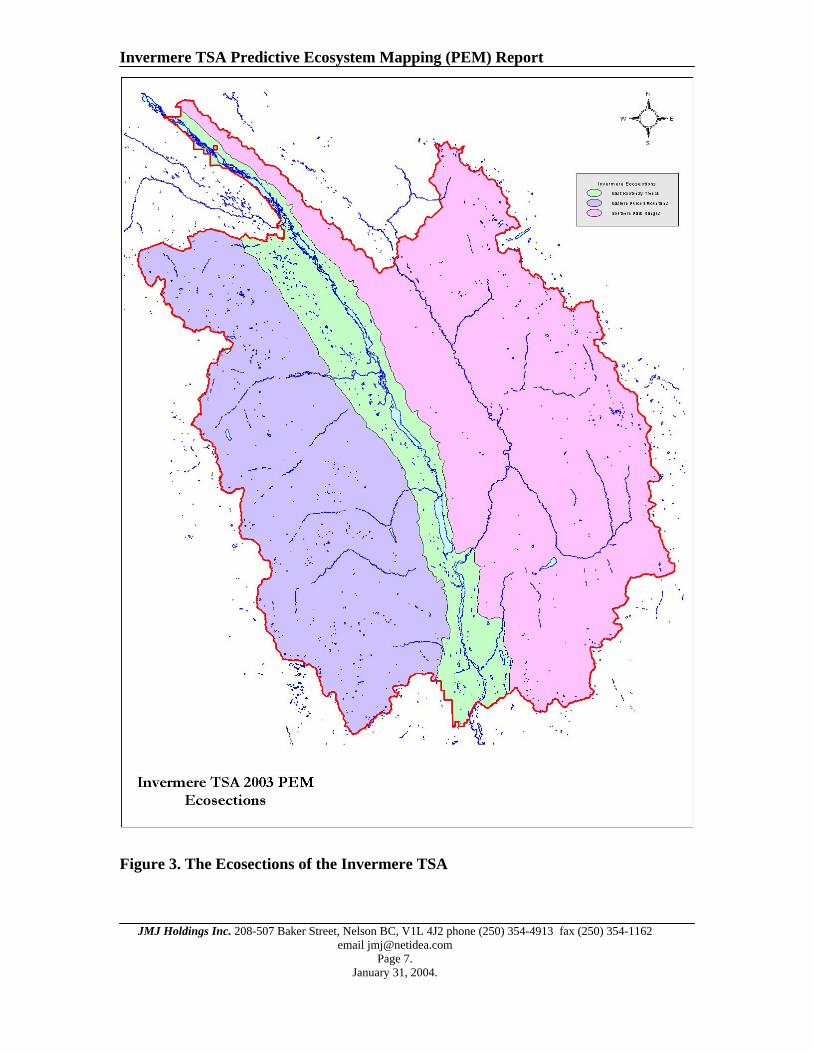
The Invermere TSA is classified using two hierarchies. The ecoregion classification of Demarchi (1996) utilizes climate and physiography while the Biogeoclimatic Ecosystem Classification (BEC) (Braumandl and Curran, 1992) used by the BC Ministry of Forests, relies on vegetation to indicate site, soil and climatic features. The ecoregion classification (as shown in Figure 3) is used at quite broad levels (three subdivisions within the TSA), while the BEC system is used down to site series level (in excess of eighty units within the project area). Ecoregions are large regional-sized, ecological land units that have similar macroclimate, physiography, vegetation and wildlife potential. Five levels of Ecoregion Classification are recognized including Ecodomain, Ecodivision, Ecoprovince, Ecoregion and Ecosection. Following the ecological land classification hierarchy set forth by Demarchi (1996), the Invermere TSA is located within the Humid Temperate Ecodomain, the Humid Continental Highlands Ecodivision, and the Southern Interior Mountains Ecoprovince. Within the Ecoprovince, it is further divided into the following Ecoregions: the Northern Columbia Mountains, the Western Continental Ranges and the Southern Rocky Mountain Trench. Ecosections are subregional units within ecoregions that are similar in climate, landforms, bedrock geology, soils, and plant and animal distributions. The Invermere TSA is located within the following three ecosections as described by Demarchi (1996): The Northern Columbia Mountains Ecoregion The Eastern Purcell Mountains (EPM) Ecosection is a mountainous area with high valleys. It is located leeward of the Purcell Ranges in the southwest part of the region and lies within a distinct rainshadow. The Western Continental Ranges Ecoregion The Southern Park Ranges (SPK) Ecosection is located in the Rockies from north of the Elk Valley to the Blaeberry Valley. It is a rugged mountainous area that is dissected by long rivers, forming moderately wide valleys. The Southern Rocky Mountain Trench Ecoregion The East Kootenay Trench (EKT) Ecosection is a broad, flat glacial plain with a distinctive rainshadow that lies in the southern portion of the Rocky Mountain Trench from Donald to the USA border.
Invermere TSA Predictive Ecosystem Mapping (PEM) Report
JMJ Holdings Inc. 208-507 Baker Street, Nelson BC, V1L 4J2 phone (250) 354-4913 fax (250) 354-1162
email [email protected] Page 7.
January 31, 2004.
Figure 3. The Ecosections of the Invermere TSA

Invermere TSA Predictive Ecosystem Mapping (PEM) Report
JMJ Holdings Inc. 208-507 Baker Street, Nelson BC, V1L 4J2 phone (250) 354-4913 fax (250) 354-1162
email [email protected] Page 8.
January 31, 2004.
Biogeoclimatic Zones, Subzones and Variants occur within each Ecosection and are classified using the Ministry of Forests Biogeoclimatic Ecosystem Classification (BEC) system (Braumandl and Curran, 1992). These units represent groups of ecosystems under the influence of the same regional climate. The Invermere TSA spans the Dry, Moist and Wet Climatic Regions and contains twelve biogeoclimatic subzones and variants (see Figure 4) that are briefly described below. Dry Subzones 1) PPdh2 - The Kootenay Dry Hot Ponderosa Pine Variant occurs in the southern part of the East Kootenay Trench generally between 700 and 950m in elevation. Very hot, very dry summers and mild winters with very light snowfall characterize this zone. Zonal sites support open stands of Ponderosa pine and Douglas-fir (Braumandl and Curran, 1992). Common species in the understorey include bluebunch wheatgrass, saskatoon, prairie rose, and rosy pussytoes. There has been extensive fire, grazing, and logging disturbance within this variant. 2) IDFdm2 - The Kootenay Dry, Mild Interior Douglas-fir Variant occurs along the East Kootenay trench generally between 800 and 1200 m in elevation on warm aspects and between 800 and 1100 m on cool aspects. Hot, very dry summers and cool winters with very light snowfall characterize this variant (Braumandl and Curran, 1992). Mature zonal sites support stands of Douglas-fir; however, due to frequent wildfires, mixed seral stands of Douglas-fir, western larch and lodgepole pine are more common. 3) IDFdm2N - This new unit replaces the IDFdm2 located north of Brisco. It is similar to the IDFdm2, although Braumandl and Dykstra (2003) report is to be “apparently more productive” and exhibits differing successional sequences more dominated by trembling aspen and paper birch. 4) IDFxk - Undifferentiated Interior Douglas-fir (Windermere Lake) Unit occurs along Windermere and Columbia Lakes between 800 and 900m primarily on warm aspects. Hot, very dry summers and cool winters with very light snowfall characterize this zone. Mature zonal sites support open stands of only Douglas-fir while other tree species are rare. Bluebunch wheatgrass and junegrass are the dominant understorey species. Marcoux (1997) has developed site series for this subzone in consultation with the regional ecologist. 5) MSdk -The Dry Cool Montane Spruce Subzone occurs along the East Kootenay trench. It is found above the IDFdm2 generally between 1200 and 1650 m elevation on warm aspects and between 1100 and 1550 m elevation on cool aspects. Warm, dry summers and cold winters with light snowfall characterize this zone (Braumandl and Curran, 1992). Mature zonal sites support stands of hybrid white spruce and subalpine fir with minor amounts of Douglas-fir. Due to widespread wildfires, extensive stands of lodgepole pine exist today.
Invermere TSA Predictive Ecosystem Mapping (PEM) Report
JMJ Holdings Inc. 208-507 Baker Street, Nelson BC, V1L 4J2 phone (250) 354-4913 fax (250) 354-1162
email [email protected] Page 9.
January 31, 2004.
6) ESSFdk1 - The Dry Cool Engelmann Spruce Subalpine Fir Subzone occurs along the East Kootenay trench. It is found above the MSdk generally between approx. 1650 and 2050 m elevation on warm aspects and between 1550 and 1920 m on cool aspects. This zone is characterized by cool, moist summers and very cold winters with moderately heavy snowfall (Braumandl and Curran, 1992). Mature zonal sites support stands of subalpine fir and Engelmann spruce. 7) ESSFdk2 – The Parson Dry Mild Engelmann Spruce – Subalpine Fir Variant occurs in the northeastern corner of the Invermere TSA from about 1600 to 2000 m on warm aspects and from 1500 to 1950 m on cool aspects. This zone was previously mapped as the ESSFwm but is characterized by a drier climate than the ESSFwm and a warmer, moister climate than the ESSFdk. Mature zonal sites support stands of subalpine fir and Engelmann spruce. Site series units were developed from field data by Kernaghan et al (1999), as this subzone is not described in Braumandl and Curran (1992). The fire cycle is much longer than in the ESSFdk, especially on cool aspect slopes. 8) ESSFdku - The Upper Dry Cool Engelmann Spruce Subalpine Fir Subzone occurs between 2050 and 2300 m elevation on warm aspects and between 1920 and 2380 m on cool aspects. It is located above the ESSFdk1 and ESSFdk2 on the highest forested slopes of the Rocky and Purcell Mountains. This zone is characterized by cool, dry summers and very cold winters with heavy snowfall. Mature zonal sites support stands of subalpine fir, Engelmann spruce and alpine larch. Late lying snow and frost pocketing create a mosaic of forest and permanent meadows. This subzone is not documented in Braumandl and Curran (1992) and has been described by Kernaghan et al (1997, 1998). Moist Subzones 9) ICHmk1 - The Kootenay Moist Cool Interior Cedar - Hemlock Variant occurs in the central part of the Invermere TSA. This variant is characterized by warm, moist summers and cool winters with light snowfall (Braumandl and Curran 1992). Mature zonal sites support stands of western redcedar, hybrid white spruce and subalpine fir; however, due to frequent wildfires and mountain pine beetle outbreaks, these are rare. Mixed seral stands of lodgepole pine and Douglas-fir are more common. 10) ESSFwm – The Wet Mild Engelmann Spruce – Subalpine Fir Subzone occurs in an isolated small area in the northeastern corner of the Invermere TSA at approximately 1650 to 2000m on warm aspects and from 1500 to 2000m on cool aspects. This subzone is characterized by cool, moist summers and cold, wet winters with moderately heavy snowfall. Climax zonal sites have stands of Engelmann spruce and subalpine fir. The understorey vegetation is dominated by false azalea with oak fern being widespread on zonal sites. Long fire cycles have produced many old growth stands and few seral stands.

Invermere TSA Predictive Ecosystem Mapping (PEM) Report
JMJ Holdings Inc. 208-507 Baker Street, Nelson BC, V1L 4J2 phone (250) 354-4913 fax (250) 354-1162
email [email protected] Page 10.
January 31, 2004.
11) ESSFwmu - The Upper Wet Mild Engelmann Spruce - Subalpine Fir Subzone occurs above the ESSFwc1 on the highest forested slopes with small openings. It is found between about 2000 and 2200m. Provisional site series are based on units developed by Kernaghan et al (1999). Cool, moist summers and very cold winters with heavy snowfall characterize this subzone. Mature zonal sites support stands of subalpine fir, Engelmann spruce and alpine larch. Understorey vegetation is often dominated by mountain-heathers. Late lying snow, avalanching, colluvial action, thin soils and frost pocketing create a mosaic of closed forest, scree slopes, avalanche tracks, and permanent meadows. 12) ATun - Alpine Tundra Undifferentiated zone occurs above elevations from 2200 m in the north to 2600 m in the south. It encompasses the high, treeless peaks of the Purcells, Selkirks and Rockies. This zone is characterized by short, cool and moist summers and very cold winters with heavy snowfall. Much of the subzone is non-vegetated. Mountain-avens, mountain-heathers and arctic willow with no conifers characterize zonal vegetated sites.

Invermere TSA Predictive Ecosystem Mapping (PEM) Report
JMJ Holdings Inc. 208-507 Baker Street, Nelson BC, V1L 4J2 phone (250) 354-4913 fax (250) 354-1162
email [email protected] Page 11.
January 31, 2004.
Figure 4. Biogeoclimatic Subzones of the Invermere TSA

Invermere TSA Predictive Ecosystem Mapping (PEM) Report
JMJ Holdings Inc. 208-507 Baker Street, Nelson BC, V1L 4J2 phone (250) 354-4913 fax (250) 354-1162
email [email protected] Page 12.
January 31, 2004.
2.0 Methods 2.1 An Overview of the PEM Process An overview of the PEM model used for the the Invermere TSA PEM is depicted in Figure 5. The PEM model starts with spatial inventories from TRIM in a raster format using a 25 x 25 meter pixel, as well as rasterized forest cover and satellite imagery. The TRIM topographic data and hydrology was manipulated within the LMES model to produce “landscape facets” which provided a surrogate for traditional bioterrain mapping. Bioterrain mapping was replaced with targeted materials mapping which delineated areas of rock, thin soils, coarse textured terraces and non-forested wetlands. The landscape facets were subdivided into slope and aspect classes. See Section 2.2 for a detailed description of landscape facets. Table 1 lists the landscape facet, slope and aspect classes used in the first run of the PEM model. Table 2 outlines the rule sets used to modify the output of the initial run of the PEM model based on the targeted materials mapping. For example, if an area is designated as a planar midslope by the landscape facet model, but falls within a targeted terrain polygon that indicated that the site is on a mix of thin materials and bedrock, the site series allocated to the planar midslope is adjusted to reflect the drier conditions found on the mix of thin materials and bedrock. The detailed rule sets for each BEC variant that dictate site series adjustments based on targeted materials mapping can be found in Appendix VII.
The Invermere PEM model consists of four stages where the landscape facet, aspect and slope derived raster result is modified by spatial attributes from targeted terrain, which is essentially depth and materials mapping for sites with rock and thin materials, or coarse textured terraces. The result is then vectorized to create polygons which represent the modeled landscape facets subdivided by slope and aspect classes. The site series represented within these polygons were then reported as proportions within of site series by polygon.
At each step in the PEM model spatially explicit field data is compared to the output of the model. If the fit of the model to the field data is poor, then the knowledge bases are modified to improve the result of the PEM model. Knowledge bases can be found in Appendix II and the final results of model fit to field data can be found in Section 3.2.

Invermere TSA Predictive Ecosystem Mapping (PEM) Report
JMJ Holdings Inc. 208-507 Baker Street, Nelson BC, V1L 4J2 phone (250) 354-4913 fax (250) 354-1162
email [email protected] Page 13.
January 31, 2004.
Table 1. TRIM Derived Inputs for the Invermere PEM Model First Run
LANDSCAPE FACET ASPECT CLASS SLOPE CLASS
Sharp Crest W - Warm (135 to 285 degrees) 1. 0 to 10% slope
Level Crest K - Cool (286 to 134 degrees) 2. >10 to 25% slope
Upper Shedding Shoulder 3. >25 to 50% slope
Upper Swale 4. >50 to 80% slope
Planar Midslope 5. >80% slope
Divergent Midslope
Convergent Midslope
Midslope Terrace
Midslope Swale
Toe Slope
Foot Slope
Toe Slope Swale
Lower Slope Mound
Level Slower Slope
Lower Slope Swale
Riparian
TRIM wetlands
Table 2. Targeted Materials Mapping and Forest Cover Data Used to Modify the Results of the First Run of the Invermere PEM Model
Materials Code (see Table 3 for definitions)
Aspect Class (see Table 1 for definitions)
Forest Cover Attribute
R W Fd leading species
R1 K
R2
R3
D
TD
TM

Invermere TSA Predictive Ecosystem Mapping (PEM) Report
JMJ Holdings Inc. 208-507 Baker Street, Nelson BC, V1L 4J2 phone (250) 354-4913 fax (250) 354-1162
email [email protected] Page 14.
January 31, 2004.
Figure 5. Invermere TSA PEM Model Overview

Invermere TSA Predictive Ecosystem Mapping (PEM) Report
JMJ Holdings Inc. 208-507 Baker Street, Nelson BC, V1L 4J2 phone (250) 354-4913 fax (250) 354-1162
email [email protected] Page 15.
January 31, 2004.
2.2 Landscape Facet Model Given tight time lines and budgets associated with this project we proposed to undertake an automated approach to bioterrain mapping that is based on a combination of both air photo interpretation and the LMES (Landmapper Environmental Solutions Inc.) landscape facet model. Initially the landscape was classified in a 25 x 25 meter raster format into facets reflecting the landscape shape and position features that terrain mappers traditionally air photo interpreted. These include slope position, slope class, aspect, and hydrologic flow class.
2.2.1 LMES Automated Landform Model LMES has been developing new procedures and a computer toolkit for landform analysis and classification for the past 10 years. The applicability of these procedures for Predictive Ecosystem Mapping was recently demonstrated in a PEM pilot project conducted in the Cariboo Forest Region of BC (MacMillan, 2002). The LMES procedures and toolkit analyze digital elevation data, and other relevant digital data sets, to automatically partition landscapes into fundamental geomorphic-hydrologic spatial entities. These spatial entities were used as the basic landscape shape categories within the Invermere PEM model. The model uses automated procedures that directly predict site series for each defined spatial entity when subdivided by aspect and slope class. Table 1 and Section 2.2.1.2 report the landscape facet categories used in the Invermere PEM model.
2.2.1.1 Landform Facet Generation
Landform facets represent segmentations of the overall landscape into smaller units that are designed to be less variable than the landscape as a whole. Each landform facet is designed to express a more narrow range of external characteristics defined according to morphology (shape), relative landform position (context), exposure (aspect) and relative drainage condition (wetness). The assumption is made that landform facets also possess a more restricted range of internal characteristics (soil texture, depth, mineralogy) than the landscape as a whole.
In the LMES approach, the only input layer required to define landform facets is a raster, or grid, Digital Elevation Model (DEM) derived from TRIM data.
The main steps followed in processing DEM data to compute landform facets are as follows.
Step 1. Obtain a seamless DEM and process it to smooth and to reduce obvious errors.

Invermere TSA Predictive Ecosystem Mapping (PEM) Report
JMJ Holdings Inc. 208-507 Baker Street, Nelson BC, V1L 4J2 phone (250) 354-4913 fax (250) 354-1162
email [email protected] Page 16.
January 31, 2004.
In general, we have found that optimum smoothing is achieved by using 3 passes of a mean filter with window sizes of 3x3, 3x3 and 5x5, in that order. Step 2. Process the DEM data to compute cell to cell flow topology.
The LMES programs use the flow direction calculations later for computing a number of terrain indices. One set of important indices consists of a variety of measures of relative landform position. Many of these measures of landform position are computed by tracing along flow paths from every cell in a DEM until the flow path reaches one of several important kinds of cells.
Step 3. Compute a series of terrain derivatives and morphological and hydrological indices using the cleaned and filtered DEM data and the flow topology data.
The LMES process computes a number of fairly common derivatives including slope percent, aspect, and profile and plan curvature. It also computes a version of the wetness index, or compound topographic index (Quinn et al., 1991) in this step. These are used to determine relative landform position and are invaluable in establishing landform context which is a key consideration in the subsequent landform classification procedures.
Step 4. Revise the existing LMES landform facet classifications for the project area.
Normally, the LMES program is run at this point using one of several predefined sets of classification rules. In the case of this proposed project landscape facet classification rules were reviewed and revised until they best reflected functional categories that would be the most useful to discriminate between Braumandl and Curran’s (1992) site series classification. Step 5. Apply the final, revised LMES landform facet classification to all DEM blocks defined for the project area.
LMES uses a custom in-house program to apply a set of rules to the DEM data and derivatives of DEM data to automatically classify a suite of defined landform classes.
Step 6. Prepare final vector and raster output files for each of the DEM blocks defined for the project area.
Step 7. Archive all data files generated in the process of computing the LMES landform facet classifications for each of the DEM blocks defined for the project area.
Invermere TSA Predictive Ecosystem Mapping (PEM) Report
JMJ Holdings Inc. 208-507 Baker Street, Nelson BC, V1L 4J2 phone (250) 354-4913 fax (250) 354-1162
email [email protected] Page 17.
January 31, 2004.
2.2.1.2 Landform
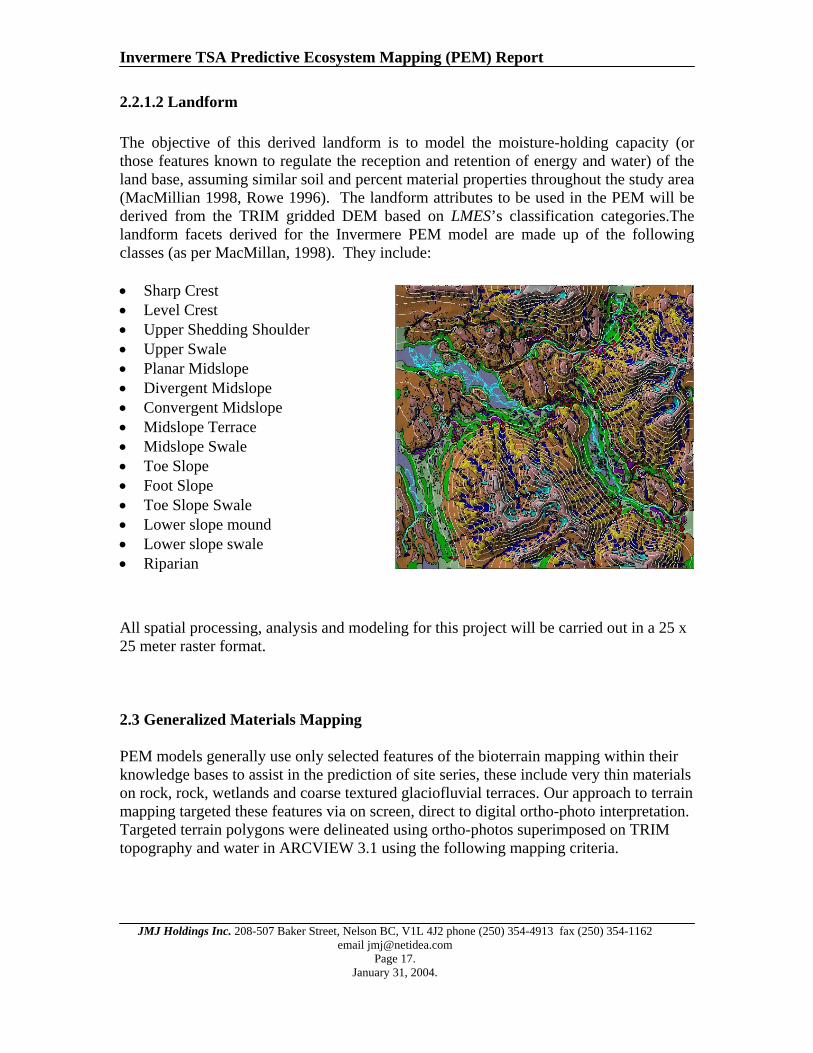
The objective of this derived landform is to model the moisture-holding capacity (or those features known to regulate the reception and retention of energy and water) of the land base, assuming similar soil and percent material properties throughout the study area (MacMillian 1998, Rowe 1996). The landform attributes to be used in the PEM will be derived from the TRIM gridded DEM based on LMES’s classification categories.The landform facets derived for the Invermere PEM model are made up of the following classes (as per MacMillan, 1998). They include:
• Sharp Crest • Level Crest • Upper Shedding Shoulder • Upper Swale • Planar Midslope • Divergent Midslope • Convergent Midslope • Midslope Terrace • Midslope Swale • Toe Slope • Foot Slope • Toe Slope Swale • Lower slope mound • Lower slope swale • Riparian
All spatial processing, analysis and modeling for this project will be carried out in a 25 x 25 meter raster format. 2.3 Generalized Materials Mapping PEM models generally use only selected features of the bioterrain mapping within their knowledge bases to assist in the prediction of site series, these include very thin materials on rock, rock, wetlands and coarse textured glaciofluvial terraces. Our approach to terrain mapping targeted these features via on screen, direct to digital ortho-photo interpretation. Targeted terrain polygons were delineated using ortho-photos superimposed on TRIM topography and water in ARCVIEW 3.1 using the following mapping criteria.

Invermere TSA Predictive Ecosystem Mapping (PEM) Report
JMJ Holdings Inc. 208-507 Baker Street, Nelson BC, V1L 4J2 phone (250) 354-4913 fax (250) 354-1162
email [email protected] Page 18.
January 31, 2004.
Table 3. Targeted Materials Mapping Criteria. Material Code Description R 100% bedrock or talus R1 Up to 25% bedrock or talus and 75% shallow materials
(veneers or very thin veneers) R2 Between 25-50% bedrock or talus and 50% shallow materials
(veneers or very thin veneers) R3 Between 50- 75% bedrock and talus and the remainder shallow
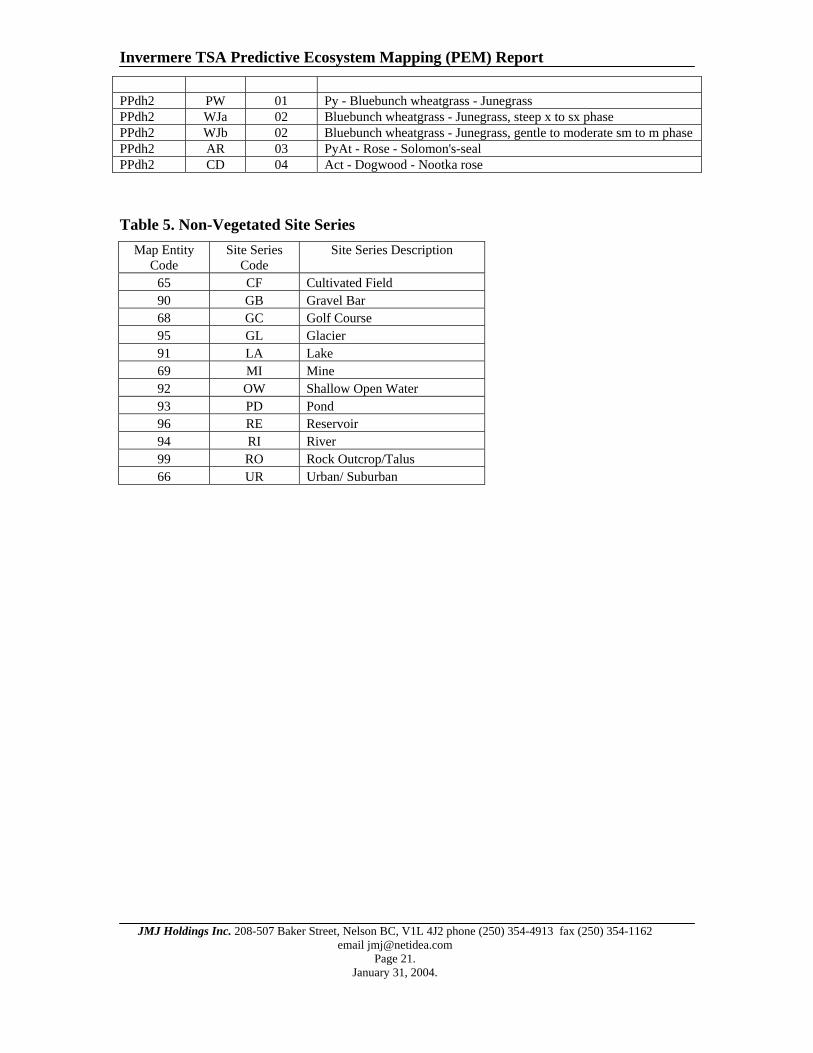
materials (veneers or very thin veneers) D 100% shallow materials (veneers or very thin veneers) TD Coarse textured terrace TM Medium to fine textured terraces W Non-treed Wetlands The materials mapping was completed throughout the Invermere TSA in both the Timber Harvesting Landbase and Non Timber Harvesting Landbase. This materials mapping formed a valuable PEM input layer used in conjunction with the LMES landscape facets as a surrogate for bioterrain mapping. 2.4 Invermere PEM Model Map Entities Knowledge Bases The variables expressed in each of the above described spatial inventories are related to the site series classification via knowledge bases. The site series classification to be mapped is described in detail in Appendix IV and summarized in Tables 4 and 5. This classification was reviewed and approved for use by Dennis Lloyd, Research Ecologist, BC Ministry of Forests, Kamloops Region. A complete set of knowledge bases for all BEC variants of the Invermere PEM project can be found in Appendix II. An example of a PEM knowledge base can be found in Table 6.

Invermere TSA Predictive Ecosystem Mapping (PEM) Report
JMJ Holdings Inc. 208-507 Baker Street, Nelson BC, V1L 4J2 phone (250) 354-4913 fax (250) 354-1162
email [email protected] Page 19.
January 31, 2004.
Table 4. BEC Variants and Map Entities Mapped in the Invermere PEM Project ** Site Series names in upper case are provisional names suggested by Dennis Lloyd, Research Ecologist, Kamloops Region.
BEC Variant
Map Entity Code
Site Series
Number SiteSeriesName AT AW 01 DRY MEADOW** Mountain-avens - Dwarf willow AT BP 03 MOIST MEADOW Black alpine sedge - Woolly pussytoes AT SL 02 EXPOSED RIDGE CREST Saxicolous lichen AT KR 04 KRUMHOLTZ AT WE 05 WETLAND AT AC 77 Avalanche chute AT AR 88 Avalanche runout zone ESSFdk1 AC 77 Avalanche chute ESSFdk1 AS 78 Trembling aspen - birch leaved spirea ESSFdk1 AW 87 Sitka alder - willow ESSFdk1 AR 88 Avalanche runout zone ESSFdk1 FA 01 Bl - Azalea - Foamflower ESSFdk1 DM 02 Fd - Douglas maple - Soopolallie ESSFdk1 FG 03 Bl - Azalea - Grouseberry ESSFdk1 FS 04 Bl - Azalea - Soopolallie ESSFdk1 XF 03/04 Bl - Azalea – Grouseberry/ Bl - Azalea – Soopolallie map entity ESSFdk1 FM 05 Bl - Azalea - Step moss ESSFdk1 FH 06 Bl - Azalea - Horsetail ESSFdk1 XM 05/06 Bl - Azalea - Step moss/ Bl - Azalea – Horsetail map entity ESSFdk1 WS 07 Willow - Sedge ESSFdku AC 77 Avalanche chute ESSFdku AR 88 Avalanche runout zone
ESSFdku AW 02 DRY MEADOW PLUS LOW KRUMHOLTZ Mountain-avens - Snow willow
ESSFdku WE 07 WETLANDS ESSFdku DV 08 MOIST TO WET MEADOWS Subalpine daisy - Sitka valerian ESSFdku EM 01 SM-M FORESTS SeBl - White mountain-heather ESSFdku WF 03 SX TO SM FORESTS PaBl
ESSFdku YW 04 DRY MEADOWS HEATHER Yellow mountain-heather - Woolly pussytoes
ESSFdku LM 05 MESIC -SH forests ESSFdku FH 06 SH-H FORESTS Bl - Horsetail ESSFdk2 AC 77 Avalanche Chute ESSFdk2 AR 88 AVALANCHE RUNOUT ZONE ESSFdk2 FG 02 Bl - Pa - Grouseberry ESSFdk2 FH 04 Bl - False azalea - Horsetail ESSFdk2 FP 01 Bl - Black huckleberry - Red-stemmed feathermoss ESSFdk2 FS 05 Bl - Sedge - Sphagnum ESSFdk2 FV 03 Bl - Rhododendron - Black huckleberry ESSFdk2 WE 06 WETLANDS ESSFwm FA 01 Bl - Azalea - Arnica

Invermere TSA Predictive Ecosystem Mapping (PEM) Report
JMJ Holdings Inc. 208-507 Baker Street, Nelson BC, V1L 4J2 phone (250) 354-4913 fax (250) 354-1162
email [email protected] Page 20.
January 31, 2004.
ESSFwm FR 02 Bl - Rhododendron - Azalea ESSFwm RA 03 BlHw - Rhododendron - Azalea ESSFwm FQ 04 Bl - Azalea - Queen's cup ESSFwm WE 05 WETLANDS ESSFwm AC 77 AVALANCHE PATH ESSFwm AR 88 AVALANCHE RUNOUT ZONE ICHmk1 AC 77 AVALANCHE PATH ICHmk1 AR 88 AVALANCHE RUNOUT ZONE ICHmk1 XA 01/04 CwSxw - Falsebox / FdPl - Sitka Alder - Pinegrass map entity ICHmk1 DP 02 Fd - Juniper - Penstemon ICHmk1 DT 03 FdPl - Pinegrass - Twinflower ICHmk1 SG 05 SxwFd - Gooseberry - Sarsaparilla ICHmk1 SO 06 Sxw - Oak fern ICHmk1 SH 07 Sxw - Horsetail ICHmk1 WE 08 WETLAND COMPLEX IDFdm2 WE 08 WETLAND COMPLEX IDFdm2 DT 01 FdPl - Pinegrass - Twinflower IDFdm2 AW 02 Antelope-brush - Bluebunch wheatgrass IDFdm2 DS 03 Fd - Snowberry - Balsamroot IDFdm2 SP 04 FdLw - Spruce - Pinegrass IDFdm2 SS 05 SxwAt - Sarsaparilla IDFdm2 SH 07 Sxw - Horsetail IDFdm2N WE 08 WETLAND COMPLEX IDFdm2N DT 01 FdPl - Pinegrass - Twinflower IDFdm2N DS 03 Fd - Snowberry - Balsamroot IDFdm2N SP 04 FdLw - Spruce - Pinegrass IDFdm2N SS 05 SxwAt - Sarsaparilla IDFdm2N SH 07 Sxw - Horsetail IDFxk CD 05 ActSxw - Red-Osier dogwood
IDFxk XJ 01/02 Fd - Rocky Mountain juniper - Bluebunch wheatgrass/ Pature sage bluebunch wheatgrass
IDFxk DP 03 Fd - Pinegrass - Step moss IDFxk SS 04 SxwAt - Sarsaparilla MSdk AC 77 AVALANCHE CHUTE MSdk AR 88 AVALANCHE RUN OUT ZONE MSdk SG 01 Sxw - Soopolallie - Grouseberry
MSdk XL 01/04 Sxw - Soopolallie - Grouseberry/ Pl Oregon -grape pinegrass map entity
MSdk XS 01/05 Sxw - Soopolallie – Grouseberry/ Sxw - Soopolallie – Snowberry map entity
MSdk SW 02 Saskatoon - Bluebunch wheatgrass MSdk LJ 03 Pl - Juniper - Pinegrass MSdk SS 05 Sxw - Soopolallie - Snowberry MSdk SH 06 Sxw - Dogwood - Horsetail MSdk WE 07 WETLAND
MSdk aa n/a ASPEN DOMINATED SERAL ASSOCIATION, applied to any MSdk site series dominated by At
Invermere TSA Predictive Ecosystem Mapping (PEM) Report
JMJ Holdings Inc. 208-507 Baker Street, Nelson BC, V1L 4J2 phone (250) 354-4913 fax (250) 354-1162
email [email protected] Page 21.
January 31, 2004.
PPdh2 PW 01 Py - Bluebunch wheatgrass - Junegrass PPdh2 WJa 02 Bluebunch wheatgrass - Junegrass, steep x to sx phase PPdh2 WJb 02 Bluebunch wheatgrass - Junegrass, gentle to moderate sm to m phase PPdh2 AR 03 PyAt - Rose - Solomon's-seal PPdh2 CD 04 Act - Dogwood - Nootka rose
Table 5. Non-Vegetated Site Series Map Entity
Code Site Series
Code Site Series Description
65 CF Cultivated Field 90 GB Gravel Bar 68 GC Golf Course 95 GL Glacier 91 LA Lake 69 MI Mine 92 OW Shallow Open Water 93 PD Pond 96 RE Reservoir 94 RI River 99 RO Rock Outcrop/Talus 66 UR Urban/ Suburban

Invermere TSA Predictive Ecosystem Mapping (PEM) Report
JMJ Holdings Inc. 208-507 Baker Street, Nelson BC, V1L 4J2 phone (250) 354-4913 fax (250) 354-1162
email [email protected] Page 22.
January 31, 2004.
Table 6. Example Portion of IDFdm2 Knowledge Bases Invermere PEM Model IDFdm2 Landscape Facet Aspect
Slope (%)
Map Entity
Site Series#
Sharp crest 0-10 AW 02 K >10-<25 AW 02 W >10-<25 AW 02 K 25-<50 AW 02 W 25-<50 AW 02 K 50-<80 AW 02 W 50-<80 AW 02 K 80+ AW 02 W 80+ AW 02 Level crests 0-10 AW 02 K >10-<25 AW 02 W >10-<25 AW 02 K 25-<50 DT 01 W 25-<50 AW 02 K 50-<80 DT 01 W 50-<80 AW 02 K 80+ DT 01 W 80+ AW 02 Upper shedding shoulder 0-10 DS 03 K >10-<25 DT 01 W >10-<25 DS 03 K 25-<50 DT 01 W 25-<50 AW 02 K 50-<80 DT 01 W 50-<80 AW 02 K 80+ DT 01 W 80+ AW 02 Upper swale 0-10 SP 04 K >10-<25 SP 04 W >10-<25 DT 01 K 25-<50 DT 01 W 25-<50 DT 01 K 50-<80 DT 01 W 50-<80 DT 01 K 80+ DT 01 W 80+ DT 01 Planar midslope 0-10 DT 01 K >10-<25 DT 01 W >10-<25 DT 01 K 25-<50 DT 01 W 25-<50 DT 01 K 50-<80 DT 01 W 50-<80 DS 03 K 80+ DT 01 W 80+ DS 03

Invermere TSA Predictive Ecosystem Mapping (PEM) Report
JMJ Holdings Inc. 208-507 Baker Street, Nelson BC, V1L 4J2 phone (250) 354-4913 fax (250) 354-1162
email [email protected] Page 23.
January 31, 2004.
The knowledge base allocates a map entity (site series or combination of site series) to a landscape facet/aspect/slope class combination. A complete list of map entities for the Invermere PEM can be found in Table 4. This forms the basis of the first step of running the PEM model after the compilation of the input layers (see Figure 5). In this way every 25 x 25 metre pixel of the Invermere TSA was initially allocated to a site series based on landscape shape and position. The targeted terrain mapping is then superimposed on the first run result of the raster PEM. Pixels within the bedrock and dry site classifications outlined in Table 3 are modified using the “second run” rule sets found within the knowledge tables. A complete set of second run rules can be found in Appendix II. An example of a second run rules can be found in Table 7.
Table 7. Second Run Materials Depth Mapping Corrections example IDFdm2 Depth Mapping Correction second run class + aspect + Fd leading sp + AW DS DT SP SS SH WE D w Y AW DS DS DT SP SS WE D w N AW DS DS DT SP SS WE D k DT DT DT DT SP SS WE R1 w Y AW/RO DS/RO DS/RO DS/RO DS/RO DS/RO WE R1 w N AW/RO DS/RO DT/RO DT/RO DT/RO DT/RO WE R1 k DT/RO DS/RO DT/RO DT/RO DT/RO DT/RO WE R2 w AW/RO DS/RO DS/RO DS/RO DS/RO DS/RO WE R2 k DT/RO DS/RO DT/RO DT/RO DT/RO DT/RO WE R3 w RO/AW RO/DS RO/DS RO/DS RO/DS RO/DS WE R3 k RO/DT RO/DT RO/DT RO/DT RO/DT RO/DT WE R w RO RO RO RO RO RO WE R k RO RO RO RO RO RO WE TD AW AW DS DS DS DS WE TM DT DT DT DT DT DT WE W WE WE WE WE WE WE WE
The allocation of landscape facet/aspect/slope combinations to map entity is determined subjectively using a combination of expert opinion and summarized site and terrain data from field data. It is recognized that the model makes predictions that reflect the resolution of the TRIM DEM and that there is ample variability in elevation on the ground that is below the resolution of the DEM. In order to account for this “micro” slope variability the PEM model allocates varying proportions of site series that can occur within a single modeled map entity. For example, in the IDFdm2 the 01 site series DT (FdPl – Pinegrass- Twinflower) is allocated to landscape facet/aspect/slope combinations that could also support one site series drier (03 DS, Fd-Snowberry-Balsamroot) in microtopographic landscape positions where hummocks up to 10 meters in elevation (which do not appear in the DEM), on their warm aspects, are more likely to exhibit the DS site series. This “proportioning” of the map entities is completed during the final run

Invermere TSA Predictive Ecosystem Mapping (PEM) Report
JMJ Holdings Inc. 208-507 Baker Street, Nelson BC, V1L 4J2 phone (250) 354-4913 fax (250) 354-1162
email [email protected] Page 24.
January 31, 2004.
of the PEM once the targeted materials mapping has been superimposed on the first run raster output. In this way on the ground landscape variability can be accounted for. The proportions used were determined by summarization of the transect data and field plot data by landscape facet/aspect/slope categories. The relative proportions of field plots, or proportion of line intercept transect occurring on a given category were determined and the proportions allocated using a combination of that information and expert opinion. Table 8 below gives an example of the proportioning rules for the IDFdm2. A complete set of proportioning rules can be found in Appendix V.
Table 8. Proportioning Rules for the IDFdm2 IDFdm2 RO AW DS DT SP SS SH BH AW/RO 0.38 0.62 DS/RO 0.38 0.5 0.12 DT/RO 0.38 0.12 0.5 RO/AW 0.62 0.38 RO/DS 0.62 0.3 0.08 RO/DT 0.62 0.08 0.3 RO 0.7 0.1 0.1 0.1 AW 1 DT 0.2 0.8 DS 0.8 0.2 SP 0.2 0.8 SS 0.2 0.7 0.1 WE 0.34 0.66

Invermere TSA Predictive Ecosystem Mapping (PEM) Report
JMJ Holdings Inc. 208-507 Baker Street, Nelson BC, V1L 4J2 phone (250) 354-4913 fax (250) 354-1162
email [email protected] Page 25.
January 31, 2004.
2.5 PEM Model Building Field Data Collection Field data is used in PEM model building and verification. It is a crucial component that helps develop knowledge tables and site series proportioning tables and to test the results of knowledge table map entity spatial allocations. There is abundant existing ecological data already collected within the Invermere TSA as a consequence of previous TEM and PEM mapping projects, however, only a portion of this data, collected since 1998, has accurate, GPS derived spatial locations. Plot data with GPS locations is the best data for developing and testing the model because site series classifications can be specifically related to landscape facet/aspect/slope class variables, as well as to targeted materials mapping variables. Transect data can be used to determine spatial variability in site series at a scale below the resolution of the DEM. Non-spatially explicit plot data, can also be used to develop knowledge bases through non-spatial comparison of site series classifications to plot site features and the landscape facet/aspect/slope class variables. Spatially explicit field data were collected as part of the Invermere PEM model during the 2003 field season. The data consists of randomly located transects and plots within the Timber Harvesting Land Base and stratified randomly located plots within the Non Timber Harvesting Land Base. The sampling designs used to direct data collection are described below.
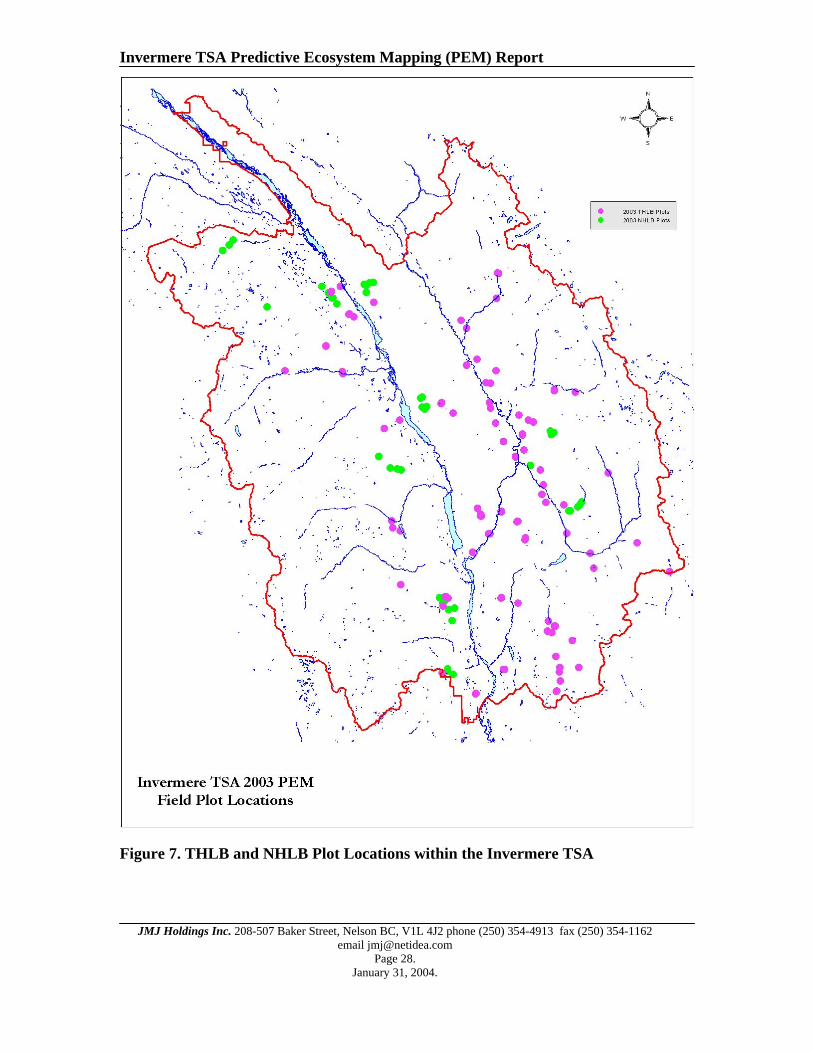
2.5.1 Field Data Collection Sampling Design The Timber Harvesting Landbase (THLB) portion of the PEM was supported by Slocan Radium Division and the Non Timber Harvesting Landbase (NHLB) portion of the PEM was supported by the Ministry of Sustainable Resource Management, Nelson under two separate contracts. Consequently, field sampling was divided between the two contracts. Figure 6 shows the extent of the timber and non-timber harvesting landbases. Figure 7 shows the location of both the THLB and NHLB plots within the Invermere TSA.
2.5.1.1 Timber Harvesting Landbase Within the timber harvesting land base three hundred random points were generated within one kilometer of TRIM road access. These formed the basis of potential transect start points. Forty of these points were sampled with 500 metre long line intercept transects and approximately 80 20 x 20 metre ground inspection plots (BC MOF & MOELP, 1998). The number of sample points was essentially determined by the amount of money available for the PEM project. Of those 40 points, sample selection was based availability and accessibility within a TRIM map sheet. From those forty points a random bearing was established and a 500 metre transect was initiated. Site series data using Braumandl and Curran’s (1992) classification was collected as line intercept distances by site series and structural stage (Ecosystems Working Group, 1998) along the transect. Each site series encountered along the transect was represented by a subjectively located sample plot best representing what is typical of the vegetation and site characteristics of that site series along the transect. Within the plot site, terrain and vegetation data was
Invermere TSA Predictive Ecosystem Mapping (PEM) Report
JMJ Holdings Inc. 208-507 Baker Street, Nelson BC, V1L 4J2 phone (250) 354-4913 fax (250) 354-1162
email [email protected] Page 26.
January 31, 2004.
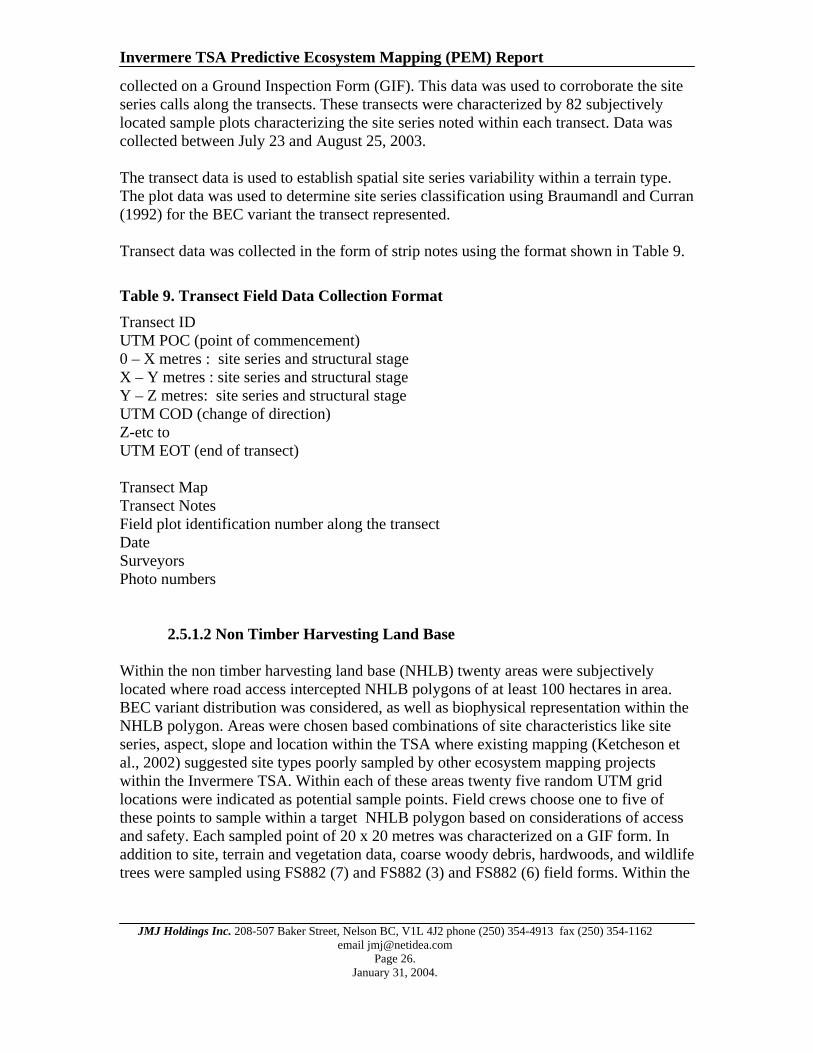
collected on a Ground Inspection Form (GIF). This data was used to corroborate the site series calls along the transects. These transects were characterized by 82 subjectively located sample plots characterizing the site series noted within each transect. Data was collected between July 23 and August 25, 2003. The transect data is used to establish spatial site series variability within a terrain type. The plot data was used to determine site series classification using Braumandl and Curran (1992) for the BEC variant the transect represented. Transect data was collected in the form of strip notes using the format shown in Table 9.
Table 9. Transect Field Data Collection Format Transect ID UTM POC (point of commencement) 0 – X metres : site series and structural stage X – Y metres : site series and structural stage Y – Z metres: site series and structural stage UTM COD (change of direction) Z-etc to UTM EOT (end of transect) Transect Map Transect Notes Field plot identification number along the transect Date Surveyors Photo numbers 2.5.1.2 Non Timber Harvesting Land Base Within the non timber harvesting land base (NHLB) twenty areas were subjectively located where road access intercepted NHLB polygons of at least 100 hectares in area. BEC variant distribution was considered, as well as biophysical representation within the NHLB polygon. Areas were chosen based combinations of site characteristics like site series, aspect, slope and location within the TSA where existing mapping (Ketcheson et al., 2002) suggested site types poorly sampled by other ecosystem mapping projects within the Invermere TSA. Within each of these areas twenty five random UTM grid locations were indicated as potential sample points. Field crews choose one to five of these points to sample within a target NHLB polygon based on considerations of access and safety. Each sampled point of 20 x 20 metres was characterized on a GIF form. In addition to site, terrain and vegetation data, coarse woody debris, hardwoods, and wildlife trees were sampled using FS882 (7) and FS882 (3) and FS882 (6) field forms. Within the

Invermere TSA Predictive Ecosystem Mapping (PEM) Report
JMJ Holdings Inc. 208-507 Baker Street, Nelson BC, V1L 4J2 phone (250) 354-4913 fax (250) 354-1162
email [email protected] Page 27.
January 31, 2004.
non timber harvesting land base 50 plots were sampled between September 25 and 29, 2003. This data can be found in Appendix IIIb.
Figure 6. Timber and Non-Timber Harvesting Landbases of the Invermere TSA
Invermere TSA Predictive Ecosystem Mapping (PEM) Report
JMJ Holdings Inc. 208-507 Baker Street, Nelson BC, V1L 4J2 phone (250) 354-4913 fax (250) 354-1162
email [email protected] Page 28.
January 31, 2004.
Figure 7. THLB and NHLB Plot Locations within the Invermere TSA

Invermere TSA Predictive Ecosystem Mapping (PEM) Report
JMJ Holdings Inc. 208-507 Baker Street, Nelson BC, V1L 4J2 phone (250) 354-4913 fax (250) 354-1162
email [email protected] Page 29.
January 31, 2004.
2.5.2 Field Sampling Standards Plot data was collected on Ground Inspection Forms and FS882 (3), (6) and (7) Forms following the standards outlined in “Describing Ecosystems in the Field” (BC MOF & MOELP, 1998). Ecological classification standards used for field classification of sites are according to Braumandl and Curran. (1992) and the terrain classification used in the field is that of Howes and Kenk (1997). BEC variant mapping used for field sampling was the coverage used for the East Kootenay PEM (Ketcheson et al, 2002). Field data was then reclassified to match BEC variant line work submitted by Braumandl and Dykstra (2003).
2.5.3 Field Data Internal Quality Control Plot cards and transect notes were checked at the end of each field day to make sure all the necessary information was included. The crews re-visited the plot to obtain missing data if internal review indicated that any portion of the data were lacking. Plots and transects were located on each crew’s field map in the field and on the project master map each evening. Plot cards were checked again in the office before data entry into the VENUS 4.2 data base. Edits were made via consultation with standards manuals and the field personnel who collected the data. Transect notes were also reviewed in the office before entry into an EXCEL spreadsheet, and any edits were made or clarification obtained from the appropriate field personnel. Site series classifications were double checked in the office against Braumandl and Curran’s 1992 classification.
Invermere TSA Predictive Ecosystem Mapping (PEM) Report
JMJ Holdings Inc. 208-507 Baker Street, Nelson BC, V1L 4J2 phone (250) 354-4913 fax (250) 354-1162
email [email protected] Page 30.
January 31, 2004.
2.5.4 Field Data Entry GIF plot data was entered into the VENUS 4.2 data base and transect data was entered into EXCEL spreadsheets following the format in Table 7. This data can be found in Appendix III. VENUS plot data was summarized in EXCEL for use with spatial data to test the output of the PEM model. This data can be found in Appendix III. Field data entry was checked against field cards to correct any entry errors. Any questionable codes were verified with the appropriate field personnel.
2.5.5 Field Data Synthesis Field data collected in 2003 were summarized based on final BEC and site series classification as EXCEL spreadsheets. They were combined with already existing plot data from PEM (Canal Flats PEM, Ketcheson et al 2000), TEM (Brewer Creek, Kernaghan et al., 1997; Stoddart Creek, Marcoux, 1997; Slocan Operating Area FLA18979, Keranaghan et al., 2001; Premier Diorite, Kernaghan et al., 2000; Premier Lake, Kernaghan et al., 2003; TFL 14, Kernaghan et al., 1999) and SIBEC activities within the Invermere TSA (Invermere TSA SIBEC, Ketcheson M.V., 2003; TFL14 SIBEC, Kernaghan et al, 2001) making a total of 2119 sample plots. Plots were summarized by BEC variant, site series, soil moisture regime (SMR), soil nutrient regime (SNR), slope, aspect, and terrain classification. Plot with UTM coordinates (Canal Flats PEM, Invermere TSA 2003 SIBEC, and Premier Lake TEM) were allocated spatially to LMES landscape facets. The frequency of occurrence of SMR, SNR, slope, aspect and terrain were summarized by BEC variant and site series for all existing and newly collected field data. The range of variables within each site series was noted and a subjective determination of the relationship between LMES landscape facets, aspect, slope and targeted materials was established and documented. Field data with GPS locations were summarized by BEC variant and site series relative to the LMES landscape facet classification, aspect, slope class and targeted materials mapping. The frequency of occurrence of each combination of variables, by site series, were determined and first draft of the site series allocations were entered into the knowledge tables. The knowledge tables were then run against the landscape facet/aspect/slope class spatial and first run site series determined. This result was compared to in-house field data and the knowledge tables modified to improve the model’s fit to the field data. Once the internal fit of the model to the field data was deemed appropriate the second run of the PEM model was undertaken where the targeted terrain mapping was used to modify the results of the first run.

Invermere TSA Predictive Ecosystem Mapping (PEM) Report
JMJ Holdings Inc. 208-507 Baker Street, Nelson BC, V1L 4J2 phone (250) 354-4913 fax (250) 354-1162
email [email protected] Page 31.
January 31, 2004.
2.5.6 Internal Quality Control As documented in the previous sections, field data were reviewed at the end of each field day, before data entry and after data entry. Knowledge tables were reviewed by an internal third party for errors or inconsistencies and approved by M. Ketcheson R.P.Bio. PEM model output results were also reviewed by in internal third party to insure that they appropriately reflected site series distribution on the ground. In-house field data was compared to the output of the final model. The output of the model was approved by M. Ketcheson R.P.Bio.
2.5.7 External Quality Control An independent assessment of map accuracy was completed by Timberline Forest Inventory Consultants, Prince George, BC. A copy of this report (Timberline 2003) can be found in Appendix XI. The results of this assessment are reported in Section 3.1.
2.5.8 Structural Stage Model The structural stage model for the Invermere TSA was completed using the localized BEC mapping and forest cover data. The structural stage classification used follows the standards set for TEM (Ecosystems Working Group, 1998) There is a seven class structural stage model used. The structural stage classes can be found in Table 9 below. A series of queries were developed for each BEC zone, utilizing non-forest and stand information from the forest cover to target various structural stages. A full set of queries can be found in Appendix VI. An example query can be found in Table 10. The queries were run, and the relevant structural stages were entered into an attribute called ‘STRUC’ in the database. An Arc/Info coverage was then created, called ‘TSS_INV’. This is a separate coverage from the PEM site series coverage. Structural stage data is based on forest cover information and can only be considered as reliable as the forest cover information.

Invermere TSA Predictive Ecosystem Mapping (PEM) Report
JMJ Holdings Inc. 208-507 Baker Street, Nelson BC, V1L 4J2 phone (250) 354-4913 fax (250) 354-1162
email [email protected] Page 32.
January 31, 2004.
Table 10. Structural Stages Modeled in the Invermere TSA Structural Stage Code Description (Ecosystems Working Group
1998) 1 Sparse/bryoid 1b Bryoid 2 Herb 3 Shrub/herb 3a Low Shrub (<2 m) 3b Tall Shrub (2-10 m) 4 Pole Sapling ( treed <10 m) 5 Young Forest 6 Mature Forest 7 Old Forest
Table 11. An Example of a Portion of a Structural Stage Knowledge Table Forest Cover Classification Subzone Site Series For Cov age class ITG ht class non prod type Structural stage number IDFdm2 all NA NA NA Ice NA 0
all NA NA NA Alpine herb 2 all NA NA NA rock Sparse/bryoid 1 all NA NA NA Gravel Pit 0 all NA NA NA sand Sparse/bryoid 1 all NA NA NA clay bank Sparse/bryoid 1 all NA NA NA Non Prod Forest Shrub/herb 3 all NA NA NA Non Prod Burn Shrub/herb 3 all NA NA NA Lake 0 all NA NA NA Gravel Bar Sparse bryoid 1 all NA NA NA River 0 all NA NA NA Mud Flat Sparse bryoid 1 all NA NA NA Swamp herb 2 all NA NA NA Clearing 0 all NA NA NA Roads 0 all NA NA NA Urban 0 all NA NA NA Hayfield herb 2 all NA NA NA Meadow herb 2 all NA NA NA Open Range herb 2 all NA NA NA Non Prob Brush shrub dominated 3 all 1 1 shrub dominated 3 all 1 >1 pole sapling 4 all 2 >1 pole sapling 4 all 3 >1 pole sapling 4 all 4 >1 young forest 5 all 5 >1 young forest 5 all 6 >1 young forest 5 all 7 >1 mature forest 6 all 8 >1 old forest 7 all 9 >1 old forest 7
*Group A and B BEC variants are classified according to the predominant natural disturbance regime indicated for that BEC unit. A list of group A and B BEC variants can be found in Ecosystems Working Group (1998) TEM mapping standards

Invermere TSA Predictive Ecosystem Mapping (PEM) Report
JMJ Holdings Inc. 208-507 Baker Street, Nelson BC, V1L 4J2 phone (250) 354-4913 fax (250) 354-1162
email [email protected] Page 33.
January 31, 2004.
2.6 Spatial and Database Formats The final format of the spatial and data base files for the Invermere PEM site series and structural stage model follows the specifications for format and documentation as found in the PEM digital data standards document (PEM Data Committee 2000). Spatial and database files can be found in Appendix IX and the appropriate metadata files located in Appendix VIII. 2.7 Internal Quality Control
2.7.1 Meidinger Approach The knowledge tables and model results were reviewed after each run of the model. We used Meidinger’s 2003 protocol for guidance and for determinations of model goodness of fit to our field plot data. Knowledge tables and results were reviewed by Maureen Ketcheson after each model run. Revisions to the knowledge tables and second run rule sets were done by Maureen Ketcheson. Final model fit determinations were undertaken and reported as confusion matrices and as confidence intervals around the means for the IDFdm2, MSdk, ICHmk1, ESSFdk1 and PPdh2. These statistics are reported for the final model, but were calculated after each iteration of the model. Spatial and data bases were reviewed internally for errors after each run of the model. Tom Dool reviewed the final version of the spatial and data bases to insure that they met Provincial PEM data warehouse standards.
2.7.2 Wilson Approach An independent assessment of PEM map reliability and approach to mapping was conducted by Wilson (2004) after the completion of the final PEM product submitted for accuracy assessment (Timberline 2003). Wilson’s approach to more efficient utilization of field data during the model building process involves determination of the “experience” values which assess the proportion of the variability of the land base sampled by the field data. The “experience” map of the Invermere PEM was generated based on Wilson’s analysis, that map can be found in Appendix X. The final run of the PEM model was depicted in terms of Wilson’s calculated “confidence” of the site series being greater or less than 75%. This map can also be found in Appendix X. These values were used to calculate a kappa statistic, which measured the probability that the result of the model is better than that which would be predicted simply by chance. The results of his analysis are reported in Section 3.1.3 below.

Invermere TSA Predictive Ecosystem Mapping (PEM) Report
JMJ Holdings Inc. 208-507 Baker Street, Nelson BC, V1L 4J2 phone (250) 354-4913 fax (250) 354-1162
email [email protected] Page 34.
January 31, 2004.
3.0 Results 3.1 PEM Model Accuracy and Fit to Field Data
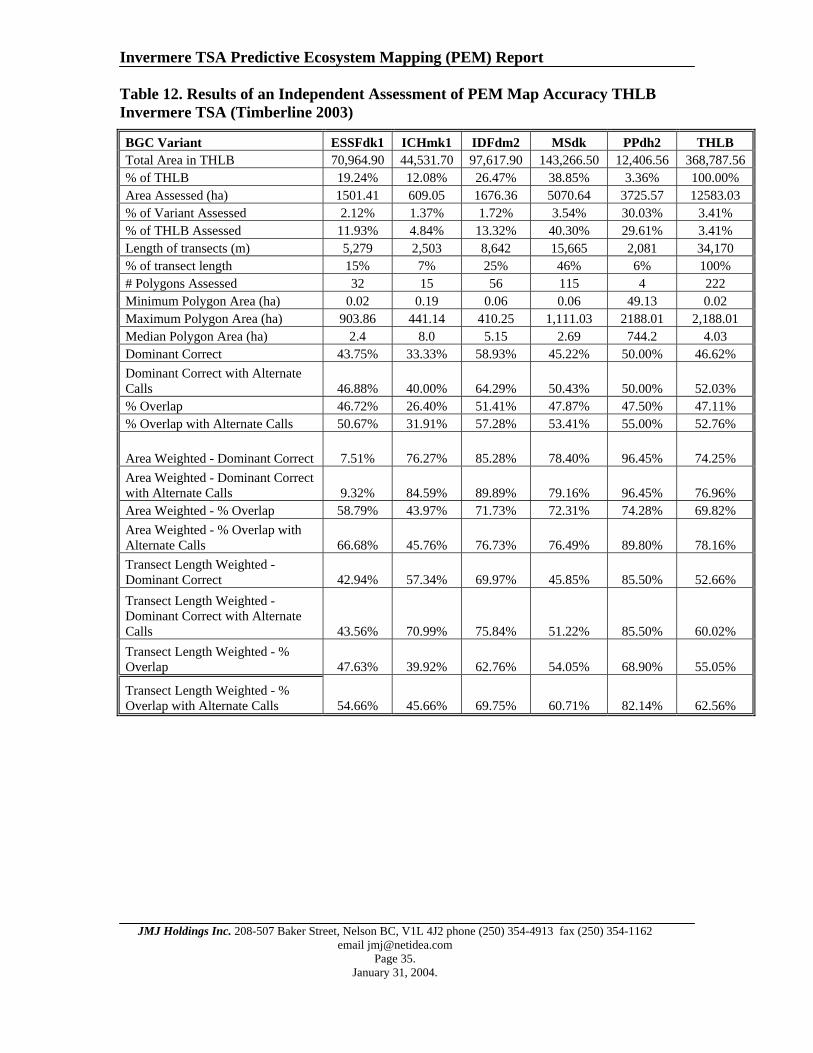
3.1.1 Independent Assessment of Model Accuracy in the THLB Using Meidinger 2003 Protocol An independent assessment of PEM map accuracy within the THLB only was undertaken by Timberline Forest Inventory Consultants, Prince George. Dan Bernier (personal communication) provided us with the information found in Table 12 below. Based on this assessment of model accuracy, using the Meidinger (2003) protocol, it was recommended that the Invermere THLB portion of the PEM was suitable for use in Timber Supply Review activities. However, for a complete discussion of the results of the independent assessment of the Invermere PEM model’s accuracy please refer to Timberline’s final report (Timberline, 2003). The independent assessment of accuracy refers to the THLB within ESSFdk1, ICHmk1, MSdk, IDFdm2 and PPdh2 BEC variants only. These are the only BEC units assessed by that project.
Invermere TSA Predictive Ecosystem Mapping (PEM) Report
JMJ Holdings Inc. 208-507 Baker Street, Nelson BC, V1L 4J2 phone (250) 354-4913 fax (250) 354-1162
email [email protected] Page 35.
January 31, 2004.
Table 12. Results of an Independent Assessment of PEM Map Accuracy THLB Invermere TSA (Timberline 2003)
BGC Variant ESSFdk1 ICHmk1 IDFdm2 MSdk PPdh2 THLB Total Area in THLB 70,964.90 44,531.70 97,617.90 143,266.50 12,406.56 368,787.56 % of THLB 19.24% 12.08% 26.47% 38.85% 3.36% 100.00% Area Assessed (ha) 1501.41 609.05 1676.36 5070.64 3725.57 12583.03 % of Variant Assessed 2.12% 1.37% 1.72% 3.54% 30.03% 3.41% % of THLB Assessed 11.93% 4.84% 13.32% 40.30% 29.61% 3.41% Length of transects (m) 5,279 2,503 8,642 15,665 2,081 34,170 % of transect length 15% 7% 25% 46% 6% 100% # Polygons Assessed 32 15 56 115 4 222 Minimum Polygon Area (ha) 0.02 0.19 0.06 0.06 49.13 0.02 Maximum Polygon Area (ha) 903.86 441.14 410.25 1,111.03 2188.01 2,188.01 Median Polygon Area (ha) 2.4 8.0 5.15 2.69 744.2 4.03 Dominant Correct 43.75% 33.33% 58.93% 45.22% 50.00% 46.62% Dominant Correct with Alternate Calls 46.88% 40.00% 64.29% 50.43% 50.00% 52.03% % Overlap 46.72% 26.40% 51.41% 47.87% 47.50% 47.11% % Overlap with Alternate Calls 50.67% 31.91% 57.28% 53.41% 55.00% 52.76%
Area Weighted - Dominant Correct 7.51% 76.27% 85.28% 78.40% 96.45% 74.25% Area Weighted - Dominant Correct with Alternate Calls 9.32% 84.59% 89.89% 79.16% 96.45% 76.96% Area Weighted - % Overlap 58.79% 43.97% 71.73% 72.31% 74.28% 69.82% Area Weighted - % Overlap with Alternate Calls 66.68% 45.76% 76.73% 76.49% 89.80% 78.16% Transect Length Weighted - Dominant Correct 42.94% 57.34% 69.97% 45.85% 85.50% 52.66% Transect Length Weighted - Dominant Correct with Alternate Calls 43.56% 70.99% 75.84% 51.22% 85.50% 60.02% Transect Length Weighted - % Overlap 47.63% 39.92% 62.76% 54.05% 68.90% 55.05%
Transect Length Weighted - % Overlap with Alternate Calls 54.66% 45.66% 69.75% 60.71% 82.14% 62.56%
Invermere TSA Predictive Ecosystem Mapping (PEM) Report
JMJ Holdings Inc. 208-507 Baker Street, Nelson BC, V1L 4J2 phone (250) 354-4913 fax (250) 354-1162
email [email protected] Page 36.
January 31, 2004.
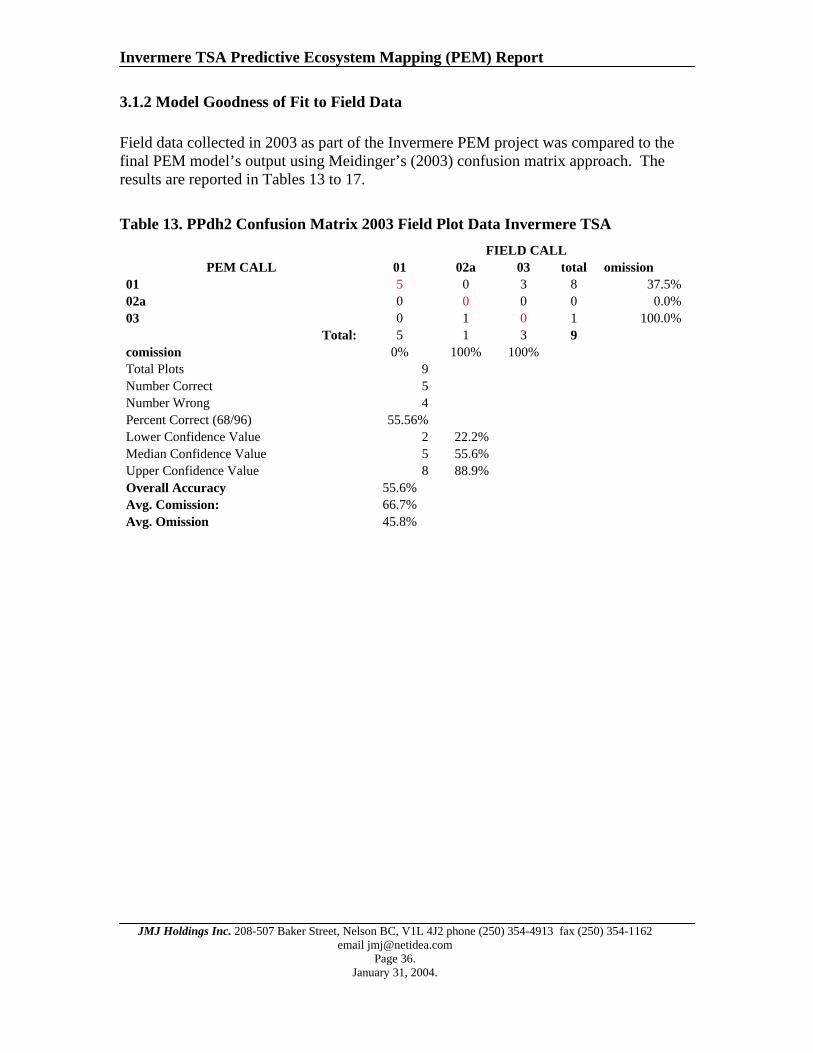
3.1.2 Model Goodness of Fit to Field Data Field data collected in 2003 as part of the Invermere PEM project was compared to the final PEM model’s output using Meidinger’s (2003) confusion matrix approach. The results are reported in Tables 13 to 17.
Table 13. PPdh2 Confusion Matrix 2003 Field Plot Data Invermere TSA FIELD CALL
PEM CALL 01 02a 03 total omission 01 5 0 3 8 37.5% 02a 0 0 0 0 0.0% 03 0 1 0 1 100.0%
Total: 5 1 3 9 comission 0% 100% 100% Total Plots 9 Number Correct 5 Number Wrong 4 Percent Correct (68/96) 55.56% Lower Confidence Value 2 22.2% Median Confidence Value 5 55.6% Upper Confidence Value 8 88.9% Overall Accuracy 55.6% Avg. Comission: 66.7% Avg. Omission 45.8%

Invermere TSA Predictive Ecosystem Mapping (PEM) Report
JMJ Holdings Inc. 208-507 Baker Street, Nelson BC, V1L 4J2 phone (250) 354-4913 fax (250) 354-1162
email [email protected] Page 37.
January 31, 2004.
Table 14. IDFdm2 Confusion Matrix 2003 Field Plot Data Invermere TSA
FIELD CALL
PEM CALL 01 02 03 04 05 99 total omission 01 8.3 2.2 1.3 0.6 0.8 0.1 13.3 36.8%
02 0.0 0.0 0.0 0.0 0.0 0.0 0.0 0.0% 03 3.3 1.6 2.3 0.0 0.2 0.3 7.7 70.1% 04 0.0 0.0 0.0 2.4 0.0 0.0 2.4 0.0% 05 0.0 0.0 0.0 0.0 0.0 0.0 0.0 0% 99 0.4 1.2 0.4 0.0 0.0 0.6 2.6 76%
Total: 12.0 5.0 4.0 3.0 1.0 1 26 comission 30.7% 100.0% 42.5% 20.0% 100.0% 38.0% Total Plots 26 Number Correct 14 Number Wrong 12.36 Percent Correct (68/96) 52.46% Lower Confidence Value 9 34.6% Median Confidence Value 14 53.8% Upper Confidence Value 19 73.1% Overall Accuracy 52.5% Avg. Comission: 55.2% Avg. Omission 30.5%
Table 15. ICHmk1 Confusion Matrix 2003 Field Plot Data Invermere TSA FIELD CALL
PEM CALL 01 02 03 04 05 06 07 08 total omission
01 2.5 0 0.4 3 1 0.0 0.0 0 6.5 61.5% 02 0.0 0 0.4 0 0 0.0 0.0 0 0.4 100.0% 03 0.0 0 1.6 0 0 0.0 0.0 0 1.6 0.0%
04 1.0 0 1.6 3.1 0 0.0 0.0 0 5.7 45.6% 05 2.5 0 0 1.9 2.4 0.0 0.0 0 6.8 64.7% 06 1.0 0 0 0 0 0.0 0.0 0 1 100% 07 0.0 0 0 0 0 0.0 0.0 1 1 100% 08 0.0 0 0 0 0 0 0.0 0 0 0%
Total: 7.0 0.0 4.0 8.0 3.0 0.0 0.0 1 23 comission 64.3% 0.0% 60.0% 61.3% 20.0% 0.0% 0.0% 0.0% Total Plots 23 Number Correct 10 Number Wrong 13.4 Percent Correct (142/165) 41.74% Lower Confidence Value 5 21.7% Median Confidence Value 10 43.5% Upper Confidence Value 14 60.9% Overall Accuracy 41.7%

Invermere TSA Predictive Ecosystem Mapping (PEM) Report
JMJ Holdings Inc. 208-507 Baker Street, Nelson BC, V1L 4J2 phone (250) 354-4913 fax (250) 354-1162
email [email protected] Page 38.
January 31, 2004.
Avg. Comission: 25.7% Avg. Omission 59.0%
Table 16. MSdk Confusion Matrix 2003 Field Plot Data Invermere TSA PEM CALL 01 02 03 04 05 06 99 total omission 01 12.7 0.6 6.7 8.2 5.6 0.3 0 34.05 60.9% 02 0.0 1.0 1.7 0.0 0.6 0.0 0 3.34 70.1% 03 0.0 0.0 4.1 1.0 0.0 0.0 0 5.1 19.6% 04 4.8 0.4 3.7 5.4 2.4 0.0 0 16.75 67.6% 05 3.5 0.0 0.0 0.0 6.0 0.7 0 10.2 41.2% 06 0.0 0.0 0.0 0.0 0.0 0.0 0 0 0.0% 99 0.0 0.0 2.8 0.4 0.4 0.0 0 3.6 100.0%
Total: 21.00 2.00 19.00 15.00 15.00 1.00 0.00 73 comission 39.5% 50.0% 54.6% 61.3% 57.5% 0.0% 0.0% Overall Accuracy 38.7% Avg. Comission: 37.6% Avg. Omission 51.3% Summary Total Plots 73 Number Correct 29 Number Wrong 44 Percent Correct (142/165) 40.03% Lower Confidence Value 21 28.8% Median Confidence Value 29 39.7% Upper Confidence Value 37 50.7%
Table 17. ESSFdk1 Confusion Matrix 2003 Field Plot Data Invermere TSA
FIELD CALL PEM CALL 01 02 03 04 05 06 total omission 01 1.0 0.0 0.0 0.0 0.9 0.0 1.9 47.4% 02 0.0 0.0 0.0 0.0 0.0 0.0 0 0.0% 03 0.4 0.2 1.2 1.8 0.4 0.0 4 70.0% 04 3.6 0.8 0.8 7.2 1.9 0.0 14.3 49.7% 05 0.0 0.0 0.0 0.0 1.5 0.0 1.5 0.0% 06 0.0 0.0 0.0 0.0 0.3 0.0 0.3 100.0%
Total: 5.0 1.0 2.0 9.0 5.0 0.0 22 comission 80.0% 0.0% 40.0% 20.0% 70.0% 0.0% Overall Accuracy 49.5% Avg. Comission: 35.0% Avg. Omission 44.5% Summary

Invermere TSA Predictive Ecosystem Mapping (PEM) Report
JMJ Holdings Inc. 208-507 Baker Street, Nelson BC, V1L 4J2 phone (250) 354-4913 fax (250) 354-1162
email [email protected] Page 39.
January 31, 2004.
Total Plots 22 Number Correct 11 Number Wrong 11.1 Percent Correct (142/165) 49.55% Lower Confidence Value 6 27.3% Median Confidence Value 11 50.0% Upper Confidence Value 15 68.2%
3.1.3 Wilson Approach to Assessment of Model Reliability An independent assessment of PEM map reliability was undertaken by Dr. Steve Wilson, Ecological Research using the PEM result, knowledge bases and 2003 field data. His report can be found in Appendix X. In general he found the output of the Invermere model did not meet the level considered acceptable as measured by the Kappa calculation. He suggests an alternative approach to the utilization of field plot data in PEM model development which could greatly improve the output of the model. 3.2 PEM Model Result
3.2.1 Map Entity Area by BEC Variant by THLB, NHLB and TSA The PEM model predicted the following distribution of site series. The area and percentage of area by within the THLB and NTHLB by BEC variant and over the entire project TSA is reported in Table 18. The spatial and data base depiction of the PEM can be found in Appendix IX.

Invermere TSA Predictive Ecosystem Mapping (PEM) Report
JMJ Holdings Inc. 208-507 Baker Street, Nelson BC, V1L 4J2 phone (250) 354-4913 fax (250) 354-1162
email [email protected] Page 40.
January 31, 2004.
Table 18. Area of Subzones and Site Series in the Invermere TSA Mapped by the PEM Model
Timber Harvesting Landbase (THLB)
Non-Timber Harvesting
Landbase (NHLB) Entire Invermere TSA
BEC Zone
Site Series #
Site Series Code
Area hectares
% of Subzone
Area hectares
% of Subzone
Area hectares % of TSA
AT 01 AW 18,549.3 16.13% 18,549.3 1.67% AT 01/99 AW/RO 340.6 0.30% 340.6 0.03% AT 02 SL 18,303.0 15.92% 18,303.0 1.64% AT 02/99 SL/RO 502.7 0.44% 502.7 0.05% AT 03 BP 1,123.5 0.98% 1,123.5 0.10% AT 03/99 BP/RO 9.1 0.01% 9.1 0.00% AT 04 KR 37,965.1 33.02% 37,965.1 3.41% AT 05 WE 7.1 0.01% 7.1 0.00% AT 77 AC 15,222.3 13.24% 15,222.3 1.37% AT 88 AR 817.5 0.71% 817.5 0.07% AT 91 LA 482.1 0.42% 482.1 0.04% AT 92 OW 12.6 0.01% 12.6 0.00% AT 93 PD 0.3 0.00% 0.3 0.00% AT 95 GL 10,493.7 9.13% 10,493.7 0.94% AT 99 RO 2,702.4 2.35% 2,702.4 0.24% AT 99/01 RO/AW 3,140.5 2.73% 3,140.5 0.28% AT 99/02 RO/SL 5,235.4 4.55% 5,235.4 0.47% AT 99/03 RO/BP 76.2 0.07% 76.2 0.01% AT Total 114,983.3 100.00% 114,983.3 10.33% ESSFdk1 01 FA 4,552.7 6.42% 24,378.8 12.30% 28,931.5 2.60% ESSFdk1 01/99 FA/RO 56.9 0.08% 759.1 0.38% 816.0 0.07% ESSFdk1 02 DM 4,071.6 5.74% 5,931.1 2.99% 10,002.7 0.90% ESSFdk1 02/99 DM/RO 320.7 0.45% 446.9 0.23% 767.6 0.07% ESSFdk1 03 FG 0.7 0.00% 682.6 0.34% 683.3 0.06% ESSFdk1 03/99 FG/RO 2.1 0.00% 1,794.4 0.90% 1,796.4 0.16% ESSFdk1 04 FS 199.2 0.28% 70,610.3 35.61% 70,809.5 6.36% ESSFdk1 05 FM 33.4 0.05% 10,992.2 5.54% 11,025.6 0.99% ESSFdk1 05/99 FM/RO 0.9 0.00% 343.0 0.17% 343.9 0.03% ESSFdk1 07 WS 73.3 0.10% 156.7 0.08% 230.1 0.02% ESSFdk1 43 XF 52,774.8 74.37% 51,154.0 25.80% 103,928.8 9.33% ESSFdk1 43/99 XF/RO 1,087.0 1.53% 12.5 0.01% 1,099.5 0.10% ESSFdk1 56 XM 6,279.0 8.85% 182.3 0.09% 6,461.3 0.58% ESSFdk1 56/99 XM/RO 23.8 0.03% 0.4 0.00% 24.1 0.00% ESSFdk1 77 AC 543.9 0.77% 11,051.5 5.57% 11,595.4 1.04% ESSFdk1 78 AS 373.7 0.53% 13,138.9 6.63% 13,512.6 1.21% ESSFdk1 87 AW 64.9 0.09% 523.3 0.26% 588.2 0.05% ESSFdk1 88 AR 122.7 0.17% 983.9 0.50% 1,106.6 0.10% ESSFdk1 90 GB 3.4 0.00% 4.1 0.00% 7.4 0.00% ESSFdk1 91 LA 20.1 0.03% 127.4 0.06% 147.5 0.01% ESSFdk1 92 OW 0.9 0.00% 4.0 0.00% 4.9 0.00% ESSFdk1 93 PD 0.00% 0.2 0.00% 0.2 0.00%

Invermere TSA Predictive Ecosystem Mapping (PEM) Report
JMJ Holdings Inc. 208-507 Baker Street, Nelson BC, V1L 4J2 phone (250) 354-4913 fax (250) 354-1162
email [email protected] Page 41.
January 31, 2004.
ESSFdk1 94 RI 39.3 0.06% 23.5 0.01% 62.8 0.01% ESSFdk1 99 RO 231.0 0.33% 4,363.7 2.20% 4,594.7 0.41% ESSFdk1 99/01 RO/FA 5.4 0.01% 232.8 0.12% 238.3 0.02% ESSFdk1 99/02 RO/DM 3.1 0.00% 90.9 0.05% 94.0 0.01% ESSFdk1 99/03 RO/FG 0.0 0.00% 171.3 0.09% 171.3 0.02% ESSFdk1 99/05 RO/FM 0.1 0.00% 117.7 0.06% 117.8 0.01% ESSFdk1 99/43 RO/XF 74.5 0.11% 1.4 0.00% 75.9 0.01% ESSFdk1 99/56 RO/XM 5.1 0.01% 0.1 0.00% 5.2 0.00% ESSFdk1 Total 70,964.4 26.36% 198,278.7 73.64% 269,243.1 24.18% ESSFdk2 01 FP 3,451.9 33.23% 4,227.3 13.07% 7,679.2 0.69% ESSFdk2 02 FG 167.0 1.61% 1,493.0 4.62% 1,660.0 0.15% ESSFdk2 02/99 FG/RO 7.2 0.07% 2,518.7 7.79% 2,525.8 0.23% ESSFdk2 03 FV 3,909.4 37.63% 10,508.1 32.49% 14,417.5 1.29% ESSFdk2 03/99 FV/RO 37.5 0.36% 2,839.0 8.78% 2,876.4 0.26% ESSFdk2 04 FH 2,374.8 22.86% 2,062.4 6.38% 4,437.2 0.40% ESSFdk2 04/99 FH/RO 5.5 0.05% 190.5 0.59% 196.0 0.02% ESSFdk2 05/06 FS/WE 46.7 0.45% 19.7 0.06% 66.4 0.01% ESSFdk2 06 WE 120.2 1.16% 84.6 0.26% 204.7 0.02% ESSFdk2 77 AC 168.3 1.62% 6,769.9 20.93% 6,938.2 0.62% ESSFdk2 88 AR 44.7 0.43% 402.0 1.24% 446.7 0.04% ESSFdk2 90 GB 6.1 0.06% 22.1 0.07% 28.2 0.00% ESSFdk2 91 LA 1.0 0.01% 51.9 0.16% 52.9 0.00% ESSFdk2 92 OW 0.3 0.00% 1.3 0.00% 1.6 0.00% ESSFdk2 93 PD 0.1 0.00% 0.00% 0.1 0.00% ESSFdk2 94 RI 21.2 0.20% 6.0 0.02% 27.1 0.00% ESSFdk2 95 GL 0.00% 4.8 0.01% 4.8 0.00% ESSFdk2 96 RE 0.1 0.00% 0.1 0.00% ESSFdk2 99 RO 27.3 0.26% 658.6 2.04% 685.9 0.06% ESSFdk2 99/01 RO/FS 0.00% 0.6 0.00% 0.6 0.00% ESSFdk2 99/02 RO/FG 0.00% 250.3 0.77% 250.3 0.02% ESSFdk2 99/03 RO/FV 0.2 0.00% 132.4 0.41% 132.6 0.01% ESSFdk2 99/04 RO/FH 0.00% 96.2 0.30% 96.2 0.01% ESSFdk2 Total 10,389.3 24.31% 32,339.3 75.69% 42,728.6 3.84% ESSFdku 01 EM 1,145.1 49.34% 67,679.1 25.90% 68,824.1 6.18% ESSFdku 01/02 EM/AW 2.2 0.10% 169.3 0.06% 171.5 0.02% ESSFdku 02 AW 256.6 11.05% 13,310.9 5.09% 13,567.4 1.22% ESSFdku 02/99 AW/RO 70.5 3.04% 8,508.5 3.26% 8,579.0 0.77% ESSFdku 03 WF 315.3 13.59% 25,624.5 9.80% 25,939.8 2.33% ESSFdku 03/99 WF/RO 27.5 1.19% 5,802.2 2.22% 5,829.7 0.52% ESSFdku 04 YW 110.7 4.77% 21,550.7 8.25% 21,661.4 1.95% ESSFdku 05 LM 295.7 12.74% 11,201.3 4.29% 11,497.0 1.03% ESSFdku 06 FH 3.6 0.15% 414.7 0.16% 418.3 0.04% ESSFdku 07 WE 0.3 0.01% 256.0 0.10% 256.2 0.02% ESSFdku 08 DV 40.1 1.73% 2,523.8 0.97% 2,563.9 0.23% ESSFdku 77 AC 17.8 0.77% 49,587.8 18.97% 49,605.6 4.45% ESSFdku 88 AR 9.0 0.39% 4,602.5 1.76% 4,611.5 0.41% ESSFdku 91 LA 0.3 0.01% 1,241.9 0.48% 1,242.2 0.11% ESSFdku 92 OW 0.00% 42.1 0.02% 42.1 0.00%

Invermere TSA Predictive Ecosystem Mapping (PEM) Report
JMJ Holdings Inc. 208-507 Baker Street, Nelson BC, V1L 4J2 phone (250) 354-4913 fax (250) 354-1162
email [email protected] Page 42.
January 31, 2004.
ESSFdku 93 PD 0.00% 2.4 0.00% 2.4 0.00% ESSFdku 95 GL 0.00% 667.0 0.26% 667.0 0.06% ESSFdku 99 RO 18.1 0.78% 10,614.2 4.06% 10,632.3 0.95% ESSFdku 99/02 RO/AW 5.0 0.22% 24,314.8 9.30% 24,319.9 2.18% ESSFdku 99/03 RO/WF 3.1 0.13% 13,232.1 5.06% 13,235.2 1.19% ESSFdku Total 2,320.9 0.88% 261,345.7 99.12% 263,666.6 23.68% ESSFwm 01 FA 363.8 34.03% 340.8 23.83% 704.6 0.06% ESSFwm 02 FR 101.4 9.49% 208.1 14.55% 309.5 0.03% ESSFwm 02/99 FR/RO 0.00% 78.2 5.47% 78.2 0.01% ESSFwm 03 RA 237.1 22.18% 293.7 20.53% 530.8 0.05% ESSFwm 04 FQ 345.5 32.32% 183.6 12.84% 529.1 0.05% ESSFwm 77 AC 14.1 1.32% 266.5 18.63% 280.6 0.03% ESSFwm 88 AR 4.4 0.41% 24.3 1.70% 28.7 0.00% ESSFwm 90 GB 0.9 0.09% 1.1 0.08% 2.1 0.00% ESSFwm 94 RI 0.7 0.06% 0.00% 0.7 0.00% ESSFwm 99 RO 0.9 0.08% 13.3 0.93% 14.1 0.00% ESSFwm 99/02 RO/FR 0.00% 20.9 1.46% 20.9 0.00% ESSFwm Total 1,068.9 42.77% 1,430.4 57.23% 2,499.3 0.22% ESSFwmu 01 EM 14.0 41.16% 679.1 38.13% 693.1 0.06% ESSFwmu 01/02 EM/AW 0.00% 0.4 0.02% 0.4 0.00% ESSFwmu 02 AW 0.4 1.12% 63.7 3.58% 64.1 0.01% ESSFwmu 02/99 AW/RO 0.00% 67.6 3.79% 67.6 0.01% ESSFwmu 03 WF 2.8 8.38% 72.8 4.09% 75.6 0.01% ESSFwmu 03/99 WF/RO 0.00% 14.7 0.82% 14.7 0.00% ESSFwmu 04 YW 15.6 45.90% 236.8 13.30% 252.4 0.02% ESSFwmu 05 LM 1.2 3.45% 30.4 1.71% 31.6 0.00% ESSFwmu 06 FH 0.00% 0.1 0.01% 0.1 0.00% ESSFwmu 08 DV 0.00% 21.3 1.19% 21.3 0.00% ESSFwmu 77 AC 0.00% 460.1 25.83% 460.1 0.04% ESSFwmu 88 AR 0.00% 21.2 1.19% 21.2 0.00% ESSFwmu 91 LA 0.00% 3.0 0.17% 3.0 0.00% ESSFwmu 92 OW 0.00% 0.1 0.00% 0.1 0.00% ESSFwmu 95 GL 0.00% 1.4 0.08% 1.4 0.00% ESSFwmu 99 RO 0.00% 1.7 0.09% 1.7 0.00% ESSFwmu 99/02 RO/AW 0.00% 85.2 4.78% 85.2 0.01% ESSFwmu 99/03 RO/WF 0.00% 21.6 1.21% 21.6 0.00% ESSFwmu Total 34.0 1.87% 1,781.1 98.13% 1,815.1 0.16% ICHmk1 01 RF 43.6 0.10% 0.00% 43.6 0.00% ICHmk1 02 DP 476.0 1.07% 169.8 1.11% 645.8 0.06% ICHmk1 02/99 DP/RO 18.3 0.04% 154.3 1.01% 172.6 0.02% ICHmk1 03 DT 2,510.8 5.64% 1,919.0 12.53% 4,429.9 0.40% ICHmk1 03/99 DT/RO 249.4 0.56% 1,545.9 10.10% 1,795.3 0.16% ICHmk1 04 DA 7,618.8 17.11% 2,924.4 19.10% 10,543.2 0.95% ICHmk1 05 SG 4,689.2 10.53% 623.7 4.07% 5,312.9 0.48% ICHmk1 05/99 SG/RO 21.4 0.05% 37.4 0.24% 58.8 0.01% ICHmk1 06 SO 4,764.1 10.70% 264.0 1.72% 5,028.1 0.45% ICHmk1 06/99 SO/RO 12.1 0.03% 6.6 0.04% 18.8 0.00%

Invermere TSA Predictive Ecosystem Mapping (PEM) Report
JMJ Holdings Inc. 208-507 Baker Street, Nelson BC, V1L 4J2 phone (250) 354-4913 fax (250) 354-1162
email [email protected] Page 43.
January 31, 2004.
ICHmk1 07 SH 493.6 1.11% 22.6 0.15% 516.1 0.05% ICHmk1 08 WE 261.0 0.59% 3.0 0.02% 264.0 0.02% ICHmk1 41 XA 21,978.1 49.35% 5,470.1 35.73% 27,448.2 2.47% ICHmk1 41/99 XA/RO 256.0 0.57% 498.8 3.26% 754.8 0.07% ICHmk1 77 AC 240.4 0.54% 1,034.1 6.75% 1,274.5 0.11% ICHmk1 88 AR 35.9 0.08% 53.0 0.35% 88.8 0.01% ICHmk1 90 GB 8.1 0.02% 0.00% 8.1 0.00% ICHmk1 91 LA 393.7 0.88% 12.3 0.08% 406.0 0.04% ICHmk1 92 OW 10.3 0.02% 0.3 0.00% 10.6 0.00% ICHmk1 93 PD 2.1 0.00% 0.00% 2.1 0.00% ICHmk1 94 RI 266.7 0.60% 0.00% 266.7 0.02% ICHmk1 99 RO 77.5 0.17% 467.8 3.06% 545.3 0.05% ICHmk1 99/02 RO/DP 3.9 0.01% 9.4 0.06% 13.3 0.00% ICHmk1 99/03 RO/DT 33.5 0.08% 77.7 0.51% 111.1 0.01% ICHmk1 99/05 RO/SG 0.8 0.00% 0.4 0.00% 1.2 0.00% ICHmk1 99/06 RO/SO 0.00% 0.1 0.00% 0.1 0.00% ICHmk1 99/41 RO/XA 66.8 0.15% 16.3 0.11% 83.1 0.01% ICHmk1 Total 44,531.8 74.41% 15,310.9 25.59% 59,842.7 5.37% IDFdm2 01 DT 64,832.2 66.41% 1,833.8 34.01% 66,665.9 5.99% IDFdm2 01/99 DT/RO 911.5 0.93% 229.1 4.25% 1,140.6 0.10% IDFdm2 02 AW 4,094.8 4.19% 41.3 0.77% 4,136.1 0.37% IDFdm2 02/99 AW/RO 87.6 0.09% 23.6 0.44% 111.2 0.01% IDFdm2 03 DS 12,452.1 12.76% 833.2 15.45% 13,285.3 1.19% IDFdm2 03/99 DS/RO 1,291.6 1.32% 1,378.4 25.56% 2,670.0 0.24% IDFdm2 04 SP 5,346.0 5.48% 30.6 0.57% 5,376.6 0.48% IDFdm2 05 SS 3,465.5 3.55% 229.3 4.25% 3,694.9 0.33% IDFdm2 06/07 WE 1,823.8 1.87% 0.00% 1,823.8 0.16% IDFdm2 90 GB 332.6 0.34% 0.8 0.02% 333.4 0.03% IDFdm2 91 LA 1,012.9 1.04% 5.3 0.10% 1,018.3 0.09% IDFdm2 92 OW 50.1 0.05% 0.2 0.00% 50.4 0.00% IDFdm2 93 PD 15.8 0.02% 0.00% 15.8 0.00% IDFdm2 94 RI 984.0 1.01% 6.9 0.13% 990.8 0.09% IDFdm2 96 RE 20.6 0.02% 0.00% 20.6 0.00% IDFdm2 99 RO 448.8 0.46% 439.1 8.14% 887.9 0.08% IDFdm2 99/01 RO/DT 178.4 0.18% 20.3 0.38% 198.7 0.02% IDFdm2 99/02 RO/AW 12.3 0.01% 12.3 0.23% 24.6 0.00% IDFdm2 99/03 RO/DS 258.0 0.26% 308.3 5.72% 566.3 0.05% IDFdm2 Total 97,618.5 94.77% 5,392.5 5.23% 103,011.1 9.25% IDFdm2n 01 DT 8,390.0 40.89% 26.9 15.49% 8,416.9 0.76% IDFdm2n 01/99 DT/RO 35.9 0.18% 9.2 5.30% 45.1 0.00% IDFdm2n 03 DS 1,342.9 6.55% 42.3 24.37% 1,385.2 0.12% IDFdm2n 03/99 DS/RO 55.5 0.27% 45.3 26.12% 100.8 0.01% IDFdm2n 04 SP 2,611.9 12.73% 13.6 7.84% 2,625.5 0.24% IDFdm2n 04/99 SP/RO 17.1 0.08% 4.1 2.36% 21.2 0.00% IDFdm2n 05 SS 2,488.5 12.13% 3.6 2.07% 2,492.1 0.22% IDFdm2n 05/99 SS/RO 5.4 0.03% 2.1 1.19% 7.4 0.00% IDFdm2n 06 BH 2,168.3 10.57% 0.00% 2,168.3 0.19% IDFdm2n 06/07 BH/SH 50.5 0.25% 0.00% 50.5 0.00%
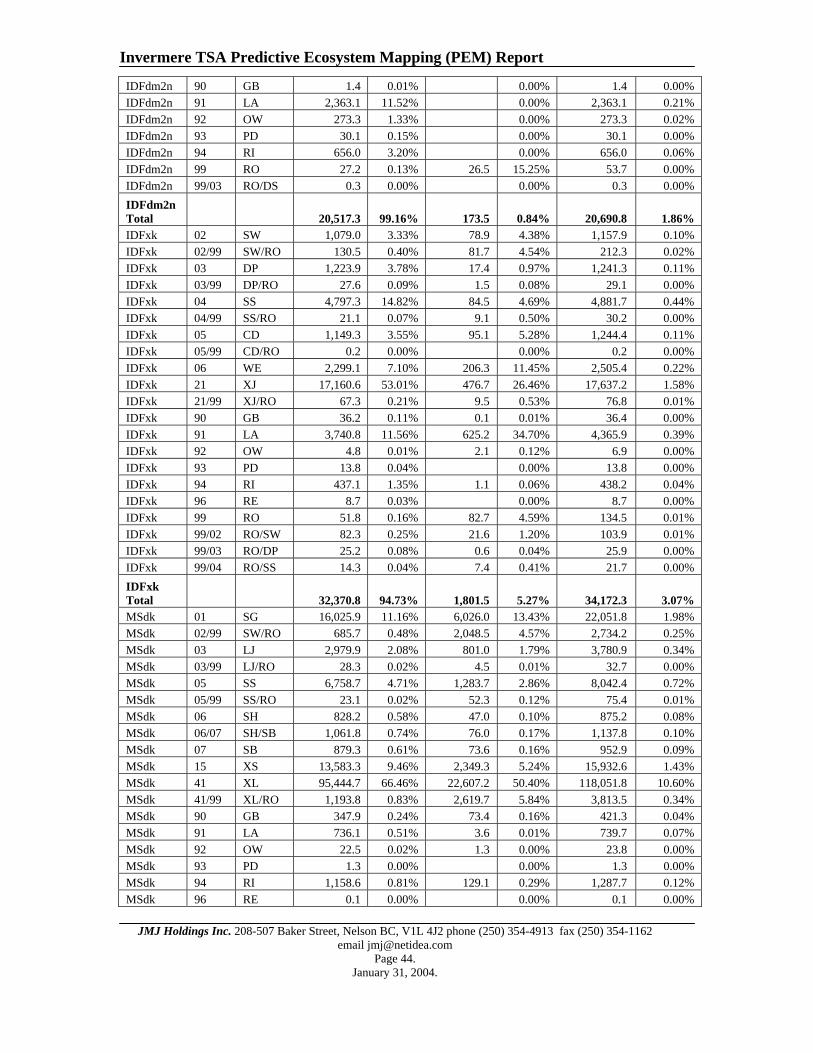
Invermere TSA Predictive Ecosystem Mapping (PEM) Report
JMJ Holdings Inc. 208-507 Baker Street, Nelson BC, V1L 4J2 phone (250) 354-4913 fax (250) 354-1162
email [email protected] Page 44.
January 31, 2004.
IDFdm2n 90 GB 1.4 0.01% 0.00% 1.4 0.00% IDFdm2n 91 LA 2,363.1 11.52% 0.00% 2,363.1 0.21% IDFdm2n 92 OW 273.3 1.33% 0.00% 273.3 0.02% IDFdm2n 93 PD 30.1 0.15% 0.00% 30.1 0.00% IDFdm2n 94 RI 656.0 3.20% 0.00% 656.0 0.06% IDFdm2n 99 RO 27.2 0.13% 26.5 15.25% 53.7 0.00% IDFdm2n 99/03 RO/DS 0.3 0.00% 0.00% 0.3 0.00% IDFdm2n Total 20,517.3 99.16% 173.5 0.84% 20,690.8 1.86% IDFxk 02 SW 1,079.0 3.33% 78.9 4.38% 1,157.9 0.10% IDFxk 02/99 SW/RO 130.5 0.40% 81.7 4.54% 212.3 0.02% IDFxk 03 DP 1,223.9 3.78% 17.4 0.97% 1,241.3 0.11% IDFxk 03/99 DP/RO 27.6 0.09% 1.5 0.08% 29.1 0.00% IDFxk 04 SS 4,797.3 14.82% 84.5 4.69% 4,881.7 0.44% IDFxk 04/99 SS/RO 21.1 0.07% 9.1 0.50% 30.2 0.00% IDFxk 05 CD 1,149.3 3.55% 95.1 5.28% 1,244.4 0.11% IDFxk 05/99 CD/RO 0.2 0.00% 0.00% 0.2 0.00% IDFxk 06 WE 2,299.1 7.10% 206.3 11.45% 2,505.4 0.22% IDFxk 21 XJ 17,160.6 53.01% 476.7 26.46% 17,637.2 1.58% IDFxk 21/99 XJ/RO 67.3 0.21% 9.5 0.53% 76.8 0.01% IDFxk 90 GB 36.2 0.11% 0.1 0.01% 36.4 0.00% IDFxk 91 LA 3,740.8 11.56% 625.2 34.70% 4,365.9 0.39% IDFxk 92 OW 4.8 0.01% 2.1 0.12% 6.9 0.00% IDFxk 93 PD 13.8 0.04% 0.00% 13.8 0.00% IDFxk 94 RI 437.1 1.35% 1.1 0.06% 438.2 0.04% IDFxk 96 RE 8.7 0.03% 0.00% 8.7 0.00% IDFxk 99 RO 51.8 0.16% 82.7 4.59% 134.5 0.01% IDFxk 99/02 RO/SW 82.3 0.25% 21.6 1.20% 103.9 0.01% IDFxk 99/03 RO/DP 25.2 0.08% 0.6 0.04% 25.9 0.00% IDFxk 99/04 RO/SS 14.3 0.04% 7.4 0.41% 21.7 0.00% IDFxk Total 32,370.8 94.73% 1,801.5 5.27% 34,172.3 3.07% MSdk 01 SG 16,025.9 11.16% 6,026.0 13.43% 22,051.8 1.98% MSdk 02/99 SW/RO 685.7 0.48% 2,048.5 4.57% 2,734.2 0.25% MSdk 03 LJ 2,979.9 2.08% 801.0 1.79% 3,780.9 0.34% MSdk 03/99 LJ/RO 28.3 0.02% 4.5 0.01% 32.7 0.00% MSdk 05 SS 6,758.7 4.71% 1,283.7 2.86% 8,042.4 0.72% MSdk 05/99 SS/RO 23.1 0.02% 52.3 0.12% 75.4 0.01% MSdk 06 SH 828.2 0.58% 47.0 0.10% 875.2 0.08% MSdk 06/07 SH/SB 1,061.8 0.74% 76.0 0.17% 1,137.8 0.10% MSdk 07 SB 879.3 0.61% 73.6 0.16% 952.9 0.09% MSdk 15 XS 13,583.3 9.46% 2,349.3 5.24% 15,932.6 1.43% MSdk 41 XL 95,444.7 66.46% 22,607.2 50.40% 118,051.8 10.60% MSdk 41/99 XL/RO 1,193.8 0.83% 2,619.7 5.84% 3,813.5 0.34% MSdk 90 GB 347.9 0.24% 73.4 0.16% 421.3 0.04% MSdk 91 LA 736.1 0.51% 3.6 0.01% 739.7 0.07% MSdk 92 OW 22.5 0.02% 1.3 0.00% 23.8 0.00% MSdk 93 PD 1.3 0.00% 0.00% 1.3 0.00% MSdk 94 RI 1,158.6 0.81% 129.1 0.29% 1,287.7 0.12% MSdk 96 RE 0.1 0.00% 0.00% 0.1 0.00%
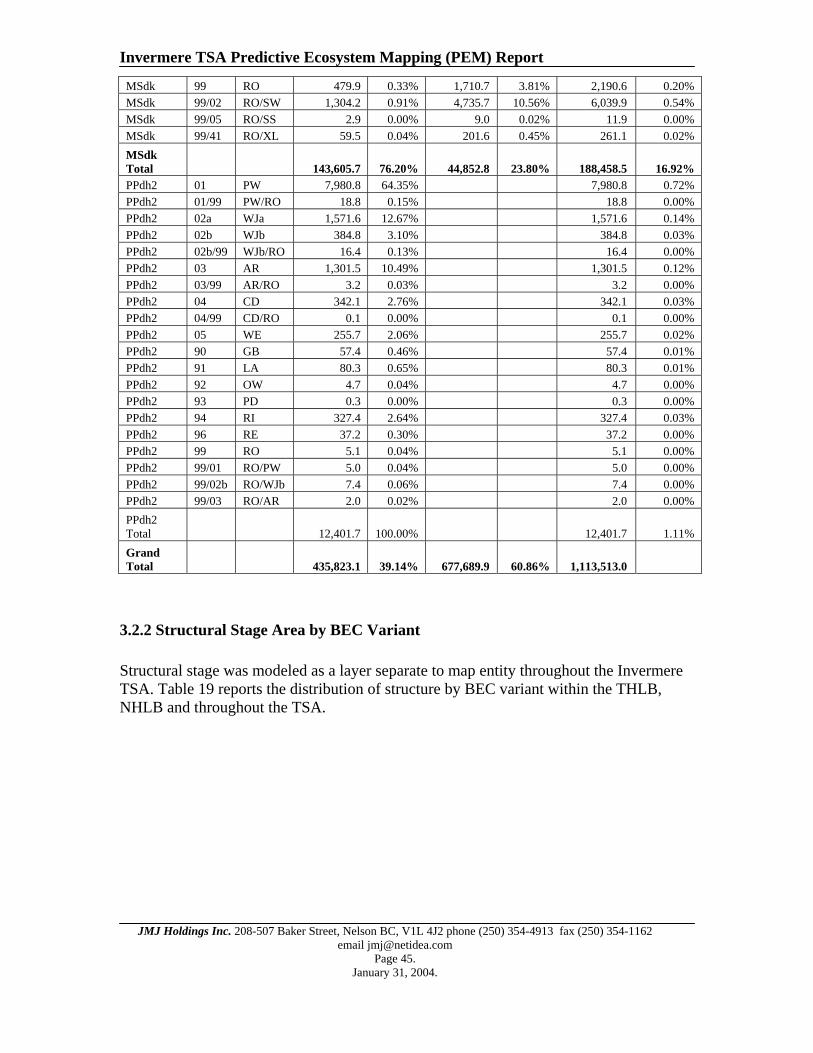
Invermere TSA Predictive Ecosystem Mapping (PEM) Report
JMJ Holdings Inc. 208-507 Baker Street, Nelson BC, V1L 4J2 phone (250) 354-4913 fax (250) 354-1162
email [email protected] Page 45.
January 31, 2004.
MSdk 99 RO 479.9 0.33% 1,710.7 3.81% 2,190.6 0.20% MSdk 99/02 RO/SW 1,304.2 0.91% 4,735.7 10.56% 6,039.9 0.54% MSdk 99/05 RO/SS 2.9 0.00% 9.0 0.02% 11.9 0.00% MSdk 99/41 RO/XL 59.5 0.04% 201.6 0.45% 261.1 0.02% MSdk Total 143,605.7 76.20% 44,852.8 23.80% 188,458.5 16.92% PPdh2 01 PW 7,980.8 64.35% 7,980.8 0.72% PPdh2 01/99 PW/RO 18.8 0.15% 18.8 0.00% PPdh2 02a WJa 1,571.6 12.67% 1,571.6 0.14% PPdh2 02b WJb 384.8 3.10% 384.8 0.03% PPdh2 02b/99 WJb/RO 16.4 0.13% 16.4 0.00% PPdh2 03 AR 1,301.5 10.49% 1,301.5 0.12% PPdh2 03/99 AR/RO 3.2 0.03% 3.2 0.00% PPdh2 04 CD 342.1 2.76% 342.1 0.03% PPdh2 04/99 CD/RO 0.1 0.00% 0.1 0.00% PPdh2 05 WE 255.7 2.06% 255.7 0.02% PPdh2 90 GB 57.4 0.46% 57.4 0.01% PPdh2 91 LA 80.3 0.65% 80.3 0.01% PPdh2 92 OW 4.7 0.04% 4.7 0.00% PPdh2 93 PD 0.3 0.00% 0.3 0.00% PPdh2 94 RI 327.4 2.64% 327.4 0.03% PPdh2 96 RE 37.2 0.30% 37.2 0.00% PPdh2 99 RO 5.1 0.04% 5.1 0.00% PPdh2 99/01 RO/PW 5.0 0.04% 5.0 0.00% PPdh2 99/02b RO/WJb 7.4 0.06% 7.4 0.00% PPdh2 99/03 RO/AR 2.0 0.02% 2.0 0.00% PPdh2 Total 12,401.7 100.00% 12,401.7 1.11% Grand Total 435,823.1 39.14% 677,689.9 60.86% 1,113,513.0
3.2.2 Structural Stage Area by BEC Variant Structural stage was modeled as a layer separate to map entity throughout the Invermere TSA. Table 19 reports the distribution of structure by BEC variant within the THLB, NHLB and throughout the TSA.

Invermere TSA Predictive Ecosystem Mapping (PEM) Report
JMJ Holdings Inc. 208-507 Baker Street, Nelson BC, V1L 4J2 phone (250) 354-4913 fax (250) 354-1162
email [email protected] Page 46.
January 31, 2004.
Table 19. Structural Stage Distribution by BEC, Invermere TSA
BEC variant
Structural Stage
THLB hectares
THLB Percentage
NHLB hectares
NHLB Percentage
Entire TSA hectares
Entire TSA percentage
AT un 0 2339.2 2.03% 2339.2 2.03% 1 158.9 0.14% 158.9 0.14% 2 111432.7 96.83% 111432.7 96.83% 3 699.8 0.61% 699.8 0.61% 4 0.3 0.00% 0.3 0.00% 5 9.4 0.01% 9.4 0.01% 6 169.4 0.15% 169.4 0.15% 7 274.5 0.24% 274.5 0.24% AT un Total 115084.3 100.00% 115084.3 100.00% ESSFdk 1 0 3821.4 5.39% 1942.6 0.98% 5764.0 2.14% 1 245.7 0.35% 4292.7 2.16% 4538.4 1.69% 2 1309.7 1.85% 34194.2 17.25% 35503.9 13.19% 3 18414.7 25.95% 28127.9 14.19% 46542.6 17.29% 4 3078.9 4.34% 8243.3 4.16% 11322.3 4.21% 5 16339.8 23.03% 43466.7 21.92% 59806.6 22.21% 6 24090.4 33.95% 69401.3 35.00% 93491.6 34.72% 7 3662.9 5.16% 8614.5 4.34% 12277.4 4.56% ESSFdk 1 Total 70963.5 100.00% 198283.3 100.00% 269246.8 100.00% ESSFdk 2 0 223.0 2.15% 111.5 0.34% 334.5 0.78% 1 27.0 0.26% 505.7 1.56% 532.7 1.25% 2 386.4 3.72% 9575.5 29.61% 9961.9 23.31% 3 2157.8 20.77% 3345.6 10.35% 5503.5 12.88% 4 425.2 4.09% 554.5 1.71% 979.7 2.29% 5 2758.1 26.54% 5924.9 18.32% 8683.0 20.32% 6 2696.7 25.95% 9482.5 29.32% 12179.2 28.50% 7 1716.1 16.52% 2837.9 8.78% 4554.0 10.66% ESSFdk 2 Total 10390.4 100.00% 32338.2 100.00% 42728.5 100.00% ESSFdku 0 118.8 5.09% 2440.7 0.93% 2559.4 0.97% 1 18.8 0.81% 4250.4 1.63% 4269.3 1.62% 2 64.9 2.78% 139106.4 53.21% 139171.3 52.77% 3 362.4 15.52% 28796.5 11.02% 29158.8 11.06% 4 23.4 1.00% 1298.1 0.50% 1321.5 0.50% 5 323.3 13.84% 13356.5 5.11% 13679.8 5.19% 6 1041.9 44.62% 62533.7 23.92% 63575.6 24.10% 7 381.6 16.34% 9632.5 3.68% 10014.1 3.80% ESSFdku Total 2335.1 100.00% 261414.8 100.00% 263749.9 100.00% ESSFwm 0 68.5 6.41% 13.6 0.95% 82.2 3.29% 1 0.9 0.09% 13.2 0.92% 14.1 0.56% 2 33.6 3.14% 498.6 34.87% 532.2 21.30% 3 394.8 36.92% 188.5 13.18% 583.3 23.34% 4 103.5 9.68% 1.4 0.10% 104.9 4.20% 5 57.8 5.41% 109.8 7.68% 167.6 6.70%
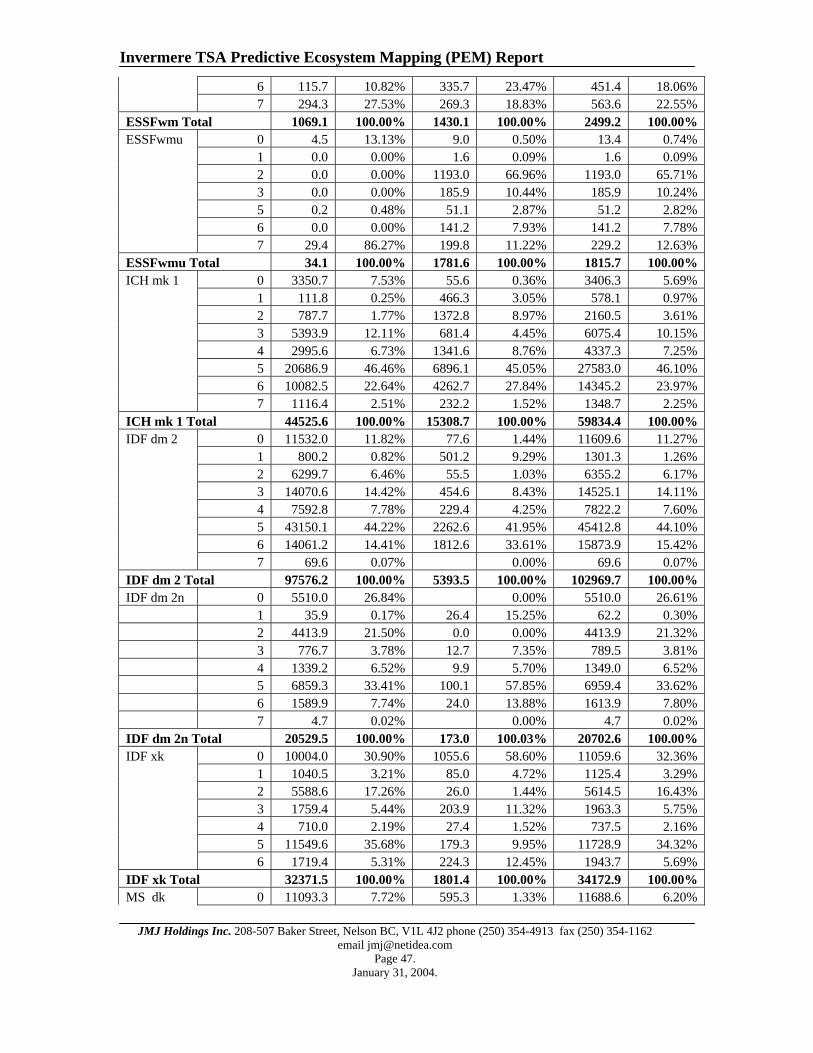
Invermere TSA Predictive Ecosystem Mapping (PEM) Report
JMJ Holdings Inc. 208-507 Baker Street, Nelson BC, V1L 4J2 phone (250) 354-4913 fax (250) 354-1162
email [email protected] Page 47.
January 31, 2004.
6 115.7 10.82% 335.7 23.47% 451.4 18.06% 7 294.3 27.53% 269.3 18.83% 563.6 22.55% ESSFwm Total 1069.1 100.00% 1430.1 100.00% 2499.2 100.00% ESSFwmu 0 4.5 13.13% 9.0 0.50% 13.4 0.74% 1 0.0 0.00% 1.6 0.09% 1.6 0.09% 2 0.0 0.00% 1193.0 66.96% 1193.0 65.71% 3 0.0 0.00% 185.9 10.44% 185.9 10.24% 5 0.2 0.48% 51.1 2.87% 51.2 2.82% 6 0.0 0.00% 141.2 7.93% 141.2 7.78% 7 29.4 86.27% 199.8 11.22% 229.2 12.63% ESSFwmu Total 34.1 100.00% 1781.6 100.00% 1815.7 100.00% ICH mk 1 0 3350.7 7.53% 55.6 0.36% 3406.3 5.69% 1 111.8 0.25% 466.3 3.05% 578.1 0.97% 2 787.7 1.77% 1372.8 8.97% 2160.5 3.61% 3 5393.9 12.11% 681.4 4.45% 6075.4 10.15% 4 2995.6 6.73% 1341.6 8.76% 4337.3 7.25% 5 20686.9 46.46% 6896.1 45.05% 27583.0 46.10% 6 10082.5 22.64% 4262.7 27.84% 14345.2 23.97% 7 1116.4 2.51% 232.2 1.52% 1348.7 2.25% ICH mk 1 Total 44525.6 100.00% 15308.7 100.00% 59834.4 100.00% IDF dm 2 0 11532.0 11.82% 77.6 1.44% 11609.6 11.27% 1 800.2 0.82% 501.2 9.29% 1301.3 1.26% 2 6299.7 6.46% 55.5 1.03% 6355.2 6.17% 3 14070.6 14.42% 454.6 8.43% 14525.1 14.11% 4 7592.8 7.78% 229.4 4.25% 7822.2 7.60% 5 43150.1 44.22% 2262.6 41.95% 45412.8 44.10% 6 14061.2 14.41% 1812.6 33.61% 15873.9 15.42% 7 69.6 0.07% 0.00% 69.6 0.07% IDF dm 2 Total 97576.2 100.00% 5393.5 100.00% 102969.7 100.00% IDF dm 2n 0 5510.0 26.84% 0.00% 5510.0 26.61% 1 35.9 0.17% 26.4 15.25% 62.2 0.30% 2 4413.9 21.50% 0.0 0.00% 4413.9 21.32% 3 776.7 3.78% 12.7 7.35% 789.5 3.81% 4 1339.2 6.52% 9.9 5.70% 1349.0 6.52% 5 6859.3 33.41% 100.1 57.85% 6959.4 33.62% 6 1589.9 7.74% 24.0 13.88% 1613.9 7.80% 7 4.7 0.02% 0.00% 4.7 0.02% IDF dm 2n Total 20529.5 100.00% 173.0 100.03% 20702.6 100.00% IDF xk 0 10004.0 30.90% 1055.6 58.60% 11059.6 32.36% 1 1040.5 3.21% 85.0 4.72% 1125.4 3.29% 2 5588.6 17.26% 26.0 1.44% 5614.5 16.43% 3 1759.4 5.44% 203.9 11.32% 1963.3 5.75% 4 710.0 2.19% 27.4 1.52% 737.5 2.16% 5 11549.6 35.68% 179.3 9.95% 11728.9 34.32% 6 1719.4 5.31% 224.3 12.45% 1943.7 5.69% IDF xk Total 32371.5 100.00% 1801.4 100.00% 34172.9 100.00% MS dk 0 11093.3 7.72% 595.3 1.33% 11688.6 6.20%

Invermere TSA Predictive Ecosystem Mapping (PEM) Report
JMJ Holdings Inc. 208-507 Baker Street, Nelson BC, V1L 4J2 phone (250) 354-4913 fax (250) 354-1162
email [email protected] Page 48.
January 31, 2004.
1 1014.1 0.71% 1607.2 3.58% 2621.3 1.39% 2 1578.1 1.10% 2698.7 6.02% 4276.7 2.27% 3 35209.5 24.51% 6056.3 13.50% 41265.8 21.89% 4 7161.4 4.99% 3623.5 8.08% 10784.9 5.72% 5 51815.3 36.07% 17384.8 38.76% 69200.1 36.71% 6 34185.1 23.80% 12297.6 27.42% 46482.7 24.66% 7 1599.9 1.11% 592.5 1.32% 2192.4 1.16% MS dk Total 143656.8 100.00% 44855.8 100.00% 188512.5 100.00% PP dh 2 0 1401.7 11.30% 1401.7 11.30% 1 7.5 0.06% 7.5 0.06% 2 2509.8 20.23% 2509.8 20.23% 3 1305.6 10.52% 1305.6 10.52% 4 686.9 5.54% 686.9 5.54% 5 4862.0 39.19% 4862.0 39.19% 6 1632.2 13.16% 1632.2 13.16% PP dh 2 Total 12405.7 100.00% 12405.7 100.00% Grand Total 435857.5 677864.7 1113722.2

Invermere TSA Predictive Ecosystem Mapping (PEM) Report
JMJ Holdings Inc. 208-507 Baker Street, Nelson BC, V1L 4J2 phone (250) 354-4913 fax (250) 354-1162
email [email protected] Page 49.
January 31, 2004.
3.3 An Illustrated Depiction of Some Site Series of the Invermere TSA
AT/01 AW Dry Meadow Structural Stage 2/3a
ESSFdk1/01 FA Bl – Azalea – Foamflower Structural Stage 5

Invermere TSA Predictive Ecosystem Mapping (PEM) Report
JMJ Holdings Inc. 208-507 Baker Street, Nelson BC, V1L 4J2 phone (250) 354-4913 fax (250) 354-1162
email [email protected] Page 50.
January 31, 2004.
ESSFdk1/04 FS Bl – Azalea – Soopolallie Structural Stage 4
ESSFdk2/01 FP Bl – Black Huckleberry – Red-stemmed Feathermoss Structural Stage 6

Invermere TSA Predictive Ecosystem Mapping (PEM) Report
JMJ Holdings Inc. 208-507 Baker Street, Nelson BC, V1L 4J2 phone (250) 354-4913 fax (250) 354-1162
email [email protected] Page 51.
January 31, 2004.
ESSFdk2/02 FG Bl – Pa – Grouseberry Structural Stage 3
ESSFdku/01 EM Submesic to Mesic Forests Structral Stage 6
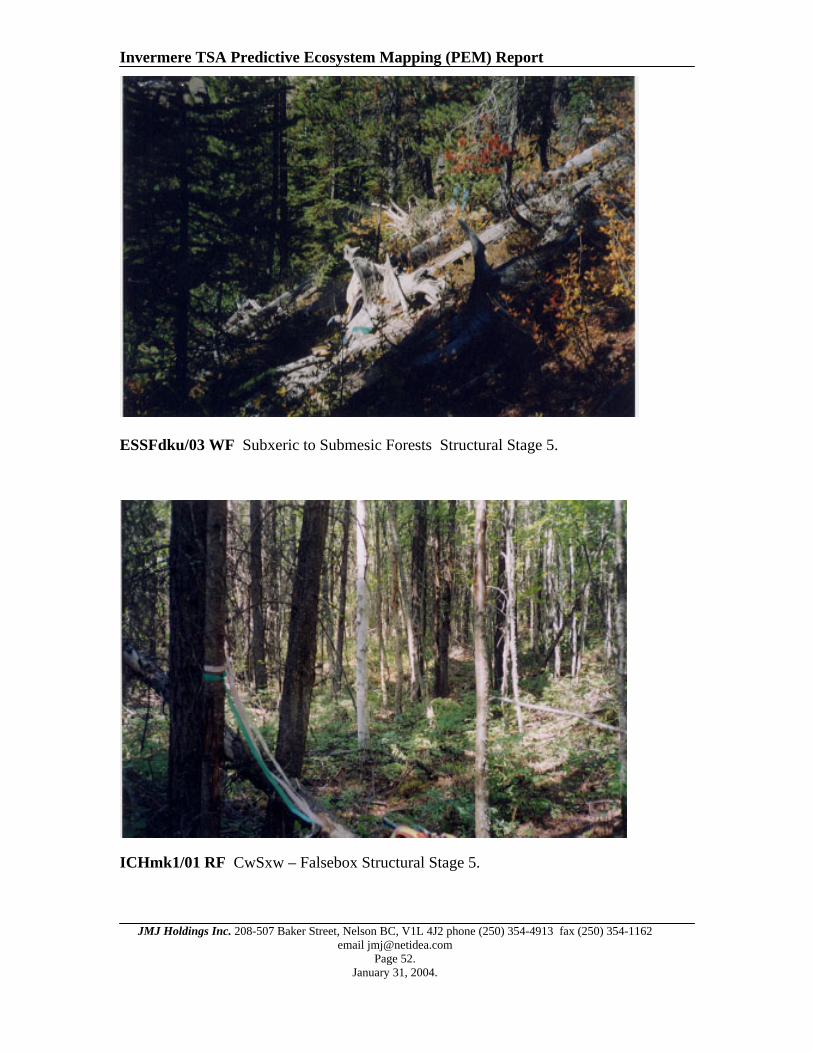
Invermere TSA Predictive Ecosystem Mapping (PEM) Report
JMJ Holdings Inc. 208-507 Baker Street, Nelson BC, V1L 4J2 phone (250) 354-4913 fax (250) 354-1162
email [email protected] Page 52.
January 31, 2004.
ESSFdku/03 WF Subxeric to Submesic Forests Structural Stage 5.
ICHmk1/01 RF CwSxw – Falsebox Structural Stage 5.

Invermere TSA Predictive Ecosystem Mapping (PEM) Report
JMJ Holdings Inc. 208-507 Baker Street, Nelson BC, V1L 4J2 phone (250) 354-4913 fax (250) 354-1162
email [email protected] Page 53.
January 31, 2004.
ICHmk1/03 DT FdPl – Pinegrass – Twinflower Structural Stage 5
ICHmk1/04 DA FdPl – Sitka Alder – Pinegrass Structural Stage 5.

Invermere TSA Predictive Ecosystem Mapping (PEM) Report
JMJ Holdings Inc. 208-507 Baker Street, Nelson BC, V1L 4J2 phone (250) 354-4913 fax (250) 354-1162
email [email protected] Page 54.
January 31, 2004.
ICHmk1/08 WE Wetland Complex Structural Stage 3
ICHmk1/88 AR Avalanche Runout Zone Structrual Stage 3

Invermere TSA Predictive Ecosystem Mapping (PEM) Report
JMJ Holdings Inc. 208-507 Baker Street, Nelson BC, V1L 4J2 phone (250) 354-4913 fax (250) 354-1162
email [email protected] Page 55.
January 31, 2004.
IDFdm2/01 DT FdPl – Pinegrass – Twinflower Structural Stage 5.
IDFdm2/02 AW – Antelope Brush – Bluebunch wheatgrass Structural Stage 2/5

Invermere TSA Predictive Ecosystem Mapping (PEM) Report
JMJ Holdings Inc. 208-507 Baker Street, Nelson BC, V1L 4J2 phone (250) 354-4913 fax (250) 354-1162
email [email protected] Page 56.
January 31, 2004.
IDFdm2/05 SS Swx At – Sarsaparilla Structural Stage 5.
IDFxk/02 SW Fd – Rocky Mountain Juniper–Bluebunch Wheatgrass Structural Stage 2

Invermere TSA Predictive Ecosystem Mapping (PEM) Report
JMJ Holdings Inc. 208-507 Baker Street, Nelson BC, V1L 4J2 phone (250) 354-4913 fax (250) 354-1162
email [email protected] Page 57.
January 31, 2004.
MSdk/01 SG Sxw – Soopolallie Grouseberry Structural Stage 5
MSdk/02 SW Saskatoon – Bluebunch Wheatgrass Structural Stage 2/3

Invermere TSA Predictive Ecosystem Mapping (PEM) Report
JMJ Holdings Inc. 208-507 Baker Street, Nelson BC, V1L 4J2 phone (250) 354-4913 fax (250) 354-1162
email [email protected] Page 58.
January 31, 2004.
MSdk/03 LJ Pl Juniper- Pinegrass Structural Stage 5
MSdk/04 LP Sxw Soopolallie – Pinegrass Structural Stage 5

Invermere TSA Predictive Ecosystem Mapping (PEM) Report
JMJ Holdings Inc. 208-507 Baker Street, Nelson BC, V1L 4J2 phone (250) 354-4913 fax (250) 354-1162
email [email protected] Page 59.
January 31, 2004.
MSdk/05 SS Swx – Soopallie – Snowberry Structural Stage 5.
PPdh2/01 PW Py – Bluebunch Wheatgrass- Junegrass Structural Stage 5.
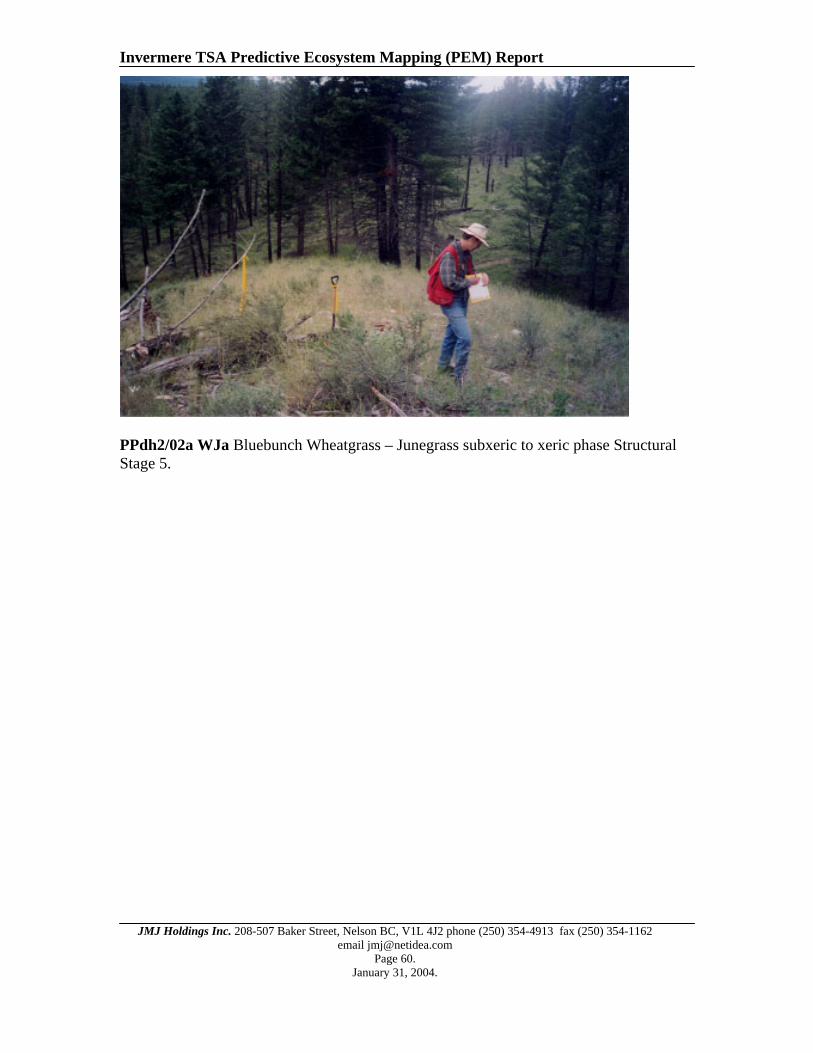
Invermere TSA Predictive Ecosystem Mapping (PEM) Report
JMJ Holdings Inc. 208-507 Baker Street, Nelson BC, V1L 4J2 phone (250) 354-4913 fax (250) 354-1162
email [email protected] Page 60.
January 31, 2004.
PPdh2/02a WJa Bluebunch Wheatgrass – Junegrass subxeric to xeric phase Structural Stage 5.

Invermere TSA Predictive Ecosystem Mapping (PEM) Report
JMJ Holdings Inc. 208-507 Baker Street, Nelson BC, V1L 4J2 phone (250) 354-4913 fax (250) 354-1162
email [email protected] Page 61.
January 31, 2004.
4.0 Discussion The Invermere PEM project modeled map entities depicting site series and proportions of site series based on the site series classification of Braumandl and Curran (1992) using revised BEC variant spatial data provided by Braumandl and Dykstra (2003). The reliability of the model varies with BEC variant and with the method of approach to assessing map reliability (Timberline, 2003, Wilson, 2004). The model could be improved as more sophisticated methods of utilizing field data information for clarifying the relationship between landscape shape, terrain, slope and aspect is determined. Changes to the BEC classification that may be up coming can also be incorporated into the model when they are available. There is opportunity for improvement in this PEM model. For the short-term it is a useful description of the spatial depiction of site series within the Invermere TSA for use in Timber Supply Review activities, sensitivity analyses, and assessment of wildlife habitat distribution (Timberline, 2003). As reported in Wilson (2004) there are ways the model can be improved. Field data, in the form of “experience” are lacking in 37% of the map units depicted within the project area. Knowledge bases derived from expert knowledge and tabularly summarized field data do not adequately represent the uncertainty of the relationship between field data and knowledge bases. The experience and reliability of the PEM model relative to the 2003 field data is depicted in Appendix X. Other sources of error within the PEM model include; spatial accuracy of field plot data, TRIM and forest cover, shortcomings of the existing site series classification and BEC variant mapping. We are particularly concerned about the result of the MSdk. We believe, based on extensive field experience, that this BEC subzone needs subdivision into at least two variants based on location within the EPM and SPK ecosections. There is a significant difference in the distribution of some key indicator plants used in the present MSdk site series classification. Field sample data for model building and testing was limited by the resources available to complete this project, although adequate (62% of the scope of map entities had at least one plot representing them). Many difficult to depict map units had no field data in them. The lack of traditional bioterrain input may have had some influence on the accuracy and reliability of this PEM model. However, this could be best tested by running the model with a traditional bioterrain component on a portion of the TSA that has bioterrain mapping and comparing results between the two approaches.

Invermere TSA Predictive Ecosystem Mapping (PEM) Report
JMJ Holdings Inc. 208-507 Baker Street, Nelson BC, V1L 4J2 phone (250) 354-4913 fax (250) 354-1162
email [email protected] Page 62.
January 31, 2004.
5.0 References Braumandl, T.F. and M. Curran. 1992. A Field Guide for Site Identification and Interpretation for the Nelson Forest Region. Land Management Handbook Number 29, BC Ministry of Forests. Victoria, BC. Braumandl T.F. and P. Dykstra.2003. Invermere TSA BEC Line Remapping. Final Report. Prepared for TEMBEC Industries Inc., Cranbrook, BC. Demarchi, D. 1996. An Introduction to the Ecoregions of British Columbia. Wildlife Branch, Ministry of Environment, Lands and Parks. Victoria, BC. Ecosystems Working Group, Terrestrial Ecosystems Task Force for the Resources Inventory Committee. 1998. Standard for Terrestrial Ecosystem Mapping in British Columbia. Victoria, BC. Howes, D.E. and Kenk, E (Version 2). Terrain Classification System for British Columbia, British Columbia Ministry of Environment, Manual 10, 1997. Kernaghan , G., K. Lessard, B. Sinclair, R. McKay, G. Burns and M.V. Ketcheson. 1999 TFL 14 Terrestrial Ecosystem Mapping Project. Unpublished report to Crestbrook Forest Industries Ltd. Cranbrook BC. Kernaghan, G., B. Sinclair, J. Riddell, and M.V. Ketcheson. 1997. Brewer Creek Terrestrial Ecosystem Mapping. Unpublished report to BC Ministry of Environment, Lands and Parks. Invermere, BC. Kernaghan, G., B. Sinclair, K. Lessard, D. Spaeth and M.V. Ketcheson. 1998. Steamboat Mountain Terrestrial Ecosystem Mapping Project. Unpublished report to Slocan Forest Products Ltd. Radium Hot Springs, BC. Kernaghan, G., K. Lessard, B. Sinclair, R. MacKay, G. Burns and M.V. Ketcheson. 1999. TFL 14 Terrestrial Ecosystem Mapping Project. Unpubllished report to Crestbrook Forest Industries Ltd. Cranbrook, BC. Kernaghan, G., K. Lessard and M.V. Ketcheson. 2000. Premier Ridge – Diorite Terrestrial Ecosystem Mapping (TEM) Project. Unpublished report to Crestbrook Forest Industries Ltd. Cranbrook, BC. Kernaghan, G. T Robertson and M.V. Ketcheson. 2003. Premier Lake Provincial Park Terrestrial Ecosystem Mapping (TEM) Project. Unpublished report to BC Parks, Kootenay District. Wasa, BC. Keranghan, G., K. Lessard, B. Sinclair, R. McKay. G. Burns and M.V. Ketcheson. 2001. Terrestrial Ecosystem Mapping of Slocan Forest Products Ltd. Radium Division Forest

Invermere TSA Predictive Ecosystem Mapping (PEM) Report
JMJ Holdings Inc. 208-507 Baker Street, Nelson BC, V1L 4J2 phone (250) 354-4913 fax (250) 354-1162
email [email protected] Page 63.
January 31, 2004.
Licence A18979. Unpublished report to Slocan Forest Products Ltd. Radium Hot Springs, BC. Kernaghan, G. and M.V. Ketcheson. TFL 14 SIBEC Sampling Project 2001. Unpublished report to TEMBEC Industries Inc. Cranbrook, BC. Ketcheson, M.V., T. Dool, G. Kernaghan, K. Lessard, and G. Burns. 2001. Canal Flats Operating Area PEM. Unpublished report to TEMBEC Industries Inc. Cranbrook, BC. Ketcheson, M.V., K. Lessard, T. Dool, L. Bradley, P. Williams, G. Kernaghan, G. Pavan, and B. Sinclair. 2002. East Kootenay Predictive Ecosystem Mapping Project Report. Unpublished report to Ministry of Sustainable Resource Management, Cranbrook, BC. Ketcheson, M.V. 2003. Invermere TSA 2003 Local SIBEC Data Collection. Unpublished report to Crestbrook Forest Industries. Cranbrook, BC. MacMillan, R.A. 2002. Cariboo PEM Pilot: Documentation of methods and results for landform-based classification procedures. Prepared for the Cariboo Site Productivity Adjustment Working Group, Contract Number: SPAWG(#) and Lignum Ltd., Williams Lake, BC. MacMillan, R. A., M. Ketcheson, Tedd Robertson, K. Misurak, and J. Shypitka. 2003. Canim Lake Predictive Ecosystem Mapping (PEM) Project Report. Unpublished report to Weldwood of Canada Ltd, 100 Mile House. MacMillan, R.A. et al. 1998. Fuzzy Sets and Systems – A generic Procedure for Automatically Segmenting Landforms into Landform Elements Using DEM’s, Heuristic Rules and Fuzzy Logic. Landmapper Environmental Solutions, Edmonton, AB 28 pgs. Marcoux, D, U. Lowrey, M. Mathers, M. Ketcheson. 1997. Stoddart Creek Study Area Expanded Legend. Unpublished Report to Columbia Basin Fish and Wildlife Compensation Program. Invermere, BC. Meidinger, D. 2003. Protocol for Accuracy Assessment of Ecosystem Maps. Research Branch, BC Ministry of Forests, Victoria, BC. BC Ministry of Forests and BC Ministry of Enviroment, Lands and Parks. 1998. Field Manual for Describing Terrestrial Ecosystems. Land Management Handbook Number 25. Victoria, BC. PEM Data Committee 2000. Standards for Predictive Ecosystem Mapping (PEM) – Digital Data Capture. Predictive Ecosystem Technical Standards and Database Manual. Version 1.0, April 2000.

Invermere TSA Predictive Ecosystem Mapping (PEM) Report
JMJ Holdings Inc. 208-507 Baker Street, Nelson BC, V1L 4J2 phone (250) 354-4913 fax (250) 354-1162
email [email protected] Page 64.
January 31, 2004.
Quinn, P., K. Beven, P. Chevallier and O. Planchon. 1991. The prediction of hillslope flow paths for distributed hydrological modelling using digital terrain models. Hydrological Processes. 5: 59-79. Rowe, JS. 1996. Land classification and ecosystem classification. (in) Global to Local: Ecological land classification. RA. Sims, IGW. Corns and K. Klinka (editors). Kluwer Academic Publishers, Dordrecht, The Netherlands. pp. 11-20. Timberline Forest Inventory Consultants Ltd. 2003. Final report for level 4 map accuracy assessment of the Invermere Timber Supply Area Predictive Ecosystem Mapping project. Prepared for Slocan Forest Products Ltd., Radium Division, British Columbia Wilson, S. 2004 Suggestions to Improve Predictive Ecosystem Mapping and Coments on the Reliability of the Invermere TSA PEM. An unpublished report to MSRM, Nelson, BC