Inventory of Departmental Key Performance Indicators(KPIs)1 Inventory cost of coal extracted...
55
Financial 1 Inventory cost of coal extracted Measures the total inventory cost of inventory being incurred for extracting per tonne of coal in current year relative to previous year. Following scale to be adhered to for rating: 5- if the inventory cost per tonne of production is less than the previous year's inventory cost per tonne of production 4- if the inventory cost per tonne of production is equal to the previous year’s inventory cost per tonne of production 3- if the inventory cost per tonne of production is more than previous year’s inventory cost per tonne of production by upto 5% 2- if the inventory cost per tonne of production is more than previous year’s inventory cost per tonne of production by upto 10% 1- if the inventory cost per tonne of production is more than previous year’s inventory cost per tonne of production by more than 10% Inventory cost (in Rs. per tonne of coal production) in current year Inventory cost per tonne of coal production in previous year 2 Variance in the electrical energy cost per tonne cubic metre Measures the total % variance between the actual cost of electrical energy consumed to extract a tonne of coal and the budgeted cost of energy. Following scale to be adhered to for rating: 5- if the actual KwH consumed is less than the budgeted KwH 4- if the actual KwH consumed is equal the budgeted KwH 3- if the actual KwH consumed is more than the budgeted KwH by upto 5% 2- if the actual KwH consumed is more than the budgeted KwH by upto 10% 1- if the actual KwH consumed is more than the budgeted KwH by upto 15% Actual electrical energy consumed (in KwH) Budgeted electrical energy consumed (in KwH) Quadrant No. Key Performance Indicator KPI Definition Formula Inventory of Departmental Key Performance Indicators(KPIs) E&M x 100 x 100
Transcript of Inventory of Departmental Key Performance Indicators(KPIs)1 Inventory cost of coal extracted...

Financial
1 Inventory cost of coal extracted
Measures the total inventory cost of inventory being incurred for extracting per tonne of coal in current year relative to previous year. Following scale to be adhered to for rating:5- if the inventory cost per tonne of production is less than the
previous year's inventory cost per tonne of production4- if the inventory cost per tonne of production is equal to the
previous year’s inventory cost per tonne of production3- if the inventory cost per tonne of production is more than
previous year’s inventory cost per tonne of production by upto 5%
2- if the inventory cost per tonne of production is more than previous year’s inventory cost per tonne of production by upto 10%
1- if the inventory cost per tonne of production is more than previous year’s inventory cost per tonne of production by more than 10%
Inventory cost (in Rs. per tonne of coal production) in current year Inventory cost per tonne of coal
production in previous year
2 Variance in the electrical energy cost per tonne cubic metre
Measures the total % variance between the actual cost of electrical energy consumed to extract a tonne of coal and the budgeted cost of energy. Following scale to be adhered to for rating:5- if the actual KwH consumed is less than the budgeted KwH4- if the actual KwH consumed is equal the budgeted KwH3- if the actual KwH consumed is more than the budgeted KwH by
upto 5%2- if the actual KwH consumed is more than the budgeted KwH by
upto 10%1- if the actual KwH consumed is more than the budgeted KwH by
upto 15%
Actual electrical energy consumed (in KwH)
Budgeted electrical energy consumed (in KwH)
Quadrant No. KeyPerformanceIndicator KPIDefinition Formula
InventoryofDepartmentalKeyPerformanceIndicators(KPIs)E&M
x 100
x 100

Quadrant No. KeyPerformanceIndicator KPIDefinition Formula
E&M\2
Financial
3 % Increase in total cost of energy - OC
Measures the impact of higher per unit cost of electrical energy on cost of production. Following scale to be adhered to for rating:5- if the actual energy cost is less than or equal to 90%the budget4- if the actual energy cost is between 91 to 95% of the budget3- if the actual energy cost is between 96 to 100% of the budget2- if the actual energy cost is between 101% to 105% of the budget1- if the actual energy cost is above 105% of the budget
Actual energy cost (in Rs. per cubic meter)
Targeted energy cost (in Rs. per cubic meter)
4% Technical accuracy of NIT specification - Centralized Capital Items
Measures the percentage of contracts which are re-tendered because of technical discrepancies in NIT specification. Following scale to be adhered to for rating:5- if no contracts were re-tendered due to technical discrepancies4- if the number of contracts that were re-tendered is less than 5%
of the total number of contracts handled3- if the number of contracts that were re-tendered is between 6 to
10% of the total number of contracts handled2- if the number of contracts that were re-tendered is between 11
to 15% of the total number of contracts handled1- if the number of contracts that were re-tendered is more than
15% of the total number of contracts handled
Number of contracts re-tendered due to technical discrepancies in NIT
specification
5% Technical accuracy of NIT specification - Centralized Revenue Items
Measures the percentage of contracts which are re-tendered because of technical discrepancies in NIT specification. Following scale to be adhered to for rating:5- if no contracts were re-tendered due to technical discrepancies4- if the number of contracts that were re-tendered is less than 5%
of the total number of contracts handled3- if the number of contracts that were re-tendered is between 6 to
10% of the total number of contracts handled2- if the number of contracts that were re-tendered is between 11
to 15% of the total number of contracts handled1- if the number of contracts that were re-tendered is more than
15% of the total number of contracts handled
Number of contracts re-tendered due to technical discrepancies in NIT
specification
x 100

Quadrant No. KeyPerformanceIndicator KPIDefinition Formula
E&M\3
Financial
6Penalties due to excess power consumption (excess contract demand)
Measures the percentage of electrical cost amount which has penalties included in it because of contract demand term and peak period demand penalty. Following scale to be adhered to for rating: 5- if no penalty have been paid4- if the penalty paid is less than 1% of the total energy cost3- if the penalty paid is between 1 to 2% of the total energy cost2- if the penalty paid is between 2.01 to 4% of the total energy cost1- if the penalty paid is more than 4% of the total energy cost
Amount of penalties due to energy consumption above
contract demand (in Rs.)Total energy cost (in Rs.)
7 Penalties due to improper energy utilization
Measures the total amount of penalties which are being levied by the electrical company for not utilizing the electrical energy as per the availability. Following scale to be adhered to for rating: 5- if no penalty have been paid4- if the penalty paid is less than 1% of the total energy cost3- if the penalty paid is between 1 to 2% of the total energy cost2- if the penalty paid is between 2.01 to 4% of the total energy cost1- if the penalty paid is more than 4% of the total energy cost
Amount of penalties due to non utilisation of demanded power
(in Rs.) Total energy cost (in Rs.)
8 Value of demurrage levied by railways
Measures the percentage of dispatch schedule without any demurrage levied on it. Following scale to be adhered to for rating:5- if the proportional number of demurrage levied is 0 to 5% of
total number of times demurrage levied on the subsidiary during the year
4- if the proportional number of demurrage levied is 6 to 10% of total number of times demurrage levied on the subsidiary during the year
3- if the proportional number of demurrage levied is 11 to 15% of total number of times demurrage levied on the subsidiary during the year
2- if the proportional number of demurrage levied is 16 to 20% of total number of times demurrage levied on the subsidiary during the year
1- if the proportional number of demurrage levied is 20% or more than 20% of total number of times demurrage levied on the subsidiary during the year
Proportional number of times demurrage levied due to non
- availability of CHPTotal number of times
demurrage levied on the subsidiary during the year
x 100
x 100
x 100

Quadrant No. KeyPerformanceIndicator KPIDefinition Formula
E&M\4
Financial
9 Variance in the operating cost of per ton coal crushed
Measures the total % variance between the actual operating cost being charged for crushing per ton of coal and the budgeted operating cost. Following scale to be adhered to for rating:5- if the operating cost of per ton coal crushed is less than or equal
to 90% the budget4- if the operating cost of per ton coal crushed is between 91 to
95% of the budget3- if the operating cost of per ton coal crushed is between 96 to
100% of the budget2- if the operating cost of per ton coal crushed is between 101% to
105% of the budget1- if the operating cost of per ton coal crushed is above 105% of the
budget
Actual crusher operating cost (in Rs. per tonne of coal)
Targeted crusher operating cost (in Rs. per tonne of coal)
10 Profit variance per tonne
Measures the percentage variance in the actual profit amount per tonne and the budgeted profit amount per tonne. Following rating scale to be adhered :5- 100% and above achievement4- Between 86%-99% achievement3- Between 76%-85% achievement2- Between 61%-75% achievement1- Below 60% achievement
Budgeted profit per tonne Actual profit per tonne
11 Loss Variance per tonne
Measures the percentage variance in the actual loss amount per tonne and the budgeted loss amount per tonne. Following rating scale to be adhered :5- 100% and above achievement4- Between 86%-99% achievement3- Between 76%-85% achievement2- Between 61%-75% achievement1- Below 60% achievement
a. Budgeted loss per tonne - actual loss per tonne
Budgeted loss per tonne
b. i. If the answer of above is positive, then add 100 to the answer to get
achievement %
ii. If the answer of above is negative, then subtract 100 to the answer to get
achievement %
x 100
x 100
x 100

Quadrant No. KeyPerformanceIndicator KPIDefinition Formula
E&M\5
Financial
12 Variable Cost Index
Measures the difference between the standard variable overheads absorbed in production and the actual variable overheads incurred. Note: Variable cost includes overtime, sunday deployment, power and POL. Following scale to be adhered to for rating:5- if the actual variable cost per tonne is less than or equal to 90%
the budget4- if the actual variable cost per tonne is between 91 to 95% of the
budget3- if the actual variable cost per tonne is between 96 to 100% of the
budget2- if the actual variable cost per tonne is between 101% to 105% of
the budget1- if the actual variable cost per tonne is over 105% of the budget
Actual variable cost (in Rs. per tonne)
Budgeted variable cost (in Rs. per tonne)
13 Production shift loss due to accidents
Measures the total number of productive mandays lost because of accidents or fatalities. Following scale to be adhered to for rating:5- if the number of shifts in which production could not be done
because of accidents is zero4- if the number of shifts in which production could not be done
because of accidents is upto 1% of the total shifts3- if the number of shifts in which production could not be done
because of accidents is between 1 to 2% of the total shifts2- if the number of shifts in which production could not be done
because of accidents is between 2 to 3% of the total shifts1- if the number of shifts in which production could not be done
because of accidents is more than 3% of the total shifts
Number of shifts in which production could not be done
because of accidents Total number of manshifts
x 100
x 100

Quadrant No. KeyPerformanceIndicator KPIDefinition Formula
E&M\6
Financial
14 Addition of new legal case (E&M related)
Measures the number of legal cases added during the year because of the discrepancies caused by E&M department. Following scale to be adhered to for rating:5- if the number of legal cases added during the year is zero4- if the number of legal cases added during the year is upto 23- if the number of legal cases added during the year is between 3
to 42- if the number of legal cases added during the year is between 4
to 51- if the number of legal cases added during the year is more than 5
Number of E&M related cases added during the year
15 Production manshifts loss due to IR problems
Measures the total number of productive manshifts lost because of IR problems Following scale to be adhered to for rating:5- if the number of shifts in which production could not be done
because of IR problems is zero4- if the number of shifts in which production could not be done
because of IR problems is upto 1% of the total shifts3- if the number of shifts in which production could not be done
because of IR problems is between 1 to 2% of the total shifts2- if the number of shifts in which production could not be done
because of IR problems is between 2 to 3% of the total shifts1- if the number of shifts in which production could not be done
because of IR problems is more than 3% of the total shifts
Number of shifts in which production could not be done
because of IR problems Total number of manshifts
16 Variance in specific energy consumption
Measures the percentage variance between the targeted quantity of energy consumed per tonne of coal relative to actual quantity of energy to be consumed. Following scale to be adhered to for rating:5- if the energy consumed is less than the previous year4- if the energy consumed is equal to the previous year’s3- if the energy consumed is more than previous year’s by upto 3%2- if the energy consumed is more than previous year’s by upto 5%1- if the energy consumed is more than previous year’s by more
than 10%
Kilo watt per hour energy consumed per tonne of coal in
current year Kilo watt per hour energy
consumed per tonne of coal in previous year
x 100
x 100

Quadrant No. KeyPerformanceIndicator KPIDefinition Formula
E&M\7
Financial
17 Settlement of warranty claims
Measures the number of warranty claims which have been settled relative to total number of claims to be settled. Following scale to be adhered to for rating:5- if the actual number of claims settled is 91% or above of the
claims registered4- if the actual number of claims settled is between 81 to 90% of
the claims registered3- if the actual number of claims settled is between 71 to 80% of
the claims registered2- if the actual number of claims settled is between 61 to 70% of
the claims registered1- if the actual number of claims settled is less than 60% of the
claims registered
Actual number of warranty claims settled
Total number of warranty claims registered
18 % Increase in total cost of energy - UG
Measures the impact of higher per unit cost of electrical energy on cost of production. Following scale to be adhered to for rating:5- if the actual energy cost is less than or equal to 90%the budget4- if the actual energy cost is between 91 to 95% of the budget3- if the actual energy cost is between 96 to 100% of the budget2- if the actual energy cost is between 101% to 105% of the budget1- if the actual energy cost is above 105% of the budget
Targeted energy cost (in Rs. per tonne)
Actual energy cost (in Rs. per tonne)
19% Technical accuracy of NIT specification - Decentralized Revenue Items
Measures the percentage of contracts which are re-tendered because of technical discrepancies in NIT specification. Following scale to be adhered to for rating:5- if no contracts were re-tendered due to commercial
discrepancies4- if the number of contracts that were re-tendered is less than 5%
of the total number of contracts3- if the number of contracts that were re-tendered is between 6 to
10% of the total number of contracts2- if the number of contracts that were re-tendered is between 11
to 15% of the total number of contracts1- if the number of contracts that were re-tendered is more than
15% of the total number of contracts
Number of contracts re-tendered due to technical discrepancies in NIT
specification
x 100
x 100

Quadrant No. KeyPerformanceIndicator KPIDefinition Formula
E&M\8
Financial
20 % Technical accuracy of NIT specification - Repair tenders
Measures the percentage of repair contracts which are re-tendered because of technical discrepancies in Repair tender’s NIT specification. Following scale to be adhered to for rating:5- if no contracts were re-tendered due to commercial
discrepancies4- if the number of contracts that were re-tendered is less than 5%
of the total number of contracts3- if the number of contracts that were re-tendered is between 6 to
10% of the total number of contracts2- if the number of contracts that were re-tendered is between 11
to 15% of the total number of contracts1- if the number of contracts that were re-tendered is more than
15% of the total number of contracts
Number of contracts re-tendered due to technical discrepancies in NIT
specification
21% Technical accuracy in scrutiny of bid documents - centralised capital item
Measures the percentage of repair contracts which are re-tendered because of technical discrepancies in scrutiny of bid documents. Following scale to be adhered to for rating:5- if no contracts were re-tendered due to technical discrepancies4- if the number of contracts that were re-tendered is less than 5%
of the total number of contracts3- if the number of contracts that were re-tendered is between 6 to
10% of the total number of contracts2- if the number of contracts that were re-tendered is between 11
to 15% of the total number of contracts1- if the number of contracts that were re-tendered is more than
15% of the total number of contracts
Number of contracts re-tendered due to technical discrepancies in scrutiny of bid
documents

Quadrant No. KeyPerformanceIndicator KPIDefinition Formula
E&M\9
Financial
22% Technical accuracy in scrutiny of bid documents - decentralised revenue item
Measures the percentage of repair contracts which are re-tendered because of technical discrepancies in scrutiny of bid documents. Following scale to be adhered to for rating:5- if no contracts were re-tendered due to technical discrepancies4- if the number of contracts that were re-tendered is less than 5%
of the total number of contracts3- if the number of contracts that were re-tendered is between 6 to
10% of the total number of contracts2- if the number of contracts that were re-tendered is between 11
to 15% of the total number of contracts1- if the number of contracts that were re-tendered is more than
15% of the total number of contracts
Number of contracts re-tendered due to technical discrepancies in scrutiny of bid
documents
23 % Technical accuracy in scrutiny of bid documents - repair tenders
Measures the percentage of repair contracts which are re-tendered because of technical discrepancies in scrutiny of bid documents. Following scale to be adhered to for rating:5- if no contracts were re-tendered due to technical discrepancies4- if the number of contracts that were re-tendered is less than 5%
of the total number of contracts handled3- if the number of contracts that were re-tendered is between 6 to
10% of the total number of contracts handled2- if the number of contracts that were re-tendered is between 11
to 15% of the total number of contracts handled1- if the number of contracts that were re-tendered is more than
15% of the total number of contracts handled
Number of contracts re-tendered due to technical discrepancies in scrutiny of bid
documents
24 % Technical accuracy of Tender Committee Recommendation
Measures the percentage of contracts which are re-tendered because of technical discrepancies in Tender Committee Recommendation. Following scale to be adhered to for rating:5- if no contracts were re-tendered due to technical discrepancies4- if the number of contracts that were re-tendered is less than 5%
of the total number of contracts handled3- if the number of contracts that were re-tendered is between 6 to
10% of the total number of contracts handled2- if the number of contracts that were re-tendered is between 11
to 15% of the total number of contracts handled1- if the number of contracts that were re-tendered is more than
15% of the total number of contracts handled
Number of contracts re-tendered due to technical discrepancies in the TCR

Quadrant No. KeyPerformanceIndicator KPIDefinition Formula
E&M\10
Customer
1 Power Availability %
Measures the availability of power at the unit level relative to the power available at source. Following scale to be adhered to for rating:5- if the power available at unit is 91% or above of the power
available at source4- if the power available at unit is between 81 to 90% of the power
available at source3- if the power available at unit is between 71 to 80% of the power
available at source2- if the power available at unit is between 61 to 70% of the power
available at source1- if the power available at unit is less than 60% of the power
available at source
Power available (in hours) at unit level
Power available (in hours) at source
2 Timely estimation of specific energy consumption target
Measures the days by which delay happened with regards to the estimation of the targeted specific energy consumption. Following scale to be adhered to for rating: 5- On or before time4- if delayed by a week3- if delayed by 2 weeks2- if delayed by 3 weeks1- If never submitted
Delay measured in days
3 Timely preparation of annual energy consumption plan
Measures the delay in days by which the annual energy consumption plan is prepared from the targeted date of preparation. Following scale to be adhered to for rating:5- On or before time4- if delayed by a week3- if delayed by 2 weeks2- if delayed by 3 weeks1- If never submitted
Delay measured in days
x 100

Quadrant No. KeyPerformanceIndicator KPIDefinition Formula
E&M\11
Customer
4 Maintenance of sub-station (in hours)
Measures the efficiency with which sub-station is being maintained during the year. Following scale to be adhered to for rating:5- if the number of hours power available is 91% or above of the
total hours4- if the number of hours power available is between 81 to 90% of
the total hours3- if the number of hours power available is between 71 to 80% of
the total hours2- if the number of hours power available is between 61 to 70% of
the total hours1- if the number of hours power available is less than 60% of the
total hours
Number of hours power available in the current year
(365 x 24)- Planned shutdown hours
5 Timely reply of Parliament/RTI Queries
Measures the number of RTIs which have been replied on time relative to total number of RTIs which have been replied. Following scale to be adhered to for rating:5- if the number of Parliament/RTI Queries replied within time is
100%4- if the number of Parliament/RTI Queries replied on time is
between 98%-99% of the total queries received3- if the number of Parliament/RTI Queries replied on time is
between 96%-97% of the total queries received2- if the number of Parliament/RTI Queries replied on time is
between 91%-95% of the total queries received1- if the number of Parliament/RTI Queries replied on time is less
than 90% of the total queries received
Number of Parliament/RTI Queries replied on time
Total number of Parliament/RTI Queries replied
x 100
x 100

Quadrant No. KeyPerformanceIndicator KPIDefinition Formula
E&M\12
Customer
6 Timely safety audit
Measures the number of times safety audit is being done by the due date. Following scale to be adhered to for rating:5- if the number of times audit was conducted on time is 91% or
above of the target4- if the number of times audit was conducted on time is between
81 to 90% of the target3- if the number of times audit was conducted on time is between
71 to 80% of the target2- if the number of times audit was conducted on time is between
61 to 70% of the target1- if the number of times audit was conducted on time is less than
60% of the target
Number of times safety audit was conducted on time
Target number of times safety audit was required to be
conducted
7 Compliance of violations identified by DGMS
Measures the percentage of the pending rate of action to be taken against DGMS voilations of safety norms for E&M activities. Following scale to be adhered to for rating:5- if the number of violations complied on time is 91% or above of
the violations reported4- if the number of violations complied on time is between 81 to
90% of the violations reported3- if the number of violations complied on time is between 71 to
80% of the violations reported2- if the number of violations complied on time is between 61 to
70% of the violations reported1- if the number of violations complied on time is less than 60% of
the violations reported
Number of violations complied on time
Total number of violations reported
x 100
x 100

Quadrant No. KeyPerformanceIndicator KPIDefinition Formula
E&M\13
Customer
8 Compliance of violations identified by ISO
Measures the percentage of the pending rate of action to be taken against ISO violations of safety norms for E&M activities. Following scale to be adhered to for rating:5- if the number of violations complied on time is 91% or above of
the violations reported4- if the number of violations complied on time is between 81 to
90% of the violations reported3- if the number of violations complied on time is between 71 to
80% of the violations reported2- if the number of violations complied on time is between 61 to
70% of the violations reported1- if the number of violations complied on time is less than 60% of
the violations reported
Number of violations complied on time
Total number of violations reported
9 Inventory in terms of month’s Consumption - E&M related spares
Measures the number of months running for which inventory is being purchased and stocked. Note: Running inventory = Total inventory - Dead inventory. Following scale to be adhered to for rating:5- if actual inventory (in months) is equal or less than the inventory
norm4- if actual inventory (in months) is upto 10% of the inventory norm3- if actual inventory (in months) is between 11 to 20 % of the
inventory norm2- if actual inventory (in months) is between 21 to 30% of the
inventory norm1- if actual inventory (in months) is above 31% of the inventory
norm
Inventory in value as on 31st March
Total consumption in value during the year
x 100
x 100

Quadrant No. KeyPerformanceIndicator KPIDefinition Formula
E&M\14
Customer
10Inventory in terms of month’s Consumption - E&M related consumable
Measures the number of months running for which inventory is being purchased and stocked. Note: Running inventory = Total inventory - Dead inventory. Following scale to be adhered to for rating:5- if actual inventory (in months) is equal or less than the inventory
norm4- if actual inventory (in months) is upto 10% of the inventory norm3- if actual inventory (in months) is between 11 to 20 % of the
inventory norm2- if actual inventory (in months) is between 21 to 30% of the
inventory norm1- if actual inventory (in months) is above 31% of the inventory
norm
Inventory in value as on 31st March
Total consumption in value during the year
11 CHP Availability %
Measures the effectiveness with which CHPs are being maintained for ensuring their optimum utilization. Following scale to be adhered to for rating:5- if the availability is more than the previous year4- if the availability is equal to the previous year’s3- if the availability is less than previous year’s by upto 5%2- if the availability is less than previous year’s by upto 10%1- if the availability is less than previous year’s by more than 10%"
Current year's availability Previous year's availability
12 SDL Availability %
Measures the effectiveness with which SDL equipments are being maintained for ensuring their optimum utilization to produce coal. Following scale to be adhered to for rating:5- if the availability is more than the previous year4- if the availability is equal to the previous year’s3- if the availability is less than previous year’s by upto 5%2- if the availability is less than previous year’s by upto 10%1- if the availability is less than previous year’s by more than 10%"
Current year's availability Previous year's availability
x 100
x 100
x 100

Quadrant No. KeyPerformanceIndicator KPIDefinition Formula
E&M\15
Customer
13 LHD Availability %
Measures the effectiveness with which LHD equipments are being maintained for ensuring their optimum utilization to produce coal. Following scale to be adhered to for rating:5- if the availability is more than the previous year4- if the availability is equal to the previous year’s3- if the availability is less than previous year’s by upto 5%2- if the availability is less than previous year’s by upto 10%1- if the availability is less than previous year’s by more than 10%"
Current year's availabilityPrevious year's availability
14 UDM Availability %
Measures the effectiveness with which UDM equipments are being maintained for ensuring their optimum utilization to produce coal. Following scale to be adhered to for rating:5- if the availability is more than the previous year4- if the availability is equal to the previous year’s3- if the availability is less than previous year’s by upto 5%2- if the availability is less than previous year’s by upto 10%1- if the availability is less than previous year’s by more than 10%"
Current year's availabilityPrevious year's availability
15 Long / Short Wall Availability %
Measures the effectiveness with which Long / Short Wall equipments are being maintained for ensuring their optimum utilization to produce coal. Following scale to be adhered to for rating:5- if the availability is more than the previous year4- if the availability is equal to the previous year’s3- if the availability is less than previous year’s by upto 5%2- if the availability is less than previous year’s by upto 10%1- if the availability is less than previous year’s by more than 10%
Current year's availability Previous year's availability
16 Continous Miner Availability %
Measures the effectiveness with which Continous Miner is being maintained for ensuring their optimum utilization to produce coal. Following scale to be adhered to for rating:5- if the availability is more than the previous year4- if the availability is equal to the previous year’s3- if the availability is less than previous year’s by upto 5%2- if the availability is less than previous year’s by upto 10%1- if the availability is less than previous year’s by more than 10%
Current year's availability Previous year's availability
x 100
x 100
x 100
x 100

Quadrant No. KeyPerformanceIndicator KPIDefinition Formula
E&M\16
Customer
17 Man Riding System Availability %
Measures the effectiveness with which Man Riding System is being maintained for ensuring their optimum utilization to produce coal. Following scale to be adhered to for rating:5- if the availability is more than the previous year4- if the availability is equal to the previous year’s3- if the availability is less than previous year’s by upto 5%2- if the availability is less than previous year’s by upto 10%1- if the availability is less than previous year’s by more than 10%
Current year's availability Previous year's availability
18 High Wall Availability %
Measures the effectiveness with which High Wall equipments are being maintained for ensuring their optimum utilization to produce coal. Following scale to be adhered to for rating:5- if the availability is more than the previous year4- if the availability is equal to the previous year’s3- if the availability is less than previous year’s by upto 5%2- if the availability is less than previous year’s by upto 10%1- if the availability is less than previous year’s by more than 10%
Current year's availability Previous year's availability
19 Pump Availability at main pump of UG mine %
Measures the effectiveness with which Pump are being maintained for ensuring their optimum utilization to produce coal. Following scale to be adhered to for rating:5- if 100% of installed capacity is maintained during monsoon4- if 96% to 99% of installed capacity is maintained during
monsoon3- if 91% to 95% of installed capacity is maintained during
monsoon2- if 86% to 90% of installed capacity is maintained during
monsoon1- if 85% or less of installed capacity is maintained during monsoon
Installed capacity maintained Total Installed capacity available
x 100
x 100
x 100

Quadrant No. KeyPerformanceIndicator KPIDefinition Formula
E&M\17
Customer
20 Winding Engine Availability %
Measures the effectiveness with which Winding machine is being maintained for ensuring their optimum utilization to produce coal. Following scale to be adhered to for rating:5- if the availability is more than the previous year4- if the availability is equal to the previous year’s3- if the availability is less than previous year’s by upto 5%2- if the availability is less than previous year’s by upto 10%1- if the availability is less than previous year’s by more than 10%
Current year's availability Previous year's availability
21 Main trunk at Belt conveyors Availability at UG%
Measures the effectiveness with which Belt conveyors are being maintained for ensuring their optimum utilization to produce coal. Following scale to be adhered to for rating:5- if the actual available hours is 100% of the total hours4- if the actual available hours is between 96% to 99% of the total
hours3- if the actual available hours is between 91% to 95% of the total
hours2- if the actual available hours is between 86% to 90% of the total
hours1- if the actual available hours is less than 85% or less of the total
hours
Actual available hoursTotal hours - scheduled
maintenance hours
22 Skip Machine Availability %
Measures the effectiveness with which Skip machine is being maintained for ensuring their optimum utilization to produce coal. Following scale to be adhered to for rating:5- if the availability is more than the previous year4- if the availability is equal to the previous year’s3- if the availability is less than previous year’s by upto 5%2- if the availability is less than previous year’s by upto 10%1- if the availability is less than previous year’s by more than 10%
Current year's availability Previous year's availability
x 100
x 100
x 100

Quadrant No. KeyPerformanceIndicator KPIDefinition Formula
E&M\18
Customer
23 Haulage Availability % for tub mining
Measures the effectiveness with which haulage are being maintained for ensuring their optimum utilization to produce coal. Following scale to be adhered to for rating:5- if the actual available hours is 100% of the total hours4- if the actual available hours is between 96% to 99% of the total
hours3- if the actual available hours is between 91% to 95% of the total
hours2- if the actual available hours is between 86% to 90% of the total
hours1- if the actual available hours is less than 85% or less of the total
hours
Actual available hoursTotal hours - scheduled
maintenance hours
24 Ventilation Fan Availability %
Measures the effectiveness with which ventilation fans are being maintained for ensuring their optimum utilization to produce coal. Following scale to be adhered to for rating:5- if the availability is more than the previous year4- if the availability is equal to the previous year’s3- if the availability is less than previous year’s by upto 5%2- if the availability is less than previous year’s by upto 10%1- if the availability is less than previous year’s by more than 10%
Current year's availability Previous year's availability
25 Feeder Braker or Crusher Availability %
Measures the effectiveness with which Feeder Braker or Crusher is being maintained for ensuring their optimum utilization to produce coal. Following scale to be adhered to for rating:5- if the availability is more than the previous year4- if the availability is equal to the previous year’s3- if the availability is less than previous year’s by upto 5%2- if the availability is less than previous year’s by upto 10%1- if the availability is less than previous year’s by more than 10%
Current year's availability Previous year's availability
x 100
x 100
x 100

Quadrant No. KeyPerformanceIndicator KPIDefinition Formula
E&M\19
Customer
26 Department vehicles / pay loader Availability %
Measures the effectiveness with which vehicle are being maintained for ensuring their optimum utilization. Following scale to be adhered to for rating:5- if the availability is more than the previous year4- if the availability is equal to the previous year’s3- if the availability is less than previous year’s by upto 5%2- if the availability is less than previous year’s by upto 10%1- if the availability is less than previous year’s by more than 10%
Current year's availabilityPrevious year's availability
27 Availability of weighbridges
Measures the availability percentage of weighbridges in hours relative to the targeted number of hours for which the same should be available. Following scale to be adhered to for rating:5- if the availability of weighbridge is 91% or above of the target4- if the availability of weighbridge is between 81 to 90% of the
target3- if the availability of weighbridge is between 71 to 80% of the
target2- if the availability of weighbridge is between 61 to 70% of the
target1- if the availability of weighbridge is less than 60% of the target
Actual number of hours for which weighbridges are available
Targeted number of hours for which weighbridges are required
to be available
28 Stockout situation
Measures the thoroughness with which material budget is being prepared. Following scale to be adhered to for rating:5- if the no. of NA issued is upto 1% of total indents raised4- if the no. of NA issued is between 1 to 5% of total indents raised3- if the no. of NA issued is between 5 to 6% of total indents raised2- if the no. of NA issued is between 7 to 12% of total indents raised1- if the no. of NA issued is more than 12% of total indents raised
Number of items not included in the E&M material budget for which NA has
been issued
x 100
x 100

Quadrant No. KeyPerformanceIndicator KPIDefinition Formula
E&M\20
Customer
29 Incidents of premature failure of mechanically repaired item
Measures the premature failure rate of those assemblies that failed later on (excluding cases of operational abuse and poor maintenance at project). Following scale to be adhered to for rating:5- if the number of premature failures of assembly is zero4- if the number of premature failures of assembly is equal to or less
than 5% of the total assemblies produced3- if the number of premature failures of assembly is greater than
5% and equal to or less than 7% of the total assemblies produced2- if the number of premature failures of assembly is greater
than 7% and equal to or less than 10% of the total assemblies produced
1- if the number of premature failures of assembly is greater than 10% of the total assemblies produced.
Number of premature failures of assembly
30 Incidents of premature failure of electrically repaired item
Measures the premature failure rate of those assemblies that failed later on (excluding cases of operational abuse and poor maintenance at project).Following scale to be adhered to for rating:5- if the number of premature failures of assembly is zero4- if the number of premature failures of assembly is equal to or less
than 5% of the total assemblies produced3- if the number of premature failures of assembly is greater than
5% and equal to or less than 7% of the total assemblies produced2- if the number of premature failures of assembly is greater
than 7% and equal to or less than 10% of the total assemblies produced
1- if the number of premature failures of assembly is greater than 10% of the total assemblies produced.
Number of premature failures of assembly

Quadrant No. KeyPerformanceIndicator KPIDefinition Formula
E&M\21
Customer
31 Performance of the electrically repaired item
Measures the efficiency with which the repaired item has performed captured by the number of hours attained by the mechanical equipment delivered relative to expected number of hours.Following scale to be adhered to for rating:5- if the actual life attained is 91% or above of the expected life4- if the actual life attained is between 81 to 90% of the expected
life3- if the actual life attained is between 71 to 80% of the expected
life2- if the actual life attained is between 61 to 70% of the expected
life1- if the actual life attained is less than 60% of the expected life
Actual life attained (in hours)
Expected life to be attained (in hours)
32 Performance of the mechanically repaired item
Measures the efficiency with which the repaired item has performed captured by the number of hours attained by the mechanical equipment delivered relative to expected number of hours.Following scale to be adhered to for rating:5- if the actual life attained is 91% or above of the expected life4- if the actual life attained is between 81 to 90% of the expected
life3- if the actual life attained is between 71 to 80% of the expected
life2- if the actual life attained is between 61 to 70% of the expected
life1- if the actual life attained is less than 60% of the expected life
Actual life attained (in hours)
Expected life to be attained (in hours)
33 Maturity of E&M tender - centralised item
Measures the number of tenders which were finalized within validity period relative to the total number of tenders placed. Following scale to be adhered to for rating:5- if the number of tenders finalized within validity period is 91%
and above of the tenders floated4- if the number of tenders finalized within validity period is
between 81 to 90% of the tenders floated3- if the number of tenders finalized within validity period is
between 71 to 80% of the tenders floated2- if the number of tenders finalized within validity period is
between 61 to 70% of the tenders floated1- if the number of tenders finalized within validity period is less
than 60% of the tenders floated
Number of tenders finalized within the validity period
Number of tenders floated during the year
x 100
x 100
x 100

Quadrant No. KeyPerformanceIndicator KPIDefinition Formula
E&M\22
Customer
34 Maturity of E&M tender - decentralised item
Measures the number of tenders which were finalized within validity period relative to the total number of tenders placed. Following scale to be adhered to for rating:5- if the number of tenders finalized within validity period is 91%
and above of the tenders floated4- if the number of tenders finalized within validity period is
between 81 to 90% of the tenders floated3- if the number of tenders finalized within validity period is
between 71 to 80% of the tenders floated2- if the number of tenders finalized within validity period is
between 61 to 70% of the tenders floated1- if the number of tenders finalized within validity period is less
than 60% of the tenders floated
Number of tenders finalized within the validity period
Number of tenders floated during the year
35 Maturity of tender - repair item
Measures the number of tenders which were finalized within validity period relative to the total number of tenders placed. Following scale to be adhered to for rating:5- if the number of tenders finalized within validity period is 91%
and above of the tenders floated4- if the number of tenders finalized within validity period is
between 81 to 90% of the tenders floated3- if the number of tenders finalized within validity period is
between 71 to 80% of the tenders floated2- if the number of tenders finalized within validity period is
between 61 to 70% of the tenders floated1- if the number of tenders finalized within validity period is less
than 60% of the tenders floated
Number of tenders finalized within the validity period
Number of tenders floated during the year
x 100
x 100

Quadrant No. KeyPerformanceIndicator KPIDefinition Formula
E&M\23
Process
1 % of sized coal dispatched
Measures the percentage of sized (crushed) coal dispatched as per the Annual Action Plan (AAP). Note: the grade of dispatched coal should be as per the MoU target. Following scale to be adhered to for rating:5- if the quantity of sized coal is 91% or above vis a vis the total
quantity dispatched4- if the quantity of sized coal is between 81 to 90% vis a vis the
total quantity dispatched3- if the quantity of sized coal is between 71 to 80% vis a vis the
total quantity dispatched2- if the quantity of sized coal is between 61 to 70% vis a vis the
total quantity dispatched1- if the quantity of sized coal is less than 60% or less vis a vis the
total quantity dispatched
Quantity of sized (crushed) coal dispatched (in tonnes)
Total quantity of coal dispatched (in tonnes)
2 CHP capacity utilization
Measures the rate at which Coal Handling Plant is getting utilized for inflow and outflow (dispatch) of coal. Following scale to be adhered to for rating:5- if the quantity of coal handled is 91% or above of the installed
capacity4- if the quantity of coal handled is between 81 to 90% of the
installed capacity3- if the quantity of coal handled is between 71 to 80% of the
installed capacity2- if the quantity of coal handled is between 61 to 70% of the
installed capacity1- if the quantity of coal handled is less than 60% of the installed
capacity
Actual quantity of coal handled (in tonnes)
Installed capacity (in tonnes)
x 100
x 100

Quadrant No. KeyPerformanceIndicator KPIDefinition Formula
E&M\24
Process
3 Survey off of P&M items / equipments
Measures the degree to which life of an equipments is getting tracked for facilitating correct mine capacity by not delaying the survey off procedure. Following scale to be adhered to for rating:5- if the number of equipments processed for survey off is 91% or
above of the equiments due for survey off4- if the number of equipments processed for survey off is between
81 to 90% of the equiments due for survey off3- if the number of equipments processed for survey off is between
71 to 80% of the equiments due for survey off2- if the number of equipments processed for survey off is between
61 to 70% of the equiments due for survey off1- if the number of equipments processed for survey off is less than
60% of the equiments due for survey off
Total number of equipments processed for survey off
Total number of equipments due for survey off as per company
policy
4No. of capital item related survey off reports processed with the specified time frame
Measures the timely processing of capital item related survey off reports Following scale to be adhered to for rating:5- if the number of equipments processed for survey off is 91% or
above of the equiments due for survey off4- if the number of equipments processed for survey off is between
81 to 90% of the equiments due for survey off3- if the number of equipments processed for survey off is between
71 to 80% of the equiments due for survey off2- if the number of equipments processed for survey off is between
61 to 70% of the equiments due for survey off1- if the number of equipments processed for survey off is less than
60% of the equiments due for survey off
Number of capital item related survey off reports processed within specified timeframe
Total number of capital item related survey off reports
processed
x 100
x 100

Quadrant No. KeyPerformanceIndicator KPIDefinition Formula
E&M\25
Process
5 Replacement of surveyed off equipments
Measures the number of equipments replaced against survey off. Following scale to be adhered to for rating:5- if the number of equipments replaced against survey off is 91%
or above of the equiments to be replaced4- if the number of equipments replaced against survey off is
between 81 to 90% of the equiments to be replaced3- if the number of equipments replaced against survey off is
between 71 to 80% of the equiments to be replaced2- if the number of equipments replaced against survey off is
between 61 to 70% of the equiments to be replaced1- if the number of equipments replaced against survey off is less
than 60% of the equiments to be replaced
Number of equipments replaced against the surveyed off
equipments Targeted number of equipments
to be replaced
6 Indent processing
Measures the extent to which the indent that has been submitted to MM for initiating procurement is complete from all respect for initiating procurement .Following scale to be adhered to for rating:5- if the actual number of indents where Technical Scrutiny &
other parameters were furnished after approval of indent by Competent Authority on request of Material Management Department is 0%
4- if the actual number of indents where Technical Scrutiny & other parameters were furnished after approval of indent by Competent Authority on request of Material Management Department is between 1% to 2% of the total indents submitted
3- if the actual number of indents where Technical Scrutiny & other parameters were furnished after approval of indent by Competent Authority on request of Material Management Department is between 3% to 5% of the total indents submitted
2- if the actual number of indents where Technical Scrutiny & other parameters were furnished after approval of indent by Competent Authority on request of Material Management Department is between 6% to 8% of the total indents submitted
1- if the actual number of indents where Technical Scrutiny & other parameters were furnished after approval of indent by Competent Authority on request of Material Management Department is 8% or above of the total indents submitted
Number of indents where Technical Scrutiny & other
parameters were furnished after approval of indent by Competent
Authority Department Total number
of Indents submitted to MM Department
x100
x100

Quadrant No. KeyPerformanceIndicator KPIDefinition Formula
E&M\26
Process
7 Equipment utilization (on roll basis)
Measures the actual utilization of equipments by against the norm. Following scale to be adhered to for rating:5- if the actual utilization of UG equipments is 91% or above of the
utilization as per norm4- if the actual utilization of UG equipments is between 81 to 90%
of the utilization as per norm3- if the actual utilization of UG equipments is between 71 to 80%
of the utilization as per norm2- if the actual utilization of UG equipments is between 61 to 70%
of the utilization as per norm1- if the actual utilization of UG equipments is less than 60% of the
utilization as per norm
Actual utilization of UG equipments
Utilization of UG equipments as per norm
8 Technical Scrutiny of Bids
Measures the number of bids for which the technical scrutiny was accurately done relative to total number of bids received. Following scale to be adhered to for rating:5- if the number of bids scrutinized is 91% or above of the proposals
received4- if the number of bids scrutinized is between 81 to 90% of the
proposals received3- if the number of bids scrutinized is between 71 to 80% of the
proposals received2- if the number of bids scrutinized is between 61 to 70% of the
proposals received1- if the number of bids scrutinized is less than 60% of the proposals
received
Actual number of technical scrutiny of bid documents
Total number of bid documents received
9 Timely renewal of AMC
Measures the percentage of AMCs that are renewed within 2 months of the expiry date. Following scale to be adhered to for rating:5- if the number of AMCs renewed within 2 months is 91% or above4- if the number of AMCs renewed within 2 months is between 81
to 90%3- if the number of AMCs renewed within 2 months is between 71
to 80%2- if the number of AMCs renewed within 2 months is between 61
to 70%1- if the number of AMCs renewed within 2 months is less than 60%
Number of AMCs renewed within 2 months of the expiry date
Total number of AMCs renewed
x100
x100
x100

Quadrant No. KeyPerformanceIndicator KPIDefinition Formula
E&M\27
Process
10 Coal Production achievement %
Measures the actual quantity of coal produced for the organisation v/s target. Following scale to be adhered to for rating:5- if the actual coal production is 91% or above the target4- if the actual coal production is between 81 to 90% of the target3- if the actual coal production is between 71 to 80% of the target2- if the actual coal production is between 61 to 70% of the target1- if the actual coal production is less than 60% of the target
Actual Coal Production (in tonnes)
Targeted Coal Production (in tonnes)
11Number of safety violations identified in tri-partite meetings related to E&M department
Measures the total number of safety violations identified in tri-partite meetings (DGMS, trade union and management). Following scale to be adhered to for rating:5- if the number of safety violations identified in tri-partite
meetings is zero4- if the number of safety violations identified in tri-partite
meetings is less than previous year3- if the number of safety violations identified in tri-partite
meetings is equal to previous year2- if the number of safety violations identified in tri-partite
meetings is more than previous year1- if the number of safety violations identified in tri-partite
meetings is double than previous year.
Number of safety violations identified in tri-partite meetings in the current year
12Number of safety violations identified in E&M department by DGMS authorities
Measures the total number of safety violations identified by the DGMS auditors. Following scale to be adhered to for rating:5- if the number of safety violations identified by DGMS auditors is
zero4- if the number of safety violations identified by DGMS auditors is
less than previous year3- if the number of safety violations identified by DGMS auditors is
equal to previous year2- if the number of safety violations identified by DGMS auditors is
more than previous year1- if the number of safety violations identified by DGMS auditors is
double than previous year
Number of safety violations identified by DGMS auditors in the current year
x 100

Quadrant No. KeyPerformanceIndicator KPIDefinition Formula
E&M\28
Process
13Number of safety violations identified in E&M department by ISO
Measures the total number of safety violations identified by the ISO. Following scale to be adhered to for rating:5- if the number of safety violations identified by ISO is zero4- if the number of safety violations identified by ISO is less than
previous year3- if the number of safety violations identified by ISO is equal to
previous year2- if the number of safety violations identified by ISO is more than
previous year1- if the number of safety violations identified by ISO is double than
previous year
Number of safety violations identified by ISO in the current year
14 Timely preparation & submission of material budget - centralised items
Measures the number of times when material budget was prepared and submitted as per scheduled relative to total number of material budgets. Following scale to be adhered to for rating: 5- On or before time4- if delayed by a week3- if delayed by 2 weeks2- if delayed by 3 weeks1- If never submitted
Delay measured in days
15Timely preparation & submission of material budget - decentralised items
Measures the number of times when material budget was prepared and submitted as per scheduled relative to total number of material budgets. Following scale to be adhered to for rating: 5- On or before time4- if delayed by a week3- if delayed by 2 weeks2- if delayed by 3 weeks1- If never submitted
Delay measured in days

Quadrant No. KeyPerformanceIndicator KPIDefinition Formula
E&M\29
Process
16 % Utilization of revenue budget
Measures the actual utilisation/expenditure against the provision. Following rating scale to be adhered for rating :5- If percentage is 91% and above4- If percentage is between 81%-90%3- If percentage is between 71%-80%2- If percentage is between 71%-60%1- If percentage is less than 60
Actual budget consumed (in Rs.)
Allocated budget (in Rs.)
17 Audit Paragraph
A measure that highlights the degree to which documentation and process execution is in sync with the standard operating procedures of the company. Following scale to be adhered to for rating:5- if the number of audit paragraphs that have been dropped is
100% 4- if the number of audit paragraphs that have been dropped is
between 91 to 99% of the number raised3- if the number of audit paragraphs that have been dropped is
between 81 to 90% of the number raised2- if the number of audit paragraphs that have been dropped is
between 61 to 80% of the number raised1- if the number of audit paragraphs that have been dropped is less
than 60% of the number raised
Actual number of audit paragraphs dropped
Actual number of audit paragraphs raised
x 100
x 100

Quadrant No. KeyPerformanceIndicator KPIDefinition Formula
E&M\30
Process
18 % Performance appraisal participation rate
Measures the % of employees who submitted the filled goal sheets at the start of the year within the stipulated time frame out of the total number of employees who were required to fill up the goal sheets. Following scale to be adhered to for rating:5- if the number of employees who have submitted their appraisal
form by due date is 100% 4- if the number of employees who have submitted their appraisal
form by due date is between 95 to 99% of the total target population of the eligible employees
3- if the number of employees who have submitted their appraisal form by due date is between 91 to 94% of the total target population of the eligible employees
2- if the number of employees who have submitted their appraisal form by due date is between 81 to 90% of the total target population of the eligible employees
1- if the number of employees who have submitted their appraisal form by due date is less than 80% of the total target population of the eligible employees
Number of employees who submitted their appraisal form
within the due date Total target population of the
eligible employees
19 % Performance appraisal completed on time
Measures the proportion of employee performance appraisals completed as scheduled (at the end of the year) from the total appraisals due. Following scale to be adhered to for rating:5- if the number of employees who have been appraised by due
date is 100%4- if the number of employees who have been appraised by due
date is between 95 to 99% of the total target population of the eligible employees
3- if the number of employees who have been appraised by due date is between 91 to 94% of the total target population of the eligible employees
2- if the number of employees who have been appraised by due date is between 81 to 90% of the total target population of the eligible employees
1- if the number of employees who have been appraised by due date is less than 80% of the total target population of the eligible employees
No. of employees appraised by due date
Total target population of the employees
x 100
x 100

Quadrant No. KeyPerformanceIndicator KPIDefinition Formula
E&M\31
Process
20 Annual MIS reports submitted on time
Measures the delay in submission of annual report beyond stipulated date. Note: 30th June is the deadline for each year. Following scale to be adhered to for rating:5- On or before time4- if delayed by a week3- if delayed by 2 weeks2- if delayed by 3 weeks1- If never submitted.
Delay measured in days
21 Timely submission of monthly report
Measures the number of times when monthly report of power requirement and availability of power is submitted to subsidiaries, power supply agencies and MoC on time. Following scale to be adhered to for rating:5- if the number of reports submitted on time is 91% or above the
total reports4- if the number of reports submitted on time is between 81 to 90%
of the total reports3- if the number of reports submitted on time is between 71 to 80%
of the total reports2- if the number of reports submitted on time is between 61 to 80%
of the total reports1- if the number of reports submitted on time is less than 60% of
the total reports
Number of times monthly report was submitted on time
Total number of reports to be submitted
22 Timely submission of daily report
Measures the number of times when daily report of power requirement and availability of power is submitted to subsidiaries, power supply agencies and MoC on time. Following scale to be adhered to for rating:5- if the number of reports submitted on time is 91% or above the
total reports4- if the number of reports submitted on time is between 81 to 90%
of the total reports3- if the number of reports submitted on time is between 71 to 80%
of the total reports2- if the number of reports submitted on time is between 61 to 80%
of the total reports1- if the number of reports submitted on time is less than 60% of
the total reports
Number of times daily report was submitted on time
Total number of days when report was submitted
x100
x100

Quadrant No. KeyPerformanceIndicator KPIDefinition Formula
E&M\32
Process
23 Timely preparation of technical specification related to NITs
Measures the number of times when technical specific information (NITs) were prepared on time relative to total number of times when they were prepared. Following scale to be adhered to for rating:5- if the number of times technical specifications were prepared on
time is 91% or above the total specifications prepared4- if the number of times technical specifications were prepared on
time is between 81 to 90% of the total specifications prepared3- if the number of times technical specifications were prepared on
time is between 71 to 80% of the total specifications prepared2- if the number of times technical specifications were prepared on
time is between 61 to 80% of the total specifications prepared1- if the number of times technical specifications were prepared on
time is less than 60% of the total specifications prepared
Number of times when technical specifications were prepared on
time Total number of times when technical specifications were
prepared
24 Number of violations identified by road transportation authorities
Measures the total number of safety violations identified by the road transportation authorities. Following scale to be adhered to for rating:5- if the number of safety violations identified by road
transportation authorities is zero4- if the number of safety violations identified by road
transportation authorities is less than previous year3- if the number of safety violations identified by road
transportation authorities is equal to previous year2- if the number of safety violations identified by road
transportation authorities is more than previous year1- if the number of safety violations identified by road
transportation authorities is double than previous year.
Number of safety violations identified by road transportation authorities in the
current year
25 Settlement of cases with electricity supply company
Measures the number of cases with the electricity supply company which have been settled relative to targeted number of cases required to be settled. Following scale to be adhered to for rating:5- if the number of cases settled is 91% or above the target4- if the number of cases settled is between 81 to 90% of the target3- if the number of cases settled is between 71 to 80% of the target2- if the number of cases settled is between 61 to 80% of the target1- if the number of cases settled is less than 60% of the target
Actual number of cases settled with electricity supply company
Total number of target cases required to be settled with electricity supply company
x100
x100

Quadrant No. KeyPerformanceIndicator KPIDefinition Formula
E&M\33
Process
26 Timely compilation & submission of monthly workshop activity report
Measures the number of workshop activity reports which have been compiled and submitted on time relative to total number of reports to be submitted. Following scale to be adhered to for rating:5- if the number of reports submitted on time is 91% or above the
target4- if the number of reports submitted on time is between 81 to 90%
of the target3- if the number of reports submitted on time is between 71 to 80%
of the target2- if the number of reports submitted on time is between 61 to 80%
of the target1- if the number of reports submitted on time is less than 60% of
the target
Number of reports compiled and submitted on time
Total number of reports to be compiled and submitted
27 Overhauling of equipments at workshop
Measures the number of equipments which have been overhauled relative to total number of equipments which have to be overhauled. Following scale to be adhered to for rating:5- if the number of equipments overhauled is 91% or above the
target4- if the number of equipments overhauled is between 81 to 90% of
the target3- if the number of equipments overhauled is between 71 to 80% of
the target2- if the number of equipments overhauled is between 61 to 80% of
the target1- if the number of equipments overhauled is less than 60% of the
target
Number of equipments overhauled
Total number of equipments to be overhauled
x 100
x 100

Quadrant No. KeyPerformanceIndicator KPIDefinition Formula
E&M\34
Process
28 Machine Idle Hour due to non availability of power supply
Measures the actual time which for which machine is kept idle due to non availability of power supply Following scale to be adhered to for rating:5- if the number of idle hours due to non avaliability of power is
less than 1% of the total available working hours4- if the number of idle hours due to non avaliability of power is
more than 1% but less than 2% of the total available working hours
3- if the number of idle hours due to non avaliability of power is more than 2% but less than 3% of the total available working hours
2- if the number of idle hours due to non avaliability of power is more than 3% but less than 4% of the total available working hours
1- if the number of idle hours due to non avaliability of power is more than 4% of the total available working hours
Actual idle hours per day due to non availability of power
Available hours – (Breakdown hours + maintenance hours +
travel time)
29 Providing coal tub
Measures the number of coal tubs which have been provided relative to the coal tubs to be provided. Following scale to be adhered to for rating:5- if the number of coal tubs provided is 91% or above of the coal
tubs to be provided4- if the number of coal tubs provided is between 81 to 90% of the
coal tubs to be provided3- if the number of coal tubs provided is between 71 to 80% of the
coal tubs to be provided2- if the number of coal tubs provided is between 61 to 70% of the
coal tubs to be provided1- if the number of coal tubs provided is less than 60% of the coal
tubs to be provided
Number of coal tubs provided Number of coal tubs to be
provided
x 100
x 100

Quadrant No. KeyPerformanceIndicator KPIDefinition Formula
E&M\35
Process
30 Providing rollers
Measures the number of rollers which have been provided relative to the rollers to be provided. Following scale to be adhered to for rating:5- if the number of rollers provided is 91% or above of the rollers to
be provided4- if the number of rollers provided is between 81 to 90% of the
rollers to be provided3- if the number of rollers provided is between 71 to 80% of the
rollers to be provided2- if the number of rollers provided is between 61 to 70% of the
rollers to be provided1- if the number of rollers provided is less than 60% of the rollers to
be provided
Number of rollers provided Number of rollers to be provided
31 Providing CI & Ferrous casting
Measures the number of CI & Ferrous casting which have been provided relative to the CI & Ferrous casting to be provided. Following scale to be adhered to for rating:5- if the number of CI & Ferrous casting provided is 91% or above of
the CI & Ferrous casting to be provided4- if the number of CI & Ferrous casting provided is between 81 to
90% of the CI & Ferrous casting to be provided3- if the number of CI & Ferrous casting provided is between 71 to
80% of the CI & Ferrous casting to be provided2- if the number of CI & Ferrous casting provided is between 61 to
70% of the CI & Ferrous casting to be provided1- if the number of CI & Ferrous casting provided is less than 60% of
the CI & Ferrous casting to be provided
Number of CI & Ferrous casting provided
Number of CI & Ferrous casting to be provided
x 100
x 100

Quadrant No. KeyPerformanceIndicator KPIDefinition Formula
E&M\36
Process
32 Providing bearing plates of roof bolts
Measures the number of bearing plates which have been provided relative to the bearing plates to be provided. Following scale to be adhered to for rating:5- if the number of bearing plates provided is 91% or above of the
bearing plates to be provided4- if the number of bearing plates provided is between 81 to 90% of
the bearing plates to be provided3- if the number of bearing plates provided is between 71 to 80% of
the bearing plates to be provided2- if the number of bearing plates provided is between 61 to 70% of
the bearing plates to be provided1- if the number of bearing plates provided is less than 60% of the
bearing plates to be provided
Number of bearing plates provided
Number of bearing plates to be provided
33 Repairing Pumps
Measures the number of pumps which have been repaired relative to the pumps to be repaired.Following scale to be adhered to for rating:5- if the number of pumps repaired is 91% or above of the pumps
to be repaired4- if the number of pumps repaired is between 81 to 90% of pumps
to be repaired3- if the number of pumps repaired is between 71 to 80% of pumps
to be repaired2- if the number of pumps repaired is between 61 to 70% of pumps
to be repaired1- if the number of pumps repaired is less than 60% of the pumps
to be repaired
Number of pumps repaired Number of pumps to be repaired
34 Repairing Engines
Measures the number of engines which have been repaired relative to the engines to be repaired.Following scale to be adhered to for rating:5- if the number of engines repaired is 91% or above of the engines
to be repaired4- if the number of engines repaired is between 81 to 90% of
engines to be repaired3- if the number of engines repaired is between 71 to 80% of
engines to be repaired2- if the number of engines repaired is between 61 to 70% of
engines to be repaired1- if the number of engines repaired is less than 60% of the engines
to be repaired
Number of engines repaired Number of engines to be repaired
x 100
x 100
x100

Quadrant No. KeyPerformanceIndicator KPIDefinition Formula
E&M\37
Process
35 Repairing drive heads of conveyor belts
Measures the number of drive heads of conveyor belts which have been repaired relative to the drive heads of conveyor belts to be repaired.Following scale to be adhered to for rating:5- if the number of drive heads repaired is 91% or above of the drive
heads to be repaired4- if the number of drive heads repaired is between 81 to 90% of
drive heads to be repaired3- if the number of drive heads repaired is between 71 to 80% of
drive heads to be repaired2- if the number of drive heads repaired is between 61 to 70% of
drive heads to be repaired1- if the number of drive heads repaired is less than 60% of the drive
heads to be repaired
Number of drive heads of conveyor belts repaired
Number of drive heads of conveyor belts to be repaired
36 Repairing motors
Measures the number of motors which have been repaired relative to the motors to be repaired.Following scale to be adhered to for rating:5- if the number of motors repaired is 91% or above of the motors
to be repaired4- if the number of motors repaired is between 81 to 90% of motors
to be repaired3- if the number of motors repaired is between 71 to 80% of motors
to be repaired2- if the number of motors repaired is between 61 to 70% of motors
to be repaired1- if the number of motors repaired is less than 60% of the motors
to be repaired
Number of motors repaired Number of motors to be repaired
x 100
x 100

Quadrant No. KeyPerformanceIndicator KPIDefinition Formula
E&M\38
Process
37 Repairing switches
Measures the number of switches which have been repaired relative to the switches to be repaired.Following scale to be adhered to for rating:5- if the number of switches repaired is 91% or above of the
switches to be repaired4- if the number of switches repaired is between 81 to 90% of
switches to be repaired3- if the number of switches repaired is between 71 to 80% of
switches to be repaired2- if the number of switches repaired is between 61 to 70% of
switches to be repaired1- if the number of switches repaired is less than 60% of the
switches to be repaired
Number of switches repaired Number of switches to be
repaired
38 Repairing compressors
Measures the number of compressors which have been repaired relative to the compressors to be repaired.Following scale to be adhered to for rating:5- if the number of compressors repaired is 91% or above of the
compressors to be repaired4- if the number of compressors repaired is between 81 to 90% of
compressors to be repaired3- if the number of compressors repaired is between 71 to 80% of
compressors to be repaired2- if the number of compressors repaired is between 61 to 70% of
compressors to be repaired1- if the number of compressors repaired is less than 60% of the
compressors to be repaired
Number of compressors repaired Number of compressors to be
repaired
x 100
x 100

Quadrant No. KeyPerformanceIndicator KPIDefinition Formula
E&M\39
Process
39 Repairing transformers
Measures the number of transformers which have been repaired relative to the transformers to be repaired.Following scale to be adhered to for rating:5- if the number of transformers repaired is 91% or above of the
transformers to be repaired4- if the number of transformers repaired is between 81 to 90% of
transformers to be repaired3- if the number of transformers repaired is between 71 to 80% of
transformers to be repaired2- if the number of transformers repaired is between 61 to 70% of
transformers to be repaired1- if the number of transformers repaired is less than 60% of the
transformers to be repaired
Number of transformers repaired
Number of transformers to be repaired
40 Repairing roof bolting machines
Measures the number of roof bolting machines which have been repaired relative to the roof bolting machines to be repaired .Following scale to be adhered to for rating:5- if the number of roof bolting machines repaired is 91% or above
of the roof bolting machines to be repaired4- if the number of roof bolting machines repaired is between 81 to
90% of roof bolting machines to be repaired3- if the number of roof bolting machines repaired is between 71 to
80% of roof bolting machines to be repaired2- if the number of roof bolting machines repaired is between 61 to
70% of roof bolting machines to be repaired1- if the number of roof bolting machines repaired is less than 60%
of the roof bolting machines to be repaired
Number of roof bolting machines repaired
Number of roof bolting machines to be repaired
x 100
x 100

Quadrant No. KeyPerformanceIndicator KPIDefinition Formula
E&M\40
Process
41 Repairing haulages
Measures the number of haulages which have been repaired relative to the haulages to be repaired .Following scale to be adhered to for rating:5- if the number of haulages repaired is 91% or above of the
haulages to be repaired4- if the number of haulages repaired is between 81 to 90% of
haulages to be repaired3- if the number of haulages repaired is between 71 to 80% of
haulages to be repaired2- if the number of haulages repaired is between 61 to 70% of
haulages to be repaired1- if the number of haulages repaired is less than 60% of the
haulages to be repaired
Number of haulages repaired Number of haulages to be
repaired
42 Repairing light motor vehicles (LMV)
Measures the number of light motor vehicles (LMV) which have been repaired relative to the light motor vehicles (LMV) to be repaired .Following scale to be adhered to for rating:5- if the number of LMVs repaired is 91% or above of the LMVs to be
repaired4- if the number of LMVs repaired is between 81 to 90% of LMVs to
be repaired3- if the number of LMVs repaired is between 71 to 80% of LMVs to
be repaired2- if the number of LMVs repaired is between 61 to 70% of LMVs to
be repaired1- if the number of LMVs repaired is less than 60% of the LMVs to be
repaired
Number of LMVs repaired Number of LMVs to be repaired
x 100
x 100

Quadrant No. KeyPerformanceIndicator KPIDefinition Formula
E&M\41
Process
43 Repairing SDL
Measures the number of SDL which have been repaired relative to the SDL to be repaired .Following scale to be adhered to for rating:5- if the number of SDL repaired is 91% or above of the SDL to be
repaired4- if the number of SDL repaired is between 81 to 90% of SDL to be
repaired3- if the number of SDL repaired is between 71 to 80% of SDL to be
repaired2- if the number of SDL repaired is between 61 to 70% of SDL to be
repaired1- if the number of SDL repaired is less than 60% of the SDL to be
repaired
Number of SDL repaired Number of SDL to be repaired
44 Repairing miscellaneous jobs
Measures the number of miscellaneous jobs which have been repaired relative to the miscellaneous jobs to be repaired .Following scale to be adhered to for rating:5- if the number of miscellaneous jobs repaired is 91% or above of
the miscellaneous jobs to be repaired4- if the number of miscellaneous jobs repaired is between 81 to
90% of miscellaneous jobs to be repaired3- if the number of miscellaneous jobs repaired is between 71 to
80% of miscellaneous jobs to be repaired2- if the number of miscellaneous jobs repaired is between 61 to
70% of miscellaneous jobs to be repaired1- if the number of miscellaneous jobs repaired is less than 60% of
the miscellaneous jobs to be repaired
Number of miscellaneous jobs repaired
Number of miscellaneous jobs to be repaired
45 Overline extension & installation
Measures the degree to which overline extension & installation was done relative to the target. Following rating scale to be adhered for rating :5- If percentage is 91% and above4- If percentage is between 81%-90%3- If percentage is between 71%-80%2- If percentage is between 71%-60%1- If percentage is less than 60"
Actual Overline extension & installation
Targeted Overline extension & installation required to be done
x 100
x 100
x100

Quadrant No. KeyPerformanceIndicator KPIDefinition Formula
E&M\42
Process
46 Providing Wstrap for roof support
Measures the number of Wstrap which have been provided relative to the Wstrap to be provided. Following scale to be adhered to for rating:5- if the number of Wstrap provided is 91% or above of the Wstrap
to be provided4- if the number of Wstrap provided is between 81 to 90% of the
Wstrap to be provided3- if the number of Wstrap provided is between 71 to 80% of the
Wstrap to be provided2- if the number of Wstrap provided is between 61 to 70% of the
Wstrap to be provided1- if the number of Wstrap provided is less than 60% of the Wstrap
to be provided
Number of Wstrap provided Number of Wstrap to be provided
47 Providing Roof bolts for roof support
Measures the number of Roof bolts which have been provided relative to the Roof bolts to be provided. Following scale to be adhered to for rating:5- if the number of Roof bolts provided is 91% or above of the Roof
bolts to be provided4- if the number of Roof bolts provided is between 81 to 90% of the
Roof bolts to be provided3- if the number of Roof bolts provided is between 71 to 80% of the
Roof bolts to be provided2- if the number of Roof bolts provided is between 61 to 70% of the
Roof bolts to be provided1- if the number of Roof bolts provided is less than 60% of the Roof
bolts to be provided
Number of Roof bolts provided Number of Roof bolts to be
provided
48 Timely compilation and submission of annual workshop requirement
Measures the delay happening for timely compilation and submission of annual requirement. Following scale to be adhered to for rating:5- On or before time4- if delayed by a week3- if delayed by 2 weeks2- if delayed by 3 weeks1- If never submitted
Delay measured in days
x100
x100

Quadrant No. KeyPerformanceIndicator KPIDefinition Formula
E&M\43
Process 49 Float Management
Measures the effectiveness with which float was managed during the year. Following scale to be adhered to for rating:5- if the number of times demand was met instantly is 91% or above
the total sub assemblies delivered4- if the number of times demand was met instantly is between 81
to 90% of the total sub assemblies delivered3- if the number of times demand was met instantly is between 71
to 80% of the total sub assemblies delivered2- if the number of times demand was met instantly is between 61
to 70% of the total sub assemblies delivered1- if the number of times demand was met instantly is less than 60%
of the total sub assemblies delivered
Number of times demand was met from available float instantly Total number of sub assemblies
delivered during the year
x100

Quadrant No. KeyPerformanceIndicator KPIDefinition Formula
E&M\44
Learning & Growth
1 Non SAP/Oracle report generation
Measures the number of non SAP or Oracle reports getting generated relative to planned number of reports to be generated. Following scale to be adhered to for rating:5- if the number of reports generated is 91% or above the target4- if the number of reports generated is between 81 to 90% of the
target3- if the number of reports generated is between 71 to 80% of the
target2- if the number of reports generated is between 61 to 80% of the
target1- if the number of reports generated is less than 60% of the target
Number of reports generated Number of reports to be
generated
2 Utilisation of capital budget
Measures the variance between actual and budgeted/forecasted activity. Following rating scale to be adhered for rating :5- If percentage is 91% and above4- If percentage is between 81%-90%3- If percentage is between 71%-80%2- If percentage is between 71%-60%1- If percentage is less than 60"
Actual utilization of budget (in Rs.)
Allotted capital budget (in Rs.)
3 Updation of employee skill
Measures the percentage of achieved training Mandays out of the total planned training Mandays. Following scale to be adhered to for rating:5- if the employees released for training by HOD is 91% and above4- if the employees released for training by HOD is between 81 to
90% of the required number of employees to be released3- if the employees released for training by HOD is between 71 to
80% of the required number of employees to be released2- if the employees released for training by HOD is between 61 to
70% of the required number of employees to be released1- if the employees released for training by HOD is 60% or less than
60% of the required number of employees to be released
Number of employees released for trainings by the HOD
Total number of employees nominated for trainings by HRD
x100
x 100
x100

Quadrant No. KeyPerformanceIndicator KPIDefinition Formula
E&M\45
Learning & Growth
4 Modernisation of UG mines
Measures the amount of capital which has been invested for the modernisation of mines relative to the targeted number of mines to be modernised in the current year. Following scale to be adhered to for rating:5- if the actual capital invested is 91% or above of the targeted
amount4- if the actual capital invested is between 81 to 90% of the
targeted amount3- if the actual capital invested is between 71 to 80% of the
targeted amount2- if the actual capital invested is between 61 to 70% of the
targeted amount1- if the actual capital invested is less than 60% of the targeted
amount
Actual capital invested for modernisation of mines
Targeted capital planned to be for modernization of mines
5
Year on year reduction in E&M inventory of non moving items (excluding non obsolete items & non insurance items)
Measures the percentage reduction in inventory of non moving items (excluding non obsolete items & non insurance items) in current year as compared to previous year.Following scale to be adhered to for rating:5- if the reduction in inventory is 10% or more4- if the reduction in inventory is 7 to 9% or more3- if the reduction in inventory is 4 to 6% or more2- if the reduction in inventory is 1 to 3% or more1- if the reduction in inventory is 0%
Value of non moving items (excluding non obsolete items & non insurance items) in the start of current year — Value of non moving items (excluding non
obsolete items & non insurance items) at the end
of year / Closing value of non moving items (excluding non
obsolete items & non insurance items) in previous year
x 100
x 100
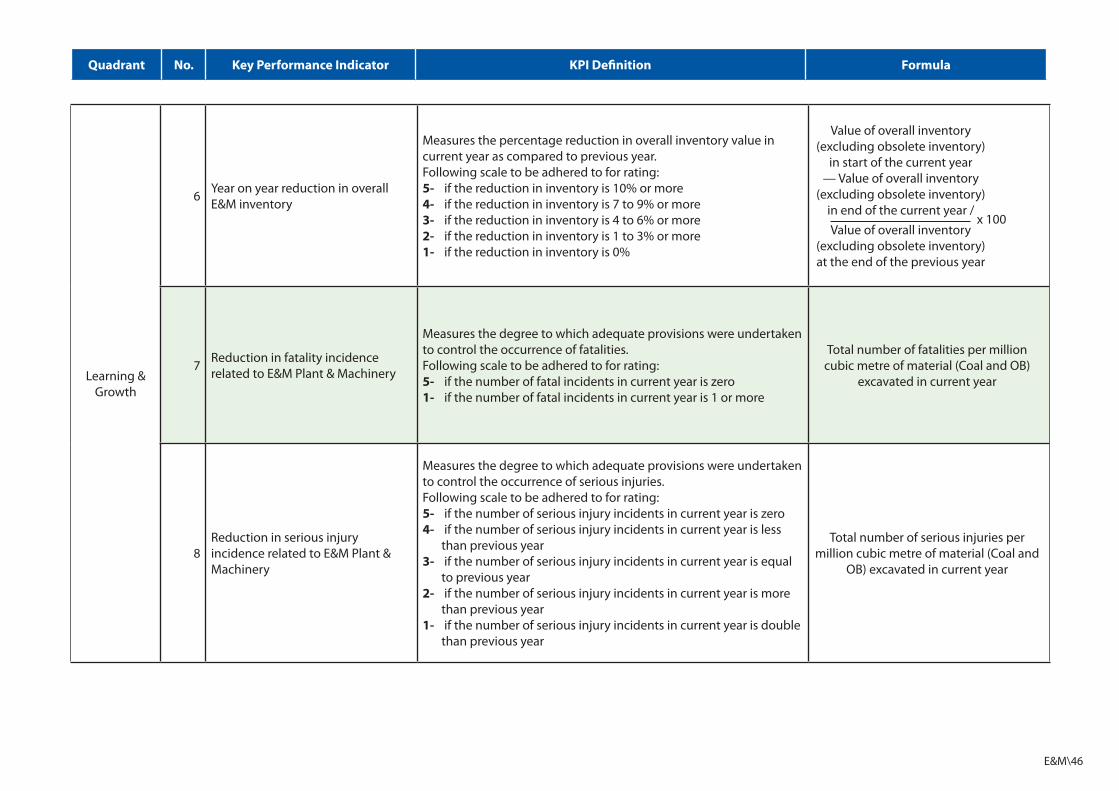
Quadrant No. KeyPerformanceIndicator KPIDefinition Formula
E&M\46
Learning & Growth
6 Year on year reduction in overall E&M inventory
Measures the percentage reduction in overall inventory value in current year as compared to previous year.Following scale to be adhered to for rating:5- if the reduction in inventory is 10% or more4- if the reduction in inventory is 7 to 9% or more3- if the reduction in inventory is 4 to 6% or more2- if the reduction in inventory is 1 to 3% or more1- if the reduction in inventory is 0%
Value of overall inventory (excluding obsolete inventory)
in start of the current year — Value of overall inventory
(excluding obsolete inventory) in end of the current year / Value of overall inventory
(excluding obsolete inventory) at the end of the previous year
7 Reduction in fatality incidence related to E&M Plant & Machinery
Measures the degree to which adequate provisions were undertaken to control the occurrence of fatalities. Following scale to be adhered to for rating:5- if the number of fatal incidents in current year is zero1- if the number of fatal incidents in current year is 1 or more
Total number of fatalities per million cubic metre of material (Coal and OB)
excavated in current year
8Reduction in serious injury incidence related to E&M Plant & Machinery
Measures the degree to which adequate provisions were undertaken to control the occurrence of serious injuries. Following scale to be adhered to for rating:5- if the number of serious injury incidents in current year is zero4- if the number of serious injury incidents in current year is less
than previous year3- if the number of serious injury incidents in current year is equal
to previous year2- if the number of serious injury incidents in current year is more
than previous year1- if the number of serious injury incidents in current year is double
than previous year
Total number of serious injuries per million cubic metre of material (Coal and
OB) excavated in current year
x 100

Quadrant No. KeyPerformanceIndicator KPIDefinition Formula
E&M\47
Learning & Growth
9 Reduction in reportable injuries related to E&M Plant & Machinery
Measures the degree to which adequate provisions were undertaken to control the occurrence of reportable injuries. Following scale to be adhered to for rating:5- if the number of reportable injuries in current year is zero4- if the number of reportable injuries in current year is less than
previous year3- if the number of reportable injuries in current year is equal to
previous year2- if the number of reportable injuries in current year is more than
previous year1- if the number of reportable injuries in current year is double than
previous year
Total number of reportable injuries serious injuries per million cubic metre of material (Coal and OB) excavated in
current year
10 Number of safety recommendations implemented in E&M dept - ISO
Measures the total number of safety recommendations given by ISO implemented in the E&M dept. Following scale to be adhered to for rating:5- if the number of recommendations implemented is 91% or
above the recommendations given4- if the number of recommendations implemented is between 81
to 90% of the recommendations given3- if the number of recommendations implemented is between 71
to 80% of the recommendations given2- if the number of recommendations implemented is between 61
to 70% of the recommendations given1- if the number of recommendations implemented is between less
than 60% of the recommendations given
Number of safety recommendations implemented
in E&M dept . Total number of
recommendations given by ISO
x 100

Quadrant No. KeyPerformanceIndicator KPIDefinition Formula
E&M\48
Learning & Growth
11 Number of safety recommendations implemented in E&M dept - DGMS
Measures the total number of safety recommendations implemented in the E&M dept. Following scale to be adhered to for rating:5- if the number of recommendations implemented is 91% or
above the recommendations given4- if the number of recommendations implemented is between 81
to 90% of the recommendations given3- if the number of recommendations implemented is between 71
to 80% of the recommendations given2- if the number of recommendations implemented is between 61
to 70% of the recommendations given1- if the number of recommendations implemented is between less
than 60% of the recommendations given
Number of safety recommendations implemented
in E&M dept . Total number of
recommendations given by DGMS
12 Employee Satisfaction index
Measures the employees' engagement in their work activities and responsibilities in terms of enthusiasm and commitment. Following scale to be adhered to for rating:5- if the number of employees giving a rating of 4 or 5 is 91% and
above of the total survey population 4- if the number of employees giving a rating of 4 or 5 is between
81 to 90% of the total survey population 3- if the number of employees giving a rating of 4 or 5 is between
71 to 80% of the total survey population 2- if the number of employees giving a rating of 4 or 5 is between
61 to 70% of the total survey population 1- if the number of employees giving a rating of 4 or 5 is equal to or
less than 60% of the total survey population
No. of employees giving a rating of 4 or 5 on a 5 point scale
instrument Total survey population
x100
x100

Quadrant No. KeyPerformanceIndicator KPIDefinition Formula
E&M\49
Learning & Growth
13 Monitoring approval of contract demand from electricity board
Measures the timeliness and follow up carried out to obtain the approval from the electricity board for the contract demand of energy relative to the targeted approval. Following scale to be adhered to for rating:5- if the actual approval received is 91% or above the approvals to
be received4- if the actual approval received is between 81 to 90% of the
approvals to be received3- if the actual approval received is between 71 to 80% of the
approvals to be received2- if the actual approval received is between 61 to 70% of the
approvals to be received1- if the actual approval received is between less than 60% of
approvals to be received
Actual contract demand's approval received
Total contract demand approvals to be received from electricity
board
14 Implementation & monitoring of new construction / electrification
Measures the percentage completion of the target of new constructions or electrifications during the year. Following scale to be adhered to for rating:5- if the number of milestones completed is 91% or above the
target4- if the number of milestones completed is between 81 to 90% of
the target3- if the number of milestones completed is between 71 to 80% of
the target2- if the number of milestones completed is between 61 to 70% of
the target1- if the number of milestones completed is between less than 60%
of target
Actual number of constructions or electrifications' milestones
completed Targeted number of
constructions or electrifications to be completed
x100
x100

Quadrant No. KeyPerformanceIndicator KPIDefinition Formula
E&M\50
Learning & Growth
15 Growth in workshop activity
Measures the percentage growth in the workshop activity by comparing the current year's repair jobs with the previous year's. Following scale to be adhered to for rating:5- if the actual growth in activity is 91% or above the target4- if the actual growth in activity is between 81 to 90% of the target3- if the actual growth in activity is between 71 to 80% of the target2- if the actual growth in activity is between 61 to 70% of the target1- if the actual growth in activity is between less than 60% of target
a. Number of repair jobs carried out in current year - Number of
repair jobs carried out in previous year
Number of repair jobs carried out in previous year
b. Actual growth % of workshop activity
Targeted growth % of workshop activity
16 Repair scope development
Measures the improvement in the workshop by comparing the number of new repair jobs added relative to the targeted jobs to be added. Following scale to be adhered to for rating:5- if the number of new jobs added is 91% or above the target4- if the number of new jobs added is between 81 to 90% of the
target3- if the number of new jobs added is between 71 to 80% of the
target2- if the number of new jobs added is between 61 to 70% of the
target1- if the number of new jobs added is between less than 60% of
target
Number of new repair jobs added in the workshop
Targeted number of new repair jobs to be added in the year
x100
x100
x100

Quadrant No. KeyPerformanceIndicator KPIDefinition Formula
E&M\51
Learning & Growth
17 Timely renewal of ISO certification
Measures the number of workshop's certification which have been renewed on time relative to total number of certifications to be renewed. Following scale to be adhered to for rating:5- if the number of certifications renewed on time is 91% or above
the target4- if the number of certifications renewed on time is between 81 to
90% of the target3- if the number of certifications renewed on time is between 71 to
80% of the target2- if the number of certifications renewed on time is between 61 to
70% of the target1- if the number of certifications renewed on time is between less
than 60% of target
Number of workshop's certification renewed on timeTotal number of workshop's certification to be renewed
18 New ISO certifications obtained
Measures the number of new ISO certifications obtained in the current year relative to previous year. Following scale to be adhered to for rating: 5- if all ISO certifications have been received as per the target3- if 50% or more ISO certifications have been received as per the
target1- if no ISO certification have been received as per the target
Number of new certifications added in the current year
19 Monitoring of CHP loading capacity per day (perspective plan)
Measures the effectiveness in monitoring of CHP loading capacity as per the perspective plan. Following scale to be adhered to for rating:5- if the actual loading capacity is 91% or above the requirement4- if the actual loading capacity is between 81 to 90% of the
requirement3- if the actual loading capacity is between 71 to 80% of the
requirement2- if the actual loading capacity is between 61 to 70% of the
requirement1- if the actual loading capacity is between less than 60% of
requirement
Actual CHP loading capacity (in TPD) per hour as per
perspective plan Required CHP loading capacity
(in TPD) per hour as per perspective plan
x100
x100

Quadrant No. KeyPerformanceIndicator KPIDefinition Formula
E&M\52
Learning & Growth
20 Monitoring of CHP loading capacity per day (annual plan)
Measures the effectiveness in monitoring of CHP loading capacity as per the annual plan. Following scale to be adhered to for rating:5- if the actual loading capacity is 91% or above the requirement4- if the actual loading capacity is between 81 to 90% of the
requirement3- if the actual loading capacity is between 71 to 80% of the
requirement2- if the actual loading capacity is between 61 to 70% of the
requirement1- if the actual loading capacity is between less than 60% of
requirement
Actual CHP loading capacity (in TPD) per hour as per annual plan Required CHP loading capacity
(in TPD) per hour as per annual plan
21 Monitoring of silo loading capacity (perspective plan)
Measures the effectiveness in monitoring of silo loading capacity as per the perspective plan. Following scale to be adhered to for rating:5- if the actual loading capacity is 91% or above the requirement4- if the actual loading capacity is between 81 to 90% of the
requirement3- if the actual loading capacity is between 71 to 80% of the
requirement2- if the actual loading capacity is between 61 to 70% of the
requirement1- if the actual loading capacity is between less than 60% of
requirement
Actual silo loading capacity (in TPD) per hour as per
perspective plan Required silo loading capacity
(in TPD) per hour as per perspective plan
22 Monitoring of silo loading capacity (annual plan)
Measures the effectiveness in monitoring of silo loading capacity as per annual plan. Following scale to be adhered to for rating:
5- if the actual loading capacity is 91% or above the requirement4- if the actual loading capacity is between 81 to 90% of the
requirement3- if the actual loading capacity is between 71 to 80% of the
requirement2- if the actual loading capacity is between 61 to 70% of the
requirement1- if the actual loading capacity is between less than 60% of
requirement
Actual silo loading capacity (in TPD) per hour as per annual plan
Required silo loading capacity (in TPD) per hour as per annual
plan
x100
x100
x100

Quadrant No. KeyPerformanceIndicator KPIDefinition Formula
E&M\53
Learning & Growth
23 Mandays of training undergone by each individual
Measures the number of mandays spent on training by each individual relative to the nominated mandays to be spent on training. Following rating scale to be adhered for rating :5- If percentage is 100%4- If percentage is between 98%-99%3- If percentage is between 96%-97%2- If percentage is between 91%-95%1- If percentage is less than 90%
Actual Mandays spent on training
Total Mandays nominated for training
24Year on Year reduction in average cycle time of tendering - E&M related centralized items
Measures the relative efficiency with which the tendering process is managed vis a vis the previous year.Following rating scale to be adhered for rating :5- If percentage is 100%4- If percentage is between 98%-99%3- If percentage is between 96%-97%2- If percentage is between 91%-95%1- If percentage is less than 90%
a. Average number of days taken between ""Date of receipt of
Approved Indent"" to ""Date of signing of contract of purchase""
in the previous year - Average number of days taken between
“Date of receipt of Approved Indent” to “Date of signing of contract of purchase” in the
current year Average number of days taken
between ""Date of receipt of Approved Indent"" to ""Date of
signing of contract of purchase"" in the previous year * 100
b. Actual reduction % of average cycle time of tendering
Targeted reduction % of average cycle time of tendering
x100
x100
x100

Quadrant No. KeyPerformanceIndicator KPIDefinition Formula
E&M\54
Learning & Growth 25
Year on Year reduction in average cycle time of tendering - E&M related decentralized items
Measures the relative efficiency with which the tendering process is managed vis a vis the previous year.Following rating scale to be adhered for rating :5- If percentage is 100%4- If percentage is between 98%-99%3- If percentage is between 96%-97%2- If percentage is between 91%-95%1- If percentage is less than 90%
a. Average number of days taken between ""Date of receipt of
Approved Indent"" to ""Date of signing of contract of purchase""
in the previous year - Average number of days taken between
“Date of receipt of Approved Indent” to “Date of signing of contract of purchase” in the
current year Average number of days taken
between ""Date of receipt of Approved Indent"" to ""Date of
signing of contract of purchase"" in the previous year
b. Actual reduction % of average cycle time of tendering
Targeted reduction % of average cycle time of tendering
x100
x100

Quadrant No. KeyPerformanceIndicator KPIDefinition Formula
E&M\55
Learning & Growth 26 Implementation of energy
conservation measures
Measures the number of energy conservation measures which have been implemented relative to the planned number of measures to be implemented. Following scale to be adhered to for rating:5- if the number of measures implemented is 91% or above the
target4- if the number of measures implemented is between 81 to 90% of
the target3- if the number of measures implemented is between 71 to 80% of
the target2- if the number of measures implemented is between 61 to 70% of
the target1- if the number of measures implemented is between less than 60%
of target
Number of energy conservation measures implemented
Planned number of energy conservation measures to be
implemented
x100