Inventory of certification schemes for agricultural...
79
Inventory of certification schemes for agricultural products and foodstuffs marketed in the EU Member States Data aggregations
Transcript of Inventory of certification schemes for agricultural...
Inventory of certification schemes for
agricultural products and foodstuffs
marketed in the EU Member States
Data aggregations

Table of contents
• Main aggregations slide 3
• Schemes by covered products slide 5
• Schemes by policy area slide 9
• Schemes by production processes covered slide 17
• Schemes by type of actors involved in the development slide 21
• Schemes by covered products and policy area slide 28
• Schemes by product and production processes covered slide 43
• Schemes by policy area and production processes covered slide 58
• Schemes by product and targeted actors slide 67
• Schemes by policy area and targeted actors slide 73


Sc
he
me
s b
y T
YP
E O
F P
RO
DU
CT

Sc
he
me
s b
y T
YP
E O
F P
RO
DU
CT

Sc
he
me
s b
y T
YP
E O
F P
RO
DU
CT

Sc
he
me
s b
y T
YP
E O
F P
RO
DU
CT

Sc
he
me
s b
y P
OL
IC
Y
AR
EA

Sc
he
me
s b
y P
OL
IC
Y
AR
EA

Sc
he
me
s b
y P
OL
IC
Y
AR
EA

Sc
he
me
s b
y P
OL
IC
Y
AR
EA

Sc
he
me
s b
y P
OL
IC
Y
AR
EA

Sc
he
me
s b
y P
OL
IC
Y
AR
EA

Sc
he
me
s b
y P
OL
IC
Y
AR
EA

Sc
he
me
s b
y P
OL
IC
Y
AR
EA

Sc
he
me
s b
y P
RO
DU
CT
IO
N
PR
OC
ES
SE
S
CO
VE
RE
D

Sc
he
me
s b
y P
RO
DU
CT
IO
N
PR
OC
ES
SE
S
CO
VE
RE
D
Sc
he
me
s b
y P
RO
DU
CT
IO
N
PR
OC
ES
SE
S
CO
VE
RE
D

Sc
he
me
s b
y P
RO
DU
CT
IO
N
PR
OC
ES
SE
S
CO
VE
RE
D

Sc
he
me
s b
y T
YP
E O
F A
CT
OR
S i
nv
olv
ed
in
th
e D
EV
EL
OP
ME
NT

Sc
he
me
s b
y T
YP
E O
F A
CT
OR
S i
nv
olv
ed
in
th
e D
EV
EL
OP
ME
NT

Sc
he
me
s b
y T
YP
E O
F A
CT
OR
S i
nv
olv
ed
in
th
e D
EV
EL
OP
ME
NT

Sc
he
me
s b
y T
YP
E O
F A
CT
OR
S i
nv
olv
ed
in
th
e D
EV
EL
OP
ME
NT


Sc
he
me
s b
y
CO
VE
RE
D P
RO
DU
CT
S a
nd
PO
LIC
Y A
RE
A
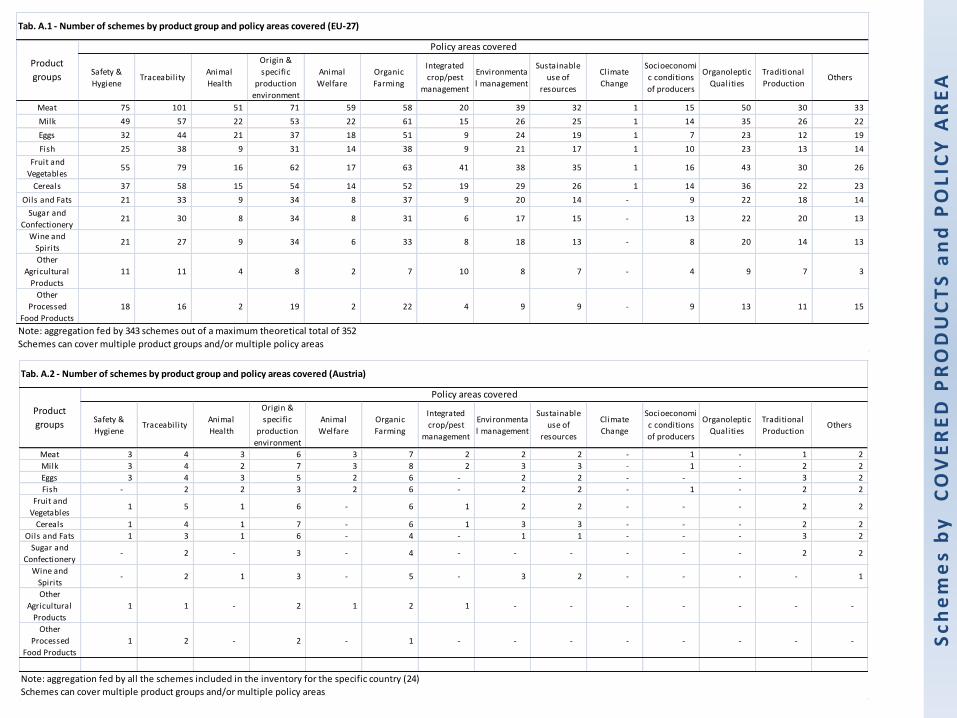
Schemes by COVERED PRODUCTS and POLICY AREA
Important noticeMany schemes featured in the inventory actually cover a combination of different
products and/or a combination of different policy areas: this has implications on the aggregations made.
In tables A.1 to A.27, wherever in the row of a specific product (e.g. “Cereals”) also columns of policy areas which apparently have no relation with the product (e.g. “Animal health”) feature a value, this happens because at least one scheme in the aggregation covers a combination of different products (e.g. “Cereals” and “Meat”) and/or of different policy areas (e.g. “Traceability” - which may concern “Cereals”, “Meat” or both - plus “Animal health”, which of course concerns just “Meat”, not “Cereals”).
Sc
he
me
s b
y
CO
VE
RE
D P
RO
DU
CT
S a
nd
PO
LIC
Y A
RE
A
Safety &
Hygiene Traceability
Animal
Health
Origin &
specific
production
environment
Animal
Welfare
Organic
Farming
Integrated
crop/pest
management
Environmenta
l management
Sustainable
use of
resources
Climate
Change
Socioeconomi
c conditions
of producers
Organoleptic
Qualities
Traditional
ProductionOthers
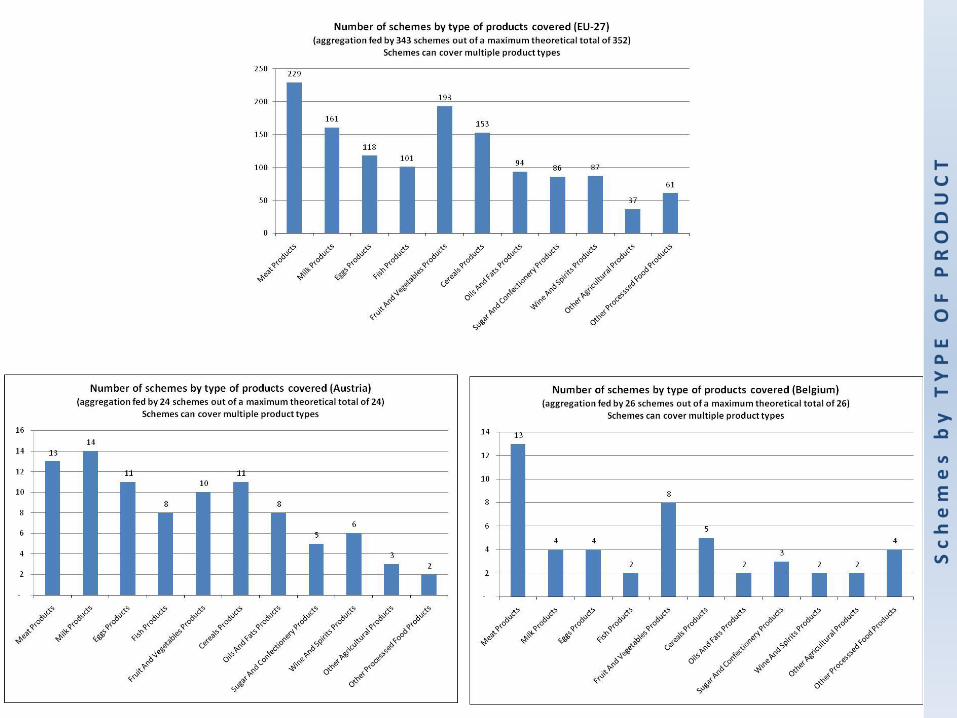
Meat 75 101 51 71 59 58 20 39 32 1 15 50 30 33
Milk 49 57 22 53 22 61 15 26 25 1 14 35 26 22
Eggs 32 44 21 37 18 51 9 24 19 1 7 23 12 19
Fish 25 38 9 31 14 38 9 21 17 1 10 23 13 14
Fruit and
Vegetables55 79 16 62 17 63 41 38 35 1 16 43 30 26
Cereals 37 58 15 54 14 52 19 29 26 1 14 36 22 23
Oils and Fats 21 33 9 34 8 37 9 20 14 - 9 22 18 14
Sugar and
Confectionery21 30 8 34 8 31 6 17 15 - 13 22 20 13
Wine and
Spirits21 27 9 34 6 33 8 18 13 - 8 20 14 13
Other
Agricultural
Products
11 11 4 8 2 7 10 8 7 - 4 9 7 3
Other
Processed
Food Products
18 16 2 19 2 22 4 9 9 - 9 13 11 15
Tab. A.1 - Number of schemes by product group and policy areas covered (EU-27)
Product
groups
Policy areas covered
Note: aggregation fed by 343 schemes out of a maximum theoretical total of 352
Schemes can cover multiple product groups and/or multiple policy areas
Safety &
Hygiene Traceability
Animal
Health
Origin &
specific
production
environment
Animal
Welfare
Organic
Farming
Integrated
crop/pest
management
Environmenta
l management
Sustainable
use of
resources
Climate
Change
Socioeconomi
c conditions
of producers
Organoleptic
Qualities
Traditional
ProductionOthers
Meat 3 4 3 6 3 7 2 2 2 - 1 - 1 2
Milk 3 4 2 7 3 8 2 3 3 - 1 - 2 2
Eggs 3 4 3 5 2 6 - 2 2 - - - 3 2
Fish - 2 2 3 2 6 - 2 2 - 1 - 2 2
Fruit and
Vegetables1 5 1 6 - 6 1 2 2 - - - 2 2
Cereals 1 4 1 7 - 6 1 3 3 - - - 2 2
Oils and Fats 1 3 1 6 - 4 - 1 1 - - - 3 2
Sugar and
Confectionery- 2 - 3 - 4 - - - - - - 2 2
Wine and
Spirits- 2 1 3 - 5 - 3 2 - - - - 1
Other
Agricultural
Products
1 1 - 2 1 2 1 - - - - - - -
Other
Processed
Food Products
1 2 - 2 - 1 - - - - - - - -
Tab. A.2 - Number of schemes by product group and policy areas covered (Austria)
Product
groups
Policy areas covered
Note: aggregation fed by all the schemes included in the inventory for the specific country (24)
Schemes can cover multiple product groups and/or multiple policy areas

Sc
he
me
s b
y
CO
VE
RE
D P
RO
DU
CT
S a
nd
PO
LIC
Y A
RE
A
Safety &
Hygiene Traceability
Animal
Health
Origin &
specific
production
environment
Animal
Welfare
Organic
Farming
Integrated
crop/pest
management
Environmenta
l management
Sustainable
use of
resources
Climate
Change
Socioeconomi
c conditions
of producers
Organoleptic
Qualities
Traditional
ProductionOthers
Meat 5 4 5 5 6 1 1 - - - - 7 2 4
Milk 2 1 2 2 1 1 1 - - - - 2 2 -
Eggs 3 3 2 1 1 1 1 - - - - 2 1 -
Fish 1 1 1 2 1 - 1 - - - - 1 2 -
Fruit and
Vegetables3 4 1 3 1 1 3 2 1 - - 5 3 1
Cereals 3 3 - 1 - 1 1 2 1 - - 1 1 -
Oils and Fats 1 1 - - - 1 - 1 - - - - - -
Sugar and
Confectionery- - - 1 - 1 - - - - - 1 2 1
Wine and
Spirits- - - 1 - 1 - - - - - - 1 -
Other
Agricultural
Products
2 1 - - - - - - - - - - - 1
Other
Processed
Food Products
2 2 - 1 - 1 - 1 - - - - 1 -
Tab. A.3 - Number of schemes by product group and policy areas covered (Belgium)
Product
groups
Policy areas covered
Note: aggregation fed by all the schemes included in the inventory for the specific country (26)
Schemes can cover multiple product groups and/or multiple policy areas
Safety &
Hygiene Traceability
Animal
Health
Origin &
specific
production
environment
Animal
Welfare
Organic
Farming
Integrated
crop/pest
management
Environmenta
l management
Sustainable
use of
resources
Climate
Change
Socioeconomi
c conditions
of producers
Organoleptic
Qualities
Traditional
ProductionOthers
Meat - - - - - 1 - - - - - - - -
Milk - - - - - 1 - - - - - - - -
Eggs - - - - - 1 - - - - - - - -
Fish - - - - - - - - - - - - - -
Fruit and
Vegetables- - - - - 1 - - - - - - - -
Cereals - - - - - - - - - - - - - -
Oils and Fats - - - - - - - - - - - - - -
Sugar and
Confectionery- - - - - - - - - - - - - -
Wine and
Spirits- - - - - - - - - - - - - -
Other
Agricultural
Products
- - - - - - - - - - - - - -
Other
Processed
Food Products
- - - - - 1 - - - - - - - -
Tab. A.4 - Number of schemes by product group and policy areas covered (Bulgaria)
Product
groups
Policy areas covered
Note: aggregation fed by all the schemes included in the inventory for the specific country (1)
Schemes can cover multiple product groups and/or multiple policy areas

Sc
he
me
s b
y
CO
VE
RE
D P
RO
DU
CT
S a
nd
PO
LIC
Y A
RE
ASafety &
Hygiene Traceability
Animal
Health
Origin &
specific
production
environment
Animal
Welfare
Organic
Farming
Integrated
crop/pest
management
Environmenta
l management
Sustainable
use of
resources
Climate
Change
Socioeconomi
c conditions
of producers
Organoleptic
Qualities
Traditional
ProductionOthers
Meat 1 - - 1 - - - - - - - 2 - -
Milk 1 - - 1 - - - - - - - 2 - -
Eggs - - - - - - - - - - - - - -
Fish 1 - - 1 - - - - - - - 1 - -
Fruit and
Vegetables1 - - 1 - - - - - - - 2 - -
Cereals 1 - - 1 - - - - - - - 2 - -
Oils and Fats 1 - - 1 - - - - - - - 1 - -
Sugar and
Confectionery1 - - 1 - - - - - - - 1 - -
Wine and
Spirits1 - - 1 - - - - - - - 1 - -
Other
Agricultural
Products
- - - - - - - - - - - - - -
Other
Processed
Food Products
1 - - 1 - - - - - - - 1 - -
Tab. A.5 - Number of schemes by product group and policy areas covered (Czech Republic)
Product
groups
Policy areas covered
Note: aggregation fed by all the schemes included in the inventory for the specific country (2)
Schemes can cover multiple product groups and/or multiple policy areas
Safety &
Hygiene Traceability
Animal
Health
Origin &
specific
production
environment
Animal
Welfare
Organic
Farming
Integrated
crop/pest
management
Environmenta
l management
Sustainable
use of
resources
Climate
Change
Socioeconomi
c conditions
of producers
Organoleptic
Qualities
Traditional
ProductionOthers
Meat 5 4 6 - 5 1 - 1 - - - 1 - 1
Milk 2 - 1 - - 1 - 1 - - - 1 - 1
Eggs - - - - - 1 - - - - - - - 1
Fish - - - - - - - - - - - - - -
Fruit and
Vegetables1 - - - - 1 1 1 - - - - - 1
Cereals 1 - - - - 1 - 1 - - - 1 - 1
Oils and Fats - - - - - - - - - - - - - -
Sugar and
Confectionery- - - - - - - - - - - - - -
Wine and
Spirits- - - - - - - - - - - - - -
Other
Agricultural
Products
- - - - - - - - - - - - - -
Other
Processed
Food Products
- - - - - - - - - - - - - 1
Tab. A.6 - Number of schemes by product group and policy areas covered (Denmark)
Product
groups
Policy areas covered
Note: aggregation fed by all the schemes included in the inventory for the specific country (14)
Schemes can cover multiple product groups and/or multiple policy areas

Sc
he
me
s b
y
CO
VE
RE
D P
RO
DU
CT
S a
nd
PO
LIC
Y A
RE
ASafety &
Hygiene Traceability
Animal
Health
Origin &
specific
production
environment
Animal
Welfare
Organic
Farming
Integrated
crop/pest
management
Environmenta
l management
Sustainable
use of
resources
Climate
Change
Socioeconomi
c conditions
of producers
Organoleptic
Qualities
Traditional
ProductionOthers
Meat - - - - - 1 - - - - - - - -
Milk - - - - - 1 - - - - - - - -
Eggs - - - - - 1 - - - - - - - -
Fish - - - - - 1 - - - - - - - -
Fruit and
Vegetables- - - - - 1 - - - - - - - -
Cereals - - - - - 1 - - - - - - - -
Oils and Fats - - - - - 1 - - - - - - - -
Sugar and
Confectionery- - - - - - - - - - - - - -
Wine and
Spirits- - - - - - - - - - - - - -
Other
Agricultural
Products
- - - - - 1 - - - - - - - -
Other
Processed
Food Products
- - - - - 1 - - - - - - - -
Tab. A.7 - Number of schemes by product group and policy areas covered (Estonia)
Product
groups
Policy areas covered
Note: aggregation fed by all the schemes included in the inventory for the specific country (1)
Schemes can cover multiple product groups and/or multiple policy areas
Safety &
Hygiene Traceability
Animal
Health
Origin &
specific
production
environment
Animal
Welfare
Organic
Farming
Integrated
crop/pest
management
Environmenta
l management
Sustainable
use of
resources
Climate
Change
Socioeconomi
c conditions
of producers
Organoleptic
Qualities
Traditional
ProductionOthers
Meat 2 1 1 3 2 1 - - - - - - - 1
Milk - - - 3 - 1 - - - - - - - 1
Eggs - - - 3 - 1 - - - - - - - -
Fish - - - 3 - 1 - - - - - - - 1
Fruit and
Vegetables- - - 3 - 1 - - - - - - - 2
Cereals - - - 3 - 1 - - - - - - - 1
Oils and Fats - - - 3 - 1 - - - - - - - 1
Sugar and
Confectionery- - - 3 - - - - - - - - - -
Wine and
Spirits- - - 3 - - - - - - - - - -
Other
Agricultural
Products
- - - - - - - - - - - - - -
Other
Processed
Food Products
- - - 1 - - - - - - - - - 1
Tab. A.8 - Number of schemes by product group and policy areas covered (Finland)
Product
groups
Policy areas covered
Note: aggregation fed by all the schemes included in the inventory for the specific country (8)
Schemes can cover multiple product groups and/or multiple policy areas

Sc
he
me
s b
y
CO
VE
RE
D P
RO
DU
CT
S a
nd
PO
LIC
Y A
RE
A
Safety &
Hygiene Traceability
Animal
Health
Origin &
specific
production
environment
Animal
Welfare
Organic
Farming
Integrated
crop/pest
management
Environmenta
l management
Sustainable
use of
resources
Climate
Change
Socioeconomi
c conditions
of producers
Organoleptic
Qualities
Traditional
ProductionOthers
Meat 3 7 - 11 1 1 2 4 3 - 3 10 5 1
Milk 4 7 - 12 1 1 1 3 3 - 3 11 6 1
Eggs 2 6 - 8 1 1 2 4 2 - 2 8 3 1
Fish 2 6 - 10 1 1 1 3 2 - 3 10 3 1
Fruit and
Vegetables3 8 - 12 1 1 3 5 3 - 4 12 6 1
Cereals 2 7 - 12 1 1 2 4 3 - 3 10 5 1
Oils and Fats 1 6 - 9 1 1 2 4 2 - 2 8 3 1
Sugar and
Confectionery2 6 - 10 1 1 1 3 3 - 3 8 4 1
Wine and
Spirits2 3 - 9 - - 1 2 2 - 2 8 5 1
Other
Agricultural
Products
- - - 1 - - - 1 - - 1 - - -
Other
Processed
Food Products
1 - - 2 - - - 1 - - 1 2 1 1
Tab. A.9 - Number of schemes by product group and policy areas covered (France)
Product
groups
Policy areas covered
Note: aggregation fed by all the schemes included in the inventory for the specific country (23)
Schemes can cover multiple product groups and/or multiple policy areas
Safety &
Hygiene Traceability
Animal
Health
Origin &
specific
production
environment
Animal
Welfare
Organic
Farming
Integrated
crop/pest
management
Environmenta
l management
Sustainable
use of
resources
Climate
Change
Socioeconomi
c conditions
of producers
Organoleptic
Qualities
Traditional
ProductionOthers
Meat 12 16 11 21 7 15 - 8 9 - 3 6 - 9
Milk 10 9 4 13 - 14 - 6 8 - 4 2 - 7
Eggs 7 7 4 10 1 11 - 5 6 - 2 2 - 6
Fish 6 6 1 5 - 10 - 3 4 - 3 2 - 4
Fruit and
Vegetables10 11 3 13 - 14 1 6 9 - 5 2 - 9
Cereals 10 11 3 14 - 14 - 7 8 - 6 3 - 9
Oils and Fats 4 5 2 5 - 9 - 4 5 - 3 2 - 6
Sugar and
Confectionery4 4 3 4 - 9 - 5 5 - 4 2 - 5
Wine and
Spirits7 7 2 9 - 12 - 5 5 - 3 3 - 7
Other
Agricultural
Products
- 1 - 2 - 1 - 2 3 - 2 1 - 1
Other
Processed
Food Products
3 3 1 5 - 6 - 4 5 - 5 1 - 5
Tab. A.10 - Number of schemes by product group and policy areas covered (Germany)
Product
groups
Policy areas covered
Note: aggregation fed by 61 schemes out of a maximum theoretical total of 62
Schemes can cover multiple product groups and/or multiple policy areas

Sc
he
me
s b
y
CO
VE
RE
D P
RO
DU
CT
S a
nd
PO
LIC
Y A
RE
A
Safety &
Hygiene Traceability
Animal
Health
Origin &
specific
production
environment
Animal
Welfare
Organic
Farming
Integrated
crop/pest
management
Environmenta
l management
Sustainable
use of
resources
Climate
Change
Socioeconomi
c conditions
of producers
Organoleptic
Qualities
Traditional
ProductionOthers
Meat 3 2 2 - - 1 1 - - - - - - -
Milk 1 - 1 - - 1 - - - - - - - -
Eggs 1 - 1 - - 1 - - - - - - - -
Fish 1 - - - - - - 1 1 - - - - -
Fruit and
Vegetables2 1 1 - - 1 1 - - - - - - -
Cereals 2 1 1 - - 1 1 - - - - - - -
Oils and Fats - - - - - - - - - - - - - -
Sugar and
Confectionery- - - - - - - - - - - - - -
Wine and
Spirits- - - - - - - - - - - - - -
Other
Agricultural
Products
- - - - - - - - - - - - - -
Other
Processed
Food Products
- - - - - - - - - - - - - -
Tab. A.11 - Number of schemes by product group and policy areas covered (Greece)
Product
groups
Policy areas covered
Note: aggregation fed by all the schemes included in the inventory for the specific country (4)
Schemes can cover multiple product groups and/or multiple policy areas
Safety &
Hygiene Traceability
Animal
Health
Origin &
specific
production
environment
Animal
Welfare
Organic
Farming
Integrated
crop/pest
management
Environmenta
l management
Sustainable
use of
resources
Climate
Change
Socioeconomi
c conditions
of producers
Organoleptic
Qualities
Traditional
ProductionOthers
Meat 1 1 - - - - - - - - - 1 - 1
Milk 1 1 - - - - - - - - - 1 - 1
Eggs 1 1 - - - - - - - - - 1 - 1
Fish 1 1 - - - - - - - - - 1 - 1
Fruit and
Vegetables1 1 - - - - - - - - - 1 - 1
Cereals 1 1 - - - - - - - - - 1 - 1
Oils and Fats 1 1 - - - - - - - - - 1 - 1
Sugar and
Confectionery1 1 - - - - - - - - - 1 - 1
Wine and
Spirits- - - - - - - - - - - - - -
Other
Agricultural
Products
- - - - - - - - - - - - - -
Other
Processed
Food Products
1 1 - - - - - - - - - 1 - 1
Tab. A.12 - Number of schemes by product group and policy areas covered (Hungary)
Product
groups
Policy areas covered
Note: aggregation fed by all the schemes included in the inventory for the specific country (1)
Schemes can cover multiple product groups and/or multiple policy areas

Sc
he
me
s b
y
CO
VE
RE
D P
RO
DU
CT
S a
nd
PO
LIC
Y A
RE
A
Safety &
Hygiene Traceability
Animal
Health
Origin &
specific
production
environment
Animal
Welfare
Organic
Farming
Integrated
crop/pest
management
Environmenta
l management
Sustainable
use of
resources
Climate
Change
Socioeconomi
c conditions
of producers
Organoleptic
Qualities
Traditional
ProductionOthers
Meat 2 6 1 2 1 2 - - - - - - 1 1
Milk - 3 1 - 1 2 - - - - - - - 1
Eggs 1 3 1 1 1 2 - - - - - - - -
Fish - 3 1 - 2 2 - 1 - - - - - -
Fruit and
Vegetables1 3 1 1 1 2 - - - - - - - -
Cereals 1 3 1 - 1 2 - - 1 - - - - -
Oils and Fats - 1 1 - - 1 - - - - - - - -
Sugar and
Confectionery- 1 1 - - 1 - - - - - - - -
Wine and
Spirits- 1 1 - - 1 - - - - - - - -
Other
Agricultural
Products
1 1 - - - - 1 - - - - - - -
Other
Processed
Food Products
- - - - - - - - - - - - - -
Tab. A.13 - Number of schemes by product group and policy areas covered (Ireland)
Product
groups
Policy areas covered
Note: aggregation fed by all the schemes included in the inventory for the specific country (9)
Schemes can cover multiple product groups and/or multiple policy areas
Safety &
Hygiene Traceability
Animal
Health
Origin &
specific
production
environment
Animal
Welfare
Organic
Farming
Integrated
crop/pest
management
Environmenta
l management
Sustainable
use of
resources
Climate
Change
Socioeconomi
c conditions
of producers
Organoleptic
Qualities
Traditional
ProductionOthers
Meat 15 18 6 5 9 7 6 8 7 - 2 6 8 -
Milk 11 13 5 6 5 10 5 6 6 - 2 8 9 -
Eggs 4 5 4 3 2 7 2 5 4 - 1 5 2 -
Fish 6 8 2 2 2 4 5 4 4 - - 4 3 -
Fruit and
Vegetables16 17 6 8 5 10 10 10 10 - 3 10 11 -
Cereals 4 8 5 8 3 6 2 4 3 - 1 10 7 -
Oils and Fats 5 6 3 3 1 7 3 5 4 - 2 5 5 -
Sugar and
Confectionery7 7 3 7 1 7 3 5 6 - 3 6 7 -
Wine and
Spirits7 8 5 3 2 4 2 4 2 - 1 5 4 -
Other
Agricultural
Products
2 1 2 1 - 1 2 - 1 - 1 4 4 -
Other
Processed
Food Products
3 2 1 3 - 2 1 1 2 - 1 2 4 -
Tab. A.14 - Number of schemes by product group and policy areas covered (Italy)
Product
groups
Policy areas covered
Note: aggregation fed by 47 schemes out of a maximum theoretical total of 52
Schemes can cover multiple product groups and/or multiple policy areas

Sc
he
me
s b
y
CO
VE
RE
D P
RO
DU
CT
S a
nd
PO
LIC
Y A
RE
ASafety &
Hygiene Traceability
Animal
Health
Origin &
specific
production
environment
Animal
Welfare
Organic
Farming
Integrated
crop/pest
management
Environmenta
l management
Sustainable
use of
resources
Climate
Change
Socioeconomi
c conditions
of producers
Organoleptic
Qualities
Traditional
ProductionOthers
Meat - - - - - 2 - - - - - - - -
Milk - - - - - 2 - - - - - - - -
Eggs - - - - - 1 - - - - - - - -
Fish - - - - - 1 - - - - - - - -
Fruit and
Vegetables- - - - - 2 - - - - - - - -
Cereals - - - - - 2 - - - - - - - -
Oils and Fats - - - - - - - - - - - - - -
Sugar and
Confectionery- - - - - - - - - - - - - -
Wine and
Spirits- - - - - - - - - - - - - -
Other
Agricultural
Products
- - - - - - - - - - - - - -
Other
Processed
Food Products
- - - - - 1 - - - - - - - -
Tab. A.15 - Number of schemes by product group and policy areas covered (Latvia)
Product
groups
Policy areas covered
Note: aggregation fed by all the schemes included in the inventory for the specific country (2)
Schemes can cover multiple product groups and/or multiple policy areas
Safety &
Hygiene Traceability
Animal
Health
Origin &
specific
production
environment
Animal
Welfare
Organic
Farming
Integrated
crop/pest
management
Environmenta
l management
Sustainable
use of
resources
Climate
Change
Socioeconomi
c conditions
of producers
Organoleptic
Qualities
Traditional
ProductionOthers
Meat - - - - 1 1 1 - - - - 1 - 1
Milk - - - - 1 1 1 - - - - 1 - 1
Eggs - - - - 1 - 1 - - - - 1 - 1
Fish - - - - - 1 - - - - - - - -
Fruit and
Vegetables- - - - 1 1 1 - - - - 1 - 1
Cereals - - - - 1 1 1 - - - - 1 - 1
Oils and Fats - - - - - 1 - - - - - - - -
Sugar and
Confectionery- - - - - - - - - - - - - -
Wine and
Spirits- - - - - - - - - - - - - -
Other
Agricultural
Products
- - - - - - - - - - - - - -
Other
Processed
Food Products
- - - - 1 1 1 - - - - 1 - 1
Tab. A.16 - Number of schemes by product group and policy areas covered (Lithuania)
Product
groups
Policy areas covered
Note: aggregation fed by all the schemes included in the inventory for the specific country (2)
Schemes can cover multiple product groups and/or multiple policy areas
Sc
he
me
s b
y
CO
VE
RE
D P
RO
DU
CT
S a
nd
PO
LIC
Y A
RE
A
Safety &
Hygiene Traceability
Animal
Health
Origin &
specific
production
environment
Animal
Welfare
Organic
Farming
Integrated
crop/pest
management
Environmenta
l management
Sustainable
use of
resources
Climate
Change
Socioeconomi
c conditions
of producers
Organoleptic
Qualities
Traditional
ProductionOthers
Meat - - - - - 1 - - - - - - - 1
Milk - - - - - 1 - - - - - - - 1
Eggs - - - - - 1 - - - - - - - 1
Fish - - - - - 1 - - - - - - - 1
Fruit and
Vegetables- - - - - 1 - - - - - - - 1
Cereals - - - - - - - - - - - - - -
Oils and Fats - - - - - - - - - - - - - -
Sugar and
Confectionery- - - - - - - - - - - - - -
Wine and
Spirits- - - - - - - - - - - - - -
Other
Agricultural
Products
- - - - - - - - - - - - - -
Other
Processed
Food Products
- - - - - - - - - - - - - -
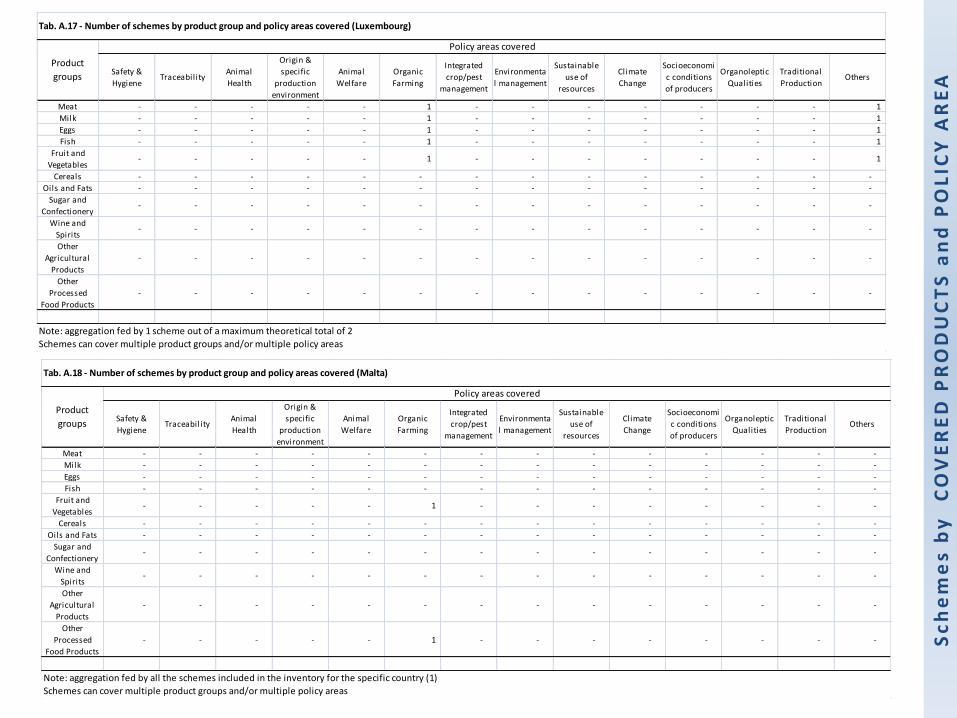
Tab. A.17 - Number of schemes by product group and policy areas covered (Luxembourg)
Product
groups
Policy areas covered
Note: aggregation fed by 1 scheme out of a maximum theoretical total of 2
Schemes can cover multiple product groups and/or multiple policy areas
Safety &
Hygiene Traceability
Animal
Health
Origin &
specific
production
environment
Animal
Welfare
Organic
Farming
Integrated
crop/pest
management
Environmenta
l management
Sustainable
use of
resources
Climate
Change
Socioeconomi
c conditions
of producers
Organoleptic
Qualities
Traditional
ProductionOthers
Meat - - - - - - - - - - - - - -
Milk - - - - - - - - - - - - - -
Eggs - - - - - - - - - - - - - -
Fish - - - - - - - - - - - - - -
Fruit and
Vegetables- - - - - 1 - - - - - - - -
Cereals - - - - - - - - - - - - - -
Oils and Fats - - - - - - - - - - - - - -
Sugar and
Confectionery- - - - - - - - - - - - - -
Wine and
Spirits- - - - - - - - - - - - - -
Other
Agricultural
Products
- - - - - - - - - - - - - -
Other
Processed
Food Products
- - - - - 1 - - - - - - - -
Tab. A.18 - Number of schemes by product group and policy areas covered (Malta)
Product
groups
Policy areas covered
Note: aggregation fed by all the schemes included in the inventory for the specific country (1)
Schemes can cover multiple product groups and/or multiple policy areas

Sc
he
me
s b
y
CO
VE
RE
D P
RO
DU
CT
S a
nd
PO
LIC
Y A
RE
A
Safety &
Hygiene Traceability
Animal
Health
Origin &
specific
production
environment
Animal
Welfare
Organic
Farming
Integrated
crop/pest
management
Environmenta
l management
Sustainable
use of
resources
Climate
Change
Socioeconomi
c conditions
of producers
Organoleptic
Qualities
Traditional
ProductionOthers
Meat 3 5 3 - 4 2 - 3 2 - - 1 - 3
Milk 1 2 1 - 1 2 - 1 1 - - - - 1
Eggs 2 3 3 - 3 2 - 3 2 - - - - 2
Fish - 1 1 - 1 1 - 2 2 - - - - 1
Fruit and
Vegetables- 1 - - 2 2 - 2 1 - - - - 1
Cereals - 1 - - 1 2 - 1 1 - - - - 1
Oils and Fats - 1 - - 1 2 - 1 1 - - - - 1
Sugar and
Confectionery- 1 - - 1 2 - 1 1 - - - - 1
Wine and
Spirits- 1 - - 1 2 - 1 1 - - - - 1
Other
Agricultural
Products
- 1 - - 1 1 - 1 1 - - - - 1
Other
Processed
Food Products
- 1 - - 1 1 - 1 1 - - - - 1
Tab. A.19 - Number of schemes by product group and policy areas covered (Netherlands)
Product
groups
Policy areas covered
Note: aggregation fed by all the schemes included in the inventory for the specific country (9)
Schemes can cover multiple product groups and/or multiple policy areas
Safety &
Hygiene Traceability
Animal
Health
Origin &
specific
production
environment
Animal
Welfare
Organic
Farming
Integrated
crop/pest
management
Environmenta
l management
Sustainable
use of
resources
Climate
Change
Socioeconomi
c conditions
of producers
Organoleptic
Qualities
Traditional
ProductionOthers
Meat 1 2 - - 1 1 - - - - - 2 - 2
Milk - - - - - 1 - - - - - 1 - 1
Eggs - - - - - 1 - - - - - 1 - 1
Fish - - - - - 1 - - - - - 1 - 1
Fruit and
Vegetables- - - - - 1 - - - - - 1 - 1
Cereals - - - - - 1 - - - - - 1 - 1
Oils and Fats - - - - - - - - - - - - - -
Sugar and
Confectionery- - - - - 1 - - - - - - - -
Wine and
Spirits- - - - - - - - - - - 1 - 1
Other
Agricultural
Products
- - - - - - - - - - - - - -
Other
Processed
Food Products
- - - - - 1 - - - - - 1 - 1
Tab. A.20 - Number of schemes by product group and policy areas covered (Poland)
Product
groups
Policy areas covered
Note: aggregation fed by 4 schemes out of a maximum theoretical total of 5
Schemes can cover multiple product groups and/or multiple policy areas

Sc
he
me
s b
y
CO
VE
RE
D P
RO
DU
CT
S a
nd
PO
LIC
Y A
RE
ASafety &
Hygiene Traceability
Animal
Health
Origin &
specific
production
environment
Animal
Welfare
Organic
Farming
Integrated
crop/pest
management
Environmenta
l management
Sustainable
use of
resources
Climate
Change
Socioeconomi
c conditions
of producers
Organoleptic
Qualities
Traditional
ProductionOthers
Meat 1 2 1 3 - - 1 1 1 - 1 2 3 -
Milk 1 1 - 2 - - 1 - - - 1 1 2 -
Eggs 1 1 - 2 - - 1 - - - 1 1 2 -
Fish - - - 1 - - - - - - - 1 1 -
Fruit and
Vegetables1 2 1 3 - 1 1 1 1 - 1 2 3 -
Cereals 1 2 1 3 - - 1 1 1 - 1 2 3 -
Oils and Fats 1 2 1 3 - - 1 1 1 - 1 2 3 -
Sugar and
Confectionery1 1 - 2 - - 1 - - - 1 1 2 -
Wine and
Spirits- - - 1 - - - - - - - 1 1 -
Other
Agricultural
Products
- - - 1 - - - - - - - 1 1 -
Other
Processed
Food Products
1 - - 1 - - - 1 - - - 1 2 -
Tab. A.21 - Number of schemes by product group and policy areas covered (Portugal)
Product
groups
Policy areas covered
Note: aggregation fed by all the schemes included in the inventory for the specific country (5)
Schemes can cover multiple product groups and/or multiple policy areas
Safety &
Hygiene Traceability
Animal
Health
Origin &
specific
production
environment
Animal
Welfare
Organic
Farming
Integrated
crop/pest
management
Environmenta
l management
Sustainable
use of
resources
Climate
Change
Socioeconomi
c conditions
of producers
Organoleptic
Qualities
Traditional
ProductionOthers
Meat - - - - - 1 - - - - - - - -
Milk - - - - - 1 - - - - - - - -
Eggs - - - - - 1 - - - - - - - -
Fish - - - - - 1 - - - - - - - -
Fruit and
Vegetables- - - - - 1 - - - - - - - -
Cereals - - - - - 1 - - - - - - - -
Oils and Fats - - - - - 1 - - - - - - - -
Sugar and
Confectionery- - - - - - - - - - - - - -
Wine and
Spirits- - - - - - - - - - - - - -
Other
Agricultural
Products
- - - - - - - - - - - - - -
Other
Processed
Food Products
- - - - - 1 - - - - - - - -
Tab. A.22 - Number of schemes by product group and policy areas covered (Romania)
Product
groups
Policy areas covered
Note: aggregation fed by all the schemes included in the inventory for the specific country (1)
Schemes can cover multiple product groups and/or multiple policy areas

Sc
he
me
s b
y
CO
VE
RE
D P
RO
DU
CT
S a
nd
PO
LIC
Y A
RE
A
Safety &
Hygiene Traceability
Animal
Health
Origin &
specific
production
environment
Animal
Welfare
Organic
Farming
Integrated
crop/pest
management
Environmenta
l management
Sustainable
use of
resources
Climate
Change
Socioeconomi
c conditions
of producers
Organoleptic
Qualities
Traditional
ProductionOthers
Meat 1 - - 1 - 2 - - 1 - 1 - - -
Milk 1 - - 1 - 2 - - 1 - 1 - - -
Eggs 1 - - 1 - 2 - - 1 - - - - -
Fish 1 - - 1 - 1 - - - - 1 - - -
Fruit and
Vegetables1 - - 1 - 2 - - 1 - 1 - - -
Cereals 1 - - 1 - 2 - - 1 - 1 - - -
Oils and Fats 1 - - 1 - 1 - - - - - - - -
Sugar and
Confectionery1 - - 1 - 1 - - - - 1 - - -
Wine and
Spirits1 - - 1 - 1 - - - - 1 - - -
Other
Agricultural
Products
- - - - - - - - - - - - - -
Other
Processed
Food Products
1 - - 1 - 2 - - 1 - - - - -
Tab. A.23 - Number of schemes by product group and policy areas covered (Slovakia)
Product
groups
Policy areas covered
Note: aggregation fed by all the schemes included in the inventory for the specific country (3)
Schemes can cover multiple product groups and/or multiple policy areas
Safety &
Hygiene Traceability
Animal
Health
Origin &
specific
production
environment
Animal
Welfare
Organic
Farming
Integrated
crop/pest
management
Environmenta
l management
Sustainable
use of
resources
Climate
Change
Socioeconomi
c conditions
of producers
Organoleptic
Qualities
Traditional
ProductionOthers
Meat - - - - - 1 - - - - - - - -
Milk - - - - - 1 - - - - - - - -
Eggs - - - - - 1 - - - - - - - -
Fish - - - - - - - - - - - - - -
Fruit and
Vegetables- - - - - 1 - - - - - - - -
Cereals - - - - - - - - - - - - - -
Oils and Fats - - - - - 1 - - - - - - - -
Sugar and
Confectionery- - - - - - - - - - - - - -
Wine and
Spirits- - - - - 1 - - - - - - - -
Other
Agricultural
Products
- - - - - - - - - - - - - -
Other
Processed
Food Products
- - - - - 1 - - - - - - - -
Tab. A.24 - Number of schemes by product group and policy areas covered (Slovenia)
Product
groups
Policy areas covered
Note: aggregation fed by all the schemes included in the inventory for the specific country (1)
Schemes can cover multiple product groups and/or multiple policy areas

Sc
he
me
s b
y
CO
VE
RE
D P
RO
DU
CT
S a
nd
PO
LIC
Y A
RE
A
Safety &
Hygiene Traceability
Animal
Health
Origin &
specific
production
environment
Animal
Welfare
Organic
Farming
Integrated
crop/pest
management
Environmenta
l management
Sustainable
use of
resources
Climate
Change
Socioeconomi
c conditions
of producers
Organoleptic
Qualities
Traditional
ProductionOthers
Meat 11 18 2 8 5 3 4 2 2 - 3 9 9 2
Milk 7 10 - 5 2 3 3 1 - - 1 5 5 1
Eggs 3 4 - 2 - 2 2 1 - - - 2 1 -
Fish 5 6 - 3 1 1 2 1 - - - 2 2 -
Fruit and
Vegetables10 19 - 9 1 3 18 2 2 - 1 7 5 1
Cereals 4 8 - 3 2 2 8 1 - - 1 4 4 -
Oils and Fats 3 4 - 2 1 2 3 1 - - 1 3 4 -
Sugar and
Confectionery2 4 - 1 1 1 1 1 - - 1 2 3 -
Wine and
Spirits2 3 - 2 - 3 5 1 1 - 1 1 3 -
Other
Agricultural
Products
1 3 - 1 - 1 4 1 - - - 3 2 -
Other
Processed
Food Products
3 4 - 2 - 1 2 - - - 2 3 3 1
Tab. A.25 - Number of schemes by product group and policy areas covered (Spain)
Product
groups
Policy areas covered
Note: aggregation fed by all the schemes included in the inventory for the specific country (49)
Schemes can cover multiple product groups and/or multiple policy areas
Safety &
Hygiene Traceability
Animal
Health
Origin &
specific
production
environment
Animal
Welfare
Organic
Farming
Integrated
crop/pest
management
Environmenta
l management
Sustainable
use of
resources
Climate
Change
Socioeconomi
c conditions
of producers
Organoleptic
Qualities
Traditional
ProductionOthers
Meat - 2 1 3 4 2 1 5 3 1 1 2 - 2
Milk - 2 1 1 3 2 - 3 2 1 1 - - 1
Eggs - 2 1 1 3 2 - 3 2 1 1 - - 1
Fish - 2 1 - 2 2 - 1 1 1 1 - - 1
Fruit and
Vegetables- 2 1 1 3 2 1 4 3 1 1 - - 2
Cereals - 2 1 1 3 2 1 4 3 1 1 - - 2
Oils and Fats - 1 - 1 2 1 - 1 - - - - - 1
Sugar and
Confectionery- 1 - 1 2 1 - 1 - - - - - 1
Wine and
Spirits- 1 - 1 2 1 - 1 - - - - - 1
Other
Agricultural
Products
- - - - - - - 1 1 - - - - -
Other
Processed
Food Products
- - - - - - - - - - - - - 1
Tab. A.26 - Number of schemes by product group and policy areas covered (Sweden)
Product
groups
Policy areas covered
Note: aggregation fed by 8 schemes out of a maximum theoretical total of 9
Schemes can cover multiple product groups and/or multiple policy areas

Sc
he
me
s b
y
CO
VE
RE
D P
RO
DU
CT
S a
nd
PO
LIC
Y A
RE
A
Safety &
Hygiene Traceability
Animal
Health
Origin &
specific
production
environment
Animal
Welfare
Organic
Farming
Integrated
crop/pest
management
Environmenta
l management
Sustainable
use of
resources
Climate
Change
Socioeconomi
c conditions
of producers
Organoleptic
Qualities
Traditional
ProductionOthers
Meat 6 9 9 2 10 4 1 5 2 - - - 1 2
Milk 4 4 4 - 4 4 1 2 1 - - - - 2
Eggs 3 5 2 - 3 5 - 1 - - - - - 2
Fish 1 2 - - 2 3 - 3 1 - 1 - - 1
Fruit and
Vegetables4 5 1 1 2 6 - 3 2 - - - - 2
Cereals 5 7 2 - 2 5 1 1 1 - - - - 3
Oils and Fats 2 2 1 - 2 3 - 1 - - - - - 1
Sugar and
Confectionery2 2 1 - 2 2 - 1 - - - - - 1
Wine and
Spirits1 1 - - 1 2 - 1 - - - - - 1
Other
Agricultural
Products
4 2 2 - - - 2 2 1 - - - - -
Other
Processed
Food Products
1 1 - - - - - - - - - - - 1
Tab. A.27 - Number of schemes by product group and policy areas covered (United Kingdom)
Product
groups
Policy areas covered
Note: aggregation fed by all the schemes included in the inventory for the specific country (36)
Schemes can cover multiple product groups and/or multiple policy areas

Sc
he
me
s b
y P
RO
DU
CT
an
d P
RO
DU
CT
ION
PR
OC
ES
SE
S C
OV
ER
ED
Schemes by PRODUCT and PRODUCTION PROCESSES COVERED
Important notice
Many schemes featured in the inventory actually cover a combination of different
products and/or a combination of different production processes: this has
implications on the aggregations made.
In tables B.1 to B.27, wherever in the row of a specific product (e.g. “Cereals”) also
columns of production processes which apparently have no relation with the
product (e.g. “Animal production”) feature a value, this happens because at least
one scheme in the aggregation covers a combination of different products (e.g.
“Cereals” and “Meat”) and/or of different production processes (e.g. “Crop
production”, which concerns “Cereals”, plus “Animal production”, which concerns
“Meat”).

Sc
he
me
s b
y P
RO
DU
CT
an
d P
RO
DU
CT
ION
PR
OC
ES
SE
S C
OV
ER
ED
Agricultural
Inputs
production
Crop
production
Animal
production
(including
fish)
Food
processing
Storage
Packing
Handling
Transport
Distribution
(wholesale +
retail)
Others
Meat 49 117 193 166 64 67 8
Milk 39 111 124 128 46 48 6
Eggs 30 83 94 89 39 41 6
Fish 22 68 79 84 35 39 4
Fruit & Vegetables 39 156 116 135 71 53 6
Cereals 37 118 105 120 47 47 6
Oils & Fats 24 70 64 80 29 36 4
Sugar & Confectionary 21 63 55 73 24 28 5
Wine & Spirits 19 67 61 71 28 26 7
Other Agricultural Products 8 27 17 24 14 8 4
Other Processed Food 12 40 36 54 20 18 6
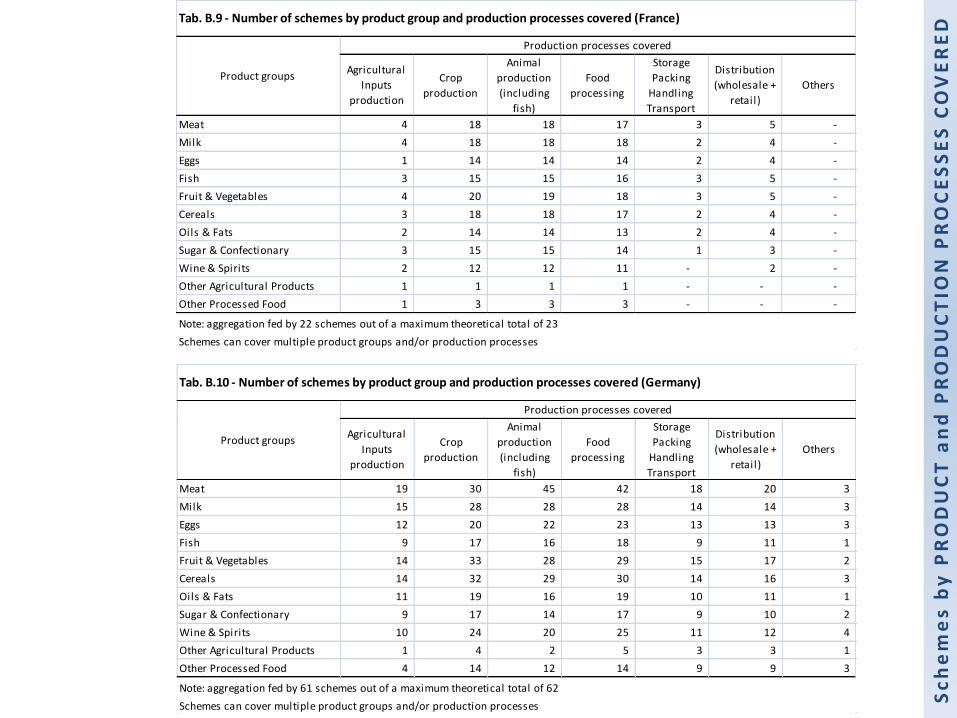
Tab. B.1 - Number of schemes by product group and production processes covered (EU-27)
Product groups
Production processes covered
Note: aggregation fed by 329 schemes out of a maximum theoretical total of 352
Schemes can cover multiple product groups and/or production processes
Agricultural
Inputs
production
Crop
production
Animal
production
(including
fish)
Food
processing
Storage
Packing
Handling
Transport
Distribution
(wholesale +
retail)
Others
Meat 2 7 11 9 2 6 -
Milk 2 7 11 10 3 9 -
Eggs 2 6 8 6 2 5 -
Fish 2 5 6 5 2 4 -
Fruit & Vegetables 2 7 7 8 2 6 -
Cereals 2 8 8 8 2 7 -
Oils & Fats 1 6 5 6 2 6 -
Sugar & Confectionary 1 4 3 4 2 3 -
Wine & Spirits - 5 4 4 2 3 -
Other Agricultural Products 1 2 2 1 - 1 -
Other Processed Food - 1 1 2 - 2 -
Tab. B.2 - Number of schemes by product group and production processes covered (Austria)
Product groups
Production processes covered
Note: aggregation fed by 24 schemes out of a maximum theoretical total of 24
Schemes can cover multiple product groups and/or production processes

Sc
he
me
s b
y P
RO
DU
CT
an
d P
RO
DU
CT
ION
PR
OC
ES
SE
S C
OV
ER
ED
Agricultural
Inputs
production
Crop
production
Animal
production
(including
fish)
Food
processing
Storage
Packing
Handling
Transport
Distribution
(wholesale +
retail)
Others
Meat 3 3 12 10 1 4 -
Milk 1 3 4 3 2 1 -
Eggs 1 2 3 3 2 2 -
Fish - 2 2 2 1 1 -
Fruit & Vegetables 1 6 3 5 4 2 1
Cereals 1 2 2 4 1 - -
Oils & Fats 1 1 1 2 - - -
Sugar & Confectionary 1 2 2 3 - - -
Wine & Spirits 1 2 2 2 - - -
Other Agricultural Products 2 - - - 2 - -
Other Processed Food 2 2 2 3 - - -
Tab. B.3 - Number of schemes by product group and production processes covered (Belgium)
Product groups
Production processes covered
Schemes can cover multiple product groups and/or production processes
Note: aggregation fed by 26 schemes out of a maximum theoretical total of 26
Agricultural
Inputs
production
Crop
production
Animal
production
(including
fish)
Food
processing
Storage
Packing
Handling
Transport
Distribution
(wholesale +
retail)
Others
Meat 1 1 1 1 - - -
Milk 1 1 1 1 - - -
Eggs 1 1 1 1 - - -
Fish - - - - - - -
Fruit & Vegetables 1 1 1 1 - - -
Cereals - - - - - - -
Oils & Fats - - - - - - -
Sugar & Confectionary - - - - - - -
Wine & Spirits - - - - - - -
Other Agricultural Products - - - - - - -
Other Processed Food 1 1 1 1 - - -
Tab. B.4 - Number of schemes by product group and production processes covered (Bulgaria)
Product groups
Production processes covered
Note: aggregation fed by 1 scheme out of a maximum theoretical total of 1
Schemes can cover multiple product groups and/or production processes

Sc
he
me
s b
y P
RO
DU
CT
an
d P
RO
DU
CT
ION
PR
OC
ES
SE
S C
OV
ER
ED
Agricultural
Inputs
production
Crop
production
Animal
production
(including
fish)
Food
processing
Storage
Packing
Handling
Transport
Distribution
(wholesale +
retail)
Others
Meat 1 2 2 2 - - -
Milk 1 2 2 2 - - -
Eggs - - - - - - -
Fish - 1 1 1 - - -
Fruit & Vegetables 1 2 2 2 - - -
Cereals 1 2 2 2 - - -
Oils & Fats - 1 1 1 - - -
Sugar & Confectionary - 1 1 1 - - -
Wine & Spirits - 1 1 1 - - -
Other Agricultural Products - - - - - - -
Other Processed Food - 1 1 1 - - -
Product groups
Production processes covered
Note: aggregation fed by 2 schemes out of a maximum theoretical total of 2
Tab. B.5 - Number of schemes by product group and production processes covered (Czech Republic)
Schemes can cover multiple product groups and/or production processes
Agricultural
Inputs
production
Crop
production
Animal
production
(including
fish)
Food
processing
Storage
Packing
Handling
Transport
Distribution
(wholesale +
retail)
Others
Meat - 1 8 3 2 - -
Milk - 1 2 1 - - -
Eggs - 1 1 - - - -
Fish - - - - - - -
Fruit & Vegetables - 2 1 - 1 - -
Cereals - 2 1 1 - - -
Oils & Fats - - - - - - -
Sugar & Confectionary - - - - - - -
Wine & Spirits - - - - - - -
Other Agricultural Products - - - - - - -
Other Processed Food - - - 1 - - -
Note: aggregation fed by 13 schemes out of a maximum theoretical total of 14
Schemes can cover multiple product groups and/or production processes
Tab. B.6 - Number of schemes by product group and production processes covered (Denmark)
Product groups
Production processes covered

Sc
he
me
s b
y P
RO
DU
CT
an
d P
RO
DU
CT
ION
PR
OC
ES
SE
S C
OV
ER
ED
Agricultural
Inputs
production
Crop
production
Animal
production
(including
fish)
Food
processing
Storage
Packing
Handling
Transport
Distribution
(wholesale +
retail)
Others
Meat - 1 1 1 1 1 -
Milk - 1 1 1 1 1 -
Eggs - 1 1 1 1 1 -
Fish - 1 1 1 1 1 -
Fruit & Vegetables - 1 1 1 1 1 -
Cereals - 1 1 1 1 1 -
Oils & Fats - 1 1 1 1 1 -
Sugar & Confectionary - - - - - - -
Wine & Spirits - - - - - - -
Other Agricultural Products - 1 1 1 1 1 -
Other Processed Food - 1 1 1 1 1 -
Tab. B.7 - Number of schemes by product group and production processes covered (Estonia)
Product groups
Production processes covered
Note: aggregation fed by 1 scheme out of a maximum theoretical total of 1
Schemes can cover multiple product groups and/or production processes
Agricultural
Inputs
production
Crop
production
Animal
production
(including
fish)
Food
processing
Storage
Packing
Handling
Transport
Distribution
(wholesale +
retail)
Others
Meat - 1 3 4 - 1 -
Milk - 1 1 3 - 1 -
Eggs - 1 1 2 - - -
Fish - 1 1 3 - 1 -
Fruit & Vegetables - 2 1 3 1 1 -
Cereals - 1 1 3 - 1 -
Oils & Fats - 1 1 3 - 1 -
Sugar & Confectionary - - - 2 - - -
Wine & Spirits - - - 2 - - -
Other Agricultural Products - - - - - - -
Other Processed Food - - - 2 - 1 -
Product groups
Production processes covered
Note: aggregation fed by 7 schemes out of a maximum theoretical total of 8
Tab. B.8 - Number of schemes by product group and production processes covered (Finland)
Schemes can cover multiple product groups and/or production processes
Sc
he
me
s b
y P
RO
DU
CT
an
d P
RO
DU
CT
ION
PR
OC
ES
SE
S C
OV
ER
ED
Agricultural
Inputs
production
Crop
production
Animal
production
(including
fish)
Food
processing
Storage
Packing
Handling
Transport
Distribution
(wholesale +
retail)
Others
Meat 4 18 18 17 3 5 -
Milk 4 18 18 18 2 4 -
Eggs 1 14 14 14 2 4 -
Fish 3 15 15 16 3 5 -
Fruit & Vegetables 4 20 19 18 3 5 -
Cereals 3 18 18 17 2 4 -
Oils & Fats 2 14 14 13 2 4 -
Sugar & Confectionary 3 15 15 14 1 3 -
Wine & Spirits 2 12 12 11 - 2 -
Other Agricultural Products 1 1 1 1 - - -
Other Processed Food 1 3 3 3 - - -
Note: aggregation fed by 22 schemes out of a maximum theoretical total of 23
Schemes can cover multiple product groups and/or production processes
Tab. B.9 - Number of schemes by product group and production processes covered (France)
Product groups
Production processes covered
Agricultural
Inputs
production
Crop
production
Animal
production
(including
fish)
Food
processing
Storage
Packing
Handling
Transport
Distribution
(wholesale +
retail)
Others
Meat 19 30 45 42 18 20 3
Milk 15 28 28 28 14 14 3
Eggs 12 20 22 23 13 13 3
Fish 9 17 16 18 9 11 1
Fruit & Vegetables 14 33 28 29 15 17 2
Cereals 14 32 29 30 14 16 3
Oils & Fats 11 19 16 19 10 11 1
Sugar & Confectionary 9 17 14 17 9 10 2
Wine & Spirits 10 24 20 25 11 12 4
Other Agricultural Products 1 4 2 5 3 3 1
Other Processed Food 4 14 12 14 9 9 3
Tab. B.10 - Number of schemes by product group and production processes covered (Germany)
Product groups
Production processes covered
Note: aggregation fed by 61 schemes out of a maximum theoretical total of 62
Schemes can cover multiple product groups and/or production processes
Sc
he
me
s b
y P
RO
DU
CT
an
d P
RO
DU
CT
ION
PR
OC
ES
SE
S C
OV
ER
ED
Agricultural
Inputs
production
Crop
production
Animal
production
(including
fish)
Food
processing
Storage
Packing
Handling
Transport
Distribution
(wholesale +
retail)
Others
Meat - 2 2 2 1 1 -
Milk - 1 1 - - - -
Eggs - 1 1 - - - -
Fish - - 1 1 1 1 -
Fruit & Vegetables - 2 1 1 - - -
Cereals - 2 1 1 - - -
Oils & Fats - - - - - - -
Sugar & Confectionary - - - - - - -
Wine & Spirits - - - - - - -
Other Agricultural Products - - - - - - -
Other Processed Food - - - - - - -
Product groups
Production processes covered
Note: aggregation fed by 4 schemes out of a maximum theoretical total of 4
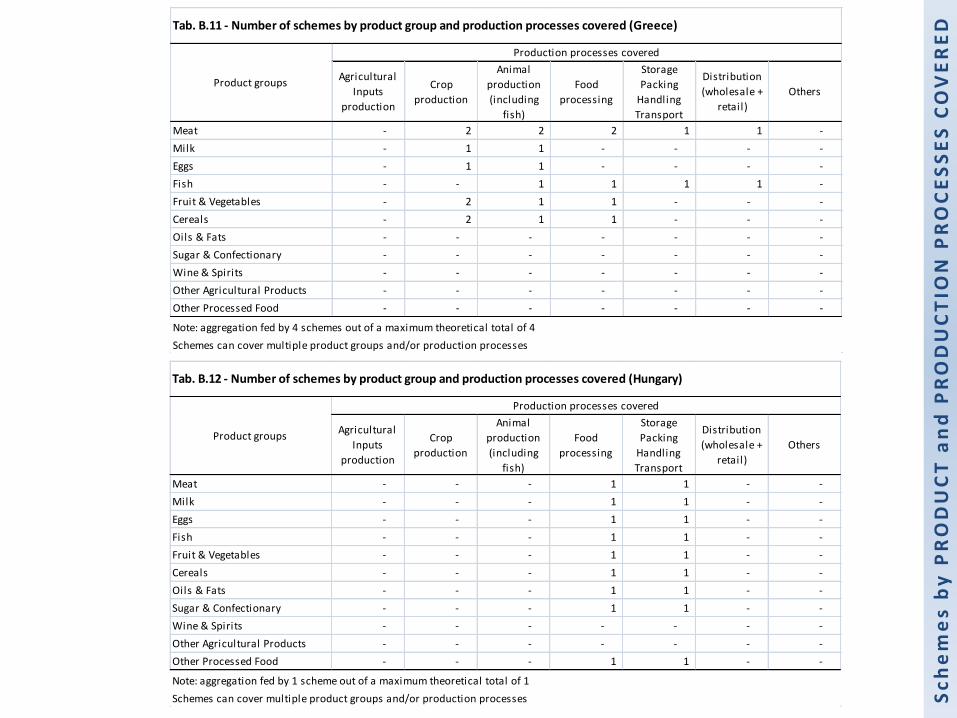
Tab. B.11 - Number of schemes by product group and production processes covered (Greece)
Schemes can cover multiple product groups and/or production processes
Agricultural
Inputs
production
Crop
production
Animal
production
(including
fish)
Food
processing
Storage
Packing
Handling
Transport
Distribution
(wholesale +
retail)
Others
Meat - - - 1 1 - -
Milk - - - 1 1 - -
Eggs - - - 1 1 - -
Fish - - - 1 1 - -
Fruit & Vegetables - - - 1 1 - -
Cereals - - - 1 1 - -
Oils & Fats - - - 1 1 - -
Sugar & Confectionary - - - 1 1 - -
Wine & Spirits - - - - - - -
Other Agricultural Products - - - - - - -
Other Processed Food - - - 1 1 - -
Note: aggregation fed by 1 scheme out of a maximum theoretical total of 1
Schemes can cover multiple product groups and/or production processes
Tab. B.12 - Number of schemes by product group and production processes covered (Hungary)
Product groups
Production processes covered

Sc
he
me
s b
y P
RO
DU
CT
an
d P
RO
DU
CT
ION
PR
OC
ES
SE
S C
OV
ER
ED
Agricultural
Inputs
production
Crop
production
Animal
production
(including
fish)
Food
processing
Storage
Packing
Handling
Transport
Distribution
(wholesale +
retail)
Others
Meat 3 3 5 5 4 4 -
Milk 3 2 3 2 2 2 -
Eggs 2 3 2 3 3 3 -
Fish 2 2 3 3 3 2 -
Fruit & Vegetables 2 3 2 3 3 3 -
Cereals 2 3 2 2 3 3 -
Oils & Fats 1 1 1 1 1 1 -
Sugar & Confectionary 1 1 1 1 1 1 -
Wine & Spirits 1 1 1 1 1 1 -
Other Agricultural Products 1 1 - - - - -
Other Processed Food - - - - - - -
Tab. B.13 - Number of schemes by product group and production processes covered (Ireland)
Product groups
Production processes covered
Note: aggregation fed by 9 schemes out of a maximum theoretical total of 9
Schemes can cover multiple product groups and/or production processes
Agricultural
Inputs
production
Crop
production
Animal
production
(including
fish)
Food
processing
Storage
Packing
Handling
Transport
Distribution
(wholesale +
retail)
Others
Meat 1 13 20 17 6 5 2
Milk 1 15 14 21 5 4 2
Eggs 1 8 7 10 3 2 2
Fish 1 9 12 12 4 4 2
Fruit & Vegetables 2 21 14 23 8 5 2
Cereals 2 12 9 15 3 2 2
Oils & Fats 1 8 6 10 2 3 2
Sugar & Confectionary 1 10 5 12 3 3 2
Wine & Spirits 2 7 6 7 3 2 2
Other Agricultural Products 1 7 3 8 2 1 2
Other Processed Food - 5 3 6 2 - 1
Product groups
Production processes covered
Note: aggregation fed by 42 schemes out of a maximum theoretical total of 52
Tab. B.14 - Number of schemes by product group and production processes covered (Italy)
Schemes can cover multiple product groups and/or production processes

Sc
he
me
s b
y P
RO
DU
CT
an
d P
RO
DU
CT
ION
PR
OC
ES
SE
S C
OV
ER
ED
Agricultural
Inputs
production
Crop
production
Animal
production
(including
fish)
Food
processing
Storage
Packing
Handling
Transport
Distribution
(wholesale +
retail)
Others
Meat 2 2 2 2 1 - -
Milk 2 2 2 2 1 - -
Eggs 1 1 1 1 - - -
Fish 1 1 1 1 - - -
Fruit & Vegetables 2 2 2 2 1 - -
Cereals 2 2 2 2 1 - -
Oils & Fats - - - - - - -
Sugar & Confectionary - - - - - - -
Wine & Spirits - - - - - - -
Other Agricultural Products - - - - - - -
Other Processed Food 1 1 1 1 - - -
Note: aggregation fed by 2 schemes out of a maximum theoretical total of 2
Schemes can cover multiple product groups and/or production processes
Tab. B.15 - Number of schemes by product group and production processes covered (Latvia)
Product groups
Production processes covered
Agricultural
Inputs
production
Crop
production
Animal
production
(including
fish)
Food
processing
Storage
Packing
Handling
Transport
Distribution
(wholesale +
retail)
Others
Meat - 2 2 2 1 1 -
Milk - 2 2 2 1 1 -
Eggs - 1 1 1 1 1 -
Fish - 1 1 1 - - -
Fruit & Vegetables - 2 2 2 1 1 -
Cereals - 2 2 2 1 1 -
Oils & Fats - 1 1 1 - - -
Sugar & Confectionary - - - - - - -
Wine & Spirits - - - - - - -
Other Agricultural Products - - - - - - -
Other Processed Food - 2 2 2 1 1 -
Tab. B.16 - Number of schemes by product group and production processes covered (Lithuania)
Product groups
Production processes covered
Note: aggregation fed by 2 schemes out of a maximum theoretical total of 2
Schemes can cover multiple product groups and/or production processes
Sc
he
me
s b
y P
RO
DU
CT
an
d P
RO
DU
CT
ION
PR
OC
ES
SE
S C
OV
ER
ED
Agricultural
Inputs
production
Crop
production
Animal
production
(including
fish)
Food
processing
Storage
Packing
Handling
Transport
Distribution
(wholesale +
retail)
Others
Meat - 1 1 - - - -
Milk - 1 1 - - - -
Eggs - 1 1 - - - -
Fish - 1 1 - - - -
Fruit & Vegetables - 1 1 - - - -
Cereals - - - - - - -
Oils & Fats - - - - - - -
Sugar & Confectionary - - - - - - -
Wine & Spirits - - - - - - -
Other Agricultural Products - - - - - - -
Other Processed Food - - - - - - -
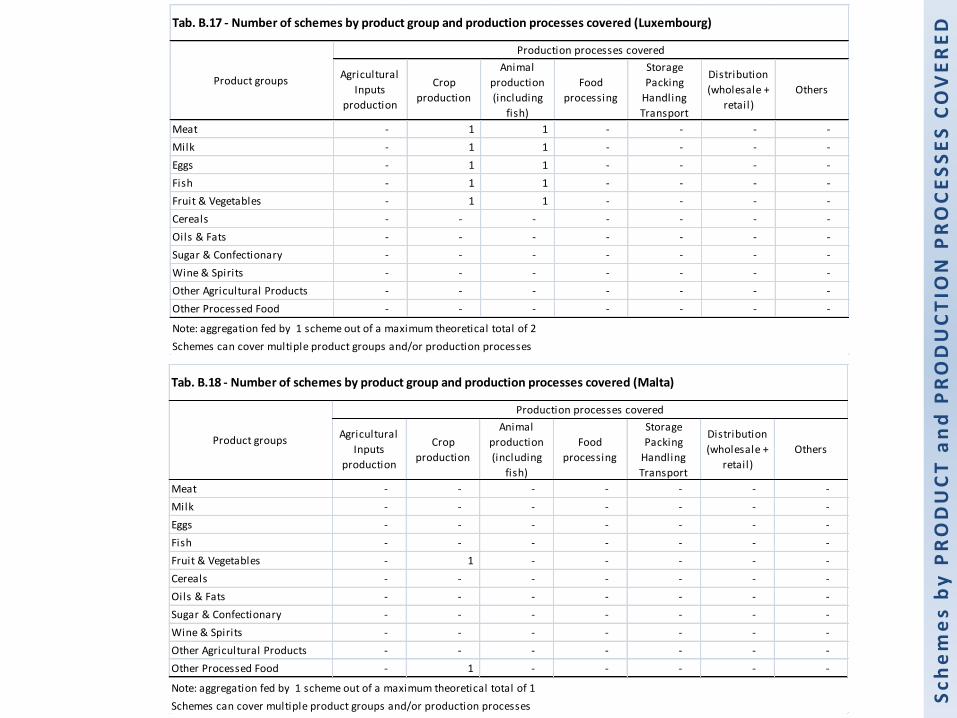
Product groups
Production processes covered
Note: aggregation fed by 1 scheme out of a maximum theoretical total of 2
Tab. B.17 - Number of schemes by product group and production processes covered (Luxembourg)
Schemes can cover multiple product groups and/or production processes
Agricultural
Inputs
production
Crop
production
Animal
production
(including
fish)
Food
processing
Storage
Packing
Handling
Transport
Distribution
(wholesale +
retail)
Others
Meat - - - - - - -
Milk - - - - - - -
Eggs - - - - - - -
Fish - - - - - - -
Fruit & Vegetables - 1 - - - - -
Cereals - - - - - - -
Oils & Fats - - - - - - -
Sugar & Confectionary - - - - - - -
Wine & Spirits - - - - - - -
Other Agricultural Products - - - - - - -
Other Processed Food - 1 - - - - -
Note: aggregation fed by 1 scheme out of a maximum theoretical total of 1
Schemes can cover multiple product groups and/or production processes
Tab. B.18 - Number of schemes by product group and production processes covered (Malta)
Product groups
Production processes covered

Sc
he
me
s b
y P
RO
DU
CT
an
d P
RO
DU
CT
ION
PR
OC
ES
SE
S C
OV
ER
ED
Agricultural
Inputs
production
Crop
production
Animal
production
(including
fish)
Food
processing
Storage
Packing
Handling
Transport
Distribution
(wholesale +
retail)
Others
Meat 3 3 8 5 3 2 2
Milk 1 2 3 3 2 1 1
Eggs 2 3 6 3 2 1 1
Fish - 1 2 1 1 1 1
Fruit & Vegetables 1 3 3 2 1 1 1
Cereals 1 2 2 2 1 1 1
Oils & Fats 1 2 2 2 1 1 1
Sugar & Confectionary 1 2 2 2 1 1 1
Wine & Spirits 1 2 2 2 1 1 1
Other Agricultural Products - 1 1 1 1 1 1
Other Processed Food - 1 1 1 1 1 1
Tab. B.19 - Number of schemes by product group and production processes covered (Netherlands)
Product groups
Production processes covered
Note: aggregation fed by 9 schemes out of a maximum theoretical total of 9
Schemes can cover multiple product groups and/or production processes
Agricultural
Inputs
production
Crop
production
Animal
production
(including
fish)
Food
processing
Storage
Packing
Handling
Transport
Distribution
(wholesale +
retail)
Others
Meat - 2 4 3 1 1 -
Milk - 2 2 2 - - -
Eggs - 2 2 2 - - -
Fish - 2 2 2 - - -
Fruit & Vegetables - 2 2 2 - - -
Cereals - 2 2 2 - - -
Oils & Fats - - - - - - -
Sugar & Confectionary - 1 1 1 - - -
Wine & Spirits - 1 1 1 - - -
Other Agricultural Products - - - - - - -
Other Processed Food - 2 2 2 - - -
Product groups
Production processes covered
Note: aggregation fed by 4 schemes out of a maximum theoretical total of 5
Tab. B.20 - Number of schemes by product group and production processes covered (Poland)
Schemes can cover multiple product groups and/or production processes

Sc
he
me
s b
y P
RO
DU
CT
an
d P
RO
DU
CT
ION
PR
OC
ES
SE
S C
OV
ER
ED
Agricultural
Inputs
production
Crop
production
Animal
production
(including
fish)
Food
processing
Storage
Packing
Handling
Transport
Distribution
(wholesale +
retail)
Others
Meat 2 2 2 3 2 3 -
Milk 1 1 1 2 1 2 -
Eggs 1 1 1 2 1 2 -
Fish - - 1 1 1 1 -
Fruit & Vegetables 2 3 2 3 2 3 -
Cereals 2 2 2 3 2 3 -
Oils & Fats 2 2 2 3 2 3 -
Sugar & Confectionary 1 1 1 2 1 2 -
Wine & Spirits - - 1 1 1 1 -
Other Agricultural Products - - 1 1 1 1 -
Other Processed Food - - 1 2 2 1 -
Note: aggregation fed by 5 schemes out of a maximum theoretical total of 5
Schemes can cover multiple product groups and/or production processes
Tab. B.21 - Number of schemes by product group and production processes covered (Portugal)
Product groups
Production processes covered
Agricultural
Inputs
production
Crop
production
Animal
production
(including
fish)
Food
processing
Storage
Packing
Handling
Transport
Distribution
(wholesale +
retail)
Others
Meat 1 1 1 1 - 1 -
Milk 1 1 1 1 - 1 -
Eggs 1 1 1 1 - 1 -
Fish 1 1 1 1 - 1 -
Fruit & Vegetables 1 1 1 1 - 1 -
Cereals 1 1 1 1 - 1 -
Oils & Fats 1 1 1 1 - 1 -
Sugar & Confectionary - - - - - - -
Wine & Spirits - - - - - - -
Other Agricultural Products - - - - - - -
Other Processed Food 1 1 1 1 - 1 -
Tab. B.22 - Number of schemes by product group and production processes covered (Romania)
Product groups
Production processes covered
Note: aggregation fed by 1 scheme out of a maximum theoretical total of 1
Schemes can cover multiple product groups and/or production processes

Sc
he
me
s b
y P
RO
DU
CT
an
d P
RO
DU
CT
ION
PR
OC
ES
SE
S C
OV
ER
ED
Agricultural
Inputs
production
Crop
production
Animal
production
(including
fish)
Food
processing
Storage
Packing
Handling
Transport
Distribution
(wholesale +
retail)
Others
Meat 1 1 1 - - - -
Milk 1 1 1 - - - -
Eggs 1 1 1 - - - -
Fish - - - - - - -
Fruit & Vegetables 1 1 1 - - - -
Cereals 1 1 1 - - - -
Oils & Fats - - - - - - -
Sugar & Confectionary - - - - - - -
Wine & Spirits - - - - - - -
Other Agricultural Products - - - - - - -
Other Processed Food 1 1 1 - - - -
Product groups
Production processes covered
Note: aggregation fed by 1 schemes out of a maximum theoretical total of 3
Tab. B.23 - Number of schemes by product group and production processes covered (Slovakia)
Schemes can cover multiple product groups and/or production processes
Agricultural
Inputs
production
Crop
production
Animal
production
(including
fish)
Food
processing
Storage
Packing
Handling
Transport
Distribution
(wholesale +
retail)
Others
Meat - 1 1 1 - - -
Milk - 1 1 1 - - -
Eggs - 1 1 1 - - -
Fish - - - - - - -
Fruit & Vegetables - 1 1 1 - - -
Cereals - - - - - - -
Oils & Fats - 1 1 1 - - -
Sugar & Confectionary - - - - - - -
Wine & Spirits - 1 1 1 - - -
Other Agricultural Products - - - - - - -
Other Processed Food - 1 1 1 - - -
Note: aggregation fed by 1 scheme out of a maximum theoretical total of 1
Schemes can cover multiple product groups and/or production processes
Tab. B.24 - Number of schemes by product group and production processes covered (Slovenia)
Product groups
Production processes covered

Sc
he
me
s b
y P
RO
DU
CT
an
d P
RO
DU
CT
ION
PR
OC
ES
SE
S C
OV
ER
ED
Agricultural
Inputs
production
Crop
production
Animal
production
(including
fish)
Food
processing
Storage
Packing
Handling
Transport
Distribution
(wholesale +
retail)
Others
Meat - 9 18 23 8 7 1
Milk - 8 12 16 4 3 -
Eggs - 6 7 7 3 2 -
Fish - 4 7 7 2 2 -
Fruit & Vegetables - 27 11 17 19 3 -
Cereals - 11 9 13 5 2 -
Oils & Fats - 6 6 9 2 - -
Sugar & Confectionary - 4 5 7 - 1 -
Wine & Spirits - 7 6 8 5 1 -
Other Agricultural Products - 6 4 6 2 - -
Other Processed Food 1 2 2 7 2 1 1
Tab. B.25 - Number of schemes by product group and production processes covered (Spain)
Product groups
Production processes covered
Note: aggregation fed by 49 schemes out of a maximum theoretical total of 49
Schemes can cover multiple product groups and/or production processes
Agricultural
Inputs
production
Crop
production
Animal
production
(including
fish)
Food
processing
Storage
Packing
Handling
Transport
Distribution
(wholesale +
retail)
Others
Meat 2 5 7 5 2 1 -
Milk 2 4 4 3 2 1 -
Eggs 2 4 4 3 2 1 -
Fish 1 2 2 3 2 1 -
Fruit & Vegetables 2 5 5 4 2 1 -
Cereals 2 5 5 4 2 1 -
Oils & Fats - 2 2 2 1 1 -
Sugar & Confectionary - 2 2 2 1 1 -
Wine & Spirits - 2 2 2 1 1 -
Other Agricultural Products 1 1 1 - - - -
Other Processed Food - - - 1 - - -
Product groups
Production processes covered
Note: aggregation fed by 8 schemes out of a maximum theoretical total of 9
Tab. B.26 - Number of schemes by product group and production processes covered (Sweden)
Schemes can cover multiple product groups and/or production processes

Sc
he
me
s b
y P
RO
DU
CT
an
d P
RO
DU
CT
ION
PR
OC
ES
SE
S C
OV
ER
ED
Agricultural
Inputs
production
Crop
production
Animal
production
(including
fish)
Food
processing
Storage
Packing
Handling
Transport
Distribution
(wholesale +
retail)
Others
Meat 4 6 18 7 7 4 -
Milk 3 6 8 5 5 3 -
Eggs 2 3 7 4 3 3 -
Fish 2 2 3 4 4 3 -
Fruit & Vegetables 3 7 5 6 6 3 -
Cereals 3 7 5 6 8 4 -
Oils & Fats 3 3 3 4 4 3 -
Sugar & Confectionary 3 3 3 4 4 3 -
Wine & Spirits 2 2 2 3 3 2 -
Other Agricultural Products - 3 1 - 2 - -
Other Processed Food - - - 1 1 - -
Note: aggregation fed by 30 schemes out of a maximum theoretical total of 36
Tab. B.27 - Number of schemes by product group and production processes covered (United Kingdom)
Product groups
Production processes covered
Schemes can cover multiple product groups and/or production processes

Sc
he
me
s b
y P
OL
ICY
AR
EA
an
d P
RO
DU
CT
ION
PR
OC
ES
SE
S C
OV
ER
ED
Schemes by POLICY AREA and PRODUCTION PROCESSES COVERED
Important notice
Many schemes featured in the inventory actually cover a combination of different policy areas and/or a combination of different production processes: this has implications on the aggregations made.
In tables C.1-C.15, wherever in the row (table C.1) or table (tables C.2-C.15) of a specific policy area (e.g. “Animal welfare”) also columns of production processes which apparently have no relation with the policy area (e.g. “Crop production”) feature a value, this happens because at least one scheme in the aggregation covers a combination of different policy areas (e.g. “Animal welfare” and “Organic farming”) and/or of different production processes (e.g. “Crop production” -which is related to “Organic farming” only - plus “Animal production”, which may be related to “Animal welfare” only or to both “Organic farming” and “Animal welfare”).

Sc
he
me
s b
y P
OL
ICY
AR
EA
an
d P
RO
DU
CT
ION
PR
OC
ES
SE
S C
OV
ER
ED
Agricultural
Inputs
production
Crop
production
Animal
production
(including
fish)
Food
processing
Storage
Packing
Handling
Transport
Distribution
(wholesale +
retail)
Others
Safety & Hygiene 18 46 67 70 46 33 2
Traceability 27 71 94 97 66 49 4
Animal Health 10 15 54 30 19 13 1
Origin & specific production environment 16 53 59 71 29 33 2
Animal Welfare 12 16 61 40 25 25 1
Organic Farming 22 62 57 59 32 30 3
Integrated crop/pest management 2 41 18 24 19 8 1
Environmental management 11 40 42 39 24 17 3
Sustainable use of resources 13 36 33 33 20 17 3
Climate Change 1 1 1 1 1 0 0
Socioeconomic conditions of producers 9 15 15 21 13 14 1
Organoleptic Qualities 7 37 45 61 26 19 5
Traditional Production 9 26 25 40 17 14 1
Others 8 20 29 29 16 14 3
Tab. C.1 - Number of schemes by policy area and production processes covered (EU-27)
Policy Area
Production processes covered
Note: aggregation fed by 329 schemes out of a maximum theoretical total of 352
Schemes can cover multiple policy areas and/or multiple production processes
Agricultural Inputs
productionCrop production
Animal production
(including fish)Food processing
Storage Packing
Handling
Transport
Distribution
(wholesale + retail)Others
Austria - 1 3 3 2 3 -
Belgium 5 1 5 7 6 4 1
Czech Republic - 1 1 1 - - -
Denmark - 2 6 5 3 - -
Finland - - 2 1 - - -
France 1 3 3 4 1 1 -
Germany 5 9 11 9 6 6 -
Greece - 2 3 3 2 2 -
Hungary - - - 1 1 - -
Ireland 1 3 1 2 2 2 -
Italy 1 10 11 11 4 5 -
Netherlands 1 - 4 3 2 - 1
Poland - - 1 - - - -
Portugal 1 1 - 2 1 1 -
Slovakia - - - - - - -
Spain 1 8 9 14 9 6 -
United Kingdom 2 5 7 4 7 3 -
EU-27 18 46 67 70 46 33 2
Tab. C.2 - Schemes covering the "safety & hygiene" policy area, by production processes covered and by Member State
Country
Production processes covered
Note: aggregation fed by 329 schemes out of a maximum theoretical total of 352
Schemes can cover multiple production processes

Sc
he
me
s b
y P
OL
ICY
AR
EA
an
d P
RO
DU
CT
ION
PR
OC
ES
SE
S C
OV
ER
ED
Agricultural Inputs
productionCrop production
Animal production
(including fish)Food processing
Storage Packing
Handling
Transport
Distribution
(wholesale + retail)Others
Austria 2 4 3 5 - 3 -
Belgium 4 3 4 7 6 5 -
Denmark - - 4 2 1 - -
Finland - - 1 - - - -
France - 8 7 8 1 2 -
Germany 8 12 17 15 10 9 -
Greece - 1 1 2 1 1 -
Hungary - - - 1 1 - -
Ireland 4 5 6 6 6 5 -
Italy 2 11 13 11 6 6 1
Netherlands 2 1 6 5 4 2 2
Poland - - 2 1 1 1 -
Portugal 2 2 1 2 1 2 -
Spain 1 17 16 24 18 8 1
Sweden 1 2 2 2 2 1 -
United Kingdom 1 5 11 6 8 4 -
EU-27 27 71 94 97 66 49 4
Tab. C.3 - Schemes covering the "traceability" policy area, by production processes covered and by Member State
Country
Production processes covered
Note: aggregation fed by 329 schemes out of a maximum theoretical total of 352
Schemes can cover multiple production processes
Agricultural Inputs
productionCrop production
Animal production
(including fish)Food processing
Storage Packing
Handling
Transport
Distribution
(wholesale + retail)Others
Austria - 1 4 1 - 1 -
Belgium - 1 6 3 2 1 -
Denmark - - 6 2 1 - -
Finland - - 1 1 - - -
Germany 5 4 12 10 4 3 1
Greece - 1 2 1 1 1 -
Ireland 1 1 1 1 1 1 -
Italy - 3 5 4 1 2 -
Netherlands 1 - 4 2 2 - -
Portugal 1 1 1 1 1 1 -
Spain - - 2 2 2 2 -
Sweden 1 1 1 1 1 - -
United Kingdom 1 2 9 1 3 1 -
EU-27 10 15 54 30 19 13 1
Tab. C.4 - Schemes covering the "animal health" policy area, by production processes covered and by Member State
Country
Production processes covered
Note: aggregation fed by 329 schemes out of a maximum theoretical total of 352
Schemes can cover multiple production processes

Sc
he
me
s b
y P
OL
ICY
AR
EA
an
d P
RO
DU
CT
ION
PR
OC
ES
SE
S C
OV
ER
ED
Agricultural Inputs
productionCrop production
Animal production
(including fish)Food processing
Storage Packing
Handling
Transport
Distribution
(wholesale + retail)Others
Austria 1 7 5 6 1 5 -
Belgium - 3 5 5 2 2 -
Czech Republic - 1 1 1 - - -
Finland - - - 2 - - -
France 3 11 11 11 - 2 -
Germany 7 14 20 17 9 10 2
Ireland - 1 1 2 2 2 -
Italy 2 4 1 7 1 2 -
Poland - - - - - - -
Portugal 2 2 2 3 2 3 -
Slovakia - - - - - - -
Spain 1 9 9 14 11 6 -
Sweden - 1 3 1 - - -
United Kingdom - - 1 2 1 1 -
EU-27 16 53 59 71 29 33 2
Tab. C.5 - Schemes covering the "origin & specific production environment" policy area, by production processes covered and by Member State
Country
Production processes covered
Note: aggregation fed by 329 schemes out of a maximum theoretical total of 352
Schemes can cover multiple production processes
Agricultural Inputs
productionCrop production
Animal production
(including fish)Food processing
Storage Packing
Handling
Transport
Distribution
(wholesale + retail)Others
Austria 1 - 4 2 3 3 -
Belgium 2 1 6 6 1 4 -
Denmark - - 4 1 1 - -
Finland - - 2 1 - - -
France - 1 1 1 - - -
Germany 2 - 7 5 1 1 -
Ireland 1 1 2 2 2 1 -
Italy - 4 8 5 3 4 -
Lithuania - 1 1 1 1 1 -
Netherlands 2 2 4 3 3 2 1
Poland - - 1 - - - -
Spain - 1 6 5 3 3 -
Sweden 1 3 4 3 2 1 -
United Kingdom 3 2 11 5 5 5 -
EU-27 12 16 61 40 25 25 1
Tab. C.6 - Schemes covering the "animal welfare" policy area, by production processes covered and by Member State
Country
Production processes covered
Note: aggregation fed by 329 schemes out of a maximum theoretical total of 352
Schemes can cover multiple production processes

Sc
he
me
s b
y P
OL
ICY
AR
EA
an
d P
RO
DU
CT
ION
PR
OC
ES
SE
S C
OV
ER
ED
Agricultural Inputs
productionCrop production
Animal production
(including fish)Food processing
Storage Packing
Handling
Transport
Distribution
(wholesale + retail)Others
Austria 2 7 8 8 5 5 -
Belgium 1 1 1 1 - - -
Bulgaria 1 1 1 1 - - -
Denmark - 1 1 - - - -
Estonia - 1 1 1 1 1 -
Finland - 1 1 - - - -
France - 1 1 1 1 1 -
Germany 7 17 16 20 11 13 2
Greece - 1 1 - - - -
Ireland 2 2 2 2 2 2 -
Italy 1 6 4 9 2 2 -
Latvia 2 2 2 2 1 - -
Lithuania - 1 1 1 - - -
Luxembourg - 2 1 - - - -
Malta - 1 - - - - -
Netherlands 1 2 2 2 1 1 1
Poland - 1 1 1 - - -
Portugal - 1 - - - - -
Romania 1 1 1 1 - 1 -
Slovakia 1 1 1 - - - -
Slovenia - 1 1 1 - - -
Spain - 3 3 3 2 1 -
Sweden 1 2 2 2 2 1 -
United Kingdom 2 5 5 3 4 2 -
EU-27 22 62 57 59 32 30 3
Tab. C.7 - Schemes covering the "organic farming" policy area, by production processes covered and by Member State
Country
Production processes covered
Note: aggregation fed by 329 schemes out of a maximum theoretical total of 352
Schemes can cover multiple production processes

Sc
he
me
s b
y P
OL
ICY
AR
EA
an
d P
RO
DU
CT
ION
PR
OC
ES
SE
S C
OV
ER
ED
Agricultural Inputs
productionCrop production
Animal production
(including fish)Food processing
Storage Packing
Handling
Transport
Distribution
(wholesale + retail)Others
Austria - 1 2 2 - 1 -
Belgium - 2 1 2 2 1 -
Denmark - 1 - - 1 - -
France - 3 2 1 1 1 -
Germany - 1 - - - - -
Greece - 1 - 1 - - -
Ireland 1 1 - - - - -
Italy - 8 5 7 1 2 1
Lithuania - 1 1 1 1 1 -
Portugal 1 1 - 1 - 1 -
Spain - 18 5 8 12 1 -
Sweden - 1 1 1 - - -
United Kingdom - 2 1 - 1 - -
EU-27 2 41 18 24 19 8 1
Tab. C.8 - Schemes covering the "integrated crop/pest management" policy area, by production processes covered and by Member State
Country
Production processes covered
Note: aggregation fed by 329 schemes out of a maximum theoretical total of 352
Schemes can cover multiple production processes
Agricultural Inputs
productionCrop production
Animal production
(including fish)Food processing
Storage Packing
Handling
Transport
Distribution
(wholesale + retail)Others
Austria - 3 3 2 - 2 -
Belgium - 1 - 2 1 - -
Denmark - 2 1 1 1 - -
France 1 4 4 3 1 1 -
Germany 4 11 10 12 8 7 2
Greece - - 1 1 1 1 -
Ireland - - 1 1 1 - -
Italy 1 6 5 6 2 1 -
Luxembourg - 1 - - - - -
Netherlands - 2 3 1 1 1 1
Portugal 1 1 1 2 2 1 -
Spain - 2 2 3 2 1 -
Sweden 2 4 5 3 1 - -
United Kingdom 2 3 6 2 3 2 -
EU-27 11 40 42 39 24 17 3
Tab. C.9 - Schemes covering the "environmental management" policy area, by production processes covered and by Member State
Country
Production processes covered
Note: aggregation fed by 329 schemes out of a maximum theoretical total of 352
Schemes can cover multiple production processes
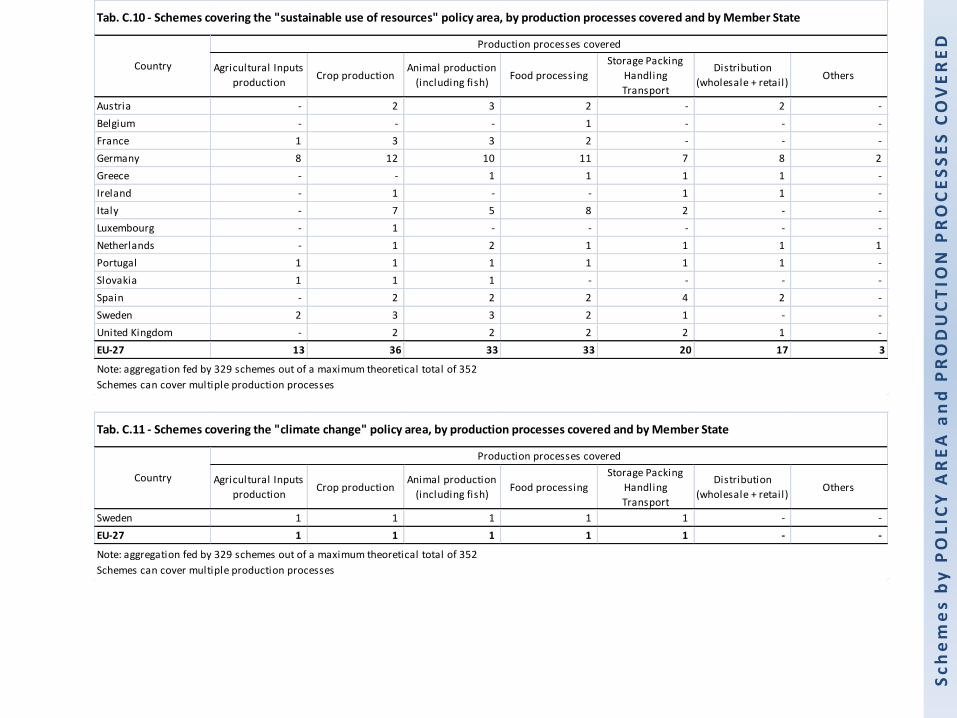
Sc
he
me
s b
y P
OL
ICY
AR
EA
an
d P
RO
DU
CT
ION
PR
OC
ES
SE
S C
OV
ER
ED
Agricultural Inputs
productionCrop production
Animal production
(including fish)Food processing
Storage Packing
Handling
Transport
Distribution
(wholesale + retail)Others
Austria - 2 3 2 - 2 -
Belgium - - - 1 - - -
France 1 3 3 2 - - -
Germany 8 12 10 11 7 8 2
Greece - - 1 1 1 1 -
Ireland - 1 - - 1 1 -
Italy - 7 5 8 2 - -
Luxembourg - 1 - - - - -
Netherlands - 1 2 1 1 1 1
Portugal 1 1 1 1 1 1 -
Slovakia 1 1 1 - - - -
Spain - 2 2 2 4 2 -
Sweden 2 3 3 2 1 - -
United Kingdom - 2 2 2 2 1 -
EU-27 13 36 33 33 20 17 3
Tab. C.10 - Schemes covering the "sustainable use of resources" policy area, by production processes covered and by Member State
Country
Production processes covered
Note: aggregation fed by 329 schemes out of a maximum theoretical total of 352
Schemes can cover multiple production processes
Agricultural Inputs
productionCrop production
Animal production
(including fish)Food processing
Storage Packing
Handling
Transport
Distribution
(wholesale + retail)Others
Sweden 1 1 1 1 1 - -
EU-27 1 1 1 1 1 - -
Tab. C.11 - Schemes covering the "climate change" policy area, by production processes covered and by Member State
Country
Production processes covered
Note: aggregation fed by 329 schemes out of a maximum theoretical total of 352
Schemes can cover multiple production processes

Sc
he
me
s b
y P
OL
ICY
AR
EA
an
d P
RO
DU
CT
ION
PR
OC
ES
SE
S C
OV
ER
ED
Agricultural Inputs
productionCrop production
Animal production
(including fish)Food processing
Storage Packing
Handling
Transport
Distribution
(wholesale + retail)Others
Austria 1 - 2 2 1 1 -
France 2 3 3 3 - - -
Germany 3 8 6 7 6 6 1
Italy - 2 1 2 1 2 -
Portugal 1 1 - 1 - 1 -
Slovakia - - - - - - -
Spain 1 - 2 4 3 3 -
Sweden 1 1 1 1 1 - -
United Kingdom - - - 1 1 1 -
EU-27 9 15 15 21 13 14 1
Tab. C.12 - Schemes covering the "socioeconomic conditions of producers" policy area, by production processes covered and by Member State
Country
Production processes covered
Note: aggregation fed by 329 schemes out of a maximum theoretical total of 352
Schemes can cover multiple production processes
Agricultural Inputs
productionCrop production
Animal production
(including fish)Food processing
Storage Packing
Handling
Transport
Distribution
(wholesale + retail)Others
Belgium - 3 7 8 5 3 1
Czech Republic 1 2 2 2 - - -
Denmark - 1 1 3 1 - -
France 1 10 10 11 1 3 -
Germany 1 1 4 7 3 4 1
Hungary - - - 1 1 - -
Italy 2 11 5 10 1 2 1
Lithuania - 1 1 1 1 1 -
Netherlands - - 1 1 - - 1
Poland - 1 2 2 1 1 -
Portugal 1 1 2 2 2 2 -
Spain 1 6 8 12 10 3 1
Sweden - - 2 1 - - -
EU-27 7 37 45 61 26 19 5
Tab. C.13 - Schemes covering the "organoleptic qualities" policy area, by production processes covered and by Member State
Country
Production processes covered
Note: aggregation fed by 329 schemes out of a maximum theoretical total of 352
Schemes can cover multiple production processes

Sc
he
me
s b
y P
OL
ICY
AR
EA
an
d P
RO
DU
CT
ION
PR
OC
ES
SE
S C
OV
ER
ED
Agricultural Inputs
productionCrop production
Animal production
(including fish)Food processing
Storage Packing
Handling
Transport
Distribution
(wholesale + retail)Others
Austria 1 2 2 1 - 2 -
Belgium - 3 2 4 2 2 -
France 2 6 6 5 1 1 -
Ireland - - 1 1 1 1 -
Italy 3 9 5 11 3 2 1
Portugal 2 2 2 4 3 3 -
Spain 1 4 6 14 7 3 -
United Kingdom - - 1 - - - -
EU-27 9 26 25 40 17 14 1
Tab. C.14 - Schemes covering the "traditional production" policy area, by production processes covered and by Member State
Country
Production processes covered
Note: aggregation fed by 329 schemes out of a maximum theoretical total of 352
Schemes can cover multiple production processes
Agricultural Inputs
productionCrop production
Animal production
(including fish)Food processing
Storage Packing
Handling
Transport
Distribution
(wholesale + retail)Others
Austria 1 2 2 2 1 1 -
Belgium 1 - 4 3 1 1 1
Denmark - 1 1 1 - - -
Finland - 1 - 1 1 1 -
France - 1 1 1 - - -
Germany 3 9 10 9 5 6 1
Hungary - - - 1 1 - -
Ireland 1 - 1 - - - -
Lithuania - 1 1 1 1 1 -
Luxembourg - 1 1 - - - -
Netherlands 2 1 3 3 3 2 1
Poland - 1 2 2 1 1 -
Spain - - 1 2 - 1 -
Sweden - 1 1 2 - - -
United Kingdom - 1 1 1 2 - -
EU-27 8 20 29 29 16 14 3
Tab. C.15 - Schemes covering "other" policy areas, by production processes covered and by Member State
Country
Production processes covered
Note: aggregation fed by 329 schemes out of a maximum theoretical total of 352
Schemes can cover multiple production processes

Sc
he
me
s b
y T
YP
E O
F P
RO
DU
CT
an
d T
AR
GE
TE
D A
CT
OR
S
B2B B2C Total
Austria 1 12 13
Belgium - 13 13
Bulgaria - 1 1
Czech Republic - 2 2
Denmark - 9 9
Estonia - 1 1
Finland - 7 7
France - 19 19
Germany 4 44 48
Greece - 3 3
Hungary - 1 1
Ireland 1 5 6
Italy - 28 28
Latvia - 2 2
Lithuania - 2 2
Luxembourg - 1 1
Netherlands - 8 8
Poland - 4 4
Portugal - 3 3
Romania - 1 1
Slovakia - 3 3
Slovenia - 1 1
Spain 1 24 25
Sweden 1 7 8
United Kingdom 6 14 20
EU-27 14 215 229
Tab. D.1 - Schemes covering the "meat" product group, by type of targeted
actors and by Member State
CountryType of targeted actors
Note: aggregation fed by 343 schemes out of a maximum theoretical total of 352
B2B B2C Total
Austria 1 13 14
Belgium 1 3 4
Bulgaria - 1 1
Czech Republic - 2 2
Denmark - 3 3
Estonia - 1 1
Finland - 5 5
France - 20 20
Germany 3 29 32
Greece - 1 1
Hungary - 1 1
Ireland 1 2 3
Italy - 26 26
Latvia - 2 2
Lithuania - 2 2
Luxembourg - 1 1
Netherlands 1 2 3
Poland - 2 2
Portugal - 2 2
Romania - 1 1
Slovakia - 3 3
Slovenia - 1 1
Spain 1 15 16
Sweden 1 4 5
United Kingdom 3 7 10
EU-27 12 149 161
Tab. D.2 - Schemes covering the "milk" product group, by type of targeted
actors and by Member State
CountryType of targeted actors
Note: aggregation fed by 343 schemes out of a maximum theoretical total of 352
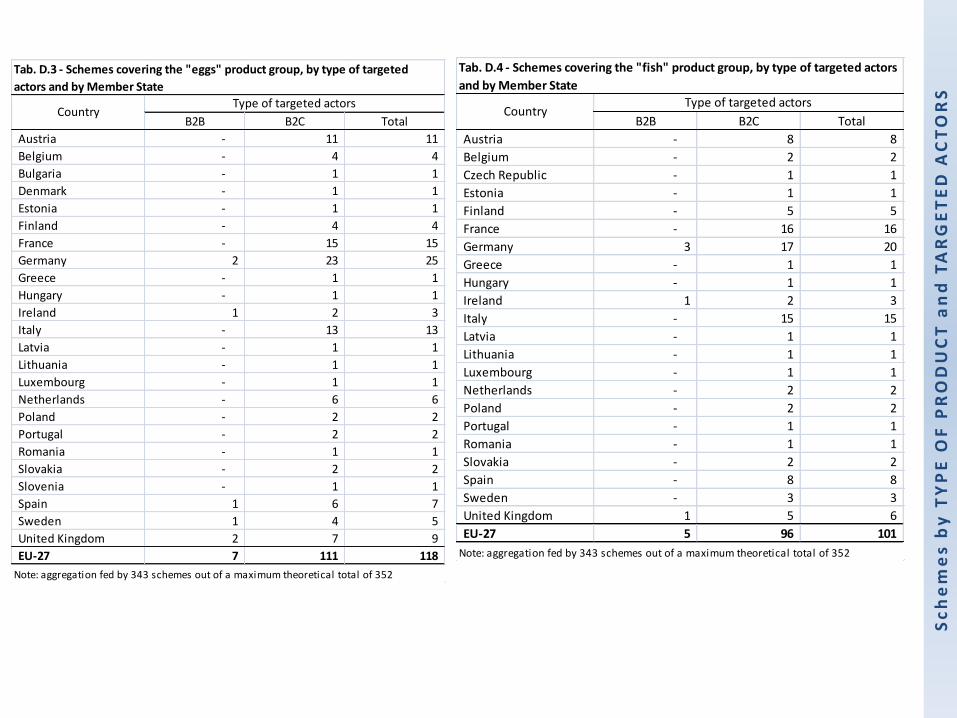
Sc
he
me
s b
y T
YP
E O
F P
RO
DU
CT
an
d T
AR
GE
TE
D A
CT
OR
S
B2B B2C Total
Austria - 11 11
Belgium - 4 4
Bulgaria - 1 1
Denmark - 1 1
Estonia - 1 1
Finland - 4 4
France - 15 15
Germany 2 23 25
Greece - 1 1
Hungary - 1 1
Ireland 1 2 3
Italy - 13 13
Latvia - 1 1
Lithuania - 1 1
Luxembourg - 1 1
Netherlands - 6 6
Poland - 2 2
Portugal - 2 2
Romania - 1 1
Slovakia - 2 2
Slovenia - 1 1
Spain 1 6 7
Sweden 1 4 5
United Kingdom 2 7 9
EU-27 7 111 118
Tab. D.3 - Schemes covering the "eggs" product group, by type of targeted
actors and by Member State
CountryType of targeted actors
Note: aggregation fed by 343 schemes out of a maximum theoretical total of 352
B2B B2C Total
Austria - 8 8
Belgium - 2 2
Czech Republic - 1 1
Estonia - 1 1
Finland - 5 5
France - 16 16
Germany 3 17 20
Greece - 1 1
Hungary - 1 1
Ireland 1 2 3
Italy - 15 15
Latvia - 1 1
Lithuania - 1 1
Luxembourg - 1 1
Netherlands - 2 2
Poland - 2 2
Portugal - 1 1
Romania - 1 1
Slovakia - 2 2
Spain - 8 8
Sweden - 3 3
United Kingdom 1 5 6
EU-27 5 96 101
Tab. D.4 - Schemes covering the "fish" product group, by type of targeted actors
and by Member State
CountryType of targeted actors
Note: aggregation fed by 343 schemes out of a maximum theoretical total of 352

Sc
he
me
s b
y T
YP
E O
F P
RO
DU
CT
an
d T
AR
GE
TE
D A
CT
OR
S
B2B B2C Total
Austria 0 10 10
Belgium 0 8 8
Bulgaria 0 1 1
Czech Republic 0 2 2
Denmark 0 2 2
Estonia 0 1 1
Finland 0 6 6
France 0 22 22
Germany 4 31 35
Greece 0 2 2
Hungary 0 1 1
Ireland 1 2 3
Italy 0 33 33
Latvia 0 2 2
Lithuania 0 2 2
Luxembourg 0 1 1
Malta 0 1 1
Netherlands 0 3 3
Poland 0 2 2
Portugal 0 4 4
Romania 0 1 1
Slovakia 0 3 3
Slovenia 0 1 1
Spain 2 28 30
Sweden 1 5 6
United Kingdom 2 9 11
EU-27 10 183 193
Tab. D.5 - Schemes covering the "fruit & vegetables" product group, by type of
targeted actors and by Member State
CountryType of targeted actors
Note: aggregation fed by 343 schemes out of a maximum theoretical total of 352
B2B B2C Total
Austria - 11 11
Belgium 2 3 5
Czech Republic - 2 2
Denmark - 2 2
Estonia - 1 1
Finland - 5 5
France - 19 19
Germany 3 32 35
Greece - 2 2
Hungary - 1 1
Ireland 2 1 3
Italy - 19 19
Latvia - 2 2
Lithuania - 2 2
Netherlands - 2 2
Poland - 2 2
Portugal - 3 3
Romania - 1 1
Slovakia - 3 3
Spain 1 15 16
Sweden 1 5 6
United Kingdom 3 8 11
EU-27 12 141 153
Tab. D.6 - Schemes covering the "cereals" product group, by type of targeted
actors and by Member State
CountryType of targeted actors
Note: aggregation fed by 343 schemes out of a maximum theoretical total of 352

Sc
he
me
s b
y T
YP
E O
F P
RO
DU
CT
an
d T
AR
GE
TE
D A
CT
OR
S
B2B B2C Total
Austria - 8 8
Belgium 1 1 2
Czech Republic - 1 1
Estonia - 1 1
Finland - 5 5
France - 15 15
Germany 2 19 21
Hungary - 1 1
Ireland - 1 1
Italy - 13 13
Lithuania - 1 1
Netherlands - 2 2
Portugal - 3 3
Romania - 1 1
Slovakia - 1 1
Slovenia - 1 1
Spain - 9 9
Sweden - 3 3
United Kingdom 1 4 5
EU-27 4 90 94
Tab. D.7 - Schemes covering the "oils&fats" product group, by type of targeted
actors and by Member State
CountryType of targeted actors
Note: aggregation fed by 343 schemes out of a maximum theoretical total of 352
B2B B2C Total
Austria - 5 5
Belgium - 3 3
Czech Republic - 1 1
Finland - 3 3
France - 16 16
Germany 2 17 19
Hungary - 1 1
Ireland - 1 1
Italy - 16 16
Netherlands - 2 2
Poland - 1 1
Portugal - 2 2
Slovakia - 2 2
Spain - 7 7
Sweden - 3 3
United Kingdom 1 3 4
EU-27 3 83 86
Tab. D.8 - Schemes covering the "sugar & confectionery" product group, by type
of targeted actors and by Member State
CountryType of targeted actors
Note: aggregation fed by 343 schemes out of a maximum theoretical total of 352

Sc
he
me
s b
y T
YP
E O
F P
RO
DU
CT
an
d T
AR
GE
TE
D A
CT
OR
S
B2B B2C Total
Austria - 6 6
Belgium - 2 2
Czech Republic - 1 1
Finland - 3 3
France - 13 13
Germany 2 25 27
Ireland - 1 1
Italy - 12 12
Netherlands - 2 2
Poland - 1 1
Portugal - 1 1
Slovakia - 2 2
Slovenia - 1 1
Spain 1 8 9
Sweden - 3 3
United Kingdom 1 2 3
EU-27 4 83 87
Tab. D.9 - Schemes covering the "wine & spirits" product group, by type of
targeted actors and by Member State
CountryType of targeted actors
Note: aggregation fed by 343 schemes out of a maximum theoretical total of 352
B2B B2C Total
Austria 1 2 3
Belgium 2 - 2
Estonia - 1 1
France - 1 1
Germany - 5 5
Ireland 1 - 1
Italy - 8 8
Netherlands - 1 1
Portugal - 1 1
Spain - 7 7
Sweden 1 - 1
United Kingdom 5 1 6
EU-27 10 27 37
Tab. D.10 - Schemes covering the "other agricultural products" product group,
by type of targeted actors and by Member State
CountryType of targeted actors
Note: aggregation fed by 343 schemes out of a maximum theoretical total of 352
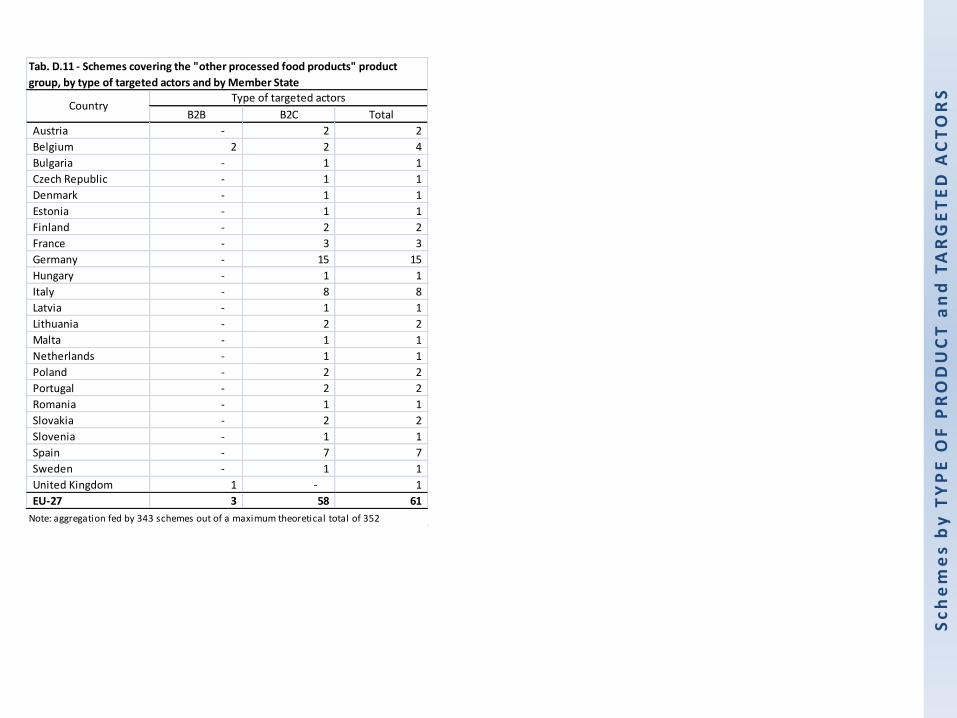
Sc
he
me
s b
y T
YP
E O
F P
RO
DU
CT
an
d T
AR
GE
TE
D A
CT
OR
S
B2B B2C Total
Austria - 2 2
Belgium 2 2 4
Bulgaria - 1 1
Czech Republic - 1 1
Denmark - 1 1
Estonia - 1 1
Finland - 2 2
France - 3 3
Germany - 15 15
Hungary - 1 1
Italy - 8 8
Latvia - 1 1
Lithuania - 2 2
Malta - 1 1
Netherlands - 1 1
Poland - 2 2
Portugal - 2 2
Romania - 1 1
Slovakia - 2 2
Slovenia - 1 1
Spain - 7 7
Sweden - 1 1
United Kingdom 1 - 1
EU-27 3 58 61
Tab. D.11 - Schemes covering the "other processed food products" product
group, by type of targeted actors and by Member State
CountryType of targeted actors
Note: aggregation fed by 343 schemes out of a maximum theoretical total of 352

Sc
he
me
s b
y P
OL
ICY
AR
EA
an
d T
AR
GE
TE
D A
CT
OR
S
B2B B2C Total
Austria 1 5 6
Belgium 6 8 14
Czech Republic - 1 1
Denmark - 9 9
Finland - 2 2
France - 4 4
Germany 3 11 14
Greece - 4 4
Hungary - 1 1
Ireland 2 2 4
Italy - 22 22
Netherlands 1 3 4
Poland - 1 1
Portugal - 2 2
Slovakia - 1 1
Spain - 19 19
United Kingdom 6 10 16
EU-27 19 105 124
Tab. E.1 - Schemes covering the "safety & hygiene" policy area, by type of targeted
actors and by Member State
CountryType of targeted actors
Note: aggregation fed by 346 schemes out of a maximum theoretical total of 352
B2B B2C Total
Austria - 6 6
Belgium 4 8 12
Denmark - 4 4
Finland - 1 1
France - 9 9
Germany 3 17 20
Greece - 2 2
Hungary - 1 1
Ireland 3 6 9
Italy - 27 27
Netherlands 1 5 6
Poland - 2 2
Portugal - 2 2
Spain - 37 37
Sweden - 2 2
United Kingdom 4 14 18
EU-27 15 143 158
Tab. E.2 - Schemes covering the "traceability" policy area, by type of targeted actors
and by Member State
CountryType of targeted actors
Note: aggregation fed by 346 schemes out of a maximum theoretical total of 352

Sc
he
me
s b
y P
OL
ICY
AR
EA
an
d T
AR
GE
TE
D A
CT
OR
S
B2B B2C Total
Austria - 4 4
Belgium 1 5 6
Denmark - 7 7
Finland - 1 1
Germany - 12 12
Greece - 2 2
Ireland - 1 1
Italy - 9 9
Netherlands 1 3 4
Portugal - 1 1
Spain - 2 2
Sweden - 1 1
United Kingdom 4 7 11
EU-27 6 55 61
Tab. E.3 - Schemes covering the "animal health" policy area, by type of targeted
actors and by Member State
CountryType of targeted actors
Note: aggregation fed by 346 schemes out of a maximum theoretical total of 352
B2B B2C Total
Austria - 10 10
Belgium - 6 6
Czech Republic - 1 1
Finland - 3 3
France - 12 12
Germany 2 20 22
Ireland - 2 2
Italy - 14 14
Poland - 1 1
Portugal - 3 3
Slovakia - 1 1
Spain - 18 18
Sweden - 3 3
United Kingdom 1 1 2
EU-27 3 95 98
Tab. E.4 - Schemes covering the "origin & specific production environment" policy area,
by type of targeted actors and by Member State
CountryType of targeted actors
Note: aggregation fed by 346 schemes out of a maximum theoretical total of 352
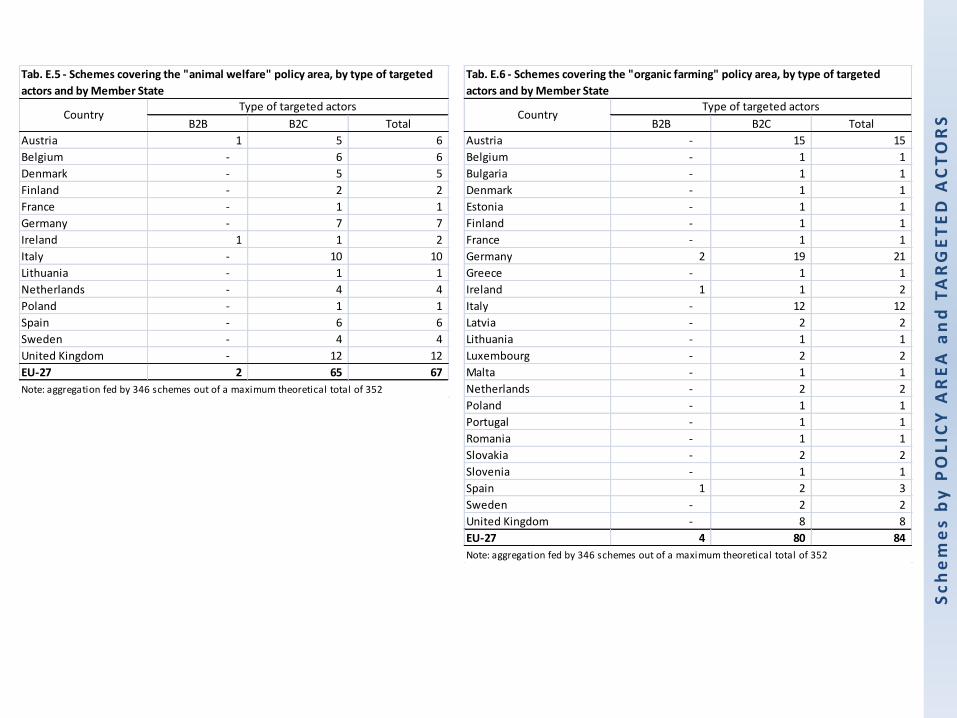
Sc
he
me
s b
y P
OL
ICY
AR
EA
an
d T
AR
GE
TE
D A
CT
OR
SB2B B2C Total
Austria 1 5 6
Belgium - 6 6
Denmark - 5 5
Finland - 2 2
France - 1 1
Germany - 7 7
Ireland 1 1 2
Italy - 10 10
Lithuania - 1 1
Netherlands - 4 4
Poland - 1 1
Spain - 6 6
Sweden - 4 4
United Kingdom - 12 12
EU-27 2 65 67
Tab. E.5 - Schemes covering the "animal welfare" policy area, by type of targeted
actors and by Member State
CountryType of targeted actors
Note: aggregation fed by 346 schemes out of a maximum theoretical total of 352
B2B B2C Total
Austria - 15 15
Belgium - 1 1
Bulgaria - 1 1
Denmark - 1 1
Estonia - 1 1
Finland - 1 1
France - 1 1
Germany 2 19 21
Greece - 1 1
Ireland 1 1 2
Italy - 12 12
Latvia - 2 2
Lithuania - 1 1
Luxembourg - 2 2
Malta - 1 1
Netherlands - 2 2
Poland - 1 1
Portugal - 1 1
Romania - 1 1
Slovakia - 2 2
Slovenia - 1 1
Spain 1 2 3
Sweden - 2 2
United Kingdom - 8 8
EU-27 4 80 84
Tab. E.6 - Schemes covering the "organic farming" policy area, by type of targeted
actors and by Member State
CountryType of targeted actors
Note: aggregation fed by 346 schemes out of a maximum theoretical total of 352

Sc
he
me
s b
y P
OL
ICY
AR
EA
an
d T
AR
GE
TE
D A
CT
OR
S
B2B B2C Total
Austria 1 3 4
Belgium - 3 3
Denmark - 1 1
France - 3 3
Germany 1 - 1
Greece - 1 1
Ireland 1 - 1
Italy - 10 10
Lithuania - 1 1
Portugal - 1 1
Spain 2 16 18
Sweden - 1 1
United Kingdom 2 - 2
EU-27 7 40 47
Tab. E.7 - Schemes covering the "integrated crop/pest management" policy area, by type
of targeted actors and by Member State
CountryType of targeted actors
Note: aggregation fed by 346 schemes out of a maximum theoretical total of 352
B2B B2C Total
Austria - 4 4
Belgium 1 2 3
Denmark - 4 4
France - 5 5
Germany - 13 13
Greece - 1 1
Ireland - 1 1
Italy - 12 12
Luxembourg - 1 1
Netherlands - 3 3
Portugal - 2 2
Spain - 3 3
Sweden 2 4 6
United Kingdom 2 7 9
EU-27 5 62 67
Tab. E.8 - Schemes covering the "environmental management" policy area, by type
of targeted actors and by Member State
CountryType of targeted actors
Note: aggregation fed by 346 schemes out of a maximum theoretical total of 352

Sc
he
me
s b
y P
OL
ICY
AR
EA
an
d T
AR
GE
TE
D A
CT
OR
S
B2B B2C Total
Austria - 3 3
Belgium - 1 1
France - 3 3
Germany - 12 12
Greece - 1 1
Ireland 1 - 1
Italy - 12 12
Luxembourg - 1 1
Netherlands - 2 2
Portugal - 1 1
Slovakia - 1 1
Spain - 4 4
Sweden 1 2 3
United Kingdom 1 3 4
EU-27 3 46 49
Tab. E.9 - Schemes covering the "sustainable use of resources" policy area, by type
of targeted actors and by Member State
CountryType of targeted actors
Note: aggregation fed by 346 schemes out of a maximum theoretical total of 352
B2B B2C Total
Sweden - 1 1
EU-27 - 1 1
Tab. E.10 - Schemes covering the "climate change" policy area, by type of
targeted actors and by Member State
CountryType of targeted actors
Note: aggregation fed by 346 schemes out of a maximum theoretical total of 352

Sc
he
me
s b
y P
OL
ICY
AR
EA
an
d T
AR
GE
TE
D A
CT
OR
S
B2B B2C Total
Austria - 2 2
France - 4 4
Germany - 8 8
Italy - 4 4
Portugal - 1 1
Slovakia - 1 1
Spain - 4 4
Sweden - 1 1
United Kingdom - 1 1
EU-27 - - 26
Tab. E.11 - Schemes covering the "socioeconomic conditions of producers"
policy area, by type of targeted actors and by Member State
CountryType of targeted actors
Note: aggregation fed by 346 schemes out of a maximum theoretical total of 352
B2B B2C Total
Belgium 1 13 14
Czech Republic - 2 2
Denmark - 3 3
France - 12 12
Germany - 8 8
Hungary - 1 1
Italy - 15 15
Lithuania - 1 1
Netherlands - 1 1
Poland - 2 2
Portugal - 2 2
Spain - 17 17
Sweden - 2 2
EU-27 1 79 80
Tab. E.12 - Schemes covering the "organoleptic qualities" policy area, by type of
targeted actors and by Member State
CountryType of targeted actors
Note: aggregation fed by 346 schemes out of a maximum theoretical total of 352

Sc
he
me
s b
y P
OL
ICY
AR
EA
an
d T
AR
GE
TE
D A
CT
OR
S
B2B B2C Total
Austria - 4 4
Belgium - 4 4
France - 6 6
Ireland - 1 1
Italy - 16 16
Portugal - 4 4
Spain - 15 15
United Kingdom - 1 1
EU-27 - 51 51
Tab. E.13 - Schemes covering the "traditional production" policy area, by type of
targeted actors and by Member State
Country
Note: aggregation fed by 346 schemes out of a maximum theoretical total of 352
B2B B2C Total
Austria - 2 2
Belgium 1 6 7
Denmark - 2 2
Finland - 2 2
France - 1 1
Germany 2 12 14
Hungary - 1 1
Ireland - 1 1
Lithuania - 1 1
Luxembourg - 1 1
Netherlands - 3 3
Poland - 2 2
Spain - 2 2
Sweden - 2 2
United Kingdom 1 2 3
EU-27 4 40 44
Tab. E.14 - Schemes covering "other" policy areas, by type of targeted actors and by
Member State
CountryType of targeted actors
Note: aggregation fed by 346 schemes out of a maximum theoretical total of 352