Inventories and the Cost of Goods Sold
24
8-1 PowerPoint Authors: Susan Coomer Galbreath, Ph.D., CPA Charles W. Caldwell, D.B.A., CMA Jon A. Booker, Ph.D., CPA, CIA Copyright © 2012 The McGraw-Hill Companies, Inc. McGraw-Hill/Irwin Inventories and the Inventories and the Cost of Goods Sold Cost of Goods Sold Chapter 8
-
Upload
orlando-estes -
Category
Documents
-
view
46 -
download
7
description
Inventories and the Cost of Goods Sold. Chapter 8. BALANCE SHEET. Asset. Inventory. INCOME STATEMENT. Revenue. Cost of goods sold. Gross profit. Expenses. Net income. The Flow of Inventory Costs. Purchase costs (or manufacturing costs). as goods are sold. - PowerPoint PPT Presentation
Transcript of Inventories and the Cost of Goods Sold

8-1
PowerPoint Authors:Susan Coomer Galbreath, Ph.D., CPACharles W. Caldwell, D.B.A., CMAJon A. Booker, Ph.D., CPA, CIACynthia J. Rooney, Ph.D., CPA
Copyright © 2012 The McGraw-Hill Companies, Inc.
McGraw-Hill/Irwin
Inventories and the Cost Inventories and the Cost of Goods Soldof Goods Sold
Chapter 8

8-2
INCOME STATEMENT
Revenue Cost of goods sold Gross profit Expenses Net income
as goods are sold
BALANCE SHEET
Asset Inventory
Purchase costs (or manufacturing
costs)
The Flow of Inventory The Flow of Inventory CostsCosts

8-3
When identical units of inventory have different unit costs, a question naturally arises as to which of these costs should be used in recording a sale of inventory.
Which Unit Did We Sell? Which Unit Did We Sell?

8-4
The Bike Company (TBC)
Data for an IllustrationData for an Illustration

8-5
On August 14, TBC sold 20 bikes for $130 each. Of the bikes sold 9 originally cost $91 and
11 cost $106.
On August 14, TBC sold 20 bikes for $130 each. Of the bikes sold 9 originally cost $91 and
11 cost $106.
Specific IdentificationSpecific Identification
The Cost of Goods Sold for the August 14 sale is $1,985. This leaves 5 units, with a total cost of $515, in inventory:
1 unit that costs $91 and 4 units that cost $106 each.
The Cost of Goods Sold for the August 14 sale is $1,985. This leaves 5 units, with a total cost of $515, in inventory:
1 unit that costs $91 and 4 units that cost $106 each.
Purchases Cost of Goods Sold
Date Units Unit Cost Total Units Unit Cost Total Units
Unit Cost Total
Aug. 1 10 @ 91$ = 910$ 10 @ 91$ = 910$
Aug. 3 15 @ 106$ = 1,590$ 10 @ 91$
15 @ 106$
Aug. 14 9 @ 91$ 1 @ 91$
11 @ 106$ 4 @ 106$
Inventory Balance
= 2,500$
= 515$ = 1,985$

8-6
Purchases Cost of Goods Sold
Date Units Unit Cost Total Units
Unit Cost Total Units
Unit Cost Total
Aug. 1 10 @ 91$ = 910$ 10 @ 91$ = 910$
Aug. 3 15 @ 106$ = 1,590$ 25 @ 100$ = 2,500$
Aug. 14 20 @ 100$ = 2,000$ 5 @ 100$ = 500$
Aug. 17 20 @ 115$ = 2,300$ 25 @ 112$ = 2,800$
Aug. 28 10 @ 119$ = 1,190$ 35 @ 114$ = 3,990$
Aug. 31 23 @ 114$ = 2,622$ 12 @ 114$ = 1,368$
Inventory Balance
Average-Cost MethodAverage-Cost Method
$114 = $3,990 35$114 = $3,990 35
Additional purchases were made on August 17 and August 28. On August 31, an additional 23 units
were sold.
Additional purchases were made on August 17 and August 28. On August 31, an additional 23 units
were sold.

8-7
Purchases Cost of Goods Sold
Date Units Unit Cost Total Units
Unit Cost Total Units
Unit Cost Total
Aug. 1 10 @ 91$ = 910$ 10 @ 91$ = 910$
Aug. 3 15 @ 106$ = 1,590$ 10 @ 91$
15 @ 106$
Aug. 14 10 @ 91$
10 @ 106$ @ 106$
Inventory Balance
= 2,500$
= 1,970$ = 530$ 5
On August 14, TBC sold 20 bikes for $130 each. On August 14, TBC sold 20 bikes for $130 each. On August 14, TBC sold 20 bikes for $130 each. On August 14, TBC sold 20 bikes for $130 each.
The Cost of Goods Sold for the August 14 sale is $1,970, leaving 5 units, with a total cost of $530, in inventory.
The Cost of Goods Sold for the August 14 sale is $1,970, leaving 5 units, with a total cost of $530, in inventory.
First-In, First-Out Method First-In, First-Out Method (FIFO)(FIFO)
8-8
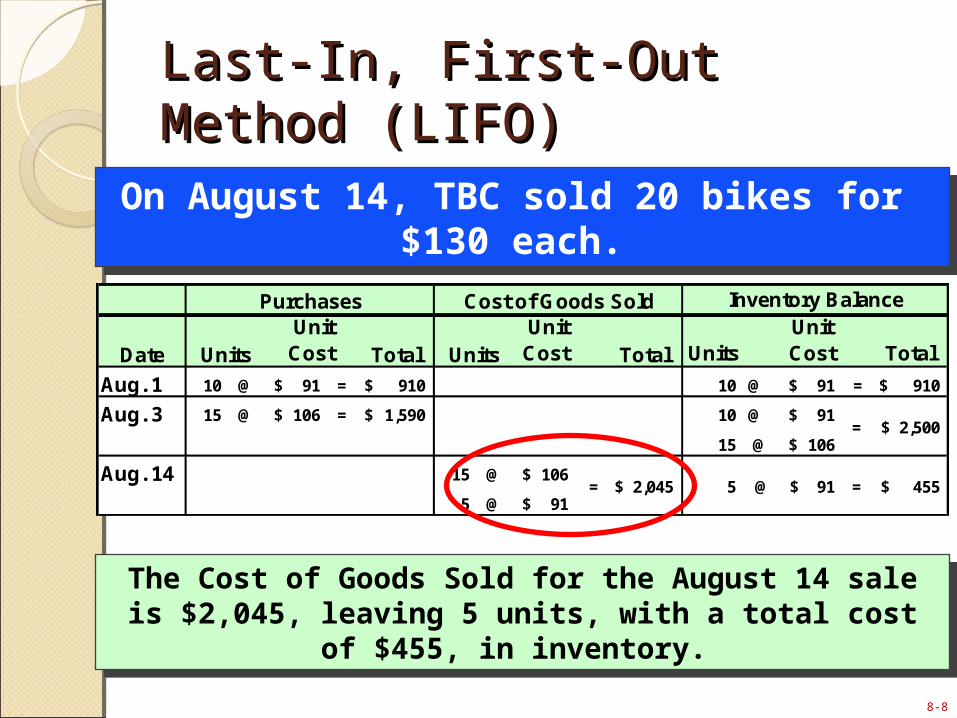
Purchases Cost of Goods Sold
Date Units Unit Cost Total Units
Unit Cost Total Units
Unit Cost Total
Aug. 1 10 @ 91$ = 910$ 10 @ 91$ = 910$
Aug. 3 15 @ 106$ = 1,590$ 10 @ 91$
15 @ 106$
Aug. 14 15 @ 106$
5 @ 91$ = 455$ = 2,045$ 5 @ 91$
Inventory Balance
= 2,500$
On August 14, TBC sold 20 bikes for $130 each.
On August 14, TBC sold 20 bikes for $130 each.
Last-In, First-Out Method Last-In, First-Out Method (LIFO)(LIFO)
The Cost of Goods Sold for the August 14 sale is $2,045, leaving 5 units, with a total cost of $455, in inventory.
The Cost of Goods Sold for the August 14 sale is $2,045, leaving 5 units, with a total cost of $455, in inventory.

8-9
Inventory Valuation Methods: A SummaryCosts Allocated to:
Valuation Method
Cost of Goods Sold Inventory Comments
Specific Actual cost of Actual cost of units Parallels physical flow identification the units sold remaining Logical method when units
are uniqueMay be misleading for identical units
Average cost Number of units sold times the
Number of units on hand times the
Assigns all units the same average unit cost
average unit cost average unit cost Current costs are averaged in with older costs
First-in, First-out (FIFO)
Cost of earliest purchases on
Cost of most recently
Cost of goods sold is based on older costs
hand prior to the sale
purchased units Inventory valued at current costsMay overstate income during periods of rising prices; may increase income taxes due
Last-in, First-out (LIFO)
Cost of most recently
Cost of earliest purchases
Cost of goods sold shown at recent prices
purchased units (assumed still in inventory)
Inventory shown at old (and perhaps out of date) costsMost conservative method during periods of rising prices; often results in lower income taxes

8-10
The primary reason for taking a physical inventory is to adjust the perpetual inventory
records for unrecorded shrinkage losses, such as theft, spoilage, or breakage.
The primary reason for taking a physical inventory is to adjust the perpetual inventory
records for unrecorded shrinkage losses, such as theft, spoilage, or breakage.
Taking a Physical Taking a Physical InventoryInventory
8-11
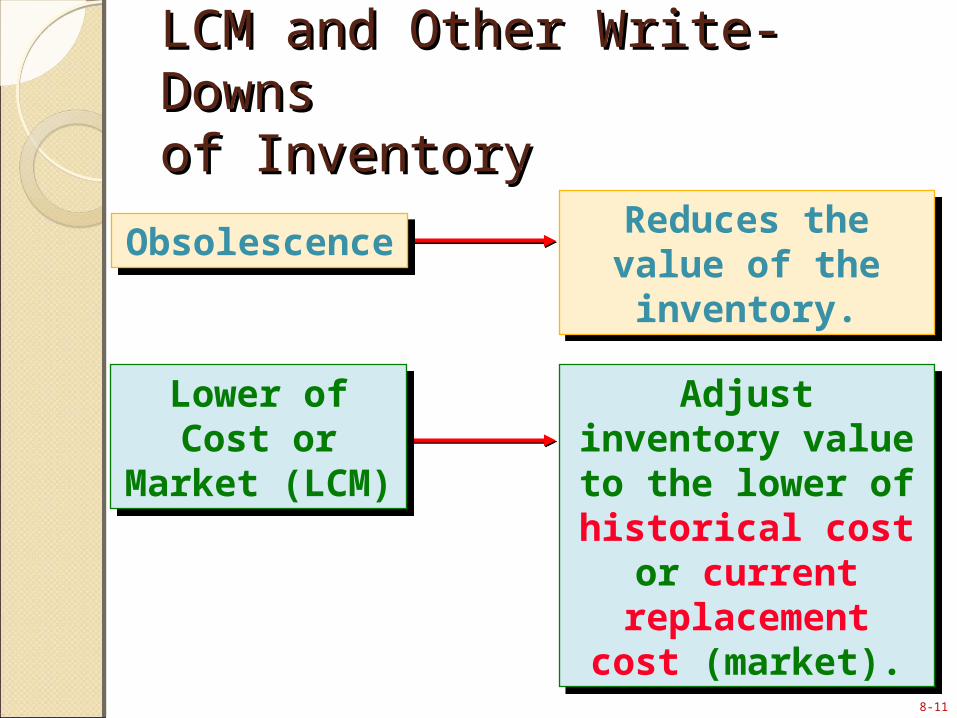
Reduces the value of the inventory.
Reduces the value of the inventory.ObsolescenceObsolescence
Adjust inventory value to the lower
of historical cost or current
replacement cost (market).
Adjust inventory value to the lower
of historical cost or current
replacement cost (market).
Lower of Cost or Market
(LCM)
Lower of Cost or Market
(LCM)
LCM and Other Write-DownsLCM and Other Write-Downsof Inventoryof Inventory
8-12
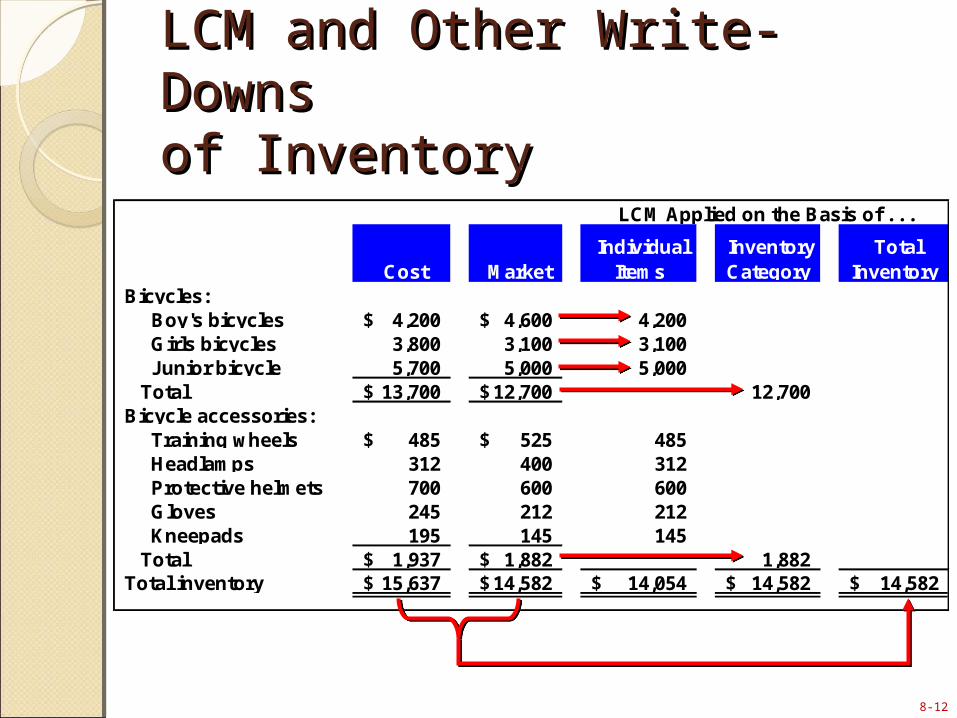
LCM and Other Write-DownsLCM and Other Write-Downsof Inventoryof Inventory
Cost Market Individual
Items Inventory Category
Total Inventory
Bicycles: Boy's bicycles 4,200$ 4,600$ 4,200 Girls bicycles 3,800 3,100 3,100 Junior bicycle 5,700 5,000 5,000 Total 13,700$ 12,700$ 12,700 Bicycle accessories: Training wheels 485$ 525$ 485 Headlamps 312 400 312 Protective helmets 700 600 600 Gloves 245 212 212 Kneepads 195 145 145 Total 1,937$ 1,882$ 1,882 Total inventory 15,637$ 14,582$ 14,054$ 14,582$ 14,582$
LCM Applied on the Basis of . . .
8-13
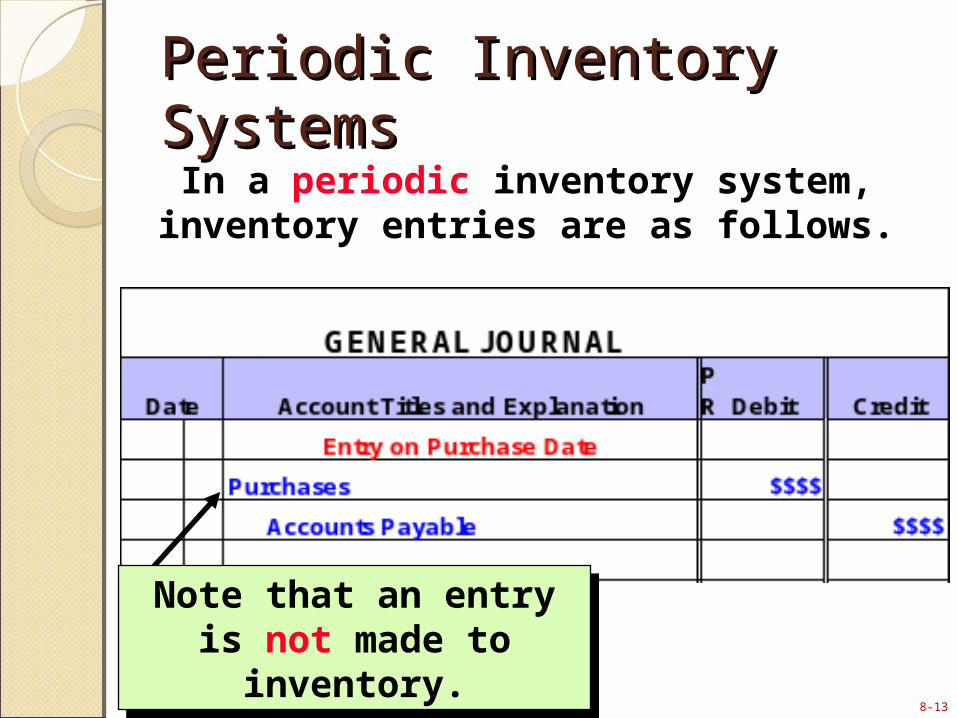
In a periodic inventory system, inventory entries are as follows.
Note that an entry is not made to inventory.
Note that an entry is not made to inventory.
Periodic Inventory Periodic Inventory SystemsSystems

8-14
Computers, Inc.Mouse Pad Inventory
Date Units $/Unit TotalBeginning Inventory 1,000 5.25$ 5,250.00$ Purchases:Jan. 3 300 5.30 1,590.00 June 20 150 5.60 840.00 Sept. 15 200 5.80 1,160.00 Nov. 29 150 5.90 885.00 Goods Available for Sale 1,800 9,725.00$
Ending Inventory 1,200 ?
Cost of Goods Sold 600 ?
Information for the Following Information for the Following Inventory ExamplesInventory Examples
8-15
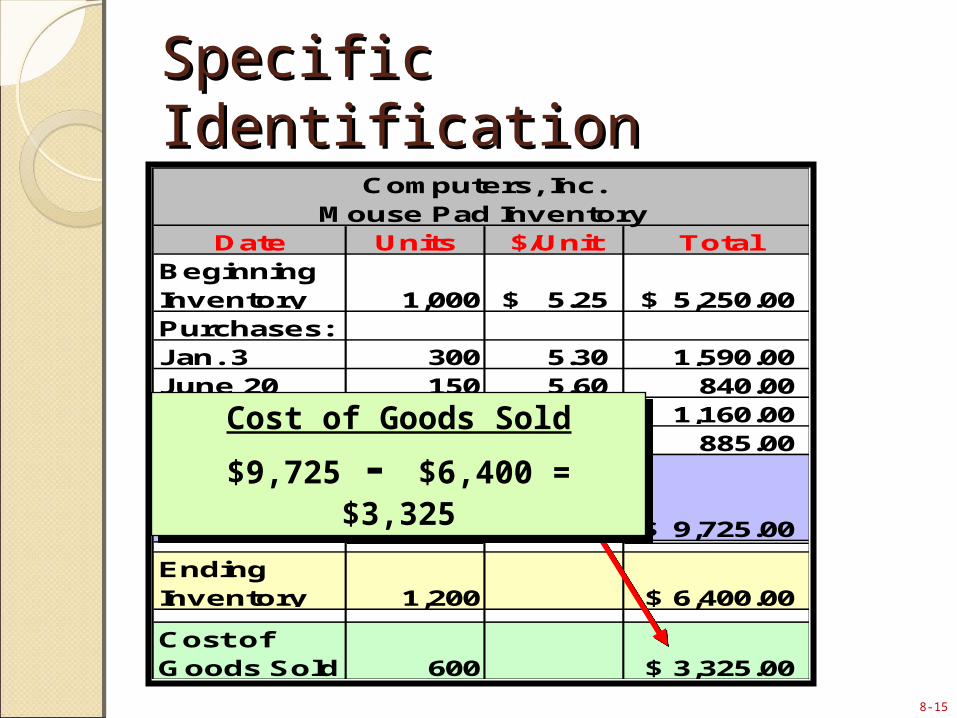
Computers, Inc.Mouse Pad Inventory
Date Units $/Unit TotalBeginning Inventory 1,000 5.25$ 5,250.00$ Purchases:Jan. 3 300 5.30 1,590.00 June 20 150 5.60 840.00 Sept. 15 200 5.80 1,160.00 Nov. 29 150 5.90 885.00 Goods Available for Sale 1,800 9,725.00$
Ending Inventory 1,200 6,400.00$
Cost of Goods Sold 600 3,325.00$
Cost of Goods Sold
$9,725 - $6,400 = $3,325
Cost of Goods Sold
$9,725 - $6,400 = $3,325
Specific IdentificationSpecific Identification
8-16
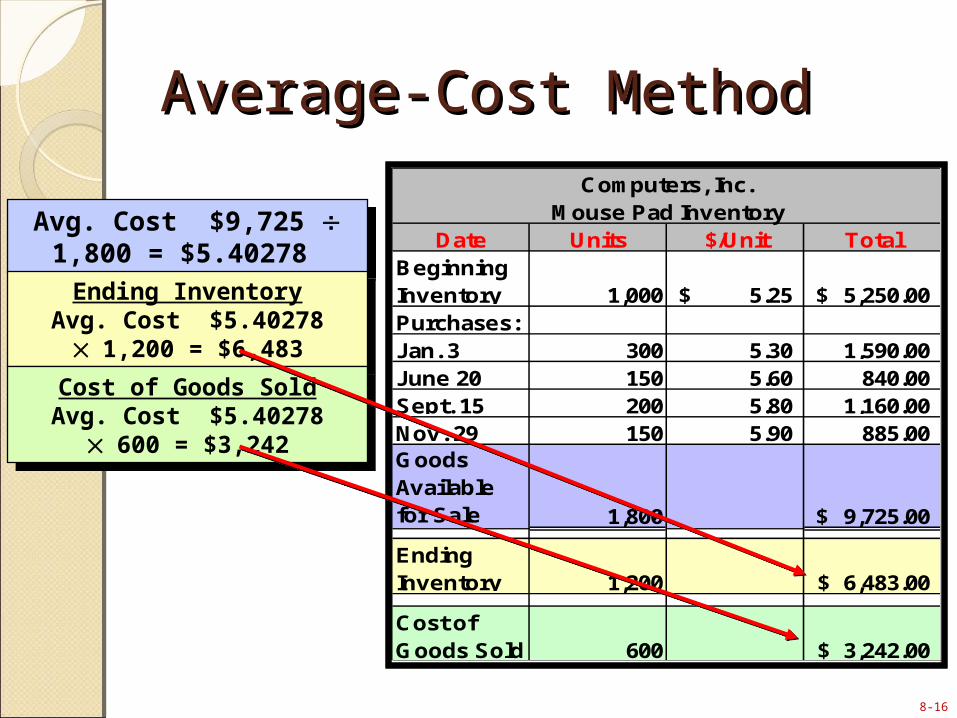
Computers, Inc.Mouse Pad Inventory
Date Units $/Unit TotalBeginning Inventory 1,000 5.25$ 5,250.00$ Purchases:Jan. 3 300 5.30 1,590.00 June 20 150 5.60 840.00 Sept. 15 200 5.80 1,160.00 Nov. 29 150 5.90 885.00 Goods Available for Sale 1,800 9,725.00$
Ending Inventory 1,200 ?
Cost of Goods Sold 600 ?
Avg. Cost $9,725 1,800 = $5.40278
Avg. Cost $9,725 1,800 = $5.40278
Average-Cost MethodAverage-Cost MethodComputers, Inc.
Mouse Pad InventoryDate Units $/Unit Total
Beginning Inventory 1,000 5.25$ 5,250.00$ Purchases:Jan. 3 300 5.30 1,590.00 June 20 150 5.60 840.00 Sept. 15 200 5.80 1,160.00 Nov. 29 150 5.90 885.00 Goods Available for Sale 1,800 9,725.00$
Ending Inventory 1,200 6,483.00$
Cost of Goods Sold 600 3,242.00$
Ending InventoryAvg. Cost $5.40278 1,200
= $6,483
Ending InventoryAvg. Cost $5.40278 1,200
= $6,483
Cost of Goods SoldAvg. Cost $5.40278 600 =
$3,242
Cost of Goods SoldAvg. Cost $5.40278 600 =
$3,242

8-17
Date Beg. Inv. Purchases End. Inv.Cost of
Goods Sold
Nov. 29 150@$5.90 150@$5.90Units 150
First-In, First-Out Method First-In, First-Out Method (FIFO)(FIFO)
Date Beg. Inv. Purchases End. Inv.Cost of
Goods Sold1,000@$5.25 600@$5.25
400@$5.25Jan. 3 300@$5.30 300@$5.30June 20 150@$5.60 150@$5.60Sept. 15 200@$5.80 200@$5.80Nov. 29 150@$5.90 150@$5.90Units 1,200 600
Date Beg. Inv. Purchases End. Inv.Cost of
Goods Sold1,000@$5.25 600@$5.25
400@$5.25Jan. 3 300@$5.30 300@$5.30June 20 150@$5.60 150@$5.60Sept. 15 200@$5.80 200@$5.80Nov. 29 150@$5.90 150@$5.90Units 1,200 600
Costs $6,575 $3,150
Cost of Goods Available for Sale $9,725

8-18
Date Beg. Inv. Purchases End. Inv.Cost of
Goods Sold1,000@$5.25 1,000@$5.25
Units 1,000
Last-In, First-Out Method Last-In, First-Out Method (LIFO)(LIFO)
Date Beg. Inv. Purchases End. Inv.Cost of
Goods Sold1,000@$5.25 1,000@$5.25
Jan. 3 300@$5.30 200@$5.30100@$5.30
Units 1,200 100
Date Beg. Inv. Purchases End. Inv.Cost of
Goods Sold1,000@$5.25 1,000@$5.25
Jan. 3 300@$5.30 200@$5.30100@$5.30
June 20 150@$5.60 150@$5.60Sept. 15 200@$5.80 200@$5.80Nov. 29 150@$5.90 150@$5.90Units 1,200 600
Costs $6,310 $3,415
Cost of Goods Available for Sale $9,725

8-19
Importance of an Accurate Importance of an Accurate Valuation of InventoryValuation of Inventory
8-20
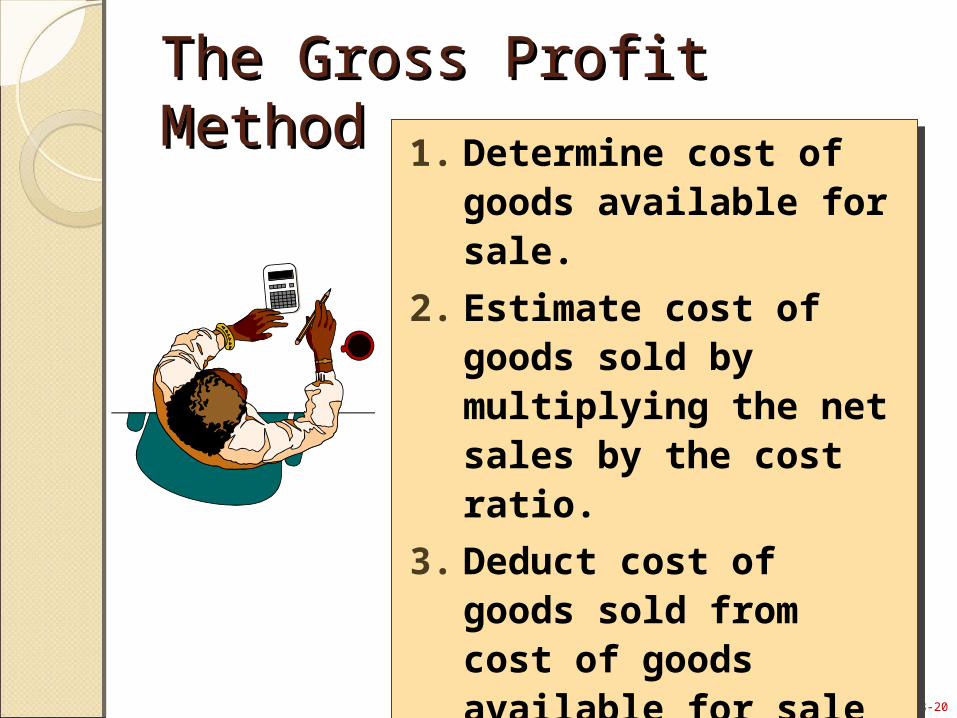
The Gross Profit MethodThe Gross Profit Method1. Determine cost of
goods available for sale.
2. Estimate cost of goods sold by multiplying the net sales by the cost ratio.
3. Deduct cost of goods sold from cost of goods available for sale to determine ending inventory.
1. Determine cost of goods available for sale.
2. Estimate cost of goods sold by multiplying the net sales by the cost ratio.
3. Deduct cost of goods sold from cost of goods available for sale to determine ending inventory.

8-21
Goods Available for Sale: Beginning Inventory 12,000$ Net cost of goods purchased 20,500 Goods available for sale 32,500$ Less estimated cost of goods sold: Sales 31,500$ Less sales returns (1,500) Net sales 30,000$
Estimated cost of goods sold (21,000) Estimated March inventory loss 11,500$
Estimating Inventory The Gross Profit Method
The Gross Profit MethodThe Gross Profit Method
Goods Available for Sale: Beginning Inventory 12,000$ Net cost of goods purchased 20,500 Goods available for sale 32,500$ Less estimated cost of goods sold: Sales 31,500$ Less sales returns (1,500) Net sales 30,000$
Estimated cost of goods sold (21,000) Estimated March inventory loss 11,500$
Estimating Inventory The Gross Profit Method
× 70%× 70%
Step 1
Step 2
Step 3

8-22
The Retail MethodThe Retail Method
a Goods available for sale at cost 32,500$ b Goods available for sale at retail 50,000 c Cost ratio [a b] 65%d Physical count of ending inventory priced at retail 22,000 e Estimated ending inventory at cost [ c d] 14,300$
Estimating Inventory The Retail Method
Matrix would follow the steps below to estimate their ending inventory using the retail method.
Matrix would follow the steps below to estimate their ending inventory using the retail method.

8-23
(Beginning Inventory + Ending Inventory) ÷ 2(Beginning Inventory + Ending Inventory) ÷ 2
Financial AnalysisFinancial AnalysisCost of Goods SoldAverage Inventory
=Inventory Turnover
365Inventory Turnover
Average Days to Sell Inventory
=

8-24
End of Chapter 8End of Chapter 8