Invading and Expanding: Range Dynamics and Ecological ... · Invading and Expanding: Range Dynamics...
12
Invading and Expanding: Range Dynamics and Ecological Consequences of the Greater White-Toothed Shrew (Crocidura russula) Invasion in Ireland Allan D. McDevitt 1 *, W. Ian Montgomery 2,3 , David G. Tosh 3 , John Lusby 4 , Neil Reid 3 , Thomas A. White 5,6 , C. Damien McDevitt 7 , John O’Halloran 8 , Jeremy B. Searle 5 , Jon M. Yearsley 1 1 School of Biology and Environmental Science, University College Dublin, Dublin, Ireland, 2 School of Biological Sciences, Queen’s University Belfast, Belfast, Northern Ireland, 3 Quercus, School of Biological Sciences, Queen’s University Belfast, Belfast, Northern Ireland, 4 Birdwatch Ireland, Kilcoole, Co. Wicklow, Ireland, 5 Department of Ecology and Evolutionary Biology, Cornell University, Ithaca, New York, United States of America, 6 Department of Biology, University of Oulu, Oulu, Finland, 7 Deele College, Raphoe, Co. Donegal, Ireland, 8 School of Biological, Earth and Environmental Sciences, University College Cork, Cork, Ireland Abstract Establishing how invasive species impact upon pre-existing species is a fundamental question in ecology and conservation biology. The greater white-toothed shrew (Crocidura russula) is an invasive species in Ireland that was first recorded in 2007 and which, according to initial data, may be limiting the abundance/distribution of the pygmy shrew (Sorex minutus), previously Ireland’s only shrew species. Because of these concerns, we undertook an intensive live-trapping survey (and used other data from live-trapping, sightings and bird of prey pellets/nest inspections collected between 2006 and 2013) to model the distribution and expansion of C. russula in Ireland and its impacts on Ireland’s small mammal community. The main distribution range of C. russula was found to be approximately 7,600 km 2 in 2013, with established outlier populations suggesting that the species is dispersing with human assistance within the island. The species is expanding rapidly for a small mammal, with a radial expansion rate of 5.5 km/yr overall (2008–2013), and independent estimates from live-trapping in 2012–2013 showing rates of 2.4–14.1 km/yr, 0.5–7.1 km/yr and 0–5.6 km/yr depending on the landscape features present. S. minutus is negatively associated with C. russula. S. minutus is completely absent at sites where C. russula is established and is only present at sites at the edge of and beyond the invasion range of C. russula. The speed of this invasion and the homogenous nature of the Irish landscape may mean that S. minutus has not had sufficient time to adapt to the sudden appearance of C. russula. This may mean the continued decline/disappearance of S. minutus as C. russula spreads throughout the island. Citation: McDevitt AD, Montgomery WI, Tosh DG, Lusby J, Reid N, et al. (2014) Invading and Expanding: Range Dynamics and Ecological Consequences of the Greater White-Toothed Shrew (Crocidura russula) Invasion in Ireland. PLoS ONE 9(6): e100403. doi:10.1371/journal.pone.0100403 Editor: Brock Fenton, University of Western Ontario, Canada Received February 17, 2014; Accepted May 27, 2014; Published June 23, 2014 Copyright: ß 2014 McDevitt et al. This is an open-access article distributed under the terms of the Creative Commons Attribution License, which permits unrestricted use, distribution, and reproduction in any medium, provided the original author and source are credited. Funding: ADM was funded by a Government of Ireland Postdoctoral Fellowship awarded by the Irish Research Council (IRC), and was provided with additional funding by the Heritage Council (HC), a Heredity Fieldwork Grant from the Genetics Society, and the Vincent Wildlife Trust. DGT was supported by the HC. JL was funded by an Embark Scholarship from the IRC; BirdWatch Ireland received funding through The National Parks and Wildlife Services of the Department of Arts, Heritage and the Gaelthacht; The Department of Agriculture, Fisheries and the Marine; the HC; Kerry Co. Council; Cork Co. Council and Galway Co. Council. NR was supported by the Natural Heritage Research Partnership between the Northern Ireland Environment Agency and Quercus, Queen’s University Belfast. The funders had no role in study design, data collection and analysis, decision to publish, or preparation of the manuscript. Competing Interests: The authors have declared that no competing interests exist. * Email: [email protected] Introduction Invasive species can have dramatic and rapid impacts on faunal and floral communities, either through direct competition or through indirect effects such as trophic cascades [1–3]. Establish- ing how invaders impact upon pre-existing species (e.g. potentially driving some to extinction [4]) is a fundamental question in ecology and conservation biology [5], and is vital for the management of biological invasions [6]. The potential impact of competition during invasions can be underestimated if we compare it to competition within communities that are static, since competition is expected to decrease over time as species co- evolve [4,7]. The strength of any competitive effects between invasive and pre-existing species may depend on the community composition of the invaded environment (as well as the environment itself [4,8]), the speed of the invasion, and trade- offs between dispersal, reproduction and competitive ability of the invasive species as it expands its range [9–11]. Interspecific competition between species will be influenced by species traits and features of the local environment [4,8,12]. Shrews are small, ground-dwelling, insectivorous mammals that have been well-studied in terms of competitive interactions. For them, it has been proposed that differences in body size between species can drive the segregation of species into habitats of differing productivity, with larger species being most abundant in more productive habitats [12,13]. Competition between shrew species has primarily been studied in regions where species naturally overlap [12–16]. Competition directly following the establishment of a new species has not been studied, perhaps because there have been few documented cases of shrews being considered as an invasive species [17]. Such a species invasion has PLOS ONE | www.plosone.org 1 June 2014 | Volume 9 | Issue 6 | e100403
Transcript of Invading and Expanding: Range Dynamics and Ecological ... · Invading and Expanding: Range Dynamics...
Invading and Expanding: Range Dynamics and EcologicalConsequences of the Greater White-Toothed Shrew(Crocidura russula) Invasion in IrelandAllan D. McDevitt1*, W. Ian Montgomery2,3, David G. Tosh3, John Lusby4, Neil Reid3, Thomas A. White5,6,
C. Damien McDevitt7, John O’Halloran8, Jeremy B. Searle5, Jon M. Yearsley1
1 School of Biology and Environmental Science, University College Dublin, Dublin, Ireland, 2 School of Biological Sciences, Queen’s University Belfast, Belfast, Northern
Ireland, 3 Quercus, School of Biological Sciences, Queen’s University Belfast, Belfast, Northern Ireland, 4 Birdwatch Ireland, Kilcoole, Co. Wicklow, Ireland, 5 Department of
Ecology and Evolutionary Biology, Cornell University, Ithaca, New York, United States of America, 6 Department of Biology, University of Oulu, Oulu, Finland, 7 Deele
College, Raphoe, Co. Donegal, Ireland, 8 School of Biological, Earth and Environmental Sciences, University College Cork, Cork, Ireland
Abstract
Establishing how invasive species impact upon pre-existing species is a fundamental question in ecology and conservationbiology. The greater white-toothed shrew (Crocidura russula) is an invasive species in Ireland that was first recorded in 2007and which, according to initial data, may be limiting the abundance/distribution of the pygmy shrew (Sorex minutus),previously Ireland’s only shrew species. Because of these concerns, we undertook an intensive live-trapping survey (andused other data from live-trapping, sightings and bird of prey pellets/nest inspections collected between 2006 and 2013) tomodel the distribution and expansion of C. russula in Ireland and its impacts on Ireland’s small mammal community. Themain distribution range of C. russula was found to be approximately 7,600 km2 in 2013, with established outlier populationssuggesting that the species is dispersing with human assistance within the island. The species is expanding rapidly for asmall mammal, with a radial expansion rate of 5.5 km/yr overall (2008–2013), and independent estimates from live-trappingin 2012–2013 showing rates of 2.4–14.1 km/yr, 0.5–7.1 km/yr and 0–5.6 km/yr depending on the landscape featurespresent. S. minutus is negatively associated with C. russula. S. minutus is completely absent at sites where C. russula isestablished and is only present at sites at the edge of and beyond the invasion range of C. russula. The speed of this invasionand the homogenous nature of the Irish landscape may mean that S. minutus has not had sufficient time to adapt to thesudden appearance of C. russula. This may mean the continued decline/disappearance of S. minutus as C. russula spreadsthroughout the island.
Citation: McDevitt AD, Montgomery WI, Tosh DG, Lusby J, Reid N, et al. (2014) Invading and Expanding: Range Dynamics and Ecological Consequences of theGreater White-Toothed Shrew (Crocidura russula) Invasion in Ireland. PLoS ONE 9(6): e100403. doi:10.1371/journal.pone.0100403
Editor: Brock Fenton, University of Western Ontario, Canada
Received February 17, 2014; Accepted May 27, 2014; Published June 23, 2014
Copyright: � 2014 McDevitt et al. This is an open-access article distributed under the terms of the Creative Commons Attribution License, which permitsunrestricted use, distribution, and reproduction in any medium, provided the original author and source are credited.
Funding: ADM was funded by a Government of Ireland Postdoctoral Fellowship awarded by the Irish Research Council (IRC), and was provided with additionalfunding by the Heritage Council (HC), a Heredity Fieldwork Grant from the Genetics Society, and the Vincent Wildlife Trust. DGT was supported by the HC. JL wasfunded by an Embark Scholarship from the IRC; BirdWatch Ireland received funding through The National Parks and Wildlife Services of the Department of Arts,Heritage and the Gaelthacht; The Department of Agriculture, Fisheries and the Marine; the HC; Kerry Co. Council; Cork Co. Council and Galway Co. Council. NR wassupported by the Natural Heritage Research Partnership between the Northern Ireland Environment Agency and Quercus, Queen’s University Belfast. The fundershad no role in study design, data collection and analysis, decision to publish, or preparation of the manuscript.
Competing Interests: The authors have declared that no competing interests exist.
* Email: [email protected]
Introduction
Invasive species can have dramatic and rapid impacts on faunal
and floral communities, either through direct competition or
through indirect effects such as trophic cascades [1–3]. Establish-
ing how invaders impact upon pre-existing species (e.g. potentially
driving some to extinction [4]) is a fundamental question in
ecology and conservation biology [5], and is vital for the
management of biological invasions [6]. The potential impact of
competition during invasions can be underestimated if we
compare it to competition within communities that are static,
since competition is expected to decrease over time as species co-
evolve [4,7]. The strength of any competitive effects between
invasive and pre-existing species may depend on the community
composition of the invaded environment (as well as the
environment itself [4,8]), the speed of the invasion, and trade-
offs between dispersal, reproduction and competitive ability of the
invasive species as it expands its range [9–11].
Interspecific competition between species will be influenced by
species traits and features of the local environment [4,8,12].
Shrews are small, ground-dwelling, insectivorous mammals that
have been well-studied in terms of competitive interactions. For
them, it has been proposed that differences in body size between
species can drive the segregation of species into habitats of
differing productivity, with larger species being most abundant in
more productive habitats [12,13]. Competition between shrew
species has primarily been studied in regions where species
naturally overlap [12–16]. Competition directly following the
establishment of a new species has not been studied, perhaps
because there have been few documented cases of shrews being
considered as an invasive species [17]. Such a species invasion has
PLOS ONE | www.plosone.org 1 June 2014 | Volume 9 | Issue 6 | e100403
occurred on the island of Ireland with the recent arrival of the
greater white-toothed shrew (Crocidura russula).
C. russula was discovered in Ireland from pellets of barn owls
(Tyto alba) and kestrels (Falco tinnunculus) collected in 2007, with
later confirmation by live-trapping in 2008 [18]. C. russula is
distributed in northern Africa and western Europe, and was
previously absent from the British Isles [19,20]. The pygmy shrew
(Sorex minutus) is present throughout the British Isles (and
distributed widely in Europe) and was notably the only shrew
species present on Ireland until the arrival of C. russula. The
human-mediated introduction of S. minutus to Ireland dates back to
the Neolithic period [21,22]. C. russula is approximately three times
the size of S. minutus, is gregarious (as opposed to the highly
territorial and relatively solitary lifestyle of S. minutus), and has
smaller home range sizes than S. minutus [16,20,23]. At first, it was
proposed that the introduction of C. russula could prove beneficial
to the Irish ecosystem as a prey item for birds of prey [18].
However, trapping conducted on sites within the Irish range of C.
russula in winter 2010/2011, found that no S. minutus were present
at these sites [24]. These two species are sympatric in western
Europe [19], with S. minutus generally being uncommon where
they occur together (representing 0.7–2.9% of small mammal
catches in various habitats in France for example [25–27]) but may
be locally more numerous, in particular on the island of Belle Ile
off the coast of northern France ([27] Fig. S1). This suggests that
the interaction between the two species in Ireland may be different
from mainland Europe and the islands where both species have
been long-established. This highlights the difficulty in predicting
the outcome of species’ interactions arising from species’
introductions [4].
An accurate assessment of its current distribution and the rate at
which C. russula is spreading are needed due the potential negative
impact of the species. The range expansion of another invasive
small mammal in Ireland, the bank vole (Myodes glareolus), which
arrived in the early 1900s, has been the subject of a number of
studies [28–31] but similar analysis is lacking for C. russula.
Previously published data estimated the range of C. russula to be
approximately 2,300 km2 in the winter of 2010/2011 [24] but this
was a minimum estimate and not the primary focus of the study in
question. The length of time that the invasive shrew has been
present in Ireland and the rate at which it is expanding its range is
pivotal for our understanding of how community dynamics will
change in Ireland’s small mammal communities.
If C. russula is having a negative impact on S. minutus in Ireland,
data from localities where the two species are still occurring
together in Ireland are crucial for understanding any replacement
processes. Such data have been lacking previously [24]. Similarly,
distributions and abundances of all species already present in the
invaded community may be important in predicting the individual
and cumulative impact of the invasive species. Montgomery et al.
[24] reported that there was a combined impact of C. russula and
M. glareolus upon S. minutus and another small mammal, the
woodmouse (Apodemus sylvaticus) in Ireland. Like S. minutus, A.
sylvaticus is probably another early human-mediated introduction
to Ireland, first appearing in the Mesolithic [32]. This combined
impact of C. russula and M. glareolus conformed to the concept of
‘invasional meltdown’ [33], where the presence of one invading
species facilitates another and compounds the negative impacts on
pre-existing species, communities and ecosystems. Therefore, in
order to assess the impact of the recently invading species (C.
russula and M. glareolus) on the pre-existing species (S. minutus and A.
sylvaticus), it is necessary to tease out the influence of each species
(as well as the effects of their interactions) on each other and the
influence of the surrounding environment [13,24]. The species
considered here overlap in their diet [24], and there is
considerable overlap in habitats throughout their European ranges
although there is variation from place to place, e.g. S. minutus is
absent from forests in a multi-shrew community in France [25] but
is abundant in forests in Ireland [27,34]. Therefore, the arrival of a
new competitor could potentially alter the habitat preferences of
the existing species [4].
The objective of the research we report here is to assess the
immediate impact of C. russula, and to predict the rate at which
these impacts will spread across the island of Ireland. More
precisely, we have two aims. The first aim is to establish the
current distribution of C. russula in Ireland and to estimate the rate
of range expansion. The second aim is to assess the impact of C.
russula on the small mammal community in Ireland by establishing
single species and interaction associations, as well as the potential
influence of habitat on each species.
Materials and Methods
Ethics StatementAll species were live-trapped with approval from the National
Parks and Wildlife Service (NPWS) in Ireland and Animal
Research Ethics Committee in University College Dublin
(AREC-13-24). C. russula were euthanized by cervical dislocation
in accordance with instructions given by the NPWS of a species
not ‘ordinarily resident in the State’. S. minutus is a protected
species in the Republic of Ireland and was trapped according to a
license issued by the NPWS (License no. C157/2011).
Distribution, abundance and rate of expansion of C.russula
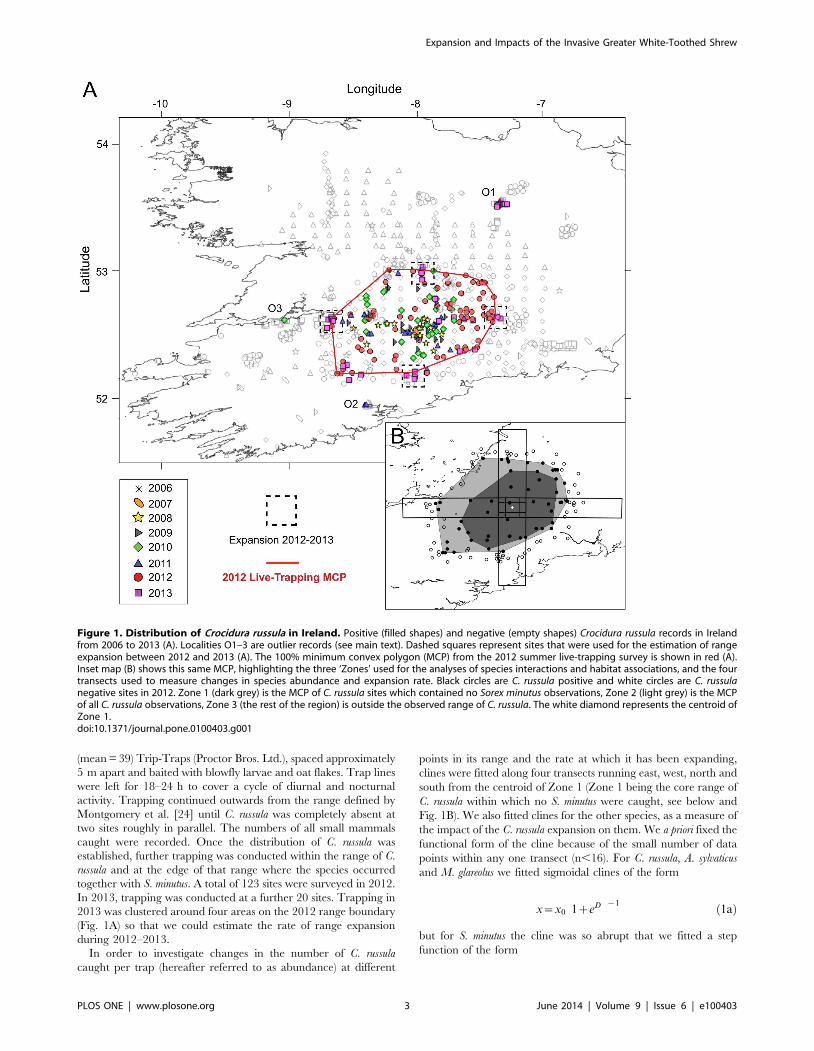
All available sighting and live-trap data on C. russula (with
associated dates) were collated for 2006–2013 (Figs 1A and S2;
Table S1) based on records from the National Biodiversity Data
Centre in Ireland (www.biodiversity.ie) and small mammal
trapping studies in the region [18,24,30,31]. In addition, data on
prey identification from barn owl and kestrel pellets and
identification of prey remains from nest inspections were also
included [35–37]. Both predators are known to feed on the range
of small mammal species present in Ireland (including C. russula
[18]). They are central-place foragers which after a period of post-
fledging dispersal are largely sedentary within a relatively small
home range and show a high level of fidelity to specific nest and
roost sites within that range [38–40]. Available data on C. russula
from the scats of pine martens (Martes martes) were not included
because the exact sampling dates were not known [41]. We used
all available data to provide an initial estimate of the expansion
rate for C. russula (km/yr). We partitioned the data by date, making
sure that data from one survey were not split between subsets (date
bins were 2008, 2009, Jan-Sept 2010, Oct 2010–Feb 2011, Mar
2011–Mar 2012, Apr 2012–Dec 2012, 2013). For each subset we
calculated the area, A, of the minimum convex polygon (MCP) for
C. russula and fitted a linear regression of the radial range of the
species distribution (km) against the median date (yr) of the data
points in each subset. Our resulting estimate of the radial
expansion rate is the slope of this regression line.
A more focused study established the distribution of C. russula in
the summer of 2012 and its expansion after one year (2013; Table
S2). Trapping started on or adjacent to the boundary of the range
defined by Montgomery et al. [24] and was conducted during May
31–September 2, 2012, and June 19–24, 2013. Trap lines were set
in each 10 km square (standard Irish grid hectads) in hedgerows
adjacent to agricultural land (the most prevalent small mammal
habitat available in Ireland [24]). Trap lines consisted of 26–112
Expansion and Impacts of the Invasive Greater White-Toothed Shrew
PLOS ONE | www.plosone.org 2 June 2014 | Volume 9 | Issue 6 | e100403
(mean = 39) Trip-Traps (Proctor Bros. Ltd.), spaced approximately
5 m apart and baited with blowfly larvae and oat flakes. Trap lines
were left for 18–24 h to cover a cycle of diurnal and nocturnal
activity. Trapping continued outwards from the range defined by
Montgomery et al. [24] until C. russula was completely absent at
two sites roughly in parallel. The numbers of all small mammals
caught were recorded. Once the distribution of C. russula was
established, further trapping was conducted within the range of C.
russula and at the edge of that range where the species occurred
together with S. minutus. A total of 123 sites were surveyed in 2012.
In 2013, trapping was conducted at a further 20 sites. Trapping in
2013 was clustered around four areas on the 2012 range boundary
(Fig. 1A) so that we could estimate the rate of range expansion
during 2012–2013.
In order to investigate changes in the number of C. russula
caught per trap (hereafter referred to as abundance) at different
points in its range and the rate at which it has been expanding,
clines were fitted along four transects running east, west, north and
south from the centroid of Zone 1 (Zone 1 being the core range of
C. russula within which no S. minutus were caught, see below and
Fig. 1B). We also fitted clines for the other species, as a measure of
the impact of the C. russula expansion on them. We a priori fixed the
functional form of the cline because of the small number of data
points within any one transect (n,16). For C. russula, A. sylvaticus
and M. glareolus we fitted sigmoidal clines of the form
x~x0 1zeD� �{1 ð1aÞ
but for S. minutus the cline was so abrupt that we fitted a step
function of the form
Figure 1. Distribution of Crocidura russula in Ireland. Positive (filled shapes) and negative (empty shapes) Crocidura russula records in Irelandfrom 2006 to 2013 (A). Localities O1–3 are outlier records (see main text). Dashed squares represent sites that were used for the estimation of rangeexpansion between 2012 and 2013 (A). The 100% minimum convex polygon (MCP) from the 2012 summer live-trapping survey is shown in red (A).Inset map (B) shows this same MCP, highlighting the three ‘Zones’ used for the analyses of species interactions and habitat associations, and the fourtransects used to measure changes in species abundance and expansion rate. Black circles are C. russula positive and white circles are C. russulanegative sites in 2012. Zone 1 (dark grey) is the MCP of C. russula sites which contained no Sorex minutus observations, Zone 2 (light grey) is the MCPof all C. russula observations, Zone 3 (the rest of the region) is outside the observed range of C. russula. The white diamond represents the centroid ofZone 1.doi:10.1371/journal.pone.0100403.g001
Expansion and Impacts of the Invasive Greater White-Toothed Shrew
PLOS ONE | www.plosone.org 3 June 2014 | Volume 9 | Issue 6 | e100403
x~x0H d{d1=2
� �ð1bÞ
where
D~½dd1=2{nDt�=s ð2Þ
and H(x) is the Heaviside step function, x0 is the asymptotic
number of individuals per trap far from the cline, d is the distance
(km) of a point from the centroid of Zone 1, d1/2 is the value of d at
which x = x0/2 in the year 2012, v is the velocity at which the cline
is moving (km/yr), s is the width of the cline (km) and Dt is the
time since 2012 (yr). The functions (1a) and (1b) were fitted using
non-linear least squares to the 2012 and 2013 data (Method 1 in
Table 1 for estimating velocity, v). For C. russula we estimated the
time taken to disperse from d = 0 to the point in 2012 when C.
russula abundance was 0.1 x0. This was done using the point
estimates and standard errors for d1/2, s and v, to generate 1000
Monte Carlo realizations for this invasion time from which the
distribution of invasion times was estimated.
The estimates of velocity from the clines (equations 1 and 2)
assume a shape for the cline and that this shape does not change
between years. We used generalized additive models (Method 2 in
Table 1) to test if our estimates of velocity were robust to the shape
of the cline at the invasion front. Using data points that were at
least 25 km from the centroid of Zone 1 (in order to focus upon the
invasion front) we fitted thin plate regression splines to the shape of
the invasion front. The shape of the fitted cline is therefore driven
by the data. The velocity of the cline was then estimated from the
shift in the cline’s position from 2012 to 2013, assuming that the
shape of the cline does not change (see File S1). Finally, we used a
third method (Method 3 in Table 1) to give point estimates of the
rate of spread of C. russula that did not rely upon fitting a cline to
the data. This method found the C. russula observations along each
transect that were furthest from the centroid in 2012 and 2013.
The difference in distance between 2012 and 2013 was used as a
point estimate for the rate of expansion.
Habitat associations and species interactionsTo investigate the effect of land-use and species-interactions on
small mammal abundances, we defined three spatial regions based
upon the distributions of C. russula and S. minutus from 2012
(Fig. 1B). The first region (called Zone 1) contained all sites where
C. russula were caught and whose MCP contained no S. minutus
captures (30 sites). The second region (called Zone 2) contained all
sites that were not in Zone 1 but were within the MCP of C. russula
captures (40 sites). Finally, Zone 3 contained all sites not in Zone 1
or Zone 2 (53 sites, by definition there were no C. russula captures
in Zone 3). The land cover for our sampling region was extracted
from the Corine Land Cover 2006 seamless vector data set
(Version 16 (04/2012)) http://www.eea.europa.eu/data-and-
maps/data/clc-2006-vector-data-version-2. We defined four ag-
gregate land cover classes as broad proxies for variation in small
mammal habitat and which were the dominant land covers
around our sampling locations: forest (broad-leaved, coniferous
and mixed woodland; Corine codes 311, 312 and 313), arable
(Corine codes 211, 242 and 243), pasture (Corine code 231),
natural grassland (Corine codes 321, 322, 324). We then
calculated the proportion of each land-cover class in two circular
rings (buffers) around each sampling location (within a 500 m
radius and from 500 m to 2000 m in radius). These spatial scales
were chosen to reflect the home range sizes and average dispersal
distances in C. russula (within 500 m [20,23,42], up to the
maximum dispersal distance recorded for the species (1.3 km
[42]). Therefore, shrews within a single generation could sample a
range of habitats within these spatial scales. All spatial data were
manipulated using the sp, rgdal, and rgeos packages in R.
Correlations between land covers where avoided by using only
forest, grass and arable land cover classes (because pasture
represented between 72% to 76% of land cover at each spatial
scale and was negatively correlated with the sum of forest, grass
and arable land covers).
We built spatial models for the abundances of each small
mammal species at each sampling location within the range of a
species (Table S2; Fig. 1B). The models for C. russula and S. minutus
are therefore based upon different datasets with different spatial
extents (Zones 1 and 2 for C. russula and Zones 2 and 3 for S.
minutus). All models were fitted by maximum likelihood using
generalised least squares (using the nlme package in R) with an
exponential spatial error structure. The response variable was
square-root transformed to compensate for over-dispersion. We
defined a maximal model for each species (File S1; Table S4) and
performed model averaging [43] across all combinations of
explanatory variables (Table S3; all continuous explanatory
variables were scaled to have a mean of zero and unit variance).
Models always contained three control variables: the number of
traps (NumTrap), the phase of the moon (Lunar) and a categorical
factor for whether or not it had rained during the trapping session
(Rain) as these variables have been previously demonstrated to
influence the trapping success of small mammals [24,44,45]. The
model with the lowest AICc was selected as the ‘best approxi-
mating’ model and all models with a DAICc,2 from the ‘best
approximating’ model were selected for model averaging (Tables
S5–S12). The Akaike weight of each model was calculated, and
normalised so that the weight of all selected models summed to
one. The fitted coefficients for the explanatory variables were then
averaged across the selected models. The uncertainty in an
averaged coefficient was estimated by the unconditional variance
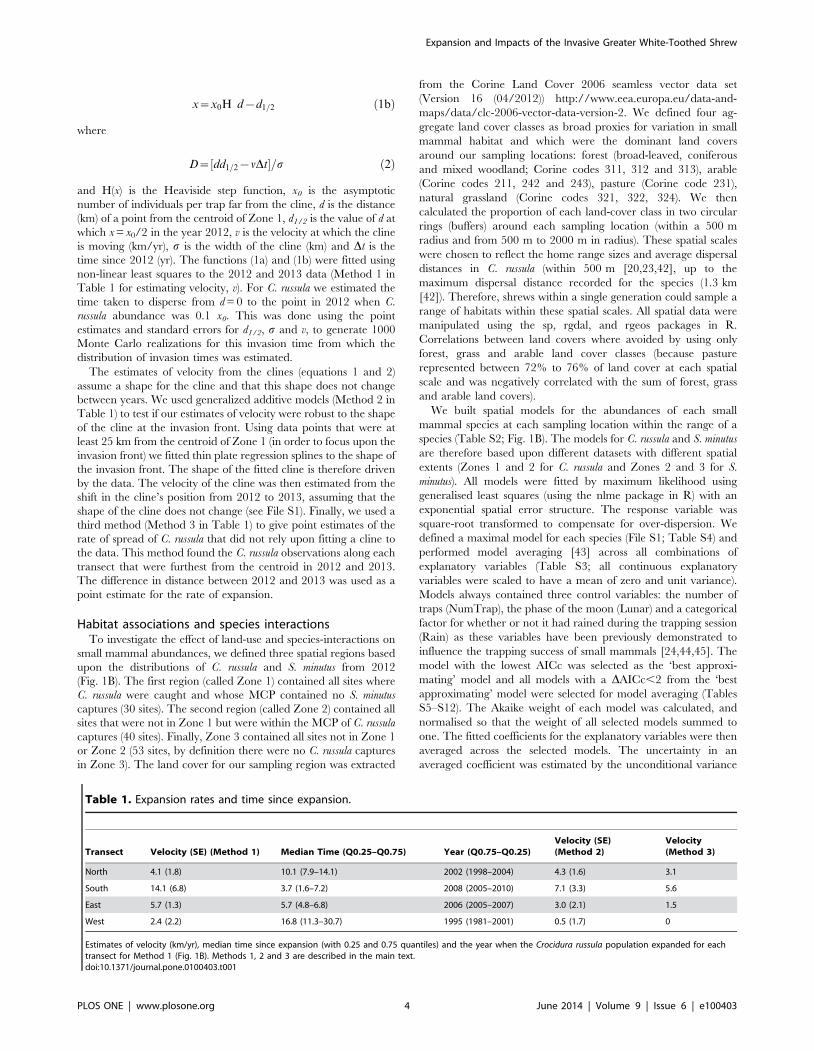
Table 1. Expansion rates and time since expansion.
Transect Velocity (SE) (Method 1) Median Time (Q0.25–Q0.75) Year (Q0.75–Q0.25)Velocity (SE)(Method 2)
Velocity(Method 3)
North 4.1 (1.8) 10.1 (7.9–14.1) 2002 (1998–2004) 4.3 (1.6) 3.1
South 14.1 (6.8) 3.7 (1.6–7.2) 2008 (2005–2010) 7.1 (3.3) 5.6
East 5.7 (1.3) 5.7 (4.8–6.8) 2006 (2005–2007) 3.0 (2.1) 1.5
West 2.4 (2.2) 16.8 (11.3–30.7) 1995 (1981–2001) 0.5 (1.7) 0
Estimates of velocity (km/yr), median time since expansion (with 0.25 and 0.75 quantiles) and the year when the Crocidura russula population expanded for eachtransect for Method 1 (Fig. 1B). Methods 1, 2 and 3 are described in the main text.doi:10.1371/journal.pone.0100403.t001
Expansion and Impacts of the Invasive Greater White-Toothed Shrew
PLOS ONE | www.plosone.org 4 June 2014 | Volume 9 | Issue 6 | e100403
estimator. The overall relative importance of each explanatory
variable was quantified by summing the Akaike weights (Svi) of
selected models in which an explanatory variable occurred (w+).
Results
Distribution and expansionC. russula was detected at 231 localities (181 via captures/
sightings/dead specimens and 50 through recorded presence in
bird of prey pellets/nest inspections at individual sites) between
2007 and 2013 (only a single record from 2007 and the species was
not recorded in 2006; Fig. 1A). The area of the main distribution
range was estimated to be approximately 7,600 km2 as of
November 2013, an increase of over 300% from the estimate in
2010/2011 [24]. The edge of this range (Zone 2) was identified by
a lower abundance of C. russula and by the abrupt presence of S.
minutus (Fig. 2). The two shrew species occurred together in 25 sites
within Zone 2 (S. minutus was completely absent within Zone 1).
Four of these sites were revisited in 2013 and S. minutus was only
found in two of the four sites. M. glareolus abundance was higher in
the presence of C. russula in three of the four transects examined
(Fig. 2; Table S13). No differences were observed in A. sylvaticus
abundance in relation to the range of C. russula (data not shown).
Furthermore, C. russula records were found outside Zones 1 and 2,
with two of these (‘O1’ and ‘O2’; Fig. 1A) being confirmed as
established, geographically isolated populations. The species was
observed on a single occasion in ‘O3’ in 2010 (S. Perkins, pers.
comm.) but was not recorded in the area again in subsequent years
despite substantial trapping efforts (Fig. 1A).
Using all the available data collected from 2008–2013 (Fig. 1A)
gave an estimate for the radial rate of expansion at 5.5 km/yr
(60.8 km/yr) and an expansion estimated to date from 2004 (Fig.
S3). Using only the summer trapping data from 2012 and 2013, an
increase in range was observed in three out of the four transects
(no increase was observed in the West transect; Fig. 3, Table 1).
The increase was greatest in the South transect (Fig. 3, Table 1).
The estimated velocity of the range expansion and times since
expansion differed across the four transects (Table 1). The North,
East and West transects had point estimates of range expansions
from Method 1 of 2.4–5.7 km/yr (Table 1). For Method 1 the
point estimate of the range expansion for the South transect was
14 km/yr, but with a large uncertainty (S.E. = 7 km/yr). This
obviously led to different estimates for the time since the range
began to expand, ranging from 4 years (inter-quartile range of 2–7
years) for the South transect, to 17 years (inter-quartile range of
11–31 years) for the West transect from 2012 (Table 1).
Considering the upper and lower quartiles for time since
expansion, the expansion could have begun between 1981 and
2010 (depending on the transect; Table 1). Method 2 gave point
estimates for range expansion rates in the range 0.5–7.1 km/yr
(Table 1; Figs. S4–S7). The one standard error intervals of all these
estimates overlap with those from Method 1. Method 3 gave single
point estimates of range expansion between 2012 and 2013 in the
range 0–5.6 km/yr (Table 1).
Species and Habitat AssociationsA total of 653 C. russula, 258 S. minutus, 381 M. glareolus and 142
A. sylvaticus individuals were recorded during the 2012 summer
survey. C. russula was recorded at 63 sites out of 123 (51%), S.
minutus at 81 (66%), M. glareolus at 99 (80%) and A. sylvaticus at 64
(52%). Correlations between captures of S. minutus and the other
species caught within a site showed no evidence that our trapping
methodology was biasing our abundance estimates. In sites where
both S. minutus and C. russula were caught, there was no significant
negative correlation between the trapping probability of C. russula
and S. minutus (r = 20.2, df = 24, p = 0.3). There was also no
significant correlation between the trapping probability of S.
minutus and any other small mammal (r = 20.003, df = 24,
p = 0.99).
Model averaging the spatial models showed that C. russula
abundance was associated positively with A. sylvaticus abundance
but showed no association with the other species (Fig. 4; Table S5).
C. russula was negatively associated with arable land at the 2 km
scale in Zone 1 but this association was lost in Zone 2. The species
was positively associated with forest at the 500 m scale in Zone 1
but the species was negatively associated with the same habitat at
the same scale in Zone 2. The abundance of S. minutus was
negatively associated with C. russula and positively associated with
A. sylvaticus (Fig. 4; Table S6). The interaction of M. glareolus and A.
sylvaticus had a weak positive association with S. minutus and the
interaction of C. russula and M. glareolus had a weak negative
association. A weak negative association with natural grassland
was also found. M. glareolus abundance was greater in Zone 1 than
either Zone 2 and 3 (Fig. 4; Table S7). M. glareolus was positively
associated with A. sylvaticus and negatively associated with forest in
Zone 1 at the 500 m scale but this association with forest was lost
within Zones 2 and 3. A. sylvaticus showed no relationships with the
Zones and had the strongest associations with the other species
(and their interactions; Fig. 4; Table S8). It was positively
associated with M. glareolus but this positive association is reduced
in the presence of either C. russula or S. minutus (negative
interactions between shrew species and M. glareolus).
Discussion
C. russula is undergoing a rapid range expansion in Ireland.
Utilizing data from multiple sources spanning between 2006 and
2013 (Fig. S2) has revealed that the species occupies a large area,
considering that it was only being discovered in bird of prey pellets
collected in 2007 (Fig. 1A). Given the size of its current range
(,7,600 km2), the species was likely present in Ireland prior to
2007 [18,24,41]. It is unclear when exactly the species was
introduced to Ireland as small mammal trapping in the vicinity of
the current range failed to detect the species in the late 1990s and
early 2000s [21,28] but analyses of pine marten (Martes martes) diet
from samples taken on unspecified dates between 2005 and 2007
did demonstrate that the species was present in several localities
[41].
Estimating the rate of expansion from all data gives a value of
5.560.8 km/yr, and points to the expansion beginning around
2004 (Fig. S3). Because this rate of expansion is at the upper end of
expectations for the species and was based on different detection
methods (direct trapping, sightings and bird of prey diet; Fig. S2)
and at different times of year, we independently tested this further
in 2013 at four areas where the edge of the range was well
established in 2012 (Fig. 1A). This edge is indicated by a lower
abundance (the number of individuals caught per trap) of C. russula
and the occurrence of S. minutus (Fig. 2). Method 1 gave velocity
point estimates of 2.4–14 km/yr, while Methods 2 and 3 gave
estimates of 0.5–7.1 km/yr and 0–5.6 km/yr, respectively
(Table 1). The variability we documented in velocity between
transects is likely due to the effects of landscape features on C.
russula dispersal ability [30]. The estimate from the West transect
was lower due to the fact that the species had not expanded
between 2012 and 2013 (Table 1; Fig. 3), likely due to the presence
of a significant river barrier in the landscape (without a nearby
bridge). Similarly, the largest estimate of 1467 km/yr (5.6 km/yr
using Method 2) was in the South transect and was also likely due
Expansion and Impacts of the Invasive Greater White-Toothed Shrew
PLOS ONE | www.plosone.org 5 June 2014 | Volume 9 | Issue 6 | e100403
to a barrier effect, but in a different way. C. russula was present in
large numbers at the edge of its range along the South transect in
2012 (having the highest abundance at an edge site of the four
transects; Figs. 2 and 3), having encountered a significant barrier
in the form of a bisected mountainous landscape, a town, a
national road, and the Blackwater River in particular. By 2013,
the species had crossed this river (a bridge was present in this
instance) and had spread further than the other three transects.
This build up of individuals has likely led to more individuals
dispersing in search of new territories, leading to a higher rate of
successful colonization and establishment. The estimate of
1467 km/yr is likely a reflection of assuming a fixed shape of
the cline between 2012 and 2013, rather than a true reflection of
the upper limit of the expansion rate for C. russula. The point
estimate from Methods 2 and 3 of 7.1 and 5.6 km/yr may be more
indicative of the expansion rate in this case (although Method 3 is
susceptible to bias from outliers because it is based on the
maximum from a sample). Nevertheless, the expansion rate across
all years (5.560.8 km/yr), and the expansion rates in 2012 for the
North, West and East transects (2.4–5.7 km/yr for Method 1, 0.5–
4.3 km/yr for Method 2 and 0–3.1 km/yr for Method 3) provide
independent verification that C. russula is expanding its invasive
range at a rapid rate.
These rates of expansion are generally faster than that of M.
glareolus in Ireland, which was estimated to be spreading at a rate of
2.23–2.63 km/yr after being introduced in the early 1900s [30]. C.
russula is considered to be a species with limited dispersal from
natal sites [46,47] and indirect estimates of dispersal distances for
C. russula based on habitat-quality modelling have suggested
average distances of 800 m per generation [48]. Direct estimates
of dispersal distances during a single breeding session within the
breeding season (over a period of 2–3 months) via mark-recapture
and parentage assignments were 350 m and 170 m for females
and males, respectively (dispersal is sex-biased towards females in
the species at the breeding group level [47]), but were as high as
1.3 km for males [42]. However, dispersal in a saturated setting in
the centre of a species distribution would not be equivalent to
dispersal into unoccupied habitat at the edge of an expanding
range. Long-distance dispersal events could become more
important in establishing new populations for the latter [49,50].
Thus, individuals may be expected to invest more in traits
associated with dispersal at the range front [9,51,52] and rapid
evolution of dispersal traits may lead to a manifold increase in
distance/range spread [10]. For example, high estimates of rates of
expansions have been observed in the invasive cane toad (Bufo
marinus) in Australia [51]. Earlier estimates of this expansion
(1940s–1960s) were approximately 10 km/yr but this was
estimated to be 55 km/yr in recent years [51]. This has been
corroborated by radio-tracking studies revealing movements up to
21.8 km in a 30-day period [53]. Cane toads at the invasion front
have longer hind limbs than those in longer established
populations nearer the point of introduction [51] and the rapid
expansion has been attributed to the increase in dispersal ability
[52]. This has been demonstrated in small mammals colonizing
islands previously, but over longer time scales (,1,000 years; [54]).
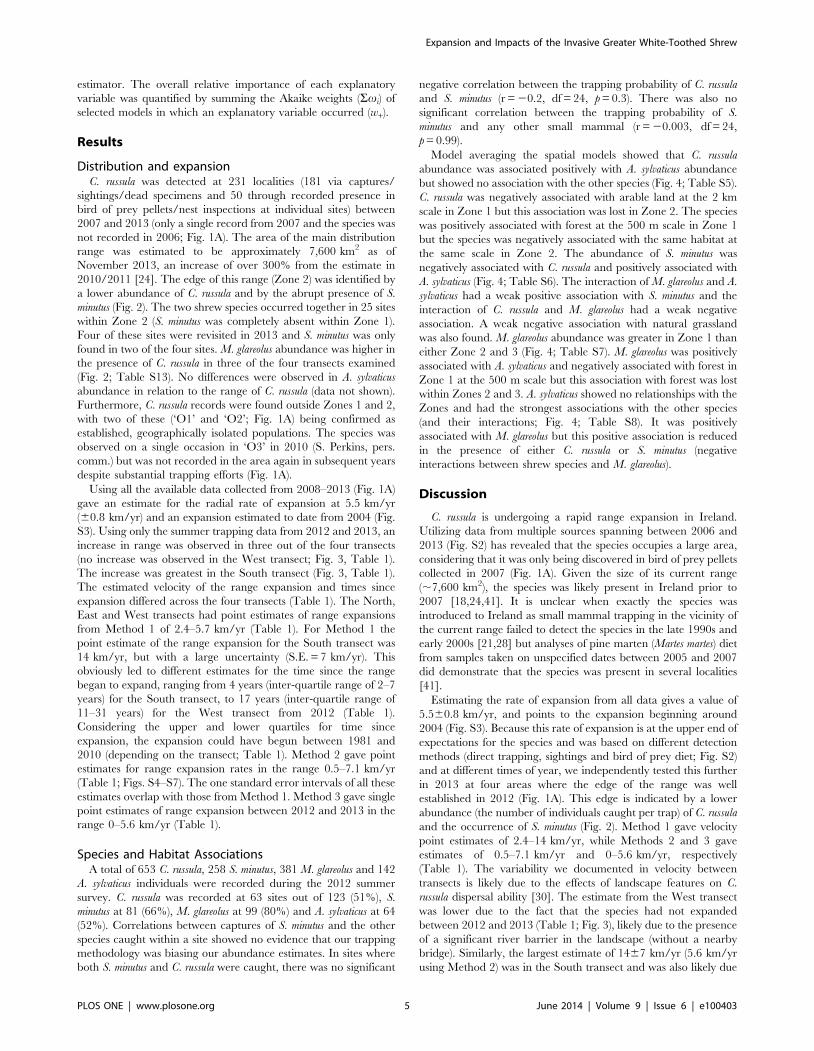
Figure 2. Small mammal species clines in relation to the range of Crocidura russula. Species clines for Crocidura russula (blue), Sorex minutus(red) and Myodes glareolus (green) using the 2012 trapping data along the four transects from the centroid (Fig. 1B). The trapping data for the threespecies are shown as coloured points. Data are from 10, 13, 15 and 12 sampling locations for the North, South, East and West transects, respectively.doi:10.1371/journal.pone.0100403.g002
Expansion and Impacts of the Invasive Greater White-Toothed Shrew
PLOS ONE | www.plosone.org 6 June 2014 | Volume 9 | Issue 6 | e100403
Changing life-history traits such as reproductive strategies may
also be important at a range front [9,10]. C. russula can produce up
to four litters in the wild from March–September [55], with litter
sizes from 2–11 [20]. It is only the first of these litters that generally
disperses away from the natal site in the first year [46]. They can
reach sexual maturity at 58–71 days (in captivity [20]) and it is
only those born early in the breeding season that are considered
capable of reproducing in their first year [51]. As is the case for
dispersal related traits [51,52], reproductive strategies may be
altered in newly colonised, empty habitats where intraspecific
competition is less intensive [31,56]. It is possible that individuals
could be reaching sexual maturity earlier, and subsequent litters of
C. russula (other than the first only) could be dispersing away from
natal sites and reproducing at the range edge, leading to increased
population growth and subsequent expansion [9,56]. The C.
russula invasion warrants further investigation to determine if
increased dispersal ability and shifting reproductive strategies are
occurring over these fine temporal and spatial scales and are
leading to the rapid expansion of the species in Ireland.
Human-assisted dispersal may also be involved. C. russula is
appearing well outside its main invasive range in Ireland (Zones 1
and 2), with at least two established, discrete outlier populations
(‘O1’ and ‘O2’; Fig. 1A). It is possible that these are independent
introductions into Ireland but, given their restricted ranges and
their more recent discoveries (Fig. 1A), it is much more likely that
these are ‘jumps’ occurring within Ireland. As in continental
Europe, the species reaches very high densities in the summer [20]
and can occupy human dwellings and farm buildings in large
numbers [15] within its invasive range in Ireland (AD McDevitt,
pers comm.). This may give the false impression that the species is
rapidly expanding its range entirely through its own dispersal
when it may in fact be assisted, and may explain why it is
expanding faster than M. glareolus, a species not associated with
humans. The possible mechanism of human-mediated dispersal in
C. russula is uncertain at present but it could be associated with the
transport of livestock and/or horticultural produce.
This rapid range expansion of C. russula is a serious concern for
its potential impacts on the small mammal community in Ireland.
In general, habitat associations at a broad scale were not as
important as species interactions in determining the abundances of
the small mammal species in and around the range of the invasive
shrew (Fig. 4). Indeed, the habitat results provide somewhat
contradictory messages. C. russula showed a negative association
with arable land in Zone 1 but this association decreased moving
into Zone 2 where it occurs together with S. minutus (Fig. 4). This
difference can perhaps be explained by colonizing individuals
being less selective as they move into new areas, whereas this
habitat is avoided where C. russula is established. C. russula also
displayed a positive association with forests in Zone 1 but this was
negative within Zone 2 (these associations were weak however).
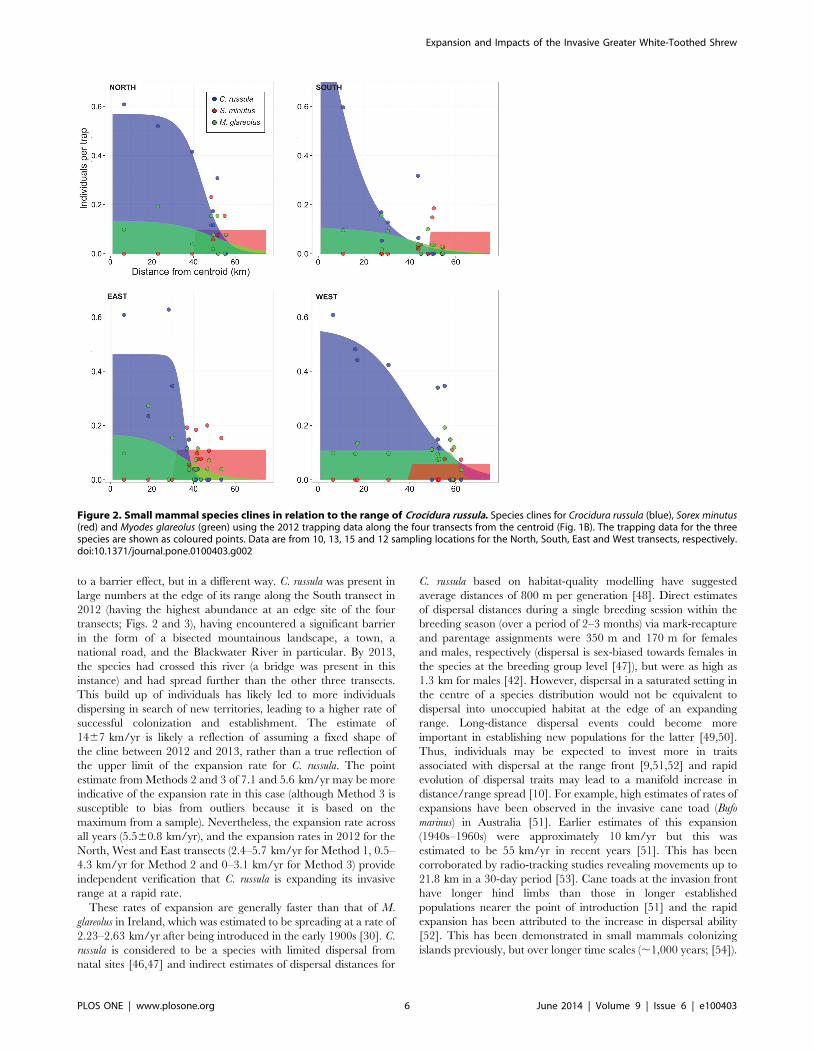
Figure 3. Expansion of the range of Crocidura russula 2012–2013. Crocidura russula clines for 2012 (blue) and 2013 (red) trapping data (Fig. 1A)along the four transects from the centroid (Fig. 1B). The trapping data for the two years are shown as points. For the north, south, east and westtransects There are 15, 18, 19 and 15 data points, and R2 values between predicted and observed abundances are 0.85, 0.73, 0.83 and 0.72,respectively.doi:10.1371/journal.pone.0100403.g003
Expansion and Impacts of the Invasive Greater White-Toothed Shrew
PLOS ONE | www.plosone.org 7 June 2014 | Volume 9 | Issue 6 | e100403
Montgomery et al. [24] reported a strong negative association with
forests in Ireland but the species is known to be common in this
habitat in parts of continental Europe [20]. For S. minutus, species
interactions dominated any additional effect of habitat (Fig. 4).
Again, Montgomery et al. [24] showed a strong negative
association with coniferous forest and arable land for S. minutus,
although other data show that the species is generally common in
forests (both deciduous and coniferous) in Ireland [27,34]. M.
glareolus showed a negative association with forests within Zone 1
but this was lost in Zones 2 and 3 (Fig. 4). Certainly M. glareolus is
common in forests in its natural range [57]. Finally, our study
found that A. sylvaticus showed a positive association with natural
grassland in the best-approximating model and a weak positive
association with forests (Fig. 4). Given the dominance of pasture on
the Irish landscape (see Methods; [24]), it is perhaps not surprising
that it is difficult to distinguish between the remaining habitat
types as determinants of small mammal species abundances.
Forests cover ,10% of the landscape in Ireland [58] and peatland
is more prevalent in the west (outside the current range of C.
russula). S. minutus are certainly abundant on peatland in Ireland
[27,59] but peatland was not included here because it was a rare
habitat within the studied area. Nevertheless, future research could
directly investigate the possible importance of these different
habitats and if they might act as refugia for S. minutus (and A.
sylvaticus) in Ireland.
The association between invasive and pre-existing species
abundances can be particularly revealing in assessing the impacts
of the former [24,60]. C. russula abundance was positively
associated with that of A. sylvaticus, as was S. minutus (Fig. 4). This
could be due to shrews being generally reliant on the pre-existing
underground runs and burrows of rodents [20,61]. S. minutus
abundance was negatively associated with C. russula where they
were present together and S. minutus was completely absent at all
sites except for those on the edge of the invasive range (Fig. 2). The
abrupt appearance of S. minutus at the edge of the range of C.
russula range suggests that the replacement of the species is rapid.
Indeed, S. minutus was already absent at two of the four edge sites
from 2012 that were revisited in 2013. It is important to note that
while trapping effort was accounted for in the analysis (NumTraps;
Fig. 4), the detection probability in occupancy rates was not
because the vast majority of sites were visited only once [62]. It is
therefore possible that S. minutus was not detected when present.
However, Montgomery et al. [24] also noted the absence of S.
minutus at sites where C. russula was present in 2010/2011. In
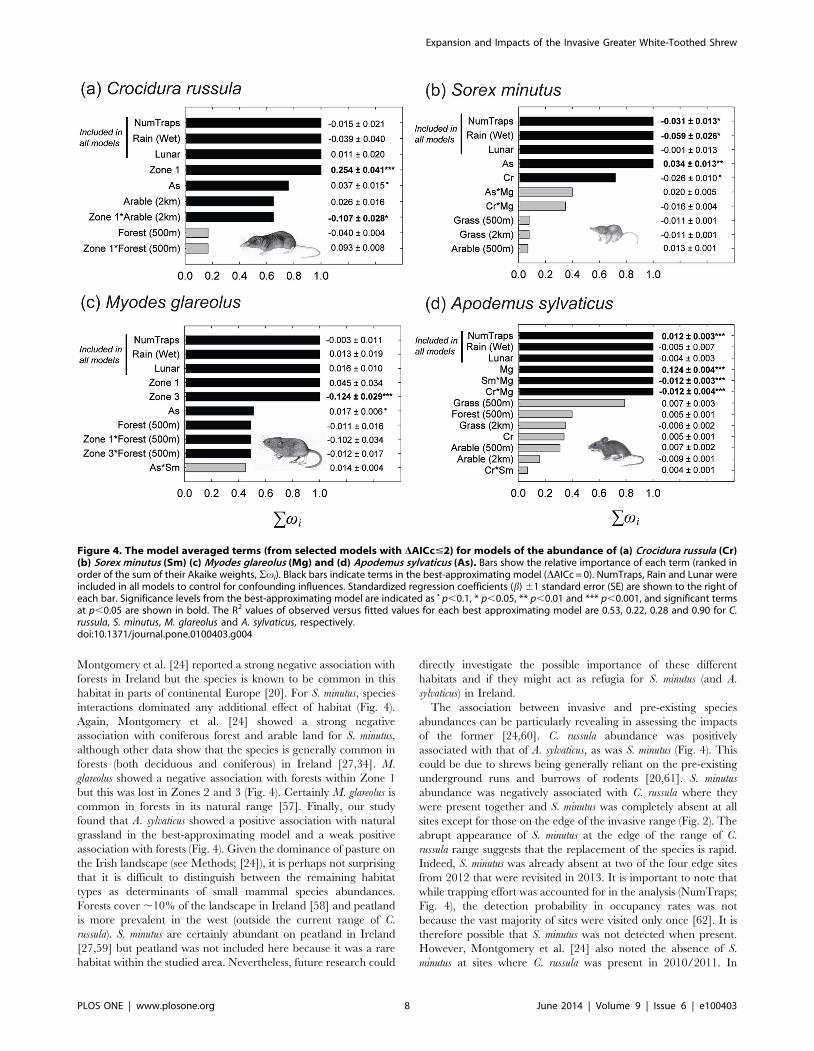
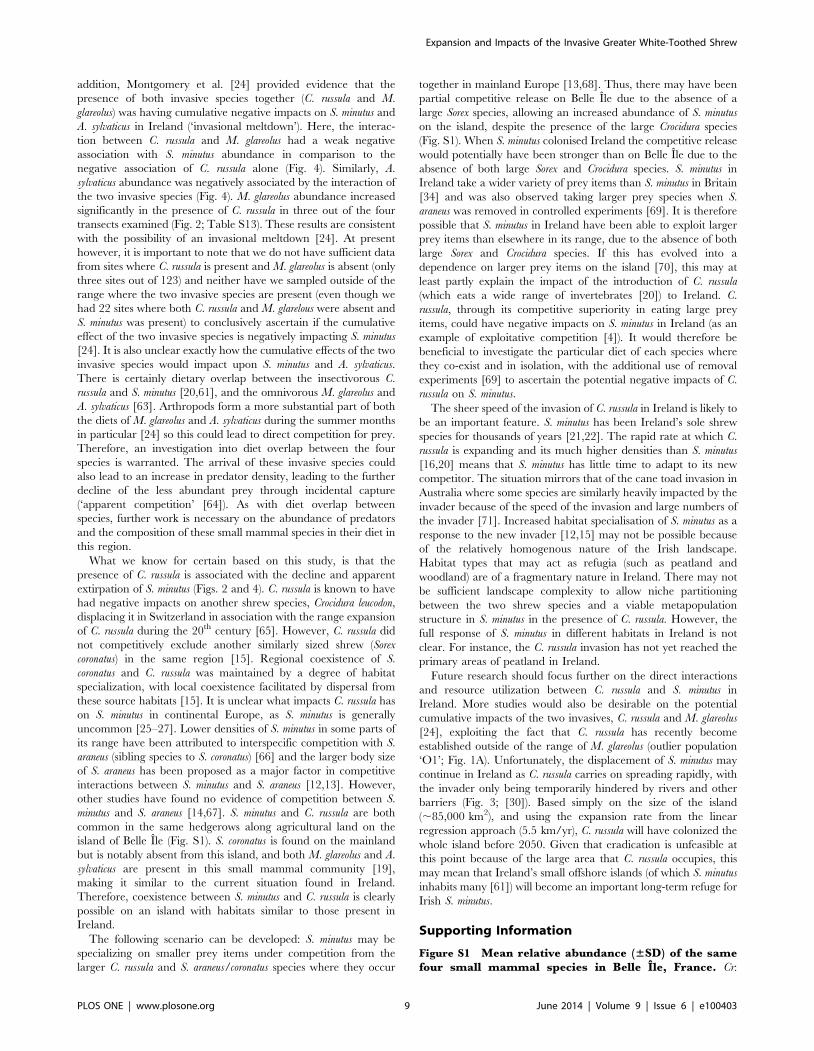
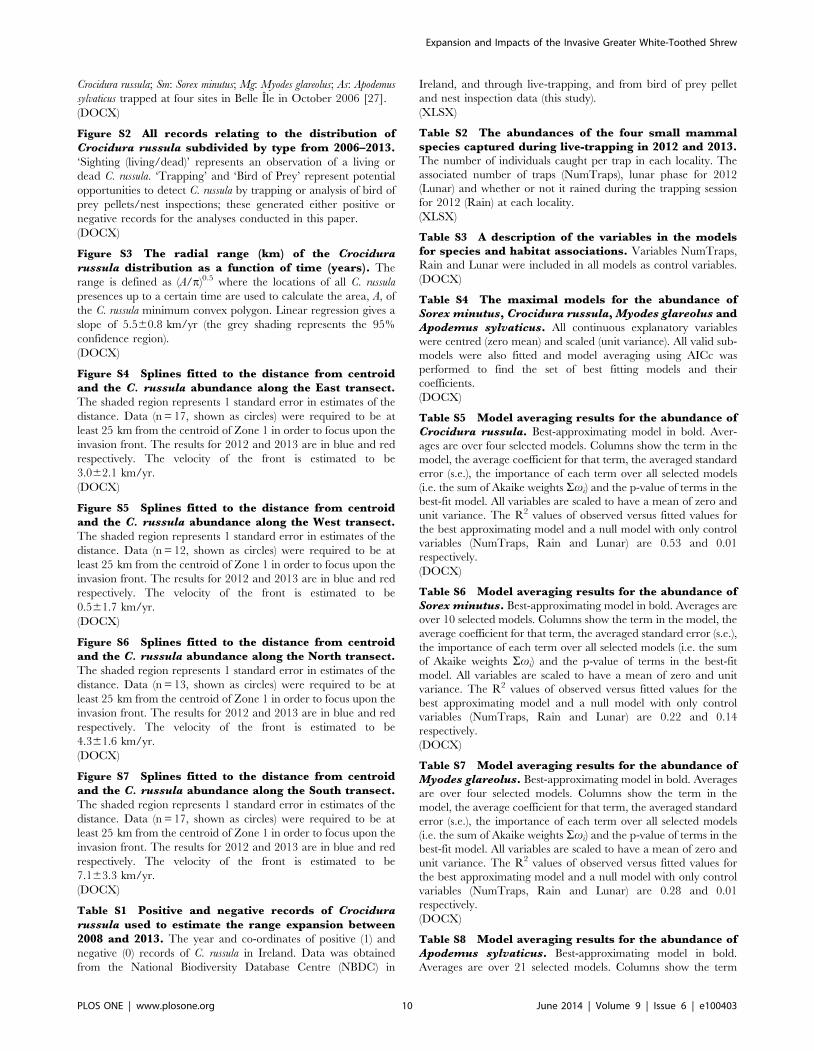
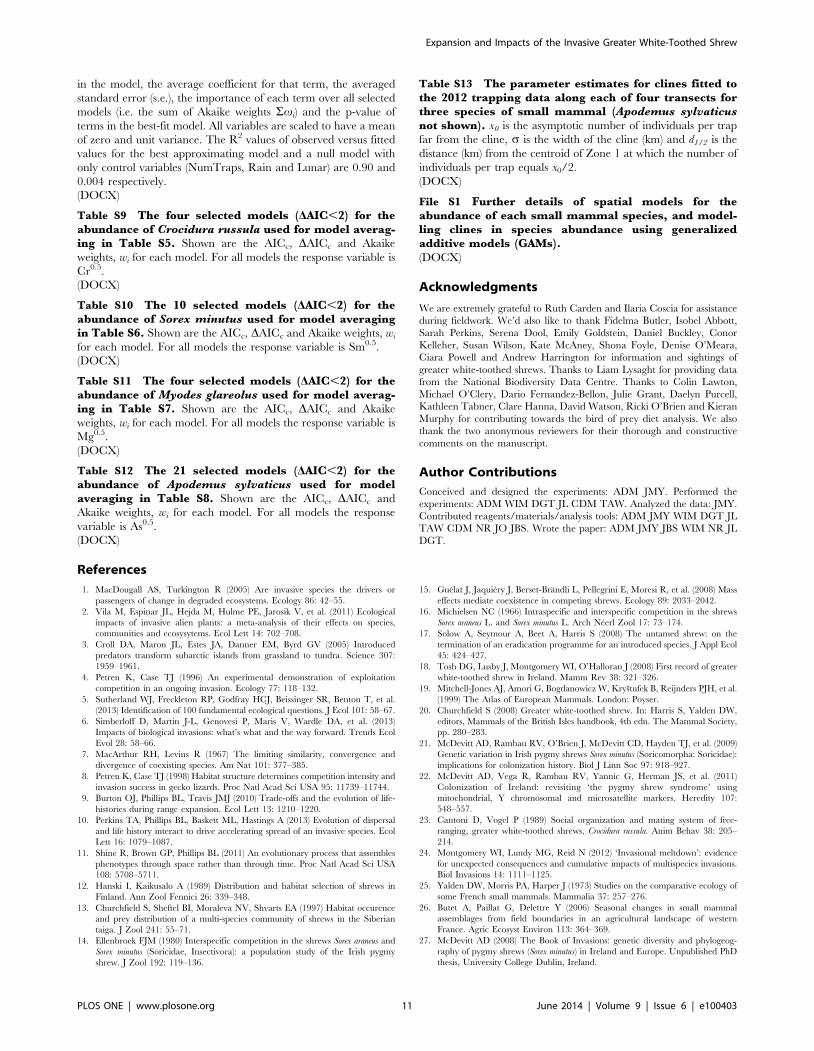
Figure 4. The model averaged terms (from selected models with DAICc#2) for models of the abundance of (a) Crocidura russula (Cr)(b) Sorex minutus (Sm) (c) Myodes glareolus (Mg) and (d) Apodemus sylvaticus (As). Bars show the relative importance of each term (ranked inorder of the sum of their Akaike weights, Svi). Black bars indicate terms in the best-approximating model (DAICc = 0). NumTraps, Rain and Lunar wereincluded in all models to control for confounding influences. Standardized regression coefficients (b) 61 standard error (SE) are shown to the right ofeach bar. Significance levels from the best-approximating model are indicated as N p,0.1, * p,0.05, ** p,0.01 and *** p,0.001, and significant termsat p,0.05 are shown in bold. The R2 values of observed versus fitted values for each best approximating model are 0.53, 0.22, 0.28 and 0.90 for C.russula, S. minutus, M. glareolus and A. sylvaticus, respectively.doi:10.1371/journal.pone.0100403.g004
Expansion and Impacts of the Invasive Greater White-Toothed Shrew
PLOS ONE | www.plosone.org 8 June 2014 | Volume 9 | Issue 6 | e100403
addition, Montgomery et al. [24] provided evidence that the
presence of both invasive species together (C. russula and M.
glareolus) was having cumulative negative impacts on S. minutus and
A. sylvaticus in Ireland (‘invasional meltdown’). Here, the interac-
tion between C. russula and M. glareolus had a weak negative
association with S. minutus abundance in comparison to the
negative association of C. russula alone (Fig. 4). Similarly, A.
sylvaticus abundance was negatively associated by the interaction of
the two invasive species (Fig. 4). M. glareolus abundance increased
significantly in the presence of C. russula in three out of the four
transects examined (Fig. 2; Table S13). These results are consistent
with the possibility of an invasional meltdown [24]. At present
however, it is important to note that we do not have sufficient data
from sites where C. russula is present and M. glareolus is absent (only
three sites out of 123) and neither have we sampled outside of the
range where the two invasive species are present (even though we
had 22 sites where both C. russula and M. glarelous were absent and
S. minutus was present) to conclusively ascertain if the cumulative
effect of the two invasive species is negatively impacting S. minutus
[24]. It is also unclear exactly how the cumulative effects of the two
invasive species would impact upon S. minutus and A. sylvaticus.
There is certainly dietary overlap between the insectivorous C.
russula and S. minutus [20,61], and the omnivorous M. glareolus and
A. sylvaticus [63]. Arthropods form a more substantial part of both
the diets of M. glareolus and A. sylvaticus during the summer months
in particular [24] so this could lead to direct competition for prey.
Therefore, an investigation into diet overlap between the four
species is warranted. The arrival of these invasive species could
also lead to an increase in predator density, leading to the further
decline of the less abundant prey through incidental capture
(‘apparent competition’ [64]). As with diet overlap between
species, further work is necessary on the abundance of predators
and the composition of these small mammal species in their diet in
this region.
What we know for certain based on this study, is that the
presence of C. russula is associated with the decline and apparent
extirpation of S. minutus (Figs. 2 and 4). C. russula is known to have
had negative impacts on another shrew species, Crocidura leucodon,
displacing it in Switzerland in association with the range expansion
of C. russula during the 20th century [65]. However, C. russula did
not competitively exclude another similarly sized shrew (Sorex
coronatus) in the same region [15]. Regional coexistence of S.
coronatus and C. russula was maintained by a degree of habitat
specialization, with local coexistence facilitated by dispersal from
these source habitats [15]. It is unclear what impacts C. russula has
on S. minutus in continental Europe, as S. minutus is generally
uncommon [25–27]. Lower densities of S. minutus in some parts of
its range have been attributed to interspecific competition with S.
araneus (sibling species to S. coronatus) [66] and the larger body size
of S. araneus has been proposed as a major factor in competitive
interactions between S. minutus and S. araneus [12,13]. However,
other studies have found no evidence of competition between S.
minutus and S. araneus [14,67]. S. minutus and C. russula are both
common in the same hedgerows along agricultural land on the
island of Belle Ile (Fig. S1). S. coronatus is found on the mainland
but is notably absent from this island, and both M. glareolus and A.
sylvaticus are present in this small mammal community [19],
making it similar to the current situation found in Ireland.
Therefore, coexistence between S. minutus and C. russula is clearly
possible on an island with habitats similar to those present in
Ireland.
The following scenario can be developed: S. minutus may be
specializing on smaller prey items under competition from the
larger C. russula and S. araneus/coronatus species where they occur
together in mainland Europe [13,68]. Thus, there may have been
partial competitive release on Belle Ile due to the absence of a
large Sorex species, allowing an increased abundance of S. minutus
on the island, despite the presence of the large Crocidura species
(Fig. S1). When S. minutus colonised Ireland the competitive release
would potentially have been stronger than on Belle Ile due to the
absence of both large Sorex and Crocidura species. S. minutus in
Ireland take a wider variety of prey items than S. minutus in Britain
[34] and was also observed taking larger prey species when S.
araneus was removed in controlled experiments [69]. It is therefore
possible that S. minutus in Ireland have been able to exploit larger
prey items than elsewhere in its range, due to the absence of both
large Sorex and Crocidura species. If this has evolved into a
dependence on larger prey items on the island [70], this may at
least partly explain the impact of the introduction of C. russula
(which eats a wide range of invertebrates [20]) to Ireland. C.
russula, through its competitive superiority in eating large prey
items, could have negative impacts on S. minutus in Ireland (as an
example of exploitative competition [4]). It would therefore be
beneficial to investigate the particular diet of each species where
they co-exist and in isolation, with the additional use of removal
experiments [69] to ascertain the potential negative impacts of C.
russula on S. minutus.
The sheer speed of the invasion of C. russula in Ireland is likely to
be an important feature. S. minutus has been Ireland’s sole shrew
species for thousands of years [21,22]. The rapid rate at which C.
russula is expanding and its much higher densities than S. minutus
[16,20] means that S. minutus has little time to adapt to its new
competitor. The situation mirrors that of the cane toad invasion in
Australia where some species are similarly heavily impacted by the
invader because of the speed of the invasion and large numbers of
the invader [71]. Increased habitat specialisation of S. minutus as a
response to the new invader [12,15] may not be possible because
of the relatively homogenous nature of the Irish landscape.
Habitat types that may act as refugia (such as peatland and
woodland) are of a fragmentary nature in Ireland. There may not
be sufficient landscape complexity to allow niche partitioning
between the two shrew species and a viable metapopulation
structure in S. minutus in the presence of C. russula. However, the
full response of S. minutus in different habitats in Ireland is not
clear. For instance, the C. russula invasion has not yet reached the
primary areas of peatland in Ireland.
Future research should focus further on the direct interactions
and resource utilization between C. russula and S. minutus in
Ireland. More studies would also be desirable on the potential
cumulative impacts of the two invasives, C. russula and M. glareolus
[24], exploiting the fact that C. russula has recently become
established outside of the range of M. glareolus (outlier population
‘O1’; Fig. 1A). Unfortunately, the displacement of S. minutus may
continue in Ireland as C. russula carries on spreading rapidly, with
the invader only being temporarily hindered by rivers and other
barriers (Fig. 3; [30]). Based simply on the size of the island
(,85,000 km2), and using the expansion rate from the linear
regression approach (5.5 km/yr), C. russula will have colonized the
whole island before 2050. Given that eradication is unfeasible at
this point because of the large area that C. russula occupies, this
may mean that Ireland’s small offshore islands (of which S. minutus
inhabits many [61]) will become an important long-term refuge for
Irish S. minutus.
Supporting Information
Figure S1 Mean relative abundance (±SD) of the samefour small mammal species in Belle Ile, France. Cr:
Expansion and Impacts of the Invasive Greater White-Toothed Shrew
PLOS ONE | www.plosone.org 9 June 2014 | Volume 9 | Issue 6 | e100403
Crocidura russula; Sm: Sorex minutus; Mg: Myodes glareolus; As: Apodemus
sylvaticus trapped at four sites in Belle Ile in October 2006 [27].
(DOCX)
Figure S2 All records relating to the distribution ofCrocidura russula subdivided by type from 2006–2013.‘Sighting (living/dead)’ represents an observation of a living or
dead C. russula. ‘Trapping’ and ‘Bird of Prey’ represent potential
opportunities to detect C. russula by trapping or analysis of bird of
prey pellets/nest inspections; these generated either positive or
negative records for the analyses conducted in this paper.
(DOCX)
Figure S3 The radial range (km) of the Crocidurarussula distribution as a function of time (years). The
range is defined as (A/p)0.5 where the locations of all C. russula
presences up to a certain time are used to calculate the area, A, of
the C. russula minimum convex polygon. Linear regression gives a
slope of 5.560.8 km/yr (the grey shading represents the 95%
confidence region).
(DOCX)
Figure S4 Splines fitted to the distance from centroidand the C. russula abundance along the East transect.The shaded region represents 1 standard error in estimates of the
distance. Data (n = 17, shown as circles) were required to be at
least 25 km from the centroid of Zone 1 in order to focus upon the
invasion front. The results for 2012 and 2013 are in blue and red
respectively. The velocity of the front is estimated to be
3.062.1 km/yr.
(DOCX)
Figure S5 Splines fitted to the distance from centroidand the C. russula abundance along the West transect.The shaded region represents 1 standard error in estimates of the
distance. Data (n = 12, shown as circles) were required to be at
least 25 km from the centroid of Zone 1 in order to focus upon the
invasion front. The results for 2012 and 2013 are in blue and red
respectively. The velocity of the front is estimated to be
0.561.7 km/yr.
(DOCX)
Figure S6 Splines fitted to the distance from centroidand the C. russula abundance along the North transect.The shaded region represents 1 standard error in estimates of the
distance. Data (n = 13, shown as circles) were required to be at
least 25 km from the centroid of Zone 1 in order to focus upon the
invasion front. The results for 2012 and 2013 are in blue and red
respectively. The velocity of the front is estimated to be
4.361.6 km/yr.
(DOCX)
Figure S7 Splines fitted to the distance from centroidand the C. russula abundance along the South transect.The shaded region represents 1 standard error in estimates of the
distance. Data (n = 17, shown as circles) were required to be at
least 25 km from the centroid of Zone 1 in order to focus upon the
invasion front. The results for 2012 and 2013 are in blue and red
respectively. The velocity of the front is estimated to be
7.163.3 km/yr.
(DOCX)
Table S1 Positive and negative records of Crocidurarussula used to estimate the range expansion between2008 and 2013. The year and co-ordinates of positive (1) and
negative (0) records of C. russula in Ireland. Data was obtained
from the National Biodiversity Database Centre (NBDC) in
Ireland, and through live-trapping, and from bird of prey pellet
and nest inspection data (this study).
(XLSX)
Table S2 The abundances of the four small mammalspecies captured during live-trapping in 2012 and 2013.The number of individuals caught per trap in each locality. The
associated number of traps (NumTraps), lunar phase for 2012
(Lunar) and whether or not it rained during the trapping session
for 2012 (Rain) at each locality.
(XLSX)
Table S3 A description of the variables in the modelsfor species and habitat associations. Variables NumTraps,
Rain and Lunar were included in all models as control variables.
(DOCX)
Table S4 The maximal models for the abundance ofSorex minutus, Crocidura russula, Myodes glareolus andApodemus sylvaticus. All continuous explanatory variables
were centred (zero mean) and scaled (unit variance). All valid sub-
models were also fitted and model averaging using AICc was
performed to find the set of best fitting models and their
coefficients.
(DOCX)
Table S5 Model averaging results for the abundance ofCrocidura russula. Best-approximating model in bold. Aver-
ages are over four selected models. Columns show the term in the
model, the average coefficient for that term, the averaged standard
error (s.e.), the importance of each term over all selected models
(i.e. the sum of Akaike weights Svi) and the p-value of terms in the
best-fit model. All variables are scaled to have a mean of zero and
unit variance. The R2 values of observed versus fitted values for
the best approximating model and a null model with only control
variables (NumTraps, Rain and Lunar) are 0.53 and 0.01
respectively.
(DOCX)
Table S6 Model averaging results for the abundance ofSorex minutus. Best-approximating model in bold. Averages are
over 10 selected models. Columns show the term in the model, the
average coefficient for that term, the averaged standard error (s.e.),
the importance of each term over all selected models (i.e. the sum
of Akaike weights Svi) and the p-value of terms in the best-fit
model. All variables are scaled to have a mean of zero and unit
variance. The R2 values of observed versus fitted values for the
best approximating model and a null model with only control
variables (NumTraps, Rain and Lunar) are 0.22 and 0.14
respectively.
(DOCX)
Table S7 Model averaging results for the abundance ofMyodes glareolus. Best-approximating model in bold. Averages
are over four selected models. Columns show the term in the
model, the average coefficient for that term, the averaged standard
error (s.e.), the importance of each term over all selected models
(i.e. the sum of Akaike weights Svi) and the p-value of terms in the
best-fit model. All variables are scaled to have a mean of zero and
unit variance. The R2 values of observed versus fitted values for
the best approximating model and a null model with only control
variables (NumTraps, Rain and Lunar) are 0.28 and 0.01
respectively.
(DOCX)
Table S8 Model averaging results for the abundance ofApodemus sylvaticus. Best-approximating model in bold.
Averages are over 21 selected models. Columns show the term
Expansion and Impacts of the Invasive Greater White-Toothed Shrew
PLOS ONE | www.plosone.org 10 June 2014 | Volume 9 | Issue 6 | e100403
in the model, the average coefficient for that term, the averaged
standard error (s.e.), the importance of each term over all selected
models (i.e. the sum of Akaike weights Svi) and the p-value of
terms in the best-fit model. All variables are scaled to have a mean
of zero and unit variance. The R2 values of observed versus fitted
values for the best approximating model and a null model with
only control variables (NumTraps, Rain and Lunar) are 0.90 and
0.004 respectively.
(DOCX)
Table S9 The four selected models (DAIC,2) for theabundance of Crocidura russula used for model averag-ing in Table S5. Shown are the AICc, DAICc and Akaike
weights, wi for each model. For all models the response variable is
Cr0.5.
(DOCX)
Table S10 The 10 selected models (DAIC,2) for theabundance of Sorex minutus used for model averagingin Table S6. Shown are the AICc, DAICc and Akaike weights, wi
for each model. For all models the response variable is Sm0.5.
(DOCX)
Table S11 The four selected models (DAIC,2) for theabundance of Myodes glareolus used for model averag-ing in Table S7. Shown are the AICc, DAICc and Akaike
weights, wi for each model. For all models the response variable is
Mg0.5.
(DOCX)
Table S12 The 21 selected models (DAIC,2) for theabundance of Apodemus sylvaticus used for modelaveraging in Table S8. Shown are the AICc, DAICc and
Akaike weights, wi for each model. For all models the response
variable is As0.5.
(DOCX)
Table S13 The parameter estimates for clines fitted tothe 2012 trapping data along each of four transects forthree species of small mammal (Apodemus sylvaticusnot shown). x0 is the asymptotic number of individuals per trap
far from the cline, s is the width of the cline (km) and d1/2 is the
distance (km) from the centroid of Zone 1 at which the number of
individuals per trap equals x0/2.
(DOCX)
File S1 Further details of spatial models for theabundance of each small mammal species, and model-ling clines in species abundance using generalizedadditive models (GAMs).(DOCX)
Acknowledgments
We are extremely grateful to Ruth Carden and Ilaria Coscia for assistance
during fieldwork. We’d also like to thank Fidelma Butler, Isobel Abbott,
Sarah Perkins, Serena Dool, Emily Goldstein, Daniel Buckley, Conor
Kelleher, Susan Wilson, Kate McAney, Shona Foyle, Denise O’Meara,
Ciara Powell and Andrew Harrington for information and sightings of
greater white-toothed shrews. Thanks to Liam Lysaght for providing data
from the National Biodiversity Data Centre. Thanks to Colin Lawton,
Michael O’Clery, Dario Fernandez-Bellon, Julie Grant, Daelyn Purcell,
Kathleen Tabner, Clare Hanna, David Watson, Ricki O’Brien and Kieran
Murphy for contributing towards the bird of prey diet analysis. We also
thank the two anonymous reviewers for their thorough and constructive
comments on the manuscript.
Author Contributions
Conceived and designed the experiments: ADM JMY. Performed the
experiments: ADM WIM DGT JL CDM TAW. Analyzed the data: JMY.
Contributed reagents/materials/analysis tools: ADM JMY WIM DGT JL
TAW CDM NR JO JBS. Wrote the paper: ADM JMY JBS WIM NR JL
DGT.
References
1. MacDougall AS, Turkington R (2005) Are invasive species the drivers or
passengers of change in degraded ecosystems. Ecology 86: 42–55.
2. Vila M, Espinar JL, Hejda M, Hulme PE, Jarosik V, et al. (2011) Ecological
impacts of invasive alien plants: a meta-analysis of their effects on species,
communities and ecosysytems. Ecol Lett 14: 702–708.
3. Croll DA, Maron JL, Estes JA, Danner EM, Byrd GV (2005) Introduced
predators transform subarctic islands from grassland to tundra. Science 307:
1959–1961.
4. Petren K, Case TJ (1996) An experimental demonstration of exploitation
competition in an ongoing invasion. Ecology 77: 118–132.
5. Sutherland WJ, Freckleton RP, Godfray HCJ, Beissinger SR, Benton T, et al.
(2013) Identification of 100 fundamental ecological questions. J Ecol 101: 58–67.
6. Simberloff D, Martin J-L, Genovesi P, Maris V, Wardle DA, et al. (2013)
Impacts of biological invasions: what’s what and the way forward. Trends Ecol
Evol 28: 58–66.
7. MacArthur RH, Levins R (1967) The limiting similarity, convergence and
divergence of coexisting species. Am Nat 101: 377–385.
8. Petren K, Case TJ (1998) Habitat structure determines competition intensity and
invasion success in gecko lizards. Proc Natl Acad Sci USA 95: 11739–11744.
9. Burton OJ, Phillips BL, Travis JMJ (2010) Trade-offs and the evolution of life-
histories during range expansion. Ecol Lett 13: 1210–1220.
10. Perkins TA, Phillips BL, Baskett ML, Hastings A (2013) Evolution of dispersal
and life history interact to drive accelerating spread of an invasive species. Ecol
Lett 16: 1079–1087.
11. Shine R, Brown GP, Phillips BL (2011) An evolutionary process that assembles
phenotypes through space rather than through time. Proc Natl Acad Sci USA
108: 5708–5711.
12. Hanski I, Kaikusalo A (1989) Distribution and habitat selection of shrews in
Finland. Ann Zool Fennici 26: 339–348.
13. Churchfield S, Sheftel BI, Moraleva NV, Shvarts EA (1997) Habitat occurence
and prey distribution of a multi-species community of shrews in the Siberian
taiga. J Zool 241: 55–71.
14. Ellenbroek FJM (1980) Interspecific competition in the shrews Sorex araneus and
Sorex minutus (Soricidae, Insectivora): a population study of the Irish pygmy
shrew. J Zool 192: 119–136.
15. Guelat J, Jaquiery J, Berset-Brandli L, Pellegrini E, Moresi R, et al. (2008) Mass
effects mediate coexistence in competing shrews. Ecology 89: 2033–2042.
16. Michielsen NC (1966) Intraspecific and interspecific competition in the shrews
Sorex araneus L. and Sorex minutus L. Arch Neerl Zool 17: 73–174.
17. Solow A, Seymour A, Beet A, Harris S (2008) The untamed shrew: on the
termination of an eradication programme for an introduced species. J Appl Ecol
45: 424–427.
18. Tosh DG, Lusby J, Montgomery WI, O’Halloran J (2008) First record of greater
white-toothed shrew in Ireland. Mamm Rev 38: 321–326.
19. Mitchell-Jones AJ, Amori G, Bogdanowicz W, Krystufek B, Reijnders PJH, et al.
(1999) The Atlas of European Mammals. London: Poyser.
20. Churchfield S (2008) Greater white-toothed shrew. In: Harris S, Yalden DW,
editors, Mammals of the British Isles handbook, 4th edn. The Mammal Society,
pp. 280–283.
21. McDevitt AD, Rambau RV, O’Brien J, McDevitt CD, Hayden TJ, et al. (2009)
Genetic variation in Irish pygmy shrews Sorex minutus (Soricomorpha: Soricidae):
implications for colonization history. Biol J Linn Soc 97: 918–927.
22. McDevitt AD, Vega R, Rambau RV, Yannic G, Herman JS, et al. (2011)
Colonization of Ireland: revisiting ‘the pygmy shrew syndrome’ using
mitochondrial, Y chromosomal and microsatellite markers. Heredity 107:
548–557.
23. Cantoni D, Vogel P (1989) Social organization and mating system of free-
ranging, greater white-toothed shrews, Crocidura russula. Anim Behav 38: 205–
214.
24. Montgomery WI, Lundy MG, Reid N (2012) ‘Invasional meltdown’: evidence
for unexpected consequences and cumulative impacts of multispecies invasions.
Biol Invasions 14: 1111–1125.
25. Yalden DW, Morris PA, Harper J (1973) Studies on the comparative ecology of
some French small mammals. Mammalia 37: 257–276.
26. Butet A, Paillat G, Delettre Y (2006) Seasonal changes in small mammal
assemblages from field boundaries in an agricultural landscape of western
France. Agric Ecosyst Environ 113: 364–369.
27. McDevitt AD (2008) The Book of Invasions: genetic diversity and phylogeog-
raphy of pygmy shrews (Sorex minutus) in Ireland and Europe. Unpublished PhD
thesis, University College Dublin, Ireland.
Expansion and Impacts of the Invasive Greater White-Toothed Shrew
PLOS ONE | www.plosone.org 11 June 2014 | Volume 9 | Issue 6 | e100403

28. Meehan JM (2005) Range expansion of the bank vole Clethrionomys glareolus
(Schreber 1780) in Ireland: habitat use by sympatric bank voles and wood miceApodemus sylvaticus (Kemp 1829). Unpublished PhD thesis. University College
Dublin, Ireland.
29. Smal CM, Fairley JS (1984) The spread of the bank vole Clethrionomys glareolus inIreland. Mamm Rev 14: 71–78.
30. White TA, Lundy MG, Montgomery WI, Montgomery S, Perkins SE, et al.(2012) Range expansion in an invasive small mammal: influence of life-history
and habitat quality. Biol Invasions 14: 2203–2215.
31. White TA, Perkins SE, Heckel G, Searle JB (2013) Adaptive evolution during arange expansion: the invasive bank vole (Myodes glareolus) in Ireland. Mol Ecol 22:
2971–2985.32. Preece RC, Coxon P, Robinson JE (1986) New biostratigraphic evidence for
post-glacial colonisation of Ireland and for Mesolithic forest disturbance.J Biogeog 13: 487–509.
33. Simberloff D, Von Holle B (1999) Positive interactions of nonindigenous species:
invasional meltdown? Biol Invasions 5: 179–192.34. Grainger JP, Fairley JS (1978) Studies on the biology of the pygmy shrew Sorex
minutus in the West of Ireland. J Zool 186: 109–141.35. Yalden DW (1985) An experimental investigation of examining kestrel diet by
pellet analysis. Bird Study 32: 50–55.
36. Yalden DW (2003) The analysis of owl pellets. The Mammal Society.37. Terrink BJ (1991) Hair of West European mammals: atlas and identification key.
Cambridge: Cambridge University Press.38. Askew NP (2006) The foraging and conservation ecology of the Barn Owl Tyto
alba. Unpublished PhD Thesis, University of York, York.39. Shawyer CR (1998) The Barn Owl. Wheathampstead: Arlequin Press.
40. Village A (1990) The Kestrel. London: T & AD Poyser.
41. O’Meara DB, Sheehy E, Turner PD, O’Mahoney D, Harrington AP, et al.(2014) Non-invasive multi-species monitoring: real-time PCR detection of small
mammal and squirrel prey DNA in pine marten (Martes martes) scats. ActaTheriol 59: 111–117.
42. Dussex N (2008) Fine-scale dispersal patterns in the greater white-toothed shrew
(Crocidura russula): what can we learn from F-statistics and parentage assignments?Unpublished MSc thesis, University of Lausanne, Switzerland.
43. Burnham KP, Anderson DR (2002) Model selection and multimodel inference –a practical information-theoretic approach. 2nd edition. New York: Springer.
44. Wolfe JL, Summerlin CT (1989) The influence of lunar light on nocturnalactivity of the old-field mouse. Animal Behav 37: 410–414.
45. Maestri R, Marinho JR (2014) Singing in the rain. Rainfall and moonlight affect
daily activity patterns of rodents in a Neotropical forest. Acta Theriol doi:10.1007/s13364-014-0177-x.
46. Favre L, Balloux F, Goudet J, Perrin N (1997) Female-biased dispersal in themonogamous mammal Crocidura russula: evidence from field data and
microsatellite patterns. Proc R Soc Lond B 264: 127–132.
47. Fontanillas P, Petit E, Perrin N (2004) Estimating sex-specific dispersal rates withautosomal markers in hierarchically structured populations. Evolution 58: 886–
894.48. Jaquiery J, Guelat J, Broquet T, Berset-Brandli L, Pellegrini E, et al. (2008)
Habitat-quality effects on metapopulation dynamics in greater white-toothedshrews, Crocidura russula. Ecology 89: 2777–2785.
49. Lindstrom T, Brown GP, Sisson SA, Phillips BL, Shine R (2013) Rapid shifts in
dispersal behavior on an expanding range edge. Proc Natl Acad Sci USA 110:13452–13456.
50. Barton KA, Hovestadt T, Phillips BL, Travis JMJ (2012) Ricky movementincreases the rate of range expansion. Proc R Soc B 279: 1194–1202.
51. Phillips BL, Brown GP, Webb JK, Shine R (2006) Invasion and the evolution of
speed in toads. Nature 439: 803.52. Phillips BL, Brown GP, Shine R (2010) Evolutionary accelerated invasions: the
rate of dispersal evolves upwards during range advance of cane toads. J Evol Biol
23: 2595–2601.53. Phillips BL, Brown GP, Greenlees M, Webb JK, Shine R (2007) Rapid
expansion of the cane toad (Bufo marinus) invasion front in tropical Australia.Austral Ecol 32: 169–176.
54. Forsman A, Merila J, Ebenhard T (2011) Phenotypic evolution of dispersal-
enhancing traits in insular voles. Proc R Soc B 278: 225–232.55. Bouteiller C, Perrin N (2000) Individual reproductive success and effective
population size in the greater white-toothed shrew Crocidura russula. Proc R Soc B267: 701–705.
56. Phillips BL (2009) The evolution of growth rates on an expanding range edge.Biol Lett 5: 802–804.
57. Flowerdew JR, Shore RF, Poulton SMC, Sparks TH (2004) Live trapping to
monitor small mammals in Britain. Mamm Rev 34: 31–50.58. Forest Service, Department of Agriculture Fisheries Food 2007. The National
Forest Inventory of Ireland (Results). Co. Wexford, Ireland: Forest Service.59. Meharg MJ, Montgomery WI, Dunwoody T (1990) Trophic relationships of
common frog (Rana temporaria) and pygmy shrew (Sorex minutus) in upland Co.
Antrim, Northern Ireland. J Zool 222: 1–17.60. Reid N (2011) European hare (Lepus europaeus) invasion ecology; implications for
the conservation of the endemic Irish hare (Lepus timidus hibernicus). Biol Invasions13: 559–569.
61. Churchfield S, Searle JB (2008) Pygmy shrew. In: Harris S, Yalden DW, editors.Mammals of the British Isles handbook, 4th edn. The Mammal Society, pp.
267–271.
62. MacKenzie DI, Nichols JD, Lachman GB, Droege S, Royle JA, et al. (2002)Estimating site occupancy rates when detection probabilities are less than one.
Ecology 83: 2248–2255.63. Watts CHS (1968) The foods eaten by wood mice (Apodemus sylvaticus) and bank
voles (Clethrionomys glareolus) in Wytham Woods, Berkshire. J Anim Ecol 37:25–
41.64. DeCesare NJ, Hebblewhite M, Robinson H, Musiani M (2010) Endangered,
apparently: the role of apparent competition in endangered species manage-ment. Anim Conserv 13: 353–362.
65. Vogel P, Jutzeler S, Rulence B, Reutter BA (2002) Range expansion of thegreater white-toothed shrew Crocidura russula in Switzerland results in local
extinction of the bicoloured white-toothed shrew C. leucodon. Acta Theriol 47:
15–24.66. Malmquist MG (1986) Density compensation in allopatric populations of the
pygmy shrew Sorex minutus on Gotland (Sweden) and the Outer Hebrides(Scotland, UK): evidence for the effect of interspecific competition. Oecologica
68: 344–346.
67. Peltonen A, Hanski I (1991) Patterns of island occupancy explained bycolonization and extinction rates in shrews. Ecology 72: 1698–1708.
68. Churchfield S, Rychlik L (2006) Diets and coexistence in Neomys and Sorex shrewsin Białowiez_a forest, eastern Poland. J Zool 269: 381–390.
69. Dickman CR (1988) Body size, prey size, and community structure ininsectivorous mammals. Ecology 69: 569–580.
70. Cornette R, Herrel A, Cosson J-F, Poitevin F, Baylac M (2012) Rapid morpho-
functional changes among insular populations of the greater white-toothedshrew. Biol J Linn Soc 107: 322–331.
71. Shine R (2010) The ecological impact of invasive cane toads (Bufo marinus) inAustralia. Q Rev Biol 85: 253–291.
Expansion and Impacts of the Invasive Greater White-Toothed Shrew
PLOS ONE | www.plosone.org 12 June 2014 | Volume 9 | Issue 6 | e100403