Intrusion Detection System Based on Carpenter/Grossberg Artificial Neural … · ·...
125
I Intrusion Detection System Based on Carpenter/Grossberg Artificial Neural Network روسبيرك العصبونية على شبكة كاربنتر/كداستناتطفل ام كشف ال نظاصطناعية اPrepared by: Ammar Mhana Kadhim Alrubaye Supervised by Prof. Reyadh Shaker Naoum Master Thesis Submitted in Partial Fulfilment of the Requirements for the Master Degree in Computer Science Department of Computer Science Faculty of Information Technology Middle East University Amman – Jordan 2014
Transcript of Intrusion Detection System Based on Carpenter/Grossberg Artificial Neural … · ·...

I
Intrusion Detection System Based on
Carpenter/Grossberg Artificial Neural Network
نظام كشف التطفل استنادا على شبكة كاربنتر/كروسبيرك العصبونية
االصطناعية
Prepared by:
Ammar Mhana Kadhim Alrubaye
Supervised by
Prof. Reyadh Shaker Naoum
Master Thesis
Submitted in Partial Fulfilment of the Requirements for the
Master Degree in Computer Science
Department of Computer Science
Faculty of Information Technology
Middle East University
Amman – Jordan
2014

II

III

IV

V
Dedication
I dedicate this work to my wonderful father and mother, and my
wife Aseel, and my lovely kids; Suhaib and Humam, and my brother
and sisters, for their praying, love and encouragement. Finally, this
worked is dedicated to my brother “Jamal”…..
May God bless his soul

VI
Acknowledgements
First of all, I would like to thank Allah the Almighty, for giving me the
strength and patience to finish this work.
I would like to express my great gratitude to my supervisor,
Professor Reyadh Shaker Naoum for his knowledge, guidance, support.
Without his support this study would not have been done
My gratitude towards Dr. Ahmad kayed for directing me the right
way in writing the current thesis.
I also would like to thank all the doctors in the Faculty of
Information Technology / Middle East University for their teaching.
Besides, I would like to thank University of Baghdad, for giving
me the opportunity to study abroad.
My appreciation towards Mr.Mohmmad Al-Akhsham for his
support, and help.
Finally, I want to thank my parents and my wife for their support,
and patience.

VII
Table of Contents
Title I
التفويض إقرار II
Authorization III
Thesis Committee Decision IV
Dedication V
Acknowledgements VI
Table of Contents VII
List of Figures IX
List of Tables XI
List of Abbreviations XII
English Abstract XIV
Arabic Abstract XV
Chapter One: Introduction 1
1.1. Introduction 2
1.2. Research Motivation 3
1.3. The Problem Statement 4
1.4. Contribution 4
1.5. Objectives of the Research 5
1.6. Questions of the Research 5
1.7. Methodology 6
Chapter Two: Literature Review and Related Work. 7
2.1. Introduction 8
2.2. Literature Review and Related Works 8
2.2.1. IDS Based on Clustering and Classification 8
2.2.2. IDS Based on ANN 9
2.2.3. IDS Based on Clustering and ANN Hybrid Methods 10
Chapter Three: Intrusion Detection System 12
3.1. Overview 13
3.2. Intrusion Detection and IDS 13
3.3. Firewall 15
3.4. Types of Network Attacks 18
3.5. IDS Techniques 19
3.6. IDS Classification 21
3.7. Requirements for Idealism of IDS 23
3.8. Passive and Reactive IDS 25
3.9. Evaluation Criteria of IDS 26

VIII
3.10. Artificial Neural Network Approach for IDS 30
Chapter Four: Artificial Neural Network (ANN) 32
4.1. Overview 33
4.2. The Using of Neural Network for IDSs 33
4.3. The Implementations of ANN 34
4.4. Artificial Neuron Model 36
4.5. Classification of ANN 38
4.6. Architecture of ANN 39
4.7. Models of ANN 41
4.8. ANN Learning 43
4.9. Learning Models 44
4.10. The stability-plasticity dilemma 47
4.11. Adaptive Resonance Theory (ART) 48
4.12. ART1 Learning 50
4.13. Resonance of ART1 51
Chapter Five: Proposed Model And Methodology Of The Ids
Based On (Carpenter/Grossberg -Art1 Ann)
52
5.1. Introduction 53
5.2. Proposed Model 53
5.3. The Proposed Model Phases 55
5.3.1. Preprocessing Phase 55
(A) The Environment Unit 55
(B) Data Codification Unit 58
(C) Data Encoding Unit 61
(D) Feature Selecting Unit 62
(E) Feature Clustering Unit 63
5.3.2. Training phase 68
(A) ART1 Architecture 69
(B) ART1 Algorithm 73
(C) ART1 Training 76
(D) The vigilance test 80
5.3.3. Testing Phase 82
5.4. Intrusion detection simulation 83
Chapter Six: Performance Evaluation and Experimental
Results.
84
6.1 Introduction 85
6.2 Implementing Technique 85
6.3 K-mean algorithm results 86
6.4 Carpenter / Grossberg-ART1 ANN Results 87
6.5 Evaluation Criteria 91
6.6 Comparison Between Our Method and Others Methods 95
6.7 Conclusion 97
6.8 Future Work 98
References 99
IX
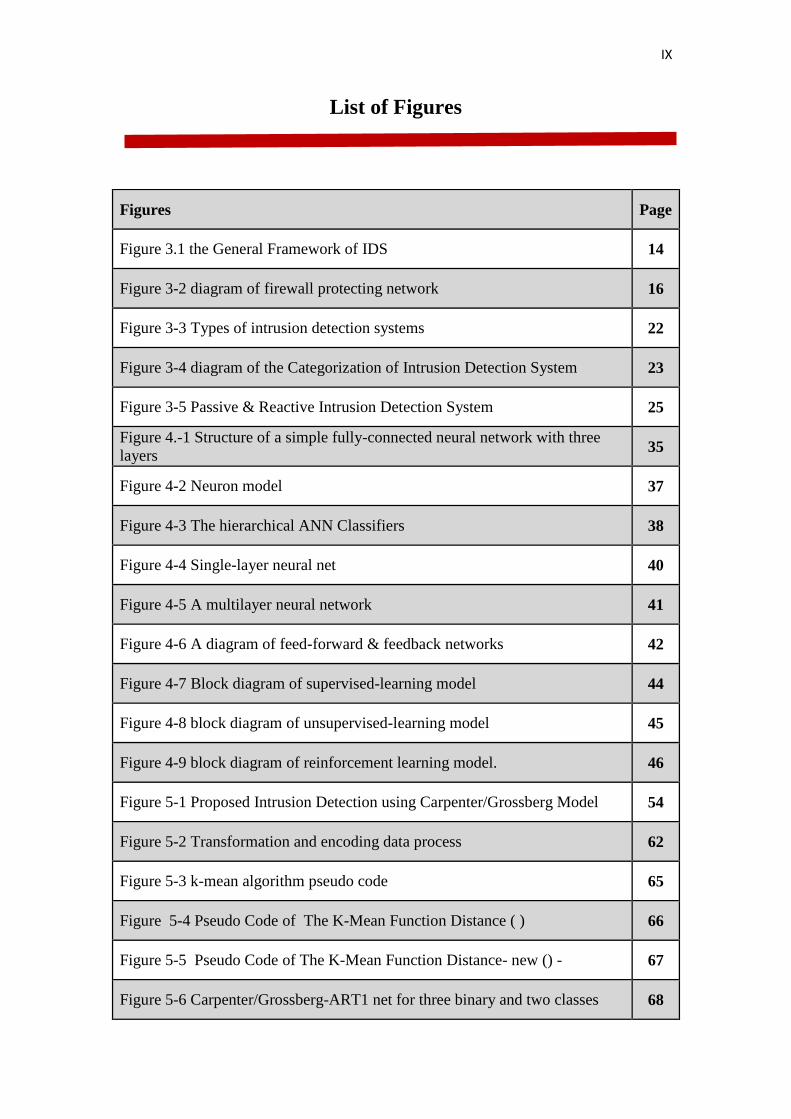
List of Figures
Figures Page
Figure 3.1 the General Framework of IDS 14
Figure 3-2 diagram of firewall protecting network 16
Figure 3-3 Types of intrusion detection systems 22
Figure 3-4 diagram of the Categorization of Intrusion Detection System 23
Figure 3-5 Passive & Reactive Intrusion Detection System 25
Figure 4.-1 Structure of a simple fully-connected neural network with three
layers 35
Figure 4-2 Neuron model 37
Figure 4-3 The hierarchical ANN Classifiers 38
Figure 4-4 Single-layer neural net 40
Figure 4-5 A multilayer neural network 41
Figure 4-6 A diagram of feed-forward & feedback networks 42
Figure 4-7 Block diagram of supervised-learning model 44
Figure 4-8 block diagram of unsupervised-learning model 45
Figure 4-9 block diagram of reinforcement learning model. 46
Figure 5-1 Proposed Intrusion Detection using Carpenter/Grossberg Model 54
Figure 5-2 Transformation and encoding data process 62
Figure 5-3 k-mean algorithm pseudo code 65
Figure 5-4 Pseudo Code of The K-Mean Function Distance ( ) 66
Figure 5-5 Pseudo Code of The K-Mean Function Distance- new () - 67
Figure 5-6 Carpenter/Grossberg-ART1 net for three binary and two classes 68
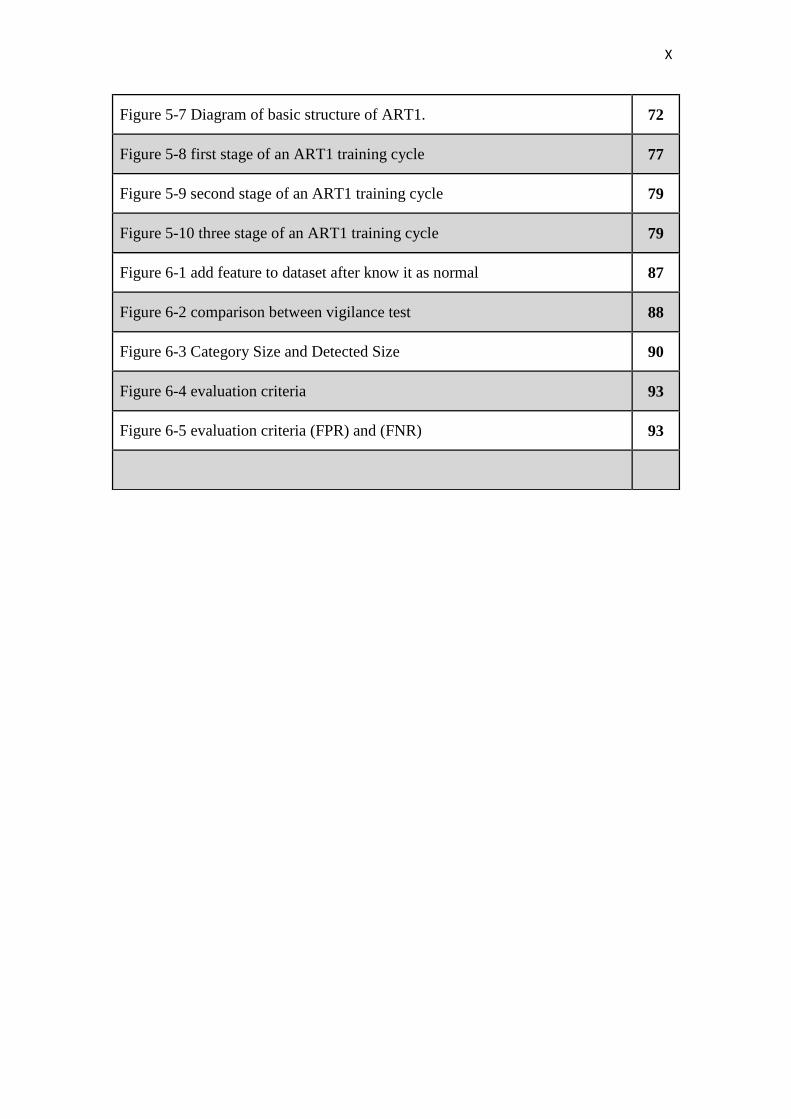
X
Figure 5-7 Diagram of basic structure of ART1. 72
Figure 5-8 first stage of an ART1 training cycle 77
Figure 5-9 second stage of an ART1 training cycle 79
Figure 5-10 three stage of an ART1 training cycle 79
Figure 6-1 add feature to dataset after know it as normal 87
Figure 6-2 comparison between vigilance test 88
Figure 6-3 Category Size and Detected Size 90
Figure 6-4 evaluation criteria 93
Figure 6-5 evaluation criteria (FPR) and (FNR) 93

XI
List of Tables
Tables Page
Table 3-1 some examples on different types of network attacks 19
Table 3-2 IDS techniques and its basic idea for detection 20
Table 3-3 Confusion Matrix 26
Table 4-1 Features of neural networks 39
Table 4-2 ANN learning rules 43
Table 4-3 The types of ART techniques and its analysis 49
Table 5-1. KDD Cup 99 Feature Columns Name and Type 57
Table 5-2 Transformation Table for Protocol Feature No.2 59
Table 5-3 Transformation Table for Flag Column Feature no.3 59
Table 5-4 (Sub Attack cluster into Main Attack type) 60
Table 5-5 Feature has big values and Feature has a Floating-Point Number. 60
Table 5-6 Compression between numbers of records before\after remove
duplicate 63
Table 6-1 K-mean clustering 86
Table 6-2 Confusion Matrix of testing data (Labeled) 89
Table 6-3 Carpenter / Grossberg-ART1 ANN detection 89
Table 6-4 Testing Unlabelled Dataset 91
Table 6-5 the true classified and misclassified 91
Table 6-6 The Evolution Criteria ID attacks 92
Table 6-7 Important results of ART1 for IDS 94
Table 6-8 Comparison between proposed system and previous researches 95

XII
List of Abbreviations
ANN Artificial Neural Network
ART Adaptive Resonance Theory
DARPA Defense Advanced Research Projects Agency
DoS Denial of Service
DMA Data Mining Algorithms
DR Detection Rate
FL Fuzzy Logic
FNR False Negative Rate
FPR False Positive Rate
GAs Genetic Algorithms
HIDS Host-Based Intrusion Detection Systems
ID Intrusion Detection
IDS Intrusion Detection System
KDD Knowledge Discovery and Data Mining
NIDS Network Based Intrusion Detection systems
PCA Principal Component Analysis
PE Process Element
RL Reinforcement learning,
RR Recall Rate
SA Statistical Analysis
SL Supervised Learning,
USL Unsupervised learning
PR Precision Rate
R2L Remote to Local Attack
RS Rough Set
SOM Self-Organizing Map
U2R User to Root Attack
AccR Accuracy Rate
XIII
Abstract
Over the last few decades, computer applications have evolved and became very
important part of our life. This led to widespread concerns of network service
disruption due to large-scale malicious attacks on computer networks. The
development of a secure infrastructure to defend these applications from all
challenges coming from intruders, hackers, and unauthorized access is a major
challenge.
Intrusion detection system (IDS) is regarded as the second line of defense against
network anomalies and threats. IDSs play an important role in detecting malicious and
suspicious activities, and providing warning for unauthorized access over the network.
This research simulates a model of intrusion detection system. Artificial neural
network (ANN) and machine learning (ML) combined with clustering algorithm as a
pre-classifier are used to enhance the detection of network intrusion.
This IDS use both Adaptive Resonance Theory (ART1) and k-mean clustering
algorithm, where ART1 is a version of Carpenter/Grossberg’s ANN and the key core
in this system.
The simulation system includes three main phases:
1. Preprocessing, in which converts the data and cluster the categories.
2. Training phase, in which trains ART1 neural network.
3. Testing phase, which tests ART1 network and check the performance and the
stability of the IDS system.

XIV
At training phase, the sample space was randomly selected, where all known attack
patterns are selected from KDD 99 dataset. Furthermore, many parameters were
adjusted such as; norm, vigilance test, and weight factors. For testing purposes, the
sample space is also randomly selected, that contains a number of duplicated patterns
in order to test the stability.
The results of this research has a detection rate about 96.8% with an accuracy rate
96% , false positive rate 1.19% and False Negative Rate about 0.54% The results are
compared with other previous studies. The results from this research showed better
performance than the compared approaches.

XV
الملخص
جزء مهم جدا من تعلى مدى العقود القليلة الماضية، تطورت تطبيقات الحاسوب، وأصبح
حياتنا. وأدى ذلك إلى مخاوف واسعة النطاق من انقطاع خدمة الشبكة بسبب الفعاليات الخبيثة
مجال شبكات الحاسوب.حيث يعد تطوير بنية تحتية آمنة للدفاع عن هذه في واسع اطار على
تر، والوصول التطبيقات تحديا كبيرا من جميع التحديات القادمة من المتسللين وقراصنة الكمبيو
.غير المصرح به
وتهديدات الشبكة. الغير الطبيعيخط الدفاع الثاني ضد السلوك ويعتبر نظام كشف التطفل هو
دورا هاما في الكشف عن األنشطة الخبيثة والمشبوهة، ويقديم تحذير للوصول (IDS)ويلعب
.غير المصرح به عبر الشبكة
دم الشبكة العصبونية االصطناعيةـــف التطفل. وتستخــــــيحاكي هذا البحث نموذجا للنظام كش
(ANN) وتعلم اآللة (LM) والذي تصنيف اوليجنبا إلى جنب مع خوارزمية التجميع بمثابة
التكيف ;نظام كشف التطفل يستخدم كلتا النظريتين ان و هذا .يعزز كشف التطفل للشبكة
ن م هو نسخة ART1 حيث ,وارزمية التجميعــــخ –رية ظـــــنk-mean و (ART1) الرنين
Carpenter/Grossberg’s ANN وهو جوهر أساسي في هذا النظام.

XVI
:يتضمن نظام المحاكاة من ثالث مراحل رئيسية
.والذي يحول البيانات وتجميع فئات :تجهيزال مرحلة .1
.العصبية ART1 شبكة التي تدرب التدريب:رحلة م .2
IDSلا والتحقق من أداء واستقرار نظام العصبية ART1 التي تختبر شبكة :االختباررحلة م .3
اختيار فضاء العينة بشكل عشوائي، حيث يتم تحديد كافة أنماط الهجوم تم في مرحلة التدريب
. وعالوة على ذلك، )اي انه عينه عشوائية مشروطه( مجموعة البيانات KDD 99 بالمعروف
، اختبار اليقظة، وعامل الوزن. ولغرض االختبار، يتم نورممثل؛ يريتم تعديل العديد من المعا
أيضا اختيار فضاء العينة بشكل عشوائي، الذي يحتوي على عدد من أنماط تكرار الختبار
.االستقرار
ومعدل اإليجابية الخاطئه ب %.8٪ مع معدل دقة 9,.8قد كشفت نتائج هذا البحث عن نسبة
وتمت مقارنة النتائج هذه الدراسه مع الدراسات السابقة % 0.,4ئهومعدل السلبيه الخاط 1,18٪
لها نفس الية األخرى. حيث أظهرت نتائج هذا البحث أداء أفضل من المناهج المقارنة االخرى
النه ال يمكن التحكم supervised learning) وايظا تعتبر جيده جدا نسبة الى التعلم ) ,التعلم
المطلوبه. بالخوارزميه والنتائج

1
Chapter One
Introduction

2
Chapter One
Introduction
1.1 Introduction
Nowadays, no one can deny that security has become a serious problem and necessary
in our life according to the growing of development that the world witnesses. Last few
decades, there is an urgent need to secure the operations in computer systems and
networks for both private and governmental institutions which are relying heavily on
networking and internet. The perspective of security has got involved in the process of
insurance and evaluation of the computer system and its resources in which is connected
on networks such as; stability, flexibility, reliability, confidentiality, availability, and
integrity for most aspects of critical information data.
It is obvious that, researchers recently time have got a promised interest at the
intrusion detection’s area through designing many approaches and methods to get good
results in this field. The main goal of Intrusion detection system (IDS) is to provide
protection against malicious activity and unauthorized access of the network or
computer system by monitoring the traffic data, analyzing audit, log file data.
(IDSs) is to detect attacks against information systems in general, and against
computer systems and networks in particular.
3
1.2 Research Motivation
Many requirements of security in information system need to satisfy secure working
environment, it is necessary to invent a system which is responsible for providing such
requirements. This has inspired the researchers to model IDS, because of lack of the
sufficiency like; anti-virus, and firewalls programs which do not prevent networks from
all attack types.
Moreover, IDS which is based on ANN considered a distinguished technique in
this field, but it does not meet the purpose, since it does not guarantee the learning
process to be stable. For instance, even if the same set of input vectors is continuously
presented to the Neural Network (NN), the winning unit (Node) may continue to
change. One way to prevent such case, is gradually reducing of the learning rate to zero,
thus this will freeze the learned categories. However when this case is carried out
stability gained at the expense of losing plasticity or ability of the network to react to
new data (that means, the network will not be able to learn new categories).
The host-based attacks are generally attacks either built-in machine as hardware or
software intentionally (by design), or attacks from remote distance that target a machine
on a network. These attacks are used to gain access to some features of the machine,
such as user accounts or files on the machine (Smith 2002).

4
1.3 The Problem Statement
IDS based on ANN can be used to detect the intrusion, but there is slight complication
that is the ANN lacks stability in the learning process of detection and classification.
This problem is called stability /plasticity dilemma.
The Adaptive Resonance Theory 1 (ART1) is a solution to such dilemma. So the
researcher proposes an approach based on Carpenter/Grossberg ANN-ART1 and K-
mean clustering to overcome the current problem.
1.4 Contributions
The researcher follows certain steps which are indicated below:
1. Design IDS model to classify normal and attacks with their different types
(Normal, DoS, R2L, U2R, and Prob) .
2. Achieve IDS which is stable in learning stage and final classification’s operation.
3. Apply hybrid system consists of two different classifiers which are:
K-mean cluster algorithm as preliminary classifier.
Carpenter /Grossberg-ART 1 ANN as a key classifier.
4. Achieve IDS which is can minimize FNR and has a small value to FPR.

5
1.5 Objectives of the Research
The main objectives of this research are as follow:
1. Applying the Carpenter/Grossberg Algorithm to detect the intrusion.
2. Using Carpenter/Grossberg Algorithm to improve the convergence speed
3. Making clustering stable in Intrusion Detection.
4. Comparing results of the Carpenter / Grossberg ANN-ART1 with previous
algorithm’s results.
1.6 Questions of the Research
The main questions in this research are identified as following:
By using the above algorithm ART1, can it cluster the data patterns according to
their types (Normal, DoS, R2L, U2R, & Prob)?
Can ART1 algorithm produce high performance for Intrusion Detection (ID)?
Can ART1 algorithm get clustering stable when applying learning and testing
phases for Intrusion Detection (ID)?
Can we use the algorithm to maximize Detection Rate (DR) and minimize the
False Negative Rate (FNR)?

6
1.7 Methodology
There are many research works and applications about the IDS, where it was built
through many techniques such as; statistical and computational methods, data mining,
artificial neural network approaches, and the genetic algorithms. These techniques may
be hybrid (that takes more than one technique).
In this study, the researcher builds a model to simulate intrusion detection system,
which it based on artificial intelligence and machine learning throughout artificial
neural network that performance has been improved by the former use of one of
clustering algorithm as a pre-classifier.
The simulation system uses both; ART1 (which is one of Carpenter/Grossberg’s
ANNs) that it is the key core in this system, and k-mean clustering algorithm.
The simulation system includes three main phases:
1. Preprocessing phase, which contains receive, convert, and cluster the KDD
99 dataset into the categories.
2. Training phase, which trains ART1 neural network.
3. Testing phase, which tests ART1 network by getting best results and ensuring
its stability.
At training phase, the sample space is randomly selected, where all known attack
patterns are selected from KDD 99 dataset.
And also adjust many parameters such as; norm, vigilance test, and weight factor. At
level of the testing, the sample space is also randomly selected, that contains a number
of duplicated patterns in order to test the stability.

7
Chapter Two
Literature Review and Related Works

8
Chapter Two
Literature Review and Related Works
2.1 Introduction
In this chapter, the researcher sheds a light on the previous related works about the field
of intrusion detected system. It tackles related literature on the clustering techniques
including several ways such as; K-mean clustering algorithm, IDS via the use of both;
supervised and unsupervised ANN.
2.2 Literature Review and Related Works
2.2.1 IDS Based on Clustering and Classification
Dipali (2013) applied K-means clustering algorithm for an intrusion detection system to
train KDD dataset that contain normal and attack traffic. She assumed that normal and
malicious traffic form different clusters. The corresponding cluster centroids are used
for efficient distance based on detection of anomalies.
She also provided a specific description of the data mining and anomaly detection
process. Moreover, she implemented k-Means clusters via applied SVMs (Support
Vector Machines), which considered a useful technique for data classification. A
classification task usually involves separating data into training and testing sets. She
used the DARPA 98 Lincoln Laboratory evaluation dataset as training and testing data

9
set. The data consists of unlabeled flow records are divided into clusters of normal and
anomalous traffic.
Sumit , et al (2014) proposed to implement Intrusion Detection System on
each node of the MANET(Mobile Ad-Hoc Networks , consist of peer-to-peer
infrastructure less communicating nodes that are highly dynamic) which is using Zone
Routing Protocol (ZRP) that adds the qualities of the proactive and reactive protocols
for packet flow. To solve the problem of the MANET security is possible that a node
can turn malicious and hamper the normal flow of packets in the MANET. They would
apply effective k-means to disjoint the malicious nodes from the network.
Consequently, it would be no malicious activity in the MANET, and also the normal
flow of packets would be possible (Sumit , et al 2014).
2.2.2 IDS Based on ANN
Amini and Jalili (2004), introduced an Unsupervised Neural Net based Intrusion
Detector (UNNID) system for classifying network traffic using different types of
unsupervised neural nets. The system is used to tune, train and test two types of
Adaptive Resonance Theory (ART) nets, (ART-1 and ART-2). The results show that
ART-1 in 93.5 percent of times and ART-2 in 90.7 percent were able to recognize
attack traffic from normal one.
Xiao and Song (2009) used novel intrusion detection approach based on Adaptive
Resonance Theory (ART) and Principal Component Analysis (PCA) is raised according
to analyzing now intrusion detection methods. (PCA-MART2) model defines as
network behaviors relied upon the datagram. PCA is applied to feature selection about
10
input samples and the multi-layered ART2 is designed to subdivide the decrease
clustering. They stated that the modified algorithm improved the speed and accuracy of
detection. The results indicated that the intrusion detection system based on PCA-
MART2 can detect intrusion behavior in network efficiently.
Srivastav and Challa (2013) indicated that, Intrusion Detection System which
includes two models (Model A and Model B) are designed by integrating layered
framework with neural network. It is observed that Model A considered all features of
training dataset attains high accuracy, the classification has been achieved through the
use of backpropagation neural network (BPN), and ‘trainscg’ as training algorithm is
used to classify the records as normal or attack. On other hand, Model B considered
feature extraction reduces training time but with a slight decrease in success rate of
attack detection, while Principal Component Analysis (PCA) is applied for individual
layer of the features extracting operation. They stated the results as DoS = 99.54, Prob=
95.46, R2L= 99.58, U2R= 90.
2.2.3 IDS Based on Clustering and ANN Hybrid Methods
Wang et al (2010) proposed a new technique, named FC-ANN, based on ANN and
fuzzy clustering. They indicated the general procedure of FC-ANN as: firstly fuzzy
clustering method is for generating different training subsets, via the heterogeneous
training set is divided to several homogenous subsets. Subsequently, based on different
training subsets, different ANN models are trained to formulate different base models.
Thus complexity of each sub training set is reduced and the detection performance is
increased, also gets a less false positive rate and stronger stability for detection process

11
could help IDS achieve higher detection rate. They concluded that the result as the
average accuracy detection rate of FC-ANN is 96.71.
Al-Rashdan (2011) has proposed an intelligent model using Hybrid Artificial
Neural Networks, supervised and unsupervised learning capabilities to classify and / or
detecting network intrusions from the KDDCup'99 dataset. She designed three
cooperative phases by using an enhanced k-means clustering algorithm in Phase-1
"clustering phase", a Hybrid Artificial Neural Network (Hopfield and Kohonen-SOM
with Conscience Function) in Phase-2 "training phase" and a Multi-Class Support
Vector Machines in Phase-3 "testing phase". The Hybrid Neural Network Machine
Learning Model achieved a detection rate of 88%.
In the study of Na'mh (2012), she used Unsupervised Learning (USL) technique
by presenting hybrid intrusion detection system models, by using K-Nearest Neighbor
machine learning algorithm and an enhanced resilient backpropagation artificial neural
network. She listed the system into five main phases: environment phase, dataset
features and pre-processing phase, feature classification K-Nearest Neighbor (KNN)
phase, training the enhanced resilient backpropagation neural network phase and testing
the hybrid system phase. The first use of K-Nearest Neighbor as a machine learning
algorithm was at the first stage of classification, whereas the multilayer perceptron was
used for classification of trained by using an enhanced resilient backpropagation
training algorithm was used in the second stage. She indicated that the hybrid system
(KNN_ERBP) was able to classify normal class, while by using the enhanced resilient
back-propagation was also able to classify intrusions classes with high detection rate
(and with less time) than the normal resilient back propagation.

12
Chapter Three
Intrusion Detection System (IDS)

13
Chapter Three
Intrusion Detection System (IDS)
3.1. Overview
This chapter provides a brief description about the types of IDS, using IDS as
complement to firewall, and provides a general overview about different types of
attacks on different protocols. Also displays valuation criteria to IDS performance and
takes a glimpse of the approach of ANN based on IDS.
3.2. Intrusion Detection and IDS
Singh and Saxena, (2014) said that the Information Technology (IT) was represented as
a primary component for any business organization. Hence, IT provides a strong
platform for a lot of critical services in our society (Singh and Saxena, 2014).
Shaveta et al, (2014) tackled the core idea behind designing the internet is to make
communications between different hosts in order to exchange data between them. For
this purpose, the common protocol used to suit data communication between hosts
called Transmission Control Protocol / Internet Protocol (TCP/IP) protocol. In this
context, internet design supposed that hosts that are working over the network have no
malicious intention. Hence, such assumptions open up this design on many
opportunities for intrusion (Shaveta et al, 2014).

14
The significant increase in using computer networks such as internet makes it
vulnerable to attacks (Sharma et al., 2014). Furthermore, various tools and techniques
were proposed to secure Electronic assets from attacks at both levels individual level
and organizational level (Majeed and Kumar, 2014). According to the National Institute
of Standards and Technology (NIST) intrusion was defined as "The process of
monitoring the events occurring in computer system or network and analyzing them for
signs of possible incidents, which are violation or imminent threats of violation of
computer policies, acceptable use policies, or standard security practices" (Sacrfone
and Mell, 2007). Figure (3-1) shows a general framework of IDS.
Figure 3-1 the General Framework of IDS (Anand A., and Patel, B., 2012)
Several methods were proposed to detect intrusions in network environment such
as: Genetic Algorithm (GA), Artificial Neural Network (ANN) classifier, Modified
Mutual Network (MMN) classifier, Modified Mutual Information Feature Selection
(MMIFS), Linear Correlation Feature Selection (LCFS), and Forward Feature Selection
(FFS) (Dastanpour et al., 2014).

15
Defending computer networks from malicious or unexpected activities lead to
propose several techniques such as IDS (Anand and Patel, 2012). Scarefone and Mell,
(2007) defined the IDS as the software that is responsible for automating intrusion
detection process. Recently, many scientific research works focused on the use of IDS
based on several approaches (Scarefone and Mell, 2007).
Naoum, et al.(2014) made a Steady State Genetic Algorithm (SSGA) is applied
to support IDS by providing the rule pool with additional data, these data can be used in
testing phase to detect the attacks. Thus, they conducted the enhancement of
replacement steady state genetic algorithm to detect intrusions. As well as, they
compared it with the existed studies (Naoum et al. 2014).
Singh et al. (2014) made a comparative study on IDS based on Artificial
Intelligence (AI) techniques. Thus, they used decision trees, and Self Organization
Maps (SOM). Hence, they worked on finding the impact of using these techniques in
detecting intrusions through network environments (Singh et al. 2014).
16
3.3. Firewall
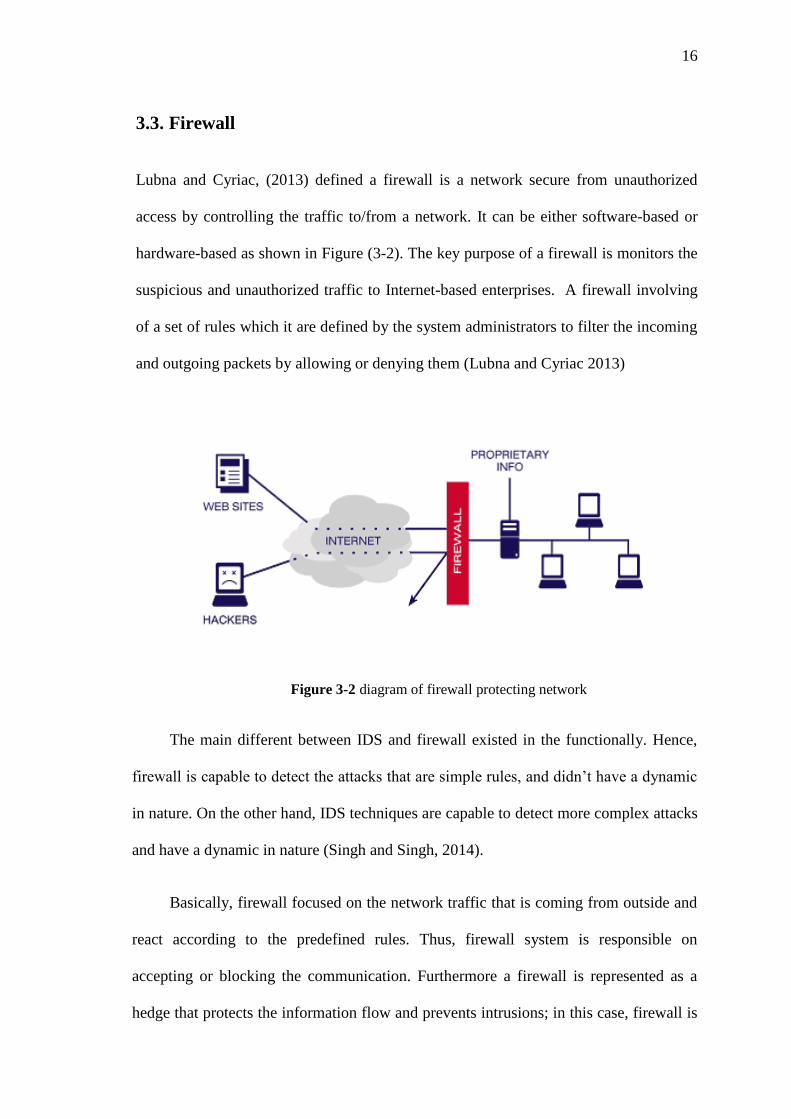
Lubna and Cyriac, (2013) defined a firewall is a network secure from unauthorized
access by controlling the traffic to/from a network. It can be either software-based or
hardware-based as shown in Figure (3-2). The key purpose of a firewall is monitors the
suspicious and unauthorized traffic to Internet-based enterprises. A firewall involving
of a set of rules which it are defined by the system administrators to filter the incoming
and outgoing packets by allowing or denying them (Lubna and Cyriac 2013)
Figure 3-2 diagram of firewall protecting network
The main different between IDS and firewall existed in the functionally. Hence,
firewall is capable to detect the attacks that are simple rules, and didn’t have a dynamic
in nature. On the other hand, IDS techniques are capable to detect more complex attacks
and have a dynamic in nature (Singh and Singh, 2014).
Basically, firewall focused on the network traffic that is coming from outside and
react according to the predefined rules. Thus, firewall system is responsible on
accepting or blocking the communication. Furthermore a firewall is represented as a
hedge that protects the information flow and prevents intrusions; in this case, firewall is
17
capable to prevent some protection not full one, whereas IDS based on detecting
weather the network is under attack or the security imposed by the firewall which has
been penetrated. Intrusion detection process initiated from inside the network, and come
into the action after the suspected intrusion has taken place on the network (Sunke,
2008).
Krishna and Victoire, (2013) found that firewalls have their limitations in some
situations where an Intrusion Detection System does not, this include the following:
The firewall cannot protect against risk associated with connections that bypass
the firewall or it never sees, because not all access to the Internet occurs through
the firewall.
Since not all threats originate outside so the firewall does not protect against
internal threats.
Firewalls itself exposed to attack and tricks such as a common strategy is to use
tunneling to bypass firewall protections.
The variety of operating systems type, and the applications that are supported by
inside the perimeter, this lead to impractical or maybe impossible for the firewall
to scan emails, massages from viruses. Consequently, firewall cannot protect
against the transfer of the infection of programs or files.
It is because of these limitations that intrusion detection systems are needed even
though a firewall may already be in place (Krishna and Victoire, 2013)

18
3.4. Types of Network Attacks
Security is a continue process of protecting an object from unauthorized access. Thus,
that object may be a person, an organization such as businesses, or property such as a
computer system of file (Kizza, 2013). Network environments are exposed from
different types of attacks. Thus, four basic types of attacks are found in computer
network environment: Denial of service, remote to user attack, user to root attacks, and
probe attacks (Ireland, 2013).
1. Denial of Service (DoS) : In this type, the attacker is capable to deny users
access to machine by making computing, or memory resources too busy, or too
full to serve authorized networking requests (Mostaque and Hassan, 2013).
2. Remote to Local (R2L) attack: User send packet to machine over the internet.
Thus, this user does not have an access in order to expose the machine
vulnerabilities and exploit privileges which local user would have on the
computer (Paliwal and Gupta, 2012).
3. User to Root (U2R) attack: In this type, the attacker starts using the system as a
normal user. Hence, the attacker attempts to abuse system vulnerabilities in
order to work on system as a super user and exploit super user privileges
(Paliwal and Gupta, 2012).
4. Probing: In this type, the attacker scans network environment to find a
vulnerabilities or weaknesses on machine or other network devices in order to
exploit them such technique is sued in data mining (Ireland, 2013).

19
Any type of attack found in the network environment could be classified under
these categories (Kayacik, et al 2005). Table (3-1) shows some examples on these
categories.
Categories Attack Examples
DoS Land, Smurf, Neptune, Ping of Death, Back.
R2L
Guess_Passwd, Ftp_Write, Imap, Phf, Multihop, Spy,
Warezclient, Warezmaster,
U2R Perl, Buffer_Overflow, Loadmodule, Rootkit.
Probing Satan, Portsweep, Ipsweep, Nmap.
Table 3-1 some examples on different types of network attacks.
3.5. IDS Techniques
Basically, Gaidhane, et al (2014) showed that there are two primary techniques are used
to detect intruders which are misuse detection, and anomaly detection. In this context,
also Ghandi, (2014) displayed that four main techniques are available in network
environments, which take the responsibility to detect the unauthorized access or
unauthorized users. Thus, these techniques are: Anomaly detection, misuse/signature
detection, target monitoring, and stealth probes (Gandhi 2014). Table (3-2) shows these
techniques in details.

20
IDS Techniques Basic Idea Detection Criteria
Anomaly
Detection
The system establishes line of
usual pattern behavior.
Any behavior differ from stored
behavior is notified as a
possible intrusion.
Misuse /
Signature
Detection
The system is capable to store
unusual patterns of
unauthorized activities which
called Signature.
Any specific number of failed
activities is determined as
possible intrusion.
Target
Monitoring
The system is capable to look
for alteration of specific files
than storing usual or unusual
behaviors.
System uncovers an
unauthorized action after it
occurs. By reversing that action
for specific time interval using
integrity checksum hashes.
Stealth Probes
System is capable to detect any
attacks tries to carry out a
mission over prolonged period
of time.
Any attempts from attacker to
collect much information to find
the weaknesses take long period
of time, it determined as
possible intrusion.
Table 3-2 IDS techniques and its basic idea for detection (Gandhi, 2014).

21
3.6. IDS Classification
Any IDS can be classified based on several categories: Host based IDS (HIDS),
Network based IDS (NIDS) and Stack Based Intrusion Detection System (SIDS)
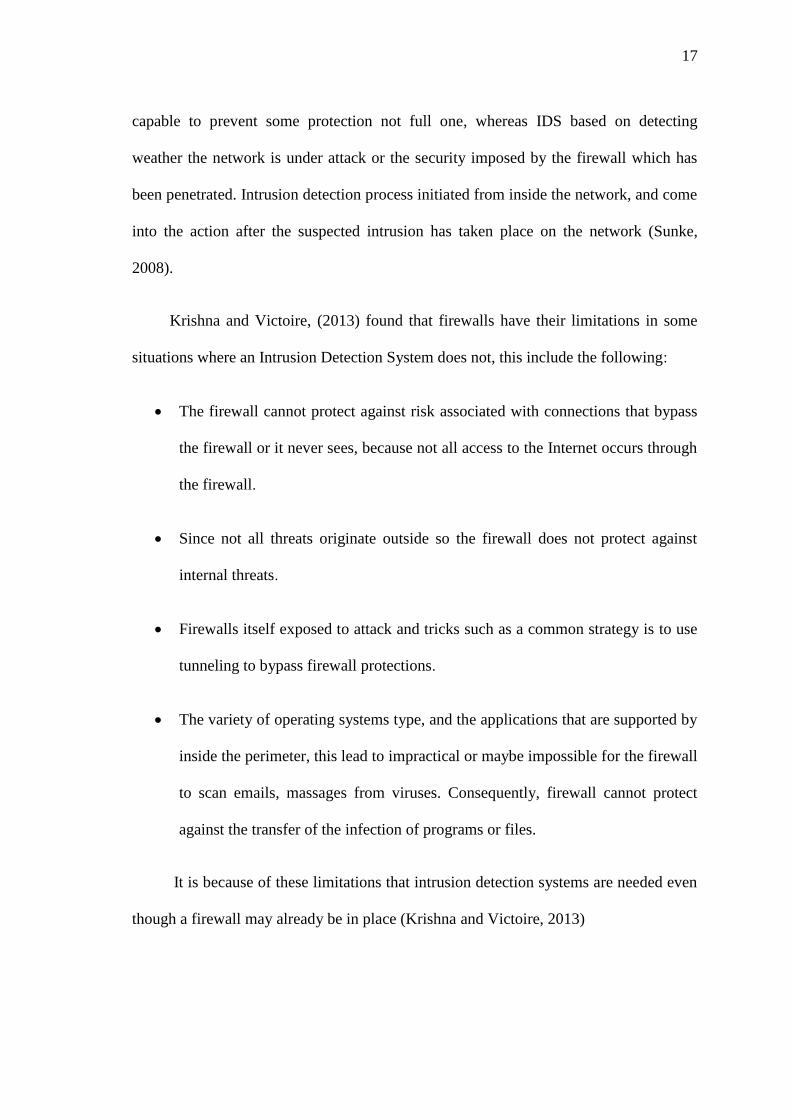
(Boncheva, 2007) and (Vinchurkar and Reshamwala, 2012) as stated in Figure (3-3).
A HIDS examine data on individual computer that is working as a host. Thus, this
category is efficient to detect unauthorized modifications on files by analyzing data that
originate on a computer. Hence, the idea of this category based on aggregating data for
that host and analyzes it locally or by sent it separately to an analysis machine (Gandhi,
2014). HIDS category concentrates on particular host activities (Aziz, et al., 2014). The
network architecture in this category is agent-based. Hence, this agent represents a
software agent, and it is located at each host node which is governed by a system
(Boncheva, 2007).
A NIDS category examines the exchange of data between computers in network
environment. Thus, NIDS analyzed data packets that are traveled over the network.
Hence, the NIDS is responsible to examine and compare these data packets with
empirical data (Gandhi, 2014). NIDS monitor the network communications activities
(Gaidhane, et al., 2014). NIDS provide flexible mean of security administration.
Furthermore, NIDS monitoring and collecting system audit trails in real time by
providing the utilization of Central Processing Unit (CPU) and network (Boncheva,
2007). NIDS category systems are capable to provide network traffic monitoring (Aziz,
et al., 2014).
22
Figure 3-3 Types of intrusion detection systems
A SIDS is latest technology, which works by integrating meticulously with the
TCP/IP stack, allowing packets to be watched as they traverse their way up the OSI
layers. Watching the packet in this way allows the IDS to pull the packet from the stack
before the OS or application has a chance to process the packets (Vinchurkar and
Reshamwala, 2012).
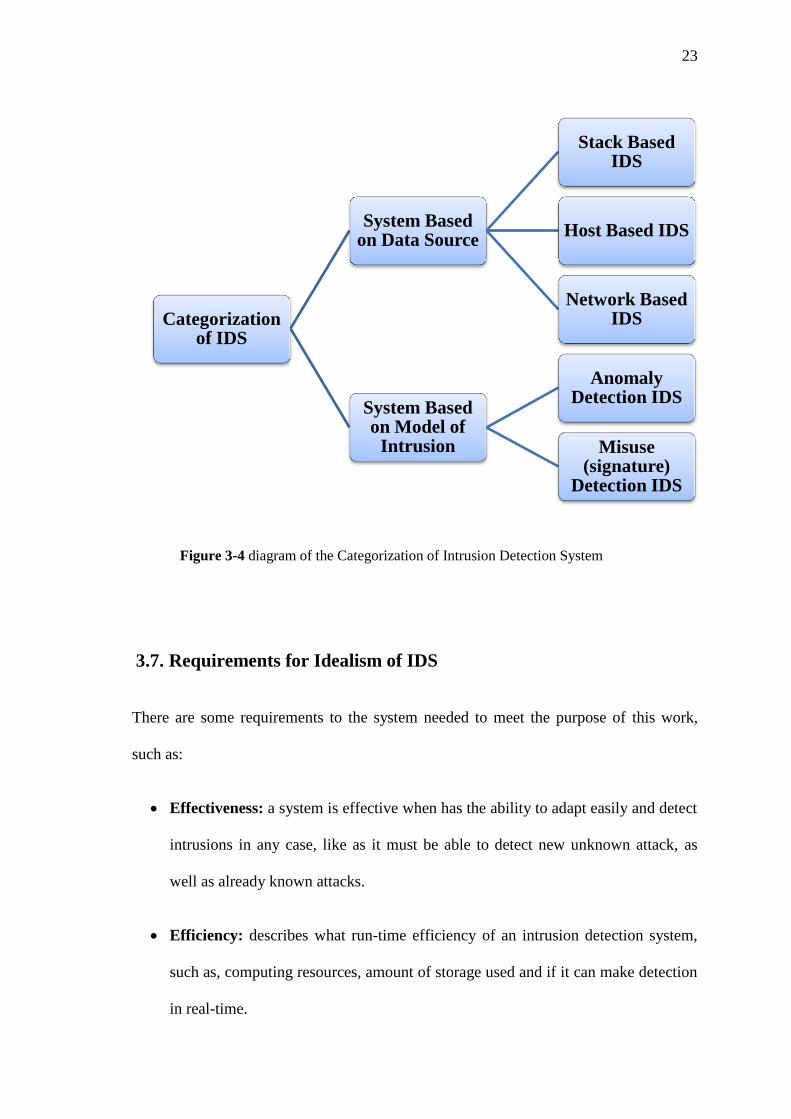
Various classification and techniques of the Intrusion Detection System are
possible as per the different criteria. Initially the categorization can be done as follows
as shown in Figure (3-4)
23
Figure 3-4 diagram of the Categorization of Intrusion Detection System
3.7. Requirements for Idealism of IDS
There are some requirements to the system needed to meet the purpose of this work,
such as:
Effectiveness: a system is effective when has the ability to adapt easily and detect
intrusions in any case, like as it must be able to detect new unknown attack, as
well as already known attacks.
Efficiency: describes what run-time efficiency of an intrusion detection system,
such as, computing resources, amount of storage used and if it can make detection
in real-time.
Categorization of IDS
System Based on Data Source
Stack Based IDS
Host Based IDS
Network Based IDS
System Based on Model of
Intrusion
Anomaly Detection IDS
Misuse (signature)
Detection IDS

24
Continually running: The system must run continually without human
supervision. It must be reliable enough to allow it to run in the background of the
system being observed.
Fault tolerance: the system should be fault tolerant means that there must be
survive a system crash.
Ease of use: the system must be user friendly (i.e. a system must be easy to use
even for the non-expert user).
Security: The system must be difficult to fool and able to resist to all attacks that
are directed to it by monitoring itself to ensure that it has not been subverted.
Interoperability and Collaboration: describes the need of cooperation between
various vendors of the network devices, where the system must send and receive
information from intrusion detection systems.
Transparency: The product evaluation process to system is important
characteristic, because it must deal with changing system behavior over time as
new applications are being added, such as: costs and management.
Consequently all the above listed are the features that an ideal Intrusion Detection
System must have. So that the system becomes perfect to defend the attacks and the
intrusions (Vinchurkar and Reshamwala, 2012) and (Prasad et al 2013).

25
3.8. Passive and Reactive IDS
Na'mh (2012) said that according to the kind of the response to the intrusion notes
Figure (3-5), can be classified the Intrusion Detection System as Passive IDS and
Reactive IDS as following:
Passive IDS: the system detects a suspicious activity, by gathering this
interesting information to be comparing this information with storage
Database and when it realizes it is an attack, it will send this information to
the alarm server to alerts the user. Subsequently the each form of response to
the intrusion is not specifying the nature of detection.
Reactive IDS: performs the same as the Passive IDS when the system detects
an attack, in addition that when the alarm server warns the user, the IDS
collector will send information to the router or the firewall and notify these
devices to block that activity to getting to the network, such as logging off a
user or by reprogramming a firewall to block network traffic from the
suspected malicious source (Na'mh, 2012).
Figure 3-5 Passive & Reactive Intrusion Detection System

26
3.9. Evaluation Criteria of IDS
Al-Rashdan, (2011) enquired about “how we can test these proposed systems”, so the
testing proposed method can provide a good indicator on whether the proposed method
can give high performance compared with others or not in solving problems or trying to
find optimal solution for them.
These measures have been widely used for comparisons between ID methods. But
in case of learning very imbalanced data is lead to the classification accuracy in general
is not often an appropriate measure of performance (Na'mh, 2012).
The effectiveness of an IDS is assessed on how capable the detection method is to
make correct attack detection (Detection Precision). According to the real nature of a
given event compared to an IDS prediction, (Shamshirband, et al 2013). four possible
outcomes which are calculated based on the Confusion Matrix (CM). The CM is a
square matrix where columns correspond to the predicted class, while rows correspond
to the actual classes as shown in Table (3-3) (Elngar, et al 2013) and (Madbouly, et al
2014).
Classified Class
Actual Class Normal Attack
Normal True Negative (TN) False Positive(FP)
Attack False Negative (FN) True Positive(TP)
Table 3-3 Confusion Matrix
27
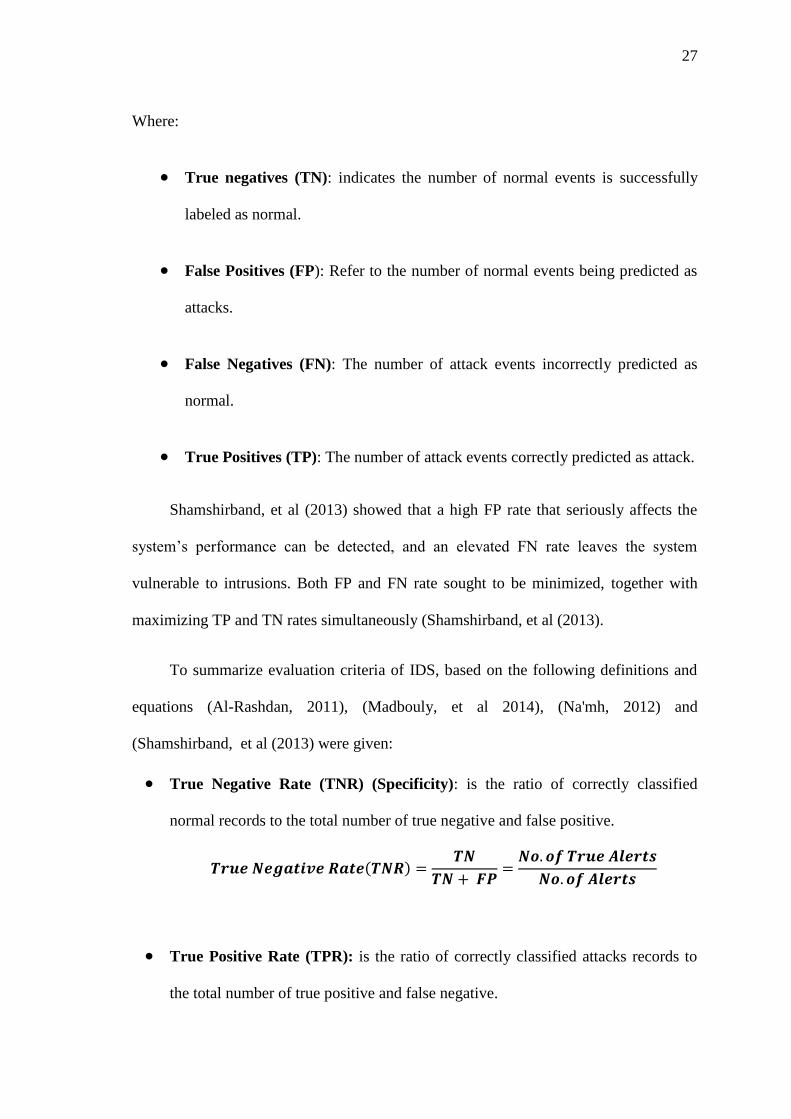
Where:
True negatives (TN): indicates the number of normal events is successfully
labeled as normal.
False Positives (FP): Refer to the number of normal events being predicted as
attacks.
False Negatives (FN): The number of attack events incorrectly predicted as
normal.
True Positives (TP): The number of attack events correctly predicted as attack.
Shamshirband, et al (2013) showed that a high FP rate that seriously affects the
system’s performance can be detected, and an elevated FN rate leaves the system
vulnerable to intrusions. Both FP and FN rate sought to be minimized, together with
maximizing TP and TN rates simultaneously (Shamshirband, et al (2013).
To summarize evaluation criteria of IDS, based on the following definitions and
equations (Al-Rashdan, 2011), (Madbouly, et al 2014), (Na'mh, 2012) and
(Shamshirband, et al (2013) were given:
True Negative Rate (TNR) (Specificity): is the ratio of correctly classified
normal records to the total number of true negative and false positive.
( )
True Positive Rate (TPR): is the ratio of correctly classified attacks records to
the total number of true positive and false negative.

28
( )
False Positive Rate (FPR): the ratio of incorrectly classified normal examples
(false alarms) to the total number of normal examples it is the same as False
Alarm Rate.
( )
False Negative Rate (FNR): is the ratio of incorrectly classified attacks (when
system classify attacks as normal) records to the total number of true positive and
false negative.
( )
Detection Rate (DR): or classification rate for all classes (5 classes) where the
system is evaluated by calculating the corrected classified records for each sub
class (5 classes) of the total number of records.
(i.e. the ratio of correctly classified intrusive examples of the total number of
intrusive examples)
( ) ∑
∑

29
Accuracy Rate (AR): the performance of the system is evaluated by calculating
the ratio of correctly classified records as attacks (either normal or attack) to the
total number of records.
( ) ( )
( )
Precision Rate: is the ratio of true positives to combined true and false positives.
Recall Rate (sensitivity): recall stands for an attack is happened and IDS detects
attacks from really attacks. This formula use TP divide TP adds FN to find recall
value.
F-Measure: is the harmonic mean of recall and precision tends to be closer to the
smaller of the two. Hence a high f-measure value ensures that both recall and
precision are reasonably high.
( )
30
3.10. Artificial Neural Network Approach for IDS
The Artificial Neural Networks (ANNs) are the most commonly used soft computing
approach in Intrusion Detection Systems (IDS), since the ANN has an ability of soft
computing techniques for dealing with uncertain and partially true data makes them
attractive to be applied in intrusion detection (Moradi, and Zulkernine, 2004), and
(Reddy, 2013). The use of neural networks for intrusion detection was chosen because
intrusion detection is a complex problem, and neural network are used to solve complex
problems. Also, the power of neural networks to make sound decisions about the
problem it is knowledgeable about made them a great candidate for detecting anomalous
patterns in a network (Smith, 2002).
Also Wang, et al (2010) explained that the Artificial Neural Networks (ANNs)
can improve the performance of intrusion detection systems (IDS) when compared with
traditional methods. However for ANN-based IDS, detection precision, especially for
low-frequent attacks, and detection stability, are still needed to be enhancing (Wang, et
al. 2010).
When the Neural Network(NN) apply to the Intrusion Detection(ID), must be
display a normal and attacks data(i.e. normal and abnormal behavior ) to train the
Neural Network by automatically adjust coefficients of the Neural Network during the
training phase. After training is accomplished, the performance tests are then conducted
with real network traffic and attacks. Thus apply this approach to Intrusion Detection
(Vinchurkar, and Reshamwala, 2012).

31
A pattern recognition technique is one of the characteristics of ANN, thus it can
be implemented in IDS by using any method of neural networks that has been trained
accordingly. During training, the neural network associates outputs with corresponding
input patterns through optimizing its coefficients. The neural network is determines the
input pattern and attempt to output the consistent class (Reddy, 2013).

32
Chapter Four
Artificial Neural Network (ANN)

33
Chapter Four
Artificial Neural Network (ANN)
4.1 Overview
This chapter describes several topics starting from discussing the emergence of neural
networks and its historical aspects. The architecture of ANN and its features are
defined. As well as, explain the Adaptive Resonance Theory (ART) as a solution for
stability/plasticity dilemma, network structure, and the analytical study of ART1
algorithm.
4.2 Using Neural Network for IDSs
Traditional IDSs are based on the profile of attacks or expert rules. Hence, it may be not
able to discover the new version of this malicious activity, which has been modified by
an attacker in order to pass through the firewall system when did not update it. The
neural networks could be a good solution for detection of a well-known attack because
of their generalization feature; it is able to operate with imprecise and incomplete data.
It means that they can recognize also patterns not presented during a learning phase
(Kukielka, 2008). In the following we addressed the main features for this purpose:
Neural network algorithms, supervised, unsupervised or reinforcement can
produce high performance with unique properties for IDS (Oks¨uz, 2007)
Neural Network has Flexibility.
The ability to process and analyzing data from a number of sources in a non-
linear relation even if the data is incomplete or distorted.

34
Because it has predictions capability to the detection this lead to the inherent
speed for outputs.
It can predict where these events, intrusion, are likely to occur in the attack.
Neural Network observed and tracking the subsequent occurrence of these
events(abnormal activities), for improving the analysis and learning of the
events and possibly conducting defensive measures before the attack is
successful (Pervez, 2006).
4.3 The Implementations of ANN
ANN refers to a group of neurons that perform or work together to solve a special
function and process information (Beqiri et al., 2010). The learning criteria in this type
could be supervised or unsupervised. ANN is a system simulating a work of the neurons
in the human brain (e.g. processing models in the brain is inspired by the nervous
system). Hence, the processing system in ANN is implemented as neuron which called
capabilities (Beqiri et al., 2010).
Basically, three layers are presented in a typical ANN. Thus, each layer has it own
responsibilities such as emulating dendrites of the biological neuron, activating
computer system functions, and emulating an axon of the biological neuron. In this
context, these layers called input, hidden, and output respectively. Furthermore, each
layer is composed of one or more nodes which could be classified into a process
element, neurons, or the communication paths between them. Figure (4-1) shows an
illustration of these layers and the relationship between them.

35
Some ANN architectures provide a feedback flow between the input and the
output nodes. Consequently, the hidden nodes are produced by the input layer nodes
after carrying out the hidden relationships. Thus, the hidden layer contains the
interaction weight between input nodes. The importance of a particular input can be
intensified by the weights that simulate biological neuron’s synapses. The input layer
represents the stimulus or information forwarded to the network by the input signals are
multiplied by the values of weights, and next the results are added in the summation
block. Hence, the summation is sent to the activation block in order to be processed by
the activation function. Consequently, the output layer is the final product of the neural
processing.
Figure 4-1 Structure of a simple fully-connected neural network with three layers
36
4.4 Artificial Neuron Model
The artificial neuron is basic building block of every ANN, and it is represented as a
Process Elements (PEs) (Zurada, 1992). Every neuron model consists of a processing
element with synaptic input connections and a single output (Zurada, 1992). The
artificial neuron model was represented as simple mathematical models which contain
three primary set rules. These rules are reception and multiplication rule, summation
rule, and the activation rule.
In the reception and multiplication rule, the assumptions from the previous studies
showed that the artificial neuron should have a local memory in order to implement
localized data processing operations. In this context, the artificial neuron act as the
receptor of a set of ’n’ inputs xi arrives either from environment or from the output of
other neurons in the neural network, when (i = 1, 2,……, n). Thus, each input is
weighted before it reaches the main body of processing element by connection strength,
or the weight factor corresponding to the synaptic strength (i.e. every input value is
multiplied with the individual weight) (Sivanandam, 2009).
Consequently, the amount of information about the input that is required to solve
the problem is stored in the form of weights. The weighting factor in the reception and
multiplication rule is limiting or amplified the input signals, in order to constitute the
special connectivity between the signal source and the neuron. Hence, the learning
process would adapt these weights to the specific problem (Lara, F., 1998).
In the summation rule, the summation is executed for all weighted inputs and bias
by the respective synapses of the neuron (Hajek, 2005). In this context, the core idea of
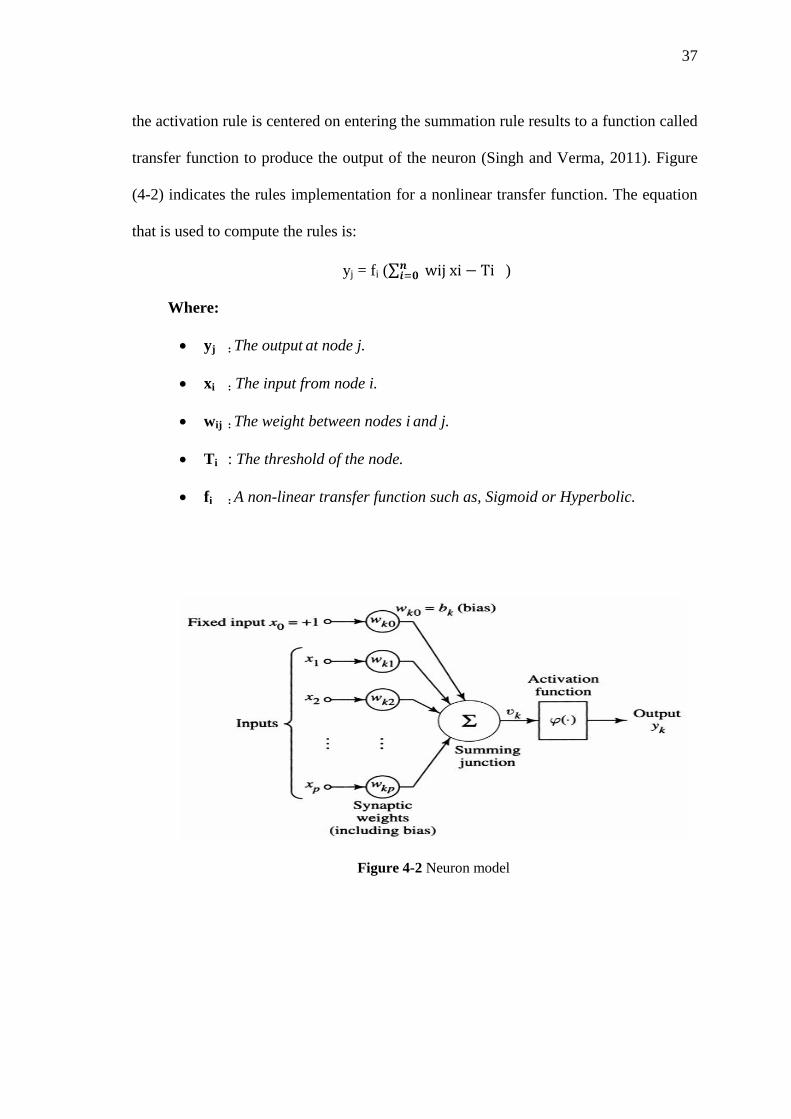
37
the activation rule is centered on entering the summation rule results to a function called
transfer function to produce the output of the neuron (Singh and Verma, 2011). Figure
(4-2) indicates the rules implementation for a nonlinear transfer function. The equation
that is used to compute the rules is:
yj = fi (∑ )
Where:
yj : The output at node j.
xi : The input from node i.
wij : The weight between nodes i and j.
Ti : The threshold of the node.
fi : A non-linear transfer function such as, Sigmoid or Hyperbolic.
Figure 4-2 Neuron model
38
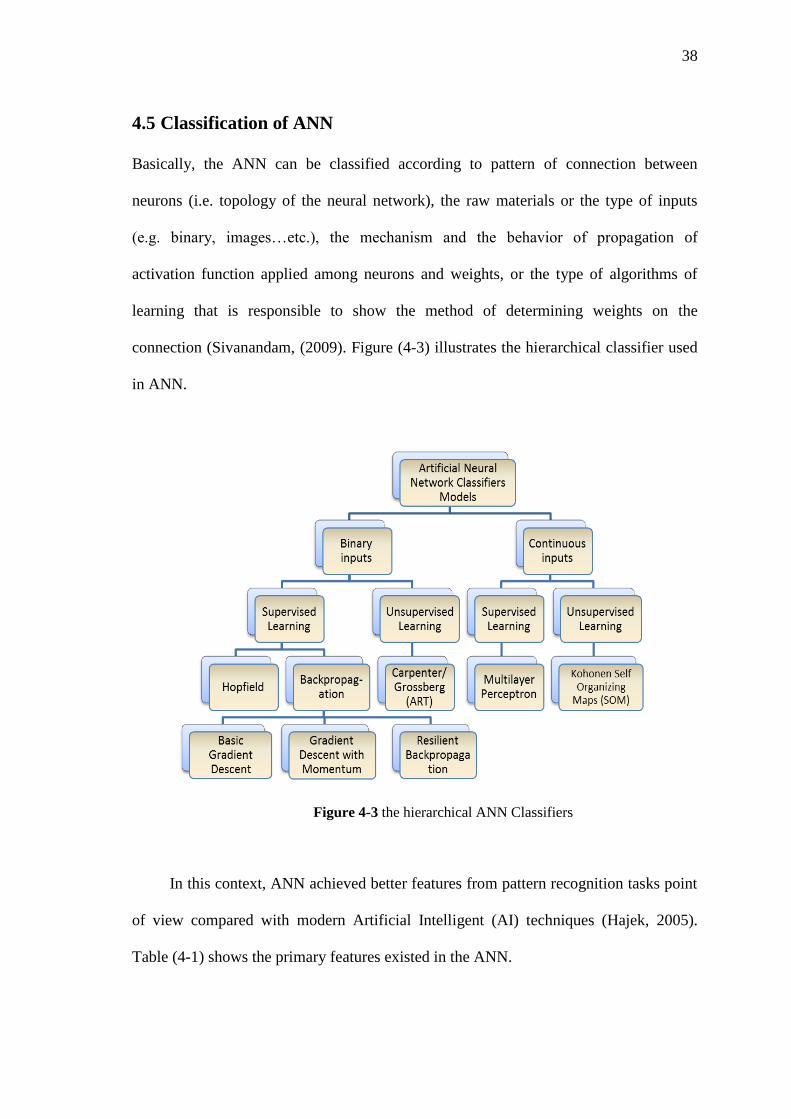
4.5 Classification of ANN
Basically, the ANN can be classified according to pattern of connection between
neurons (i.e. topology of the neural network), the raw materials or the type of inputs
(e.g. binary, images…etc.), the mechanism and the behavior of propagation of
activation function applied among neurons and weights, or the type of algorithms of
learning that is responsible to show the method of determining weights on the
connection (Sivanandam, (2009). Figure (4-3) illustrates the hierarchical classifier used
in ANN.
Figure 4-3 the hierarchical ANN Classifiers
In this context, ANN achieved better features from pattern recognition tasks point
of view compared with modern Artificial Intelligent (AI) techniques (Hajek, 2005).
Table (4-1) shows the primary features existed in the ANN.
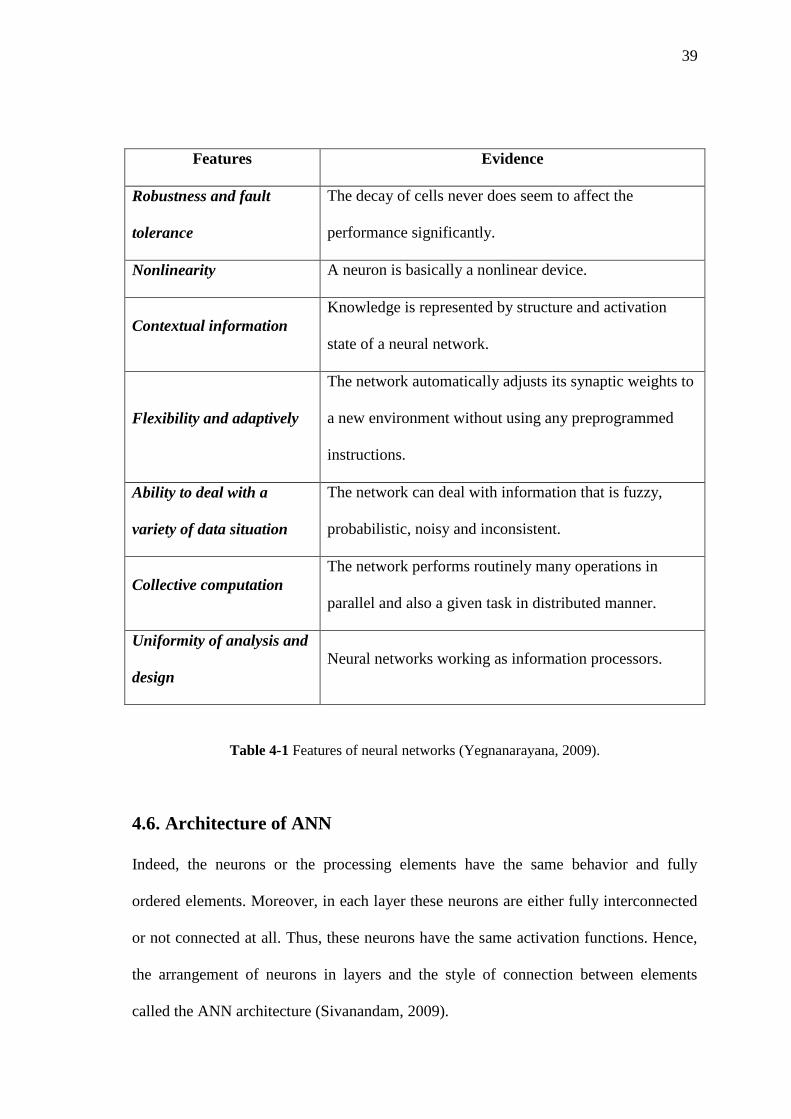
39
Features Evidence
Robustness and fault
tolerance
The decay of cells never does seem to affect the
performance significantly.
Nonlinearity A neuron is basically a nonlinear device.
Contextual information
Knowledge is represented by structure and activation
state of a neural network.
Flexibility and adaptively
The network automatically adjusts its synaptic weights to
a new environment without using any preprogrammed
instructions.
Ability to deal with a
variety of data situation
The network can deal with information that is fuzzy,
probabilistic, noisy and inconsistent.
Collective computation
The network performs routinely many operations in
parallel and also a given task in distributed manner.
Uniformity of analysis and
design
Neural networks working as information processors.
Table 4-1 Features of neural networks (Yegnanarayana, 2009).
4.6. Architecture of ANN
Indeed, the neurons or the processing elements have the same behavior and fully
ordered elements. Moreover, in each layer these neurons are either fully interconnected
or not connected at all. Thus, these neurons have the same activation functions. Hence,
the arrangement of neurons in layers and the style of connection between elements
called the ANN architecture (Sivanandam, 2009).
40
The external specification of the problem represented as a set which determine the
number of inputs to the target network. Thus, if the neuron has received one input then
it is called single-input neuron. Otherwise, it is called Multiple-Input Neuron when the
neuron has more than one input (Hagan et al., 1996). Neural networks are often
classified as single layer or multilayer (Fausett, 2008).
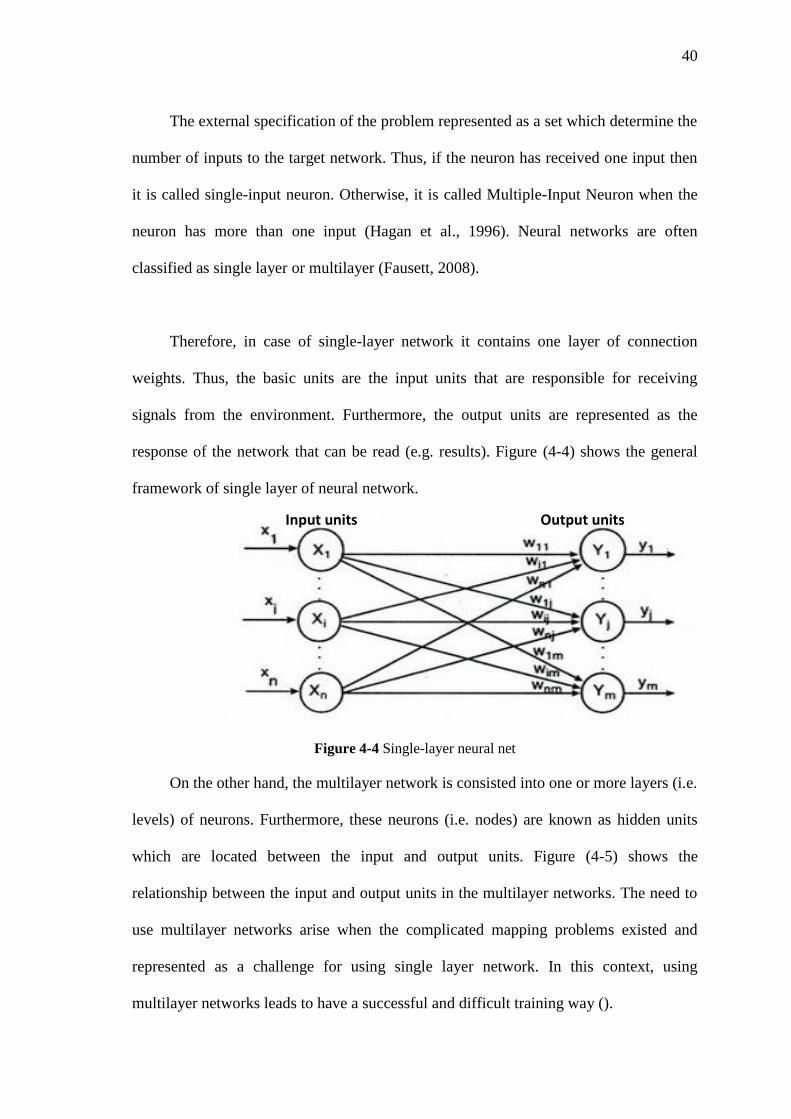
Therefore, in case of single-layer network it contains one layer of connection
weights. Thus, the basic units are the input units that are responsible for receiving
signals from the environment. Furthermore, the output units are represented as the
response of the network that can be read (e.g. results). Figure (4-4) shows the general
framework of single layer of neural network.
Figure 4-4 Single-layer neural net
On the other hand, the multilayer network is consisted into one or more layers (i.e.
levels) of neurons. Furthermore, these neurons (i.e. nodes) are known as hidden units
which are located between the input and output units. Figure (4-5) shows the
relationship between the input and output units in the multilayer networks. The need to
use multilayer networks arise when the complicated mapping problems existed and
represented as a challenge for using single layer network. In this context, using
multilayer networks leads to have a successful and difficult training way ().
Input units Output units

41
Figure 4-5 A multilayer neural networks
In order to determine the complexity of a specific function, it is necessary to
specify the functions that are almost have arbitrary complexity with the number of
layers (i.e. the number of hidden layers). Therefore, both the number of units in each
layer and the number of hidden layers have a relationship with function's complexity
(Eluyode. and Akomolafe, 2013).
4.7. Models of ANN
Two primary models are found in the field of ANN. Feed-Forward Networks (FFN)
model is capable to allow signals to be transferred in the forward directions (i.e. from
the input toward the output units). This model is represented depending on the
association between inputs and outputs. Hence, in this model no feedback or cycles
which leads to make isolation between input and output units (i.e. the output of any
layer does not affect the same layer input units (King and Pribram, 2013).

42
The second model is called Feedback networks. The basic idea behind this model
is to allow signals to be propagated in form of bidirectional by introducing cycles in the
network. In this model the outputs are depend on the inputs and on the previous input as
well. In this scenario, the feedback network model is dynamic and extremely
complicated model. Hence, there are continuous changes until reach the equilibrium
point (Eluyode and Akomolafe, 2013). Figure (4-6) shows an illustration of feedback
network architecture.
Figure 4-6 A diagram of feed-forward & feedback networks

43
4.8. ANN Learning
Basically, many studies showed the importance of learning processes in ANN. Thus,
these studies focused on showing the main rules based on adjusting the weights of
network (Haykin 2004). The learning rules which are found in the field of ANN are
summarized in Table (4-2) that shows each learning rule and its goal.
Learning Rules The main target
Error-correction learning
rule
The goal is to minimize the cost function to correct the
errors (e.g. Delta Rule or Widrow-Hoff).
Hebbian learning rule
These are the oldest and most famous of all learning rule.
It is used to change weights on connections from the
output to the input layer. As a result, an input pattern calls
a pattern on the output layer, which in turn of projects the
prototype of the winning group back onto the input layer.
Competitive learning rule
A process in which the output layer neurons compete
among themselves to acquire the ability to fire in
response to a given input patterns. A winner-take-all CLN
(Competitive Learning Network) consists of an input
layer and a competition, or output layer.
Memory–Based learning
rule
All algorithms in this category involve two essential
ingredients:
- Criterion used for defining the local neighborhood
of the test vector X,
- Learning rule applied to the training examples in
the local neighborhood of X.
Boltzmann learning rule
Can classified it within a stochastic learning algorithm
derived from ideas rooted in statistical machines. The
neurons constitute a recurrent structure and they operate
in a binary manner. The machine is characterized by an
energy function E.
Table 4-2 ANN learning rules (Haykin, 2004).

44
4.9. Learning Models
ANN learns by training and the type of learning determined by the manner in which the
parameter changes. Learning process in ANN can be classified into:
Supervised learning Model
Supervised learning is needed to external teacher to assist in learning the neural network
by routing the neural network what the desired output to a given motivation should be.
The desired output is then used to create an error signal that adapts the weights of the
network by comparing each current output with a desired output to an input signal as
shown in figure (4-7) (Priddy and Keller 2005). An important concerning is the problem
of error convergence, which is the minimization of error between the desired output and
computed unit values; the aim is to determine a proper set of weights which minimize
the error E by:
E=|| Z – Y ||
Using Mean Square Error (MSE) as following:
∑( )
Where z is the desired output and y is the ANN computed value (current output).
Figure 4-7 Block diagram of supervised-learning model
45
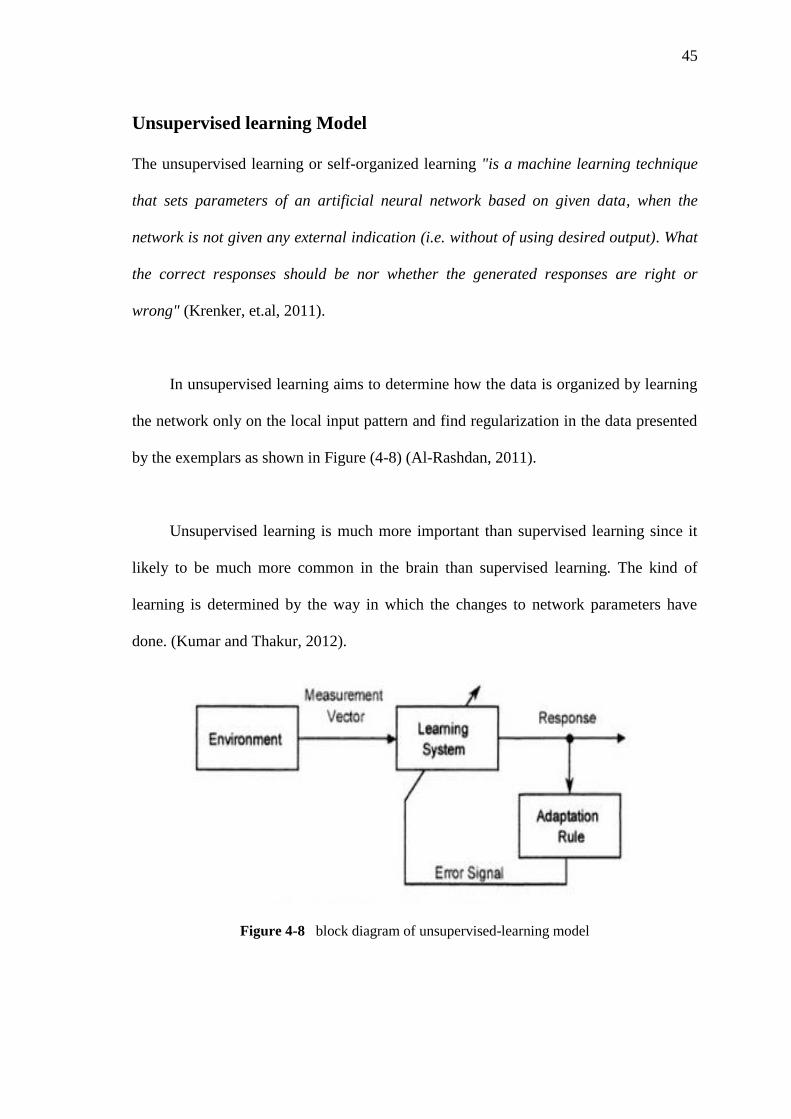
Unsupervised learning Model
The unsupervised learning or self-organized learning "is a machine learning technique
that sets parameters of an artificial neural network based on given data, when the
network is not given any external indication (i.e. without of using desired output). What
the correct responses should be nor whether the generated responses are right or
wrong" (Krenker, et.al, 2011).
In unsupervised learning aims to determine how the data is organized by learning
the network only on the local input pattern and find regularization in the data presented
by the exemplars as shown in Figure (4-8) (Al-Rashdan, 2011).
Unsupervised learning is much more important than supervised learning since it
likely to be much more common in the brain than supervised learning. The kind of
learning is determined by the way in which the changes to network parameters have
done. (Kumar and Thakur, 2012).
Figure 4-8 block diagram of unsupervised-learning model

46
Reinforcement Learning Model
The reinforcement learning is a type of learning may be considered as an intermediate
form of the supervised learning, which the system is provided with the desired output,
and the unsupervised learning, in which the system gets no feedback at all (Dongare, et.
al, 2012).
In this technique the learning machine does some action on the environment and
receives a feedback response from the environment. Hence, to tell whether the output
response is right or wrong. In contrast, there are no information is provided on what the
right output should be. The weights adjustments are continued until equilibrium state
occurs. Figure (4-9) show the block diagram of reinforcement learning model.
Figure 4-9 block diagram of reinforcement learning model.
Semi-Supervised learning Model
Al-Rashdan, (2011) defined the Semi-supervised learning is a relatively new area of
research which combines unsupervised and supervised learning approaches (Al-
Rashdan, 2011). Generally, these approaches use unsupervised learning techniques to
learn the structure of data, making it easier to identify the ‘most interesting’ examples in
a training set. This enables a supervised learning technique to gain better performance
with fewer labeled examples.

47
Hybrid learning
Hybrid Learning is the newer learning technique. Thus, it is a combination between
supervised learning and unsupervised learning.
4.10. The stability-plasticity dilemma
One of the drawbacks which is facing artificial and biological neural systems is the
stability-plasticity dilemma. The basic idea is that learning in a parallel and distributed
system requires plasticity for the integration of new knowledge, but also stability in
order to prevent the forgetting of previous knowledge. The old learning being constantly
forgotten when increasing the plasticity, also, increasing stability will impede the
efficient learning at the level of the synapses (Mermillod et al 2013).
Freeman and Skapura, (1991) have been describing what Stephen Grossberg calls
the stability/ plasticity dilemma by following questions:
How can a learning system remain adaptive (plastic) in response to
significant input, yet remain stable in response to irrelevant input patterns?
How does the system known to switch between its plastic and its stable
modes?
How can the system retain previously learned information while continuing
to learn new things? (Freeman and Skapura, 1991)
Grossberg and Carpenter have developed adaptive resonance theory (ART) to
answers such questions and solving the stability/plasticity dilemma by adding a

48
feedback mechanism between the competitive layer and the input layer of a network.
This feedback mechanism facilitates the learning of new information without destroying
old information, automatic switching between stable and plastic modes, and
stabilization of the encoding of the classes done by the nodes. The results from this
approach are (ART family) neural network architectures that are particularly suited for
pattern classification problems in realistic environments.
4.11. Adaptive Resonance Theory (ART)
The ART was proposed to deal with the forgetting problem of ANNs. Furthermore, this
forgetting poses a problem for traditional ANNs, because the previous learning is fading
with time and prone to forget when is not revised a long time, even as the ANNs
continues to learn newer rules (Shukla et al, 2012).
Many types of ART were found in the field of ART. Each ART type have its own
core idea such as ART1, ART2, ART3, Fuzzy ART, ARTMAP, and Fuzzy ARTMAP
(Grossberg, 2013). Table (4-3) shows the basic idea for ART types. In this research, we
focused in only ART1 algorithm, which will be explained in detail and applied in the
intrusion detection system simulation.

49
ART Type
Supervised /
Unsupervised
Learning
The basic idea
ART 1 Unsupervised Is the simplest variety of ART networks,
accepting only binary inputs.
ART 2 Unsupervised Extends network capabilities to support
continuous inputs.
ART 3 Unsupervised
Is network performs parallel searches of
distributed recognition codes in
multilevel network hierarchy.
Fuzzy ART Unsupervised
The network is almost exactly the same
as ART1, except that it can also handle
continuous input pattern implements
fuzzy logic into ART’s pattern
recognition.
ARTMAP Supervised
Also known as predictive ART combines
two slightly modified ART-1 or ART-2
units into a supervised learning structure.
Fuzzy
ARTMAP Supervised
Is merely ARTMAP using fuzzy ART
units, resulting in a corresponding
increase in efficacy.
Table 4-3 the types of ART techniques and its analysis (Priddy and Keller 2005).

50
4.12. ART1 Learning
The ART1 network has two separate learning laws (Hagan,1996):
X connections from F1 layer to F2 layer, it uses a type instar learning to learn to
recognize a set of prototype patterns.
Y connections weight from F2 layer to F1 layer and also called it expectations
pattern, uses outstar learning in order to reproduce (or recall) a set of prototype
patterns.
Freriks, et.al (1992) confirm when implementing ART1training algorithm, the F2
layer nodes produces output Y (expectations pattern) is associated with input vector S,
this output node represents a cluster. The combining input vector into the cluster to
stress this relation between them. The way this is done in ART1 is a winner-take-all
method, which means, that only weights to and from the winning node j are allowed to
change. Thus Adaptive Resonance name come from weights will be adapted if input
pattern and LTM-prototype resonate, i.e. weights only change if an association is made.
During learning, bij weights and tji weights have to be distinguished. The bij
vector in LTM to the winning node becomes:
In which L can be seen as a normalization parameter, where L > 1
Adjustment of the top-down vector from the winning node is easier:

51
The type of learning used here is so called fast learning, which means that an
input is stored into LTM in only a few learning cycles. Learning in this ART network is
even very fast. After adjustment of the weights, the input is totally incorporated into
LTM. It’s clear from these equations becomes the prototypes in LTM are smaller during
learning. The process of blend of fast learning and prototypes which are decreasing, this
will lead to changing prototypes very often.
When the LTM is not totally adapted to the present input pattern during one
learning cycle but only partially, that operation is called slow learning is the opposite of
fast learning. Only if the same input pattern is applied to the network and assigned to
the same cluster repeatedly it can be totally stored into LTM. In this way prototypes can
be a mixture of the patterns which are stored into the same cluster, but it can take a long
time before LTM stabilizes.
4.13. Resonance of ART1
It’s not necessary to update the bij connections weight and tji connections weights in the
same time. Whenever the input pattern X and the F2 output Y (i.e. expectation) have an
adequate match (e.g. similarity factor), as determined by orienting subsystem (i.e.
vigilance test), both bij and tji are adapted. This process of matching, and subsequent
adaptation, is referred to as resonance, which is the name of adaptive resonance theory
(Hagan, 1996).

52
Chapter Five
Proposed Model and Methodology of the IDS
Based on (Carpenter/Grossberg-ART1ANN)
53
Chapter Five
Proposed Model and Methodology of the IDS based on
(Carpenter/Grossberg-ART1ANN)
5.1 Introduction
In different approaches, there are many researchers that have attempted and successfully
used neural networks for intrusion detection. This chapter shows the IDS model which
used KDD 99 dataset as an intrusion environment in order to train this model, intended
to classify the normal and attack patterns and the type of the attack. Besides, the
researcher clarifies all phases that include its units in details.
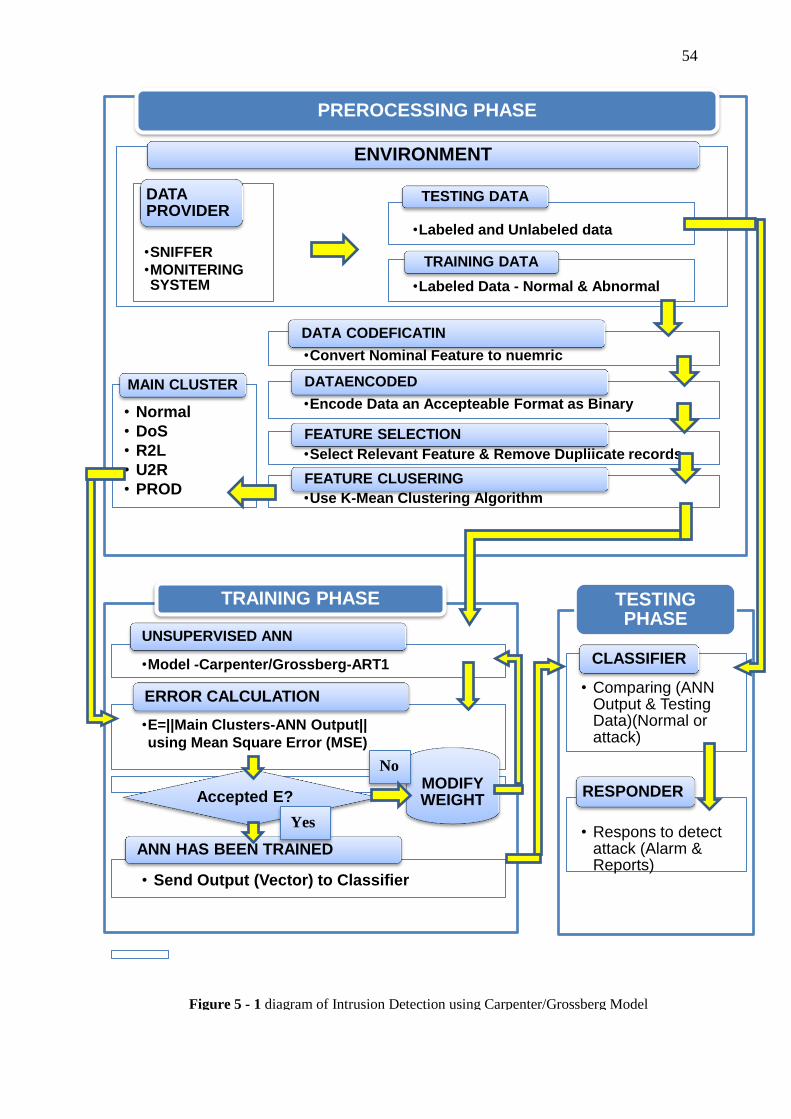
5.2 Proposed Model
In this study, the researcher builds a model IDS, which it depended on artificial
intelligence and machine learning via artificial neural network that its performance has
been enhanced by the former application of one of clustering algorithm as initial
classifier.
The IDS model uses both; unsupervised learning of ART1 (which is one of
Carpenter/Grossberg’s ANN) that it is the main part in this system and k-mean
clustering algorithm (which is considered machine learning) as shown in Figure (5-1).
The simulation system includes three main phases:
1. Preprocessing, which contains receive, convert, and cluster the categories.
2. Training phase, which trains ART1 neural network.
3. Testing phase, which tests ART1 network by getting best results and ensuring its
stability.
54
PREROCESSING PHASE
• Normal
• DoS
• R2L
• U2R
• PROD
MAIN CLUSTER
TRAINING PHASE
•Model -Carpenter/Grossberg-ART1
UNSUPERVISED ANN
•E=||Main Clusters-ANN Output||
using Mean Square Error (MSE)
ERROR CALCULATION
Accepted E? MODIFYWEIGHT
• Send Output (Vector) to Classifier
ANN HAS BEEN TRAINED
TESTING PHASE
• Comparing (ANN Output & Testing Data)(Normal or attack)
CLASSIFIER
• Respons to detect attack (Alarm & Reports)
RESPONDER
No
Yes
ENVIRONMENT
•SNIFFER
•MONITERING SYSTEM
DATA PROVIDER
•Labeled and Unlabeled data
TESTING DATA
•Labeled Data - Normal & Abnormal
TRAINING DATA
Figure 5 - 1 diagram of Intrusion Detection using Carpenter/Grossberg Model
•Convert Nominal Feature to nuemric
DATA CODEFICATIN
•Encode Data an Accepteable Format as Binary
DATAENCODED
•Select Relevant Feature & Remove Dupliicate records
FEATURE SELECTION
•Use K-Mean Clustering Algorithm
FEATURE CLUSERING

55
5.3 The Proposed Model Phases
Our proposed model structure is composed of three main phases; preprocessing phase,
training phase, and testing phase. Each phase represents and feeds the next phase with
the needed data in an efficient format, as an attempt to get more workflow and efficient
intrusion detection system.
5.3.1. Preprocessing Phase
The preprocessing phase consists of several units. It receives and collects traffic data
from external world (environment), selects appropriate features, converts features into
numerical form and then encodes into acceptable format as a binary based on ANN
Algorithm, and then sends this coded data to the clustering unit. The description of
units works as follow:
(A) The Environment Unit
This work deals with KDD Cup 99 intrusion detection dataset in which provides
designers for intrusion detection systems (IDSs) with a benchmark on which to
evaluate different methodologies. The KDD Cup 99 dataset, originally developed by
the DARPA1998 IDS evaluation program, DARPA’98 is about 4 gigabytes of
compressed record (binary) tcpdump data of 7 weeks of network traffic, which can be
processed into about 5 million connection records; each one contains about 100 bytes.
The two weeks of test data have about 2 million connection records (Tavallaee, 2009),
(Song et al., 2014).
56
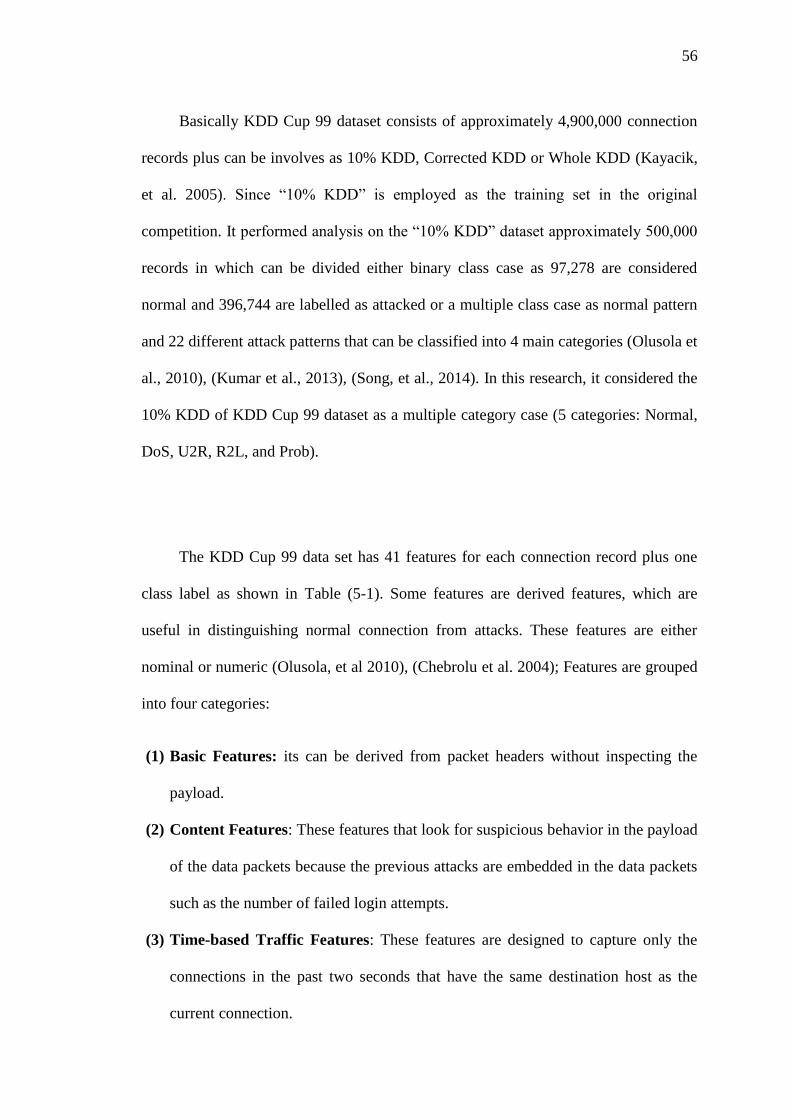
Basically KDD Cup 99 dataset consists of approximately 4,900,000 connection
records plus can be involves as 10% KDD, Corrected KDD or Whole KDD (Kayacik,
et al. 2005). Since “10% KDD” is employed as the training set in the original
competition. It performed analysis on the “10% KDD” dataset approximately 500,000
records in which can be divided either binary class case as 97,278 are considered
normal and 396,744 are labelled as attacked or a multiple class case as normal pattern
and 22 different attack patterns that can be classified into 4 main categories (Olusola et
al., 2010), (Kumar et al., 2013), (Song, et al., 2014). In this research, it considered the
10% KDD of KDD Cup 99 dataset as a multiple category case (5 categories: Normal,
DoS, U2R, R2L, and Prob).
The KDD Cup 99 data set has 41 features for each connection record plus one
class label as shown in Table (5-1). Some features are derived features, which are
useful in distinguishing normal connection from attacks. These features are either
nominal or numeric (Olusola, et al 2010), (Chebrolu et al. 2004); Features are grouped
into four categories:
(1) Basic Features: its can be derived from packet headers without inspecting the
payload.
(2) Content Features: These features that look for suspicious behavior in the payload
of the data packets because the previous attacks are embedded in the data packets
such as the number of failed login attempts.
(3) Time-based Traffic Features: These features are designed to capture only the
connections in the past two seconds that have the same destination host as the
current connection.

57
(4) Host-based Traffic Features: Host based features are therefore designed to
assess attacks, which span intervals longer than two seconds, by Utilize a
historical window estimated over the number of connections to the same
destination host. (Chebrolu and et al. 2004), (Kayacik et al. 2005), (Tavallaee,
2009).
No Feature Name Feature
Type No Feature Name
Feature
Type
1 Duration Cont.
Ba
sic featu
res of in
div
idu
al T
CP
con
nectio
ns.
22 is_guest_login Disc
2 protocol_type symbolic 23 count Cont. Tra
ffic featu
res usin
g a
two
-seco
nd
time.
3 Service symbolic 24 serror_rate Cont.
4 Flag symbolic 25 rerror_rate Cont.
5 src_bytes Cont. 26 same_srv_rate Cont.
6 dst_bytes Cont. 27 diff_srv_rate Cont.
7 Land Disc. 28 srv_count Cont.
8 wrong_fragment Cont. 29 srv_serror_rate Cont.
9 urgent Cont. 30 srv_rerror_rate Cont.
10 Hot Cont.
Co
nten
t featu
res in a
con
nectio
n su
gg
ested b
y d
om
ain
kn
ow
ledg
e.
31 srv_diff_host_rate Cont.
11 num_failed_logins Cont. 32 dst_host_count Cont.
12 logged_in Disc 33 dst_host_srv_count Cont.
13 num_compromised Cont. 34 dst_host_same_srv_rate Cont.
14 root_shell Cont. 35 dst_host_diff_srv_rate Cont.
15 su_attempted Cont. 36 dst_host_same_src_port_rate Cont.
16 num_root Cont. 37 dst_host_srv_diff_host_rate Cont.
17 num_file_creations Cont. 38 dst_host_serror_rate Cont.
18 num_shells Cont. 39 dst_host_srv_serror_rate Cont.
19 num_access_files Cont. 40 dst_host_rerror_rate Cont.
20 num_outbound_cmds Cont. 41 dst_host_srv_rerror_rate Cont.
21 is_hot_login Disc 42 Lable Symbolic
Table 5-1 KDD Cup 99 Feature Columns Name and Type

58
The function of environment unit provides the dataset to the system, and then the
system selects sample space randomly for training dataset (10,000 records are Labeled
Data - Normal and Abnormal), Since the records number for each attack is not equal in
dataset, thus the selected sample space in training phase is not equal in term of attack
type. Consequently the chosen mechanism progressively begins from the smallest
representation to normal and attack type are more appearing in dataset. Whereas the
system randomly selects sample space in testing dataset as (10,000 records are Labeled
and 3000 records Unlabeled data - Normal and Abnormal).
(B) Data Codification Unit
The raw data from the above unit will be converted from its current unacceptable
format such as symbolic (nominal) into an accepted numeric ANN format. To meet
this we will apply converting data depending on the column content analyzing as
follow:
Nominal 2 Numeric: when a feature contains a symbolic (nominal) value such as
protocol, service, flag and label are transformed to numeric values using customize
transformation table. Each column has its own customization table. This step
should be applied for the testing data set as done in the training data set. As shown
in Tables (5-2) and (5-3).
Implemented scaling: when a feature contains a big number values or a floating-
point numbers (between 0 and 1), such as (650,220,000), (0.1, 0.004) respectively,
then it would be coded to serial numbers as demonstrated in Table (5-5) Carpenter/
Grossberg (ART1) Net is used with discrete binary input. Therefore, it is difficult to
encod this feature to binary, since numbers above often take huge values.

59
Table 5-2 Transformation for Protocol Feature No.2
Flag No. Flag No.
OTH 1 S1 7
REJ 2 S2 8
RSTO 3 S3 9
RSTOS0 4 SF 10
RSTR 5 SH 11
S0 6
Table 5-3 Transformation for Flag Column Feature no.3
Protocol type No.
TCP 1
ICMP 2
UDP 3
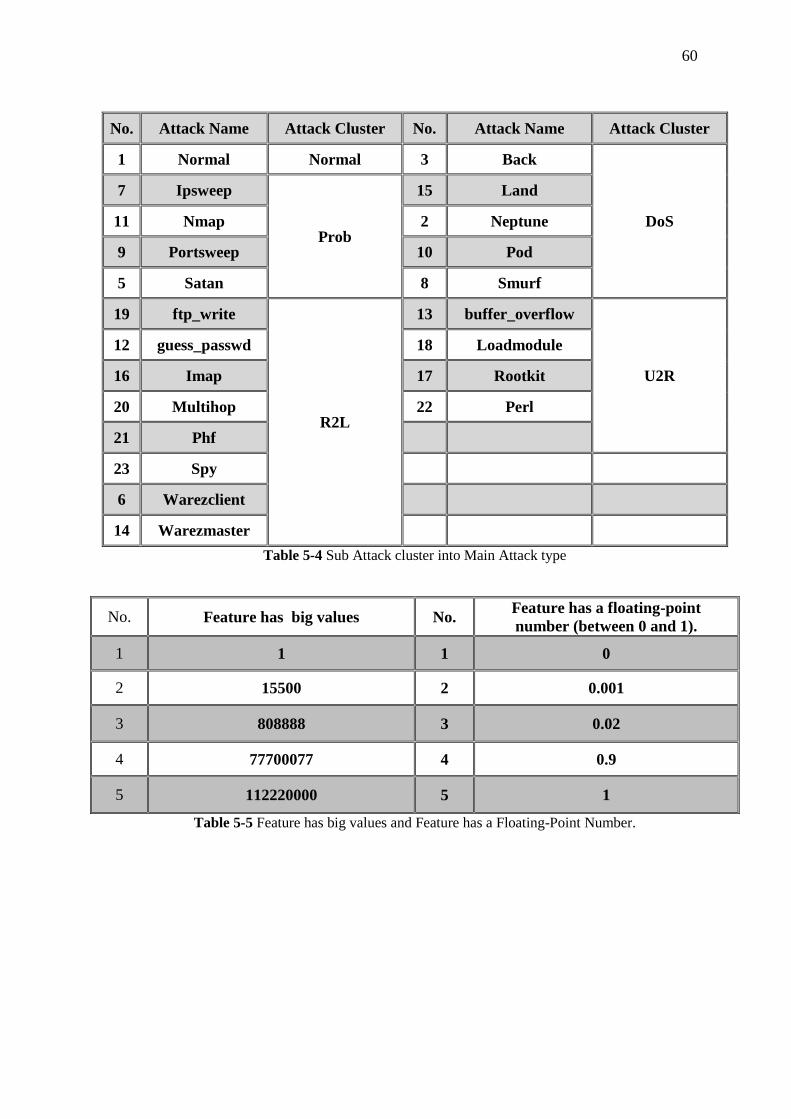
60
No. Attack Name Attack Cluster No. Attack Name Attack Cluster
1 Normal Normal 3 Back
DoS
7 Ipsweep
Prob
15 Land
11 Nmap 2 Neptune
9 Portsweep 10 Pod
5 Satan 8 Smurf
19 ftp_write
R2L
13 buffer_overflow
U2R
12 guess_passwd 18 Loadmodule
16 Imap 17 Rootkit
20 Multihop 22 Perl
21 Phf
23 Spy
6 Warezclient
14 Warezmaster
Table 5-4 Sub Attack cluster into Main Attack type
No. Feature has big values No. Feature has a floating-point
number (between 0 and 1).
1 1 1 0
2 15500 2 0.001
3 808888 3 0.02
4 77700077 4 0.9
5 112220000 5 1
Table 5-5 Feature has big values and Feature has a Floating-Point Number.
61
(C) Data Encoding Unit
The Adaptive Resonance Theory (ART1) classifier is one of kinds of the
Carpenter\Grossberg ANNs. ART1 accepts the inputs and targets only in the form of
binary data (i.e. 0 or 1). So processing of the data according to the demand of neural
network architecture plays an important role in their successful implementation (i.e.
generate an acceptable data format for ART1, by encoding incoming data to binary
format) (Kavuri and Kundu, 2011).
In the work of Liu, et al (2002), they use binary encoding in order to generate
homogeneous code and a homogeneous environment. Binary encoding method is the
most common encoding method (Liu, et al 2002). Gong, et al (2013) indicated that the
compact binary strings can enable large efficiency gains in storage and computation
speed for similarity (Gong, et al 2013).
In this model, the researcher uses binary encoding with adaptive representation
according to a long of feature for each character of those network data vectors as input
for our ART1 classifier. So, as they can see the binary representation for a 41-features
data vector will be very long as shown in Figure (5.2), for this the database size is very
huge taken in mind that all data vectors in the environment unit is encoded binary.
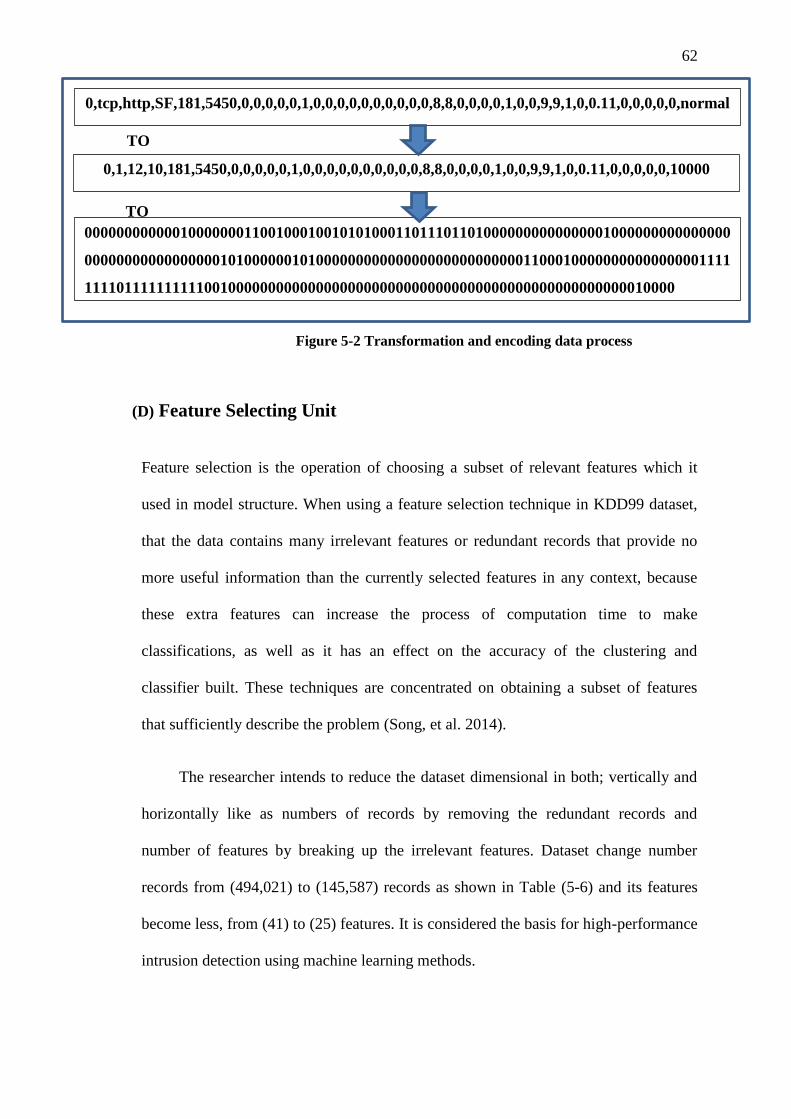
62
Figure 5-2 Transformation and encoding data process
(D) Feature Selecting Unit
Feature selection is the operation of choosing a subset of relevant features which it
used in model structure. When using a feature selection technique in KDD99 dataset,
that the data contains many irrelevant features or redundant records that provide no
more useful information than the currently selected features in any context, because
these extra features can increase the process of computation time to make
classifications, as well as it has an effect on the accuracy of the clustering and
classifier built. These techniques are concentrated on obtaining a subset of features
that sufficiently describe the problem (Song, et al. 2014).
The researcher intends to reduce the dataset dimensional in both; vertically and
horizontally like as numbers of records by removing the redundant records and
number of features by breaking up the irrelevant features. Dataset change number
records from (494,021) to (145,587) records as shown in Table (5-6) and its features
become less, from (41) to (25) features. It is considered the basis for high-performance
intrusion detection using machine learning methods.
0,tcp,http,SF,181,5450,0,0,0,0,0,1,0,0,0,0,0,0,0,0,0,0,8,8,0,0,0,0,1,0,0,9,9,1,0,0.11,0,0,0,0,0,normal
.
000000000000100000001100100010010101000110111011010000000000000001000000000000000
000000000000000001010000001010000000000000000000000000011000100000000000000001111
11110111111111100100000000000000000000000000000000000000000000000000010000
0,1,12,10,181,5450,0,0,0,0,0,1,0,0,0,0,0,0,0,0,0,0,8,8,0,0,0,0,1,0,0,9,9,1,0,0.11,0,0,0,0,0,10000
TO
TO

63
Attack Types Number of Records
before remove duplicate
Number of Records after
remove duplicate
Normal 97277 87832
Denial of Service 391458 54572
Remote to User 1126 999
User to Root 52 52
Probing 4107 2139
Total 494020 145586
Table 5-6 Compression between numbers of records before\after remove duplicate
(E) Feature Clustering Unit
Clustering technique can be considered as the important part of our model. Sahu and
Jena (2014) stated that the clustering is categorizes the groups data objects based only
on the information found in the data that display the objects and their relationships
with finding a structure in a group of the data. The aim of the clustering is a
combination of objects which are “similar” between them and are “dissimilar” to the
objects belonging to other clusters (Sahu and Jena 2014). The cause of its simplicity
and efficiency K-means clustering algorithms would be used as a clustering method.

64
K-means Clustering Algorithms
The K-means is one of the simplest unsupervised learning algorithms that solve the
well-known clustering problem (Faraoun and Boukelif, 2006).
Liu, et al (2014) defined k-mean as a sort of indirect clustering method based on
statistical properties and distance measures between patterns to classify the data
objects. The objective function of this technique is to define a distinct k centroid or
mean for each cluster, where k is the number of cluster, which divides n data objects
based on features into k clusters with minimum standard deviation, by determined it
automatically in the process of clustering (Liu, et al. 2014).
A distance function is required in order to compute the distance (i.e. similarity)
between two objects. The Euclidean is the most commonly used distance function,
which is define as: Formula
( ) √∑( )
( )
In previous equation (5-1) two input vectors are with m quantitative features where x =
(x1,… , xm) and y = (y1,….,ym) .In the Euclidean distance function, all features
contribute equally to the function value. (Münz, et al, 2007).

65
Riad, et al (2013) is described the general steps for the K-means algorithm as
follows:
1. Number of clusters (K) is choosed
2. Centroids Initialization
3. Each pattern Assigned to the cluster with closest centroid
4. Means of each cluster is calculate to be its new centroid
5. Repeat step 3 until stopping criteria is met
6. The best clustering solution was chosen after repeating this procedure 10 times
(Riad, et al. 2013)
The following Figure 5-3 demonstrates the pseudo code of k-mean algorithm:
Figure 5-3 k-mean algorithm pseudo code
1) MSE=large-number;
2) Select initial cluster centroids ;
3) Select clusters number k
4) Do
5) Old-MSE=MSE;
6) MSE1=0;
7) For j=1 to k
8) mj=0; nj=0;
9) end for
10) For i=1 to n
11) For j=1 to k
12) Compute squared Euclidean distance d2(xi, mj);
13) end for
14) Find the closest centroid mj to xi;
15) mj=mj+xi; nj=nj+1;
16) MSE1=MSE1+d2(xi, mj);
17) end for
18) For j=1 to k
19) nj=max(nj, 1); mj=mj/nj;
20) end for
21) MSE=MSE1;
22) while (MSE<Old-MSE)

66
The first function is the basic function of the k-means algorithm, it is used in to
find the nearest center (k) for each data point, it is based on computing the distances
between each data point and the centers, then the minimum distance kept in a especial
table in our system database. The first function is shown in Figure (5-4), to keep the
distance between each point and its nearest cluster. This function is called distance ()
(Al-Rashdan, 2011).
Figure 5-4 Pseudo Code of the K-Mean Function Distance ( ) -
The other function is shown in Figure (5-5), is called distance-new ( ). Line 1
finds the distance between the current point i and the new cluster center assigned to it
in the previous iteration, if the computed distance is smaller than or equal to the
distance to the old center, the point stays in its cluster that was assigned to in previous
iteration, and there is no need to compute the distances to the other k−1 centers. Lines
3~5 will be executed if the computed distance is larger than the distance to the old
`Function distance()
//assign each point to its nearest cluster
1) 1 For i=1 to n
2) 2 For j=1 to k
3) 3 Compute squared Euclidean distance d2(xi, mj);
4) 4 end for
5) 5 Find the closest centroid mj to xi;
6) 6 mj=mj+xi; nj=nj+1;
7) 7 MSE=MSE+d2(xi, mj);
8) 8 Clusterid [i]=number of the closest centroid;
9) 9 Pointdis[i]=Euclidean distance to the closest centroid;
10) 10 end for
11) 11 For j=1 to k
12) 12 mj=mj/nj;
13) 13 end for

67
center, this is because the point may change its cluster, Lines 9 and 10 keep the cluster
id, for the current point assigned to it, and its distance to it to be used in next iteration
of that function. This information allows this function to reduce the distance
calculation required to assign each point to the closest cluster, and this makes the
function faster than the function distance in Algorithm as shown in Figure (5-4). In the
second implementation, in our system implementation the function distance () is
executed two times, while function distance_new () is executed the reminder of
iteration. This implementation referred to as “enhanced k-means” algorithm.
Figure 5-5 Pseudo Code of The K-Mean Function Distance- new ( )
The results of K-mean will be saved in a particular table then we will pass it to
the training unit (Carpenter /Grossberg ANN ART1) in order to re-cluster to get more
representative clusters.
Function distance_new ()
//assign each point to its nearest cluster
12) 1 For i=1 to n
Compute squared Euclidean distance d2(xi, Clusterid[i]);
If (d2(xi, Clusterid[i])<=Pointdis[i])
Point stay in its cluster;
13) Else
14) For j=1 to k
15) Compute squared Euclidean distance d2(xi, mj);
16) End for
17) Find the closest centroid mj to xi;
18) mj=mj+xi; nj=nj+1;
19) MSE=MSE+d2(xi, mj);
20) Clustered[i]=number of the closest centroid;
21) Pointdis[i]=Euclidean distance to the closest centroid;
22) endfor
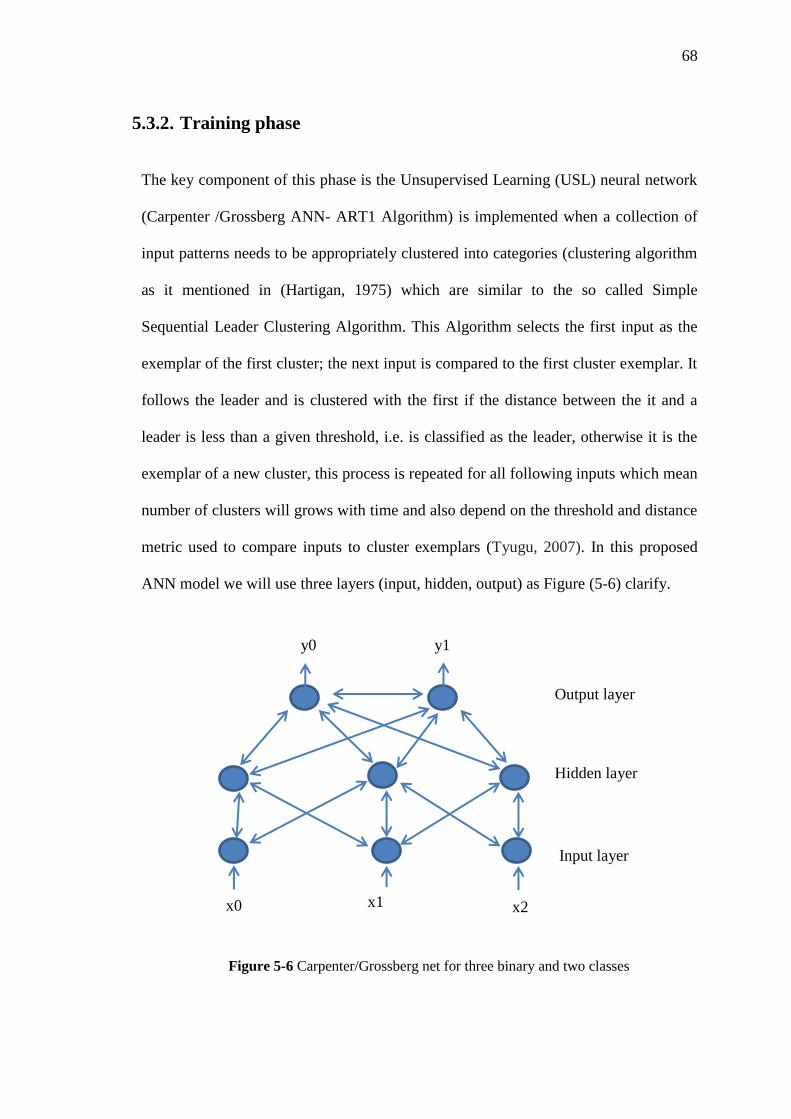
68
5.3.2. Training phase
The key component of this phase is the Unsupervised Learning (USL) neural network
(Carpenter /Grossberg ANN- ART1 Algorithm) is implemented when a collection of
input patterns needs to be appropriately clustered into categories (clustering algorithm
as it mentioned in (Hartigan, 1975) which are similar to the so called Simple
Sequential Leader Clustering Algorithm. This Algorithm selects the first input as the
exemplar of the first cluster; the next input is compared to the first cluster exemplar. It
follows the leader and is clustered with the first if the distance between the it and a
leader is less than a given threshold, i.e. is classified as the leader, otherwise it is the
exemplar of a new cluster, this process is repeated for all following inputs which mean
number of clusters will grows with time and also depend on the threshold and distance
metric used to compare inputs to cluster exemplars (Tyugu, 2007). In this proposed
ANN model we will use three layers (input, hidden, output) as Figure (5-6) clarify.
Figure 5-6 Carpenter/Grossberg net for three binary and two classes
y0 y1
x2 x1 x0
Hidden layer
Input layer
Output layer

69
The mean function of this phase can be described as a training the system for
intrusion detecting.it will act as classifier unit, by classify KDD 99 records inputs data
based on their similarity, ART1 nets are used in our model for clustering and
classifying network traffic into normal and intrusive, where learning process should be
stable.
ART1 is designed to allow the user to control the degree of similarity of patterns
placed on the same cluster. This can be done by tuning the vigilance parameter in such
net. In ART1, the number of clusters is not required to be determined previously, so
the vigilance parameter can be used to determine the proper number of clusters in
order to decrease the probability of merging different types of clusters into the same
cluster.
(A) ART1 Architecture
Historically the first (and simplest) member of the ART family is ART1. The basic
architecture of an adaptive resonance neural net involves three parts: attentional
subsystem, the orienting subsystem and gain control.
Orienting Subsystem (Reset Mechanism)
Depending on the similarity between the top down weight (tji) and the input
vector X, the cluster unit is allowed to learn a pattern or not. This is done at the
reset unit, based on the signals it receives from the input and interface portion of
the F1 later. If the cluster unit is not allowed to learn, it becomes inhibited and a
new cluster unit is selected for learning. It dictates the three possible states for F2
layer neurons; they are namely active, inactive and inhibited. The difference

70
between the inactive and inhibited is that for both the cases activation state of F2
unit is zero. In its inactive state, the F2 neurons are available in next competition
during the presentation of current input vector which is not possible when the F2
layer is inhibited (Kavuri and Kundu, 2011).
Gain control
The gain controller (G) is nothing but a data controller. It controls the attentional
subsystem by sending data or not.
Attentional Subsystem
Attentional Subsystem is a central part of the ART1 network, it divided to:
o Input: Represents and stores the given input vector (I) from external
environment to F1 layer (no dynamics).
o Bottom F1 layer: Is consists of N binary valued nodes. The output(X) of these
nodes is controlled by a so called 2/3 rule . F1 layer exchanges the input portion
signal with the F2 layer. The main purpose of F1 layer is to compare the binary
input pattern X with the binary expectation pattern (Y) from F2 layer. In a F1
layer occur at the excitatory and inhibitory inputs to shunting model. The
excitatory input to F1 layer of ART1 consists of a combination of the input
pattern and the Y expectation. The inhibitory input consists of the gain control
signal from F2 layer (Hagan, 1996).
F1 Layer Equation:
)25.........().........(][)(
)()()()(
2111
21:21111
tt
tttdt
td
aWnb
aWpnbnn
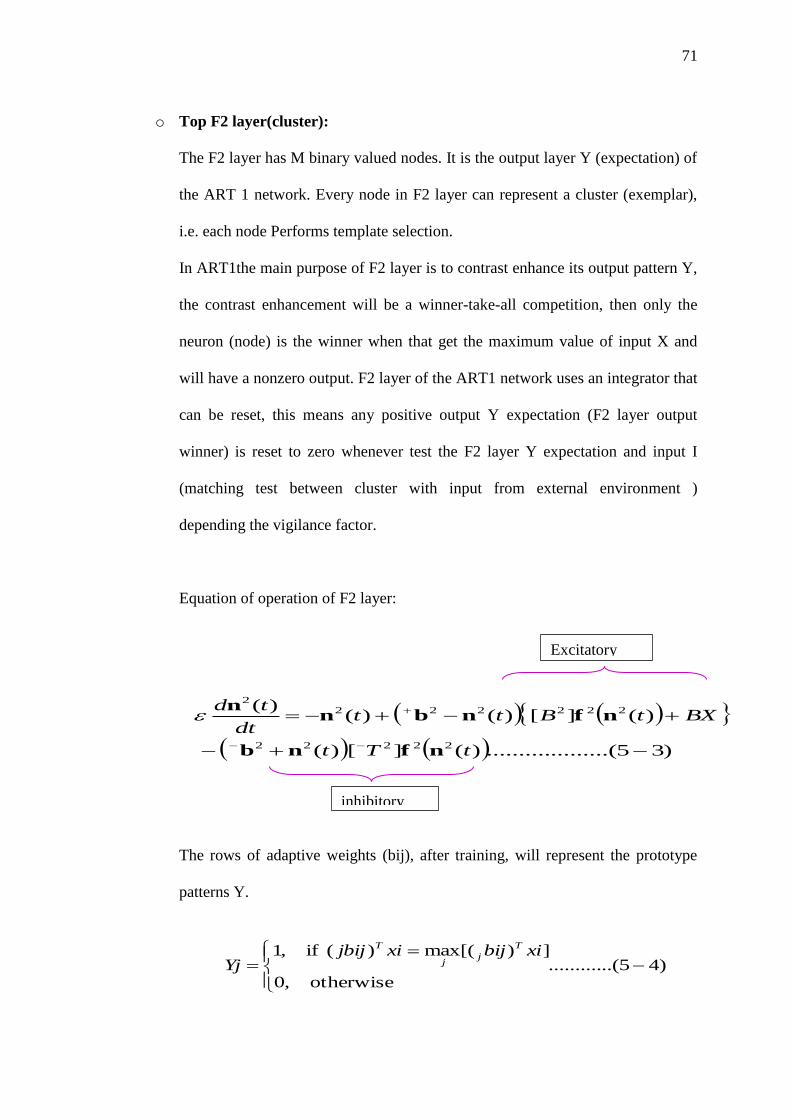
71
o Top F2 layer(cluster):
The F2 layer has M binary valued nodes. It is the output layer Y (expectation) of
the ART 1 network. Every node in F2 layer can represent a cluster (exemplar),
i.e. each node Performs template selection.
In ART1the main purpose of F2 layer is to contrast enhance its output pattern Y,
the contrast enhancement will be a winner-take-all competition, then only the
neuron (node) is the winner when that get the maximum value of input X and
will have a nonzero output. F2 layer of the ART1 network uses an integrator that
can be reset, this means any positive output Y expectation (F2 layer output
winner) is reset to zero whenever test the F2 layer Y expectation and input I
(matching test between cluster with input from external environment )
depending the vigilance factor.
Equation of operation of F2 layer:
The rows of adaptive weights (bij), after training, will represent the prototype
patterns Y.
)45..(..........otherwise,0
])[(max)(if,1
xibijxijbijYj
T
jj
T
Excitatory
inhibitory
)35.........(..........)(][)(
)(][)()()(
22222
2222222
tTt
BXtBttdt
td
nfnb
nfnbnn

72
Figure 5-7 diagram of Basic structure of ART1.
As shown in Figure (5-7) every node in the input layer is connected to the
corresponding node in the F1 layer (interface). Each node in the input layer and F1
layer is connected to the reset unit, which in turn is connected to every F2 layer. All
nodes Xi in the F1 layer are fully connected to all nodes Yi in the F2 layer by two
weighted connections, denoted as (bij) bottom-up weights and (tji) top-down weights
is a representative weight for the connections between nodes in the F2 and F1, layer
Fausett, (2008).
These connections weights, (bij) (tji) are also indicated as the Long Term
Memory (LTM) and the same time the F1 and F2 are also denoted as the Short Term
INPUT PATTERN (I)
Y +
tij= (LTM)
Expectation Pattern
bij =(LTM)
+
-
+ +
+
M Neuron (STM)
RESET
GAIN 1
GAIN 2
Orienting
Subsystem
Attentional Subsystem Gain
Control
F1 Layer
F2 Layer
N Neuron (STM)
+
-
+
Vigilance
Test (ρ)
X A

73
Memory (STM) of the ART 1 network. X and Y are therefore called the F1 STM
pattern and the F2 STM pattern) (Freriks, et.al 1992).
(B) ART1 Algorithm
From two perspectives of Lippmann (1987) and Laurene Fausett (2008)the
researcher formed the following steps:
Step 1: Initialization
Put ( )=1 ……………….. (5-5)
( )
……………… (5-6)
Where
L > 1 ; 0 ≤ i ≤ N-1 , 0 ≤ j ≤ M-1
Set ρ to some number 0 ≤ ρ ≤ 1
In these equation ( ) is the bottom up connection weight and ( ) is the top
down connection weight between input node (i) and output node (j) at time (t) of a
Carpenter/Grossberg net with N inputs x0…..xn-1 and M output y0…..ym-1. After
learning, these weights define the exemplar specified by output node (j).
The function ρ is the vigilance threshold which indicates how close an input must be
to a stored exemplar to match. The value of the ρ close to 1 means that an input must
be close to the learnt pattern in order to be classified respectively.
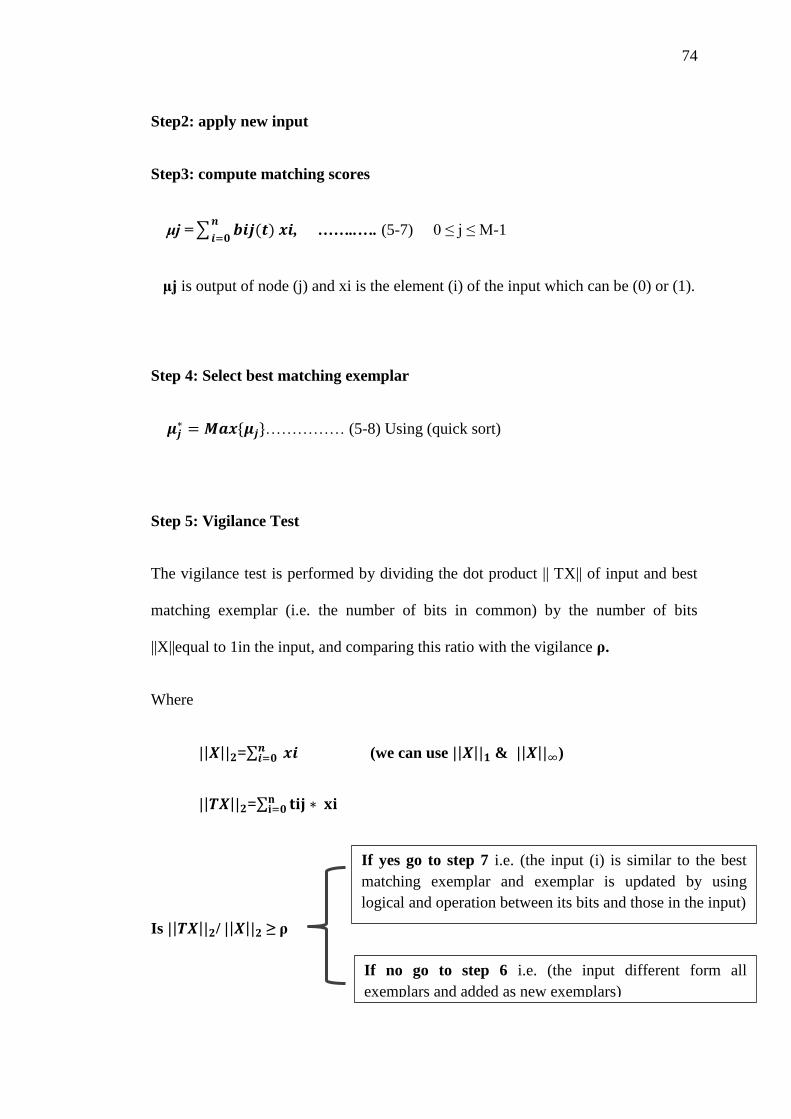
74
Step2: apply new input
Step3: compute matching scores
μj =∑ ( )
, ……..…. (5-7) 0 ≤ j ≤ M-1
μj is output of node (j) and xi is the element (i) of the input which can be (0) or (1).
Step 4: Select best matching exemplar
…………… (5-8) Using (quick sort)
Step 5: Vigilance Test
The vigilance test is performed by dividing the dot product || TX|| of input and best
matching exemplar (i.e. the number of bits in common) by the number of bits
||X||equal to 1in the input, and comparing this ratio with the vigilance ρ.
Where
=∑ (we can use & )
=∑
Is / ≥ ρ
If yes go to step 7 i.e. (the input (i) is similar to the best
matching exemplar and exemplar is updated by using
logical and operation between its bits and those in the input)
If no go to step 6 i.e. (the input different form all
exemplars and added as new exemplars)

75
Step 6: Disable best matching exemplar
The output of the best matching node selected in step 4 is temporarily set to zero and
no longer takes parts in the maximization of step 4 then go to step 3.
Step 7: Adapt best matching exemplar
The given input is used for learning by computing new connection weights (
) and ( ) as follows:
( ) = ( ) ………..(5-9)
( ) = tji(t)xi/0.5 + ∑ ( )
= (t+1)/0.5 + ∑ ( )
……(5-10)
Step 8: Repeat by go to step 2
compute error rate by
If || bij(t+1) - bij(t)|| < Є ………..(5-11)
where Є very small value
IF Yes go to End
else go to step 2
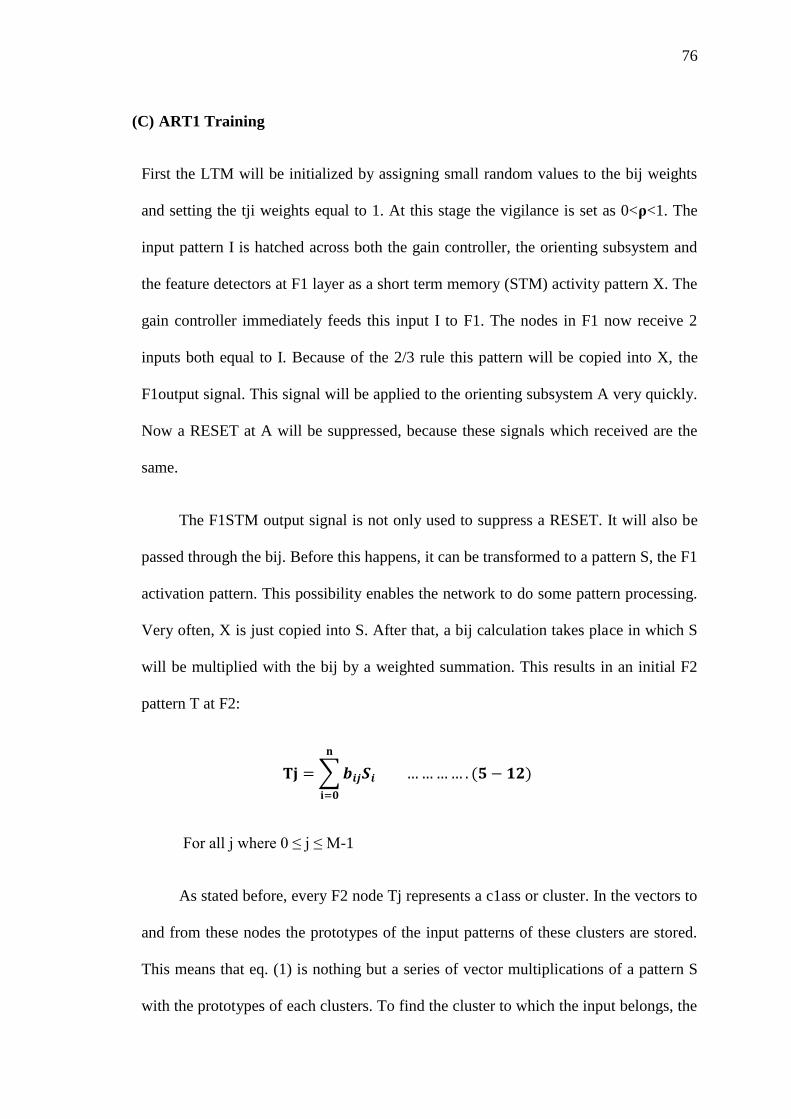
76
(C) ART1 Training
First the LTM will be initialized by assigning small random values to the bij weights
and setting the tji weights equal to 1. At this stage the vigilance is set as 0<ρ<1. The
input pattern I is hatched across both the gain controller, the orienting subsystem and
the feature detectors at F1 layer as a short term memory (STM) activity pattern X. The
gain controller immediately feeds this input I to F1. The nodes in F1 now receive 2
inputs both equal to I. Because of the 2/3 rule this pattern will be copied into X, the
F1output signal. This signal will be applied to the orienting subsystem A very quickly.
Now a RESET at A will be suppressed, because these signals which received are the
same.
The F1STM output signal is not only used to suppress a RESET. It will also be
passed through the bij. Before this happens, it can be transformed to a pattern S, the F1
activation pattern. This possibility enables the network to do some pattern processing.
Very often, X is just copied into S. After that, a bij calculation takes place in which S
will be multiplied with the bij by a weighted summation. This results in an initial F2
pattern T at F2:
∑
( )
For all j where 0 ≤ j ≤ M-1
As stated before, every F2 node Tj represents a c1ass or cluster. In the vectors to
and from these nodes the prototypes of the input patterns of these clusters are stored.
This means that eq. (1) is nothing but a series of vector multiplications of a pattern S
with the prototypes of each clusters. To find the cluster to which the input belongs, the

77
output node which represents this cluster has to be selected. This is reached by letting
the values Tj undergo a competitive process. During such a process a criterion is
defined; the output node which satisfies this criterion most is selected. This node is
called the winning node. A criterion which is often used in neural networks is
selection of the output node with the maximum response to the bij calculation. This
winning node Tj will be stored in Y by making Yj = 1 and all other Yj nodes = 0. The
cluster assigned or represented by this node is assumed to be the best match to the
applied input as illustrated in Figure (5-8).
Figure 5-8 first stage of an ART1 training cycle
To test whether this match is valid, the prototype of this cluster has to be
compared with the applied input. This is done by a tji calculation from the F2 layer to
the F1 layer. The F2 STM pattern Y eventually can, similar to X, be transformed into a
F2 activation pattern U. Often U = Y. This pattern is sent to the tji LTM.
Simultaneously a signal is sent to the gain controller (G). This signal shuts off the feed
through of pattern I at G. Now a new pattern enters F1 as a result of the weighted
summation of pattern S and the tji LTM. This pattern B can be calculated as follows:

78
∑
( )
For all i where 0 ≤ i ≤ N-1
B is called a (tji) template or (tji) learned expectation. It represents the prototype of the
input of the cluster assigned by the winning node. F1 now receives two signals I and
B. Those nodes Xi in F1, which receive two input values, elicit an output signal equal
to 1. Output vector X will be sent to the orienting subsystem A. There, two things can
happen now.
If I and B look alike X will resemble I very much. Therefore X is able to suppress a
RESET in the orienting system. the input is said to match the assigned cluster as
Figure (5-9).
If I and B differ much, X does not resemble I. Now X is not able to prevent A from
generating a RESET, so this RESET will be generated.
Figure 5-9 second stage of an ART1 training cycle

79
In the first case the match cycle ends. It is known to which cluster the input
belongs. The learning phase can start now to incorporate I in that cluster. In the second
case the search process or training algorithm has to continue because the input is not
accepted as a member of the assigned class. The RESET signal disables the winning
node in Y. As a consequence of this, the tji control signal and the F2 activation pattern
are removed as shown in Figure (5-10).
Figure 5-10 three stage of an ART1 training cycle
This results in a new feed through of I at G, suppression of the RESET signal
and a new bij calculation. The outcome of this calculation is the same as after the first
bij calculation. When the competitive process starts the preceding winning node is
excluded from competition. This results in a new winning node. Now again this
winning node is stored into Y, transformed into U and calculated back to B. At F1 will
be tested then, whether the prototype of the cluster assigned by this winning node
matches I. If so, the training algorithm has come to an end. If not, the above described
process of bij calculation and tji matching has to be repeated until a match is found.
This will always happen if there still remains at least one so called uncommitted node.

80
This is an output node which is not assigned to any cluster yet. If an uncommitted
node wins the competition, due to the initialization of the tji LTM this node will
always be assigned to input pattern I. Only if there are no uncommitted nodes left it
can happen that an input pattern I doesn't fit to any cluster. In that case this has to be
made clear although it is always possible within the ART network to add new nodes
without influencing the behavior of the net.
(D) The vigilance test
Zurada (1992) says in orienting subsystem running the vigilance test. the vigilance
threshold is a parameter take values between (0,1) specified by a user which is has
control on The criterion of similarity or "match," required between a cluster or pattern
or exemplar already stored in the ART1 network and the current input in order for this
new pattern to resonate with the encoded one. If the match between the input vector and
cluster is found, the network is said to be in resonance (Zurada 1992).
Grossberg (2013) considered that by lowering of the vigilance threshold permits
the learning of general categories with abstract pattern in other word allows the system
to be more noise tolerant and broad generalization. High vigilance leads to narrow
generalization and forces a memory search to occur for a new category when even
small mismatches exist between an exemplar and the category that it activates
(Grossberg 2013)

81
During training this test will be executed at least 2 times. The first time is when
an input I is applied to the ART1 network, then input layer I is on, and since this value
is positive an excitatory signal is sent to orienting subsystem A. The strength of that
signal depends on how many input layer I are on. However, A also receives inhibitory
signals from the F1 layer that are on. If enough F1 layer interface are on, orienting
subsystem A is prevented from firing (That is a RESET signal is suppressed).
If the ratio of and is greater than or equal to the vigilance parameter,
the weights (bij and tji) for the winning cluster unit are adjusted.
The vigilance test now becomes:
………...(5-14)
Where:
I: is (input layer) output
Y: is output of (F2) layer
∑ √ . ……………. (5-15)
However, if the ratio is less than the vigilance parameter, the candidate unit is
rejected, and another candidate unit must be chosen. The current winning cluster unit
becomes inhibited, so that it cannot be chosen again as a candidate on this learning trial,
and the activations of the F1 units are reset to zero Freriks, et.al (1992).

82
5.3.3. Testing Phase
In this phase, testing dataset will be implemented by the ART1 neural network which
was trained during the training phase using the best number of parameters such as norm,
weight factor and vigilance test (threshold). furthermore the selected records should be
involve on some the duplicated records when testing system, to ensure the learning is a
stable .The designed system will be evaluated by calculating the Detection Rate (DR),
accuracy Rate (AR), False Positive Rate (FPR) etc. for our model. The results and
experiments details are described in chapter six.
5.4 Intrusion detection simulation
When test data traffic network by passing it through the database that contains a saved
trained patterns in order to detect intrusion if found by:
Classifier: compare between ANN output and data testing set for classifying
network traffic into normal or intrusive, sends its results to the responder.
Responder: response to the detected intrusions by generating alarms (such as
sending e-mail to system administrators) and generating reports on the collected
data in IDS log files.

83
Chapter Six
Experiments Results and Conclusion
84
Chapter Six
Experiments Results and Conclusion
6.1 Introduction
In this chapter, the researcher tackles the main experiment results and its evaluation
criteria which are produced by implement the proposed simulation by applying k-mean
clustering algorithm and Carpenter / Grossberg-ART1 ANN system, and compare it
with previous studies. The chapter ends with conclusion and future work.
6.2 Implementing Technique
Heaton (2008) displays that the neural networks are constructed of neurons that form
layers. Java can be used to construct such network. Java can used to calculate the output
of ART1 neural network from inputs, connection weights, and threshold values to
determine the final result by the mathematical equations (Heaton 2008).
The researcher uses java version 1.7 to program the proposed simulation. Firstly,
from KDD 99 dataset the system convert row data to another forms through tow
process; codification and encoding as acceptable format to ART1 ANN.
Secondly, the system passing these modified data to K-mean clustering algorithm
to get initial classification, this process increases the similarities between normal
patterns and in other hand, it increases the differences between normal patterns and
attack types. In order to get high performance and accuracy of ART1 ANN.
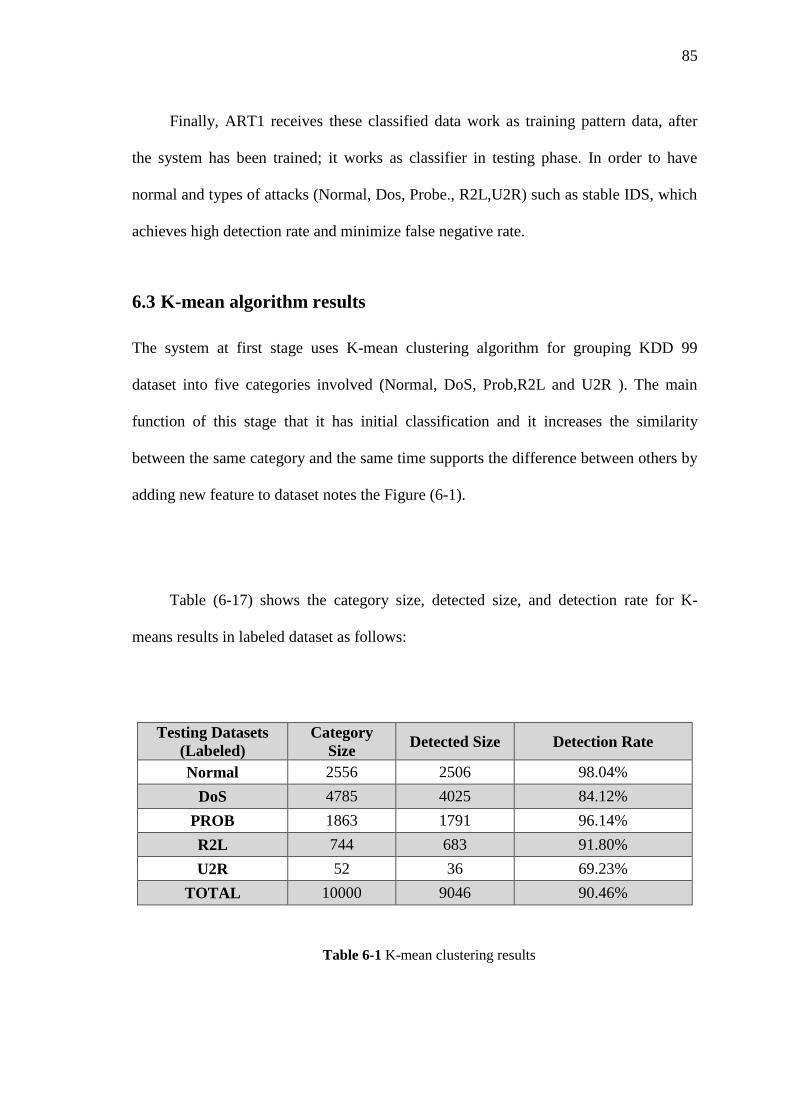
85
Finally, ART1 receives these classified data work as training pattern data, after
the system has been trained; it works as classifier in testing phase. In order to have
normal and types of attacks (Normal, Dos, Probe., R2L,U2R) such as stable IDS, which
achieves high detection rate and minimize false negative rate.
6.3 K-mean algorithm results
The system at first stage uses K-mean clustering algorithm for grouping KDD 99
dataset into five categories involved (Normal, DoS, Prob,R2L and U2R ). The main
function of this stage that it has initial classification and it increases the similarity
between the same category and the same time supports the difference between others by
adding new feature to dataset notes the Figure (6-1).
Table (6-17) shows the category size, detected size, and detection rate for K-
means results in labeled dataset as follows:
Testing Datasets
(Labeled)
Category
Size Detected Size Detection Rate
Normal 2556 2506 98.04%
DoS 4785 4025 84.12%
PROB 1863 1791 96.14%
R2L 744 683 91.80%
U2R 52 36 69.23%
TOTAL 10000 9046 90.46%
Table 6-1 K-mean clustering results

86
Figure 6-1 add feature to dataset after know it as normal
6.4 Carpenter / Grossberg-ART1 ANN Results
At the second stage in classification implements by the Carpenter / Grossberg-ART1
ANN. It uses also to classify the testing dataset into 5 categorizes. The neural network is
trained by using the best adjusted values of parameters such as norm, weight factor, and
vigilance test (threshold). Furthermore, the selected records should be containing some
the duplicated records when testing system, to test and ensure the stability of the
learning process.
During training network ART1, we noticed when the norm parameter is used in
vigilance test as shown in equation (5-15) and (5-14) respectively. Using the second
norm demonstrates better results than using the first norm and infinity norm, because
first norm has low detection rate and infinity norm has high misclassification in the
categories.
The parameter of weights factor (L) as displayed in equation (5-6). It has been
adjusted and changed to many values which are bigger from 1. We get the best results
when using L=2.
0000000000001000000011001000100101010001101110110100000000000000010000
0000000000000000000000000000101000000101000000000000000000000000001100
0100000000000000001111111101111111111001000000000000000000000000000000
00000000000000000000010000
0000000000001000000011001000100101010001101110110100000000000000010000
0000000000000000000000000000101000000101000000000000000000000000001100
0100000000000000001111111101111111111001000000000000000000000000000000
000000000000000000000100001111
Add feature

87
The vigilance threshold is an important parameter which determined through
researcher in order to get best results. this parameter take values between (0,1) is has
control on the measurement of the matching desired between a cluster or pattern already
stored in the Carpenter / Grossberg-ART1 ANN and the current input in order for this
new pattern to resonate with the encoded one. The comparison between different
threshold (when vigilance value take: 0.7, 0.8, 0.9 and 0.95) in Carpenter / Grossberg-
ART1 ANN, we choose vigilance = 0.9 because it gives the best results for DR, AccR,
FPR, and FNR as showed in Figure (6-2)
Figure 6-2 comparison between vigilance tests
Depending on the adjusted values of parameters as (weight factor = 2, second
norms = 2, vigilance = 0.9) of the previous experiment Carpenter / Grossberg-ART1
ANN is able to classify the labeled testing dataset which has results demonstrated in
Table (6-2) that represent the confusion matrix of the 5 categorizes (labeled):
0.1
1
10
100
0.7 0.8 0.9 0.95
DR
AccR
FPR
FNR
Vigilance Value

88
Confusion Matrix (Labeled)
Detection
Normal DoS PROB R2L U2R TOTAL
Act
ual
Normal 2526 11 4 13 2 30
DoS 11 4694 23 42 15 91
PROB 13 52 1731 58 9 132
R2L 15 31 2 683 13 61
U2R 1 6 1 13 29 23
TOTAL 2566 4794 1761 809 68 10000
Table 6-2 Confusion Matrix of testing data (Labeled)
From Confusion Matrix of testing data (Labeled) above, it indicates the detected
size for each category. Table (6-3) below displays Category Size, Detected Size, and
Detection Rate as follows:
weight factor = 2 , second norms = 2 , vigilance = 0.9
Testing Datasets
(Labeled)
Category
Size Detected Size Detection Rate
Normal 2556 2526 98.83%
DoS 4785 4694 98.10%
PROB 1863 1731 92.91%
R2L 744 683 91.80%
U2R 52 29 55.77%
TOTAL 10000 9608 96.08%
Table 6-3 Carpenter / Grossberg-ART1 ANN detection

89
Figure (6-3) displayed the Category Size and Detected Size for each Category
(normal and attack types).
Figure 6-3 Category Size and Detected Size
From Figure (6-3) we note the ART1 has a very good results that belong to
normal and DoS about 98.83% and 98.10% respectively. Since the system used k-mean
cluster as a pre-classifier which increasing similarity between the same category and
dissimilarity between others. But the drawback of the ATR1 was the U2R detects 29
patterns (records) from 52 patterns as total in testing phase.
In Table (6-4), we apply 3000 testing unknown (unlabeled) dataset of KDD 99 in
ART1. It is obvious that there is a good percentage in simulation of ID that detects the
new unknown attack with Detection Rate of approximately 87.10%, Non-detection
Rate 12.90% as listed below:
1
10
100
1000
10000
Normal DoS PROB R2L U2R
Category Size
Detected Size
Attack Type
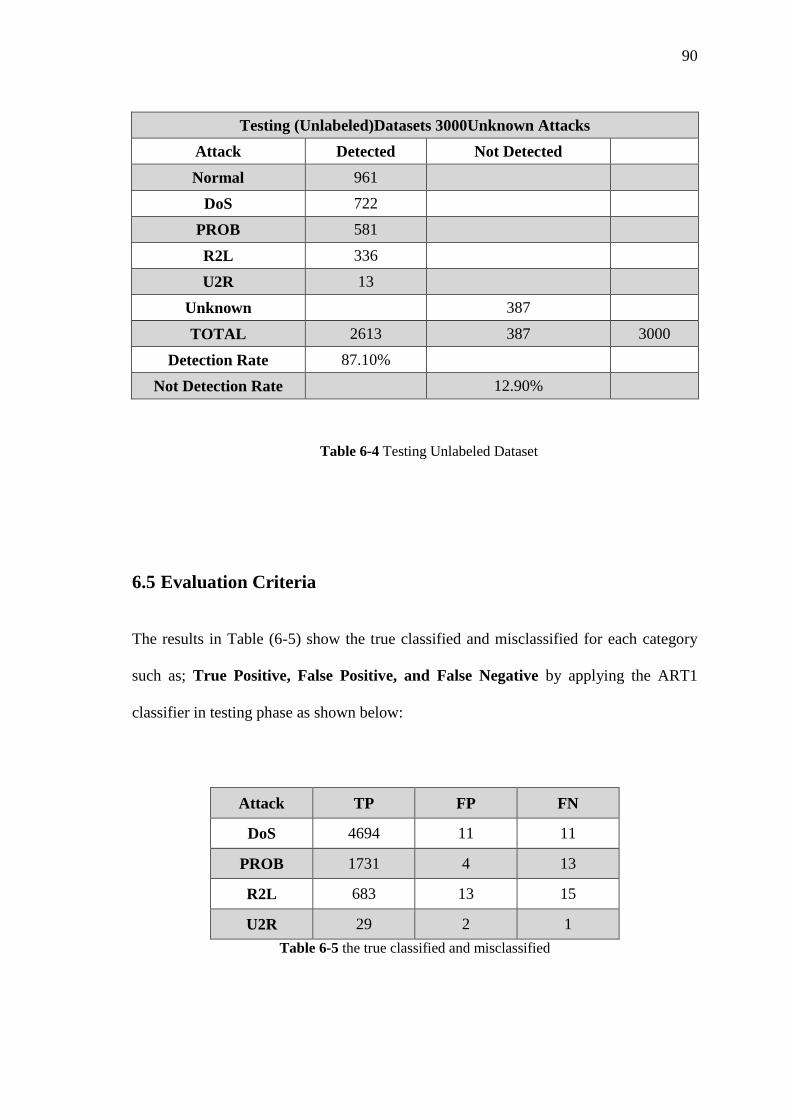
90
Testing (Unlabeled)Datasets 3000Unknown Attacks
Attack Detected Not Detected
Normal 961
DoS 722
PROB 581
R2L 336
U2R 13
Unknown
387
TOTAL 2613 387 3000
Detection Rate 87.10%
Not Detection Rate 12.90%
Table 6-4 Testing Unlabeled Dataset
6.5 Evaluation Criteria
The results in Table (6-5) show the true classified and misclassified for each category
such as; True Positive, False Positive, and False Negative by applying the ART1
classifier in testing phase as shown below:
Attack TP FP FN
DoS 4694 11 11
PROB 1731 4 13
R2L 683 13 15
U2R 29 2 1
Table 6-5 the true classified and misclassified

91
The Evolution Criteria ID attacks that consist of the Accuracy Rate, Precision,
Recall, FPR and FNR can be displayed in Table (6-6) as follows:
Attack Accuracy
Detection Rate Recall Precision F-Measure FPR FNR
DoS 99.70% 99.8% 99.77% 99.77% 0.43% 0.234%
Prob 99.03% 99.3% 99.77% 99.51% 0.16% 0.745%
R2L 96.13% 97.9% 98.13% 97.99% 0.51% 2.149%
U2R 93.62% 96.7% 93.55% 95.08% 0.08% 3.33%
Table 6-6 The Evolution Criteria ID attacks
It is concluded from Table (6-6) above which detailed the testing of labeled data
the use of ART1 ANN that Accuracy Detection Rate for each DoS detect about 99.70%
, Prob has value of 99.03%, R2L detect about 96.13%, and U2R get value as 89.80%.
Recall rate with DoS. PROB, R2L, U2R has value of 99.8%, 99.3%, 97.9%, 90.6%
respectively. Also FPR with DoS. PROB, R2L, U2R has value of 0.43%, 0.16%, 0.51%,
0.08% respectively. Whereas FNR includes DoS ; has a False Negative Rate 0.234%,
PROB attack has about 0.745%, R2L attack has False Negative Rate of about 2.149%,,
U2R attack has about 3.38% False Negative Rate. Below Figures (6-4) and (6-5)
demonstrates the evaluation criteria Accuracy, Detection Rate, Recall Precision, F-
Measure, FPR, and FNR
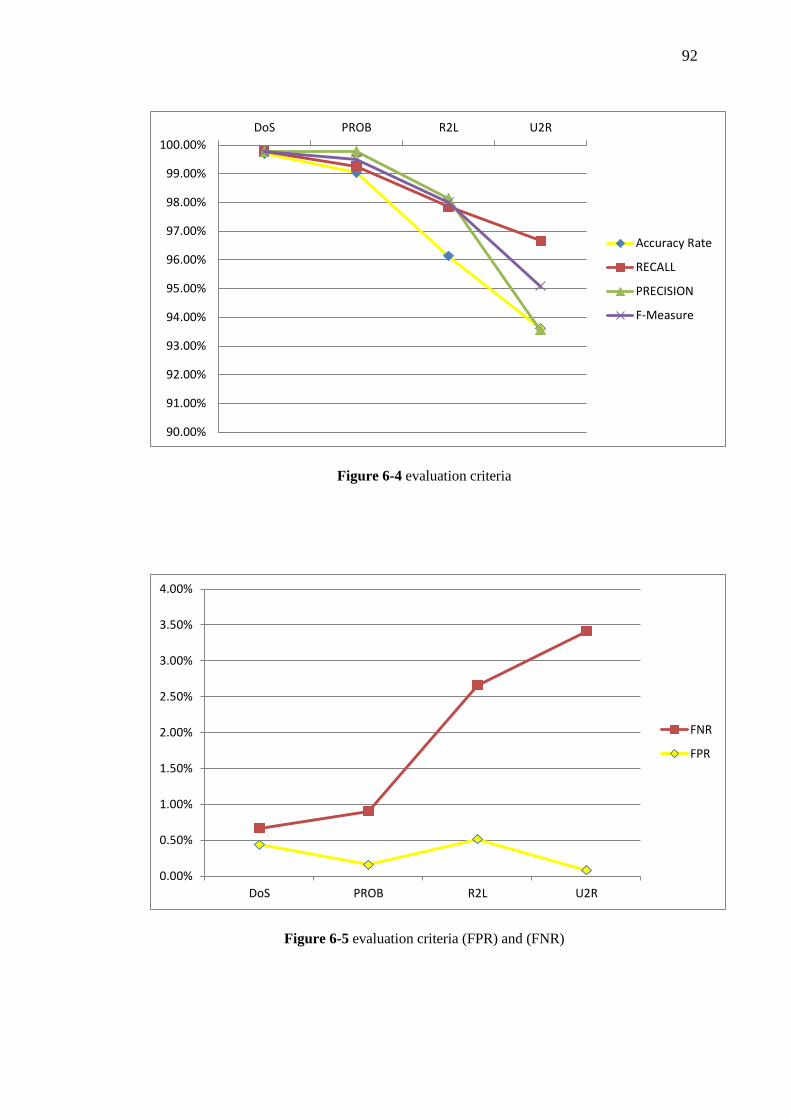
92
Figure 6-4 evaluation criteria
Figure 6-5 evaluation criteria (FPR) and (FNR)
90.00%
91.00%
92.00%
93.00%
94.00%
95.00%
96.00%
97.00%
98.00%
99.00%
100.00%
DoS PROB R2L U2R
Accuracy Rate
RECALL
PRECISION
F-Measure
0.00%
0.50%
1.00%
1.50%
2.00%
2.50%
3.00%
3.50%
4.00%
DoS PROB R2L U2R
FNR
FPR

93
The effectiveness of an ID is evaluated on how capable the detection method is to
make correct attack detection Al-Rashdan (2011) and Shamshirband, et al (2013),
according to the following criteria:
∑
…………………. (6-1)
∑
……………. (6-2)
∑
…….. (6-3)
∑
……………….(6-4)
Table 6-7 important results of ART1 for IDS
From Table (6-7) it can be concluded that Carpenter / Grossberg-ART1 ANN
classifier was able to detect records with a detection rate of approximately 96% with
accuracy rate 96.08% which is considered very good were the system trustworthy is
guaranteed to detect intrusions. The ART1 very good performance results and rates
especially false positive rate about 1.19% and false negative rate equal 0.54% when the
false negative patterns (records) were only 40 records from 10,000 records (intrusions
detected as normal).
Evaluation Criteria Value
False Positive Rate (FPR) 1.19%
False Negative Rate (FNR) 0.54%
Detection Rate (DR) 96%
Accuracy Rate (AccR) 96.08%
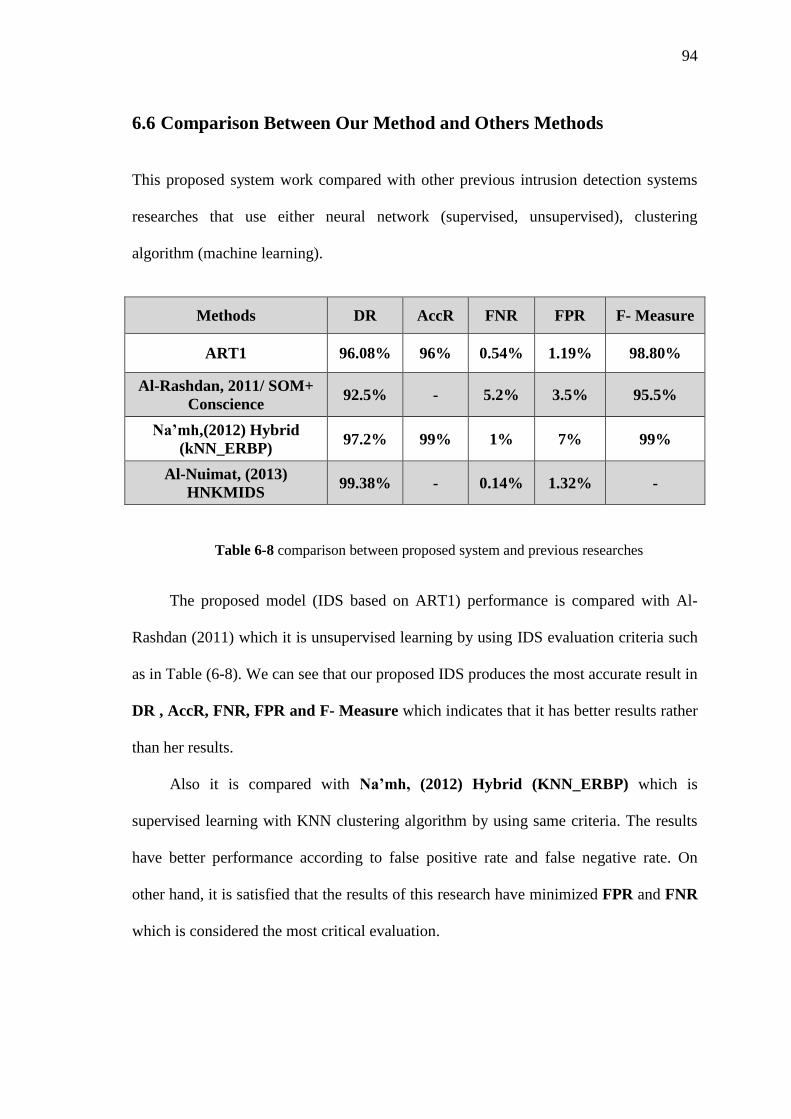
94
6.6 Comparison Between Our Method and Others Methods
This proposed system work compared with other previous intrusion detection systems
researches that use either neural network (supervised, unsupervised), clustering
algorithm (machine learning).
Methods DR AccR FNR FPR F- Measure
ART1 96.08% 96% 0.54% 1.19% 98.80%
Al-Rashdan, 2011/ SOM+
Conscience 92.5% - 5.2% 3.5% 95.5%
Na’mh,(2012) Hybrid
(kNN_ERBP) 97.2% 99% 1% 7% 99%
Al-Nuimat, (2013)
HNKMIDS 99.38% - 0.14% 1.32% -
Table 6-8 comparison between proposed system and previous researches
The proposed model (IDS based on ART1) performance is compared with Al-
Rashdan (2011) which it is unsupervised learning by using IDS evaluation criteria such
as in Table (6-8). We can see that our proposed IDS produces the most accurate result in
DR , AccR, FNR, FPR and F- Measure which indicates that it has better results rather
than her results.
Also it is compared with Na’mh, (2012) Hybrid (KNN_ERBP) which is
supervised learning with KNN clustering algorithm by using same criteria. The results
have better performance according to false positive rate and false negative rate. On
other hand, it is satisfied that the results of this research have minimized FPR and FNR
which is considered the most critical evaluation.

95
Finally, the proposed system is compared to HNKMIDS proposed by Al-Nuimat,
(2013) which is used supervised learning with K-means clustering algorithm. Table (6-
8) illustrates that the DR and FNR of HNKMIDS system has better results from our
proposed system (ART1). In contrast, we gain FPR batter results. Although, our system
is unsupervised learning, so is considered a good results in term of comparison in
supervised learning.

96
6.7 Conclusion
This research introduces an Intrusion Detector based on the Carpenter / Grossberg-
ART1 ANN system. It used KDD 99 dataset that converted row data to another forms
through two processes; codification and encoding as acceptable format to ART1 ANN
for training and testing phase. In addition, K-mean clustering algorithm has been used to
improve performance of the proposed system, where ART1 categorizes network data
flow into normal and four attacks (DoS, Probe, R2L and U2R). Also ART1 sub system
recognize and memories the old learning attack patterns.
The main function of this process (which mentioned above) that it has initial
clustering and it increases the similarity between the same category, and at the same
time supports the difference between others by adding new feature to dataset notes the
Figure (6-1).
In training phase, there is an important parameter so called the vigilance
threshold. We noticed that the comparison between different threshold (when vigilance
value take: 0.7, 0.8, 0.9 and 0.95) in Carpenter / Grossberg-ART1 ANN, preferred to
select vigilance = 0.9 because give the best results for DR, AccR, FPR, and FNR as
showed in Figure (6-2)
Depending on the adjusted values of parameters as (weight factor = 2, second
norms = 2, vigilance = 0.9) we have got results demonstrated in Table (6-3) that
ART1 has a very good results that belong to normal and DoS about 98.83% and 98.10%
respectively. But the drawback of the ATR1 was the U2R detects 29 patterns (records)

97
from 52 patterns as total in testing phase. From the results of the research we conclude
that our system has many advantages over than supervised NN system such as resilient
back-propagation. Beside, our system doesn’t suffer from stability / plasticity while
previous IDSs suffer from (i.e. forgetting old learning). This proposed simulation
system compute the FPR and FNR which is better than previous results of Al-Rashdan,
2011 Na'mh, Z. (2012) as shown in Table (6-8)
6.8 Future Work
The researcher recommends the following suggestions:
Enhance the capability of ART1 algorithm in proposed IDS by choosing
best candidate rather than minimum index max value for winning node in
layer 2 such that has more than one candidate
Enhancing FPR and FNR by saving several patterns for well-known
types(normal or attack)
Reduce number of features by considering the importance features for each
class and discarding the weak ones.
Enhance the optimal features for each class.
Design IDS to detect attacker before they get access, or during the process
of getting access
Design an IDS to prevent the intrusion
Design optimal an algorithm to improve the vigilance in proposed IDS.
Enhance our proposed system, so except continuous data

98
References
- Al-Rashdan, W. (2011). A Hybrid artificial neural network model (Hopfield-
SOM with Conscience) for effective network intrusion detection system,( PhD
thesis) The Arab Academy for Banking and Financial Sciences, Amman: Jordan.
- Anand, A., and Patel, B. (2012). An Overview on Intrusion Detection System and
Types of Attacks It can Detect Considering Different Protocols. Vol. 2, Issue. 8.
ISSN: 2277-128. (IJARCSSE). PP. 94-98.
- Aziz, A., Azar, A. T., Hassanien, A. E., and Hanafy, S. E. O. (2014). Negative
Selection Approach Application in Network Intrusion Detection Systems. ISSN:
.1403.2716
- Beqiri, E., Lee, S. W., & Draganova, C. (2010) A Neural Network Approach for
Intrusion Detection Systems. In 5th Conference in Advances in Computing and
Technology (London, United Kingdom, 27th Jan) (pp. 209-217). University of
East London., pp. 211 -212viewed 2 Dec 2013. Available at:
http://roar.uel.ac.uk/619/1/Beqiri,%20E%20(2010)%20AC%26T%20209-
217.pdf
- Boncheva, V. (2007). A short survey of intrusion detection systems. Problems of
Engineering Cybernetics and Robotics, Vol. 58, PP. 23-30.
- Chebrolu, S., Abraham, A., & Thomas, J. P. (2004, January). Hybrid feature
selection for modeling intrusion detection systems. In Neural Information
Processing (pp. 1020-1025). Springer Berlin Heidelberg.
99
- Dastanpour, A., Ibrahim, S., and Mashinchi, R. (2014). Using Genetic Algorithm
of Supporting Artificial Neural Networks for Intrusion Detection Systems. ISBN:
978-0-9891305-4-7. (SDIWC).
- Dipali, G. (2013) Network Traffic Intrusion Detection System using Decision
Tree & K-Means Clustering Algorithm. International Journal of Emerging
Trends and Technology in Computer Science. Vol 2, (5), 218-220.
Dongare, A. D., Kharde, R. R., & Kachare, A. D. (2012). Introduction to -
artificial neural network. International Journal of Engineering and Innovative
Technology (IJEIT), 2, 189-194
- Elngar, A., Mohamed, D., & Ghaleb, F. (2013). A Real-Time Anomaly Network
Intrusion Detection System with High Accuracy. Information Sciences Letters
International Journal, 2(2), 49-56.
- Eluyode, O. S., & Akomolafe, D. T. (2013) Comparative study of biological and
artificial neural networks.
- Faraoun, K. M., & Boukelif, A. (2006). Neural networks learning improvement
using the K-means clustering algorithm to detect network intrusions.
International Journal of Computational Intelligence, 3(2), 161-168.
- Fausett, L. V. (1994). Fundamentals of neural networks. Prentice-Hall.
- _________. (2008). Fundamentals of Neural Networks Architecture, Algorithm,
and Applications, Pearson Education, Inc. ( ch5)

100
- Freeman, J. A., & Skapura, D. M. (1991).Neural networks: algorithms,
applications, and programming techniques. Reading, Massachussets: Addison-
Wesley.
- Freriks, L. W., Cluitmans, P. J. M., & van Gils, M. J. (1992). The Adaptive
Resonance Theory Network:(Clustering-) Behaviour in Relation With Brainstem
Auditory Evoked Potential Patterns. University of Technology.
- Gaidhane, R., Vaidya, C., and Raghuwanshi, M. (2014). Survey: Learning
Techniques for Intrusion Detection System (IDS). CSIDL.
- Gong, Y., Lazebnik, S., Gordo, A., & Perronnin, F. (2013). Iterative
quantization: A procrustean approach to learning binary codes for large-scale
image retrieval. Pattern Analysis and Machine Intelligence, IEEE Transactions
on, 35(12), 2916-2929.
- Grossberg, S. (2013). Adaptive Resonance Theory: How a brain learns to
consciously attend, learn, and recognize a changing world. Neural Networks, 37,
.1-47
- Gurney, K. (1997). An introduction to neural networks. CRC press.
- Hagan, M. T., Demuth, H. B., & Beale, M. H. (1996). Neural network
design(Vol. 1). Boston:Pws.
- Hajek M. (2005).Neural Networks, Neural Networks.doc, (2005).
101
- Haykin, S., & Network, N. (2004). A comprehensive foundation. Neural
Networks, 2(2004).
- Heaton, J. (2008). Introduction to neural networks with Java. Heaton Research,
Inc.
- He, H. (2012). Monitoring and anomaly detection in solar thermal systems
using adaptive resonance theory neural networks.
- Kavuri, N. C., & Kundu, M. (2011). ART1 network: application in wine
classification. International Journal.
- Kayacik, H. G., Zincir-Heywood, A. N., & Heywood, M. I. (2005). Selecting
features for intrusion detection: A feature relevance analysis on KDD 99
intrusion detection datasets.
- King, J. S., & Pribram, K. H. (Eds.). (2013). Scale in Conscious Experience: Is
the Brain Too Important To Be Left To Specialists To Study?. Psychology Press.
- Kizza, J. (2013). Guide to Computer Network Security, Computer,
Communication, and Network. DOI: 10.10071978-1-4471-4543-1, Springer-
Velag 2013. PP. 43-45.
- Kumar, K., Kumar, G., & Kumar, Y. (2013). Feature Selection Approach for
Intrusion Detection System. International Journal of Advanced Trends in
Computer Science and Engineering (IJATCSE), Vol.2 , No.5, Pages :47-53.In
Proceedings of the third annual conference on privacy, security and trust.
102
- Kumar, K., & Thakur, G. S. M. (2012). Advanced Applications of Neural
Networks and Artificial Intelligence: A Review. International Journal of
Information Technology and Computer Science, 4(6), 57.
- Krenker, A., Bester, J., & Kos, A. (2011). Introduction to the artificial neural
networks. Artificial neural networks: methodological advances and biomedical
applications. InTech, Rijeka. ISBN, 978-953.
- Krishna, V. A., and Victoire, T. A. A. (2013). Analysis of Firewall Policy Rules
a Comparative Study. Analysis, 6(5), 112-118.
- Lara, F. (1998). Artificial Neural Networks: An Introduction. Instrumentation
and Development, 3(9).
- Liu, Z., Florez, G., & Bridges, S. M. (2002). A comparison of input
representations in neural networks: a case study in intrusion detection. InNeural
Networks, 2002. IJCNN'02. Proceedings of the 2002 International Joint
Conference on (Vol. 2, pp. 1708-1713). IEEE.
- Liu, L., Wan, P., Wang, Y., & Liu, S. (2014). Clustering and Hybrid Genetic
Algorithm based Intrusion Detection Strategy. TELKOMNIKA Indonesian
Journal of Electrical Engineering, 12(1), 762-770.
- Lubna K, Cyriac R. (2013) A Study on Firewall Policy Anomaly Representation
Techniques. International Journal of Advanced Research in Computer and
Communication Engineering. Vol. 2, Issue 4, April 2013.

103
- Madbouly, A. I., Gody, A. M., & Barakat, T. M. (2014). Relevant Feature
Selection Model Using Data Mining for Intrusion Detection System. arXiv
preprint arXiv:1403.7726.
- Majeed, P., and Kumar, S. (2014). Genetic Algorithm in Intrusion Detection
Systems: A Survey. International Journal of Innovation and Applied Studies
(IJIAS). Vol. 5, Issue. 3. ISSN: 2028-9324. PP. 233-240.
- Manning, T., Sleator, R. D., & Walsh, P. (2013). Biologically inspired
intelligent decision making: A commentary on the use of artificial neural
networks in bioinformatics. Bioengineered, 5(2), 0-1.
- Massey, L. (2009). Discovery of hierarchical thematic structure in text
collections with adaptive resonance theory. Neural Computing and
Applications,18(3), 261-273.
- Mermillod, M., Bugaiska, A., & Bonin, P. (2013). The stability-plasticity
dilemma: investigating the continuum from catastrophic forgetting to age-
limited learning effects. Frontiers in psychology, 4.
- Moradi, M., and Zulkernine, M. (2004). A neural network based system for
intrusion detection and classification of attacks. In Proceedings of the 2004
IEEE international conference on advances in intelligent systems-theory and
applications.

104
- Mostaque, Md., and Hassan, M. (2013). Current Studies on Intrusion Detection
Systems, Genetic Algorithm, and Fuzzy Logic. International Journal of
Distributed and Parallel Systems (IJDPS). Vol. 3.
- Münz, G., Li, S., & Carle, G. (2007, September). Traffic anomaly detection
using k-means clustering. In GI/ITG Workshop MMBnet.
- Na'mh, Z. (2012). An Enhanced resilient backpropagation artificial neural
network for intrusion detection system. (MSc thesis). MEU: Amman, Jordan.
- Naoum,R. , Aziz,S., Alabsi,F.(2014). An Enhancement of the Replacement
Steady State Genetic Algorithm for Intrusion Detection. International Journal of
Advanced Computer Research (ISSN (print): 2249-7277 ISSN (online): 2277-
7970) Volume-4 Number-2 Issue-15 June-2014.
- Norgaard, L., Lagerholm, M., & Westerhaus, M. (2013). Artificial Neural
Networks and Near Infrared Spectroscopy-A case study on protein content in
whole wheat grain. Foss White Paper http://www. foss. dk/campaign/-
/media/242657904D734CE9B0652C3D885776AE.
- Oks¨uz A., 2007, Unsupervised Intrusion Detection System, Publisher :
Informatics and Mathematical Modelling, Technical University of Denmark,
DTU Series:IMM-Thesis-2007-20,p.p15 viewed 15 Nov 2013. Available at:
http://etd.dtu.dk/thesis/200720/imm5193.pdf

105
- Olusola, A. A., Oladele, A. S., & Abosede, D. O. (2010). Analysis of KDD’99
Intrusion detection dataset for selection of relevance features. In Proceedings of
the World Congress on Engineering and Computer Science (Vol. 1, pp. 20-22).
- Paliwal, S., and Gupta, R. (2012). Denial-of-Service, Probing, and Remote to
User R2l Attacks Detection Using Genetic Algorithm. International Journal of
Computer Applications (0975-8887). Vol. 60, No. 19. December 2012, PP. 57-
62.
- Pervez, S., Ahmad, I., Akram, A., & Swati, S. (2007). A comparative analysis of
artificial neural network technologies in intrusion detection systems. WSEAS
Transactions on Computers, 6(1), 175-180. viewed 25 October 2013, Available
at: http://www.labplan.ufsc.br/congressos/WSEAS/papers/517-423.pdf
- Prasad, M. S., Babu, A. V., and Rao, M. K. B. (2013). An Intrusion Detection
System Architecture Based on Neural Networks and Genetic Algorithms.
International Journal of Computer Science and Management Research, 2.
- Priddy, K. L., & Keller, P. E. (2005). Artificial neural networks: an introduction
(Vol. 68). SPIE Press.
- Reddy, E. (2013). Neural networks for intrusion detection and its applications.
In Proceedings of the World Congress on Engineering (Vol. 2). London, U.K.
- Riad, A. M., Elhenawy, I., Hassan, A., & Awadallah, N. (2013). Visualize
Network Anomaly Detection By Using K-Means Clustering Algorithm.
International Journal of Computer Networks & Communications, 5(5).
106
- Sahu, S. K., & Jena, S. K. (2014, June). A study of K-Means and C-Means
clustering algorithms for intrusion detection product development. In 2nd
Journal Conference on Innovation, Management and Technology (JCIMT 2014
2nd), 16-17th June, 2014 Hong Kong.
- Rojas, R. (1996). Neutral Networks: A Systematic Introduction. Springer
Scarfone, K., and Mell, P. (2007). Guide to Intrusion Detection and Prevention
System (IDPS). Special Publication 800-94. Recommendations of the National
Institute of Standard and Technology NIST.
- Sammut, C., & Webb, G. I. (Eds.). (2010). Encyclopedia of machine learning.
Springer.
- Shamshirband, S., Anuar, N. B., Kiah, M. L. M., & Patel, A. (2013). An
appraisal and design of a multi-agent system based cooperative wireless
intrusion detection computational intelligence technique. Engineering
Applications of Artificial Intelligence, 26(9), 2105-2127.
- Sharma, S., Kumar, S., and Kaur, M. (2014). Recent Trends in Intrusion
Detection System using Fuzzy Genetic Algorithm. International Journal of
Advanced Research in Computer and Communication Engineering Vol. 3, Issue.
5, ISSN: 2278-1021, PP. 6472-6476.
- Shaveta, E., Bhandana, A., and Saluja, K. (2014). Applying Genetic Algorithm in
Intrusion Detection System: A Comprehensive Review. Proceeding of

107
International Conference on Recent Trends in Information, Telecommunication,
and Computing, ITC, DOI: 02.ITC.2014.5.46. PP. 102-112.
- Shukla, A., Tiwari, R., & Kala, R. (2012). Real life applications of soft
computing. CRC Press.
- Singh, A. P., & Singh, M. D. (2014). Analysis of Host-Based and Network-
Based Intrusion Detection System. I.J. Computer Network and Information
Security, 41-47.
- Singh, M., & Verma, K. (2011). Speech Recognition Using Neural
Networks.International Journal of Technology And Engineering System
(IJTES), 2(1).
- Singh, S., Saxena, K., and Khan, Z. (2014). Intrusion Detection System Based on
Artificial Intelligence Techniques. International Conference of Advanced
Research and Innovation (ICARI-2014). ISBN: 978 – 93 – 5156 – 328. PP. 536-
543.
- Sivanandam, M. (2009). Introduction to artificial neural networks. vikas
publishing House PVT LTD.
- Smith, R. (2002). Network-based intrusion detection using neural networks.
InProc. ANNIE 2002 Conference. viewed 25 Nov 2013, Available at:
http://www.cs.rpi.edu/~szymansk/theses/smith.ms.02.pdf

108
- Song, J., Zhu, Z., Scully, P., & Price, C. (2014). Modified Mutual Information-
based Feature Selection for Intrusion Detection Systems in Decision Tree
Learning. Journal of Computers, 9(7), 1542-1546.
- Srivastav, N., & Challa, R. K. (2013). Novel intrusion detection system
integrating layered framework with neural network. In Advance Computing
Conference (IACC), 2013 IEEE 3rd International (pp. 682-689). IEEE.
- Sumit, S., Mitra, D., & Gupta, D. (2014). Proposed Intrusion Detection on ZRP
based MANET by effective k-means clustering method of data mining. In
Optimization, Reliability, and Information Technology (ICROIT), 2014
International Conference on (pp. 156-160). IEEE.
- Sunke B, (2008) thesis: Research and Analysis of Network Intrusion Detection
System. pp. 9-10.
- Tavallaee, M., Bagheri, E., Lu, W., & Ghorbani, A. A. (2009). A detailed
analysis of the KDD CUP 99 data set. In Proceedings of the Second IEEE
Symposium on Computational Intelligence for Security and Defence
Applications 2009.
- Tyugu, Ė. K. (2007). Algorithms and architectures of artificial intelligence (Vol.
159).
- Vinchurkar, D. P. and Reshamwala, A. (2012). A Review of Intrusion Detection
System Using Neural Network and Machine Learning Technique. International
Journal of Engineering Science and Innovative Technology (IJESIT), 1(2).

109
- Wang, G., Hao, J., Ma, J., & Huang, L. (2010). A new approach to intrusion
detection using Artificial Neural Networks and fuzzy clustering. Expert Systems
with Applications, 37(9), 6225-6232.
- Xiao, J., & Song, H. (2009). A novel intrusion detection method based on
adaptive resonance theory and principal component analysis. In
Communications and Mobile Computing, 2009. CMC'09. WRI International
Conference on (Vol. 3, pp. 445-449). IEEE.
- Yegnanarayana, B. (2009). Artificial neural networks. PHI Learning Pvt. Ltd
- Al-Nuimat, Z. J. (2013). An Enhanced Hopfield Neural Network Model for
Misuse Intrusion Detection System. (Master dissertation, Middle East
University).
- Zurada, J. M. (1992). Introduction to artificial neural systems.