INTRODUCTORY CHEMICAL ENGINEERING COURSE BASED ON ANALOGIES AND
32
INTRODUCTORY CHEMICAL ENGINEERING COURSE BASED ON ANALOGIES AND RESEARCH-BASED LEARNING BY: ZIN EDDINE DADACH
Transcript of INTRODUCTORY CHEMICAL ENGINEERING COURSE BASED ON ANALOGIES AND

INTRODUCTORY CHEMICAL
ENGINEERING COURSE
BASED ON ANALOGIES AND
RESEARCH-BASED LEARNINGBY: ZIN EDDINE DADACH

Introduction The main goal of this paper is to present an introductory course in
chemical engineering based on analogies and research-based
activities.
The use of analogies can be a very helpful tool used to build a strong
engineering foundation for freshmen with weak high school scientific
background.
To help students shift from the imaginary of the five analogies utilized in
the course to the real pictures of some engineering concepts, the
similarity to the analogy is followed by simple lab experiments or class
activities.
The final chapter of this course is related to energy efficiency to
demonstrate to freshmen who lack scientific background that their
attitude could make them more efficient and lead them to success.

Course Learning Outcomes
This course aims to introduce the concepts used in the analysis of chemical
engineering problems.
Based on analogies and research-based learning, it is intended to provide
freshmen a global overview of the chemical engineering field and assist them
visualize the elementary principles of transport phenomena, thermodynamics,
energy conservation and energy efficiency.
The Learning outcomes (LO’s) of the course are related to the following
chapters: (1) Electricity, (2) Fluid Dynamics, (3) Heat Transfer, (4) Mass Transfer
and Solubility, (5) Thermodynamics, (6) Energy efficiency.
For every chapter, the teaching strategy followed the three main steps: (a) a
basic introduction to theory, (b) Similitude with the selected Analogy, (c)
Research-based learning: lab experiments or class activities and (d) A
conclusion.

Transport phenomena: Basic equation
Electrical charges, momentum, mass and heat transport
share all of them a very similar framework where
movement is motivated by a driving force within the
system and is inversely proportional to the resistance
located between two poles.
As a consequence, these processes could be described
using the following generalized relationship:
𝐹𝑙𝑜𝑤 =𝐷𝑟𝑖𝑣𝑖𝑛𝑔 𝐹𝑜𝑟𝑐𝑒
𝑅𝑒𝑠𝑖𝑠𝑡𝑎𝑛𝑐𝑒(1)

Analogy and Class activity
To make transport phenomena easier to understand, traffic situations on different roads of Abu Dhabi are selected as the analogy to visualize movements during chemical engineering processes.
Some pictures showing cars on highways and streets of the city during different times of the day were distributed to the students. The objective of the activity was to analyze the following situations:

Analyzing different situations
Situation #1: Before 7 a.m., the corresponding pictures showed
roads and highways with only a few cars. It was deduced that only
few people had the motivation to go to work or study.
Consequently, the weak “total driving force” could explain the
small number of cars on the streets and highways. Based on eq. (1),
it could be concluded that the small “flow” of cars was not caused
by the width of the road but rather by the weak “total driving
force”.
Situation #2: Around 7:30 a.m., most people have started to leave
home and the corresponding pictures show that the number of
cars suddenly increases. During this rush hour, the total motivation
was very high and it is easy for the students to link the larger
number of cars on the highways to a higher “total driving force“.

Situation #3: Pictures related to the traffic in the city also show that
the streets are full of cars but that their number is much lower
compared to the number of cars on the highways (previous
pictures). As a consequence, for the same “total driving force”,
the width of the road made a difference on the number of cars.
Analyzing eq. (1), students link the small number of cars to the width
of the road.
Situation #4: Finally, students have to imagine the situation around
midnight where the total motivation is now close to zero. Streets
and highways become very quiet. Based on eq. (1), with no
“driving force”, any system becomes static.
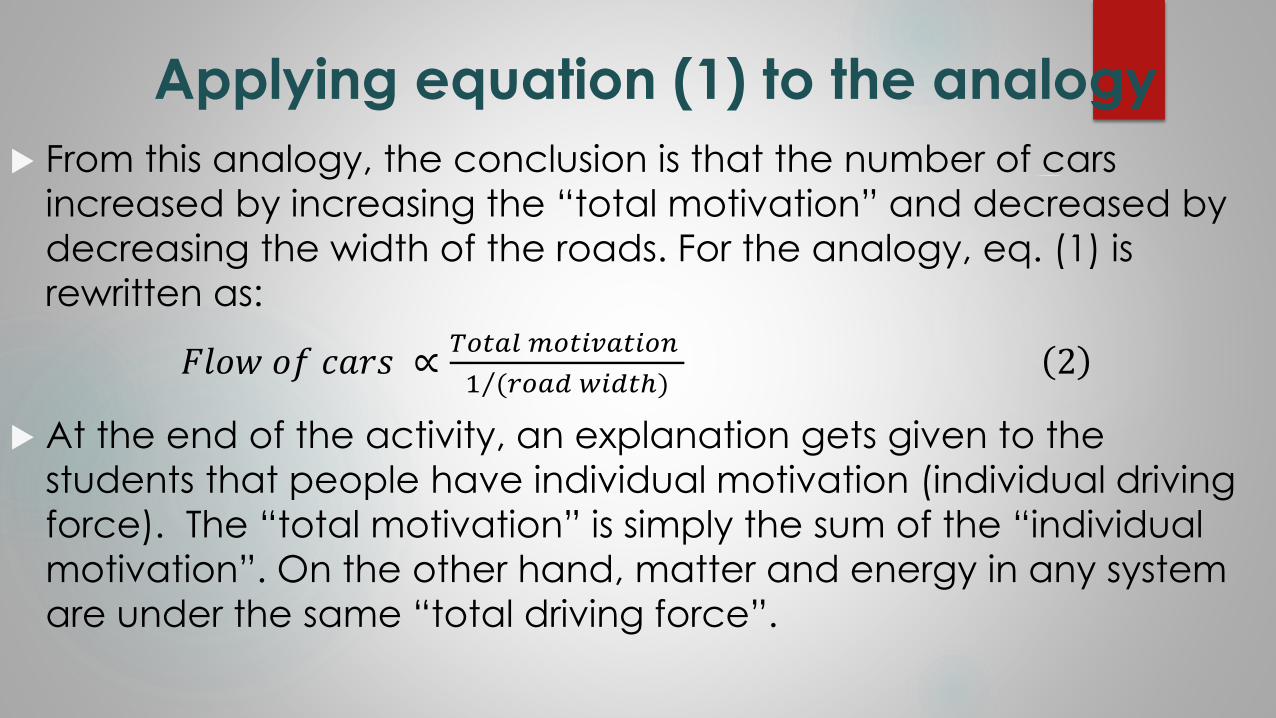
Applying equation (1) to the analogy
From this analogy, the conclusion is that the number of cars
increased by increasing the “total motivation” and decreased by
decreasing the width of the roads. For the analogy, eq. (1) is
rewritten as:
𝐹𝑙𝑜𝑤 𝑜𝑓 𝑐𝑎𝑟𝑠 ∝𝑇𝑜𝑡𝑎𝑙 𝑚𝑜𝑡𝑖𝑣𝑎𝑡𝑖𝑜𝑛
1 (𝑟𝑜𝑎𝑑 𝑤𝑖𝑑𝑡ℎ)2
At the end of the activity, an explanation gets given to the
students that people have individual motivation (individual driving
force). The “total motivation” is simply the sum of the “individual
motivation”. On the other hand, matter and energy in any system
are under the same “total driving force”.

Chapter I: Electricity Fundamentals: Voltage (V), current (I), and resistance (R) were first defined as shown
in fig 2. In order to shift from the pictures of the analogy to the basics of Ohm’s law, a
laboratory experiment was designed (picture). Voltage (V), current (I), and resistance
(R) were first defined as shown in figure.
Movement of electrons (I) in an electrical circuit looks like the flow of cars on the
roads where electrons could be considered as “nano-cars”, (2) the value of the
electrical resistance (R) could be linked to the width of the road, (3) the difference in
voltage (V) represents the “total motivation” of people to take the road.

Analogy & Ohm’s Law: Research-based Learning Students conducted the lab experiments using the following procedure:
Similar to situations #1 and 2 of the analogy, the current through the circuit was measured using
a small electrical resistance of 5 Ω and selecting two different values of voltage (small and
large). The experimental data are shown in Table 1.
Similar to situation #2 and 3 of the analogy, a large current source of 80V was selected and the
intensity was measured for two electrical resistances of the circuit (table 2).
Similar to situation #4 of the analogy, a zero voltage was utilized and the students noticed that
there was no current even with a small electrical resistance. The system becomes static (Table
2).
Analogy Resistance ( Ω) Voltage (V) Current (A)
Situation #1 5 12 2.4
Situation #2 5 80 16
Analogy Voltage (V) Resistance (Ω) Current (A)
Situation #2 80 5 16
Situation #3 80 100 0.8
Situation #4 0 5 0

Ohm’s law: Research-tutored Learning
During the second part of the activity (Figure 4), every group of students analyzed the collected data. In concordance with the analogy, it was concluded that the flow of electrons is motivated by a potential in voltage (total motivation) and controlled by varying the value of the electrical resistance (width of the road) of the system.
Based on Equation (1), the corresponding equation (3)
was derived : 𝐹𝑙𝑜𝑤 𝑜𝑓 𝑒𝑙𝑒𝑐𝑡𝑟𝑜𝑛𝑠 ∝𝑉𝑜𝑙𝑡𝑎𝑔𝑒
𝐸𝑙𝑒𝑐𝑡𝑟𝑖𝑐𝑎𝑙 𝑅𝑒𝑠𝑖𝑠𝑡𝑎𝑛𝑐𝑒
Finally, equation (3) was linked to Ohm’s law:
𝐼 =𝑄
𝑡=
∆𝑈
𝑅Where I stands for the Electrical current, Q electrical charges in Coulombs, t time in seconds, R Electrical resistance in Ohms and ΔU Potential energy of a battery in Volts.
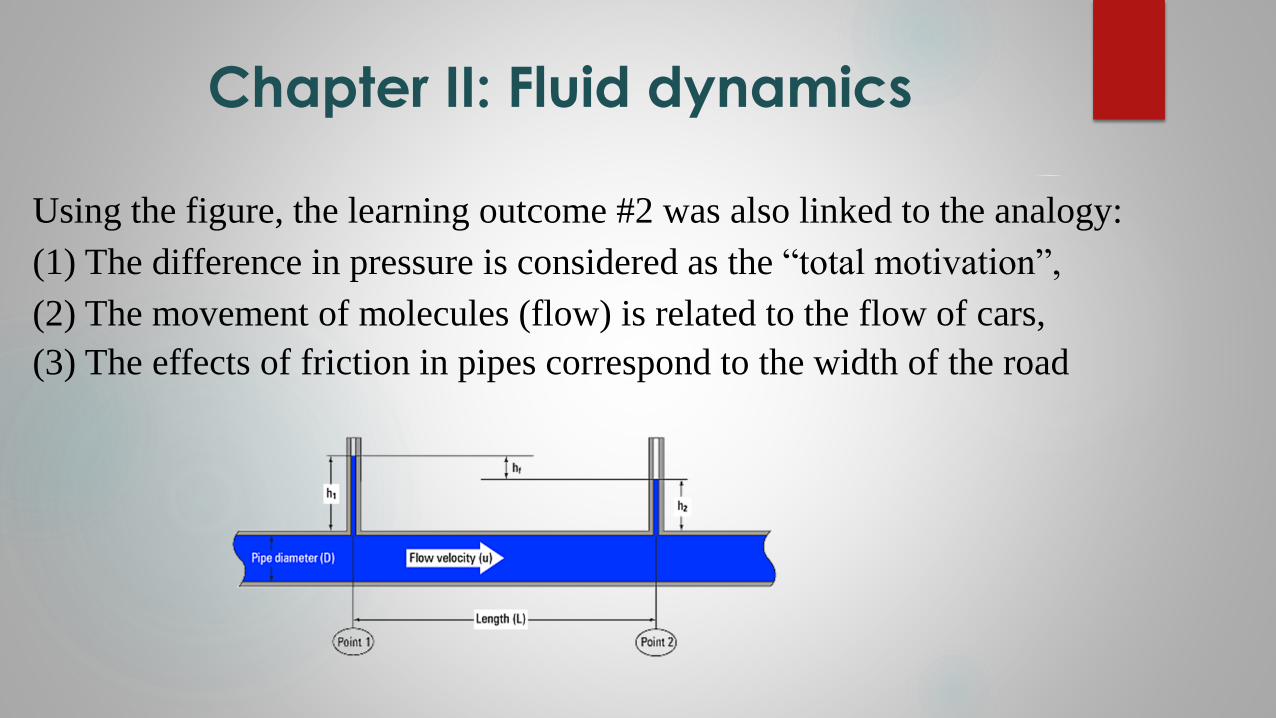
Chapter II: Fluid dynamics
Using the figure, the learning outcome #2 was also linked to the analogy:
(1) The difference in pressure is considered as the “total motivation”,
(2) The movement of molecules (flow) is related to the flow of cars,
(3) The effects of friction in pipes correspond to the width of the road

Research-based learning
As shown in picture, the corresponding laboratory consists of two small
bottles of propane usually used for picnic. One bottle has high pressure
and the other has low pressure. For the investigation, the two bottles are
connected one after the other to a burner with a manual valve used to
create friction in the system. The height of the flame is measured as an
indication of the flow

Analogy and fluid dynamics
During the first set of experiments (situations #1 and # 2 of the analogy), using a full opening of the
valve, the bottle having low pressure and high pressure are utilized simultaneously and the height of the
flame is measured (Table).
The second set of experiments (situations #2 and #3 of the analogy) consist of using the bottle having
high pressure and measuring the height of the flame for two positions of the valve.
During the last experiment (Situation #4 of the analogy), students use an empty bottle and realize that,
without a variation in pressure between the bottle and the atmosphere, there is no flame even with the
valve fully open (minimum friction). The system becomes static.
Analogy Opening of the valve
(%)
Pressure in bottle
(psig)
Height of flame (cm)
Situation #1 100 10 15
Situation #2 100 50 > 50
Analogy Pressure in bottle (psig) Opening of the valve (%) Height of flame (cm)
Situation #2 50 100 > 50
Situation #3 50 5 7
Situation #4 0 100 0

Fluid dynamics: Research-tutored learning
During the second part of the activity, students analyze the collected data and realize
that the flame is higher when the bottle is full (high pressure) and the height of the flame
increases with the opening of the valve (decreasing friction). In agreement with the
analogy, it is concluded that the flow of propane increases with increasing pressure in the
bottle (driving force) and decreases with the closing of the valve (increasing friction).
After this picnic experiment, the students rewrite the general equation (1):
𝐺𝑎𝑠 𝑙𝑜𝑤 ∝=𝑃𝐵−𝑃𝑎𝑡𝑚
1 𝑂𝑉
Where: PB= Absolute pressure in bottle, PATM = Atmospheric pressure, OV= Percentage of
the opening of the valve. At the end of the activity, the following equation, derived from
Bernoulli’s equation, was explained:
𝐹𝑙𝑜𝑤 = ∆𝑃.2
𝜌𝑥
𝐴12 𝑥 𝐴2
2
(𝐴12− 𝐴2
2 )
Where ∆P= Differential pressure between the bottle and the atmosphere, A1 and A2 =
Area of the pipe and valve respectively, ρ= Density of fluid

Chapter III: Heat transfer After an introduction of the different types of heat transfer, it is explained that heat transfer by
conduction depends on the thermal conductivity of metals and the difference in
temperature between the two ends of the metal.
To link heat transfer by conduction (fig.) to the analogy, (1) the difference in temperatures represents the “total motivation” for heat flow, (2) the movement of heat waves (heat flow) is
the flow of cars, (3) the value of the thermal conductivity corresponds to the width of the
road.

Research-based learning
As shown in picture, the lab set-up consist of copper and steel rods, a beaker containing 100
grams of warm water and a beaker containing 100 grams of water at 0 °C. Every group
conduct the experiments following the investigation strategy:
Similar to situations #1 and #2 of the analogy, during the first set of experiments, copper is used
and the temperature of the cold water is measured for two the different temperatures of
warm water ( 20 °C and 100 °C).
Analogy Metal Temperature warm
water (°C)
Final Temperature
cold water (°C)
Situation #1 Copper 20 3.7
Situation #2 Copper 100 16

2. Similar to situations #2 and #3 of the analogy, the temperature of the warm water of
1000C is used and the temperature of the cold water is measured (Table 6) for the coper
and steel simultaneously (Table).
3. Similar to situation #4 of the analogy, water in the two beakers has the same
temperature of 00C and the students realize that the temperature stayed the same in the
two beakers using copper (maximum conductivity). The system becomes static (Table).
Analogy Metal Temperature warm water (°C) Final Temperature cold water (°C)
Situation #2 Copper 100 16
Situation #3 Steel rod 100 1.8
Situation #4 Copper 0 0

Research-tutored-learning Analyzing the collected data during the second part of the activity, students find out that the
temperature of the cold water reaches a maximum of 16°C when temperature of the warm water was 100°C and copper are utilized. On the other hand, the temperature of the cold water reaches a minimum of 1.8 °C when the temperature of the warm water is 100°C and steel rod is used.
In order to create images that could help students understand the concept of conductivity, copper which has a thermal conductivity of 385 W/m.K, was compared to a car in a highway moving with high speed and steel, which has a thermal conductivity of 54 W/m.K, was compared to a car in a street moving with a much lower speed. As a consequence, the resistance to heat transfer by conduction is the inverse of the thermal conductivity. Based on equation (1), the following equation is derived by the students to explain their experimental data:
𝐻𝑒𝑎𝑡 𝑏𝑦 𝑐𝑜𝑛𝑑𝑢𝑐𝑡𝑖𝑜𝑛 =Δ𝑇
1 (𝑇ℎ𝑒𝑟𝑚𝑎𝑙 𝑐𝑜𝑛𝑑𝑢𝑐𝑡𝑖𝑣𝑖𝑡𝑦)
Fourier’s law of heat conduction (Thermal Ohm’s law) is introduced and explained:
𝑄 =Δ𝑇
𝑑 𝑘𝐴
Where ∆T= difference in Temperature, d= d= thickness of the slab, A= surface area of the metal, k= heat conductivity of the metal.

Chapter IV: Mass Transfer & Solubility Similar to heat transfer, mass transfer of a solute (A) between two solvents occurs from high
concentration to low concentration. Using the convective mass transfer coefficient (k), the molecular flux (NA) is represented by the equation:
𝑁𝐴 = 𝑘 𝐶𝐴1 − 𝐶𝐴2
By definition, solubility is the capacity for one product (solute) to form a homogenous mixture (a solution) with another product (solvent). The objective of this learning outcome is to explain that solubility is related to molecular interactions

Analogy to explain solubility A second analogy is used in the course to create a bridge connecting the chemical
affinity between different species and the affinity between people. The selected analogy
for affinity is language. For example, in a foreign country, people who speak the same
language stay together because they feel comfortable and can communicate with each other. It is then explained that, like people, two different chemical species can mix
because of some affinities (like dissolves like).
The practical part related to mass transfer and solubility consisted of a lab experiment
about liquid-liquid extraction (picture).
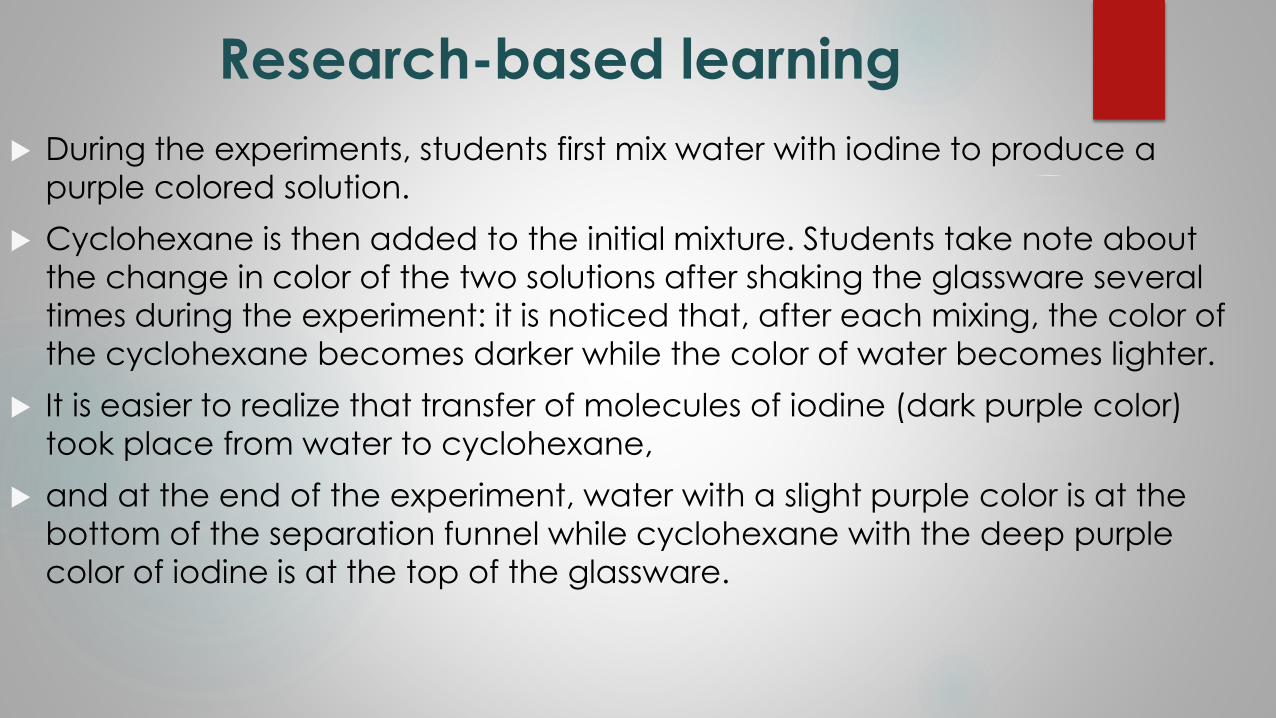
Research-based learning
During the experiments, students first mix water with iodine to produce a
purple colored solution.
Cyclohexane is then added to the initial mixture. Students take note about
the change in color of the two solutions after shaking the glassware several
times during the experiment: it is noticed that, after each mixing, the color of
the cyclohexane becomes darker while the color of water becomes lighter.
It is easier to realize that transfer of molecules of iodine (dark purple color)
took place from water to cyclohexane,
and at the end of the experiment, water with a slight purple color is at the
bottom of the separation funnel while cyclohexane with the deep purple
color of iodine is at the top of the glassware.

Research-tutored learning
During the second part of the activity, students use solubility
tables in order to interpret the outputs of the experiment. The
solubility of iodine in water at 20°C is 0.3 g/100g and the solubility
of iodine in cyclohexane is 2.8 g/100g.
It is then concluded that iodine (non-polar) is slightly soluble in
water (polar) because it has a weak interaction with the
hydrogen bonded water molecules. However, because,
cyclohexane (non-polar) has weaker solvent/solvent interactions
than water, iodine found it easier to disrupt these interactions
and insert itself between the molecules of cyclohexane.

Research tutored learning: Transport phenomena
At the end of the learning outcomes related to transport phenomena, a review of all the
processes is covered during a class activity. Every group of students has to fill the blanks
related to “flow” “driving force” and “resistance” of eq. 1 for all the transport phenomena in
the given table.
Flow Driving Force Resistance
Analogy Cars Sum of individual motivation
of people
1/ width of the road
Electricity Electrons Difference in voltage Electrical resistance
Fluid dynamics Molecules of propane Difference in pressure 1/ opening of the valve
Heat transfer Heat waves Difference in temperature 1/ thermal conductivity
Mass transfer Molecules of Iodine Difference in concentration 1/(mass transfer coefficient)

Chapter V: Thermodynamics
The law of conservation of energy states that the total energy of an isolated system is
constant and energy can be transformed from one form to another, but cannot be created
or destroyed. To make energy conservation easier to understand, money in different
currencies is selected as the third analogy.
The second law tells us that energy naturally flows from a higher concentration to a lower
concentration. In order to explain that natural movements are only from high energies to low
energies, the fourth analogy used in this course is physical strength.
Class activity : Analogy for 1st law of thermodynamics
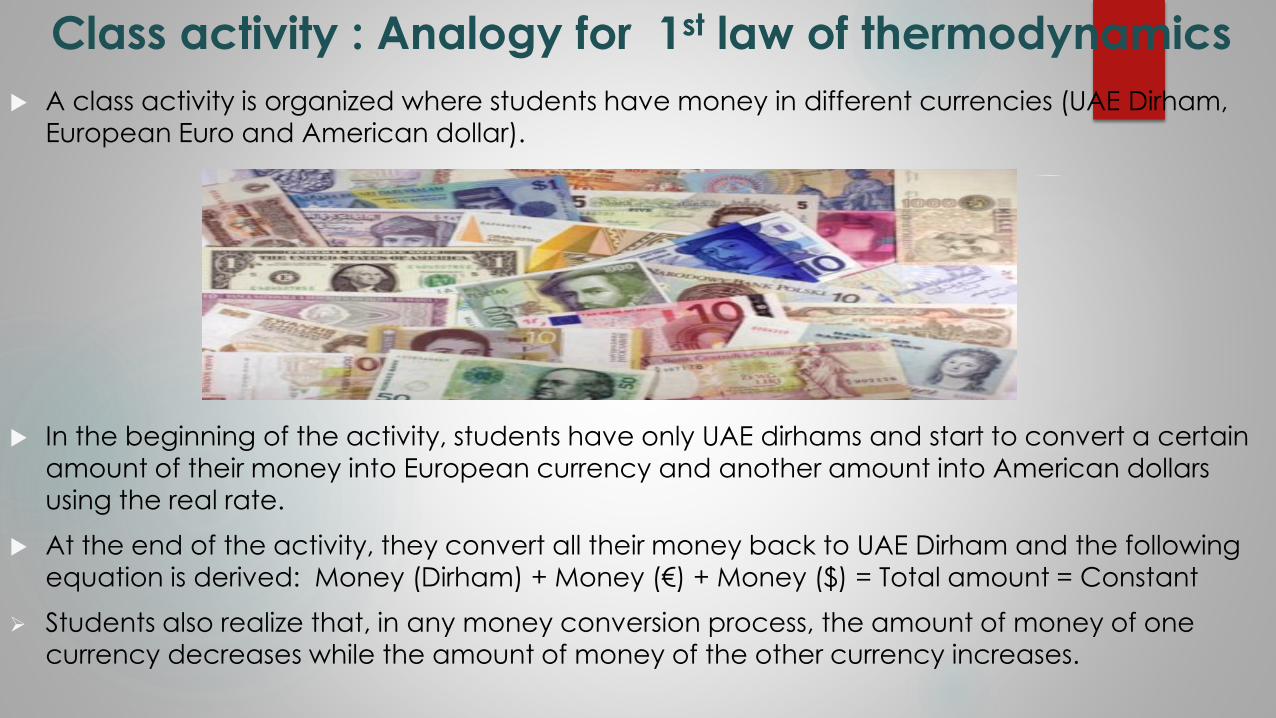
A class activity is organized where students have money in different currencies (UAE Dirham,
European Euro and American dollar).
In the beginning of the activity, students have only UAE dirhams and start to convert a certain
amount of their money into European currency and another amount into American dollars
using the real rate.
At the end of the activity, they convert all their money back to UAE Dirham and the following
equation is derived: Money (Dirham) + Money (€) + Money ($) = Total amount = Constant
Students also realize that, in any money conversion process, the amount of money of one
currency decreases while the amount of money of the other currency increases.

Class activity : 1st law of thermodynamics
During the second part of the activity, the principle of mechanical energy conservation (Bernoulli’s equation) is introduced and students are asked to solve the following problem: “Water flows through a horizontal pipe. At one end, the water in the pipe has a pressure of 150,000 Pascal (Pa), a speed of 5.0 m/s. At the other end, the speed of the water is 10 m/s.
The pressure at the second end should be calculated using eq.
𝑝 +1
2𝜌𝑣2 𝑘𝑖𝑛𝑒𝑡𝑖𝑐 + 𝜌𝑔ℎ 𝑝𝑜𝑡𝑒𝑛𝑡𝑖𝑎𝑙 = 𝐶𝑜𝑛𝑠𝑡𝑎𝑛𝑡
Where p is pressure, ρ= density, v= velocity, g= gravity and h= height.
Similar to the analogy, the kinetic energy increases by increasing the velocity from 5 m/s to 10 m/s. As a consequence, the pressure will decrease from 150,000 Pa to 112,500 Pa.
In conclusion, like the total amount of money, total energy is then conserved in any system but can be converted from one form to another. It is also explained that, like the loss of some money during money transfer in a different currency, some amount of energy is also lost during any energy conversion process mainly by friction.
Class activity : Analogy for 2nd law of thermodynamics
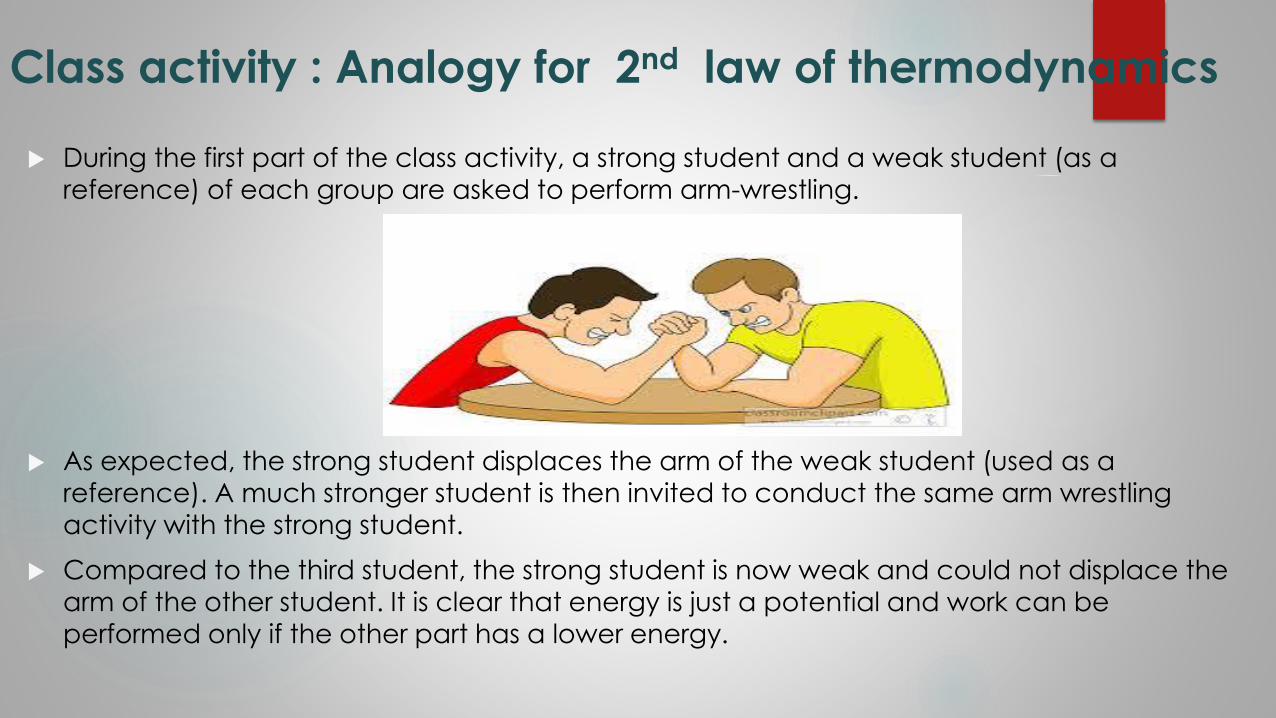
During the first part of the class activity, a strong student and a weak student (as a
reference) of each group are asked to perform arm-wrestling.
As expected, the strong student displaces the arm of the weak student (used as a
reference). A much stronger student is then invited to conduct the same arm wrestling
activity with the strong student.
Compared to the third student, the strong student is now weak and could not displace the
arm of the other student. It is clear that energy is just a potential and work can be performed only if the other part has a lower energy.

Class activity : 2nd law of thermodynamics Following the analogy, a second activity is organized where students are asked to study a steam table.
Enthalpy is the selected energy in this activity (Table).
It is found that under some conditions at the beginning of the tables, the enthalpy of the saturated liquid water is very close to zero. The values of the enthalpy became higher by increasing temperatures.
It is explained that the pressure and temperature that give a zero value for the enthalpy are the “reference conditions” used in the table.
To continue the class activity, the two following temperatures are selected (T1= 32.018°F, P1= 0.08865 psiaand T2= 213.03°F, P2= 15 psia). The corresponding enthalpies of the saturated liquid at T1 and saturated steam at T2 are respectively hl1= 0 BTU/lbm and hg2= 1150.9 BTU/lbm.
Based on this analogy, it is explained that production of electricity from a steam turbine could happen only from a steam at high energy (hg2) to become a steam at lower energy (hl1).
Using the concept of energy conservation, the following equation is derived: ℎ𝑔2= ℎ𝑙1 +𝑊𝑜𝑟𝑘 𝑡𝑢𝑟𝑏𝑖𝑛𝑒
Saturated Steam
Pressure in Absolute PSI
Abs.
press.
(psia)
lb per
in²
Temp
° F
Specific volume
ft³ / lbm
Enthalpy
BTU / lbm
Entropy
btu / lbm × ° F
Abs.
press.
(psia)
lb per
in²
Water
V f
Steam
V g
Water
h f
Steam
h g
Water
S r
Steam
S g
0.08865
0.250
0.500
32.018
59.323
79.586
0.016022
0.016032
0.016071
3302.4000
1235.5000
641.5000
0.0003
27.382
47.623
1075.5
1067.4
1096.3
0.0000
0.0542
0.0925
2.1872
2.0967
2.0370
0.08865
0.250
0.500
1.000
3.000
6.000
10.000
14.696
101.74
141.47
170.05
193.21
212.00
0.016136
0.016300
0.016451
0.016592
0.016719
333.6000
118.7300
61.9840
38.4200
26.7990
69.730
109.420
138.030
161.260
180.170
1105.8
1122.6
1134.2
1143.3
1150.5
0.1326
0.2009
0.2474
0.2836
0.3121
1.9781
1.8864
1.8294
1.7879
1.7568
1.000
3.000
6.000
10.000
14.696
15.000
20.000
25.000
30.000
35.000
213.03
227.96
240.07
250.34
259.29
0.016726
0.016834
0.016927
0.017009
0.017083
26.2900
20.0870
16.3010
13.7440
11.8960
181.210
196.270
208.520
218.900
228.000
1150.9
1156.3
1160.6
1164.1
1167.1
0.3137
0.3358
0.3535
0.3682
0.3809
1.7552
1.7320
1.7141
1.6995
1.6872
15.000
20.000
25.000
30.000
35.000

VI: Energy efficiency
In chemical plants, energy is used as work or heat by equipment like compressors,
pumps, turbines, heat exchangers, boilers and condensers located at the interface
between the fluid in the process and the utilities (energy sources) used by the process. For
these equipment, energy efficiency could be defined as the ratio of total enthalpy change of the transported fluid (∆H) over the energy (E) used:
𝜂 =Δ𝐻
𝐸
To motivate students to take action for sustainable development, the last analogy used in
this introduction course is the well-known story of the “Tortoise and the Hare”. The hare
moved faster but in different directions. On the other hand, the tortoise was moving slowly
but steadily towards the final destination.

Class activity: Energy efficiency Based on the imaginary story, students use a P-V diagram to draw the path of both the hare and the tortoise between
the two fixed points (states) which are the beginning and the end of the imagined race.
Analyzing the P-V diagram, students realize that the area under the path used by the tortoise is much smaller than the
one utilized by the hare for the same change of states. Since the area under the state (1) and state (2) is the work PV
used by both animals, the following energy efficiencies could be written:
𝜂𝑇𝑢𝑡𝑜𝑖𝑠𝑒 =Δ𝐻
𝑊𝑇𝑢𝑟𝑡𝑜𝑖𝑠𝑒𝜂𝐻𝑎𝑟𝑒 =
Δ𝐻
𝑊𝐻𝑎𝑟𝑒
It is concluded, henceforth, that the hare wasted too much energy. The tortoise is then more
efficient and won the race even with a smaller capacity to run.
The final point to the freshmen with weak scientific background is that they should make efforts
and keep learning because their attitude and motivation is more important

Conclusion
This paper presented an introductory course of chemical engineering
designed for freshmen with weak high school scientific background. To
achieve this goal, five analogies, four research-based learning activities, four
research-tutored learning activities and two class activities were utilized.
The use of analogies helped freshmen with weak high school scientific
background visualize the concepts of chemical engineering.
Simple laboratory experiments and class activities were added for this
category of students in order to help them “touch” the learned concept and
use it properly in different chemical engineering applications.
A faculty evaluation conducted by students indicates that most of them had
fun working in groups and the different activities offered during this
introductory course motivated them to learn.