
Introduction1-1 Networking Overview. Introduction1-2 Introduction.
19
INTRODUCTION..............................................................................................................1
Need for Crash Analysis Systems................................................................................................................................1
Crash Analysis Systems in Iowa ..................................................................................................................................2
Related Projects...............................................................................................................................................................3
OBJECTIVES...................................................................................................................3
SYSTEM DEVELOPMENT............................................................................................4
Software Criteria and Selection ...................................................................................................................................4
Database Development ....................................................................................................................................................6Crash Data - Location................................................................................................................................................. 6Crash Data - Integration............................................................................................................................................. 7Reference Data............................................................................................................................................................. 7
Products ............................................................................................................................................................................8Explorer-ALAS............................................................................................................................................................. 8ArcView-ALAS.......................................................................................................................................................... 10
GIS-ALAS Usability......................................................................................................................................................11"Look and Feel"......................................................................................................................................................... 11Usability Study.......................................................................................................................................................... 13
EXAMPLE APPLICATIONS ........................................................................................13
High Crash Locations: Implications for Emergency Response............................................................................14
Underlying Socieconomic/Demographic Factors..................................................... Error! Bookmark not defined.
NEXT STEPS .................................................................................................................15
Data Input (conversions, location) ..............................................................................................................................16
High Crash Locations, Links and Intersections .....................................................................................................16
Technology transfer......................................................................................................................................................16System Distribution .................................................................................................................................................. 17Training, Beta-Testing, and Feedback................................................................................................................... 18
SUMMARY......................................................................................................................18

1
GIS-ALAS: The Integration and Analysis of Highway Crash Data in a GIS Environment
Reg Souleyrette1, Tim Strauss, Michael Pawlovich, and Brad Estochen, Center for TransportationResearch and Education, Iowa State University.
Abstract
The Center for Transportation Research and Education and the Iowa Department ofTransportation are developing a GIS-based Accident Location and Analysis System (GIS-ALAS).This system, an extension of Iowa’s DOS-based PC-ALAS, includes the location of all crashes onall roads in the state for the last ten years, about 700,000 records. It provides spatial display,query, and analysis capabilities for users in highway safety, law enforcement, and health services.This paper covers the history and status of GIS-ALAS development and methodologies for dataassimilation and system design. Issues covered include software selection, crash data andlocation, integration of background data and other applications, and distribution/security methods.
INTRODUCTION
Need for Crash Analysis Systems
Every day, on average, more than 100 persons are killed in highway crashes in the United States.In 1996, the National Highway Traffic Safety Administration (NHTSA) reported 6.8 million motorvehicle traffic crashes. That year, there were 37,351 crash-related fatalities and 2.3 millioninjuries.2 Due to the high number of deaths and injuries, state and federal agencies continuallyseek to improve the safety of highways and reduce the number of crashes. A useful tool forhighway agencies in the campaign to make roadways safer is a crash location and analysissystem, a database query tool that provides a method for storing and analyzing information aboutcrashes and, particularly, for identifying and mitigating high-crash locations and situations. Theobjective of this paper is to report on the development of a GIS-based crash analysis system forIowa.
Crash analysis requires information on the characteristics of crashes and potential contributingcircumstances. This includes data on the crashes themselves (number of crashes, severity ofcrashes, and number of vehicles and fixed objects struck), as well as highway features(geographic locations, roadway classifications, surface type, and traffic control devices), vehicle
1 Reg Souleyrette is Associate Director for Transportation Planning and Information Systems atthe Center for Transportation Research and Education and Associate Professor of Civil andConstruction Engineering at Iowa State University. Tim Strauss is a Research Associate atCTRE and Adjunct Professor of Community and Regional Planning at ISU. Michael Pawlovichand Brad Estochen are graduate students in Civil Engineering and research assistants at CTRE.2 National Highway Traffic Safety Administration. Traffic Safety Facts 1996: A Compilation ofMotor Vehicle Crash Data from the Fatal Accident Reporting System and General EstimatesSystem. U.S. Department of Transportation 1997
2
characteristics (type, size, and age of vehicle), human factors (age, gender, license status), andenvironmental conditions (weather and light conditions)3.
Crash data are used in statistical analyses to identify high crash locations and determine whatsolutions would make crash-prone segments safer. From this process, severity reduction factorscan be related to proposed safety improvements including: removing utility poles, straighteningcurves, reducing speed limits, widening lanes, adding turn bays, and widening shoulders.
Crash Analysis Systems in Iowa
PC-ALAS: The Iowa Department of Transportation (Iowa DOT) has developed one of the mostcomprehensive computerized crash location and analysis systems in the country, PC-ALAS. Thissystem is used by transportation and enforcement agencies throughout Iowa—cities, counties,metropolitan planning organizations, and regional planning affiliations. PC-ALAS is more portablethan its mainframe predecessor, and, with its pull-down menus, more user friendly. Queries can benarrowly defined. For instance, can query the database for crashes of specific type, at certaintimes or by drivers with characteristics of interest. The results (outputs, statistics) can be viewedon-screen, saved to a file, or printed using predefined formats. The database behind PC-ALASincludes up to 10 years of crash data (700,000 records) for all of Iowa's road system (110,000miles). Data are distributed on a county-by-county or city basis.
Limitations of PC ALAS: Still, PC-ALAS can be improved. For example, to request informationfor a particular location, a user must specify an ALAS node number comprised of a countynumber, a congressional township number, and a unique node specification (e.g., 85141347 isStory County (85), township 14, node 1347). Currently, node maps (paper or CAD) must beconsulted to determine these node numbers (literal descriptions are available for nodes alongprimary highway and interstate routes). For corridor analysis, each node in a node string must beidentified and, at times, it is difficult determine intermediate node numbers from the paper nodemaps. Consequently, identification of a large number of nodes is cumbersome and timeconsuming.
The use of maps or tables to determine node numbers limits the performance and utility of the PC-ALAS system. In addition, the presence of a node does not necessarily indicate the existence ofhistorical data (a node representing a bridge constructed in 1994 will have no data for years priorto 1994). Adjacent nodes may not represent adjacent nodes along a link (e.g., nodes representinggrade separation may be mistakenly associated with a link).
Most importantly, although PC-ALAS enables the user to access crash statistics for a given node,segment or area, it does not readily support the spatial analysis of crash patterns or promote theintegration of additional data. It is difficult or impossible to properly and efficiently identify crash“hot spots” or their causes. Further, the system is DOS based, which hinders data integration.
3 Brackett, R. Brackett & Associates. Basic Highway Safety Analytical Procedures.Proceedings from the Joint 21st International Forum on Traffic Records and HighwayInformation Systems at the 4th NHTSA Conference on the Analysis of State Highway SafetyData. National Safety Council, National Highway Traffic Safety Administration, and the FederalHighway Administration, Milwaukee, Wisconsin, 1995. pg. 106-110

3
Related Projects
Other ongoing projects at the Iowa DOT and elsewhere in the state are relevant to, and are beingconducted in coordination with, the Department’s crash location and analysis efforts. Theseprojects include:
• developing a program for assessing the potential benefits of safety improvements to roadways;
• using software to develop collision diagrams for intersections or short sections of roadway;
• analyzing the relationship of crashes to roadside features such as guardrails;
• developing statewide transportation management systems, especially safety and intermodalsystems, but also maintenance, pavement, bridge, and congestion management systems; and
• automating reporting methods used by law enforcement officers (e.g., the Mobile AccidentReporting System (MARS) being implemented across Iowa for crash reporting and crash datainterfacing, which is pioneering the application of global positioning systems (GPS) and GIStechnologies for such systems).
To enhance PC-ALAS’s capabilities for the Iowa DOT, while making it compatible with relatedefforts in Iowa, Iowa State University's Center for Transportation Research and Education isdeveloping a GIS-based Accident Location and Analysis System: GIS-ALAS4.
OBJECTIVES
A primary project objective in GIS-ALAS is to make use of GIS technology to manage the crashretrieval and analysis system. Within GIS, various queries can be performed. Instead of referringto a paper node map for a node number, a user could locate the desired node, link, or interchangethrough a map-based GUI. Parameters for refining a search could be added before querying orreporting from the database through a GIS SQL capability. GIS can then easily create tables ormaps displaying query results.
Other data that have been used (road characteristics) or might be used (demographic andsocioeconomic data) to enhance highway safety analysis can be integrated in the analysisenvironment. As location is the key to transportation data integration, GIS can effectively providethis function. Since crash and related data are spatially oriented, it makes sense to manage thedata using a GIS.
In addition to replicating the functionality of PC-ALAS, GIS-ALAS is intended to satisfy otherdesign requirements:
• Maintainability: The system is to be easily updated to accommodate new and improved data andcartography and easily adjusted for changes in the format of the crash database.
4 The use of the GIS-ALAS acronym predates the current preference for the term "crash" overthe term “accident”.

4
• Compatibility: The system must have import/export options that are compatible with othersystems and efforts (as described above).
• Enhanced logical query capabilities: Users should be able to use standard queries or define theirown queries based on any field(s) in the database.
• Spatial query capabilities: Users should be able to query actual crash locations, while retainingthe ability to use the old node system to reference non-crash information like roadside features(at least for the time being while nodes remain in popular use).
• Maps and crash diagrams: The system will provide diagrams of specific crashes, maps ofcrashes in a given city or county, pie diagrams of crashes at nodes (e.g., by cause, number ofvehicles, etc.), and intersection maps (when used in conjunction with collision diagramsoftware).
• Accessibility: The system is to be accessible statewide, eventually via the Internet, with queriespossible via a secure, interactive Web session, (the data and program are currently onlyaccessible via CD).
• Performance: The system should respond quickly and efficiently.
• User friendliness: The program should have a short learning curve and an interface familiar tocurrent users of PC-ALAS.
• Report generation: Users should be able to select predefined report formats or define their own.
The GIS-ALAS project follows a three-year timeline. In the first year (CY 1997), GIS-ALASwas constructed to reproduce the current functionality of PC-ALAS and incorporate improvedspatial query and display capabilities. The graphical interface of GIS-ALAS allows the viewer tosee on-screen maps of crash locations and to select specific nodes and links of interest with theclick of a mouse. Paper maps and tables of node numbers are now unnecessary, as is the manualtyping of node numbers to do queries. The results of GIS-ALAS queries can be displayed, not onlyin tabular form but also in maps. Subsequent phases of development are described below.
SYSTEM DEVELOPMENT
Software Criteria and Selection
The development platform for GIS-ALAS was chosen through the following process. First, theGIS World Sourcebook was consulted to identify the universe of potential software platforms.This publication, produced annually by GIS World, Inc., provides detailed lists and descriptions ofhundreds of software products, services, and vendors. Searches on the Internet World Wide Webwere also performed to identify additional candidates.
After examining the resulting list, the project team decided to narrow the list of candidates usingseveral fundamental criteria. The chosen platform would be a desktop package suitable fordistribution to a wide community of end users, with a development language to support necessarycustomization, and provided by a vendor with marketplace stability (to ensure that the selectedplatform would continue to be available in the future, preferably with enhanced functionality). The
5
list of candidates was thus narrowed to three desktop GIS packages: MapInfo (MapInfo),Maptitude (Caliper Corp), and ArcView (ESRI).5
The project team then prepared detailed criteria for the final selected platform to support GIS-ALAS. Two developmental levels were considered, "minimum functionality" and "enhancedfunctionality" (see Table 1).
Crash reference nodes for Dallas County, Iowa, were imported into each GIS package, along withfive years of ALAS location and attribute data. The performance of all three packages wassimilar in many respects. ESRI’s ArcView was selected due to its dynamic segmentation andnetwork analysis capabilities that make it a particularly useful package for the management andanalysis of transportation data. The software was also found to best meet project criteria asoutlined in Table 1.
For users who do not wish to purchase and learn a GIS package, the project team chose ESRI'sArcExplorer, currently available at no cost from ESRI’s World Wide Web site. Although thisprogram does not include the full query and reporting capabilities of ALAS, it reads the same dataformat as ArcView, and can be distributed freely along with the data on CD-ROM.
ESRI's Internet Mapper and Map Objects are also being considered for further GIS-ALASdevelopment in Phase II of the project.
5 Software selection for GIS-ALAS was completed prior to the release of Intergraph’s GeoMedia,which has been chosen as the DOT's preferred desktop GIS platform for end-users. Phase II ofthe project allows for reconsideration of the development platform.

6
Table 1: Criteria and functionality considered in GIS-ALAS software evaluationCriteria Minimum and Enhanced FunctionalityGeneralfunctionality
Minimum: ability to reproduce PC-ALAS capabilities (existing and updated),cost of distribution, ease of training end users.Minimum: functionality in updating data and cartography (existing and future),import/export capabilities.
Data updates/data integration
Enhanced: ability to tie in to videolog/GPS, overlay "other" data (e.g., landuse, road features, health care facilities, FRA data, aerialphotos/DOQs/DEMs, weather, location of maintenance and emergencyequipment, major infrastructure changes, intersections).
Queries Minimum: ability to perform logical queries (e.g., high crash locations, alcoholrelated crashes, subset of crashes based on any field in the database at thestate, county, and city levels), and spatial queries (e.g., beat/area request,graphical selection of a single node/link or a set of nodes/links, graphicalselection of nodes within a user-defined area), and to support an appropriateinterface for queries.Minimum: implications for analytical/statistical programming.AnalysisEnhanced: interdisciplinary applications identify historical trends, analysis ofrelationships in crash causation, e.g., volumes, v/c (LOS), road conditions,weather, lighting.Minimum: ability to support reports (e.g., local area report, reports onfrequency/location of any crash report form element, ability to select formatof report, ability to create and save user-defined report formats), ability tosupport maps/diagrams (e.g., crash diagrams, maps of crashes in a given cityor county, pie-diagram maps of crashes at nodes by cause, number ofvehicles, etc.).
Output
Enhanced: intersection maps.
Maintenance Minimum: ability to support system maintenance, and to easily adjust forchanges in the format of the crash database.
Database Development
Crash Data - Location
Crash data are currently obtained from paper copies of officer and driver reports submitted to theDepartment of Transportation, Motor Vehicle Division. While the process is being automated inthe field through the MARS project, currently crash data are entered and located in the centraloffice. To support PC-ALAS, crashes are referenced to a node or set of nodes (distance from areference node to a direction node).
The first step in the development of GIS-ALAS was to determine and import crash locations. Thefirst version of GIS-ALAS generates x-y coordinates for crashes based on straight lineinterpolation between node x-y locations which were available in a Microstation CAD format.Node locations were exported from Microstation in DXF format, then imported into MapInfo. A

7
text file containing crash reference information was then read into a MapBasic program(Mapinfo's programming language), which calculated the crash locations. Located crashes werethen exported to ArcView via MIF (MapInfo Interchange Format). MapInfo was used tofacilitate the process as the project team was originally more familiar with its programminglanguage and had previously developed a program similar to the location routine in MapBasic foranother project.
Obviously, the straight-line location process may result in some errors in crash location (especiallyon curved roads). The Iowa DOT Office of Cartography has subsequently developed aMicrostation MDL program to tie nodes to underlying road cartography and "walk a line" to amore accurate crash location. The Office then provides x-y coordinates for crashes that can bedirectly read by the GIS.
Crash Data - Integration
From the officer and driver reports, the Motor Vehicle Division inputs three types of crashinformation: 1) information about the crash in general, known as A-records, 2) information abouteach driver involved, known as B-records, and 3) information about each injured person, known asC-records. For a given crash, there is only one A-record, one B-record for each involved driver,and zero, one, or more C-records, depending on the incidence of injury. One C-record canaccommodate information for up to three injuries. All these records contain a common, uniquecrash identifier and are made available to the GIS-ALAS team in text format. Therefore, it is astraightforward process to join A, B, or C records to crash locations in the GIS. However, thecurrent system generates a point for each record, so, for a given crash, there may be as few astwo coincident points (one A-record and one B-record) or, in rare cases as many as seven oreight (with several B and C records).
Using ArcView and its programming language, Avenue, a one-to-many relationship is establishedbetween crash locations and data records upon execution of predefined queries. One-to-manyuser-defined queries are slightly more complicated, requiring manual database joins or spatialqueries. As ArcExplorer has limited query capability and no programming language, one point foreach A, B, and C record is currently provided. This makes crash analysis difficult. Therefore, A,B and C records will be joined for each crash prior to inclusion on the CD ROM in an ABBBCformat. "Extra" B and C records will not be provided, as very few (<1%) crashes have more thanthree driver (B) records or more than one C-record (i.e., more than three injuries). Although asmall amount of crash information will not be available to ArcExplorer users, at a minimum the A-records contain information on the number of vehicles involved (number of B records) and totalnumber of injuries. While in-depth study of a particular, severe crash might not be possible withthe freeware version, the ability of the program to facilitate statistical and spatial analysis is notcompromised.
Reference Data
To provide a more powerful, convenient and practical analysis system, several additional layers ofdata were needed. In order to determine exposure levels, highway information (e.g., traffic,geometry) is required. Since the crash database covers all roads in the state, highway data wereincorporated for municipal, county and state highways. These "base record" data from the DOTare provided to the project team along with text descriptions of underlying cartography

8
(coordinates of vertices). A MapBasic program was written that reads these data and creates aGIS layer. The layer is then exported to ArcView via MIF. MapInfo is used to facilitate theprocess as it has superior projection processing (ArcView will not properly import the DOT'scoordinate projection system). Also included as reference layers are rail data from the NationalTransportation Atlas Database (NTAD) and reference nodes and hydrology from the Iowa DOT(see Table 2).
Table 2: Databases provided with GIS-ALASCoverage Source Current as of
Primary (State) Highways Iowa DOT Records Section 7/1/97Secondary (County)
HighwaysIowa DOT Records Section 7/1/97
Municipal Roads Iowa DOT Records Section 7/1/97Rail National Transportation Atlas Database 1997
Crash Reference Nodes Iowa DOT Cartography Section 7/1/97Hydrology Iowa DOT Cartography Section 1/1/96
A Crash Records Iowa DOT Office of Transportation Safety 12/31/95B Crash Records Iowa DOT Office of Transportation Safety 12/31/95C Crash Records Iowa DOT Office of Transportation Safety 12/31/95
Estimates of the time required to import these databases into ArcView format are provided inTable 3.
Table 3: Time estimates for creating GIS-ALAS coveragesCoverage Time Required to Create
Attributed Primary, Secondary, and Municipal Roads 3 daysCrash Nodes 1 dayCrash Data 3 days
Hydrological Data 1 dayTotal Time 8 days*
*Note: The amount of personnel time is approximately 3 days. Computer running time is 5 days.
Products
Two products have been developed to serve two types of users. The first product, Explorer-ALAS, combines a free GIS viewing tool and an extensive database of crash locations andcharacteristics. The second product, ArcView-ALAS replicates the functionality of PC-ALAS ina GIS environment. Both products access the same database, minimizing data maintenancerequirements.
Explorer-ALAS

9
ArcExplorer is a GIS viewing tool provided by ESRI at no cost. This system allows users tosimultaneously view crash data and background layers but does not have the mapping and spatialquery functions of the ArcView-based system (see Figure 1). Based on ArcExporer, Explorer-ALAS is provided on a CD and includes data to display the primary roads, secondary roads,municipal roads, as well as crash records and locations.
The database can be queried to select specific crashes based on their characteristics. Theseresults will appear highlighted on the screen (Figure 2). Thematic mapping, which allows additionalvisual analysis of data, is also available using ArcExplorer.
Figure 1: Crash data for a Des Moines neighborhood, 1995
Figure 2: Injury crashes (white squares) and property-damage-only crashes
10
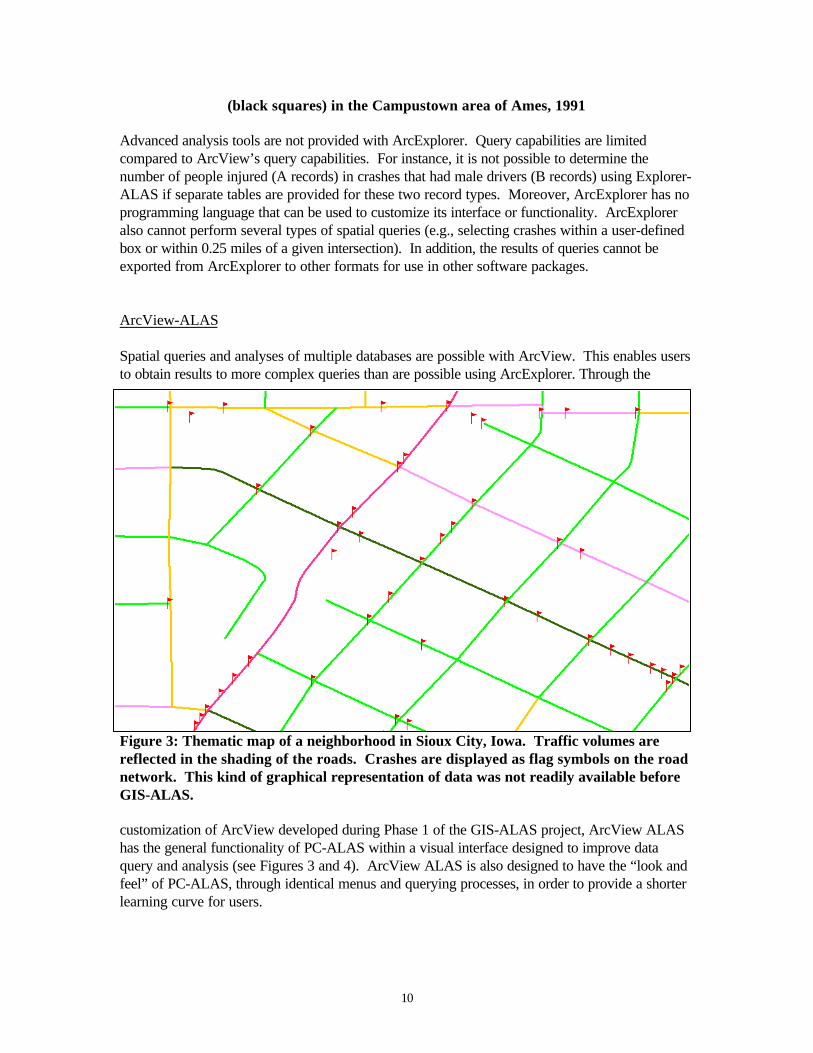
(black squares) in the Campustown area of Ames, 1991
Advanced analysis tools are not provided with ArcExplorer. Query capabilities are limitedcompared to ArcView’s query capabilities. For instance, it is not possible to determine thenumber of people injured (A records) in crashes that had male drivers (B records) using Explorer-ALAS if separate tables are provided for these two record types. Moreover, ArcExplorer has noprogramming language that can be used to customize its interface or functionality. ArcExploreralso cannot perform several types of spatial queries (e.g., selecting crashes within a user-definedbox or within 0.25 miles of a given intersection). In addition, the results of queries cannot beexported from ArcExplorer to other formats for use in other software packages.
ArcView-ALAS
Spatial queries and analyses of multiple databases are possible with ArcView. This enables usersto obtain results to more complex queries than are possible using ArcExplorer. Through the
Figure 3: Thematic map of a neighborhood in Sioux City, Iowa. Traffic volumes arereflected in the shading of the roads. Crashes are displayed as flag symbols on the roadnetwork. This kind of graphical representation of data was not readily available beforeGIS-ALAS.
customization of ArcView developed during Phase 1 of the GIS-ALAS project, ArcView ALAShas the general functionality of PC-ALAS within a visual interface designed to improve dataquery and analysis (see Figures 3 and 4). ArcView ALAS is also designed to have the “look andfeel” of PC-ALAS, through identical menus and querying processes, in order to provide a shorterlearning curve for users.

11
Figure 4: The spatial pattern of crashes by time of daycan be easily displayed using the power of a GIS.
ArcView GIS-ALAS is being designed to work with a commercial collision diagram softwarealready selected for use by the Iowa DOT through another CTRE-managed project. Care wastaken to avoid inefficient file structures, duplicate and orphan databases, etc., because ultimatelythe GIS-ALAS may be integrated with MARS and other law enforcement applications, as well asother safety and engineering applications outside the current scope of ALAS. Throughout theprogramming process, Internet distribution and access has been considered.
GIS-ALAS Usability
"Look and Feel"
The GIS-ALAS team made a special effort to duplicate the Graphical User Interface (GUI) fromPC-ALAS into the development of GIS-ALAS. This similarity provides an approach to dataaccess familiar to users who have been exposed to PC-ALAS. The similarity between the twosystems in performing a typical query (in this case, crash severity) is illustrated in the followingthree figures (Figures 5-7).

12
AV-ALAS PC-ALAS
Figure 5: Selection of Refinement Parameters.
AV-ALAS PC-ALAS
Figure 6. Selection of Crash Information Parameters.
AV-ALAS PC-ALAS
Figure 7: Selection of Crash Severities.
13
Usability Study
A usability and implementation study is being conducted in cooperation with ISU’s Department ofEnglish to evaluate the GIS-ALAS menus and toolbars, query and report options, and onlinedocumentation and to test for bugs or potential technical problems. Specifically, this research willinclude an assessment of GIS-ALAS’s purpose as seen by its designers and users, a period ofobserving and interviewing the users of GIS-ALAS in order to identify difficulties, and thepreparation of design recommendations to improve the usability of the system. The products ofthis research will include:
• a summary of differences between users' and designers' perceptions of the system (often asource of problems);
• a report that categorizes and details difficulties that users have with the system;
• a prototype revision of the system that corrects some of the problems; and
• a report on an experiment to determine whether the revision was successful.
This component of the project is currently being conducted and will be completed during thesummer of 1998. After improvements suggested by the usability study have been incorporated,both the ArcView and Explorer versions will be distributed to transportation agencies throughoutIowa via CD-ROM or secure Internet access.
EXAMPLE APPLICATIONS
GIS-ALAS is designed largely as an enhanced tool to provide quick and easy data access andquery capabilities to end users. However, during the system development phase the projectteam has learned that the data integration and spatial analysis capabilities of GIS create a varietyof new opportunities for using crash data. These opportunities have been discovered largelythrough continual interaction with individuals in the user community, including traffic engineersand law enforcement personnel, as well as individuals from the emergency services, publichealth, and academic communities. In this mutually beneficial process, end users have learnedabout the capabilities of GIS and the project team has learned of new applications areas andissues to address. Through a focus group, presentations/demonstrations at several professionalconferences and committee meetings, and on-going contacts, several applications have beenselected for further development. One such area is the analysis of implications of crash locationcharacteristics for emergency response services

14
High Crash Locations: Implications for Emergency Response
Response time is critical for crashes that involve an injury.6,7 Emergency medical services(EMS), such as intravenous drip, trauma care, and basic life support, can make the differencebetween life and death. Conversely, injuries may unnecessarily become fatalities if such care isnot provided in a timely fashion. GIS can be used to analyze the relationship between thedistribution of emergency response services and the spatial pattern of crashes, a crucialdeterminant of the final outcome of highway crashes.
For example, (Figure 8) shows travel time areas around emergency medical service facilities inCedar Rapids, Iowa, shown in rings around the facilities that represent five, seven, and tenminute increments (in this case, the road network depicted contains gaps which illustrate theimpact of roadway obstacles). In urban areas, the level of service sought by EMS planners isthat 95% of the daily demand be reached within 10 minutes.8 Travel time area analysis canprovide data on the number and types of crashes that can be reached within this threshold, giventhe pattern of response facilities and crashes.
The results of this analysis can be used to assess service areas, to detect high-crash zones withinsufficient response times, and, if necessary, to allocate additional facilities. In certain cases,the results can be also used to assess the possibility of pre-deploying emergency vehicles inareas with high crash likelihoods at certain times of the day. Specifically, the network analysiscapabilities of GIS can be used to estimate the response times of strategically placed emergencyvehicles and compare them to the actual response times of fixed facilities.
6 Repede, John, and Bernardo, John J., Developing and validating a decision support system forlocating emergency vehicles in Louisville, Kentucky, European Journal of OperationsResearch, V. 75(3).7 Williams, F.L.R., Lloyd, O.L.I., and Dundar, J.A., Deaths from road traffic accidents inScotland: 1979-1988, Does it matter where you live? Public Health, 1991, 39-326.8 Scott, D.W., Factor, L.E., and Gorry, G.A., Predicting response time of an urban ambulancesystem, Health Services Research, Winter 1978, 404-417.

15
Figure 8: Travel time areas around emergency service facilitiesin Cedar Rapids, Iowa, and the pattern of crashes.
NEXT STEPS
Phase 1 activities have been completed and the GIS-ALAS project is beginning its second phase.Phase 2 will build on this first version of GIS-ALAS by incorporating additional refinements andenhancements and by improving its data integration and analytical capabilities. The interface willbe improved and specific functionality will be added in response to input from users. This inputwill be gathered both during technology training sessions/workshops and after the users have hadtime to work with ArcView-ALAS or Explorer-ALAS in their own offices. Typical improvementsmight include changes to the menus and/or toolbars, additional query and report options,clarifications in the on-line and/or hardcopy documentation, and the removal of bugs and otherpotential technical problems.
Analytical capabilities will be developed to: 1) facilitate more in-depth assessments of crashpattern and causation, such as the development of tools to analyze trends and identifydiscontinuities in trends, 2) the incorporation of causal statistical analysis, and 3) the creation ofautomated systems to assist the user in identifying problem areas and crash characteristics.

16
Using Black Hawk County (Waterloo) as a pilot area, the research team is working with theUniversity of Northern Iowa to experiment with incorporating additional kinds of information.These include road features, health care facilities, geographic borders (e.g., counties, censustracts), emergency response service districts, highway/rail grade crossings, aerial photos/digitalortho quads/digital elevation models, and maintenance and emergency facilities.
The project team is also assisting Iowa State University’s Fire Services Institute with its pilotproject to assess the emergency response impacts of Iowa’s Highway 218 corridor relocation andexpansion into the “Avenue of the Saints.”
Data Input (conversions, location)
Two issues found to be relevant during the development of GIS-ALAS included: a) the location ofcrashes on curved line segments; and b) missing links. This phase is already beginning to addressthese problems. Also, as future crash location collection is likely to include only geographiccoordinates, the existing procedure that converts link-node locations to latitude-longitude will bereversed. (i.e., to convert latitude-longitude to a link-node specification). As long as node-basedreferencing is required or desired, this procedure will allow the crash records to be populated withboth reference designations.
In addition, ArcView-ALAS and Explorer-ALAS will be reviewed for their potential to assist inDMV traffic crash location efforts. Preliminary discussions with DMV on integrating GIS-ALAStools into their OIM (Officer Information Manager) will be conducted.
High Crash Locations, Links and Intersections
Other activities of Phase 2 include an assessment of methods to estimate crash rates for highwaysections/intersections based on specific crash locations and traffic counts and a definition ofrequirements for a database to support detailed intersection analysis.
The calculation of segment-based crash rates can conceal patterns of specific crash locationswithin, or even between, these segments. For instance, crashes may be clustered in one part of asegment, or clustered near the endpoints of two consecutive segments. Moreover, the trafficcounts used to calculate these rates may vary as one travels along a single segment. Otherrelevant roadway characteristics may also vary. The end result is that analyses of segments maymiss important factors in the identification of crash problems, causes, and solutions. This task willassess the usefulness of the crash point locations of GIS-ALAS, and estimates of ADT variationsalong a segment, in providing finer-scale analyses of crashes.
Technology transfer
Training and documentation will be provided for the Phase 2 enhanced version of GIS-ALAS. Inaddition, the project team will outline the system requirements for maintaining the application oncethe project is completed. (A final set of requirements and recommendations will be provided atthe end of Phase 3.)

17
System Distribution
GIS-ALAS products and data will be distributed on compact disc (CD). The CD for Explorer-ALAS will include the file with which users can install a free version of ArcExplorer, as well asthe crash data and related information outlined above. The CD for ArcView-ALAS will includean ArcView project file, which contains the customization programs that provide its interface andanalytical capabilities, as well as the databases outlined above. Currently, users who want to useArcView-ALAS will need to purchase ArcView. CTRE on has already begun distributing fiveyears of crash data along with roadway graphics to test users.
The use of the Internet for distribution has been explored but was not implemented in Phase 1.Concerns were expressed about confidentiality and other issues related to public access to crashdata via the Internet, especially for data on a single crash or at a specific node number. Measuresmay be taken to ensure the security of the data, such as stripping off the last four digits of thenode number and creating thematic maps (e.g., to show the number of crashes at particularlocations).
Finally, VisualBasic and MapObjects are being explored to see if a fully functional, freeware GIS-ALAS can be developed. In addition, the data from ArcView-ALAS will tested for use inGeoMedia, as per the Iowa DOT’s enterprise GIS implementation strategy.
Figure 9 summarizes the current status of development and distribution of the GIS-ALASdatabase and its related products.
Figure 9: Summary of Database Development and Distribution
18
Training, Beta-Testing, and Feedback
In December 1997, the GIS-ALAS project team provided a demonstration and training sessionfor the GIS-ALAS Steering Committee and other interested individuals9. Tutorials were providedfor both Explorer-ALAS and a prototype version of ArcView-ALAS. This feedback wasincorporated into the subsequent development of GIS-ALAS. Participants also generated a list ofquestions and issues for the project team to answer and address.
SUMMARY
This paper has described the need for and development of a GIS-based crash location andanalysis system for the State of Iowa. A rich database existed even before the start of thisproject in the form of a comprehensive set of crash records referenced to a statewide nodesystem. Some 70,000 crashes per year were already keyed into the system for 110,000 miles ofroad. While the database and the efforts on the part of the DOT and its partners was impressive,the system currently being used to access and analyze the data, PC-ALAS, had limitations and didnot make use of GIS technology.
By importing and combining graphic and non-graphic databases in ESRI software, two systemswere developed (ArcView-ALAS and Explorer-ALAS). ArcView-ALAS replicates thefunctionality of PC-ALAS and allows GIS queries, management, overlay and presentation of thedata. Explorer-ALAS provides users with an excellent viewing and query tool for the data and isdistributed at no cost.
Acknowledgements: The authors wish to thank Joyce Emery and the Office of TransportationSafety of the Iowa Department of Transportation for funding and helpful comments and theOffice of Transportation Data for technical assistance and provision of data. Portions of thispaper were derived with permission from a project summary report prepared by Marcia Brink,CTRE Communications Specialist. Ms. Brink's contribution is gratefully acknowledged. Theopinions expressed in this paper are those of the authors and do not necessarily represent theofficial policies or plans of the Iowa Department of Transportation. Errors or omissions arestrictly the responsibility of the authors.
9 Several individuals, many of whom attended the training session, are currently testing Explorer-ALAS. These include Iowa DOT employees, city employees, Federal Highway Administrationpersonnel, city and state law enforcement agencies, metropolitan planning associations, and countyengineers.

19
INTRODUCTION..............................................................................................................1
Need for Crash Analysis Systems................................................................................................................................1
Crash Analysis Systems in Iowa ..................................................................................................................................2
Related Projects...............................................................................................................................................................3
OBJECTIVES...................................................................................................................3
SYSTEM DEVELOPMENT............................................................................................4
Software Criteria and Selection ...................................................................................................................................4
Database Development ....................................................................................................................................................6Crash Data - Location................................................................................................................................................. 6Crash Data - Integration............................................................................................................................................. 7Reference Data............................................................................................................................................................. 7
Products ............................................................................................................................................................................8Explorer-ALAS............................................................................................................................................................. 8ArcView-ALAS.......................................................................................................................................................... 10
GIS-ALAS Usability......................................................................................................................................................11"Look and Feel"......................................................................................................................................................... 11Usability Study.......................................................................................................................................................... 13
EXAMPLE APPLICATIONS ........................................................................................13
High Crash Locations: Implications for Emergency Response............................................................................14
Underlying Socieconomic/Demographic Factors..................................................... Error! Bookmark not defined.
NEXT STEPS .................................................................................................................15
Data Input (conversions, location) ..............................................................................................................................16
High Crash Locations, Links and Intersections .....................................................................................................16
Technology transfer......................................................................................................................................................16System Distribution .................................................................................................................................................. 17Training, Beta-Testing, and Feedback................................................................................................................... 18
SUMMARY......................................................................................................................18


![01-Introduction1 [Compatibility Mode]](https://static.fdocuments.us/doc/165x107/577d21b51a28ab4e1e95c7b3/01-introduction1-compatibility-mode.jpg)

